prescription medicines trends: an overview and perspective ...global market spending, based on list...
TRANSCRIPT

Copyright © 2017 IQVIA. All rights reserved.
Sarah Rickwood, Vice President, IQVIA
Prescription medicines
trends: an overview
and perspective on two
therapy areas

1
Global prescription medicine volume growth is decelerating
Global prescription medicine value spend has also decelerated
Antibiotics are a therapy class challenged by unmet need but innovation deficit
Orphan drugs for rare diseases see high levels of innovation but budget challenge
We will discuss four issues

2
Where IQVIA data is expressed at value level in this presentation, this is at ex-Manufacturer level, list price
List price
• List price is a price level for a medicine either publically available or estimated from public sources, from which non-
publically available discounts or rebates may be made, meaning the actual price the manufacturer realises is in fact
lower.
• These non publically available rebates/discounts can be substantial- it is now estimated that the average discount in
the US to private insurers is now 41%, up from 28% in 2012*.
• These rebates and discounts are also almost entirely non transparent, with confidentiality agreements between buyer
and supplier frequent.
Ex-manufacturer level
• This means that margins added by wholesalers, retail pharmacies and any other elements of the distribution chain to
the patient are not captured, nor are any other tariffs of taxes. In many countries these are regulated margins. In some
countries they are not.
• A certain level of mark-up added by distributors is the necessary cost of delivering medicines to patients safely,
securely, and reliably by commercial enterprise. However, in some countries where distribution margins are
unregulated and/or distribution is inefficient and involves many actors, mark-ups can substantially increase the cost
of medicines to the patient.
* Wells Fargo report, January 2018
A word on value measurements

0
1,000
2,000
3,000
4,000
5,000
2007 2012 2017 2022
Pharmerging Others
Global prescription medicines volume growth slows; Pharmerging markets have seen the strongest slowdown
1%
3%
2%
0%
4%
2%
2%
8%
5%
CAGR 2007-2012 CAGR 2012-2017 CAGR 2017-2022
Source: IQVIA Institute, Oct 2017. Pharmerging is a group of IQVIA defined pharmerging markets characterized by less than $30k GDP/capita and greater than $1bn absolute prescription medicines market growth potential between 2014 and 2019. The markets are: China Brazil India Russia Mexico
Turkey Poland Saudi Arabia Indonesia Egypt Philippines Pakistan Vietnam Bangladesh Argentina Algeria Colombia South Africa Chile Nigeria Kazakhstan
Trn
Sta
nd
ard
Units,
To
tal w
orld
, a
ud
ited
an
d u
na
ud
ited

-20 0 20 40 60 80 100 120 140
NIGERIAINDONESIA
PHILIPPINESMEXICO
BANGLADESHINDIA
CHINAPAKISTANTHAILANDVIETNAMALGERIA
ARGENTINASAUDI ARABIA
SOUTH AFRICACOLOMBIA
EGYPTTURKEY
CHILEBRAZIL
KAZAKHSTANPOLAND
RUSSIAN FEDERATION
Index of SU Per Capita to Developed Markets Average in 2017 SU Per Capita Incremental to 2022
Pharmaceutical volume per capita varies widely in pharmerging countries, as does the potential for growth
high income markets’
Volume in SU per capita =
100
2017 = 1,457
2022 = 1,487
Source: IQVIA Institute, Oct 2017. Pharmerging is a group of IQVIA defined pharmerging markets characterized by less than $30k GDP/capita and greater than $1bn absolute prescription medicines market growth potential between 2014 and 2019. The markets are: China Brazil India Russia Mexico Turkey Poland
Saudi Arabia Indonesia Egypt Philippines Pakistan Vietnam Bangladesh Argentina Algeria Colombia South Africa Chile Nigeria Kazakhstan Note: High Income markets are known for wider adoption of newer therapies whose clinical importance is often understated
in Standard Units. Pharmerging markets are known for historically less well resourced health systems and often use oral and older medicines to a greater extent. The index may overstate the gains being made by Pharmerging markets relative to more clinical or
health outcomes based measures. Although the South African market has been strongly affected by weak economic growth, changes in data coverage may also affect this market’s recent history.
Pharma SU volume per capita index for
Pharmerging countries for 2017 and 2022
Original branded
products (protected or
unprotected) represent 7-
15% of pharmerging
medicine volumes and
19-34% of list price ex
manufacturer value; most
volume/value is non-
original

5
Global Market Spending, based on list price, to grow 3-6% in value in the next five years
Source: IQVIA Market Prognosis, Sept 2017; IQVIA Institute, Oct 2017- Outlook for Global Medicines through 2021
Global pharma spending and growth
2007 -2022
0%
2%
4%
6%
8%
10%
12%
0
200
400
600
800
1,000
1,200
1,400
1,600
2007 2008 2009 2010 2011 2012 2013 2014 2015 2016 2017 2018 2019 2020 2021 2022
Gro
wth
Co
ns
tan
t U
S$
Sp
en
din
g U
S$
Bn
Spending Growth
Heavy small molecule
genericisation
Economic austerity in
US/Europe/Japan
Resurgence of spend on
innovative medicines in
high income markets,
list price growth in US,
peak Hepatitis C spend
Moderating
growth of
pharmerging
medicine spend
2016 IQVIA estimate of
difference between list
price and net sales for
the US=33%, or $148bn
2016 IQVIA estimate of
difference between list
and net for rest of world=
18% or $96bn
An estimate of the
difference between list
price and net value is
therefore 25% globally,
but with substantial
caveats.

6
Below this list price picture, rebates and discounts have grown strongly, although recently moderating in US
Notes: US calculation from IQVIA Institute; RoW calculation using a universe of 297 products representing 21% of MIDAS sales in 2016; Anomalous products excluded
Source: IQVIA Thought Leadership Analysis, IQVIA Analytics Link, IQVIA Institute; IQVIA MIDAS MAT Q2 2017
0%
5%
10%
15%
20%
25%
30%
35%
2009 2010 2011 2012 2013 2014 2015 2016
Rest of World US
Global and US difference between gross (MIDAS list price) and estimated net
pharmaceutical market value (2009-16)
Rest of World Data
• Calculation based on the ratio of MIDAS
sales and company reported Net sales on a
product by product basis
• Starting universe of 297 products
representing 11% of MIDAS sales (2016)
and 9% of RoW sales
• 2016 RoW value (18% discount)
constructed from 112 data points
Caveats
• Crude calculation – no distinction possible
between high and low income economies
outside US, but this is likely skewed to
high income countries
• Starting universe of products are company
reported – so typically new products or
those with significant sales for a publically
quoted company. No Generics
contribution.

7
Inefficient use of existing medicines generates avoidable costs: non compliance is the biggest cost, antibiotics misuse third
• The inefficient use of existing medications, whether on or off
patent, incurs substantial, avoidable costs for healthcare
systems
• Non-adherence to prescribed medicines regimens is the single
greatest avoidable cost- although a perennially challenging
issue, even small improvements would result in substantial
savings
• Antibiotic misuse (antibiotic use for non bacterial infections)
was the third largest source of waste, and, although it has
seen recent substantial effort to address, cost 2012
healthcare systems $54bn in avoidable spend
Estimated avoidable costs (2012) bn USD
475 100%
Mismanaged polypharmacy
in the elderly 18
269 57%
42 9%
Antibiotic misuse 54 11%
Delayed evidence-based
treatment practise 62 13%
Non-adherence
Total avoidable costs
4%
Suboptimal generic use 30 6%
Medication errors
Source: IQVIA European Thought Leadership; IQVIA Institute 2012 “Responsible use of Medicine”

8
Antibiotics and orphan drugs: opposite ends of the innovation spectrum
Antibiotics Orphan drugs
• High prevalence conditions, acute
• Established treatment paradigm
• High share of generic standard of care
• Extremely low individual prevalence conditions
(although there are many of them) chronic
• Emerging/radically changing treatment paradigm
• No or low share of generics
• Focus on generics for the broadest population
• Focus on reducing unit cost (where payers are institutions or
governments)
• Action to reduce mis-use (but still a major problem and source of
unnecessary medicine spend)
• New products may see restricted use as “antibiotic of last resort”- sales
are low
• Cost per patient is high and a growing concern in high income
markets
• Individual products can have low sales, but collectively treatments for
rare diseases are a growing element of high income market medicine
spend
• Orphan drugs increasingly the subject of strict price negotiation and
health technology assessment
• Commercial launch of new antibiotics was
historically frequent but is now rare
• Commercial launch of new orphan drug treatments was historically
rare but is now frequent and increasing
• However, only an estimated 5% of rare diseases currently have a
pharmacotherapy
Market features
Payer/provider
actions
Commercial
impacts
Regulation/policy • Significant global legislation and action to manage antibiotic use and
contain resistance
• GAIN provision as part of 2012 FDA safety and innovation act (US) aims
to improve commercial attractiveness with additional 5 years exclusivity
• EU Innovative Medicines Initiative ND4BB program and setting up of
JPIAMR since 1999
• 1983 Orphan drug act (US) , 2000 Regulation (EC) 141/2000 (EU)
both have given substantial encouragement to companies
developing drugs for rare diseases
• Japan, Singapore and Australia have also enacted legislation which
encourages development of orphan drugs
How do medicines challenge healthcare systems? What is the impact of regulation and commercial activity?

9
Usage of systemic antibiotics declines in high income markets; from 2016 we see the same trend for pharmerging markets
Source: IQVIA European Thought Leadership; IMS MIDAS Q3/2017; *only systemic antibiotics (ATC J1)
2012 2013 2014 2015 2016 2017
70
40
50
60
100
90
10
0
30
80
20 -2.3% -1.0%
Global
+1.7%
+1.9% -3.4%
Top7
-2.7%
Pharmerging
Systemic antibiotics* Sales in Volume (Bn SU) Standard Unit volume for Systemic
antibiotics falls in both pharmerging
markets (low/middle income) and
high income markets
Volume decreases 2015-17 in
China, Brazil, Turkey, South Africa,
Thailand, Philippines, Saudi Arabia,
Poland, Vietnam and Chile (10/20
pharmerging markets)
Volume rises 2015-17 in
Kazhakstan, Algeria, Egypt,
Pakistan, Russia, India,
Bangladesh, Argentina, Colombia,
Mexico

10
Global New Active Substance launch has seen very little activity from systemic antibiotics
Note: 2017 NAS data is provisional and is subject toc change ; NAS=New Active Substance; Antibiotics include the following ATC3s J1A,B,C,D,E,F,G,H,K,L,M,P,X,J3A,J8
Source: IQVIA MIDAS NAS analysis Q3 2017
0
10
20
30
40
50
60
2010 2011 2012 2013 2014 2015 2016 2017
NAS launches 2010 - 2017
1 1
3 3
0
0 2
0
# Antibiotic NASs

11
In contrast, orphan drug approvals in Europe have risen substantially since 2000 legislation
10
18
20
14
7
11
54
10
6
0
5
10
15
20
2017* 2016 2015 2014 2013 2008 2012 2011 2010 2009
Orphan drugs in Europe with European Market
Authorisation by approval year (2008-16) – 135 in total
were approved between 2001 and 2016
Source: European Medicines Agency October 2017; *to Oct 2017 only
• 146 medicines were reviewed by
the EMA for orphan designation
since 2001-2016.
• As of 2016:
• 90 are approved Orphans
• 45 have been withdrawn
• 11 were refused designation
• 91% (82) of approved Orphan
drugs in 2016 (90) have sales in
Europe in MIDAS
12
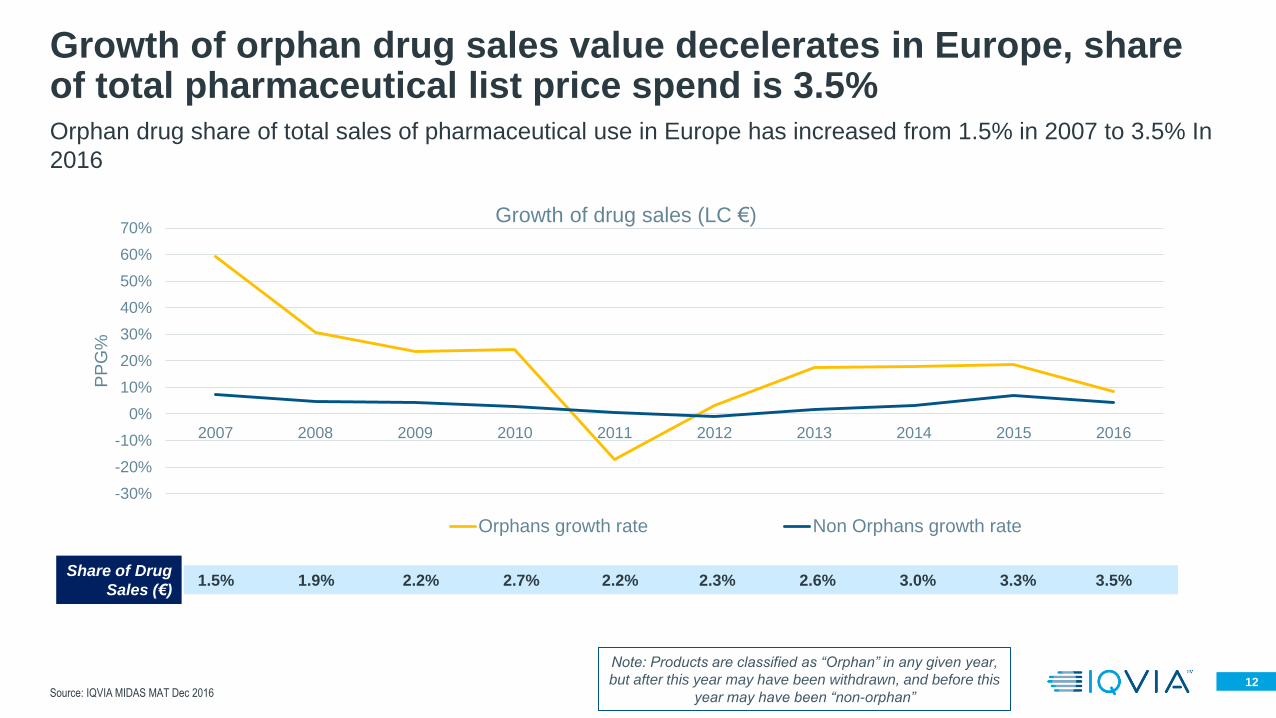
Orphan drug share of total sales of pharmaceutical use in Europe has increased from 1.5% in 2007 to 3.5% In
2016
Source: IQVIA MIDAS MAT Dec 2016
Growth of orphan drug sales value decelerates in Europe, share of total pharmaceutical list price spend is 3.5%
-30%
-20%
-10%
0%
10%
20%
30%
40%
50%
60%
70%
2007 2008 2009 2010 2011 2012 2013 2014 2015 2016
PP
G%
Growth of drug sales (LC €)
Orphans growth rate Non Orphans growth rate
Note: Products are classified as “Orphan” in any given year,
but after this year may have been withdrawn, and before this
year may have been “non-orphan”
Share of Drug
Sales (€) 1.5% 1.9% 2.2% 2.7% 2.2% 2.3% 2.6% 3.0% 3.3% 3.5%
13
• There is currently both volume and value deceleration in spend on Rx medicines globally
• Many pharmerging markets (where majority of volume and value is off patent) are substantially
behind the high income markets in terms of use per head of modern medicines, and current
growth rates will not close that gap
• Avoidable costs to healthcare systems of mis-use of prescription medicines equated to 49% of
total list price Rx market value in 2012, with compliance the leading cost and antiobiotic mis-use
third
• Orphan drugs see growth of innovation with enabling legislation but costs challenge high income
markets
• Antibiotics see innovation dearth and yet to see impact of policy on new drug approvals
Concluding points

IQVIA’s definition of Pharmerging Markets: middle-low income countries that have significant potential for list price, ex-manufacturer market growth
Source: IQVIA Market Prognosis
China Brazil Mexico Bangladesh
India Turkey Argentina
Russia Poland Algeria
Saudi Arabia Colombia
Indonesia South Africa
Egypt Chile
Philippines Nigeria
Pakistan Kazakhstan
Vietnam
21
co
un
trie
s
Pharmerging Definition
GDP per capita less than $30,000
>$1Bn US$ or LCUS$ in absolute
5yr growth (2014-2019)
Tier 1 Tier 2 Tier 3
Tier
definition
> 100Bn US$
sales in 2014
>15Bn US$ sales
in 2014
>1Bn US$ or LCUS$ in absolute 5yr
growth
(2014-2019)