prepregnancy body mass and weight gain during pregnancy in india … · · 2015-03-13prepregnancy...
TRANSCRIPT
Prepregnancy body mass and weight gain duringpregnancy in India and sub-Saharan AfricaDiane Coffey1
Office of Population Research, Princeton University, Princeton, NJ 08540
Edited by Kenneth W. Wachter, University of California, Berkeley, CA, and approved February 10, 2015 (received for review September 2, 2014)
Despite being wealthier, Indian children are significantly shorterand smaller than African children. These differences begin veryearly in life, suggesting that they may in part reflect differences inmaternal health. By applying reweighting estimation strategiesto the Demographic and Health Surveys, this paper reports, to myknowledge, the first representative estimates of prepregnancy bodymass index and weight gain during pregnancy for India and sub-Saharan Africa. I find that 42.2% of prepregnant women in Indiaare underweight compared with 16.5% of prepregnant women insub-Saharan Africa. Levels of prepregnancy underweight for Indiaare almost seven percentage points higher than the average fractionunderweight among women 15–49 y old. This difference in partreflects a previously unquantified relationship among age, fertility,and underweight; childbearing is concentrated in the narrow agerange in which Indian women are most likely to be underweight.Further, because weight gain during pregnancy is low, averagingabout 7 kg for a full-term pregnancy in both regions, the averagewoman in India ends pregnancy weighing less than the averagewoman in sub-Saharan Africa begins pregnancy. Poor maternalhealth among Indian women is of global significance because Indiais home to one fifth of the world’s births.
maternal health | nutrition | India | sub-Saharan Africa
Children in India are significantly shorter and smaller thanchildren in sub-Saharan Africa. Because Indian children are
much richer, on average, than African children, scholars have de-scribed anthropometric differences between Indians and Africansas an “Asian enigma” (1–4). Although there are likely many rea-sons why Indian children are shorter than African children (5, 6)and why Indian children are shorter than economic indicatorspredict, demographic and health surveys show that physical dif-ferences between Indian and African children begin very early inlife, suggesting that the Asian enigma may in part reflect differ-ences in maternal health. That Indian women have worse healthduring pregnancy than African women is also consistent with ananomalously high rate of neonatal mortality in India, as well ashigh rates of low birth weight, even among relatively privilegedgroups (7). Poor maternal health and nutrition among Indianwomen is of global significance because India is home to one sixthof the world’s population and one fifth of the world’s births.In recent decades, India has experienced rapid economic growth
and significant reductions in poverty. Despite this economic suc-cess, however, measures of women’s nutrition remain exception-ally poor. The latest Demographic and Health Survey (DHS), in2005, showed that 35.5% of women aged 15–49 y are underweight,suggesting that maternal health and nutrition are extremely alsopoor. India’s high rate of underweight among women is worrisomein light of mounting evidence that nutrition during pregnancy isimportant not only for neonatal survival but also for birth weight(8, 9), which is associated with height and health in childhood andadulthood (10–13), as well cognition and productivity (14–17).Prepregnancy body mass and weight gain during pregnancy are
useful measures of maternal nutrition. These factors interact todetermine birth weight: on average, women with lower prepreg-nancy body mass need to gain more weight during pregnancy todeliver infants of the same birth weight as women who start
pregnancy with higher body mass (18, 19). The Institute of Med-icine guidelines for women in the United States recommend higherweight gain during pregnancy for women with a prepregnancybody mass index (BMI) of less than 18.5 kg/m2 (19).What are average prepregnancy BMI and weight gain during
pregnancy in India, and how do these figures compare with thosein sub-Saharan Africa? These basic nutrition facts are unknownbecause no representative longitudinal monitoring systems existfor these regions. This paper’s primary contribution is to pro-duce, to my knowledge, the first representative estimates of pre-pregnancy BMI and weight gain during pregnancy for India andsub-Saharan Africa.To estimate prepregnancy BMI, I adjust the BMIs of non-
pregnant women for selection into pregnancy based on observ-able characteristics of pregnant women. I find that in India, 42.2%of prepregnant women are underweight; this figure is about sevenpercentage points higher than the average fraction underweightamong women 15–49 y old. These estimates constitute a signifi-cant contribution to the literature because they show that com-monly cited figures for average women’s nutrition in India (1, 20,21) significantly underestimate the fraction of prepregnant womenwho are underweight and overestimate average prepregnancyBMI. About half of the difference between the prevalence ofwomen’s underweight and the prevalence of prepregnancy un-derweight can be attributed to previously unquantified agepatterns of fertility and undernutrition that are likely due topronounced sex and age hierarchies in Indian households. Suchhierarchies have been documented and studied by demogra-phers, sociologists, and anthropologists (22–24). In contrast, inthe much poorer African sample, only 16.5% of prepregnantwomen are underweight.
Significance
Because India—home to one fifth of all births—has no moni-toring system for maternal health, basic facts about maternalnutrition are unknown. Using statistically adjusted nationallyrepresentative survey data, this paper presents, to my knowl-edge, the first estimates of prepregnancy body mass andweight gain during pregnancy in India and compares themwith sub-Saharan Africa: 42.2% of Indian women are un-derweight when they begin pregnancy compared with 16.5%of African women. In both regions, women gain little weightduring pregnancy, but because of prepregnancy deficits, Indianwomen end pregnancy weighing less than African women doat the beginning. Deficits in maternal nutrition could help ex-plain the Asian enigma, the puzzle of why Indian children aremuch smaller than their relative wealth predicts.
Author contributions: D.C. designed research, performed research, analyzed data, andwrote the paper.
The author declares no conflict of interest.
This article is a PNAS Direct Submission.1Email: [email protected].
This article contains supporting information online at www.pnas.org/lookup/suppl/doi:10.1073/pnas.1416964112/-/DCSupplemental.
3302–3307 | PNAS | March 17, 2015 | vol. 112 | no. 11 www.pnas.org/cgi/doi/10.1073/pnas.1416964112
Empirical distributions of the weights of pregnant womenshow that Indian women do not compensate for low prepreg-nancy body mass by gaining adequate weight during pregnancy.Indeed, on average, women in India end pregnancy weighing lessthan women in sub-Saharan Africa begin pregnancy.Women in both India and sub-Saharan Africa gain only about
7 kg, on average, for a full-term pregnancy. Two differentmethods confirm these results. Such a small weight gain is onlyabout half of the minimum recommended gain for underweightwomen in the United States, for whom national guidelines rec-ommend gaining between 12.5 and 18 kg during pregnancy. It isonly about 60% of the minimum recommended gain for normalweight women, for whom the guidelines recommend gainingbetween 11.5 and 16 kg (19).
Summary StatisticsTable 1 shows that the 2005 Indian gross domestic product(GDP) per capita was twice the GDP per capita of sub-SaharanAfrica, and the Indian population was 1.45 times as large (25).The 2005 poverty headcount ratio, using the World Bank’s $1.25per day poverty line, was lower in India than sub-Saharan Africa(26). Further, the 2005 total fertility rate (TFR) in India wasconsiderably lower than in sub-Saharan Africa; the PopulationReference Bureau estimates an India TFR of 3.0 compared with5.6 for sub-Saharan Africa (27).Table 1 also provides information on the samples used for
the analysis. The sample of African countries is restricted tothose 29 countries with a DHS that measured women’s weightsbetween 2000 and 2010; these are listed in Table S1. Samplecountries from sub-Saharan Africa represent about 80% of thepopulation of the region and are poorer than the region asa whole.
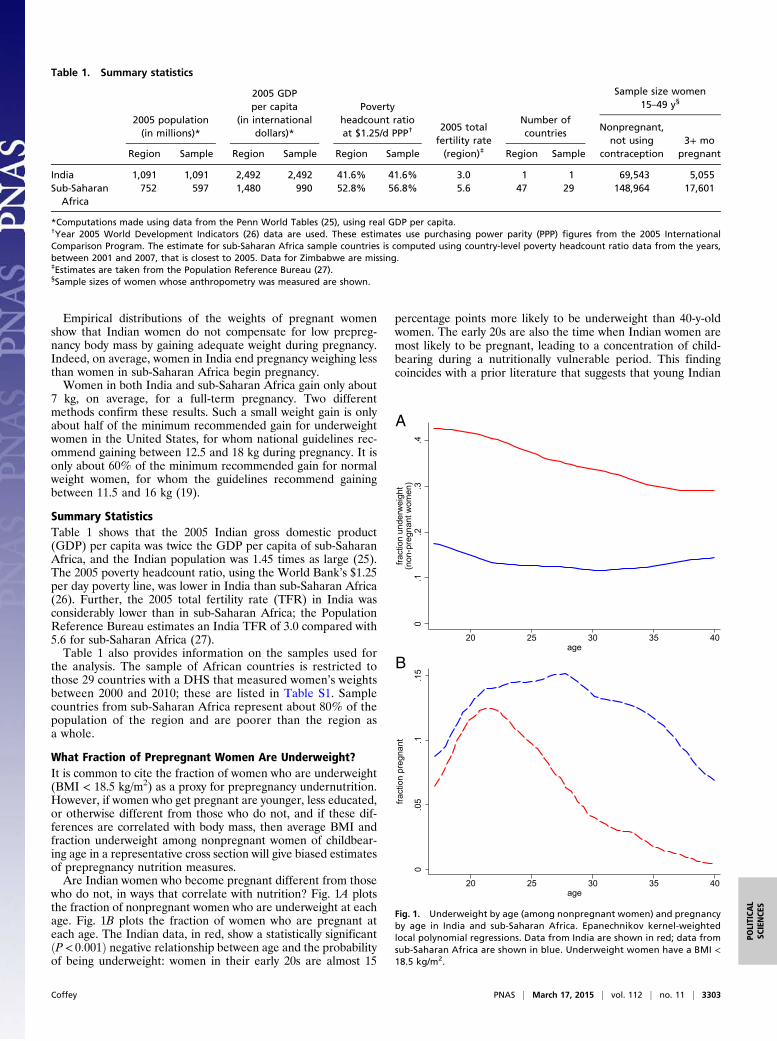
What Fraction of Prepregnant Women Are Underweight?It is common to cite the fraction of women who are underweight(BMI < 18.5 kg/m2) as a proxy for prepregnancy undernutrition.However, if women who get pregnant are younger, less educated,or otherwise different from those who do not, and if these dif-ferences are correlated with body mass, then average BMI andfraction underweight among nonpregnant women of childbear-ing age in a representative cross section will give biased estimatesof prepregnancy nutrition measures.Are Indian women who become pregnant different from those
who do not, in ways that correlate with nutrition? Fig. 1A plotsthe fraction of nonpregnant women who are underweight at eachage. Fig. 1B plots the fraction of women who are pregnant ateach age. The Indian data, in red, show a statistically significantðP< 0:001Þ negative relationship between age and the probabilityof being underweight: women in their early 20s are almost 15
percentage points more likely to be underweight than 40-y-oldwomen. The early 20s are also the time when Indian women aremost likely to be pregnant, leading to a concentration of child-bearing during a nutritionally vulnerable period. This findingcoincides with a prior literature that suggests that young Indian
Table 1. Summary statistics
2005 population(in millions)*
2005 GDPper capita
(in internationaldollars)*
Povertyheadcount ratioat $1.25/d PPP†
2005 totalfertility rate(region)‡
Number ofcountries
Sample size women15–49 y§
Region Sample Region Sample Region Sample Region Sample
Nonpregnant,not using
contraception3+ mo
pregnant
India 1,091 1,091 2,492 2,492 41.6% 41.6% 3.0 1 1 69,543 5,055Sub-Saharan
Africa752 597 1,480 990 52.8% 56.8% 5.6 47 29 148,964 17,601
*Computations made using data from the Penn World Tables (25), using real GDP per capita.†Year 2005 World Development Indicators (26) data are used. These estimates use purchasing power parity (PPP) figures from the 2005 InternationalComparison Program. The estimate for sub-Saharan Africa sample countries is computed using country-level poverty headcount ratio data from the years,between 2001 and 2007, that is closest to 2005. Data for Zimbabwe are missing.‡Estimates are taken from the Population Reference Bureau (27).§Sample sizes of women whose anthropometry was measured are shown.
0.1
.2.3
.4
fract
ion
unde
rwei
ght
(non
-pre
gnan
t wom
en)
20 25 30 35 40age
0.0
5.1
.15
fract
ion
preg
nant
20 25 30 35 40age
A
B
Fig. 1. Underweight by age (among nonpregnant women) and pregnancyby age in India and sub-Saharan Africa. Epanechnikov kernel-weightedlocal polynomial regressions. Data from India are shown in red; data fromsub-Saharan Africa are shown in blue. Underweight women have a BMI <18.5 kg/m2.
Coffey PNAS | March 17, 2015 | vol. 112 | no. 11 | 3303
POLITICA
LSC
IENCE
S
women have particularly low social status early in their marriages(23). This has negative consequences for their own health andthe health of their children (22).The Indian data contrast sharply with those for sub-Saharan
Africa. The solid blue curve in Fig. 1 shows a quadratic relation-ship between age and underweight ðP< 0:001Þ among Africanwomen. African women in their early 20s are about 25 percentagepoints less likely to be underweight than Indian women in thesame age range. In sub-Saharan Africa, fertility levels, shown withdashed curves, are much higher, and childbearing is spread outbetween the ages of about 17 and 35, rather than being concen-trated in the early 20s.To estimate prepregnancy BMI and fraction underweight, I
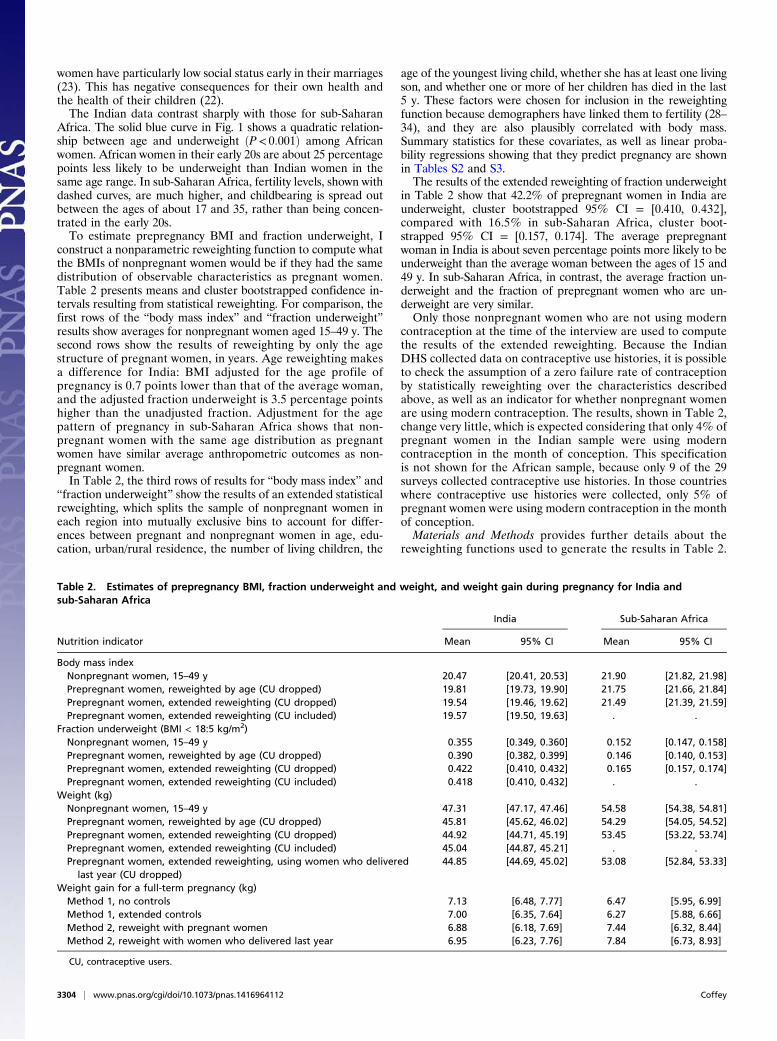
construct a nonparametric reweighting function to compute whatthe BMIs of nonpregnant women would be if they had the samedistribution of observable characteristics as pregnant women.Table 2 presents means and cluster bootstrapped confidence in-tervals resulting from statistical reweighting. For comparison, thefirst rows of the “body mass index” and “fraction underweight”results show averages for nonpregnant women aged 15–49 y. Thesecond rows show the results of reweighting by only the agestructure of pregnant women, in years. Age reweighting makesa difference for India: BMI adjusted for the age profile ofpregnancy is 0.7 points lower than that of the average woman,and the adjusted fraction underweight is 3.5 percentage pointshigher than the unadjusted fraction. Adjustment for the agepattern of pregnancy in sub-Saharan Africa shows that non-pregnant women with the same age distribution as pregnantwomen have similar average anthropometric outcomes as non-pregnant women.In Table 2, the third rows of results for “body mass index” and
“fraction underweight” show the results of an extended statisticalreweighting, which splits the sample of nonpregnant women ineach region into mutually exclusive bins to account for differ-ences between pregnant and nonpregnant women in age, edu-cation, urban/rural residence, the number of living children, the
age of the youngest living child, whether she has at least one livingson, and whether one or more of her children has died in the last5 y. These factors were chosen for inclusion in the reweightingfunction because demographers have linked them to fertility (28–34), and they are also plausibly correlated with body mass.Summary statistics for these covariates, as well as linear proba-bility regressions showing that they predict pregnancy are shownin Tables S2 and S3.The results of the extended reweighting of fraction underweight
in Table 2 show that 42.2% of prepregnant women in India areunderweight, cluster bootstrapped 95% CI = [0.410, 0.432],compared with 16.5% in sub-Saharan Africa, cluster boot-strapped 95% CI = [0.157, 0.174]. The average prepregnantwoman in India is about seven percentage points more likely to beunderweight than the average woman between the ages of 15 and49 y. In sub-Saharan Africa, in contrast, the average fraction un-derweight and the fraction of prepregnant women who are un-derweight are very similar.Only those nonpregnant women who are not using modern
contraception at the time of the interview are used to computethe results of the extended reweighting. Because the IndianDHS collected data on contraceptive use histories, it is possibleto check the assumption of a zero failure rate of contraceptionby statistically reweighting over the characteristics describedabove, as well as an indicator for whether nonpregnant womenare using modern contraception. The results, shown in Table 2,change very little, which is expected considering that only 4% ofpregnant women in the Indian sample were using moderncontraception in the month of conception. This specificationis not shown for the African sample, because only 9 of the 29surveys collected contraceptive use histories. In those countrieswhere contraceptive use histories were collected, only 5% ofpregnant women were using modern contraception in the monthof conception.Materials and Methods provides further details about the
reweighting functions used to generate the results in Table 2.
Table 2. Estimates of prepregnancy BMI, fraction underweight and weight, and weight gain during pregnancy for India andsub-Saharan Africa
Nutrition indicator
India Sub-Saharan Africa
Mean 95% CI Mean 95% CI
Body mass indexNonpregnant women, 15–49 y 20.47 [20.41, 20.53] 21.90 [21.82, 21.98]Prepregnant women, reweighted by age (CU dropped) 19.81 [19.73, 19.90] 21.75 [21.66, 21.84]Prepregnant women, extended reweighting (CU dropped) 19.54 [19.46, 19.62] 21.49 [21.39, 21.59]Prepregnant women, extended reweighting (CU included) 19.57 [19.50, 19.63] . .
Fraction underweight (BMI < 18:5 kg/m2)Nonpregnant women, 15–49 y 0.355 [0.349, 0.360] 0.152 [0.147, 0.158]Prepregnant women, reweighted by age (CU dropped) 0.390 [0.382, 0.399] 0.146 [0.140, 0.153]Prepregnant women, extended reweighting (CU dropped) 0.422 [0.410, 0.432] 0.165 [0.157, 0.174]Prepregnant women, extended reweighting (CU included) 0.418 [0.410, 0.432] . .
Weight (kg)Nonpregnant women, 15–49 y 47.31 [47.17, 47.46] 54.58 [54.38, 54.81]Prepregnant women, reweighted by age (CU dropped) 45.81 [45.62, 46.02] 54.29 [54.05, 54.52]Prepregnant women, extended reweighting (CU dropped) 44.92 [44.71, 45.19] 53.45 [53.22, 53.74]Prepregnant women, extended reweighting (CU included) 45.04 [44.87, 45.21] . .Prepregnant women, extended reweighting, using women who delivered
last year (CU dropped)44.85 [44.69, 45.02] 53.08 [52.84, 53.33]
Weight gain for a full-term pregnancy (kg)Method 1, no controls 7.13 [6.48, 7.77] 6.47 [5.95, 6.99]Method 1, extended controls 7.00 [6.35, 7.64] 6.27 [5.88, 6.66]Method 2, reweight with pregnant women 6.88 [6.18, 7.69] 7.44 [6.32, 8.44]Method 2, reweight with women who delivered last year 6.95 [6.23, 7.76] 7.84 [6.73, 8.93]
CU, contraceptive users.
3304 | www.pnas.org/cgi/doi/10.1073/pnas.1416964112 Coffey
Do Indian Women Compensate for Low Prepregnancy BodyMass with Weight Gain During Pregnancy?Prior research on weight gain during pregnancy in India studiessmall samples of women, which are not intended to be repre-sentative of the population (35–37). To estimate average weightgain for full-term pregnancies in the population, this paper usestwo strategies: the first compares the weights of women in earlypregnancy with those of women in late pregnancy, and the sec-ond compares the weights of nonpregnant women, adjusted forselection, with weights of women in late pregnancy.Before turning to model-based estimates of weight gain during
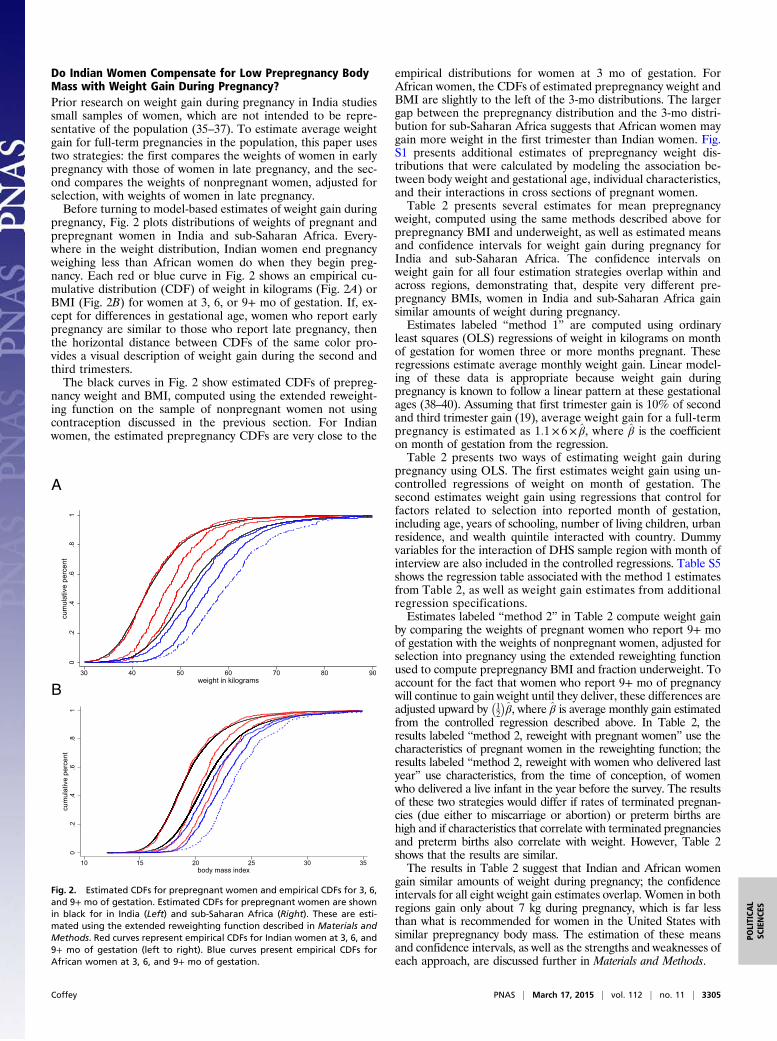
pregnancy, Fig. 2 plots distributions of weights of pregnant andprepregnant women in India and sub-Saharan Africa. Every-where in the weight distribution, Indian women end pregnancyweighing less than African women do when they begin preg-nancy. Each red or blue curve in Fig. 2 shows an empirical cu-mulative distribution (CDF) of weight in kilograms (Fig. 2A) orBMI (Fig. 2B) for women at 3, 6, or 9+ mo of gestation. If, ex-cept for differences in gestational age, women who report earlypregnancy are similar to those who report late pregnancy, thenthe horizontal distance between CDFs of the same color pro-vides a visual description of weight gain during the second andthird trimesters.The black curves in Fig. 2 show estimated CDFs of prepreg-
nancy weight and BMI, computed using the extended reweight-ing function on the sample of nonpregnant women not usingcontraception discussed in the previous section. For Indianwomen, the estimated prepregnancy CDFs are very close to the
empirical distributions for women at 3 mo of gestation. ForAfrican women, the CDFs of estimated prepregnancy weight andBMI are slightly to the left of the 3-mo distributions. The largergap between the prepregnancy distribution and the 3-mo distri-bution for sub-Saharan Africa suggests that African women maygain more weight in the first trimester than Indian women. Fig.S1 presents additional estimates of prepregnancy weight dis-tributions that were calculated by modeling the association be-tween body weight and gestational age, individual characteristics,and their interactions in cross sections of pregnant women.Table 2 presents several estimates for mean prepregnancy
weight, computed using the same methods described above forprepregnancy BMI and underweight, as well as estimated meansand confidence intervals for weight gain during pregnancy forIndia and sub-Saharan Africa. The confidence intervals onweight gain for all four estimation strategies overlap within andacross regions, demonstrating that, despite very different pre-pregnancy BMIs, women in India and sub-Saharan Africa gainsimilar amounts of weight during pregnancy.Estimates labeled “method 1” are computed using ordinary
least squares (OLS) regressions of weight in kilograms on monthof gestation for women three or more months pregnant. Theseregressions estimate average monthly weight gain. Linear model-ing of these data is appropriate because weight gain duringpregnancy is known to follow a linear pattern at these gestationalages (38–40). Assuming that first trimester gain is 10% of secondand third trimester gain (19), average weight gain for a full-termpregnancy is estimated as 1:1× 6× β̂, where β̂ is the coefficienton month of gestation from the regression.Table 2 presents two ways of estimating weight gain during
pregnancy using OLS. The first estimates weight gain using un-controlled regressions of weight on month of gestation. Thesecond estimates weight gain using regressions that control forfactors related to selection into reported month of gestation,including age, years of schooling, number of living children, urbanresidence, and wealth quintile interacted with country. Dummyvariables for the interaction of DHS sample region with month ofinterview are also included in the controlled regressions. Table S5shows the regression table associated with the method 1 estimatesfrom Table 2, as well as weight gain estimates from additionalregression specifications.Estimates labeled “method 2” in Table 2 compute weight gain
by comparing the weights of pregnant women who report 9+ moof gestation with the weights of nonpregnant women, adjusted forselection into pregnancy using the extended reweighting functionused to compute prepregnancy BMI and fraction underweight. Toaccount for the fact that women who report 9+ mo of pregnancywill continue to gain weight until they deliver, these differences areadjusted upward by
�12
�β̂, where β̂ is average monthly gain estimated
from the controlled regression described above. In Table 2, theresults labeled “method 2, reweight with pregnant women” use thecharacteristics of pregnant women in the reweighting function; theresults labeled “method 2, reweight with women who delivered lastyear” use characteristics, from the time of conception, of womenwho delivered a live infant in the year before the survey. The resultsof these two strategies would differ if rates of terminated pregnan-cies (due either to miscarriage or abortion) or preterm births arehigh and if characteristics that correlate with terminated pregnanciesand preterm births also correlate with weight. However, Table 2shows that the results are similar.The results in Table 2 suggest that Indian and African women
gain similar amounts of weight during pregnancy; the confidenceintervals for all eight weight gain estimates overlap. Women in bothregions gain only about 7 kg during pregnancy, which is far lessthan what is recommended for women in the United States withsimilar prepregnancy body mass. The estimation of these meansand confidence intervals, as well as the strengths and weaknesses ofeach approach, are discussed further in Materials and Methods.
0.2
.4.6
.81
cum
ulat
ive
perc
ent
10 15 20 25 30 35body mass index
A
B
Fig. 2. Estimated CDFs for prepregnant women and empirical CDFs for 3, 6,and 9+ mo of gestation. Estimated CDFs for prepregnant women are shownin black for in India (Left) and sub-Saharan Africa (Right). These are esti-mated using the extended reweighting function described in Materials andMethods. Red curves represent empirical CDFs for Indian women at 3, 6, and9+ mo of gestation (left to right). Blue curves present empirical CDFs forAfrican women at 3, 6, and 9+ mo of gestation.
Coffey PNAS | March 17, 2015 | vol. 112 | no. 11 | 3305
POLITICA
LSC
IENCE
S
DiscussionThis paper provides, to my knowledge, the first estimates ofprepregnancy BMI, fraction underweight, and weight gain duringpregnancy for India, the country with the highest number of birthsin the world and serious challenges for population health, and forsub-Saharan Africa, a region that is significantly poorer.By a novel application of reweighting estimation strategies, I
find that 42.2% of prepregnant women in India are underweight,which is more than 25 percentage points higher than the compa-rable figure for sub-Saharan Africa. Women in both regions gainvery little weight during pregnancy, but because of prepregnancydeficits, women in India end pregnancy weighing even less thanwomen in sub-Saharan Africa begin it. Because prepregnancyBMI interacts with weight gain to produce birth weight, one wouldexpect Indian infants to be born at significantly lower birth weightsthan African infants, a prediction that is supported by differencesin anthropometric outcomes very early in life measured in theDHS. Because birth weight is a determinant of height, these dif-ferences in in utero nutrition may help explain the Asian enigmathat Indians are shorter than Africans, despite their relativelybetter economic circumstances.This study also found that in India, the prevalence of under-
weight among prepregnant women is higher than estimates forthe average woman. About half of the gap between average un-derweight and prepregnancy underweight is explained by a pre-viously unquantified relationship among age, the prevalence ofunderweight, and pregnancy, shown in Fig. 1.These results suggest that further research is needed to un-
derstand why health during pregnancy in India is so poor and howit might be improved. Strong economic arguments exist as to whyIndia should invest in pregnancy to improve infant health (14,41). However, to the extent that poor health during pregnancy iscaused by low intrahousehold status among young women, whichimposes a heavy burden of manual labor and restricts food intake(23), government intervention may prove extremely difficult. In-deed, prior literature on maternal health care has observed thatthe coincidence of childbearing with the restricted mobility andlow intrahousehold status of young women limits their use ofhealth services (23, 42).Although certainly important, discrimination against young
women is not the only reason why maternal health is so poor.Indeed, India’s most recent DHS shows that the prevalence ofunderweight is 25% among men aged 40–50 y; these are thehousehold members with the highest intrahousehold status. Ex-posure to infectious disease, poor sanitation, and poor diets allcontribute to low body mass among both men and women. In thecontext of strong intrahousehold inequalities, investments inpublic goods that improve the disease environment similarly foreveryone may be particularly useful.
Materials and MethodsData. This paper uses data from the DHS, which are publicly available fromwww.dhsprogram.com. For sub-Saharan Africa, I construct a dataset thatincludes all countries in which a survey collected data on women’s weightsand pregnancy duration between 2000 and 2010. If a country had more thanone such DHS in this time window, the survey that took place closest to 2005is chosen. A list of 29 countries and survey years included in the sub-SaharanAfrica sample is presented in Table S1. Anthropometry data are missing for4.3% of pregnant women and 4.6% of nonpregnant women in the Indiasample and for 2.4% of pregnant women and 2.4% of nonpregnant womenin the sub-Saharan Africa sample; these observations are dropped fromthe analysis.
Design Weights.Design weights are used to compute all results. For India, I usethe women’s sampling weights provided by the DHS. For sub-Saharan Africa,I construct a weight, sic , for each woman i in country c. sic = ðpopc,2005=P
cpopc,2005Þ× ðwi=P
i∈cwiÞ, where popc,2005 is the population of country cin 2005 from the Penn World Tables (25). wi is the sampling weight forwoman i within a given survey.
Estimation of Prepregnancy Indicators. This paper applies a nonparametricreweighting function similar to that described by DiNardo et al. (43) andGeruso (44). The reweighting function used to generate many of the resultsreported in Table 2, Ψ, is defined as ΨðxÞ= ½fðxjP = 1Þ�=½fðxjP = 0Þ�, where x isa single set of indicators for the intersections of categorical indicatorsassigned from observable characteristics that are correlated with pregnancyand body size. With the exception of education and urban residence, whichare assigned for all women based on what is true at the time of survey,pregnant women are assigned characteristics based on what was true in themonth of conception, and nonpregnant women are assigned characteristicsbased on what is true when they are surveyed. In Table 2, results labeled“reweighted by age” reweight only by age in years, and nonpregnantwomen who are using modern contraception are dropped from thereweighting procedure. The results of the extended reweighting likewiseomit women using contraception and include a larger set of characteristicsin the reweighting function: dummy variables for age groups (15–19, 20–24,25–30, 30–40, and 40–50 y); education level (primary or less, some secondaryor more); residence (urban, rural); age of the youngest child (no livingchildren, youngest child is <1 y old, youngest child is between 1 and 2 y old,youngest child is >2 y old); presence of a living son; number of living children(one, two, three, and four or more); and whether any of the woman’schildren died in the 5 y before the interview. Table S2 presents summarystatistics for these covariates for pregnant and nonpregnant women. Table S3shows linear probability regressions of an indicator for being 3+ mopregnant on these covariates. The results in Table 2 include nonpregnantwomen who are using modern contraception and add to the extendedreweighting function an indicator for the use of modern contraception at thetime of conception.
The probability of reporting pregnancies of 1 or 2 mo of gestation is lowrelative to the probability of reporting pregnancies of other months ofgestation. Table S4 shows the fraction of women reporting pregnancies ofeach gestational age. To avoid biasing the results due to selection intoreporting of early pregnancies, only women reporting 3 mo or more sincetheir last menstrual period are included in the sample of pregnant womenused to compute the reweighting function. Throughout the paper, month ofgestation is calculated based on the respondent’s reported time since herlast menstrual period, which is asked of all respondents, and is rounded upor down to the nearest month if reported in weeks. Where data on timesince last menstrual period is missing, the response to a question asked onlyof pregnant women (“How many months pregnant are you?”) is used.
Mean prepregnancy BMI, BMI, is ½PiBMIi ×ΨðxiÞ�=n0, where i indexesnonpregnant women and n0 is the number of nonpregnant women in thesample. For India, the results in Table 2 for the age-only reweighting andthe extended reweighting without contraceptive users drop less than 1% ofthe sample of pregnant women due to lack of support in the distribution ofnonpregnant women. For the extended reweighting that includes contra-ceptive users, 2% of the sample of pregnant women are dropped beforecalculating the reweighting function. For sub-Saharan Africa, no pregnantwomen are dropped to compute the results of the age-only reweighting; forthe extended reweighting, about a tenth of a percent of the sample ofpregnant women is dropped.
To compute the bootstrapped confidence intervals for results about bodymass, fraction underweight, and weight Table 2, I resample clusters from theoriginal data sources (DHS primary sampling units), stratifying within urbanresidence and state for the India sample and urban residence and countryfor the African sample.
Estimation of Weight Gain During Pregnancy.Method 1. Estimates labeled method 1 in Table 2 present average weight gainfor a full-term pregnancy estimated as 1:1× 6× β̂, where β̂ is the coefficienton month of gestation from an OLS regression of weight on month of gesta-tion for women 3+ mo pregnant. This method for computing weight gainassumes that women in both regions gain an additional 10% of their secondand third trimester weight gain in the first trimester. Table S5 presents esti-mates of weight gain in pregnancy computed using several different estimatesof β̂ from OLS regressions of the form
weighti = α+ βmonthi +ΓCi + ei , [1]
where weighti is the weight in kilograms of pregnant woman i. monthi ismonth of gestation, calculated as described above. Controls, Ci , are added tothe regression in stages to correct for possible selection into gestational agereporting, which could bias β̂ negatively if disadvantaged women fail toreport early pregnancies or positively if disadvantaged women are morelikely to miscarry or terminate the pregnancy. Column 3 in Table S5 controls
3306 | www.pnas.org/cgi/doi/10.1073/pnas.1416964112 Coffey
for age fixed effects, years of schooling fixed effects, number of livingchildren fixed effects, an urban fixed effect, and dummy variables for theinteraction of wealth quintile with country. Column 3 also adds controls forplace interacted with month of interview. Places are countries in the Africasample and states in the India sample. Columns 4 and 5 restrict the re-gression to women reporting 4–9 and 3–8 mo of pregnancy, respectively, totest whether the results are sensitive to omitting the months that are mostlikely affected by pregnancy underreporting and prematurity, respectively.The results are not sensitive to these respecifications; 95% confidenceintervals of weight gain for method 1 results in Table 2 and Table S5 arecalculated as 1:1× 6× ðβ̂± 1:96× seβ̂Þ.Method 2. It is useful to validate weight gain estimates from method 1 usinga second method. Estimates produced using method 1 may overestimateweight gain during pregnancy if women gain less than 10% of second andthird trimester gain in the first trimester. The black curve representing thedistribution of weights among prepregnant women in India in Fig. 2 sug-gests that, for India, this may be true. However, if gestational ages aremisreported, then the coefficients on gestational age would be attenuated,and method 1 would underestimate weight gain in pregnancy. Method 2estimates average gain as the difference between average prepregnantweight computed using the nonparametric reweighting method describedabove for BMI and the average weight of women in late pregnancy. Thismethod does not make assumptions about first trimester gain, nor does itpotentially suffer from attenuation bias. However, method 2 will only pro-duce unbiased estimates of weight gain in pregnancy insofar as the non-parametric reweighting accounts for all important endogeneity in selectioninto pregnancy. Fig. S1, which plots the estimated prepregnancy weightdistribution from the nonparametric reweighting of nonpregnant womenagainst estimates of the distribution of prepregnant weight based on cor-recting the weights of individual pregnant women for gestational age,
observable characteristics, and their interactions, provides evidence that thedistributions resulting from the nonparametric reweighting are good esti-mates of the prepregnancy distributions.
Method 2 estimates average gain as ðW9 −W0Þ+ ð1=2Þβ̂1, whereW9 is theaverage weight of women reporting 9+ mo of gestation; W0 is an estimateof prepregnancy weight from the nonparametric reweighting; and β̂ is theaverage estimated monthly gain from the controlled regression describedfor method 1. The inclusion of a half a month of linear weight gain assumesthat pregnant women who report 9+ mo since their last menstrual periodare, on average, at the midpoint of the final month of pregnancy. Averageprepregnancy weight is computed using the extended reweighting functiondescribed above, dropping contraceptive users. The first row of method 2results in Table 2 reweights over characteristics of pregnant women; thesecond row of method 2 results reweights over characteristics, from the timeof conception, of women who delivered a live birth in the year beforethe survey.
Sampling error contributes to the variance of both W9 and W0 and to theestimation of β̂. Therefore, to calculate 95% CIs for this estimate of weightgain, I bootstrap the entire calculation, stratifying within urban residenceand state for the India sample and urban residence and country for theAfrican sample. I cluster at the primary sampling unit level.
ACKNOWLEDGMENTS. I thank Hoyt Bleakley, Anne Case, Robert Chase, JanetCurrie, Angus Deaton, Thomas Espenshade, Dennis Feehan, Aashish Gupta,Jeffrey Hammer, Payal Hathi, Sara McLanahan, Franco Peracchi, Sangita Vyas,Charles Westoff, data specialists at ICF International, and especially DeanSpears for helpful comments and discussions. Partial support for this researchwas provided by Eunice Kennedy Shriver National Institute of Child Healthand Human Development Grant 5R24HD047879.
1. Bhutta ZA (2000) Why has so little changed in maternal and child health in southAsia? BMJ 321(7264):809–812.
2. Nubé M (2009) The Asian enigma: Predisposition for low adult BMI among people ofSouth Asian descent. Public Health Nutr 12(4):507–516.
3. Deaton A (2007) Height, health, and development. Proc Natl Acad Sci USA 104(33):13232–13237.
4. Underwood BA (2002) Health and nutrition in women, infants, and children: Over-view of the global situation and the Asian enigma. Nutr Rev 60(5 Pt 2):S7–S13.
5. Coffey D, Deaton A, Drèze J, Spears D, Tarozzi A (2013) Stunting among children:Facts and implications. Econ Polit Wkly XLVIII(34):68–70.
6. Spears D (2013) How much international variation in child height can sanitation ex-plain? World Bank Policy Research working paper 6351.
7. WHO, UNICEF (2004) Low Birth Weight: Country, Regional and Global Estimates(UNICEF, New York).
8. Ludwig DS, Currie J (2010) The association between pregnancy weight gain andbirthweight: A within-family comparison. Lancet 376(9745):984–990.
9. Hytten F, Leitch I (1971) The Physiology of Human Pregnancy (Blackwell ScientificPublications, Oxford).
10. Almond D, Currie J (2011) Killing me softly: The fetal origins hypothesis. J Econ Per-spect 25(3):153–172.
11. Barker DJ (1995) The fetal and infant origins of disease. Eur J Clin Invest 25(7):457–463.
12. Currie J, Vogl T (2013) Early-life health and adult circumstance in developing coun-tries. Annu Rev Econ 5(1):1–36.
13. Adair LS (2007) Size at birth and growth trajectories to young adulthood. Am J HumBiol 19(3):327–337.
14. Behrman J, Rosenzweig M (2004) Returns to birthweight. Rev Econ Stat 86(2):586–601.15. Grantham-McGregor S, et al.; International Child Development Steering Group (2007)
Developmental potential in the first 5 years for children in developing countries.Lancet 369(9555):60–70.
16. Susser M, Stein Z (1994) Timing in prenatal nutrition: A reprise of the Dutch FamineStudy. Nutr Rev 52(3):84–94.
17. Black S, Devereux P, Salvanes K (2007) From the cradle to the labor market? The effectof birth weight on adult outcomes. Q J Econ 122(1):409–439.
18. Institute of Medicine (1990) Nutrition During Pregnancy: Part I, Weight Gain (NationalAcademies Press, Washington, DC).
19. Yaktine A, Rasmussen K, eds (2009) Weight Gain During Pregnancy: Reexamining theGuidelines (National Academies Press, Washington, DC).
20. Bhutta ZA, et al.; Maternal and Child Undernutrition Study Group (2008) Whatworks? Interventions for maternal and child undernutrition and survival. Lancet371(9610):417–440.
21. Black RE, et al.; Maternal and Child Undernutrition Study Group (2008) Maternal andchild undernutrition: Global and regional exposures and health consequences. Lancet371(9608):243–260.
22. Das Gupta M (1995) Life course perspectives on women’s autonomy and healthoutcomes. Am Anthropol 97(3):481–491.
23. Jeffery P, Jeffery R, Lyon A (1989) Labour Pains and Labour Power: Women andChildbearing in India (Zed Books, London).
24. Dyson T, Moore M (1983) On kinship structure, female autonomy, and demographicbehavior in India. Popul Dev Rev 9(1):35–60.
25. Heston A, Summers R, Aten B (2002) Penn World Table (Center for InternationalComparisons at the Univ of Pennsylvania, Philadelphia).
26. World Bank (2014) World Development Indicators 1960-2013 (World Bank, Wash-ington, DC).
27. Population Reference Bureau (2005) 2005 World Population Datasheet (PopulationReference Bureau, Washington, DC).
28. Castro Martín T (1995) Women’s education and fertility: Results from 26 Demographicand Health Surveys. Stud Fam Plann 26(4):187–202.
29. Bongaarts J (1987) The proximate determinants of fertility. Technol Soc 9:243–260.30. Easterlin R (1971) Does human fertility adjust to the environment? Am Econ Rev 61(3):
399–407.31. Bongaarts J, Frank O, Lesthaeghe R (1984) The proximate determinants of fertility in
sub-Saharan Africa. Popul Dev Rev 10:511–537.32. Das N (1987) Sex preference and fertility behavior: A study of recent Indian data.
Demography 24(4):517–530.33. Montgomery M, et al. (1997) From Death to Birth: Mortality Decline and Reproductive
Change (National Academies Press, Washington, DC).34. Preston S, et al. (1978) The Effects of Infant and Child Mortality on Fertility (Aca-
demic Press, New York).35. Yajnik CS, et al. (2003) Neonatal anthropometry: The thin-fat Indian baby. The Pune
Maternal Nutrition Study. Int J Obes Relat Metab Disord 27(2):173–180.36. Agarwal DK, Agarwal KN, Satya K, Agarwal S (1998) Weight gain during pregnancy—a
key factor in perinatal and infant mortality. Indian Pediatr 35(8):733–743.37. Hutter I (1994) Being Pregnant in Rural South India: Nutrition of Women and Well-
Being of Children (Purdue Univ Press, West Lafayette, IN).38. Billewicz WC, Thomson AM (1957) Clinical significance of weight trends during
pregnancy. BMJ 1(5013):243–247.39. Siega-Riz AM, Adair LS, Hobel CJ (1994) Institute of Medicine maternal weight gain
recommendations and pregnancy outcome in a predominantly Hispanic population.Obstet Gynecol 84(4):565–573.
40. Abrams B, Selvin S (1995) Maternal weight gain pattern and birth weight. ObstetGynecol 86(2):163–169.
41. Alderman H, Behrman J (2006) Reducing the incidence of low birth weight in low-income countries has substantial economic benefits. World Bank Res Obs 21(1):25–48.
42. Bloom SS, Wypij D, Das Gupta M (2001) Dimensions of women’s autonomy and theinfluence on maternal health care utilization in a north Indian city. Demography38(1):67–78.
43. DiNardo J, Fortin M, Lemieux T (1996) Labor market institutions and the distributionof wages, 1973-1992: A semiparametric approach. Econometrica 64(5):1001–1044.
44. Geruso M (2012) Black-white disparities in life expectancy: How much can the stan-dard SES variables explain? Demography 49(2):553–574.
Coffey PNAS | March 17, 2015 | vol. 112 | no. 11 | 3307
POLITICA
LSC
IENCE
S