preparing new york city high school ... - city of new york
TRANSCRIPT

EDUCATION and RAND LABOR AND POPULATION
Preparing New York City High School Students for the WorkforceEvaluation of the Scholars at Work Program
Robert Bozick, Gabriella C. Gonzalez, Serafina Lanna, Monica Mean

The RAND Corporation is a research organization that develops solutions to public policy challenges to help make communities throughout the world safer and more secure, healthier and more prosperous. RAND is nonprofit, nonpartisan, and committed to the public interest.
RAND’s publications do not necessarily reflect the opinions of its research clients and sponsors.
Support RANDMake a tax-deductible charitable contribution at
www.rand.org/giving/contribute
www.rand.org
For more information on this publication, visit www.rand.org/t/RR2488
Published by the RAND Corporation, Santa Monica, Calif.
© 2019 Mayor’s Office for Economic Opportunity
R® is a registered trademark.

iii
Preface
As the New York City economy becomes increasingly reliant on workers who have some postsecondary education or training in a specialized field, there is a growing need for local policymakers and educators to identify the most efficient ways to prepare high school students to take on these “middle-skill jobs.” These needs are particularly acute in the transportation and manufacturing industries. To address these needs, the New York City Department of Small Business Services (SBS) and Department of Education (DOE) created Scholars at Work (SAW), a program available to an eligible subset of New York City high school students enrolled in Career and Technical Education (CTE) programs. The goal of the SAW program is to expose students to career opportunities, to provide them with real-life work experience alongside adults, and to develop their workplace skills.
This report presents findings from the RAND Corporation’s evaluation of the SAW program. The evaluation has two components: an implementation study that examines and describes SAW’s activities and processes, to understand the extent to which those are functioning as the designers and implementers of the program expect, and an outcomes study, which analyzes how SAW participants are faring in the labor market compared to comparable NYC public school graduates.
This report should be of interest to employers, education providers, and stakeholders who are embedded in New York City’s collaborative efforts to support a thriving urban economy. This study can inform the direction of these collaborations so that they can effectively utilize the relationships and resources already in place. With a strong collaborative foundation, SAW can play a role in supporting an effective programmatic infrastructure that sustains a robust workforce development system while engaging local high school graduates.
This work was jointly conducted by RAND Labor and Population and RAND Education. It was funded by the NYC Mayor’s Office for Economic Opportunity. For more information, please contact the study’s Project Leader, Robert Bozick, at [email protected] or by phone at (310) 393-0411, x6140.

iv
Contents
Preface ........................................................................................................................................... iii Figures ............................................................................................................................................. v Tables ............................................................................................................................................. vi Summary ....................................................................................................................................... vii Acknowledgments .......................................................................................................................... xi Abbreviations ............................................................................................................................... xii 1. Introduction ................................................................................................................................. 1
Background .................................................................................................................................. 1 Objectives of the Study ............................................................................................................... 2 Organization of This Report ........................................................................................................ 3
2. New York City Career and Technical Education and the Scholars at Work Program ................ 4 Career and Technical Education in New York City Public Schools ........................................... 4 Description of Scholars at Work ................................................................................................. 7
3. Implementation Study ............................................................................................................... 18 Data Sources .............................................................................................................................. 18 Analytic Approach ..................................................................................................................... 20 Key Findings ............................................................................................................................. 20 Summary .................................................................................................................................... 31
4. Outcomes Analysis .................................................................................................................... 32 Data Sources and Sample Selection .......................................................................................... 32 Method ....................................................................................................................................... 35 Key Findings ............................................................................................................................. 39 Summary .................................................................................................................................... 46
5. Summary and Limitations ......................................................................................................... 47
References ..................................................................................................................................... 50
Appendices A. Organizational Structure of Scholars at Work .......................................................................... 53 B. Description of Site Visit Samples and Interviews .................................................................... 54 C. Employment and Earnings by Quarter ...................................................................................... 59

v
Figures
Figure 2.1. New York State Program Approval Process ................................................................. 5 Figure 2.2. Scholars at Work Expected Short-term and Long-term Outcomes ............................... 8 Figure 4.1. Percentage of NYC High School Graduates Who Participated in the Career
Exploration Module Enrolling in College Within One Year of Graduation; Classes of 2012–2015 ....................................................................................................................................... 39
Figure 4.2. Percentage of NYC High School Graduates Who Participated in the Internship Module Enrolling in College Within One Year of Graduation; Classes of 2012–2015 ........ 40
Figure 4.3. Percentage of NYC High School Graduates Who Participated in the Career Exploration Module Formally Employed at Least Once in New York State Within One Year of Graduation; Classes of 2012–2016 ................................................................................... 41
Figure 4.4. Percentage of NYC High School Graduates Who Participated in the Internship Module Formally Employed at Least Once in New York State Within One Year of Graduation; Classes of 2012–2016 ........................................................................................ 42
Figure 4.5. Percentage of Employed NYC High School Graduates Who Participated in the Career Exploration Module Working in Manufacturing or Transportation in New York State Within One Year of Graduation; Classes of 2012–2016 ....................................................... 43
Figure 4.6. Percentage of Employed NYC High School Graduates Who Participated in the Internship Module Working in Manufacturing or Transportation in New York State Within One Year of Graduation; Classes of 2012–2016 ................................................................... 43
Figure 4.7. Average Earnings in New York State Among Employed NYC High School Graduates Who Participated in the Career Exploration Module Within One Year of Graduation; Classes of 2012–2016 ........................................................................................ 45
Figure 4.8. Average Earnings in New York State Among Employed NYC High School Graduates Who Participated in the Internship Module Within One Year of Graduation; Classes of 2012–2016 ............................................................................................................ 45
Figure A.1. Organizational Structure of Scholars at Work ........................................................... 53

vi
Tables
Table 2.1. SAW Program Participation and Participant Sociodemographic Characteristics by School Year ............................................................................................................................. 9
Table 3.1. Summary of Primary Data Collection Efforts .............................................................. 19 Table 4.1. Covariate Balance Between SAW Career Exploration Treatment and Comparison
Groups ................................................................................................................................... 36 Table 4.2. Covariate Balance Between SAW Internship Treatment and Comparison Groups ..... 38 Table B.1. Interview Populations and Topics of Interest: Career Exploration Site Visit .............. 54 Table B.2. Interview Populations and Topics of Interest: Internship Site Visit ............................ 55 Table C.1. Employment Rates and Earnings by Quarters During the First Year After High
School Graduation ................................................................................................................. 59

vii
Summary
In 2009, the New York City Department of Small Business Services (SBS) and Department of Education (DOE) created Scholars at Work (SAW), a program available to New York City high school seniors enrolled in Career and Technical Education (CTE) programs at high schools that opted to participate. Workforce1 Industrial & Transportation Career (ITC) Centers is the arm of SBS that is responsible for implementation of SAW. The goal of the SAW program is to expose students to career opportunities, to provide them with real-life work experience alongside adults, and to develop their workplace skills. SAW has two core components, each a semester in length: (1) a career exploration module in the fall semester; and (2) an internship that places high school seniors with employers in the spring semester. In career exploration, students engage in activities in a classroom setting designed to develop their soft skills and workplace competencies while learning about career opportunities through visits from industry experts. In the internship module, students participate in a paid internship at a local business for approximately 13 weeks after school for five days a week. The industries in which companies offered internships during the study year ranged from automotive and transportation; voice, data, fiber optic; travel and tourism; electrical and air conditioning; ready-to-wear fashion; architecture, construction, home rehabilitation; manufacturing and fabrication; aerospace; chocolate production, and food supplies and distribution; furniture import and fabrication; energy and utilities; computer maintenance and repair; and cleaning supplies. Most SAW students participate in either the career exploration module (34 percent) or the internship module (59 percent), while a small percentage (7 percent) participate in both.
To improve its understanding of how well SAW is preparing students for employment and postsecondary education after high school, in 2016 the NYC Mayor’s Office for Economic Opportunity asked the RAND Corporation, a nonprofit, nonpartisan public policy research institution, to conduct an external evaluation of SAW. This report presents the findings of this evaluation. Researchers conducted an implementation study that examined and described SAW’s activities and processes to understand the extent to which they function as the designers and implementers of the program expected. In the fall of 2016 we visited the five schools participating in career explorations to conduct an informal observation, interview key staff at the schools and within the SAW program, and conduct focus groups with students who were participating in the career explorations module. In the spring of 2017 we visited six purposefully selected internship sites to interview internship coordinators and mentors and to informally observe the internship site locations. We also conducted phone interviews with four additional employers and with SAW staff. We also conducted an outcomes study to analyze how SAW participants are faring in the labor market compared to similar NYC public school graduates. We note major findings below.

viii
SAW successfully exposed participating students to the workplace. All interviewed employers noted that the program was a “good opportunity” for students to be exposed to a real-life work environment. Likewise, students in the career explorations module with whom we spoke noted that the exposure to the workplace was novel and helpful in honing their career aspirations, and they lauded the mentoring they received from the employers that visited the classroom and the Workforce1 program staff.
SAW provided needed labor to businesses and supported the pipeline of talent. Interviewed employers reported that, from their perspective, the program was meeting the needs of small businesses and the industrial and transportation industries by providing them with a pipeline of talent. The employers appreciated what they considered a “cost-free training opportunity,” in that they did not have to pay interns but rather provided employee time through mentoring. There was a sense of commitment among the employers to train local talent for employment in local small businesses.
Workforce1 ITC built relationships between local employers, participating CTE schools, and the Department of Education. Interviewees noted that SAW helped support partnerships among the coordinating entities of the program (Workforce1 ITC, SBS, and DOE) and employers.
Processes for continuous improvement were in place. Workforce1 ITC endeavored to foster the relationship with employers by engaging them in the process of soliciting their feedback on the program and taking their recommendations into consideration.
Employers reported that student internship placement did not always result in a “good fit.” Although measures had been taken to improve the matching process through continuous improvement mechanisms, four of the six companies interviewed stated that they were “unhappy” with the matching process, given their experiences with students not having an interest in and/or skills matched with the internship in which they were placed. This suggests a number of areas that could be improved: the placement process itself could better align students’ goals with employers’ needs or the pool of talent, and employers could be broadened so that more placement opportunities are available.
Stakeholders lacked a unified vision of SAW’s goals and mission. It was clear from our interviewees that there were multiple, potentially conflicting goals: some stakeholders emphasized student-centered goals while others focused on employer-centered goals.
Formal mechanisms for communication existed, but proved challenging. Program administrators at SBS and DOE meet to discuss the program at the beginning and end of every program year in order to discuss what worked well and where there might be areas for

ix
improvement. However, despite these existing formal mechanisms, all three stakeholder organizations agreed that there needed to be better communication among partners and more constructive and open conversations about challenges and successes of the program. While some employer mentors and coordinators liked the current level of communication, a smaller number voiced concerns that they were charged with reaching out to SAW and that there did not seem to be a clear point of contact or line of communication.
The perceived quality of internship experiences varied across employers and mentors. Employer interviews revealed that the quality of mentorship for interns across sites varied dramatically based on whether mentors had prior training or were brand new to the mentorship process. Interviewees noted that the variation could be for three reasons: the lack of training provided to employer mentors on how best to support interns; a lack of employer knowledge of the skills and CTE coursework that students had prior to the internship; and a lack of standardization or guidance in how mentors assigned tasks to interns.
K–12 education and industry disconnects remained. Program stakeholders from SBS, DOE, and Workforce1 ITC noted that there was a disconnect between CTE education and industry, though all approached it differently. SAW made strides to bridge the gap by bringing together educators, employers, and workforce development leaders. Yet, more work needed to be done in building relationships between K–12 education and industry so that students were receiving the most up-to-date skills training.
Internal monitoring could be improved to better measure and track SAW goals. SAW staff relied on pre- and postcareer exploration and internship student surveys to measure its existing goals. However, these surveys did not measure student decisionmaking processes regarding college and their careers, nor did they inquire about the career and college-going aspirations of the students or the extent to which students explored different career pathways. Having this type of information could help determine how to better shape the program to meet students’ goals. Another way that SAW kept track of student progress was through training plans set up by CTE high school staff, students, and their internship employer. These training plans included hoped-for outcomes for students. However, it was clear from interviews across stakeholders that there was an inconsistent use of the training plan, which could present a barrier to measuring student outcomes.
Participation in SAW did not improve participants’ chances of enrolling in college or finding work after high school, but it was associated with higher earnings. SAW participants enrolled in college and entered the workforce at approximately the same rates as comparison group members. However, SAW students who participated in either the career exploration module or the internship module, or both, earned twice as much as comparison group members in the year after high school graduation.

x
SAW program participants were more likely to secure jobs in the manufacturing and transportation industries, which were the focal industries of the SAW program. Sixteen percent of participants in the SAW internship module and 13 percent of participants in the SAW career exploration module who held jobs in the first year after high school were employed in the manufacturing and transportation industry. These rates of employment in the focal industries of SAW were significantly higher than comparison group members.
As the local New York City economy becomes increasingly reliant on workers who have some postsecondary education or training in a specialized field, there is a growing need for local policymakers and educators to identify the most efficient ways to prepare high school students to take on these “middle-skills jobs.” These needs are particularly acute in the transportation and manufacturing industries. Our study suggests that SAW is a promising program model to help meet these needs.

xi
Acknowledgments
We thank the New York City’s Mayor’s Office for Economic Opportunity for its generous sponsorship of this research. Within this office, we are particularly grateful to David Berman, the Director of Programs and Evaluation, and Daniel Edelman, the Senior Advisor overseeing this particular evaluation. Additionally, our research benefitted from the insight and direction of Shammara Wright and Parker Krasney, who oversaw earlier stages of the evaluation. We thank Lawton Bourne (formerly of NYC Department of Education), Julia Breitman (NYC Department of Youth and Community Development), and Ahmed Chaudry (NYC Department of Small Business Services) for helping to procure data and for providing technical support for the outcomes analysis. We also thank the directors, instructors, and students in the Career and Technical Education programs and the directors, coordinators, and instructors of the Scholars at Work career exploration courses and internship component with whom we spoke. We are particularly grateful to Justin Brown, Andy Kertesz, and Nabila Mohamed (Workforce1), who allowed us to shadow them as they taught and worked with students in the program. We also want to thank the internship site mentors and coordinators with whom we spoke and who so graciously allowed us to visit their sites.

xii
Abbreviations
CIP Classification of Instruction (CIP)
CTE Career and Technical Education
DOE Department of Education
DOL Department of Labor
ITC Industrial and Transportation Career
NYC New York City
NYSED New York State Education Department
PSW propensity score weighting
SAW Scholars at Work
SBS New York City Department of Small Business Services
SYEP Summer Youth Employment Program
WBL Work-Based Learning

1
1. Introduction
Background Middle-skill jobs—occupations that require some postsecondary education or training in a
specialized field, though not necessarily a four-year baccalaureate degree—are projected to make up 48 percent of all jobs created nationally between 2014 and 2024 (National Skills Coalition, 2017). According to analysis of the 2014 Quarterly Census of Employment and Wages, 2.6 million or 46 percent of New Yorkers aged 25 and older lacked the necessary education and training to fill the estimated one million middle-skills jobs available in New York City (NYC) (J. P. Morgan Chase, 2014). Yet, in that same time period, approximately 35 percent of young adults aged 18 to 24 were either unemployed or working low-skill jobs in NYC (J. P. Morgan Chase, 2014), suggesting that there are inefficiencies in the “school-to-work pipeline” intended to train and connect workers with available middle-skill jobs.
Career and Technical Education (CTE) is one of the central, institutionally supported ways for high school students to acquire occupation-specific skills, providing them with an advantage when applying for more specialized postsecondary education training and for landing entry-level middle-skill jobs (Holzer and Lerman, 2009; National Skills Coalition, 2017). CTE refers to an array of programs and practices, from coursework that includes simple workplace scenarios as part of standard academic course offerings (on the “less intensive” end of the CTE spectrum) to full-fledged apprenticeship-style opportunities (on the “more intensive” end of the CTE spectrum). One component of CTE is work-based learning, which allows students to apply their classroom learning in professional settings, gaining real-world experience in the process. This is often done via cooperative education, in which an education program gives students an opportunity to combine theory learned in the classroom with on-the-job, career-related work experience or through internships. Studies have shown that workplace learning, such as internships, can help students understand the applications of academic content in a real workplace context and to build a social network in the fields that interest them (Halpern, 2006), develop their long-term career plans (Nikaido and Singh, 2013), and they are associated with better employment transitions (Polidano and Tabasso, 2014). In the short term, these programs have been shown to improve school attendance rates, school completion rates (Polidano and Tabasso, 2014), and positively contribute to learning motivation (Kuijpers, Meijers, and Gundy,

2
2011) and cognitive and youth development (Bailey, Hughes, and Moore, 2004; Hodkinson and Sparkes, 1997).1
Moreover, job retention tends to be higher for those employees who participated in an internship or cooperative with the employer that then hired them full time. In a 2017 National Association of College and Employers survey, retention after one year of employment was, on average, 65.5 percent for full-time, entry-level hires who had internships or co-ops with the employers that hired them full time, compared to 46.2 percent for full-time, entry-level hires who did not have an internship or co-op at that same employer (National Association of Colleges and Employers, 2018).
To help improve the employment prospects of students entering a labor market with a growing demand for middle-skills workers, in 2009 the NYC Department of Small Business Services (SBS) and Department of Education (DOE) created Scholars at Work (SAW), a program that offers paid internships to NYC high school students participating in CTE programs. In the school year 2012–2013, career exploration, a classroom-based curriculum that teaches workplace competencies and career-readiness skills, was introduced. SAW now consists of both career exploration and paid internships. Most SAW students participate in either the career exploration module (34 percent) or the internship module (59 percent), while a small percentage (7 percent) participate in both.
Objectives of the Study To improve its understanding of how well SAW is preparing students for employment and
postsecondary education after high school, in 2016 the NYC Mayor’s Office for Economic Opportunity asked the RAND Corporation, a nonprofit, nonpartisan public policy research institution, to conduct an external evaluation of SAW. This report presents the findings of this evaluation, which has two components: an implementation study that examines and describes SAW’s activities and processes, to understand the extent to which those are functioning as the designers and implementers of the program expected, and an outcomes study which analyzes how SAW participants are faring in the labor market compared to comparable NYC public school graduates.
The implementation study documented the operation of the program at the time of the study, during the academic year 2016–2017, focusing on the infrastructure, resources, and relationships necessary to implement SAW, and assessed how students and employers experienced the program.
1 This is typically achieved through “career stories” (Savickas, 2002) that emerge in a dialogue in which personal meaning is attached to concrete experiences with work: the learning environment has to be practice-based and dialogical (Bailey, Hughes, and Moore, 2004; Hodkinson and Sparkes, 1997; Kuijpers, Meijers, and Gundy, 2011). The dialogue occurs when students’ perspectives of their work experiences are given a central place in the conversation (Bardick et al., 2006; Philip, 2000). Further, the dialogue is ongoing, rather than a one-off discussion (Harrington and Harrigan, 2006; Riverin-Simard, 2000).

3
Additionally, it identified program strengths and areas needing improvement. The implementation study provided the empirical scaffolding to measure and document the mechanisms (i.e., effective features and components of the program) that produced the outcomes observed in the outcomes study. We based our implementation study on data from a series of interviews and focus groups the RAND research team conducted with program participants, instructors, employers, and SAW program staff.
The outcomes study assessed how SAW participants fared in the labor market when compared with similar youth in the city who did not participate in the program. Due to data and resource constraints, we focused our analysis solely on employment and wages of program participants in the year immediately following high school graduation.2 We based our outcomes study on data provided by the NYC DOE, the SBS, the NYC Department of Youth and Community Development, and the New York State Department of Labor (NYS DOL). Our outcomes study employs a quasi-experimental analytic approach, but because participation in SAW is voluntary we cannot establish a direct causal link between program participation and our observed outcomes. All findings from our outcomes study are purely correlational in nature.
Organization of This Report The remainder of this report describes the results of the RAND evaluation of SAW. As
context, Chapter Two describes the NYC career and technical education system and the SAW program. Chapter Three presents our findings from the implementation study. Chapter Four details our findings of the outcomes study. We conclude in Chapter Five with a summary of findings.
2 There are a host of outcomes that are relevant to effectively evaluating the efficacy of the SAW program, including type of occupation, job performance, job satisfaction, additional job training, and career progression. Those outcomes are not maintained in administrative files and thus would require more resource-intensive methods (e.g., surveys) to collect.

4
2. New York City Career and Technical Education and the Scholars at Work Program
Career and Technical Education in New York City Public Schools Between 2003 and the time of this study in the 2016–2017 academic year, the NYC DOE
created over 30 new CTE schools and rededicated efforts to enhancing student educational experiences in CTE through work-based learning, development of technical skills, and career preparedness.1 Approximately 65,000 students participated in CTE programs in NYC each year in this time period (2003–2017). In the 2017–2018 school year, the DOE designated 46 high schools exclusively as CTE high schools and established 78 programs at schools that include CTE as part of their broader curricular offerings. Some CTE high schools focus on a single industry program area, such as automotive or transportation, while others offer courses in multiple industry program areas. NYC organizes its CTE curriculum around “areas of study,” which are intended to provide students with foundational skills and knowledge in broad career categories.2
The NYC DOE provides 16 CTE areas of study3
• Agriculture, Food, and Natural Resources Cluster • Architecture and Construction Cluster • Arts, Audio/Video Technology, and Communications Cluster • Business Management and Administration Cluster • Education and Training Cluster • Finance Cluster • Government and Administration Cluster • Health Science Cluster • Hospitality and Tourism Cluster • Human Services Cluster • Information Technology Cluster
1 Between 1968 and 2003, no new CTE schools had been created. From NYC CTE, n.d. b. 2 These are also the categorizations that New York State Department of Education uses as Classification of Instructional (CIP) codes, originally developed by the U.S. Department of Education's National Center for Education Statistics in 1980, with revisions occurring in 1985, 1990, and 2000. CIP codes provide a taxonomic scheme to support the accurate tracking and reporting of fields of study and program completions activity. More information can be found at https://nces.ed.gov/pubs2002/cip2000/. 3 University of the State of New York, 2018.

5
• Law and Public Safety Cluster • Manufacturing Production Cluster • Marketing Sales and Services Cluster • Scientific Research and Engineering Cluster • Transportation, Distribution, and Logistics Cluster.
The mission of NYC’s CTE is “to ensure all [CTE] students graduate college and career ready, and to provide a high-value strategy to support both students’ postsecondary aspirations and the strength of the City’s economy.”4 NYC’s CTE initiative is intended as “a scalable approach to school-based career development” structured around three interrelated guiding principles: skill foundation, work experience, and external validation (see Figure 2.1).5
Figure 2.1. New York State Program Approval Process
SOURCE: NYC CTE, “New York State Program Approval Process,” (n.d. c).
Students who enroll in a CTE program complete traditional academic courses (such as math, English language arts, and science) required by NYC DOE; receive instruction from teachers with certifications, licenses, and previous industry experience using industry-approved technical curricula; participate in work-based learning opportunities; and have opportunities to earn industry-recognized certifications. All CTE students must complete a minimum of seven credits in technical courses. Those students who participate in work-based learning opportunities are expected to accrue at least 60 hours of in-the-field experience. At the completion of a CTE program approved by the New York State Education Department (NYSED), students
4 NYC CTE, n.d. a. 5 NYC CTE, n.d. c.

6
receive a CTE-endorsed Regents diploma. CTE schools must also administer an assessment to students for industry credentialing at the conclusion of the program, with the intent of signaling to employers that they have the requisite competencies in their program area. In addition, the NYC DOE has formal agreements with postsecondary institutions that are renewed every five years. The scope of each agreement varies, but in general NYSED requires that CTE students receive benefits if they choose to attend the postsecondary institution, such as advanced standing, preferential placement, or college credit.
There are two types of CTE staff in each school. One is a CTE-certified teacher, who teaches a specific occupational area of focus within a classroom setting. In order for a teacher to be certified to teach CTE courses, he or she must have NYC teaching certification as well as previous work experience in the area of study and vocational training (which varies by the CTE subject). CTE teachers must already be on staff in order for a program to receive state CTE program approval. The second type of CTE staff is a Work-Based Learning (WBL) coordinator, who is a CTE-licensed teacher who manages out-of-classroom experiences for students and is charged with developing a progressive sequence of on-the-job experiences appropriate for students’ educational needs, including mentoring, site visits, career days, competitions, internships, apprenticeships, or cooperatives. On top of their responsibilities as CTE teachers, WBL coordinators work with their fellow CTE teachers to integrate workplace skills into the classroom and to find internship experiences for their students, as well as manage the paperwork that comes with student employment. In order to become a WBL coordinator, NYSED requires an additional certification which includes additional coursework and out-of-classroom work experience, and this enables the certification holder to oversee and protect students at WBL (e.g., internship and apprenticeship) sites.
In order to support internal program development, administration, and evaluation of CTE programming, a CTE Advisory Council was created.6 The mission of the Advisory Council is to aid in student development of academic and workforce preparation skills through substantial and purposeful programming. Each year, the CTE Advisory Council meets five times to discuss its six priorities: CTE program approval, teacher training, internships and job connections, scholarships, competitions, and mentoring. The Council also has working groups (including an executive committee, a committee for CTE students with disabilities, a committee for gender equity, and a CTE students advisory committee) to address specific topic areas under the larger
6 CTE Council, n.d. A CTE Advisory Council is federally mandated as part of the Carl D. Perkins Act (for more information, see CTE Council, 2006).
7
CTE umbrella. The Council consists of individuals from business, industry, labor, postsecondary education, and nonprofit sectors.7
Description of Scholars at Work The NYC SBS and NYC DOE developed SAW based on the NYC CTE WBL requirements.
The stated purpose of the program is “to close skills gaps in critical economic sectors by preparing CTE high school students for and connecting them to good jobs in these sectors. SAW supplements CTE students’ school-based learning of technical skills with exposure to career opportunities, real-life work experience alongside adults, and development of workplace skills.”8 The vision of SAW is to bring educators and employers together to help support a more strategic school-to-work pipeline that addresses the knowledge and skill needs of employers.
The mission statement of SAW identifies five objectives largely aimed at the skill development of students:
(1) close skills gaps in high-need economic areas in NYC (2) prepare CTE high school students for and connect them to careers in these high-need
areas (3) supplement CTE work-based learning curriculum, experience, and development of
technical skills (4) expose students to career opportunities and work experience (5) develop students’ workplace competencies.9
In addition to the student-based mission statement, SAW promotes a community-based vision for local economic development, which strives to complete additional objectives across stakeholders, including the K–12 public education system and NYC employers. These objectives are:
(1) increase youth awareness of, access to, preparation for, and choice of careers in high-need sectors of NYC economy
(2) align and adapt the K–12 public education system in order to develop student skills and competencies that match employer expectations and employment opportunities
7 At the time of this study, the CTE Advisory Council members included ASI System Integration; Brooklyn, Queens, & Long Island Area Health Education Consortium; Building Trades Employers’ Association; Ernst & Young; General Contractors Association of New York; Greater New York Automobile Dealership Association; International Informatics Institute; Learning Disabilities Association of New York State; City University of New York; Metropolitan Transportation Authority; NYC and Co.; Partnership for NYC; Pier Sixty; Securities Industries & Financial Markets Association (SIMFA); Success Via Apprenticeship Program; Tata Consultancy Services; The Edward J. Initiative for Construction Skills; and United Federation of Teachers. 8 NYC CTE, n.d. d. 9 Scholars at Work, 2017a, slide 4.

8
(3) increase NYC employers’ awareness of and appreciation for the cultivation of a youth talent pipeline
(4) build NYC employers’ capacity to develop their desired talent pool (5) create and grow relationships between local employers, high schools, and CTE programs
in order to address skills gaps.10
Figure 2.2 lists the mission and objectives of SAW, as documented in SAW materials that RAND reviewed.
Figure 2.2. Scholars at Work Expected Short-term and Long-term Outcomes
SOURCE: Scholars at Work, 2017a, Slide 4.
10 Scholars at Work, 2017a, slide 4.

9
SAW has two core components, each a semester in length: (1) career exploration, typically scheduled in the fall semester; and (2) an after-school internship that places high school seniors with employers in the spring semester. In career exploration, students engage in activities in a classroom setting designed to develop their soft skills (such as communication, networking, and self-awareness) and workplace competencies (such as basic expectations on timeliness and work ethic that employers and coworkers will have once the student is in a job) while learning about future career opportunities through visits from industry experts. For internships, students participate in an approximately 13-week paid internship at a business aligned with their CTE program. Internships are held after school (typically 2 to 5 p.m. each day) five days a week. Students from participating schools are able to participate in either component of SAW; they are not required to participate in career explorations in order to participate in a paid internship. Most SAW students participate in either the career exploration module or the internship module, while a small percentage (7 percent of SAW students across all cohorts) participated in both. Table 2.1 details the percentage of students who participated in the program components from 2010–2011 to 2015–2016, the six years for which we have data.
Table 2.1. SAW Program Participation and Participant Sociodemographic Characteristics, by School Year
NOTE: The table only includes students who actively consented to releasing their personal information.
2010-11 2011-12 2012-13 2013-14 2014-15 2015-16
Program Participation (%)
Career Exploration 0.0 76.8 12.2 14.8 25.9 14.3
Internship 100.0 22.0 86.7 67.9 63.8 74.5
Both 0.0 1.2 1.1 17.3 10.3 11.2
Sex (%)
Female 0.0 15.2 13.3 13.6 15.5 17.4
Male 100.0 84.8 86.7 86.4 84.5 82.7
Race/Ethnicity (%)
Asian 23.8 14.6 7.8 12.4 20.7 15.3
Black 47.6 36.0 48.9 46.9 44.0 31.6
Hispanic 28.6 40.9 28.9 25.9 31.0 43.9
White 0.0 8.5 12.2 13.6 4.3 9.2
Poverty Status (%)
Yes 80.9 83.5 64.4 74.1 76.7 80.6
No 19.1 16.5 35.6 25.9 23.3 19.4
Total 21 164 90 81 116 98
School Year

10
SAW started as an internship program in the 2009–2010 school year, with 17 high school seniors in three CTE high schools who interned with 12 employers. SAW offers one of only a few internship programs available to CTE students in NYC to fulfill work-based learning and CTE graduation requirements that compensate students for their time and which has work-based learning coordinators heavily engaged in the process of implementing the program and student selection.11 Career exploration launched in the 2012–2013 school year as a full-fledged classroom-based training. During the 2016–2017 year, approximately 525 students participated in career explorations and approximately 120 CTE high school seniors interned at 58 industry-specific employers across the five boroughs. (Seventy-eight students participated in the internship phase and not career exploration; 42 students [8 percent] participated in both career exploration and the internship.)
The program was originally jointly overseen by DOE and SBS, but at the time of this study it was solely under the purview of DOE. Workforce1 Industrial and Transportation Career (ITC) Centers are service centers provided by the SBS and they are the arm of SBS that is responsible for implementation of SAW.12 Workforce1 ITC is one of over 20 career service centers that SBS manages in NYC.13 Due to the CTE focus of SAW, program designers chose Workforce1 ITC to implement the program
In addition to Workforce1 ITC, the Work-Based Learning Resource Center is the arm of the NYC DOE that has been responsible for implementation of SAW. The center is a component of the CTE office, which is under the aegis of the Office of Postsecondary Readiness (see organizational chart in Appendix A) to prepare and implement the program. As of the 2017–2018 school year, the Work-Based Learning Resource Center’s role has shifted to focus on administrative matters related to payroll, with oversight of the instructional component shifting to another area of DOE, the CTE Industry Engagement team. These offices are charged with overseeing CTE programming in high schools, other internship programs similar to SAW, and WBL opportunities at large. A goal of the partnership between Workforce1 ITC (the representative for SBS) and the CTE Industry Engagement team (the representative for DOE) is
11 Other internship programs aimed at NYC high school students include the NYC CTE Industry Scholars Program and the Bank of America CTE Summer Scholars. Though they have similar goals to SAW, the present evaluation is only for SAW. 12 When SAW launched in the 2009–2010 school year, the Workforce1 ITC was known as the Workforce1 Transportation Career Center. 13 The overall mission of Workforce1 is to train and match New Yorkers looking for new or better jobs to local opportunities, and help businesses operate and expand by offering cost-saving recruitment services. Of the over 20 Workforce1 service centers in NYC, some specialize based on location (e.g., Rockaways); others are specialized toward certain populations (e.g., immigrants or out-of-school, out-of-work youth); and others are specialized by sector or industry (e.g., ITC or health care career centers). Workforce1 collaborates directly with employers to meet its mission to bridge the gap between local workforce needs and the skills that potential candidates for employment possess, in turn providing more efficient and effective job recruitment and placement. All career service centers provide individuals seeking employment with career services, such as résumé development, interview preparation, career mapping, and connection to training or educational experiences.

11
to encourage greater collaboration among stakeholders in order to build and sustain a CTE workforce pipeline where education and skills training is aligned with the needs of employers.
Eligibility Requirements and Selection Process Career Explorations. At the beginning of the school year, prior to the start of career
exploration, the NYC DOE CTE office sends out information about the career exploration module and invites high schools with focus areas such as automotive, construction, transportation, engineering, or manufacturing to participate. Interested high schools notify the DOE CTE Office of their intention to participate and designate a point of contact at the high school who will assist in program implementation. During the time period of this study in the 2016–2017 school year, five high schools with CTE programs across the five boroughs opted to participate. The NYC DOE intentionally invites a smaller number of high schools to participate in career exploration than the total number of high schools that participate in the internship component. This is partly due to capacity, so that SAW staff can have sufficient time and resources to conduct seminars for participating students.
At the start of the career exploration module, NYC DOE requests that WBL coordinators and CTE teachers (whoever serves as the point of contact at a given school) recruit a cohort of students to participate. The point of contact at each school determines which students would be best suited to participate in the program, based on criteria such as teacher knowledge of student attendance, academic success, time commitments, and interest. For most of the program’s history, SAW program staff have encouraged schools to focus on graduating seniors in selected fields who may be eligible for employment at the end of the year. The benefit of offering the program in existing classes, however, is that students in earlier grades or CTE fields of study outside those represented by ITC may participate. Within each school, a career exploration cohort is typically between 10 and 20 students. In the 2016–2017 school year, cohorts from four schools were in an already existing CTE course, in which all students in the course participated in career exploration in addition to their coursework. In the remaining school, career exploration was a within-school extracurricular offering in which all students across the school (both CTE and non-CTE) were selected to attend.
Internships. At the conclusion of career exploration, NYC DOE sends out information about the internship program to all high schools with CTE programs across the five boroughs. It is not a requirement for students who participate in career exploration to apply for an internship, nor is participation in career exploration a requirement for those who are interested in the internship. SAW internships are primarily targeted at CTE high school seniors who are expected to graduate at the end of the school year.14 High schools with a WBL coordinator or CTE teacher who are interested in having their students participate in the internships set up a meeting with SAW
14 In 2014 a few college students enrolled in the internship program. And during the 2017–2018 school year, the career exploration module was offered to sophomores instead of seniors.

12
program staff and coordinate an opportunity for interested students to attend an informational session about SAW. Application to the internship component is open to any CTE student from a participating high school who fulfills specific criteria. Applicants must be seniors, on track to graduate in June, enrolled in CTE coursework in eligible fields of study, and eligible to work in the United States. Ideal applicants are those seeking part-time or full-time employment after graduation, have some prior work experience, and are open to a range of internship placements.
Workforce1 ITC staff visit schools to pitch the internship program to students, with CTE school staff working closely with Workforce1 ITC to engage students and submit the required application. The interested students then interview with SAW program staff before being accepted into the program. Every student who applies to the program has the opportunity to be interviewed.15 Once a student is accepted into the program, Workforce1 ITC matches the student to an employer based on location, area of interest, and employer need. Workforce1 ITC selects employers based on their capacity and desire to host student interns, the employer’s relationship with Workforce1 ITC, and the viability of the site as a safe and reasonable site for interns of high school age. To further engage the business community, Workforce1 ITC separately asks employers to participate as guest speakers during career exploration.
Structure of Career Exploration Career exploration began in the 2012–2013 school year as an opportunity to offer CTE high
schools work-readiness courses that teach workplace competencies (such as networking and interviewing), as well as awareness of high-demand career options available through Workforce1. It was created as a result of conversations between staff at SBS, DOE, and the schools, and participating employers. Career exploration typically takes place in the fall semester of each school year. There have been some years in which career exploration was offered in the spring (e.g., in the 2012–2013 school year). Once a school decides to participate in career exploration and notifies the NYC DOE CTE office, each participating high school identifies a CTE teacher who will be in charge of implementing the program and who will attend meetings with DOE CTE and SAW program staff. This teacher is sometimes supported by a second teacher or administrator who supports internships at the school. The DOE CTE office then hosts a professional development day with each of the points of contact to welcome school staff to the program and provide guidance on implementation of the career exploration curriculum. The professional development day is a two-hour session that takes place prior to the start of the program.
Students in career exploration in any given year are considered a “cohort” for that year. CTE teachers are selected by the high school administrator and tasked with leading five cohort meetings with students based on a curriculum provided by the SAW program administrators.
15 Nearly all students who apply are accepted into the internship program. Those who are not accepted are typically rejected due to not having met the eligibility requirements.

13
These cohort meetings provide essential preparation and follow-up for the four seminar meetings that each cohort attends, led by Workforce1 ITC staff (two SAW coordinators and a business relationship manager). The semester is divided into two types of meetings: five cohort meetings with CTE high school staff and four seminars with ITC staff. The CTE high school staff members are in charge of implementing SAW schedules and conducting cohort meetings with selected SAW students during a regularly scheduled class or after school.
At the beginning of the module, each high school receives portfolio binders for staff and students that contain the career exploration curriculum for the semester. The curriculum is fully integrated—Workforce1 ITC presenters provide seminars with authentic, real-world situations to students and cohort meetings give students the opportunity to explore and master ideas presented in the seminars. The curriculum is designed to build on work readiness content already included in the CTE curriculum, with Workforce1 ITC providing context and examples from industry to better prepare students to enter the workplace. During the cohort meetings, the CTE high school staff members are expected to prepare students for the biweekly seminar meetings with ITC staff by reviewing curriculum and completing homework assignments provided in the SAW portfolio binders. The CTE high school staff can modify lesson plans in order to best suit their cohort of students. The curriculum includes lessons such as, “Your Strengths, Your Career,” “Know Your Industry and How Workforce1 Can Help,” “Marketing Your Accomplishments,” and “Find the Job and Land It.”16
Building on the material taught in each cohort meeting, Workforce1 ITC staff (two SAW coordinators and one business relationship manager) conduct seminar meetings which include student portfolio activities and visits by industry employers. During seminar meetings, the Workforce1 ITC staff—usually with the support of the CTE teacher—lead students in career readiness activities designed to engage students in better understanding their individual skills and how they can apply those skills in a workplace environment. These activities are also designed to help students articulate initial career goals by exposing them to a variety of career and education pathways. The students receive a student version of the teacher portfolio binder which includes resources and exercises, such as mapping out a career plan, creating a résumé, and crafting a 30-second elevator pitch, all of which they complete during the course of the career exploration semester.
The NYC DOE; SBS; Workforce Investment Board; City University of New York; GMD Shipyard Corporation; Grant Associates, Inc.; Youth Development Institute; Development Without Limits; and CTE high schools—particularly William E. Grady High School—collaborated to create the curriculum for career exploration. After the conclusion of each program year, the program partners meet to discuss what worked and did not work with the
16 Scholars at Work, 2017b.

14
curriculum throughout the previous program year and to make any modifications for the next year of the program.17
Structure of the Internship Module The second component of SAW is an approximately 13-week internship, which generally
lasts from President’s Day (February) to Memorial Day (May) of each spring semester. Students participating in the internship component in any given year are considered a part of the “cohort” for that year. Workforce1 ITC matches students to employers and then records the match in an online internal monitoring system overseen by the NYC DOE CTE Office. Matches are based on employers’ stated needs, students’ interests, and the geographic proximity of a student to an internship site. According to input provided by interviewees, in 2015–2016 and 2016–2017, Workforce1 ITC provided sample job descriptions to teachers, who provided input about which students were the best fit for certain kinds of jobs. Teachers also used these job descriptions to help students draft learning goals, which were further developed during Workforce1 ITC’s Work Readiness sessions. The goal of these tactics was to improve the match between students and internships, and to help students develop social and emotional skills by aligning their own interests with employer needs.
Prior to starting their internship, students work with their WBL coordinators to create a training plan, which serves as both a record of the activities that they complete while at their internship and a mechanism for reflection and feedback between students, employers, and WBL coordinators. The training plan identifies two overarching learning goals—technical/ academic skills and work readiness/interpersonal skills. It also creates headings for the related job tasks that would give an opportunity for interns to improve their skills and the evidence or outcomes that goals have been met. The training plan is organized in a table format and requires three responses under each goal, related job task, and evidence or outcome.
Before the internship begins, students meet with Workforce1 ITC staff for mandatory Work Readiness sessions that are meant to prepare them for the internship, and to support Workforce1 ITC in making better matches for the students by better understanding their skills and interests. The curriculum for the Work Readiness sessions is a condensed version of the career exploration curriculum with added instructions about logistics (e.g., how to complete a timesheet), as well as scenarios designed to prepare students for common workplace situations (e.g., how to deal with a dissatisfied customer). The sessions are also an opportunity for students to speak with Workforce1 ITC staff regarding the internships and to continue building workplace skills. In line with research-based best practices, throughout the 13-week internship,
17 As an example, according to one interviewee, in the second year of SAW, it was determined that the first iteration of the material on résumé development was not as effective as hoped. The program was therefore modified to (1) move some content into an initial cohort meeting, prior to the first seminar with ITC, and (2) offer a “scaffolded” approach to résumé writing. All other adjustments to the curriculum after that were minor.

15
students complete a series of check-in assignments and discuss their experience with their school-based point of contact. Workforce1 ITC hosts two seminar meetings—once after the first week of the program, and another at the end of the program—to help students make the connection between their internship and other opportunities and services available through Workforce1.18
Since employer capacity and need vary, internships vary by site, as do the tasks that interns might perform. Some companies take students to fulfill office-based jobs, while others take students to work in a more hands-on capacity (e.g., working with an engineer in an auto mechanic shop). Students are expected to work at their internships each weekday afternoon from 2 to 5 p.m. during the internship period, amounting to 15 hours per week. Internship sites can be flexible and will work with students to create alternate schedules if needed. Students were compensated at $11.00 per hour (minimum wage) as of 2017.
A memorandum of understanding exists between SBS and DOE to establish the cost-sharing for internship wages. Workforce1 ITC provides two SAW coordinators and one business relationship manager (the same individuals who staffed the career explorations module) who monitor all interns and internship sites, field concerns from students and employers, and relay relevant information back to stakeholders. The two SAW coordinators are responsible for leading the Work Readiness sessions, directing interviews for the internship, and conducting site visits to internship sites prior to and during the internship, as well as for recruiting students and CTE high schools to participate in the program at large with help from the business relationship manager. These two coordinators are not required to hold a teaching degree, but are expected to have a background in mentoring and working closely with students of high school age. The business relationship manager is the primary point of contact for SAW internship employers and is responsible for cultivating and maintaining relationships with these employers. An individual in this role is expected to have strong ties to and substantial experience with local businesses. The position is also tasked with recruiting new businesses to participate by reaching out to businesses who have participated in other Workforce1 programs or by making cold calls to local businesses that may be able to provide quality internship opportunities to SAW interns. The training manager for Workforce1 has also worked closely with SBS and DOE staff to provide communication with schools, and to review with students any individual situations that may come up at worksites, such as attendance or performance issues (from either supervisors or interns); health and safety concerns; developing new learning goals for students who are excelling; and so on.
18 In the first few years of the program, students gathered once a month at the Workforce1 ITC center to submit a “Task Planner” reflection document, to discuss their internship experiences, and learn about additional opportunities. Attendance at these monthly seminars consistently dropped each month of the program, reaching rates of approximately 50 percent, so in 2016–2017 the current model in which Workforce1 ITC hosts two meetings per semester was adopted.

16
Employer Involvement As mentioned previously, Workforce1 ITC staff select and recruit employers to participate in
SAW (both career explorations and internships), based on the skills and educational needs of the participating schools and students. The majority of these employers have worked with or utilized one of the other Workforce1 programs, such as training and certification services, prior to their participation in SAW. Employers meet with Workforce1 for an introductory meeting at which they are asked to give descriptions of their workforce needs and how many interns they are willing to host. At these meetings, ITC staff highlight the goals of the internships and set expectations and limitations for use of the interns at work sites. Internship employers include auto mechanic shops, construction companies, and HVAC (heating, ventilation, air conditioning)/ refrigeration suppliers, among others. In the past few years, as new CTE strands have become more popular, the cohort of employers has grown in tandem with CTE high school programs to include other sectors, such as food manufacturing, as areas for internships. In the 2016–2017 school year, five employers participated in the career exploration module as guest speakers and 58 employers hosted interns. The industries in which companies offered internships during the study year ranged from automotive and transportation; voice, data, fiber optic; travel and tourism; electrical and air conditioning; ready-to-wear fashion; architecture, construction, home rehabilitation; manufacturing and fabrication; aerospace; chocolate production, and food supplies and distribution; furniture import and fabrication; energy and utilities; computer maintenance and repair; and cleaning supplies.
Monitoring Program Success
In order to monitor student-level and program-level indicators of the program, DOE staff developed student “pre” and “post” surveys, which are administered as bookends to the career exploration and internship modules by Workforce1 ITC staff. The surveys administered pre- and postcareer exploration to ask students about their knowledge and awareness of
• high-demand employment fields • skills and accomplishments that might help them procure a job • how to create a résumé and 30-second elevator pitch • networking skills • interviewing skills.
The internship pre and post surveys track the same indicators as those collected for the career exploration, as well as indicators of students’ self-reports of
• the application of CTE technical skills in the workplace • confidence in time and resource management • confidence in communication and interpersonal skills • confidence in technological skills

17
• perceptions of SAW and its components • relationships with internship employer.
In addition to student surveys, ITC staff solicit feedback about the program through discussions with stakeholders. After the conclusion of the internship component each year, employers are invited to an appreciation event and a meeting to discuss the program. During the program year, employers also have access to the business relationship manager and other Workforce1 ITC staff who address concerns and questions regarding the interns and internships on an ongoing basis. Similarly, WBL coordinators and CTE teachers have access to Workforce1 staff and are invited to give feedback to the program concerning both the career exploration and internship components.
Once all stakeholders have contributed feedback, DOE and SBS work together to implement changes to program areas and to determine retention strategies for effective employers and CTE high schools. One significant change to the program that occurred due to these conversations with stakeholders was the design and implementation of the career exploration component in 2013, with the intention of providing access to workforce-readiness resources for a larger pool of CTE students beyond those in the internship. Additional changes to the program have included modification to the curriculum, creation of a training plan to track student progress at internships, and criteria for inclusion or exclusion of employers and internship sites.
18
3. Implementation Study
This chapter presents findings from our implementation study of SAW. This component of our evaluation focused on the infrastructure, resources, and relationships necessary to implement SAW. It assessed how students acquired the skills and knowledge required for employment in high-growth industries and how students and employers experienced the program more broadly. Additionally, it identified program strengths and areas needing improvement, and it documents how the program is functioning. Our research questions inquired about the following
• How are program components structured? • To what extent is the program meeting its articulated goal(s)? • In what ways are students expected to learn the skills needed in places of employment? • How are the working relationships across partners?
We first describe the data and methods we used to undertake the implementation study. We then detail our findings in terms of strengths of the program’s components and areas for improvement.
Data Sources Data from five sources informed the implementation analysis: (1) documents describing
SAW program components, mission, and design features, as well as curriculum materials of career exploration; (2) focus groups with students participating in career exploration; (3) interviews with CTE high school staff, including WBL coordinators and CTE instructors; (4) interviews with 10 employers who participated in the career exploration and internship modules; and (5) interviews with key staff at Workforce1, the NYC DOE, and SBS.
To gain a better understanding of how typical career exploration modules were delivered in each school and how internships operated, RAND research team members informally observed one classroom in each of the five schools that participated in the career exploration module and visited six internship sites.1
RAND researchers collected data in two phases to match the two SAW modules: a December 2016 visit to collect data on the career exploration component that ran September 2016 to February 2017, and a May 2017 visit to collect data on the internship component that ran March 2017 to June 2017. During the visits, members of the RAND research team visited
1 In each setting, researchers did not complete a formal observation protocol to determine whether a set curriculum or pedagogical practice had been implemented, but rather took descriptive notes and documented what had occurred in each setting.

19
NYC to conduct the focus groups and interviews in person and informally observe the schools and internship locations.
During the December 2016 (career exploration) site visit, RAND research team members observed Workforce1 seminar meetings at the five participating career exploration high schools, conducted one student focus group at each participating high school, and interviewed CTE school staff involved with SAW and SAW program administrators. At the high schools participating in career exploration, individuals in various positions were interviewed, including CTE teachers, WBL coordinators, and guidance counselors. Similarly, during the May 2017 (internship) site visit, RAND visited six internship employers and interviewed participating employer internship coordinators, mentors, and program administrators. Internship sites included companies with a focus on retail interior design, cold-storage distribution, transportation, custom and historic window design, utility and meter manufacturing, and food distribution. After the site visits in December 2016 and May 2017, RAND scheduled and conducted phone interviews with CTE high school staff, program stakeholders, and employers who were unable to attend in-person interviews. In addition to the six internship employers who were interviewed during the internship site visit, RAND reached out to four other internship employers for phone interviews after the site visits.
Interviewees at participating internship employers included internship coordinators (those who organized the internships at their place of business) and mentors (those who worked one on one with each intern), as well as other staff members who interacted with the program. These internship coordinators and mentors held various positions across their individual companies. Interviewees included program staff that directly and indirectly implemented and provided continuous improvement to SAW. We conducted 17 interviews and five focus groups of between 6 and 20 participants. In some cases, researchers conducted group interviews of two or three participants. In one instance, a stakeholder participated in two group interviews. In total, 86 individuals participated in focus groups or interviews.
Table 3.1 itemizes the data collection effort in each site visit.
Table 3.1. Summary of Primary Data Collection Efforts
Data Collection Activity
December 2016 Career Exploration Site Visit
May 2017 Internship Site Visit After Site Visits
Informal observation Workforce1 seminar meetings (n = 5)
Internship sites (n = 6)
In person interviews CTE high school staff (n = 8) Scholars at Work staff and administrators (n = 20)
Internship coordinators and mentors (n = 8) Scholars at Work staff and administrators (n = 7)
Focus groups Students (n = 53) Phone Interviews Internship coordinators
and mentors (n = 6) Scholars at Work staff and administrators (n = 4)
NOTE: After the site visits, RAND scheduled and conducted phone interviews with stakeholders who were unable to attend in-person interviews.

20
Appendix B includes detailed information on the types of interviewees, number of participants per type, and the interview topics discussed in the career exploration site visit and internship site visit, respectively (including in-person and phone interviews).
Analytic Approach RAND research team members analyzed the interview and focus group notes using a
grounded-theory technique in a systematic three-step process. Grounded-theory analysis is an iterative process in which the analyst becomes increasingly “grounded” in the data and develops increasingly rich concepts and models, rather than looking for patterns that support or test a preexisting hypothesis. It is a particularly sensitive technique for elucidating experiences and perceptions. This approach allowed RAND to systematically identify key themes and patterns of responses. In the first step, RAND employed a standardized coding scheme to organize the data in the qualitative software Dedoose. Example codes included nature of engagement, factors contributing to successful engagement of partners, facilitators to successful program implementation, and barriers to successful program implementation. In the second step, RAND ran queries within the program and the coded responses into separate documents, based on broader themes, to highlight concurrence in responses and contradictions across statements and across schools and internship sites. Example codes and broad themes included alignment of goals between stakeholders, perceptions of the curriculum, perceptions of the internship, functioning processes, and outcome measures. To establish interrater reliability, two team members independently coded notes from one site and then met to resolve any discrepancies. After all notes were coded, in the third step, the team met to review the themes and narrow down to a final set of the most significant themes and findings.
Key Findings In this section, we summarize our key findings from the analysis of documentation,
interviews, and focus groups. We first discuss strengths of SAW and then note areas in need of improvement.
Strengths of Scholars at Work
SAW successfully exposed participating students to the workplace. All employers interviewed thought that the internship program provided a “good
opportunity” for students to be exposed to a real-life work environment. Likewise, students reported in focus groups that the exposure they received through career exploration and would receive through the internship was novel and helpful in honing their career aspirations. Students valued the opportunity to be exposed to a real working environment, which was an experience they reported that their schools were unable to provide for them in the way that SAW could. Many students spoke about their exposure to the workforce in general. One student stated, “I like

21
that it’s giving us an opportunity to see the workforce, have a real-world experience, and prepare us for what’s after high school.” Students also saw the exposure as a way to help them determine whether or not they enjoyed particular fields and industries. For instance, one student noted: “It broadens horizons. I wanted experience in the field of construction through the internship, because I’m interested in electrical construction and want to know more.” A CTE teacher with whom we spoke stated, “They can explore different careers to make an informed decision and learn so that they know about themselves and what they do best.”
In addition, students reported that they had the opportunity to learn various twenty-first-century skills like workplace communication and working collaboratively. When asked about benefits of the program, one student stated: “Better communication skills; they have us talking in front of the whole class to give our pitches and to tell them about ourselves, so that helps develop better communication skills.” Another student chimed in with, “They also teach us about teamwork and how to work together better.” Many students were exposed to the entire employment process during career exploration, from the interview process to making a good impression on the first day of employment. One student said, “They’re helping me with job-seeking skills, like working on my résumé, speaking in an interview, and helping me think about my skills. Those things are not something the average teen thinks about.” Another student reported, “It is teaching us ways to secure a job through different exercises, like the exercise that we just had with what to do for an interview and the one where they got our views on the job field.”
Students noted their initial shortcomings when it came to interviewing or talking about their skills, but found that the activities they engaged in during the career exploration cohort and ITC seminar meetings helped make them much more comfortable interviewing and making presentations to an audience. One student stated, “It’s helped with interview skills. I’m not good at speaking and making eye contact, but they try to help you conquer that fear.” These activities included finalizing and practicing a 30-second elevator pitch to employers about their skills, mock interviews, and conducting an oral presentation about their internship experience to the entire SAW cohort of peers and coordinators. One of the CTE teachers noted the improvement in students’ abilities: “I think that the kids show a marked difference in their ability to present themselves and to answer interview questions—they have bettered the ability to ace an interview.”
The other positive aspect of SAW for students was the mentoring they received from their employers via the internship and from the ITC staff. Many of these students had little or no work experience, so supervisors and coworkers served as professional mentors. One of the employers we interviewed stated, “Scholars at Work is giving them mentorship, helping them get a background in what employment is, about rules and regulations they have to follow.” One student noted how valuable their internship employers could be to their future: “The connection with our former internship employers means that when we meet and go for job interviews, then they could be the interviewers, which makes the interview and job possibility even better.”

22
Students reported that Workforce1 staff members were very knowledgeable and students received valuable advice about postsecondary education and possible career fields. One student stated, “I mean that they understand that we’re in high school, and they show us respect, how to be responsible, and how to meet deadlines.” Students felt that these experiences and skills would undoubtedly help them as they transition from high school to postsecondary education and the workforce; as one student points out: “They’re helpful people, they can help you by teaching you the right way to do things. In case you wanted to work for the company, they can teach you how to do that or how to get to their position.”
SAW provided needed labor to businesses and supported the pipeline of talent. Employers from industrial and transportation industries with whom we spoke reported that
the program was meeting their needs as employers by providing them with a pipeline of talent. From their perspective, the internship served as a cost-free training opportunity for employers (in that they did not have to pay the interns, but rather provided employee time through mentoring the interns). Among the employers with whom we spoke there was a sense of commitment to training local talent for employment in local small businesses.
Employer interviewees also reported that they benefitted from the contributions the students were making to the company. Employers stated that the students positively contributed to the operations of the company and provided valuable help to the employees. For instance, one employer noted, “We needed the extra help, and the company always wants to get students and have the students get another view and a different feel for what manufacturing and everything is.” One employer stated that his company had an increase in the amount of work that needed to be completed during the spring of 2017, so having interns working at that time helped alleviate the workload of the full-time employees. He said, “In my department, it will take an engineer’s time to do these little tasks so it saves me time to give the simple tasks to the interns.”
Workforce1 ITC built relationships between CTE schools, local employers, and the Department of Education.
Interviewees noted that SAW helped to support partnerships among the coordinating entities of the program (Workforce1 ITC, NYC SBS, and NYC Public Schools) and employers. This happened through two primary means: (1) employers that participated in SAW—whether through career explorations or internships—also participated in other programs Workforce1 offers for their adult clients (indeed some of these other programs served as a source of employer recruitment into SAW); and (2) the recruitment of new employers. As one Workforce1 staff member stated: “I take the initiative to recruit new employers. In many cases, the employers are referred to us by another company in the program.” Employers who participated in SAW for a long time also served as champions of the program to external audiences and other employers. One of the Workforce1 ITC staff members said of existing employers, “Over time, a lot of these

23
companies have been championing the program. These companies really understand that they have folks that are aging out and it’s time to train the new young people.”
Processes for continuous improvement were in place. Workforce1 ITC endeavored to foster the relationship with employers by engaging them in
the process of soliciting their feedback on the program and taking their recommendations into consideration. This process was part of Workforce1’s greater continuous improvement effort for SAW. Program administrators at SBS, DOE, and Workforce1 meet to discuss the program at the beginning and end of every program year in order to discuss what worked well and where there might be areas for improvement. They capture feedback from employers, students, and coordinators at the high schools in order to improve the content of the career exploration component, improve the internship experiences for students, and streamline processes that may be tedious. During the program year, at least one representative from each of the three stakeholders attends a weekly meeting to monitor program implementation. All other discussion of the program happens on an informal basis and as requested by each stakeholder. Below are three examples of ways that the program staff engaged in continuous improvement, as provided by a SAW employee over written correspondence:
(1) Modification of career exploration curriculum in second year. After reflecting on year-one experiences, SBS, ITC, and DOE determined that the résumé-writing materials were too complicated for students—students were generally unable to identify basic elements of résumés in the time allotted, and the portfolio provided examples of multiple résumé formats which were very confusing to students—many of whom were writing their first résumé. The stakeholders therefore decided to devote more time in the curriculum to résumé writing by moving some of the skills- and interests-identification content into a cohort meeting at the school, before the first seminar with the Workforce1 ITC staff. Multiple résumé formats were eliminated, and students were given a formal, structured approach to writing “accomplishment statements” as a building block for their résumés. Introduced in the second cohort meeting, students were able to develop these statements in advance of the second Workforce1 ITC seminar, providing additional scaffolding and time for students to build their skills.
(2) Modifications to internship seminar and monthly check-in expectations. As explained previously in this report, originally, internship seminars were scheduled at Workforce1 ITC on a monthly basis. Even though students were paid for their time, attendance at the seminars dropped over the three months, until only about 50 percent of students attended the final seminar. In the continuous improvement discussions, it was determined that this was due to two factors: extensive travel time to the neighborhood of Jamaica for these sessions and students’ preference to go to their worksite rather than to the monthly check-in. Borrowing from the career exploration model, SAW program administrators engaged the CTE teachers for monthly check-ins. Teachers met with students to collect their Task Planner reflection documents and to discuss any issues at the worksites. Since students sometimes feel

24
comfortable sharing concerns or issues with a teacher that they would not at a worksite, this process endeavored to ensure that schools and Workforce1 were both supporting the student throughout the internship. Moreover, the number of seminars was reduced from three to two (one at the beginning of the internship and the second at the end). The goal of the first seminar was to provide an opportunity for students to process their first week and for ITC to identify any issues with placement that they needed to address. The second seminar helped students prepare for the Career Day event, and connect their internship experience with other opportunities and services offered by Workforce1.
(3) Providing teachers and students with job descriptions. In response to employer and stakeholder concerns about potential mismatch between student skills and interests and their internship worksite, prior to Workforce1 ITC matching students to internships, Workforce1 ITC asked teachers to suggest which students might best match with which available internships. Teachers also had an opportunity to work with students to read job descriptions and draft goals for their internship experience (using the “Accomplishment Statement” materials from the career exploration module, if they had attended that). The goal was to increase student buy-in and commitment: to have them focus on what they wanted to accomplish while in an internship and be more open to the options made available to them.
Areas for Improvement While participants in SAW reported positive experiences, several areas for improvement
remain.
Internship experiences varied across employers and mentors. When we observed the internship students during site visits, students were performing a
variety of tasks. For example: assisting with office work (e.g., filing paperwork, sending emails, creating documents); performing maintenance on vehicles; building meters and equipment; using CAD software to design buildings and homes; performing inventories; scraping paint off a table; and shadowing mentors in their workday. Employer interviews revealed that the mentorship for interns across sites varied dramatically based on whether mentors had prior training or were brand new to the mentorship process. For example, some mentors provided more hands-on experience to interns or closely monitored their work; others had interns conduct more paper or desk-based work or did not monitor work closely.
Interviewees noted that this could be for three reasons. First was the lack of training provided to employer mentors on how best to support interns. At the beginning of the internship component each year, participating employers are invited to an orientation meeting to learn about the program and to set expectations for the semester. While the orientation includes information about the type of student who would be placed in internships with employers, it does not include any formal training on how to work with interns of high school age. Outside of the orientation, employers did not note any other training or materials provided by the program
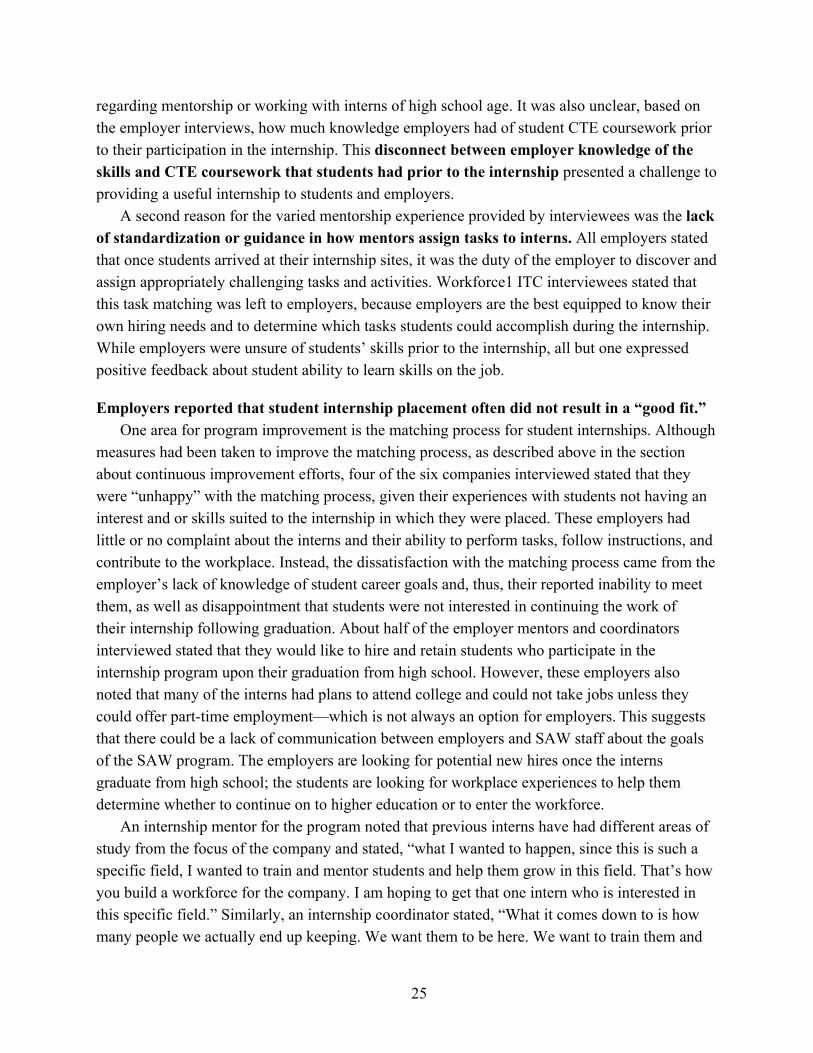
25
regarding mentorship or working with interns of high school age. It was also unclear, based on the employer interviews, how much knowledge employers had of student CTE coursework prior to their participation in the internship. This disconnect between employer knowledge of the skills and CTE coursework that students had prior to the internship presented a challenge to providing a useful internship to students and employers.
A second reason for the varied mentorship experience provided by interviewees was the lack of standardization or guidance in how mentors assign tasks to interns. All employers stated that once students arrived at their internship sites, it was the duty of the employer to discover and assign appropriately challenging tasks and activities. Workforce1 ITC interviewees stated that this task matching was left to employers, because employers are the best equipped to know their own hiring needs and to determine which tasks students could accomplish during the internship. While employers were unsure of students’ skills prior to the internship, all but one expressed positive feedback about student ability to learn skills on the job.
Employers reported that student internship placement often did not result in a “good fit.” One area for program improvement is the matching process for student internships. Although
measures had been taken to improve the matching process, as described above in the section about continuous improvement efforts, four of the six companies interviewed stated that they were “unhappy” with the matching process, given their experiences with students not having an interest and or skills suited to the internship in which they were placed. These employers had little or no complaint about the interns and their ability to perform tasks, follow instructions, and contribute to the workplace. Instead, the dissatisfaction with the matching process came from the employer’s lack of knowledge of student career goals and, thus, their reported inability to meet them, as well as disappointment that students were not interested in continuing the work of their internship following graduation. About half of the employer mentors and coordinators interviewed stated that they would like to hire and retain students who participate in the internship program upon their graduation from high school. However, these employers also noted that many of the interns had plans to attend college and could not take jobs unless they could offer part-time employment—which is not always an option for employers. This suggests that there could be a lack of communication between employers and SAW staff about the goals of the SAW program. The employers are looking for potential new hires once the interns graduate from high school; the students are looking for workplace experiences to help them determine whether to continue on to higher education or to enter the workforce.
An internship mentor for the program noted that previous interns have had different areas of study from the focus of the company and stated, “what I wanted to happen, since this is such a specific field, I wanted to train and mentor students and help them grow in this field. That’s how you build a workforce for the company. I am hoping to get that one intern who is interested in this specific field.” Similarly, an internship coordinator stated, “What it comes down to is how many people we actually end up keeping. We want them to be here. We want to train them and

26
have them go up the ladder. That’s what we’re looking for when we [accept] them.” The same internship coordinator advocated for “making sure the placements are right, getting those kinds of kids from [related] programs here,” noting that students whose academic work was in the same field as the company were happier with the internship and performed better than those who did not come from a program in that area. Additionally, another internship coordinator noted, “we don’t know if we filled [their] needs”; and another internship coordinator at the same site stated that this intern “wants to be a mechanical engineer and there’s nothing we can do for [them] in that area.” One factor that could be impacting stronger matching was the issue of commute time. If the student’s school was too far away from the employer’s location, then the student would not be matched with that employer, even if the match met both student and employer requests. The issue of geographic placement could therefore be improved upon.
While employers’ wanting to know students’ career goals signaled employer buy-in and investment in creating relationships with and mentoring students—a positive outcome for the program—it also signaled that employers and students were not receiving the most meaningful experience from the program. These four “dissatisfied” employers all mentioned that they would like to receive students who had an interest in the employer business and related career path, with some noting that when students were interested in this way, they had more prerequisite knowledge that helped them succeed in the internship. Both employers and DOE stakeholders advocated for better matching and placement of interns at sites. This suggests a number of areas that could be improved: the internship placement process itself could better align students’ goals with employers’ needs, the pool of talent and employers could be broadened so that more placement opportunities are available, or the requirement to reduce commute time for students (if there is a strong match, but the location is far from the students’ school) could be reconsidered.
It is important to note that high school students often do not know what career path they plan to take upon graduation, and that exploring various opportunities is likely. Moreover, it is important to consider the lack of satisfaction from employers within the context of the goals of the SAW program, as noted in Figure 2.2 in Chapter Two: a goal of the SAW internship is to expose high school students to work and the workplace and not necessarily to find employers a prospective employee. We discuss the SAW goals in more depth in the following section.
Stakeholders lacked a unified vision of SAW goals and mission. The dissatisfaction with student internship placement aligned with a reported dissatisfaction
with how program stakeholders viewed the purpose and target audience of the SAW program overall. It was clear from our interviewees’ perspectives that there were multiple, potentially conflicting, goals: one set of stakeholders emphasized student-centered goals; another set focused more on employer-centered goals. Stakeholders at Workforce1 ITC and SBS reported that they endeavored to meet student needs and saw the program as providing important exposure to students to a workplace environment, but they also recognized the value in meeting employers’ needs in finding potential talent for employment. Stakeholders at the NYC DOE

27
expressed concerns about the way in which they saw the program was marketed to employers—that is, as another tool that Workforce1 could provide to help their business. Instead, program administrators from the DOE advocated for more focus on student-centered outcomes (such as improving exposure to the workplace or “rounding out” students’ résumés to make them more attractive to higher education institutions). They noted that this would be particularly important when selecting and setting expectations for employers who participate in the internship component. DOE stakeholders thus placed a stronger emphasis on finding employers who would be invested in students’ outcomes and who would place value on the experience, rather than solely finding a new employee. Interestingly, the majority of employers felt similarly, particularly when it came to providing a quality experience to interns by matching them to internship sites where they would be able to practice skills that they had learned in CTE coursework.
Formal mechanisms for communication existed, but proved challenging. Despite the existing mechanisms for communication and continuous improvements, all three
stakeholder organizations (SBS, DOE, and Workforce1) agreed that better communication among partners and more constructive and open conversations about challenges and successes of the program were needed. One challenge that CTE high school staff, employers, and program administrators all identified as a barrier to communication was a high rate of staff turnover across all program administrators in SBS, DOE, and Workforce1. Interviewees noted a difference in consistency in how the program was implemented among partners due partially to the staffing changes.
An additional challenge identified primarily by the CTE high school staff and employers was that lines of communication were not well understood, that is, who best to contact within each organization when specific program challenges arose. While some partners in the program reportedly were satisfied with the current level of communication and feedback available through the program, lack of communication from the program to employers, students, and WBL coordinators was a theme that emerged in our interviews and focus groups. On one hand, Workforce1 staff noted that too much communication or pressure from the program might cause an employer to quit the program. While some employer mentors and coordinators liked the current level of communication, a smaller number voiced concerns that they were charged with reaching out to SAW and that there did not seem to be a clear point of contact or line of communication. One employer noted, “I wish they checked in with the companies more.” While another employer stated that, “the Scholars at Work people need to communicate more often with the employer on how the student is doing. They used to do it more often before; they used to send emails to check in and ask for feedback . . . they should follow up with us.” These employers stated that program administrators addressed concerns as they came up, but did not monitor student progress in the internship at a high level.
An additional challenge was in the communication between CTE high school staff and program administrators. Both DOE stakeholders and CTE high school staff advocated for

28
greater inclusion in the program for WBL coordinators and CTE high school teachers, citing the fact that these staff members come in contact with students the most and can be the best equipped to voice student concerns and recognize student successes. About one-quarter of the CTE high school staff interviewed mentioned that they would like greater involvement in and access to the program components. One CTE high school staff member, in particular, mentioned that WBL coordinators and CTE teachers should have the opportunity to visit internship sites, contact sites, and monitor internships, similar to other work-based learning opportunities.2 On the other hand, another CTE high school staff member expressed appreciation that SAW had a dedicated team in place to monitor and implement internships.
K–12 education and industry disconnects remained. Program administrators from SBS, DOE, and Workforce1 noted that there is a disconnect
between CTE education and industry, though all approached it differently. Interviewees from Workforce1 highlighted the difference in how change is implemented over time in businesses versus education, specifically that businesses can and do change and adapt more rapidly as a means of survival. These interviewees and DOE interviewees also mentioned that while SAW has made strides to bridge the gap by bringing together educators, employers, and workforce development leaders, more work needs to be done in aligning K–12 education with industry. This was particularly the case in ensuring that students are receiving the most up-to-date skills training, and in building strong relationships between partners. Outside of SAW, administrators at ITC expressed concerns that CTE teachers, WBL coordinators, and the DOE are not well versed in how best to make connections with industry or to retain those connections. These interviewees advocated for training to address this disconnect. Yet, personal correspondence with a SAW employee noted that the Department of Education offers this type of training through their Industry Engagement Commissions and the CTE Advisory Council. Given the lack of awareness of the availability of this training, it is clear that improved communication and outreach are needed. Alternatively, reading materials could be provided online as a way to supplement in person trainings.
Internal monitoring could be improved to better measure and track SAW goals. SAW relies on pre- and postcareer exploration and internship student surveys to measure
its progress toward existing goals. These surveys measure general perceptions of the program; awareness of high-demand career fields; knowledge of skills, such as how to interview, create a résumé, or give a 30-second elevator pitch; confidence in areas such as time management, communication, and technological skills; and student relationship with internship employer. However, they do not measure student choice to pursue careers in high-need sectors and
2 As a result of 2016 feedback CTE instructors provided to SAW team members, this has changed. As of 2017, site visit opportunities were offered to CTE staff and WBL coordinators.

29
exposure to real-life work experience. None of the surveys include questions about students’ choices to pursue “high-need” careers. Nor do the surveys inquire about the career and college-going aspirations of the students or the extent to which students have explored different career pathways. According to written correspondence with interviewees, student surveys in the years prior to this study included these types of questions, but the surveys were deemed too lengthy and there was concern about survey fatigue. These questions are now available on the program application. However, having this type of information about college- and career-going decision-making on the survey itself could allow more useful analysis to determine how to shape the program to meet the student-centered goals that are at the core of the DOE, as well as the goals of fostering the economic growth of NYC and creating stronger businesses and thriving neighborhoods that are at the core of the SBS’s mission. With this knowledge, programming can be crafted in a way to support students’ career pathway ambitions and (aggregated) survey results can be used by the internship employers and mentors to better understand the needs and interests of a student group or cohort. Further, while the focus of the pre- and postcareer exploration surveys is on understanding how the classroom-based content prepared the students for the workplace, students’ perceptions about exposure to career options is missing. Within the career exploration semester, students are exposed to career options through guest speakers. Including questions about the extent or perceived utility of this exposure could be valuable to programming.
Note that while this external evaluation is able to gauge employment outcomes, there are no ongoing “real-time” systems in place to monitor this on an ongoing basis. In addition, program measurement of student access to careers in high-need sectors is unclear due to a lack of clearly defined terms. In this instance, access could be referencing a number of different indicators, such as awareness or knowledge of careers, a personal network that directly connects the individual with employers, personal ability to obtain a job (e.g., physical or mental capability, possession of requisite skills), or employer practices that promote or restrict access to young workers.
Another way that SAW keeps track of student progress is through training plans set up by CTE high school staff, students, and their internship employer. Training plans are a DOE requirement across all internship programs, not only SAW. These training plans outline learning goals and activities at employer work sites that can help achieve those goals, and they track the outcomes of student internships. However, it was clear from interviews across stakeholders that there was an inconsistent use of the training plan, which could present a barrier to measurement of student outcomes. Interviews with stakeholders, including administrators and employer mentors and coordinators, noted that while training plans were in place for students, they were not being used effectively, in part due to differing perceptions of the purpose of training plans. Of the eight administrators interviewed, two remarked that training plans were not being used as a reflection and communication tool as intended, but instead as a compliance activity. Of these two, one administrator noted that it was a challenge to talk to other stakeholders about the training plan, stating that, “There is a spreadsheet saying [coordinators, students, and employers]

30
were talking about [the training plans], but clearly they weren’t. Training plans are supposed to give focus,” and instead, “it was like some sort of compliance activity.” Employers felt similarly; one internship coordinator noted that the training plan was more of a checklist than a substantive feedback and training tool. By contrast, one CTE high school staff member noted that the training plan and task analysis activity gave WBL coordinators, teachers, employers, and students an opportunity to monitor and evaluate student progress. One potential reason for the lack of training plan enforcement may be that those interviewed at Workforce1 expressed concern regarding employer burden, especially in terms of paperwork, that could cause employers to end their voluntary participation in the program. However, three of the nine internship mentors interviewed stated that while they provided training feedback on an informal basis, they would like to see the program implement more structured opportunities for feedback to interns.
Although the pre and post surveys measure elements of the CTE work-based learning experience, there were not systems in place to measure whether students developed technical skills beyond what they had learned in CTE courses. While the development of technical skills could be captured in the training plan, without consistent use across sites there was no formalized way to determine how and if that development was taking place because the form did not outline these elements in a systematic, measurable way. However, without consistent use and monitoring of the training plan across all internship sites and interns, the training plan did not provide high level reflection of student knowledge and skills and how these skills might be gained through the internship. An additional challenge to measurement is that interns did not have to use the SAW training plan if they used training plans provided to them by their CTE school. One of the program administrators interviewed noted the absence of an assessment to capture student skills, such as workplace competencies, stating, “these are tricky measurements: confidence, soft skills, communication, skills about networking. It would need to be rigorous, but we need to develop a test to measure skills in those areas” for future program years. Without measurement or an inventory of skills, it is hard to determine if the program is meeting its goal of closing skills gaps in critical economic sectors. It is important to note that each occupation is different—and the CTE curricula for those occupations also differ. Therefore, measurement of skills may reveal which CTE courses have wider gaps than others.
While measurement of some K–12 education and student outcomes comes through pre- and postcareer exploration and internship surveys, and student training plans, the program lacks mechanisms to measure employer, workforce, and other K–12 education outcomes. These include alignment and adaptation between the preparation, competencies, and skills that students gain in school and the needs and expectations of employers. It is unclear how SAW administrators measure employers’ capacity to develop their desired talent pool, relationships with local high schools and CTE programs, ability to address skills gaps, or perceptions of the value of cultivating a youth talent pipeline. Nor is it clear how to measure how well the program aligns and adapts K–12 education and student preparation to changing employer expectations and

31
needs. Unlike student participants, employers do not receive surveys to track these outcomes. Instead, Workforce1 staff invite employers to an event at the close of the internship to celebrate employer participation and to an informal debrief either in person or via phone call after the program year concludes. However, our interviews revealed that knowledge of this opportunity for feedback was inconsistent across internship sites, and internship mentors mentioned that these events and meetings happen during inconvenient hours.
Summary This chapter summarizes the findings from RAND’s analysis of 17 interviews and 5 focus
groups with a total of 86 students, employers, teachers, and SAW administrators, with some taking place as group interviews. We conducted the interviews and focus groups over the course of two site visits (one in December 2016; the second in May 2017) as well as over the phone. We found a number of strengths of the program as reported by study participants: SAW exposed participating students to the workplace; SAW provided needed labor to businesses and supported the pipeline of talent; Workforce1 ITC built relationships between CTE schools and local employers; and processes for continuous improvement were in place. Our analyses also shed light on areas within the program that were in need of improvement. These were policies, structures, or relationships that the study reported were not as effective as participants had hoped or as they were designed to be. First was that the perceived quality of internship experiences varied across employers and mentors. Second, the matching process for student internships could be improved; employers reported that student internship placement often did not result in a “good fit.” Third, stakeholders with whom we spoke lacked a unified vision of SAW goals and mission, which can negatively affect how policies, structures, and services are developed and implemented. Fourth, while formal mechanisms for communication exist, interviewees reported that they proved challenging, were not well used, or were confusing. Fifth, K–12 education and industry disconnects remain. And sixth, internal monitoring could be improved to better measure and track SAW goals (once those goals are decided upon).

32
4. Outcomes Analysis
This chapter presents findings from our outcomes study of SAW. This component of our evaluation compares postsecondary outcomes of SAW participants with two strategically selected comparison groups to provide insight into whether there is a distinct benefit that accrues to SAW students as they transition to college or the workforce following high school graduation. Because SAW is largely a voluntary program, it is not possible to establish causal relationships via a traditional experiment in which some students are randomly selected to participate in SAW while others are randomly excluded from SAW. In the absence of a traditional experiment with random assignment, we develop a treatment group consisting of SAW participants and two comparison groups from a pool of applicants to NYC’s Summer Youth Employment Program (SYEP). This program provides NYC youth with paid summer employment in entry-level jobs for up to six weeks in July and August. Similar to SAW, SYEP provides workshops on job readiness, career exploration, and financial literacy, and opportunities to continue education and social growth. SYEP receives substantially more applications than there are available job openings, and so SYEP randomly selects applicants to participate. Using a quasi-experimental framework, we compare outcomes of two treatment groups—SAW participants in the career exploration module and SAW participants in the internship module—with outcomes of our two comparison groups. These comparison groups include SYEP applicants who were not selected for the SYEP program, with one group including students who attended the same schools as SAW students and with the other group including students who attended CTE schools where SAW was not available. We examine four outcomes: postsecondary enrollment, employment status, industry of employment (among those employed), and earnings (among those employed). In what follows, we first describe the data and how we selected our sample for analysis. We then describe the methods we used to undertake comparisons between our treatment and comparison groups, and we then present our findings.
Data Sources and Sample Selection To conduct the outcome analysis we combined data from four sources: (1) SAW program
participation rosters maintained by SBS; (2) SYEP applicant rosters maintained by the NYC Department of Youth and Community Development; (3) sociodemographic background, academic histories, and postsecondary enrollment data maintained by NYC DOE; and (4) employment data maintained by the NYS DOL. RAND established data sharing agreements with these four state and local agencies, who then provided data directly to RAND to undertake this analysis.

33
We focus our analysis on six cohorts of SAW participants spanning the 2010–2011 school year through the 2015–2016 school year. For ease of expression, we refer to those who graduated in 2010–2011 as the class of 2011, those who graduated in 2011–2012 as the class of 2012, and so forth. SBS provided data on 270 students who enrolled in the career exploration module and 469 students who enrolled in the internship module from the classes of 2011 through 2016. SBS was able to provide information only on those students who gave written authorization for the release of their information, including their social security number, at the time of acceptance to the program (240 of the 270 career exploration students provided authorization and 410 of the 470 internship students provided authorization). The NYC Department of Youth and Community Development provided data on 252,326 SYEP applicants who were denied admission (by a lottery system) to the SYEP program between 2011 and 2016, which aligns with the years of program participation among treatment group members. We specifically selected students who applied to SYEP for the summer before their senior year of high school so as to correspond to the approximate timing of the SAW participants’ application process. As noted earlier, SYEP provides workshops on job readiness, career exploration, financial literacy, and opportunities to continue education and social growth. Students who applied to SYEP were hoping to gain similar job experiences and supports as those provided in SAW. Using those denied admission to SYEP provides the best available approximation of a counterfactual within the NYC public school context given that SAW was a completely voluntary program.
To better align the SYEP comparison group to the SAW treatment group (who were all enrolled in CTE high schools), we restrict our analysis to SYEP applicants who were enrolled in CTE high schools. It is worth noting that the application to SAW is more extensive and requests more background information about the student’s school and work histories than the SYEP application. So while both programs are aimed toward students who are seeking a foothold in the local labor force, SAW may be attracting more motivated students. This is an important distinction to keep in mind when interpreting our findings.
To undertake the analysis, it is essential to have information on the sociodemographic background and academic histories of our treatment and comparison groups. This information, as noted above, is maintained by the NYC DOE, which does not use social security numbers to identify and organize student files. Therefore, we had to merge the treatment and comparison group rosters with NYC DOE data (that included complete enrollment files for all students in the city attending public schools between 2011 and 2016) using first names, last names, and birth dates. We applied “fuzzy matching” algorithms that would allow for the matching of like names across files (e.g., “Christopher Doss” and “Chris Doss”) that had the same birth dates as well as nearly identical birthdates across files (e.g., “April 01, 1998” and “April 11, 1998”) where the first and last name were a direct match. This process yielded a match rate of 89.3 percent among the career exploration treatment group, 85.1 percent among the internship treatment group, and 14.5 percent among the comparison group. The match rate is particularly low for the comparison group for two main reasons. First, the DOE data includes only students who attended public

34
schools in the city, whereas the SYEP program is open to all youth in the city—including those who enroll in private, religious, or charter schools. Second, the SYEP program is open to youth between the ages of 14 and 24. Therefore, a substantial number of applicants to SYEP are not of school age and so would not be included in the DOE files. In an ideal setting, we would compare the distribution of characteristics of students in the original rosters with the distribution of characteristics of those who were successfully merged to assess whether there are any detectable changes in the composition of the treatment and comparison groups resulting from matching that might bias our estimates. However, such background information is available only for students with valid matches, and thus the extent to which the matching process alters the composition of our sample and potentially biases our findings is unknown. This is a limitation to our analysis.1
After this matching process, we eliminated cases that had a missing graduation status, as well as cases where students dropped out, transferred, or were still enrolled at the time of their on-time graduation year. To ensure that our comparison group had similar academic experiences and career motivations to the treatment groups, we maintained in the comparison group only those who graduated from CTE high schools. Our final complete analytic samples include 233 career exploration treatment group members, 388 internship treatment group members, and 22,492 comparison group members. There were 40 SAW participants in our sample who participated in both the career exploration module and the internship module. These 40 graduates are included in both treatment groups.
It is important to note that our treatment groups include students who enrolled in the SAW program but withdrew before completing: 11.6 percent of career exploration participants and 12.6 percent of internship participants. Therefore, our analysis reflects an “intent-to-treat” approach.2 Additionally, we partition our comparison group into two sets of students: those who attended CTE schools where SAW was offered (n = 16,377) and those who attended CTE schools where SAW was not offered (n = 6,115). Treatment group comparisons with the former may be biased as comparison group members either opted to not apply to SAW or were refused admission to SAW. Treatment group comparisons with the latter may be biased as CTE schools
1 The data files from SBS and Department of Youth and Community Development (DYCD) contain only names, birthdates, social security numbers, year of program participation, and, if in SAW, whether they were in career exploration, internships, or both. Sociodemographic information on the students comes from the DOE data. Therefore, we can assess the sociodemographic composition of only those students in the SBS/DYCD rosters who successfully merge with the DOE files. 2 We apply an intent-to-treat approach as our analysis is geared toward city leaders and stakeholders who are making decisions regarding the efficacy of their investments in CTE programming. By including those in the treatment groups who enrolled in SAW but withdrew, we are providing a realistic appraisal of the total effect of administering SAW in NYC. In applying an intent-to-treat approach, our analysis provides an estimate of the effects of offering SAW at the institutional level, rather than the effects of SAW only on those who persisted through the program (which could introduce bias via a type I error as “persisters” are likely a select group characterized by motivation and occupational orientation). We ran all our analyses with and without noncompleters and our substantive findings remain consistent.

35
that do not offer SAW tend to emphasize health and fine arts while CTE schools that offer SAW largely emphasize engineering, manufacturing, and technology. While we cannot eliminate these potential biases, we show these two variants of the comparison group separately for a clearer interpretation of group differences.
Method Applicants to SYEP from CTE programs serve as a viable comparison group to SAW
because they were seeking a guided employment experience with accommodations and supports (e.g., job readiness workshops, career exploration workshops) and were not selected. Therefore, it is likely that SYEP applicants have similar motivations to work and to start their careers as SAW students. However, there may be other distinctive characteristics of the two groups that could explain potential differences in postsecondary outcomes. While we cannot eliminate all potential confounding factors—especially those that are not observed in our data—our analysis aims to minimize differences in sociodemographic background characteristics and academic histories via a propensity score weighting (PSW) approach.3 With PSW, we first identify all substantively relevant characteristics of students in our data (referred to commonly as “pretreatment covariates”) and then via an algorithm, we create an analytic weight that balances the distributions of pretreatment covariates between the treatment groups and the comparison group. If PSW is done correctly the weighted comparison group will effectively mirror the treatment group on all observed characteristics, thus creating a defensible counterfactual to the SAW treatment group in the absence of a randomized experiment.
To undertake PSW we used nine pretreatment covariates in the NYC DOE data that are relevant to postsecondary outcomes: sex, race/ethnicity, poverty status, disability status, whether or not the student was an English Language Learner, whether or not the student was in an Individualized Education Program, the students’ score on the New York State’s Regents Algebra exam, the year of graduation, and the receipt of an advanced diploma (which in New York requires that students receive a score of 65 or better on the following Regents exams: Comprehensive English, Mathematics, Global History, U.S. History, Physical Science, Life Science, and a Language other than English). Table 4.1 shows the distribution of these pretreatment covariates for the career exploration treatment group and the comparison groups.
3 To create weights, we use generalized boosted regression models which apply an automated nonparametric machine-learning process (via the RAND Corporation’s TWANG software package) that combines many piecewise constant functions of the covariates, including all possible interactions and higher-order terms, and automatically selects the best functional form (Griffin et al., 2014).

36
Table 4.1. Covariate Balance Between SAW Career Exploration Treatment and Comparison Groups
NOTE: Asterisks indicate significantly different from the treatment group. * p < 0.05 ** p < 0.01
SAW Career
Exploration
Treatment
Group (n = 233)
Unweighted
(n = 16,377)
Weighted
(n = 16,377)
Unweighted
(n = 6,115)
Weighted
(n = 6,115)
Sex
Female 12.6% 42.9% ** 13.0% 66.1% 14.5%
Male 87.4% 57.1% ** 87.0% 33.9% ** 85.5%
Race/Ethnicity
Asian 13.5% 28.6% ** 13.5% 3.1% ** 12.8%
Black 43.5% 32.8% ** 43.8% 56.9% ** 43.5%
Hispanic 36.5% 27.9% ** 36.9% 38.0% 38.7%
White 6.5% 10.7% * 5.8% 2.0% ** 5.0%
Poverty Status
Yes 80.9% 71.4% ** 80.6% 81.6% 81.7%
No 19.1% 28.6% 19.4% 18.4% 18.3%
Disability
Yes 3.0% 3.0% 2.8% 4.4% 3.3%
No 97.0% 97.0% 97.2% 95.6% 96.7%
English Language Learner
Yes 1.7% 3.6% * 1.2% 2.4% 1.9%
No 98.3% 96.4% * 98.8% 97.6% 98.1%
Individualized Education Program
Yes 7.0% 8.4% 6.9% 11.4% * 7.5%
No 93.0% 91.6% 93.1% 88.6% * 92.5%
Regents Algebra Test
Average Score 74.2 76.2 ** 74.3 72.2 ** 74.3
Graduation Year
2012 1.3% 12.4% ** 1.6% 13.2% ** 1.0%
2013 2.2% 15.1% ** 2.5% 16.3% ** 1.4%
2014 55.2% 16.1% ** 54.4% 17.8% ** 55.7%
2015 1.7% 16.3% ** 2.3% 15.8% ** 2.7%
2016 39.6% 40.1% 39.2% 36.9% 39.2%
Advanced Diploma Recipient
Yes 15.2% 36.1% ** 15.3% 7.4% ** 15.4%
No 84.8% 63.9% ** 84.7% 92.6% ** 84.6%
SYEP Applicant Comparison Group
Attending SAW Schools
SYEP Applicant Comparison Group
Attending Other Non-SAW CTE
Schools

37
In this table, the first column shows the distribution of the pretreatment covariates for the treatment group and the second and fourth columns shows the distribution of the pretreatment covariates for the comparison groups. Statistically significant differences between the treatment group column and comparison group columns are indicated by asterisks. Note that the sample size for the comparison group differs from the total reported earlier because we removed comparison group members who graduated in 2011 as career exploration was not available during that school year. Additionally, we removed comparison group members whose race/ethnicity was reported as “other,” because there were no students in the treatment group with an “other” race/ethnicity designation. In comparing the distributions of the treatment group and the unweighted comparison groups, note that there are a number of statistically significant differences. For example, treatment group members are more likely to be a racial/ethnic minority, living in poverty, and have lower scores on the New York State Algebra Regents exam (among other differences). If we compared postsecondary outcomes between these groups and observed more positive outcomes for the comparison group, it may be due to differences on these pretreatment covariates. However, in applying PSW we create comparison groups that look similar to SAW participants in terms of sociodemographic and academic characteristics. The third and fifth columns show the newly weighted comparison groups. Here, all of the differences observed when using the unweighted comparison group samples are attenuated when applying PSW. This indicates the PSW was effective in creating balance between the career exploration treatment group and the comparison group.4
In Table 4.2, we repeat this weighting exercise for the internship treatment group. Though the patterns are somewhat different on individual pretreatment covariates, the overall outcome is the same: Initially, there are a series of significant differences between the treatment group and the unweighted comparison groups, but these differences are largely attenuated once PSW has been applied. As was the case with Table 4.1, here we have evidence that the PSW was effective in creating balance between the internship treatment group and the comparison groups. When making comparisons on our outcomes we will apply these weights, and thus substantially attenuate any bias that could potentially be attributed to our nine pretreatment covariates. Specifically, we estimated regression models with a binary treatment–comparison group indicator as the sole predictor. The regressions were weighted with the derived PSW, and the resulting means were calculated from the models’ parameter estimates.
4 In addition to comparing the average mean values on pretreatment characteristics, we also compared the maximum vertical distance between the empirical cumulative distribution functions for each pretreatment covariate using the Kolmogorov-Smirnov statistic. All distributional differences that were observed between the treatment group and the unweighted comparison group were eliminated once the PSWs were developed and applied—further giving us confidence in the efficacy of the weighting procedure. This was true both for the career exploration treatment group (Table 4.1) and the internship treatment group (Table 4.2). As mean differences are more intuitive to interpret, we do not show the Kolmogorov-Smirnov statistics. They are available from the authors upon request.
38
Table 4.2. Covariate Balance Between SAW Internship Treatment and Comparison Groups
NOTE: Asterisks indicate significantly different from the treatment group. * p < 0.05 ** p < 0.01
SAW Internship
Treatment
Group (n = 388)
Unweighted
(n = 16,377)
Weighted
(n = 16,377)
Unweighted
(n = 6,115)
Weighted
(n = 6,115)
Sex
Female 14.9% 42.9% ** 15.4% 65.9% ** 15.7%
Male 85.1% 57.1% ** 84.6% 34.1% ** 84.3%
Race/Ethnicity
Asian 15.5% 28.3% ** 15.3% 3.0% ** 13.2%
Black 39.9% 32.7% ** 40.5% 56.6% ** 44.6%
Hispanic 33.5% 27.8% * 33.6% 37.9% 34.6%
Other 0.8% 0.7% 0.6% 0.7% 0.6%
White 10.3% 10.5% 10.0% 1.8% ** 7.0%
Poverty Status
Yes 75.3% 71.4% 74.8% 81.7% ** 77.8%
No 24.7% 28.6% 25.2% 18.3% ** 22.2%
Disability
Yes 1.8% 2.6% 1.5% 4.6% ** 1.2%
No 98.2% 97.4% 98.5% 95.4% ** 98.8%
English Language Learner
Yes 1.3% 3.6% ** 1.5% 2.4% 0.5%
No 98.7% 96.4% ** 98.5% 97.6% 99.5%
Individualized Education Program
Yes 7.7% 8.4% 7.9% 11.5% ** 6.6%
No 92.3% 91.6% 92.1% 88.5% ** 93.4%
Regents Algebra Test
Average Score 74.3 76.2 ** 74.4 72.2 ** 74.4
Graduation Year
2011 0.8% 0.7% 0.8% 0.7% 0.4%
2012 3.4% 12.4% ** 3.6% 13.1% ** 3.4%
2013 4.9% 15.0% ** 5.3% 16.2% ** 5.9%
2014 9.8% 16.0% ** 9.4% 17.6% ** 10.5%
2015 20.1% 16.1% 19.6% 15.7% * 20.6%
2016 61.1% 39.9% ** 61.3% 36.7% ** 59.2%
Advanced Diploma Recipient
Yes 16.0% 35.9% ** 16.5% 7.3% ** 13.3%
No 84.0% 64.1% ** 83.5% 92.7% ** 86.7%
SYEP Applicant Comparison Group
Attending SAW Schools
SYEP Applicant Comparison Group
Attending Other Non-SAW CTE
Schools

39
Key Findings In this section, we summarize our key findings when comparing our two treatment groups
with our comparison group while applying PSW. As mentioned earlier, we make comparisons on four outcomes: postsecondary enrollment, employment status, industry of employment (among those employed), and earnings (among those employed). We discuss each in turn.
Postsecondary Enrollment
The NYC DOE maintains a variable in their student record files which indicates whether or not a graduate from the city attended college in the school year immediately after high school graduation. For example, for the high school graduating class of 2011 this variable indicates any postsecondary enrollment during the 2011–2012 school year. The data provided do not distinguish between two- and four-year enrollment, private and public school enrollment, or in-state and out-of-state enrollment. Postsecondary enrollment data were not yet available for the high school graduating class of 2016, and so the analysis (and corresponding sample sizes) reflects only eligible graduating cohorts through 2015. In Figure 4.1 we show the results for the career exploration module comparisons and in Figure 4.2 we show the results for the internship module comparisons. In both figures, the rates of postsecondary enrollment for the treatment groups are not statistically different from those of the weighted comparison groups. This suggests that SAW students are no more or less likely to enroll in college following high school graduation when compared with similar peers who were not exposed to the program.
Figure 4.1. Percentage of NYC High School Graduates Who Participated in the Career Exploration Module Enrolling in College Within One Year of Graduation; Classes of 2012–2015
62.6$65.5$ 65.4$
0$
10$
20$
30$
40$
50$
60$
70$
80$
90$
100$
SAW$Career$Exploration$Treatment$Group5n$=$2065
Weighted$SYEP$Applicant$Comparison$Group$AAending$SAW$
Schools5n$=$14,3535
Weighted$SYEP$Applicant$Comparison$Group$AAending$Other$
NonISAW$CTE$Schools5n$=$5,3395

40
Figure 4.2. Percentage of NYC High School Graduates Who Participated in the Internship Module Enrolling in College Within One Year of Graduation; Classes of 2012–2015
Employment Status
The NYS DOL provided RAND with quarterly earnings data. Each quarter, employers covered by New York State's Unemployment Insurance Law are required to submit earnings information for each of their employees to the New York State Department of Taxation and Finance. This information is shared with the NYS DOL to administer the state’s Unemployment Insurance program. Approximately 97 percent of New York’s nonfarm employment is covered by the Unemployment Insurance law.5 With these data, we are able to ascertain for each graduating cohort whether or not they had reported earnings within the four quarters (or one full calendar year) immediately following high school graduation. As an example, for the high school graduating class of 2016 we are able to identify whether or not they had positive earnings in Q3 of 2016 (July–September), Q4 of 2016 (October–November), Q1 of 2017 (January–March), and Q2 of 2017 (April–June). We consider those with positive earnings in any one of those four quarters as having been employed in the year following high school graduation. Note that due to the source and structure of the data, we are unable to ascertain self-employment, “under the table” informal jobs, and employment outside the state of New York.
5 New York State, no date.
65.1% 63.8% 64.3%
0%
10%
20%
30%
40%
50%
60%
70%
80%
90%
100%
SAW$Internship$Treatment$Group4
n$=$3064
Weighted$SYEP$Applicant$
Comparison$Group$AAending$SAW$
Schools4
n$=$14,3534
Weighted$SYEP$Applicant$
Comparison$Group$AAending$Other$
NonHSAW$CTE$Schools4
n$=$5,3394

41
Figure 4.3. Percentage of NYC High School Graduates Who Participated in the Career Exploration Module Formally Employed at Least Once in New York State Within
One Year of Graduation; Classes of 2012–2016
Figure 4.3 illustrates the comparison between the career exploration treatment group and the weighted comparison groups, while Figure 4.4 illustrates the comparison between the internship treatment group and the weighted comparison groups. Similar to our findings regarding postsecondary education enrollment, here we see that both treatment groups are as likely to find formal employment in New York State as their peers in the weighted comparison groups.6 There are no statistically significant differences. Although a primary goal of SAW is to help ensure that participants have workplace skills and insight that can help expedite their transition to employment after high school graduation, our analysis shows that does not necessarily translate into an employment advantage when comparing SAW participants with similarly job-oriented high school graduates in the city. It is worth pointing out that these employment analyses are based on all sample members regardless of whether or not they
6 When examining the four individual calendar quarters separately, we find that at any given time there is a higher proportion of SAW treatment group members employed than comparison group members. This suggests that in the year following high school graduation, comparison group members are as likely to work as treatment group members but accumulate less work experience. Appendix C documents these rates of employment broken down by quarter for our three groups of interest.
73.4%71.2% 71.6%
0%
10%
20%
30%
40%
50%
60%
70%
80%
90%
100%
SAW$Career$Exploration$Treatment$Group5n$=$2335
Weighted$SYEP$Applicant$Comparison$Group$A@ending$SAW$
Schools5n$=$16,3775
Weighted$SYEP$Applicant$Comparison$Group$A@ending$Other$
NonGSAW$CTE$Schools5n$=$6,1155

42
Figure 4.4. Percentage of NYC High School Graduates Who Participated in the Internship Module Formally Employed at Least Once in New York State Within One Year of
Graduation; Classes of 2012–2016
enrolled in college. Recall that just under two-thirds of our sample had at least enrolled in college within the first year after high school graduation. In analyses not shown, we restricted the sample to only those who were not enrolled in college; the findings remain unchanged.
Industry The quarterly earnings data provided by the NYS DOL to RAND included codes from
the North American Industry Classification System that allowed us to identify the industry associated with the employer who reported wages for the worker. We used these codes to create a variable that indicates whether or not the sample member had worked in the manufacturing or transportation industry during the first year after high school graduation. We hone in on these two industries as they were the primary focus of the SAW program. We present the results in Figure 4.5 and Figure 4.6. These comparisons are made for only those who were employed (as those not employed have no relevant industry assignment).
As shown in Figure 4.5, SAW participants who participated in the career exploration module took jobs in the manufacturing and transportation industry at rates comparable to those in the comparison group who attended SAW schools (i.e., the difference between these two groups is not statistically significant), but took jobs at significantly higher rates than those in the
74.5% 73.0% 71.2%
0%
10%
20%
30%
40%
50%
60%
70%
80%
90%
100%
SAW$Internship$Treatment$Group4n$=$3884
Weighted$SYEP$Applicant$Comparison$Group$A@ending$SAW$
Schools4n$=$16,3774
Weighted$SYEP$Applicant$Comparison$Group$A@ending$Other$
NonGSAW$CTE$Schools4n$=$6,1154

43
Figure 4.5. Percentage of Employed NYC High School Graduates Who Participated in the Career Exploration Module Working in Manufacturing or Transportation in New York State
Within One Year of Graduation; Classes of 2012–2016
NOTE: * Different from the treatment group at p < 0.01.
Figure 4.6. Percentage of Employed NYC High School Graduates Who Participated in the Internship Module Working in Manufacturing or Transportation in New York State
Within One Year of Graduation; Classes of 2012–2016
NOTE: * Different from the treatment group at p < 0.01.
13.0%9.3%
5.4%
0%
10%
20%
30%
40%
50%
60%
70%
80%
90%
100%
SAW$Career$Exploration$Treatment$Group5n$=$1705
Weighted$SYEP$Applicant$Comparison$Group$AAending$SAW$
Schools5n$=$11,6755
Weighted$SYEP$Applicant$Comparison$Group$AAending$Other$
NonGSAW$CTE$Schools5n$=$4,645*5
15.5$
7.6$ 5.5$
0$
10$
20$
30$
40$
50$
60$
70$
80$
90$
100$
SAW$Internship$Treatment$Group4n$=$2844
Weighted$SYEP$Applicant$Comparison$Group$AAending$SAW$
Schools4n$=$11,675*4
Weighted$SYEP$Applicant$Comparison$Group$AAending$Other$
NonJSAW$CTE$Schools4n$=$4,645*4

44
comparison group who attended other non-SAW CTE schools. SAW participants who participated in the internship module took jobs in the manufacturing industry at statistically higher rates than their peers in either of the comparison groups: 15.5 percent of SAW participants who held jobs in the first year after high school were employed in the manufacturing and transportation industry compared to 7.6 percent of applicants denied admission to the SYEP program who attended SAW schools and 5.5 percent of applicants denied admission to the SYEP program who attended other non-SAW CTE schools. The career exploration module is not industry specific, while the internship module is specific to the manufacturing and transportation industry. Therefore, it is not surprising to see more pronounced effects for the internship module.
Earnings Lastly, we compared the total reported earnings in the year after high school graduation of
those in our two treatment groups with those in our comparison group using the quarterly earnings data provided by the NYS DOL to RAND. In Figure 4.7 we show the results for the career exploration module comparisons and in Figure 4.8 we show the results for the internship module comparisons. Similar to our analysis of industry outcomes, these comparisons are restricted to those who were employed (and thus have reported earnings on file).
While SAW program participation had no discernible effect on procuring a job after high school, Figure 4.7 and Figure 4.8 indicate that participants in either of the program modules (career exploration or internship) earn considerably more than their comparison group counterparts. Those workers who had participated in either career exploration or the internship earned approximately $22,000 in the first year after high school graduation. These earnings are at least double those of the two comparison groups.7 The earnings differences between the SAW treatment groups and SYEP comparison groups are substantively large and significant at p < 0.01. These findings suggest that there are sizeable financial benefits associated with SAW program participation in either module.8
7 Appendix C documents earnings broken down by quarter for our three groups of interest. When examining the four individual calendar quarters separately, we find that at any given time in the year after high school graduation SAW treatment group members are earning more than comparison group members. 8 Recall that there were 40 students who participated in both the career exploration module and the internship module. Only 26 of those original 40 were employed. In supplementary analyses not shown, the earnings of those 26 SAW “dual-module” participants were higher than of those who participated in only the internship module. This suggests that there is an added benefit to participating in both modules. However, with only 26 cases, we cannot provide conclusive evidence in support of that suggestion.

45
Figure 4.7. Average Earnings in New York State Among Employed NYC High School Graduates Who Participated in the Career Exploration Module Within One Year of Graduation;
Classes of 2012–2016
NOTE: * Different from the treatment group at p < 0.01.
Figure 4.8. Average Earnings in New York State Among Employed NYC High School Graduates Who Participated in the Internship Module Within One Year of Graduation; Classes of 2012–2016
NOTE: * Different from the treatment group at p < 0.01.
$22,461''
$11,776'
$9,963''
$0''
$5,000''
$10,000''
$15,000''
$20,000''
$25,000''
SAW$Career$Exploration$Treatment$Group5n$=$1705
Weighted$SYEP$Applicant$Comparison$Group$AAending$SAW$
Schools5n$=$11,675*5
Weighted$SYEP$Applicant$Comparison$Group$AAending$Other$NonHSAW$CTE$Schools5
n$=$4,645*5
$22,132&&
$11,347&$10,074&&
$0&&
$5,000&&
$10,000&&
$15,000&&
$20,000&&
$25,000&&
SAW$Internship$Treatment$Group4n$=$2844
Weighted$SYEP$Applicant$Comparison$Group$AAending$SAW$
Schools4n$=$11,675*4
Weighted$SYEP$Applicant$Comparison$Group$AAending$Other$NonJSAW$CTE$Schools4
n$=$4,645*4

46
Summary To estimate the effect of SAW program participation on postsecondary outcomes, we
compare two treatment groups—career exploration module participants and internship module participants—with a strategically selected comparison group of CTE students who were looking for paid work and career-readiness services. We find that participating in SAW does not improve the probability that students will enroll in college or find a job in the year immediately after high school. However, we do find evidence that there are benefits to students who do find work. Those who participated in the internship module were more likely to secure jobs in the manufacturing and transportation industries, which are the focal industries of the SAW program. Further, the analysis suggests that SAW participation may improve earnings: Employed graduates who participated in the career exploration module or the internship module, or both, earned double that of comparison group members.

47
5. Summary and Limitations
In 2009 the SBS and NYC DOE created SAW, a program available to NYC high school students enrolled in CTE programs. The goal of the program is to expose students to career opportunities, to provide them with real-life work experience, and to develop students’ workplace skills. SAW has two core components, each a semester in length: (1) a career exploration module in the fall semester; and (2) an internship that places high school seniors with employers in the spring semester. In the career exploration module, students engage in activities in a classroom setting designed to develop their soft skills and workplace competencies while learning about future career opportunities through visits from industry experts. In the internship module, students participate in an approximately 13-week paid internship at a local business.
To improve its understanding of how well SAW is preparing students for employment and postsecondary education after high school, in 2016 the NYC Mayor’s Office for Economic Opportunity asked the RAND Corporation, a nonprofit, nonpartisan public policy research institution, to conduct an external evaluation of SAW. This report presents the findings of this evaluation, which has two parts: an implementation study that examines and describes SAW’s activities and processes, to understand the extent to which those are functioning as the designers and implementers of the program expect; and an outcomes study, which analyzes how SAW participants are faring in the labor market compared to comparable NYC public school graduates.
In our implementation study, we found a number of strengths of the program as reported by study participants: SAW exposed participating students to the workplace; SAW provided needed labor to businesses and supported the pipeline of talent; ITC centers built relationships between CTE schools and local employers; and processes for continuous improvement were in place. Our analyses also shed light on areas within the program that need improvement. These were policies, structures, or relationships that study participants reported were not as effective as had been hoped or as they were designed to be. First, the matching process for student internships could be improved; employers reported that student internship placement often did not result in a good fit. Second, stakeholders with whom we spoke lacked a unified vision of SAW goals and mission, which can negatively affect how policies, structures, and services are developed and implemented. Third, while formal mechanisms for communication exist, interviewees reported that they proved challenging, were not well used, or were confusing. Fourth, the perceived quality of internship experiences varied across employers and mentors. Fifth, K–12 education and industry disconnects remain. And sixth, internal monitoring could be improved to better measure and track SAW goals (once those goals are decided upon).
In our outcomes study we found that participating in SAW does not improve the probability that students will enroll in college or find a job in the year immediately after high school.

48
However, we did find evidence that there are benefits to students who do find work. Those who participated in the internship module were more likely to secure jobs in the manufacturing and transportation industries, which are the focal industries of the SAW program. Further, the analysis suggests that SAW participation may improve earnings: Employed graduates who participated in the career exploration module or the internship module, or both, earned substantially more than comparison group members.
Though we have confidence in our findings, there are a number of limitations that readers should keep in mind when interpreting the results and making program implementation decisions based on them. With respect to our implementation study, there are two key limitations. First, data collection occurred over the course of the 2016–2017 academic year. While our interview and focus group questions endeavored to capture the perspectives of program participants, any comments we received about the early years of the program were retrospective in nature and might not have captured all the facts. We were also not able to capture any changes to the program that occurred after the data collection window in the 2017–2018 academic year. Second, as with all qualitative data collection, we were limited to gathering perspectives of those who willingly participated in the study. While the parents or guardians of most students actively consented for them to participate in our focus groups, not all students agreed to do so on the day of data collection. It is therefore likely that the perspectives we captured were of those students who were more open or comfortable talking. RAND researchers tried to overcome the potential response bias by calling on students, waiting three to five seconds after posing a question for a student to answer, and asking follow-up questions to students who had not yet taken a turn to respond. Even with these efforts, it is important to note that not all students were vocal during the focus group sessions.
With respect to the outcomes study, there are two limitations of note. First, SAW is a voluntary program, which makes it impossible to directly determine causal effects via a randomized experiment. While we have crafted carefully selected comparison groups and applied state-of-the-art quasi-experimental methods to attenuate bias that could be introduced via potentially confounding observed sociodemographic and academic variables, we cannot unequivocally confirm that the industry or earnings benefits that we find are directly caused by SAW program participation. In other words, we find strong, robust associations, but we cannot unequivocally ascertain causality.
Of particular concern here is that we observe large differences in earnings between our treatment group and our comparison groups. We suspect that these differences may be partly due to the nature of the treatment groups. Though we were able to balance the treatment and comparison groups on observed characteristics (e.g., gender, race/ethnicity), we are not able to do so with respect to unobserved characteristics. One particularly important unobserved characteristic is a desire to work in manufacturing and transportation, which compensate young workers better than traditional “first jobs” that are often in the service sector. Our SYEP applicant group who attended SAW schools were potentially less likely to desire employment in

49
manufacturing and transportation (or employment during the school year due to other obligations), else they would have sought participation in SAW. Our SAW applicant group who attended non-SAW CTE schools was largely clustered in CTE schools that focused on arts and health. These students would be less likely to pursue higher-paying jobs in manufacturing and transportation given their academic backgrounds, or to go to college first, which would diminish immediate earnings. Moreover, the application for SAW was more extensive than the application for SYEP. Specifically, the SAW application required information on past work experiences and goals for the future. SAW students were chosen to participate based on their responses. SYEP applicants, on the other hand, had only to provide standard sociodemographic and academic information. Therefore, SAW participants are likely more motivated toward work overall than SYEP applicants, and these differences in motivation—which we could not control for statistically—are likely contributing to the large differences in earnings that we observe.
The second limitation of our outcomes study is that not all SAW program participants gave permission to use their social security numbers and this precluded them from our analysis of postsecondary outcomes because employment outcome linkages required social security numbers. Furthermore, not all files merged due to the lack of common identifiers. Therefore, it is possible that our final analytic sample does not entirely reflect the full population of all possible treatment and comparison group members, meaning that our findings might not apply to all SAW participants.
In closing, as the New York City economy becomes increasingly reliant on workers who have some postsecondary education or training in a specialized field (though not necessarily a four-year baccalaureate degree), there is a growing need for local policymakers and educators to identify the most efficient ways to prepare high school students to take on these “middle-skill jobs.” These needs are particularly pronounced in the transportation and manufacturing industries. Our study suggests that SAW is a promising program model to help meet these needs. This should be particularly good news for local employers who rely on high schools to appropriately prepare students poised to take jobs at their firms. With stronger connections between high schools and employers via programs like SAW, the NYC schools have an opportunity to help sustain and grow the school-to-work talent pipeline in support of the local subbaccalaureate economy.
50
References
Bailey, Thomas R., Katherine L. Hughes, and David Thornton Moore, Working Knowledge: Work-Based Learning and Education Reform, New York: Routledge, 2004.
Bardick, Angela D., Kerry B. Bernes, Kris C. Magnusson, and Kim D. Witko, “Junior High School Students’ Career Plans for the Future: A Canadian Perspective,” Journal of Career Development, Vol. 32, No. 3, 2006, pp. 250–271.
CTE Council, “Advisory Council for Career & Technical Education,” CTE Council, n.d. As of September 13, 2018: http://icte.us/ctec/about-the-advisory-council-for-career-technical-education/
———, “Carl D. Perkins Career and Technical Education Improvement Act of 2006,” NYSED gov., 2006. As of September 13, 2018: http://www.p12.nysed.gov/cte/perkins4/
Griffin, Beth Ann, Greg Ridgeway, Andrew R. Morral, Lane F. Burgette, Craig Martin, Daniel Almirall, Rajeev Ramchand, Lisa H. Jaycox, and Daniel F. McCaffrey, “Toolkit for Weighting and Analysis of Nonequivalent Groups (TWANG),” Santa Monica, CA: RAND Corporation, 2014. As of September 13, 2018: http://www.rand.org/statistics/twang.html
Halpern, Robert, “After-School Matters in Chicago: Apprenticeship as a Model for Youth Programming,” Youth and Society, Vol. 38, No. 2, 2006, pp. 203–235.
Harrington, Thomas F., and Theresa A. Harrigan, “Practice and Research in Career Counseling and Development—2005,” Career Development Quarterly, Vol. 55, No. 2, 2006, pp. 98–167.
Hodkinson, Phil, and Andrew C. Sparkes, “Careership: A Sociological Theory of Career Decision Making,” British Journal of Sociology of Education, Vol. 18, No. 2, 1997, pp. 29–44.
Holzer, Harry J., and Robert I. Lerman, The Future of Middle-Skill Jobs, CCF Brief No. 41, Washington, D.C.: Brookings Institution, Center on Children and Families, 2009.
Hughes, Katherine L., Thomas R. Bailey, and Melinda J. Mechur, School-to-Work: Making a Difference in Education. A Research Report to America, New York: Columbia University Institute on Education and the Economy, 2001. As of September 13, 2018: https://eric.ed.gov/?id=ED449364

51
J. P. Morgan Chase, Closing the Skills Gap: Preparing New Yorkers for High-Growth, High-Demand, Middle-Skill Jobs, New York: J. P. Morgan Chase, 2014.
Kuijpers, Marinka, Frans Meijers, and Chad Gundy, “The Relationship Between Learning Environment and Career Competencies of Students in Vocational Education,” Journal of Vocational Behavior, Vol. 78, No. 1, 2011, pp. 21–30.
National Association of Colleges and Employers, Internship and Co-Op Survey Reports, Bethlehem, PA: National Association of College and Employers, 2018.
National Skills Coalition, United States Middle-Skill Fact Sheet, Washington, D.C., 2017. As of September 13, 2018: https://www.nationalskillscoalition.org/state-policy/fact-sheets
New York City (NYC) Career and Technical Education (CTE), “About NYC Career and Technical Education,” NYC CTE, n.d. a. As of September 13, 2018: http://www.cte.nyc/site/content/about-career-and-technical-education
———, “NYC Career and Technical Education Schools and Programs,” n.d. b. As of September 13, 2018: http://www.cte.nyc/site/content/cte-schools-and-programs
———, “New York State Program Approval Process,” n.d. c. As of September 13, 2018: http://www.cte.nyc/site/content/new-york-state-program-approval-process
———, “Work-Based Learning Resource Center,” NYC CTE, n.d. d. As of September 13, 2018: http://cte.nyc/site/content/work-based-learning-resource-center
New York State, “QCEW Technical Notes,” New York State Department of Labor. As of September 13, 2018: https://labor.ny.gov/stats/lstechqcew.shtm
Nikaido, David, and Kanika Singh, “From High School Student to Employee: A Proposal for a Citywide Internship Program in San Antonio,” Mellon Fellows White Paper SA2020, 2013.
Philip, Kate, “Mentoring: Pitfalls and Potential for Young People.” Youth and Policy, Vol. 67, 2000, pp. 1–15.
Polidano, Cain, and Domenico Tabasso, “Making It Real: The Benefits of Workplace Learning in Upper-Secondary Vocational Education and Training Courses,” Economics of Education Review, Vol. 42, 2014, pp. 130–146.
Riverin-Simard, Danielle, “Career Development in a Changing Context of the Second Part of Working Life,” in The Future of Career, edited by Audrey Collin and Richard A. Young, pp. 115–129, Cambridge: Cambridge University Press, 2000.

52
Savickas, Mark L., “Career Construction: A Developmental Theory of Vocational Behaviour,” in Career Choice and Development, edited by Duane Brown, pp. 149–205, San Francisco: Jossey-Bass, 2002.
Scholars at Work, “Scholars at Work Employer Orientation: Winter/Spring Internship 2017,” Scholars at Work staff, May 3, 2017a.
———, “Scholars at Work Career Exploration Facilitator Manual,” Scholars at Work staff, May 3, 2017b.
University of the State of New York, “New York State Information Repository System (SIRS) Manual: Reporting Data for the 2017–18 School Year,” State Education Department, Albany, February 16, 2018: http://www.p12.nysed.gov/irs/sirs/2017-18SIRSManual13-6.docx

53
Appendix A. Organizational Structure of Scholars at Work
The Scholars at Work program was created by the New York City Department of Small Business Services and the Department of Education, and functions under the aegis of the Workforce1 Industrial Career Centers and the Career and Technical Education Office, as shown in Figure A.1.
Figure A.1. Organizational Structure of Scholars at Work
New$York$City$GovernmentScholars$at$Work$Organizational$Chart Mayor’s Office for EconomicOpportunity
NYC$Department$of$EducationDepartment of Small Business Services
Office$of$Postsecondary$Readiness
Workforce1$Industrial$Transportation$Career$
Centers
Grant$Associates
Career$and$Technical$Education$Office$(CTE)• WorkLBased$Learning$Resource$Center
CTE$Schools
WorkLBased$Learning$Coordinators$and$CTE$Teachers
Scholars$at$Work

54
Appendix B. Description of Site Visit Samples and Interviews
The types of interviewees, number of participants per type, and the interview topics are laid out in the following tables. Table B.1 shows the information for career exploration site visits and Table B.2 for internship site visits.
Table B.1. Interview Populations and Topics of Interest: Career Exploration Site Visit
Interviewee Type Number per Type Interview Topics
Students (in five schools) • Participants in career
exploration
53 • Reasons for entering Scholars at Work • Perceptions of program preparation for careers in
manufacturing and transportation or other industry • Program strengths and areas for improvement • Relationship with Scholars at Work coordinators • Skills development as a result of career exploration
and where these skills are learned • Personal gain from program participation
CTE high school staff (in five schools) • CTE teachers • WBL coordinators • Other staff (e.g., principal or
vice-principal)
8 • Background and teaching experience • Relationship with Scholars at Work • Reasons for joining or continuing a relationship with
the program • Perception of Scholars at Work program goals and
the ability or inability of the program to meet these goals
• Expectation of students’ skills development as a result of Scholars of Work participation and areas of the program that promote this development
• Types of activities and instruction used • Perception of students’ ability or inability to master
skills and student improvement • Alignment with needs of local manufacturing and
transportation (or other industry) businesses • Role and utilization of local employers in the
program • Role of other partners, such as program
administrators, schools, etc., and quality of working relationship across partners
• Program strengths and areas for improvement
Scholars at Work staff and administrators • NYC Department of
Education • NYC Department of Small
Business Services • Workforce1 Industrial and
Transportation Career Center
24 • Background, current position, and description of role within the program
• Perception of Scholars at Work program goals and the ability or inability of the program to meet these goals
• Scholars at Work program background • Guidance and training for career exploration
curriculum • Perceptions and use of career exploration curriculum
and activities • Types of activities and instruction used • Recruitment, selection, and retention of employers

55
Table B.1—Continued
Interviewee Type Number per Type Interview Topics
Students (in five schools) —Continued
• Perception of program ability to prepare students for careers in transportation and manufacturing (or other industries), for careers generally, or for internships
• Perception of students’ ability or inability to master skills and student improvement as a result of the career exploration component
• Expectation of student preinternship skills • Types of activities and instruction at internship • Perception of students’ ability or inability to master
skills and student improvement as a result of the internship component
• Alignment between the program and local manufacturing, transportation, or other industry employers
• Evaluation and monitoring process for site visits (frequency, check list, safety, etc.)
• Role and utilization of local employers in the program
• Role of other partners, such as program administrators, schools, etc., and quality of working relationship across partners
• Program strengths and areas for improvement
Table B.2. Interview Populations and Topics of Interest: Internship Site Visit
Interviewee Type Number per Type Interview Topics
Internship employers (six employers) • Internship coordinators, • Internship mentors, • Other staff
14 • Background, current position, and employer description
• Individual and employer relationship with Scholars at Work
• Reasons for joining the program • How employer discovered and became a part of
Scholars at Work • Number of interns hosted (current and previous
program years) • Participation in other internship programs and how
these programs compare to Scholars at Work • Perception of Scholars at Work program goals and
the ability or inability of the program to meet these goals
• Expectation of students’ skills development as a result of Scholars at Work participation and areas of the program that promote this development
• Types of activities and instruction used • Perception of students’ ability or inability to master or
not master skills and student improvement • Alignment with needs of local manufacturing and
transportation (or other industry) businesses • Continuation of relationships with previous program
interns • Role and utilization of local employers in the
program

56
Table B.2—Continued
Interviewee Type Number per Type Interview Topics
Internship employers (six employers)—Continued
• Knowledge about, involvement with, and perception of career exploration component
• Role of other partners, such as program administrators, schools, etc., and quality of working relationship across partners
• Program strengths and areas for improvement
Scholars at Work staff and administrators • NYC Department of
Education • NYC Department of Small
Business Services • Workforce1 Industrial and
Transportation Career Centers
7 • Background, current position, and description of role within the program
• Perception of Scholars at Work program goals and the ability or inability of the program to meet these goals
• Scholars at Work program background • Guidance and training for career exploration
curriculum • Perceptions and use of career exploration curriculum
and activities • Types of activities and instruction used • Recruitment, selection, and retention of employers • Perception of program ability to prepare students for
careers in transportation and manufacturing (or other industries), for careers generally, or for internships
• Perception of students’ ability or inability to master skills and student improvement as a result of the career exploration component
• Expectation of student preinternship skills • Types of activities and instruction at internship • Perception of students’ ability or inability to master
skills and student improvement as a result of the internship component
• Alignment between the program and local manufacturing, transportation, or other industry employers
• Evaluation and monitoring process for site visits (frequency, check list, safety, etc.)
• Role and utilization of local employers in the program
• Role of other partners, such as program administrators, schools, etc., and quality of working relationship across partners
• Program strengths and areas for improvement
For the career exploration site visits, RAND worked with contacts at the NYC DOE in order to reach out to all participating high schools and their staff. These CTE high school staff helped to identify and recruit students for the focus groups, as well as to schedule the five-day site visit (with one day at each participating high school). The student focus groups were conducted in person with a high school staff member present to oversee the conversation between RAND research staff and students. Interviews with CTE high school staff, including CTE teachers/ WBL coordinators, and other related staff, were conducted in person where possible or on the phone when it was not possible to meet in person. In addition, interviews with program

57
stakeholders took place in person and were modified to reflect follow-up conversations via email and telephone. All interviews and focus groups were conducted by two evaluation team members, one as lead interviewer and one as notetaker.
RAND worked with ITC staff who oversaw SAW to schedule the internship site visits to six employers. These ITC staff provided RAND with employer contact information, as well as staff at each site visit to introduce RAND research team members to SAW internship employers. We requested a group of employers that varied by industry, geographic location within the NYC metropolitan area, length of time involved in SAW, and number of interns hosted. The interviews with internship employers were conducted in person, where possible, with follow-up telephone calls to staff who were unavailable at the time of the site visits. All but two of these interviews were conducted by two evaluation team members, one as lead interviewer and one as notetaker. In the other two interviews, one evaluation team member served as both lead interviewer and notetaker. Additionally, RAND requested contact information for four internship employers based on the same criteria as the site visits to the previous six internship employers. We contacted these employers after the internship site visits via telephone.
In the informed consent protocol, all interviewees were informed that we would protect the confidentiality of their information, would not disclose their identity, and would use the information they provided for research purposes only. However, we did make interview subjects aware that due to the handful of participants in SAW by type (i.e., student, staff, employer, and stakeholder), it may be possible for comments to be attributed to individuals if the comments were specific in nature. We also informed interviewees and focus group participants that we would be taking detailed notes of their comments, but that we would destroy all identifying information at the end of the study. During the career exploration site visits, we did not request to audio-record participants. However, during the internship site visits, we did request to audio-record participants for notetaking purposes. Additionally, we requested to audio-record interviews for notetaking purposes conducted after the internship site visits, but not those interviews conducted immediately after the career exploration site visits. Where permission for audio recordings was requested, all of the interviewees agreed to have the discussion audio-recorded. These audio recordings helped to address gaps in the notes and were not used to directly transcribe conversations with interviewees. Follow-up phone calls were also conducted to fill gaps in the notes or, as previously mentioned, to interview those who were unable to be interviewed in person.
In the case of student focus groups, students were sent home with active consent forms to acquire parental permission to participate. These active consent forms informed parents that we would protect student confidentiality and would not identify their child to anyone outside of the RAND research team. We also informed parents that public reporting of the findings would include only aggregated group responses and not individual responses from students, and that student participation was completely voluntary. In addition to active consent from parents, NYC DOE required informed consent from student participants. The informed consent forms

58
were passed out to students prior to the focus group and included the same information as the informed consent for all other interviewees, that RAND would protect the confidentiality of participants, would not use any information that could be used to identify any individuals in our reports, that the information we were collecting was for research purposes only, and that we would not share any information with anyone outside of the RAND research team. We also asked focus group participants to guard each other’s confidentiality and included a note that while we would not share individual information, we could not guarantee that other participants of the focus groups would not share comments shared within the focus group. While it would have been helpful to have some perspectives of CTE students who were not involved in SAW, limited resources precluded that.

59
Appendix C. Employment and Earnings by Quarter
Earnings and employment data were broken down by quarter for the three groups of interest. When examining the calendar quarters separately, we find that at any given time there is a higher proportion of SAW treatment group members employed than comparison group member, and the SAW treatment group members are earning more than comparison group members (Table C.1).
Table C.1. Employment Rates and Earnings by Quarters During the First Year After High School Graduation
SAW Career Exploration
Treatment Group
Weighted SYEP Applicant
Comparison Group Attending SAW
Schools
Weighted SYEP Applicant
Comparison Group Attending Other Non-
SAW CTE SchoolsQuarterly Employment Rates
July - September 59% 58% 56%October - December 58% 55% 54%January - March 56% 53% 53%April - June 60% 57% 56%
Quarterly EarningsJuly - September $6,654 $3,514 $3,121October - December $6,832 $3,716 $3,137January - March $7,213 $3,799 $3,274April - June $7,564 $4,063 $3,652
SAW Internship Treatment Group
Weighted SYEP Applicant
Comparison Group Attending SAW
Schools
Weighted SYEP Applicant
Comparison Group Attending Other Non-
SAW CTE SchoolsQuarterly Employment Rates
July - September 60% 59% 56%October - December 61% 55% 54%January - March 61% 54% 53%April - June 62% 58% 56%
Quarterly EarningsJuly - September $6,853 $3,340 $3,064October - December $6,493 $3,606 $3,224January - March $6,286 $3,696 $3,180April - June $7,198 $4,045 $3,545