new york city criminal justicenew york city criminal
TRANSCRIPT
PREDICTING THE LIKELIHOOD OF PRETRIAL RE-ARREST AMONG NEW YORK CITY DEFENDANTS:
AN ANALYSIS OF THE 2001 DATASET
Qudsia Siddiqi, Ph.D. Project Director
FINAL REPORT
June 2003 (Revised October 2005)
52 Duane Street, New York, NY 10007 (646) 213-2500
CJA NEW YORK CITY CRIMINAL USTICE AGENCY NEW YORK CITY CRIMINAL JUSTICE AGENCY
Jerome E. McElroy Executive Director

PREDICTING THE LIKELIHOOD OF PRETRIAL RE-ARREST AMONG NEW YORK CITY DEFENDANTS:
AN ANALYSIS OF THE 2001 DATASET
Qudsia Siddiqi, Ph.D. Project Director
Research Assistance:
Elyse S. Revere Junior Research Analyst
Elizabeth Walton
Senior Research Assistant
Systems Programming:
Barbara Geller Diaz Director of Systems
Wayne Nehwadowich
Senior Programmer/Analyst
Administrative Support:
Bernice Linen-Reed Administrative Assistant
June 2003 (Revised October 2005)
© 2005 NYC Criminal Justice Agency

ACKNOWLEDGEMENTS
The author extends special thanks to Barbara Geller Diaz, Director of Systems, who did the
programming to extract the re-arrest data from the CJA database.
The author is grateful to Justin P. Bernstein, Senior Research Assistant, for his assistance
with the report, and Nyota A. Muhammad, Administrative Associate, for her support.
Finally, sincere thanks to the New York State Division of Criminal Justice Services (DCJS)
for providing supplemental criminal history data. DCJS bears no responsibility for the methods
of analysis used in this report or its conclusions.
TABLE OF CONTENTS
LIST OF TABLES.....................................................................................................ii INTRODUCTION .....................................................................................................1 METHODOLOGY ....................................................................................................2
A. Sampling and Data Sources ................................................................................2 B. Dependent Variable ............................................................................................5 C. Independent Variables ........................................................................................5 D. Statistical Methods .............................................................................................8 RESULTS .................................................................................................................10
A. Defendant Characteristics ..................................................................................10 B. Relationship between Borough of Initial Arrest and Borough of Re-arrest .......19 C. Relationship between the Top Initial Arrest Charge and Top Re-arrest Charge..................................................................................................19 Top Charge Severity............................................................................................19 Top Charge Type.................................................................................................24 D. Regression Analysis of Re-arrest........................................................................27 E. A Comparison of the 2001 Re-arrest Model with the 1998 Re-arrest Model .....31 F. A Comparison of the Re-arrest Model with the FTA Model ..............................33 SUMMARY AND CONCLUSIONS ........................................................................38 REFERENCES ......................................................................................................... 42 APPENDIX A………………………………..………………………...…………...43
i
LIST OF TABLES
Table 1 Arraignment Outcome ............................................................................................4 Table 2 Release Status at Arraignment ...................................................................................6 Table 3 Characteristics of Defendants Related Pretrial Regardless of Court of
Disposition: A Comparison of the 2001 Sample with the 1998 Sample..................11 Table 4 Borough of Arrest by Borough of Re-arrest (1998 Dataset) ....................................20 Table 5 Borough of Arrest by Borough of Re-arrest (2001 Dataset) ....................................21 Table 6 Severity of Top Initial Arrest Charge by Severity of Top Re-arrest Charge
for Defendants Re-arrested Pretrial. (1998 Dataset) ................................................22 Table 7 Severity of Top Initial Arrest Charge by Severity of Top Re-arrest Charge
for Defendants Re-arrested Pretrial. (2001 Dataset) ................................................23 Table 8 Type of Top Initial Arrest Charge by Type of Top Re-arrest Charge for
Defendants Re-arrested Pretrial. (1998 Dataset)......................................................25 Table 9: Type of Top Initial Arrest Charge by Type of Top Re-arrest Charge for
Defendants Re-arrested Pretrial. (2001 Dataset)......................................................26 Table 10: Multiple Logistic Regression Models Predicting Pretrial Re-arrest ........................28 Table 11: A Comparison of the 2001 FTA Model with the 2001 Re-arrest Model .................34
ii
PREDICTING THE LIKELIHOOD OF PRETRIAL RE-ARREST AMONG NEW YORK
CITY DEFENDANTS: AN ANALYSIS OF THE 2001 DATASET
INTRODUCTION
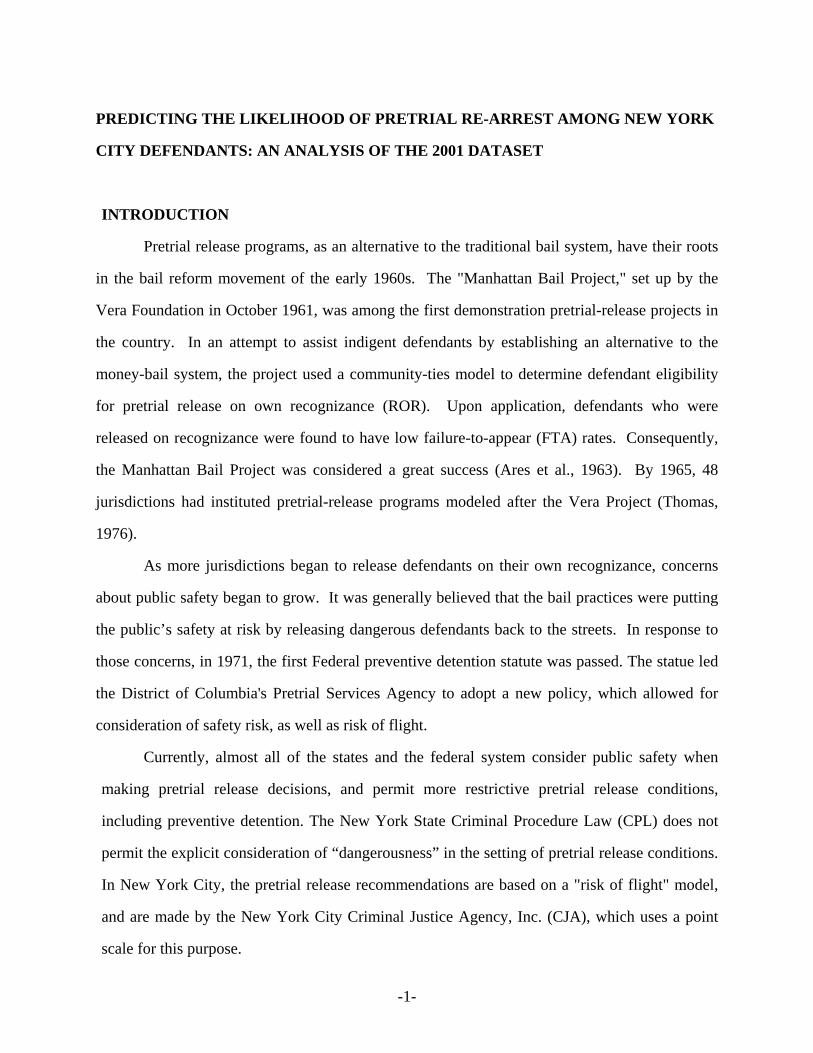
Pretrial release programs, as an alternative to the traditional bail system, have their roots
in the bail reform movement of the early 1960s. The "Manhattan Bail Project," set up by the
Vera Foundation in October 1961, was among the first demonstration pretrial-release projects in
the country. In an attempt to assist indigent defendants by establishing an alternative to the
money-bail system, the project used a community-ties model to determine defendant eligibility
for pretrial release on own recognizance (ROR). Upon application, defendants who were
released on recognizance were found to have low failure-to-appear (FTA) rates. Consequently,
the Manhattan Bail Project was considered a great success (Ares et al., 1963). By 1965, 48
jurisdictions had instituted pretrial-release programs modeled after the Vera Project (Thomas,
1976).
As more jurisdictions began to release defendants on their own recognizance, concerns
about public safety began to grow. It was generally believed that the bail practices were putting
the public’s safety at risk by releasing dangerous defendants back to the streets. In response to
those concerns, in 1971, the first Federal preventive detention statute was passed. The statue led
the District of Columbia's Pretrial Services Agency to adopt a new policy, which allowed for
consideration of safety risk, as well as risk of flight.
Currently, almost all of the states and the federal system consider public safety when
making pretrial release decisions, and permit more restrictive pretrial release conditions,
including preventive detention. The New York State Criminal Procedure Law (CPL) does not
permit the explicit consideration of “dangerousness” in the setting of pretrial release conditions.
In New York City, the pretrial release recommendations are based on a "risk of flight" model,
and are made by the New York City Criminal Justice Agency, Inc. (CJA), which uses a point
scale for this purpose.
-1-
The concern for the effects of recidivism upon public safety has resulted in many studies
on recidivism. However, the knowledge about pretrial recidivism is quite limited and the
findings are either inconsistent or not clear. It is also not known whether the findings from the
general literature would hold for those released pretrial. Therefore, although the New York
State CPL doesn’t permit consideration of public safety in making pretrial release decisions, the
issue is worthy of inquiry.
At CJA, the likelihood of pretrial recidivism was first examined a few years ago using a
random sample of defendants arrested in New York City in 1989. Recently, CJA decided to
examine pretrial recidivism on more recent samples of defendants. The data collected in the
third quarter of 1998 and first quarter of 2001 for the validation of the point scale were used for
that purpose. The results from the re-arrest analysis of 1998 sample were presented in a report
submitted to Mayor’s Office of the Criminal Justice Coordinator on March 30, 2003. This
report presents findings from the analysis of 2001 dataset. The report addresses several
research questions. First, do the defendants recommit the same type of offenses? Second, are
there consistent predictors of re-arrest across different samples? Third, do the same variables
predict both types of pretrial misconduct (FTA and re-arrest)? By answering these questions,
the report attempts to fill in the gap in our knowledge of pretrial recidivism.
METHODOLOGY
A. Sampling and Data Sources
Data for the present analysis were drawn from a cohort of arrests made between January
1, 2001 and March 31, 2001, in which the defendants were prosecuted on new charges. The data
set excludes cases that were not docketed in the CJA database (UDIIS), unless there was an
indication that they were prosecuted as “A” dockets in Manhattan, or as direct indictment1
(cases for which prosecution information is not available in CJA’s database). 1CJA’s database does not contain court data for dockets with the same docket number. Thus, court data for “A” dockets in Manhattan (the designation is used in Manhattan to distinguish between two court cases with the same docket number, one of which receives a suffix “A”) were not available for analysis. Felony prosecution in the Supreme Court as the result of a direct
-2-
The dataset contained 91,728 docketed arrests.2 Six percent of them were given Desk
Appearance Tickets (DATs) and the remaining 94 percent were held for arraignment in Criminal
Court (summary arrests). DATs were excluded from the study sample.
The primary data source was the CJA database.3 The Criminal Court data were tracked
through November 30, 2001.4 By that time, 90 percent of the cases had reached a disposition in
Criminal Court. The cutoff date for Supreme Court data was January 31, 2002. Approximately
12 percent of the cases had not reached final outcomes by that date. The criminal history
information was supplemented with data from New York State Division of Criminal Justice
Services (DCJS).5
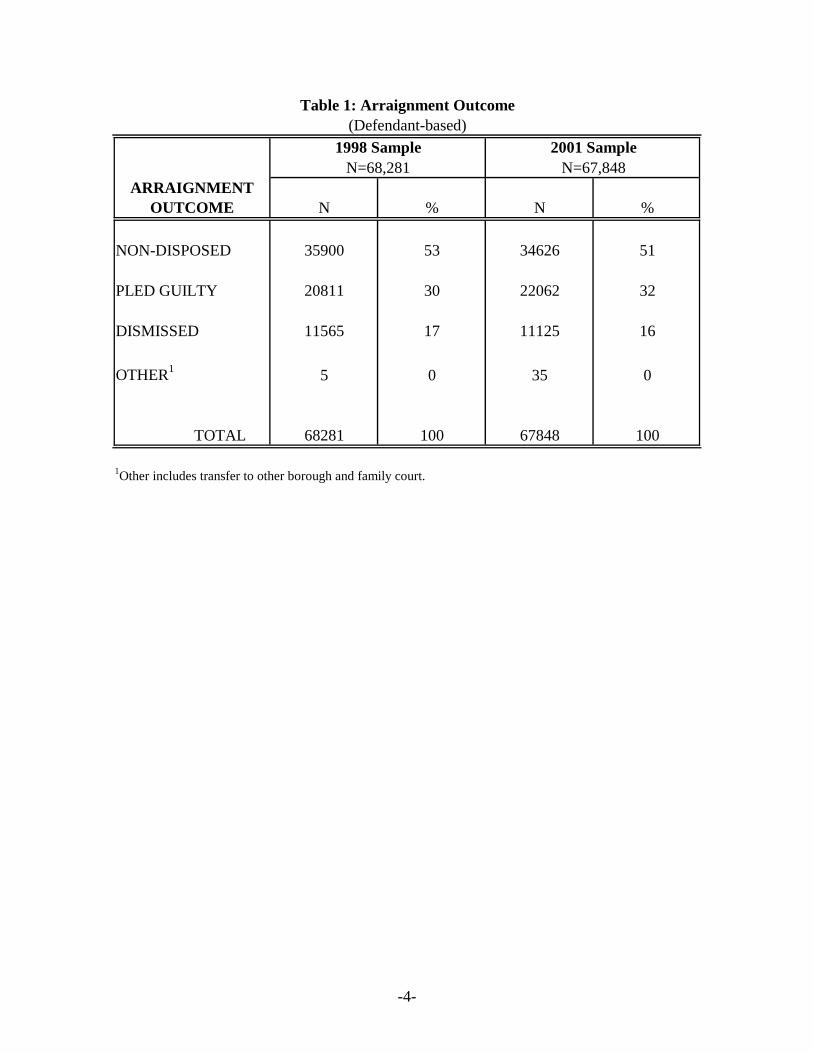
In the first quarter of 2001 dataset, 14 percent of the defendants had multiple arrests. To
examine defendant behavior, the arrest-based file was converted into a defendant-based file,
where only the defendant’s first arrest during the sampling period was taken. This file contained
67,848 defendants. Their arraignment dispositions are presented in Table 1. For comparison
purposes, the distribution for the ’98 dataset is also provided.
As shown by the table, in the first quarter of 2001, 16 percent of the defendants had their
cases dismissed at arraignment. One-third pled guilty and one-half had their cases adjourned for
further appearances. These distributions were similar to those found in the third quarter of
1998.6
indictment by a grand jury is also unavailable. Arrest information is available for both these types of records, and defendant information may be available for arrests receiving “A” dockets. To the extent that these records could be distinguished from other types of non-docketed arrests, they were retained in the dataset to maintain a complete cohort of prosecuted arrests. 2This number excludes juvenile delinquents whose cases were transferred to Family Court prior to arraignment, non-juvenile cases transferred to Family Court prior to arraignment, and voided arrests. 3 Information about the arrest is provided by an on-line feed from the New York City Police Department. 4 If a case had multiple dockets, the Criminal Court information including warrants was pulled from the docket having the most severe affidavit charge (Penal Law severity). 5 DCJS did not provide data for sealed cases. The New York City Police Department, DCJS, or any agency providing data bear no responsibility for the methods of analysis used in this report or its conclusions. 6 When compared with the ’89 dataset, the 2001 dataset behaved quite differently (table for the 1989 dataset is not provided). The dismissal rate for the former was considerably lower than that for the latter. This was also true for defendants who pled guilty at arraignment (23% in 1989 versus 32 percent in 2001). In contrast, the proportion of defendants whose cases were adjourned at arraignment dropped from 70 percent in 1989 to 51 percent in 2001.
-3-
-4-
N % N %
NON-DISPOSED 35900 53 34626 51
PLED GUILTY 20811 30 22062 32
DISMISSED 11565 17 11125 16
OTHER1 5 0 35 0
TOTAL 68281 100 67848 100
1Other includes transfer to other borough and family court.
ARRAIGNMENTOUTCOME
1998 SampleN=68,281
2001 SampleN=67,848
Table 1: Arraignment Outcome(Defendant-based)
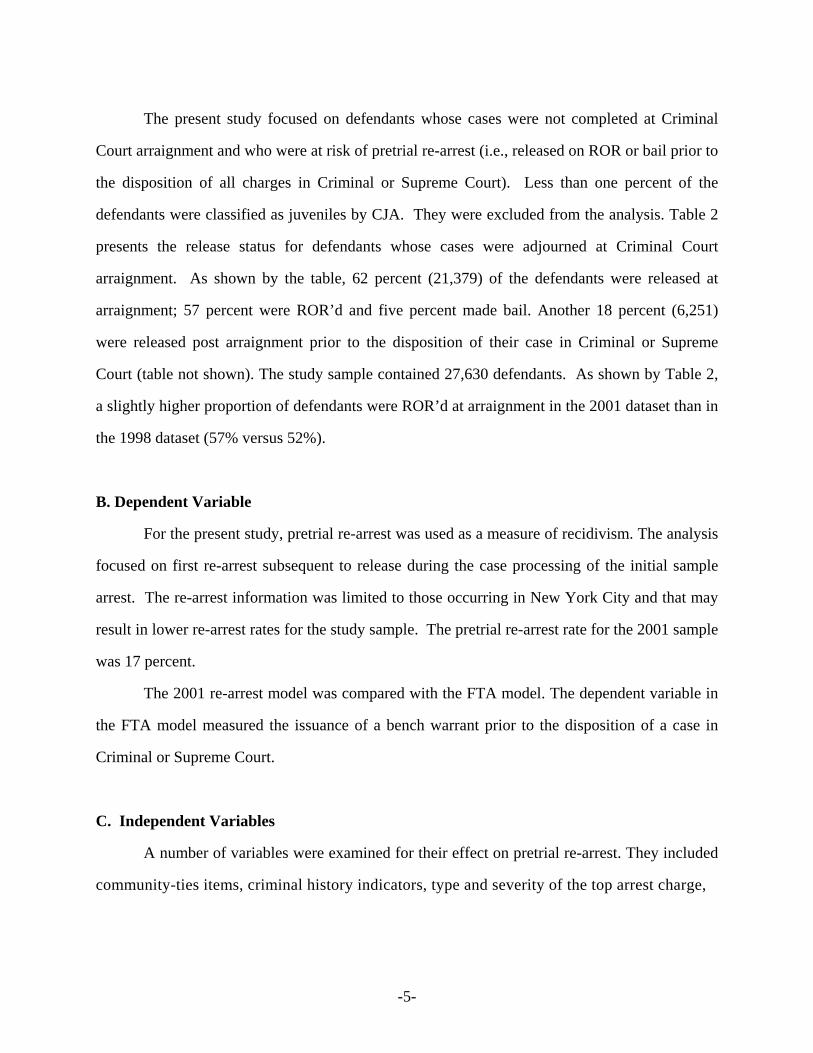
The present study focused on defendants whose cases were not completed at Criminal
Court arraignment and who were at risk of pretrial re-arrest (i.e., released on ROR or bail prior to
the disposition of all charges in Criminal or Supreme Court). Less than one percent of the
defendants were classified as juveniles by CJA. They were excluded from the analysis. Table 2
presents the release status for defendants whose cases were adjourned at Criminal Court
arraignment. As shown by the table, 62 percent (21,379) of the defendants were released at
arraignment; 57 percent were ROR’d and five percent made bail. Another 18 percent (6,251)
were released post arraignment prior to the disposition of their case in Criminal or Supreme
Court (table not shown). The study sample contained 27,630 defendants. As shown by Table 2,
a slightly higher proportion of defendants were ROR’d at arraignment in the 2001 dataset than in
the 1998 dataset (57% versus 52%).
B. Dependent Variable
For the present study, pretrial re-arrest was used as a measure of recidivism. The analysis
focused on first re-arrest subsequent to release during the case processing of the initial sample
arrest. The re-arrest information was limited to those occurring in New York City and that may
result in lower re-arrest rates for the study sample. The pretrial re-arrest rate for the 2001 sample
was 17 percent.
The 2001 re-arrest model was compared with the FTA model. The dependent variable in
the FTA model measured the issuance of a bench warrant prior to the disposition of a case in
Criminal or Supreme Court.
C. Independent Variables
A number of variables were examined for their effect on pretrial re-arrest. They included
community-ties items, criminal history indicators, type and severity of the top arrest charge,
-5-

-6-
N % N %
REMAND 424 1 497 2
BAIL SET, NOT MADE 15751 44 12388 36
BAIL MADE 863 2 1709 5
ROR 18770 52 19670 57
TOTAL 35,808 100 34264 100
RELEASESTATUS
Table 2: Release Status at Arraignment(Defendant-based)
1998 Sample 2001 Sample

demographic attributes and case-processing characteristics. Theory and correlation with the
dependent variable aided the selection of the independent variables.
The community-ties items contained information on whether the defendants had a
working telephone in the residence, the length of time at their current address, whether they had
a New York City area address, family ties within the residence, whether they expected someone
at their Criminal Court arraignment, and whether they were employed, in school, or in a training
program full time at the time of their initial arrest. The criminal history variables provided data
on a defendant’s prior arrests, prior convictions, open warrants, pending cases, and prior FTA.
The top arrest charge "type" was based on its Uniform Crime Reports' (UCR) category. The
offenses were categorized into 1) violent, 2) property, 3) drug, 4), public order offenses, and 5)
others. These categories were similar to those used by BJS in its various reports on recidivism
(Bureau of Justice Statistics, 2002).
The "severity" of the top arrest charge was derived from its New York State Penal Law
offense class. The hierarchy from most to least serious severity level was: A felony, B felony, C
felony, D felony, A misdemeanor, B misdemeanor, unclassified misdemeanor (U misdemeanor),
violations and infractions.
The demographic variables provided information about a defendant’s sex, ethnicity and
age. The case-processing variables included information on borough of initial arrest, borough of
first pretrial re-arrest, time from arraignment to disposition on the initial arrest (case-processing
time), time from arraignment to first pretrial re-arrest, type of first release, and court of
disposition. The type of first release variable indicated whether a defendant was initially released
on own recognizance or by the posting of bail. The court of disposition variable accounted for
whether a case was disposed in Criminal Court or was transferred to Supreme Court. Included in
the borough of arrest were the five boroughs comprising the City of New York: Brooklyn,
Manhattan, Queens, the Bronx, and Staten Island.
-7-
D. Statistical Methods
The analysis presented in this report focused on the likelihood of pretrial re-arrest among
defendants who were at risk in Criminal Court or Supreme Court. The analysis began by
applying the final model from the 1998 sample to the 2001 sample. Then, another model was
developed which excluded the variables that lost significance in the 2001 sample. In the next
phase, using the 2001 sample, the likelihood or pretrial FTA was examined. It should be noted
that the 2001 dataset was previously used to validate an FTA model, which was developed using
a 1998 sample. The model was translated into a new point scale and, for policy reasons, did not
include defendants’ demographics and type and severity of top arrest charge. This model,
therefore, could not be compared with the re-arrest model.
Since dependent variables in both FTA and re-arrest analyses were dichotomous (pretrial
re-arrest or no re-arrest, pretrial FTA or no FTA), logistic regression analysis was used to
develop models. Multiple logistic regression analysis is a statistical technique that is used to test
the individual effect of a number of independent variables on a dichotomous dependent variable,
while controlling for the other variables in the model. A logistic regression procedure predicts
the log-odds (the logit coefficients) of an observation being in one category of the dependent
variable versus another. When reporting the results from a logistic regression model, one may
also wish to transform the log-odds into odds ratios. This is accomplished by taking the antilog
of the logit coefficient. The result is then interpreted as how much the odds of an outcome
change, given a specific category of an independent variable. An odds ratio greater than one
indicates an increase in the likelihood of an event occurring, and an odds ratio of less than one
indicates a decrease in the likelihood of an event occurring. An odds ratio of one indicates the
odds remain unchanged (no association between the independent and dependent variable). If the
independent variable is continuous, such as age, the odds ratio measures the change in the odds
of an outcome given one unit change in the independent variable. For dichotomous independent
variables, such as gender, the odds ratio tells us how much the odds of an outcome change when
cases are in one category versus another category. If a categorical independent variable has
-8-
more than two categories, such as offense type, the odds ratio measures the effect of being in
each category of the independent variable versus a specified reference category. In the analysis
presented in this report, the effect for each category, except one, was compared to the overall
effect of that variable (deviation contrast technique). The last category was specified as the
excluded category.
As an example, assume that a dichotomized independent variable is coded "1" if a
defendant has a history of failure to appear, and "0" otherwise (no prior FTA). Also assume that
the dependent variable, indicating first pretrial re-arrest, is coded "1" if a defendant is re-arrested
pretrial and "0" if a defendant is not re-arrested. Estimating a univariate logistic regression
model with prior FTA as the only independent variable produces a logit coefficient (log-odds) of
.344. This suggests that when the variable of prior FTA changes from 0 to 1, there is an
associated increase of .344 in the log-odds of re-arrest. Taking the antilog of the logit coefficient
gives an odds ratio of 1.410. This indicates the odds of being re-arrested for defendants with
prior FTAs are about 1.4 times greater than that for defendants who do not have a history of
failure to appear.
In the present analysis, a .05 level (or less) was used to ascertain whether an observation
had a statistically significant effect on the dependent variable. A .05 level of significance means
that the observation could have occurred by chance alone five times in 100. The overall ability
of all the independent variables in the logistic regression model to predict the outcome variable
was measured by examining Nagelkerk R2 (SPSS, Inc., 1999). This statistic indicates what
proportion of the variation in the dependent variable is explained by all the independent
variables in the model. Its values range from 0 to 1, with 0 indicating no variation in the
dependent variable and 1 suggesting that all the variation in the dependent variable was
explained by the independent variables in the model.
-9-
RESULTS
A. Defendant Characteristics
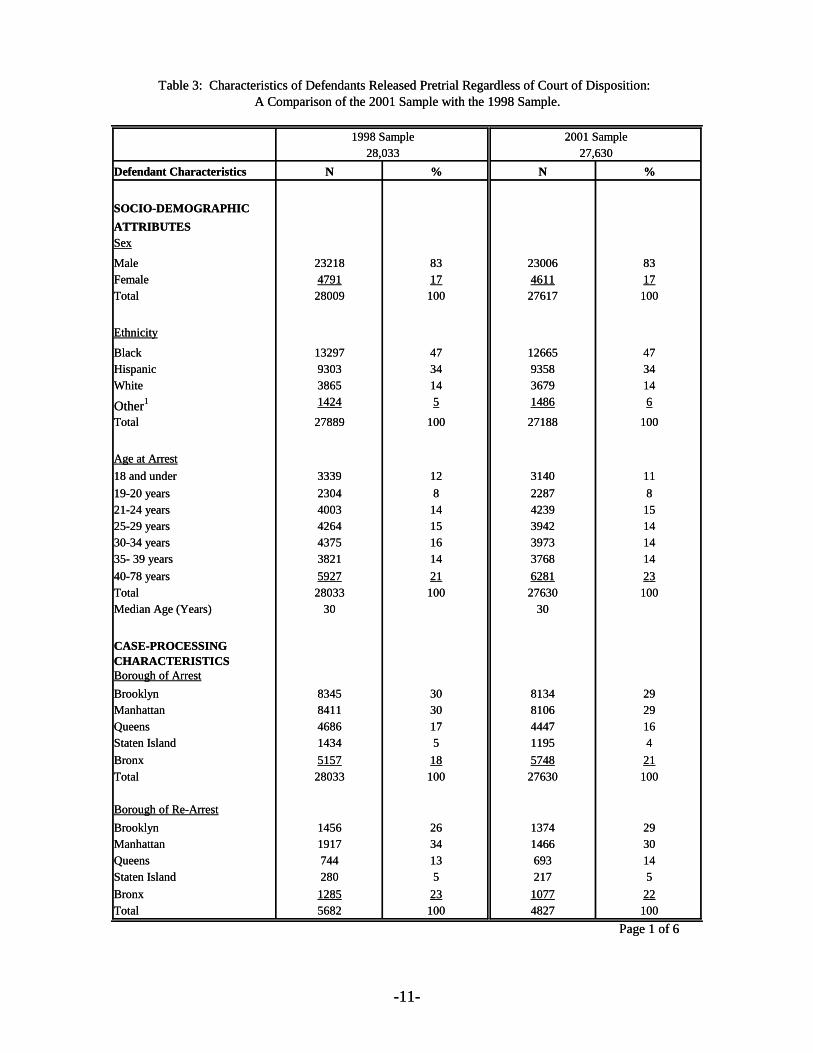
Table 3 displays characteristics of defendants from the 2001 sample who were at risk for
pretrial re-arrest in either Criminal or Supreme Court. To facilitate comparisons, distributions
for the ’98 sample are also provided. As shown by the table, the 1998 and 2001 samples did not
differ with respect to defendants’ demographics. The majority of the defendants in both samples
were male. Slightly less than half of the defendants were black, one-third were Hispanic, and the
remainder were white or other ethnicity. The median age was 30 years. The average FTA rate
dropped from 20 percent in 1998 to 16 percent in 2001.7
The two samples differed slightly with respect to their average re-arrest rate, which
dropped from 20 percent in 1998, to 17 percent in 2001. In the 1998 sample, defendants initially
arrested for a non-violent felony offense had the highest re-arrest rate (23%), followed by
defendants charged with a violent felony offense (19%) and defendants with misdemeanor or
lesser charges (18%). In the 2001 sample, the re-arrest rates for defendants initially charged
with a violent felony offense, and with a non-violent felony offense were virtually the same
(16% for the former, 17% for the latter). The re-arrest rate for defendants initially arrested for a
misdemeanor or lesser charge was also similar (18%).
In both samples, Brooklyn and Manhattan had the highest proportion of defendants being
arrested (approximately 30% in each of these boroughs). One-fifth of the defendants were
arrested in the Bronx and 16 percent were arrested in Queens. Staten Island had the lowest
number of arrests (4%). In the 2001 sample, 30 percent of the re-arrests were made in
Manhattan, followed by Brooklyn (29%), and the Bronx (22%). The comparable numbers for
the 1998 sample were 34 percent for Manhattan, 26 percent for Brooklyn, and 23 percent for the
Bronx. In both samples, about 14 percent of the defendants were re-arrested in Queens and five
percent in Staten Island. Relative to the 1998 sample, the 2001 sample had a slightly lower
7Both the re-arrest and FTA rates showed a steady decline since 1989. The average combined-court re-arrest and FTA rates in 1989 were 30 percent and 35 percent, respectively.
-10-
Defendant Characteristics N % N %
SOCIO-DEMOGRAPHICATTRIBUTESSex
Male 23218 83 23006 83Female 4791 17 4611 17Total 28009 100 27617 100
Ethnicity
Black 13297 47 12665 47Hispanic 9303 34 9358 34White 3865 14 3679 14
Other1 1424 5 1486 6
Total 27889 100 27188 100
Age at Arrest18 and under 3339 12 3140 1119-20 years 2304 8 2287 821-24 years 4003 14 4239 1525-29 years 4264 15 3942 1430-34 years 4375 16 3973 1435- 39 years 3821 14 3768 1440-78 years 5927 21 6281 23Total 28033 100 27630 100Median Age (Years) 30 30
CASE-PROCESSING CHARACTERISTICSBorough of ArrestBrooklyn 8345 30 8134 29Manhattan 8411 30 8106 29Queens 4686 17 4447 16Staten Island 1434 5 1195 4Bronx 5157 18 5748 21Total 28033 100 27630 100
Borough of Re-ArrestBrooklyn 1456 26 1374 29Manhattan 1917 34 1466 30Queens 744 13 693 14Staten Island 280 5 217 5Bronx 1285 23 1077 22Total 5682 100 4827 100
Page 1 of 6
Table 3: Characteristics of Defendants Released Pretrial Regardless of Court of Disposition: A Comparison of the 2001 Sample with the 1998 Sample.
1998 Sample 2001 Sample28,033 27,630
-11-
Defendant Characteristics N % N %CASE-PROCESSING CHARACTERISTICSType of CourtCriminal Court 23861 85 24355 88Supreme Court 4172 15 3275 12Total 28033 100 27630 100
Type of First Release
ROR 21895 80 21081 79Bail 5355 20 5600 21Total 27250 100 26681 100
Median Time From Arrignment to Disposition (Days) 89 87
Median Time from Arraignment to First Re-Arrest (Days) 48 37
FTA Regardless of Court of DispositionYes 5612 20 4393 16No 22421 80 23237 84Total 28033 100 27630 100
Pretrial Re-Arrest (All Offenders)Yes 5682 20 4827 17No 22351 80 22803 83Total 28033 100 27630 100
Pretrial Re-Arrest Among Violent Felony OffendersYes 1149 19 699 16No 4774 81 3631 84Total 5923 100 4330 100
Pretrial Re-Arrest Among Nonviolent Felony OffendersYes 2518 23 1622 17No 8457 77 8126 83Total 10975 100 9748 100
Page 2 of 6
Table 3(contd.)
1998 Sample 2001 SampleN=28,033 N=27,630
-12-
Defendant Characteristics N % N %CASE-PROCESSING CHARACTERISTICSPretrial Re-Arrest Among MisdemeanantsYes 1987 18 2464 18No 9062 82 10938 82Total 11049 100 13402 100
COMMUNITY-TIES ITEMS
Verified NYC Area Address
Yes Unverified 15383 58 16930 65Yes Verified 9101 34 7294 28No, Unverified 1362 5 1291 5No Verified 299 1 157 1Unresolved Conflict 469 2 314 1Total 26614 100 25986 100
Verified Length of residence of at least 18 monthsYes Unverified 11057 41 12707 49Yes Verified 6923 26 5812 22No, Unverified 5794 22 5518 21No Verified 2099 8 1433 6Unresolved Conflict 786 3 539 2Total 26659 100 26009 100
Verified Family Ties With in ResidenceYes Unverified 8805 33 9844 38Yes Verified 7027 26 5714 22No, Unverified 7979 30 8341 32No Verified 2252 8 1700 7Unresolved Conflict 588 2 393 2Total 26651 100 25992 100
Expects Someone at Arraignment
Yes 10593 40 9873 38No 15948 60 16029 62Total 26541 100 25902 100
Page 3 of 6
Table 3(contd.)
1998 Sample 2001 SampleN=28,033 N=27,630
-13-

Defendant Characteristics N % N %COMMUNITY-TIES ITEMS
Verified Telephone
Yes Unverified 10194 38 12482 48Yes Verified 8657 32 7118 27No, Unverified 6135 23 5383 21No Verified 705 3 324 1Unresolved Conflict 952 4 675 3Total 26643 100 25982 100
Verified Full Time Employment/ School/ TrainingYes Unverified 8151 31 9791 38Yes Verified 4933 18 4236 16No, Unverified 9067 34 8665 33No Verified 3640 14 2706 10Unresolved Conflict 804 3 566 2Total 26595 100 25964 100
CRIMINAL HISTORY
First Arrest
Yes 11733 44 10966 42No 15226 56 15305 58Total 26959 100 26271 100
Prior Violent Felony Convictions
Yes 2096 7 2078 8No 25937 93 25552 93Total 28033 100 27630 100
Prior Felony Convictions
Yes 5710 21 5956 23No 21110 79 20315 77Total 26820 100 26271 100
Prior Misdemeanor Convictions
Yes 7167 27 7520 29No 19653 73 18751 71Total 26820 100 26271 100
Page 4 of 6
Table 3(contd.)
1998 Sample 2001 SampleN=28,033 N=27,630
-14-
Defendant Characteristics N % N %CRIMINAL HISTORY
Open CasesYes 7018 26 6226 24No 19802 74 20045 76Total 26762 100 26271 100
Type of WarrantAttached to Rap SheetBench Warrant 1866 7 2413 9No Bench Warrant 24896 93 23979 91Total 26762 100 26392 100
Prior FTA
Yes 7210 26 7127 26No 20823 74 20503 74Total 28033 100 27630 100
TOP INITIAL ARRESTCHARGE SEVERITYA Felony 336 1 338 1B Felony 5822 21 4343 16C Felony 1810 7 1464 5D Felony 6321 23 5255 19E Felony 2616 9 2678 10A Misdemeanor 8705 31 10317 38B Misdemeanor 1401 5 1604 6Other3 943 3 1481 5Total 27945 100 27480 100
TOP RE-ARRESTCHARGE SEVERITYA Felony 64 1 41 1B Felony 1193 22 659 14C Felony 249 4 185 4D Felony 605 11 508 11E Felony 571 10 549 12A Misdemeanor 2051 37 1864 40B Misdemeanor 558 10 601 13Other3 260 5 286 6Total 5551 100 4693 100
Page 5 of 6
1998 Sample 2001 SampleN=28,033 N=27,630
Table 3(contd.)
-15-

-16-
Defendant Characteristics N % N %CRIMINAL HISTORY
TOP INITIAL ARREST CHARGE TYPE Violent 10355 37 8943 32Property 3778 13 4056 15Drug 7309 26 6344 23Public-Order 3281 12 3995 15Other 3222 12 4292 16Total 27945 100 27630 100
TOP RE-ARREST CHARGE TYPEViolent 960 17 861 18Property 887 15 720 15Drug 2084 37 1492 31Public-Order 671 12 624 13Other 1072 19 1130 23Total 5674 100 4827 100
Page 6 of 6
1 Other includes Asian, American Indian, and others.2 OTHER includes Unclassified Misdemeanors, Violations, Infractions, and charges outside the N.Y. State Penal Law and Vehicle and Traffic Law (e.g., Administrative and Public Health
1998 Sample 2001 SampleN=28,033 N=27,630
Codes).
Table 3(contd.)
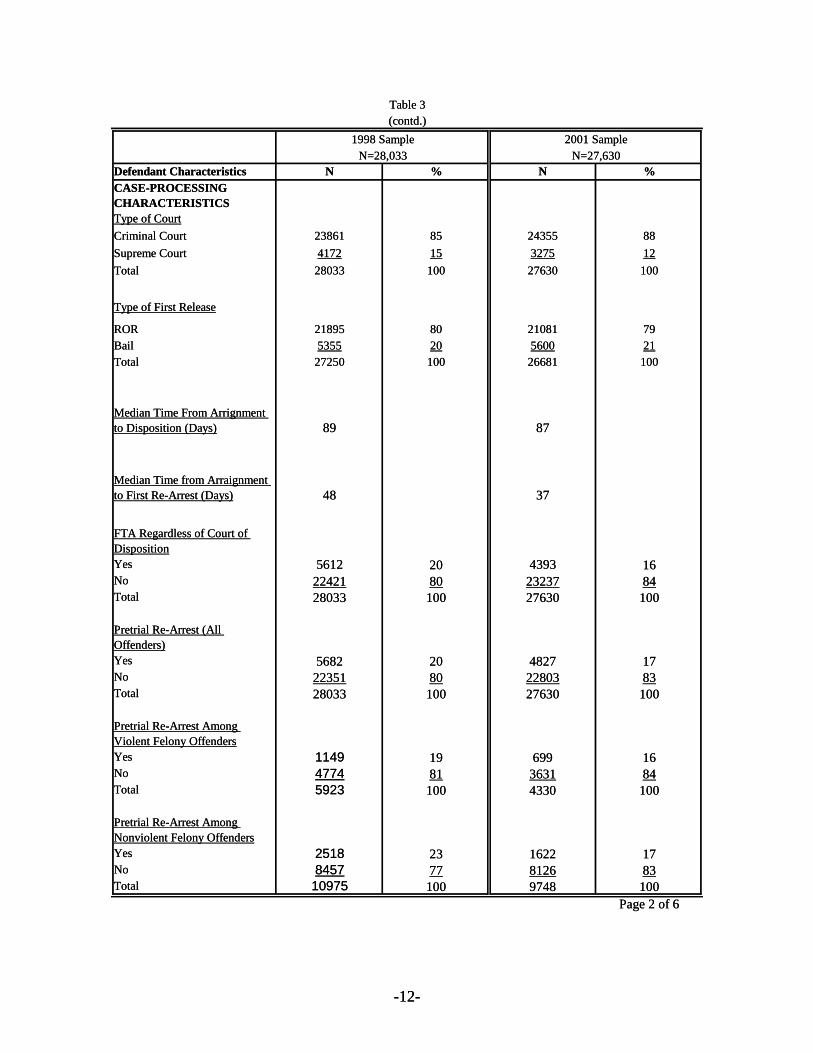
proportion of defendants with cases disposed in Supreme Court (12% versus 15%).8 In both
samples, an overwhelming majority was released on recognizance. The median case processing
time from arraignment to case disposition was 87 days. In the 2001 at-risk sample, the
median time from arraignment to first pretrial re-arrest dropped from 48 days to 37 days.
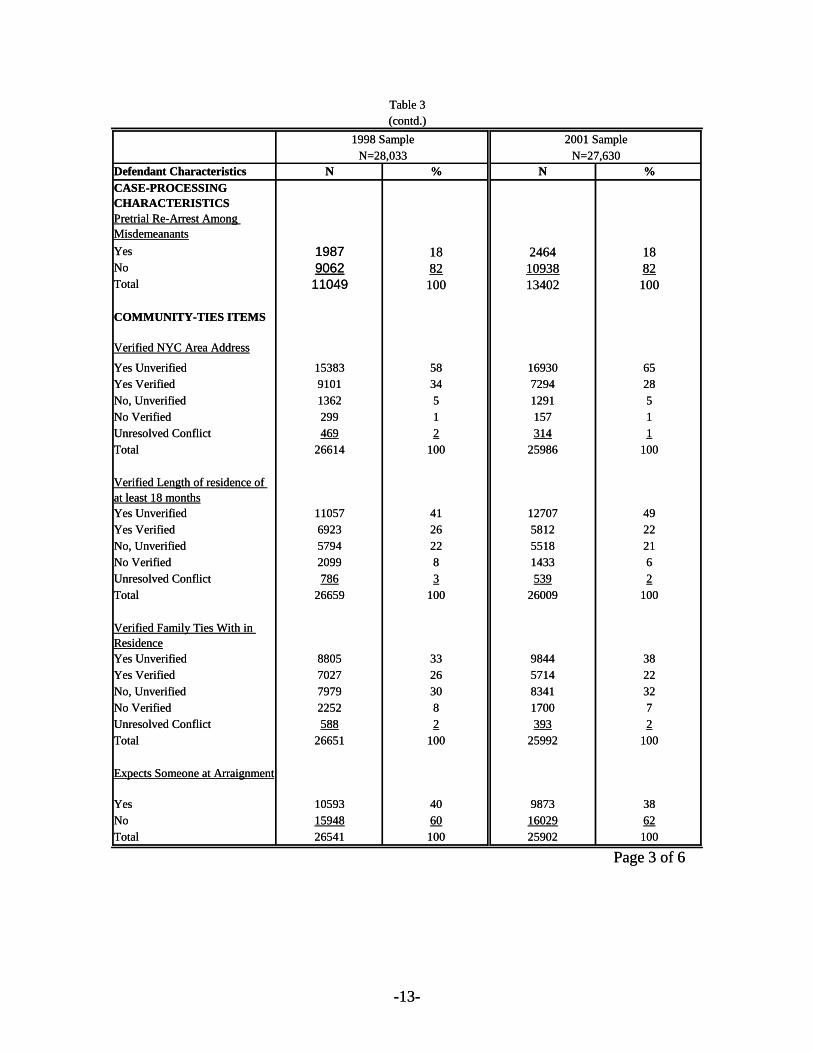
Examining the community ties items, an overwhelming majority of the defendants in
both samples reported living at a New York City area address. Three-fifths reported living with
someone at the time of their arrest. Relative to the ’98 sample, a slightly higher proportion of the
defendants in the ’01 sample reported living at their current address for 18 months or longer,
being employed, in school, or in a training program, and having a working telephone in the
residence or a cellular phone (71% versus 67% for length of time at current address, 54% versus
49% for full-time activity, and 75% versus 70% for having a phone). In both samples, about
two-fifths expected a relative or friend at arraignment. With regard to differences between “yes”
and “yes verified” categories for the community-ties variables, the proportion of defendants with
affirmative, but unverified responses increased in the 2001 sample.9
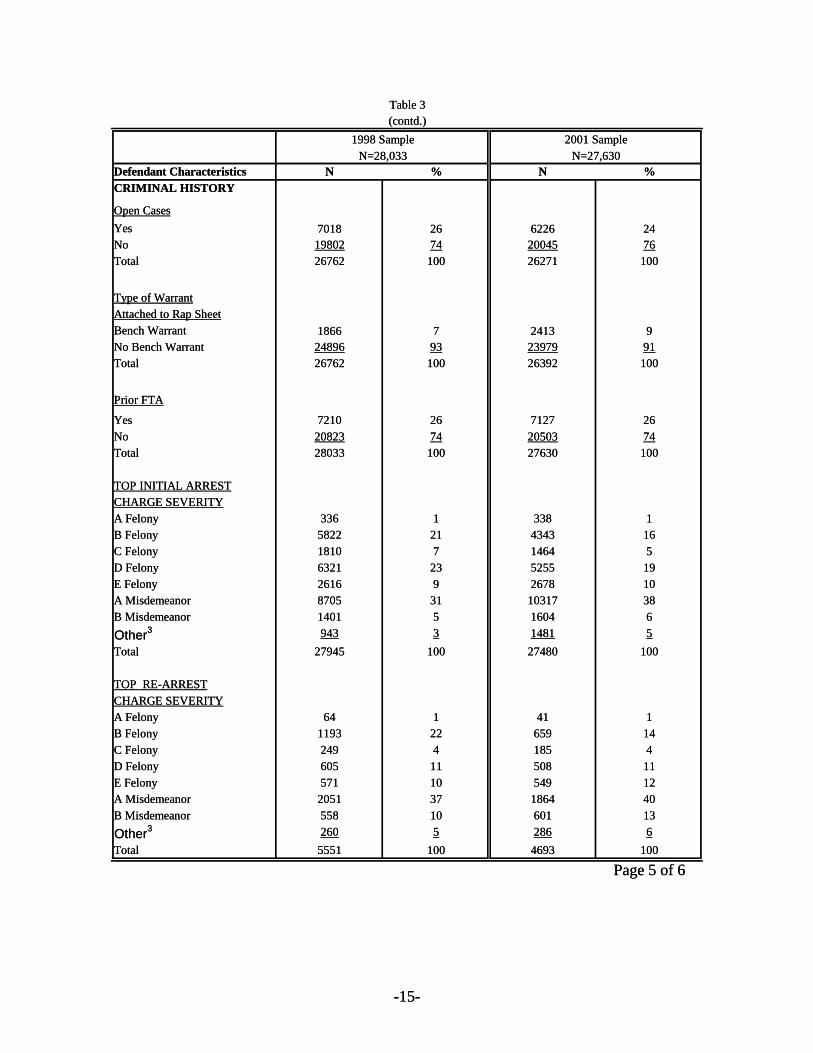
The two samples were very similar with respect to the various measures of a defendant’s
criminal history. To be more specific, in both the 1998 and 2001 at-risk samples, slightly less
than three-fifths of the defendants had been arrested previously. Slightly more than one-fourth
had been convicted previously on misdemeanor charges and one-fifth had a prior felony
conviction(s). Seven percent had a prior violent felony conviction(s). One-fourth had a history of
FTA prior to the sample arrest. One-fourth of the defendants had one or more cases open at the
8A comparison with the 1989 dataset showed a steady decline in the proportion of defendants whose cases were disposed in Supreme Court. In the 1989 sample, 23 percent of the defendants had their cases disposed to Supreme Court. 9Comparisons were also made with the 1989 sample, which indicated a steady decline in the verification efforts by CJA, with the exception of the telephone variable. For the telephone variable, the 1989 and 1998 samples did not differ with respect to defendants whose affirmative responses were verified. However, in the 2001 sample, the proportion of such defendants decreased slightly (by five percentage points). The three samples did not differ with respect to the distribution of defendants with “no verified” responses, with the exception of having a telephone in the residence and being employed, in a school, or a training program full time. Starting with the former, in 1989, seven percent of the defendants were recorded as “no verified.” The corresponding numbers for the 1998 and 2001 samples were three percent and one percent, respectively. For the latter, no difference was found between 1989 and 1998 sample with respect to the proportion of defendants with “no verified” responses. However, the proportion of such defendants dropped from 15 percent in 1989 to ten percent in 2001.
-17-
time of the sample arrest, and less than one-tenth had a bench warrant attached to their rap
sheet.10
Three-fifths of the defendants in the 1998 sample and one-half of the 2001 sample were
initially arrested for felony charges, primarily B and D felonies. In the 2001 sample, the
proportion of defendants arrested for B felonies decreased from 21 percent in 1998 to 16 percent.
In addition, a slight decrease was observed in the proportion of defendants arrested for D
felonies (23% in 1998, 19% in 2001). In contrast, the proportion of defendants arrested for an A
misdemeanor increased from 31 percent in 1998 to 38 percent in 2001.11
The two samples differed somewhat with respect to the type of offenses for which
defendants were arrested. In 2001, the proportion of defendants arrested for violent offenses
decreased from 37 percent in 1998 to 32 percent. For drug offenses, the decrease was from 26
percent in 1998 to 23 percent in 2001.12 Minor differences were found with respect to other
offense types.
Table 3 also presents the distribution of defendants by type and severity of re-arrest
charge. As can be seen, the proportion of defendants re-arrested for a felony decreased from 48
percent in 1998 to 42 percent in 2001. Furthermore, in the 2001 sample, there was a decrease in
the proportion of B felony re-arrests. This may be attributed to a decline in the proportion of
defendants re-arrested for drug offenses (31% in 2001 versus 37 percent in 1998).
10In comparison to the ’89 sample, the 1998 and 2001 samples reflected a decrease in the proportion of defendants with respect to various measures of criminal history, with the exception of having prior arrests and prior violent felony convictions. For example, the proportion of defendants with open cases at the time of arrest decreased from 38 percent in 1989 to 26 percent in 1998 and 24 percent in 2001. For prior misdemeanor convictions, the numbers for the 1989 sample was 32 percent. Continuing further, in 1989, 14 percent of the defendants had a bench warrant attached to their NYSID. The proportion of defendants with prior FTA also decreased from 33 percent in 1989 to 26 percent in 2001. 11In comparison to the ’89 sample, the ’98 and ’01 samples showed a slight decrease in the proportion of defendants arrested for B and D felonies. In contrast, from 1989 to 2001, there was a substantial increase in the number of defendants arrested for A misdemeanors. In 1989, one-fifth of the defendants were arrested for A misdemeanors, versus 31 percent in 1998 and 37 percent in 2001. This may be attributed to an increase in arrests involving quality of life offenses. 12In the ’89 sample, 29 percent of the defendants were arrested for violent crimes. The proportion of such defendants increased in the ’98 sample, and then decreased in the ’01 sample. The ’01 and ’98 samples differed substantially from the 1989 sample with respect to the proportion of defendants arrested for property offenses, ranging from 13 percent for the ’01 sample and 21 percent for the ’89 sample. The comparable figure for the ’98 sample was 12 percent. Finally, relative to the ’89 sample, the proportion of defendants charged with drug offenses decreased by five percentage points in the ’98 sample and eight percentage points for the ’01 sample.
-18-

To summarize the findings from this section, the 1998 and 2001 sample were quite
similar with respect to their characteristics, with the exception of slight differences in the type
and severity of the top arrest charge, pretrial FTA, and pretrial re-arrest.
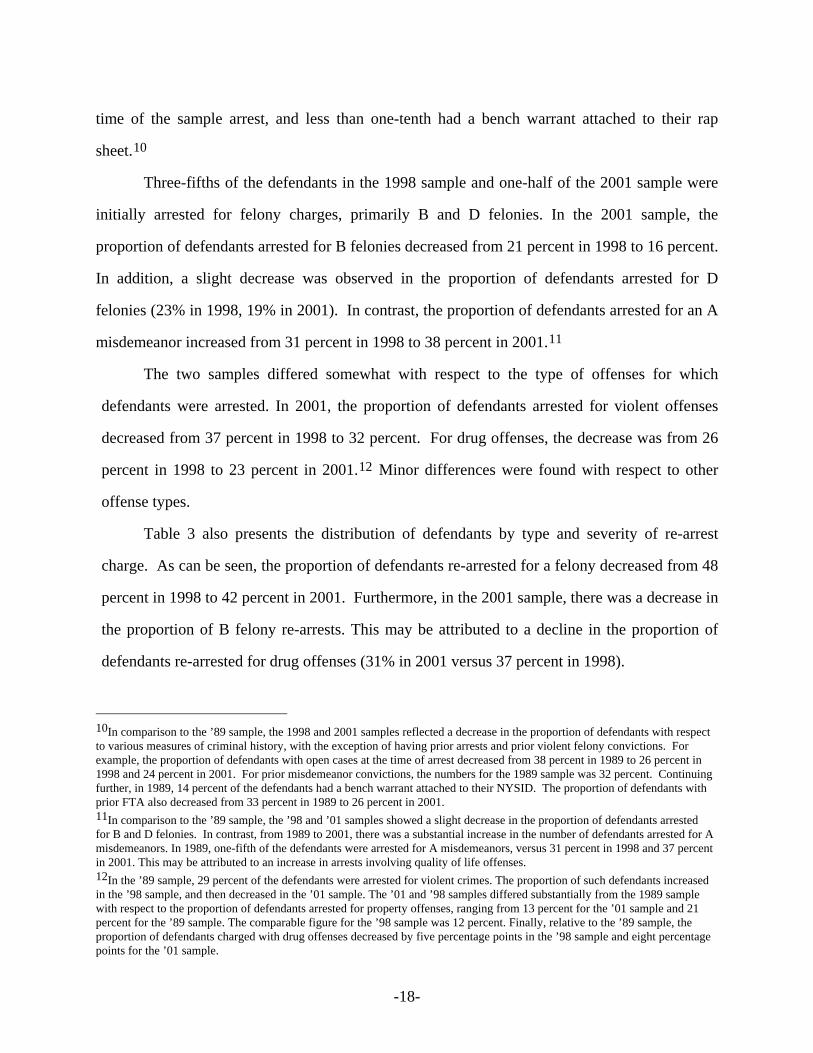
B. Relationship between Borough of Initial Arrest and Borough of Re-arrest
Tables 4 and 5 display the bivariate relationship between borough of initial arrest and
borough of first re-arrest for those re-arrested pretrial in the two samples. As shown by the
tables, an overwhelming majority in both samples were re-arrested in the same borough where
the initial arrest occurred, ranging from 81 percent in Manhattan to about 90% in Staten Island
and the Bronx in 2001. The percentages for the 1998 sample ranged from 81 percent in
Manhattan to 93 percent in Staten Island.
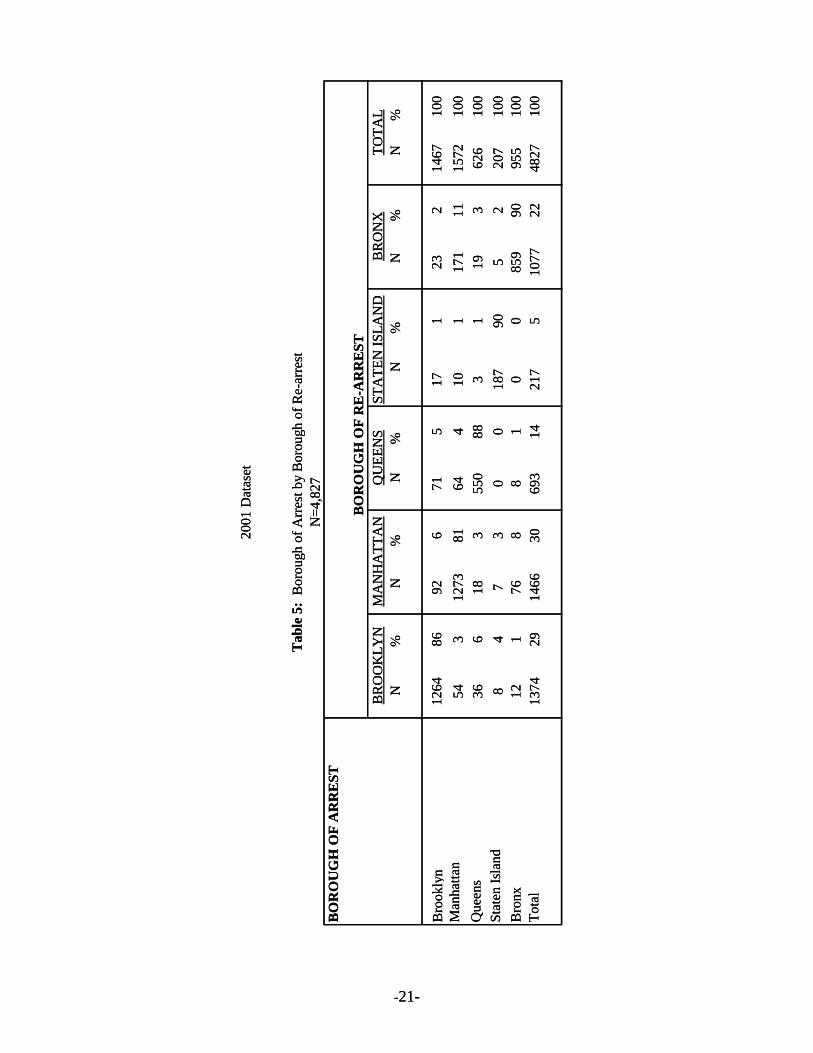
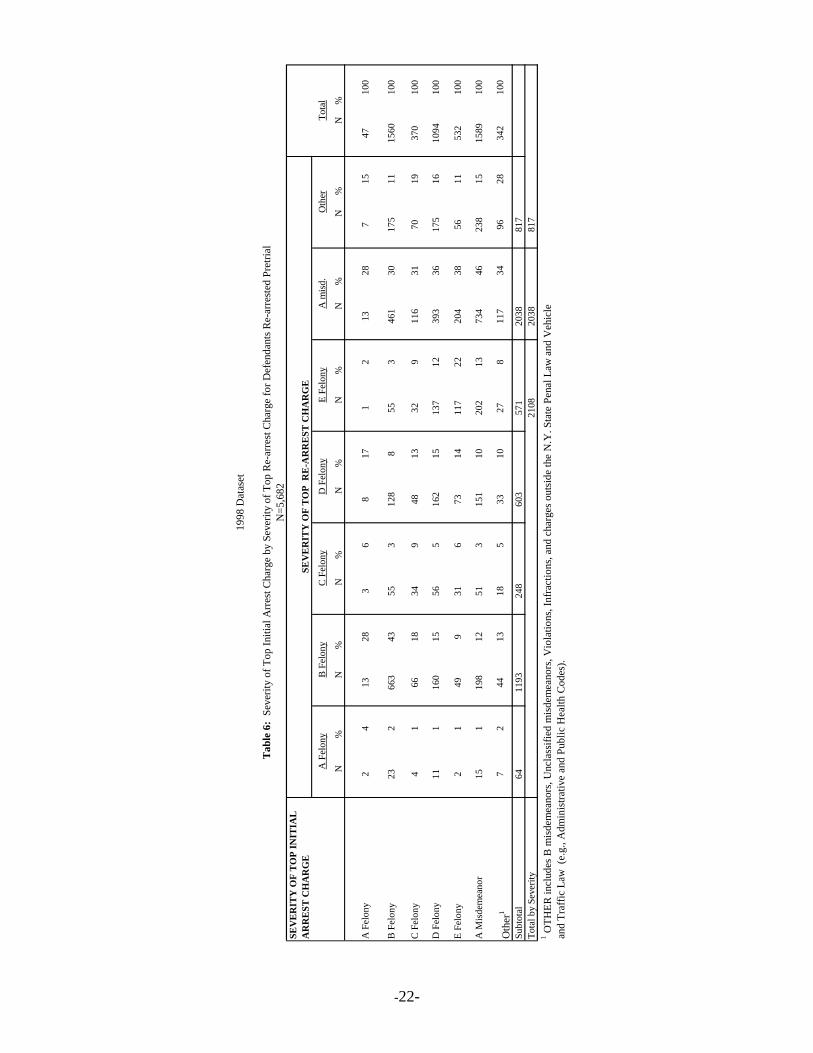
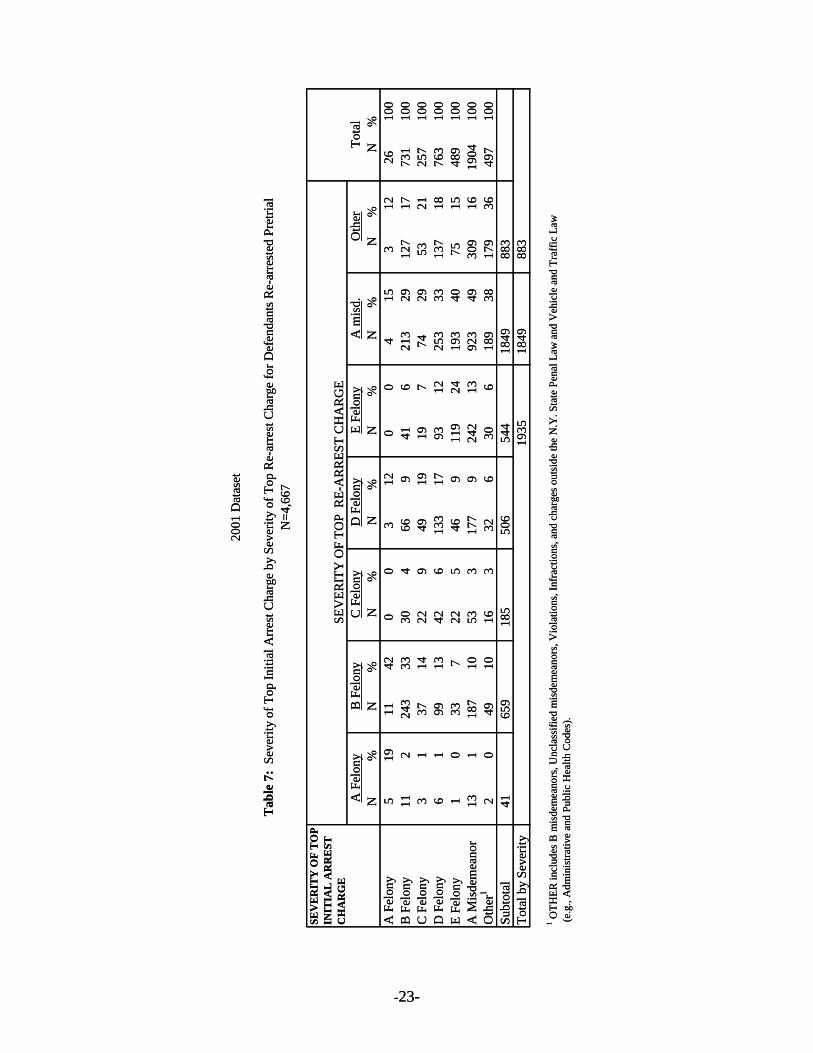
C. Relationship between the Top Initial Arrest Charge and Top Re-arrest Charge
Top Charge Severity
Tables 6 and 7 show the degree of overlap between the severity of the top initial arrest
charge (sample arrest) and the severity of the top re-arrest charge, for those who were re-
arrested pretrial. In the 2001 at-risk sample, half of the defendants who were initially arrested
for felonies were re-arrested for felony offenses. This was slightly lower than that reported for
the 1998 sample where 54 percent of the defendants with a felony arrest charge were re-arrested
for a felony.13 In contrast, defendants with non-felony initial arrest charges were less likely to
have been re-arrested for a felony offense. However, the specific severity of the charge was not
constant. In both of the samples, the largest degree of consistency was observed for the A-
misdemeanors, where approximately half of the defendants were re-arrested with an offense of
the same statutory severity. The overlap for the B-felony category decreased from 43 percent in
1998 to 33 percent in 2001. For the other categories, there was less overlap. 13 A comparison with the 1989 sample showed a steady decline in the proportion of defendants charged with a felony at the time of initial arrest and re-arrest. In 1989, of those who were re-arrested, 58 percent with a felony as the initial arrest charge were re-arrested for felony offenses.
-19-

BO
RO
UG
H O
F A
RR
EST
Bro
okl y
n
BO
RO
UG
H O
F R
E-A
RR
EST
BR
OO
KLY
NN
%
QU
EEN
SN
%B
RO
NX
N
%ST
ATE
N IS
LAN
DM
AN
HA
TTA
NN
%
TOTA
LN
%
1309
8510
47
926
131
272
1545
100
Man
hatta
n95
516
8481
724
101
218
1120
7910
0Q
ueen
s38
630
556
487
00
132
645
100
Stat
en Is
land
52
73
31
256
933
127
410
0B
ronx
91
928
131
10
1024
9011
3910
0To
tal
1456
2619
1734
744
1328
010
0
N
%
1998
Dat
aset
Tab
le 4
: B
orou
gh o
f Arr
est b
y B
orou
gh o
f Re-
arre
st
N=5
,682
512
8523
5682
-20-
BO
RO
UG
H O
F A
RR
EST
Bro
okl y
n
100
N
%
2001
Dat
aset
Tab
le 5
: B
orou
gh o
f Arr
est b
y B
orou
gh o
f Re-
arre
st
N=4
,827
510
7722
4827
3069
314
217
Tota
l13
7429
1466
859
9095
510
010
0B
ronx
121
768
81
0090
52
207
30
018
7St
aten
Isla
nd8
47
193
626
100
100
Que
ens
366
183
550
883
1117
111
1572
8164
410
Man
hatta
n54
312
7323
214
6710
071
517
112
6486
926
TOTA
LN
%ST
ATE
N IS
LAN
DM
AN
HA
TTA
NN
%
BO
RO
UG
H O
F R
E-A
RR
EST
BR
OO
KLY
NN
%
QU
EEN
SN
%B
RO
NX
N
%
-21-
BO
RO
UG
H O
F A
RR
EST
Bro
okl y
n
100
N
%
2001
Dat
aset
Tab
le 5
: B
orou
gh o
f Arr
est b
y B
orou
gh o
f Re-
arre
st
N=4
,827
510
7722
4827
3069
314
217
Tota
l13
7429
1466
859
9095
510
010
0B
ronx
121
768
81
0090
52
207
30
018
7St
aten
Isla
nd8
47
193
626
100
100
Que
ens
366
183
550
883
1117
111
1572
8164
410
Man
hatta
n54
312
7323
214
6710
071
517
112
6486
926
TOTA
LN
%ST
ATE
N IS
LAN
DM
AN
HA
TTA
NN
%
BO
RO
UG
H O
F R
E-A
RR
EST
BR
OO
KLY
NN
%
QU
EEN
SN
%B
RO
NX
N
%
-21-
-22-
SEV
ER
ITY
OF
TO
P IN
ITIA
L
AR
RE
ST C
HA
RG
E
A F
elon
y2
413
283
68
171
213
287
1547
100
Subt
otal
6411
9324
860
357
120
3881
7To
tal b
y Se
verit
y21
0820
3881
71 O
THER
incl
udes
B m
isde
mea
nors
, Unc
lass
ified
mis
dem
eano
rs, V
iola
tions
, Inf
ract
ions
, and
cha
rges
out
side
the
N.Y
. Sta
te P
enal
Law
and
Veh
icle
an
d Tr
affic
Law
(e.
g., A
dmin
istra
tive
and
Publ
ic H
ealth
Cod
es).
1998
Dat
aset
Tota
l
N
%
Tab
le 6
: Se
verit
y of
Top
Initi
al A
rres
t Cha
rge
by S
ever
ity o
f Top
Re-
arre
st C
harg
e fo
r Def
enda
nts R
e-ar
rest
ed P
retri
alN
=5,6
82
SEV
ER
ITY
OF
TO
P R
E-A
RR
EST
CH
AR
GE
A F
elon
y
N
%
B F
elon
y
N
%
C F
elon
y
N
%
D F
elon
y
N
%
E Fe
lony
N
%
A m
isd.
N
%
Oth
er
N
%
B F
elon
y23
266
343
553
128
855
346
130
175
1115
6010
0
C F
elon
y4
166
1834
948
1332
911
631
7019
370
100
D F
elon
y11
116
015
565
162
1513
712
393
3617
516
1094
100
E Fe
lony
21
499
316
7314
117
2220
438
5611
532
100
A M
isde
mea
nor
151
198
1251
315
110
202
1373
446
238
1515
8910
0
Oth
er1
72
4413
185
3310
278
117
3496
2834
210
0
SEV
ER
ITY
OF
TO
P IN
ITIA
L A
RR
EST
CH
AR
GE
A F
elon
y5
1911
420
03
120
04
153
1226
100
B Fe
lony
112
243
3330
466
941
621
329
127
1773
110
0C
Fel
ony
31
3714
229
4919
197
7429
5321
257
100
D F
elon
y6
199
1342
613
317
9312
253
3313
718
763
100
E Fe
lony
10
337
225
469
119
2419
340
7515
489
100
A M
isde
mea
nor
131
187
1053
317
79
242
1392
349
309
1619
0410
0O
ther
12
049
1016
332
630
618
938
179
3649
710
0Su
btot
al41
659
185
506
544
1849
883
Tota
l by
Seve
rity
1935
1849
883
1 OTH
ER in
clud
es B
mis
dem
eano
rs, U
ncla
ssifi
ed m
isde
mea
nors
, Vio
latio
ns, I
nfra
ctio
ns, a
nd c
harg
es o
utsi
de th
e N
.Y. S
tate
Pen
al L
aw a
nd V
ehic
le a
nd T
raffi
c La
w
(e.g
., A
dmin
istra
tive
and
Publ
ic H
ealth
Cod
es).
N
%B
Felo
nyN
%
C F
elon
yN
%N
%E
Felo
nyN
%
N
%N
%O
ther
N
%
2001
Dat
aset
Tab
le 7
: Se
verit
y of
Top
Initi
al A
rrest
Cha
rge
by S
ever
ity o
f Top
Re-
arre
st C
harg
e fo
r Def
enda
nts R
e-ar
rest
ed P
retri
alN
=4,6
67
A m
isd .
SEV
ERIT
Y O
F TO
P R
E-A
RR
EST
CH
AR
GE
Tota
lD
Fel
ony
A F
elon
y
-23-
SEV
ER
ITY
OF
TO
P IN
ITIA
L A
RR
EST
CH
AR
GE
A F
elon
y5
1911
420
03
120
04
153
1226
100
B Fe
lony
112
243
3330
466
941
621
329
127
1773
110
0C
Fel
ony
31
3714
229
4919
197
7429
5321
257
100
D F
elon
y6
199
1342
613
317
9312
253
3313
718
763
100
E Fe
lony
10
337
225
469
119
2419
340
7515
489
100
A M
isde
mea
nor
131
187
1053
317
79
242
1392
349
309
1619
0410
0O
ther
12
049
1016
332
630
618
938
179
3649
710
0Su
btot
al41
659
185
506
544
1849
883
Tota
l by
Seve
rity
1935
1849
883
1 OTH
ER in
clud
es B
mis
dem
eano
rs, U
ncla
ssifi
ed m
isde
mea
nors
, Vio
latio
ns, I
nfra
ctio
ns, a
nd c
harg
es o
utsi
de th
e N
.Y. S
tate
Pen
al L
aw a
nd V
ehic
le a
nd T
raffi
c La
w
(e.g
., A
dmin
istra
tive
and
Publ
ic H
ealth
Cod
es).
N
%B
Felo
nyN
%
C F
elon
yN
%N
%E
Felo
nyN
%
N
%N
%O
ther
N
%
2001
Dat
aset
Tab
le 7
: Se
verit
y of
Top
Initi
al A
rrest
Cha
rge
by S
ever
ity o
f Top
Re-
arre
st C
harg
e fo
r Def
enda
nts R
e-ar
rest
ed P
retri
alN
=4,6
67
A m
isd .
SEV
ERIT
Y O
F TO
P R
E-A
RR
EST
CH
AR
GE
Tota
lD
Fel
ony
A F
elon
y
-23-
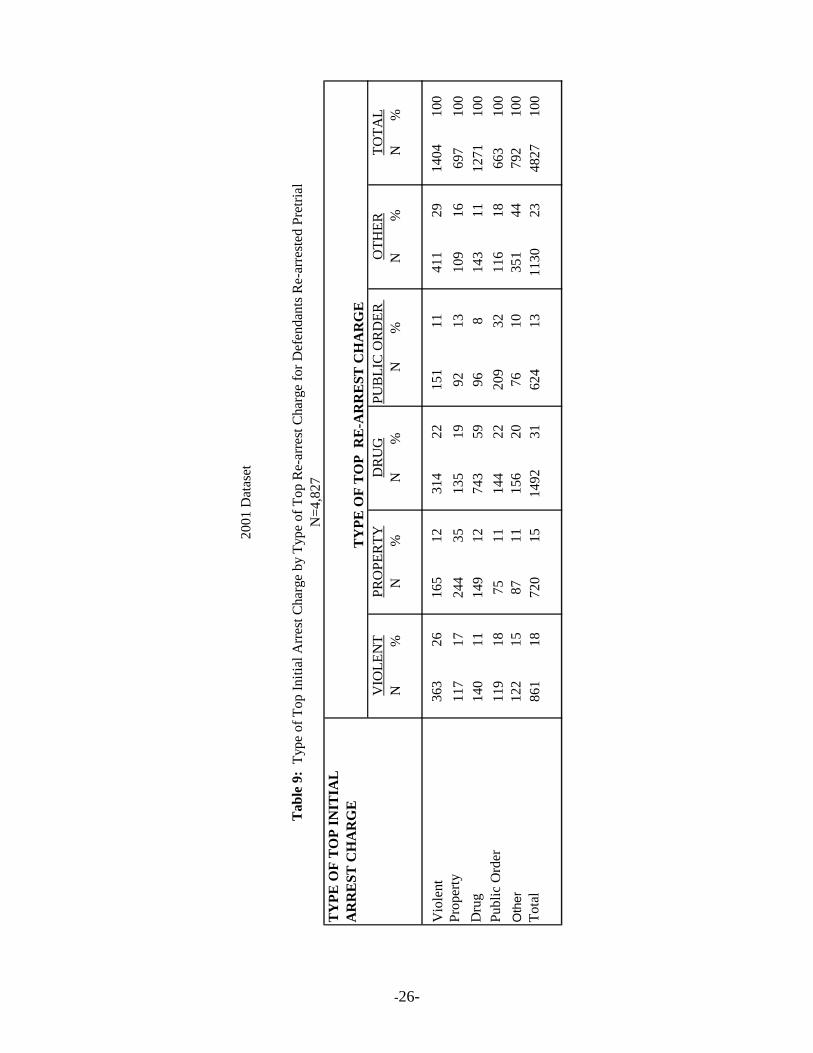
Top Charge Type
The bivariate relationship between the top initial arrest charge type and the top re-arrest
charge type is displayed in Tables 8 and 9. In both samples, there was more of an overlap for
some offense types than others, particularly among those arrested for drug, other, and property
offenses. In 2001, of those who were initially arrested for a drug offense, almost three-fifths
(59%) were re-arrested pretrial for the same type of offense. This was six percentage points
lower than that reported for the 1998 sample (64%). With respect to defendants initially charged
with “other” offenses, almost half were re-arrested for the same offenses in the 2001 sample.
The comparable number for the 1998 sample was 41 percent. In both samples, slightly less than
one-third (29% in 1998 and 32% in 2001) were charged with public order offenses, both at the
time of initial arrest and re-arrest. In both samples, among those initially arrested for property
offenses, one-third were re-arrested for the same offense. In both 1998 and 2001, one-fourth of
the defendants initially arrested for a violent offense were re-arrested for the same type. In
addition to re-committing the same offense, defendants in each of the offense type committed
entirely new offenses.
-24-

-25-
Vio
lent
439
2526
314
426
2421
812
434
2517
80
TY
PE O
F T
OP
RE
-AR
RE
ST C
HA
RG
EV
IOLE
NT
TY
PE O
F T
OP
INIT
IAL
AR
RE
ST
CH
AR
GE
N
%D
RU
GN
%O
THER
N
%PR
OPE
RTY
N
%PU
BLI
C O
RD
ER
N
%
TOTA
LN
%
100
Prop
erty
130
1628
735
176
2210
112
118
1581
210
0D
rug
192
1017
59
1222
6412
57
207
1119
2110
0Pu
blic
Ord
er
110
1883
1415
425
178
2986
1461
110
0O
ther
8516
7114
103
2048
921
541
522
2081
3767
012
956
1787
915
ts R
e-ar
rest
ed P
retri
al
1060
1956
4610
010
0To
tal
1998
Dat
aset
Tab
le 8
: Ty
pe o
f Top
Initi
al A
rres
t Cha
rge
by T
ype
of T
op R
e-ar
rest
Cha
rge
for D
efen
dan
N=5
,646
-26-
TY
PE O
F T
OP
INIT
IAL
A
RR
EST
CH
AR
GE
Vio
lent
100
N
%
2001
Dat
aset
Tab
le 9
: Ty
pe o
f Top
Initi
al A
rres
t Cha
rge
by T
ype
of T
op R
e-ar
rest
Cha
rge
for D
efen
dant
s Re-
arre
sted
Pre
trial
N=4
,827
1311
3023
4827
1514
9231
624
Tota
l86
118
720
351
4479
210
010
0O
ther
122
1587
1115
620
761032
116
1866
311
144
2220
9Pu
blic
Ord
er
119
1875
143
1112
7110
010
0D
rug
140
1114
912
743
5996
81310
916
697
3513
519
92Pr
oper
ty11
717
244
411
2914
0410
031
422
151
1136
326
165
12
TOTA
LN
%PU
BLI
C O
RD
ER
PRO
PER
TYN
%T
YPE
OF
TO
P R
E-A
RR
EST
CH
AR
GE
VIO
LEN
TN
%
DR
UG
N
%
OTH
ERN
%
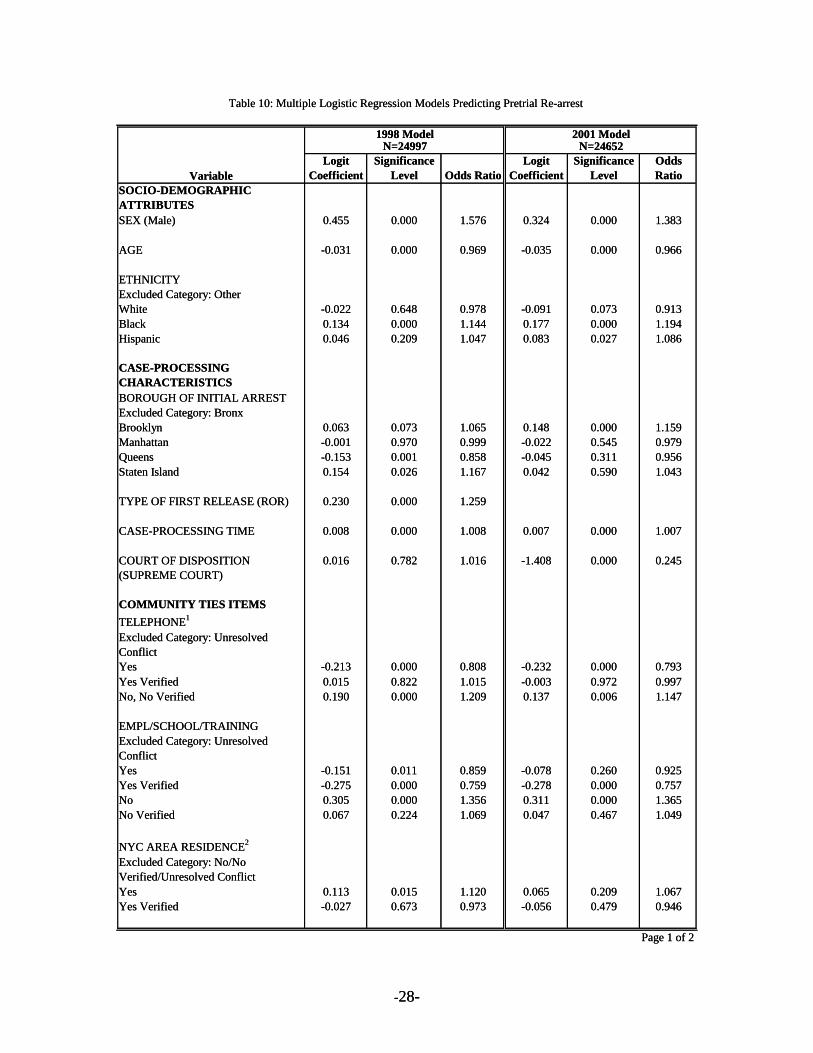
D. Regression Analysis of Re-arrest
To identify consistent predictors of re-arrest across different samples, the variables that
were found to predict re-arrest in the 1998 sample were applied to the 2001 sample of at-risk
defendants. Before entering them into a multiple logistic regression model, their correlation with
pretrial re-arrest was examined. The correlation matrix revealed that all of the variables from the
1998 model were significantly correlated with pretrial re-arrest, with the exception of the type of
first release prior to the disposition of a case in Criminal or Supreme Court. Due to its
insignificance, the type of first release was dropped from the analysis. Table 10 displays the
logistic regression models for the two samples. First, the findings from the 2001 model are
presented. Then, comparisons are made with the 1998 model.
The variables included in the 2001 model contained information on community-ties,
criminal history, charge type and severity, demographics, and case-processing characteristics.14
Beginning with the community-ties variables, having a telephone in the residence, and being
employed, in school, or in a training program full-time significantly predicted the likelihood of
pretrial re-arrest. To be specific, defendants with a “yes, unverified” response to having a
telephone, or a “yes, verified” response to being engaged in a full-time activity were less likely
to be re-arrested than defendants with the average effect of these variables. In contrast, the odds
of being re-arrested pretrial were higher among defendants with “no, no verified” responses to
the telephone variable or a “no, unverified” response to the full-time activity variable. Living at a
New York City area address did not prove to be a statistically significant predictor of the
likelihood of pretrial re-arrest.
With respect to the criminal history variables, defendants having prior arrests, prior
misdemeanor convictions, open cases, and a history of FTA were more likely to be re-arrested
pretrial than defendants who did not have such a history. The prior felony conviction variable
14Due to fewer defendants with no verified responses for the telephone variable, this category was collapsed with the no category. For the same reason, the no verified and unresolved conflict categories for the New York City area address variable were collapsed with the no category.
-27-
Logit Coefficient
Significance Level Odds Ratio
Logit Coefficient
Significance Level
Odds Ratio
SOCIO-DEMOGRAPHIC ATTRIBUTESSEX (Male) 0.455 0.000 1.576 0.324 0.000 1.383
AGE -0.031 0.000 0.969 -0.035 0.000 0.966
ETHNICITYExcluded Category: OtherWhite -0.022 0.648 0.978 -0.091 0.073 0.913Black 0.134 0.000 1.144 0.177 0.000 1.194Hispanic 0.046 0.209 1.047 0.083 0.027 1.086
CASE-PROCESSING CHARACTERISTICSBOROUGH OF INITIAL ARRESTExcluded Category: BronxBrooklyn 0.063 0.073 1.065 0.148 0.000 1.159Manhattan -0.001 0.970 0.999 -0.022 0.545 0.979Queens -0.153 0.001 0.858 -0.045 0.311 0.956Staten Island 0.154 0.026 1.167 0.042 0.590 1.043
TYPE OF FIRST RELEASE (ROR) 0.230 0.000 1.259
CASE-PROCESSING TIME 0.008 0.000 1.008 0.007 0.000 1.007
COURT OF DISPOSITION (SUPREME COURT)
0.016 0.782 1.016 -1.408 0.000 0.245
COMMUNITY TIES ITEMSTELEPHONE1
Excluded Category: Unresolved ConflictYes -0.213 0.000 0.808 -0.232 0.000 0.793Yes Verified 0.015 0.822 1.015 -0.003 0.972 0.997No, No Verified 0.190 0.000 1.209 0.137 0.006 1.147
EMPL/SCHOOL/TRAININGExcluded Category: Unresolved Conflict Yes -0.151 0.011 0.859 -0.078 0.260 0.925Yes Verified -0.275 0.000 0.759 -0.278 0.000 0.757No 0.305 0.000 1.356 0.311 0.000 1.365No Verified 0.067 0.224 1.069 0.047 0.467 1.049
NYC AREA RESIDENCE2
Excluded Category: No/No Verified/Unresolved ConflictYes 0.113 0.015 1.120 0.065 0.209 1.067Yes Verified -0.027 0.673 0.973 -0.056 0.479 0.946
Page 1 of 2
Table 10: Multiple Logistic Regression Models Predicting Pretrial Re-arrest
Variable
1998 Model 2001 ModelN=24997 N=24652
-28-
Logit Coefficient
Significance Level Odds Ratio
Logit Coefficient
Significance Level
Odds Ratio
SOCIO-DEMOGRAPHIC ATTRIBUTESSEX (Male) 0.455 0.000 1.576 0.324 0.000 1.383
AGE -0.031 0.000 0.969 -0.035 0.000 0.966
ETHNICITYExcluded Category: OtherWhite -0.022 0.648 0.978 -0.091 0.073 0.913Black 0.134 0.000 1.144 0.177 0.000 1.194Hispanic 0.046 0.209 1.047 0.083 0.027 1.086
CASE-PROCESSING CHARACTERISTICSBOROUGH OF INITIAL ARRESTExcluded Category: BronxBrooklyn 0.063 0.073 1.065 0.148 0.000 1.159Manhattan -0.001 0.970 0.999 -0.022 0.545 0.979Queens -0.153 0.001 0.858 -0.045 0.311 0.956Staten Island 0.154 0.026 1.167 0.042 0.590 1.043
TYPE OF FIRST RELEASE (ROR) 0.230 0.000 1.259
CASE-PROCESSING TIME 0.008 0.000 1.008 0.007 0.000 1.007
COURT OF DISPOSITION (SUPREME COURT)
0.016 0.782 1.016 -1.408 0.000 0.245
COMMUNITY TIES ITEMSTELEPHONE1
Excluded Category: Unresolved ConflictYes -0.213 0.000 0.808 -0.232 0.000 0.793Yes Verified 0.015 0.822 1.015 -0.003 0.972 0.997No, No Verified 0.190 0.000 1.209 0.137 0.006 1.147
EMPL/SCHOOL/TRAININGExcluded Category: Unresolved Conflict Yes -0.151 0.011 0.859 -0.078 0.260 0.925Yes Verified -0.275 0.000 0.759 -0.278 0.000 0.757No 0.305 0.000 1.356 0.311 0.000 1.365No Verified 0.067 0.224 1.069 0.047 0.467 1.049
NYC AREA RESIDENCE2
Excluded Category: No/No Verified/Unresolved ConflictYes 0.113 0.015 1.120 0.065 0.209 1.067Yes Verified -0.027 0.673 0.973 -0.056 0.479 0.946
Page 1 of 2
Table 10: Multiple Logistic Regression Models Predicting Pretrial Re-arrest
Variable
1998 Model 2001 ModelN=24997 N=24652
-28-
-29-
Logit Coefficient
Significance Level Odds Ratio
Logit Coefficient
Significance Level
Odds Ratio
CRIMINAL HISTORYPrior Arrests 0.486 0.000 1.626 0.429 0.000 1.535
Prior Misdemeanor Convictions 0.304 0.000 1.355 0.315 0.000 1.370
Prior Felony Convictions 0.097 0.036 1.102 0.053 0.262 1.054
PRIOR FTA 0.397 0.000 1.488 0.381 0.000 1.463
OPEN CASES 0.219 0.000 1.245 0.242 0.000 1.274
TOP ARREST CHARGE SEVERITY
Excluded Category: B Misd/ OtherA Felony -0.665 0.000 0.514 -0.664 0.000 0.515B Felony 0.212 0.000 1.236 0.008 0.887 1.008C Felony 0.063 0.354 1.065 0.145 0.053 1.156D Felony 0.096 0.053 1.101 0.057 0.293 1.058E Felony 0.225 0.000 1.253 0.244 0.000 1.276A Misdemeanor 0.217 0.000 1.243 0.224 0.000 1.251
Top Arrest Charge TypeExcluded Category: OtherViolent -0.128 0.000 0.879 -0.128 0.000 0.880Property 0.039 0.378 1.039 -0.089 0.042 0.915Drug 0.191 0.000 1.210 0.183 0.000 1.201Public Order -0.042 0.365 0.959 -0.029 0.505 0.972
Nagelkerke R2 for the 1998 Model = 23%Nagelkerke R2 for the 2001 Model = 18%
the no category.
the no category.
Page 2 of 2
1Due to an insufficient number of defendants with no verified responses, this category was collapsed with the
2Due to an insufficient number of defendants, the no verified and unresolved conflict categories were collapsed with
TABLE 10(contd.)
Variable
1998 Model 2001 ModelN=24997 N=24997
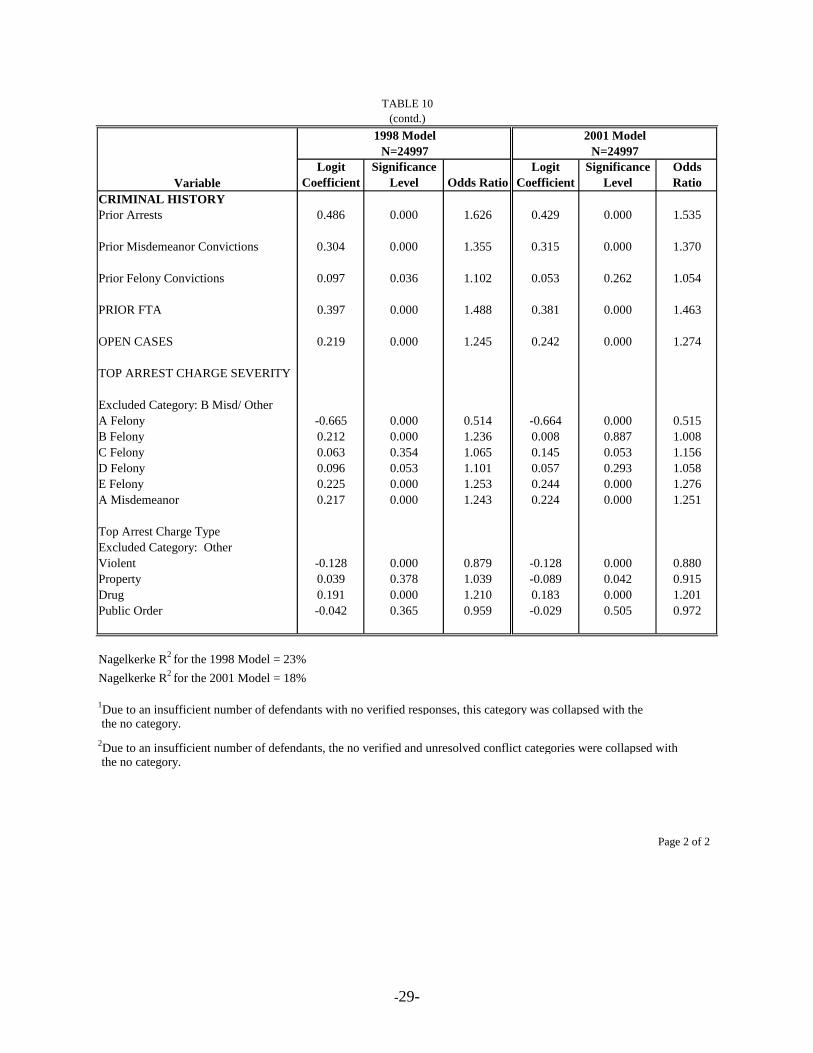
did not attain statistical significance.
In the 2001 model, the severity of the top charge at the initial arrest had a statistically
significant effect on the likelihood of re-arrest. The likelihood of pretrial re-arrest was lower
among defendants initially arrested for an A felony. In contrast, the odds of pretrial re-arrest
were higher among defendants arrested for an E felony or an A misdemeanor. With respect to
the type of offense, defendants arrested on drug offenses were more likely to be re-arrested
pretrial than defendants with the mean effect of that variable, whereas defendants charged with
violent and property offenses at the time of initial arrest were less likely to be re-arrested.15
An examination of demographic variables indicated that, all else being equal, the
probability of re-arrest was higher for male, black, and Hispanic defendants. The likelihood of
being re-arrested pretrial decreased with age. Turning to variation in case-processing
characteristics, the likelihood of re-arrest increased with case processing time. The borough
where the initial arrest occurred also proved relevant: the likelihood of pretrial re-arrest was
higher among defendants initially arrested in Brooklyn. Finally, the likelihood of re-arrest was
higher for cases disposed in Criminal Court than for cases disposed in Supreme Court. It should
be noted that only 11 percent of the defendants in the at-risk sample had their cases disposed in
Supreme Court.
The statistically significant variables were further examined in terms of the size of their
effect on the likelihood of re-arrest. The logit coefficients for these variables suggested that
criminal history variables were among the strongest predictors of pretrial re-arrest. The beta
coefficients for prior arrests, prior FTA and prior misdemeanor convictions were B=.43, B=.38
and B=.31, respectively. A defendant’s gender (B=.32) and being engaged in a full-time activity
(B for the no category=.31) also had strong effects on the likelihood of pretrial re-arrest.
Table 10 also presents the odds ratios for the variables in the model. In this model, the
odds ratio for a variable reflected a change in odds of being re-arrested pretrial after controlling
15 The bivariate analysis showed that defendants charged with an A misdemeanor drug offense had a higher re-arrest rate than defendants charged with a B felony drug offense (29% versus 17%) (data not shown).
-30-

for the effects of all of the other variables in the model. As shown by Table 10, the odds of
being re-arrested pretrial were 1.54 times higher for defendants who had been arrested
previously than the odds for defendants with no prior arrests. The odds ratios for those with
prior FTA, prior misdemeanor convictions, and a “no, unverified” response to the full-time
activity variable were 1.46, 1.37 and 1.36, respectively. The odds of being re-arrested pretrial
for male defendants were 1.38 times higher than that for female defendants. The total amount of
variance explained by the model (as expressed with Nagelkerke’s R2) was 18 percent.
E. A Comparison of the 2001 Re-arrest Model with the 1998 Re-arrest Model
To determine whether there had been a change in the prediction of re-arrest over time, the
2001 model was compared with the 1998 model. Table 10 shows that with the exception of
living at a New York City area address, prior felony convictions and court of disposition, all of
the variables were useful in predicting re-arrest in both samples.16 In the 1998 model, living at a
New York City area address was a significant but weak predictor of re-arrest (B for the yes
category=.11, odds ratio=1.12). In the 2001 sample, when examined separately, both prior arrests
and prior felony convictions were significantly related with pretrial re-arrest. However, when
they were simultaneously controlled for (Table 10), only prior arrests attained statistical
significance. The variable controlling for the court of disposition was significant in the 2001
model only; the likelihood of being re-arrested pretrial was lower among defendants whose cases
were disposed in Supreme Court.17
A comparison of the statistically significant variables for the two models revealed
differences in the interpretation of some of the variables. Beginning with the community-ties
variables, in the 2001 model, the likelihood of re-arrest was lower for defendants with “yes,
16Living at a New York City area address was not a statistically significant predictor of re-arrest in the 1989 model. Prior felony convictions were found to be a significant predictor of re-arrest when prior arrests were not included in the model. 17The court of disposition variable was also found to be a statistically significant predictor of re-arrest in the 1989 sample; the odds of re-arrest were higher in Criminal Court.
-31-
verified” responses to the full-time activity variable. In comparison, in the 1998 sample, this
was true regardless of verification.
Changes were also observed in the interpretation of the some of the demographic and
case-processing variables. In the 1998 model, only one category of the ethnicity variable attained
statistical significance; the likelihood of re-arrest was higher among blacks. In the 2001 sample,
when compared with defendants with the mean effect of the variable, the odds of being re-
arrested pretrial were higher for black and Hispanic defendants. With regard to the borough of
initial arrest, in 1998 defendants initially arrested in Queens were less likely to be re-arrested. In
contrast, when compared with the mean effect of that variable, defendants arrested in Staten
Island were more likely to be re-arrested pretrial. In the 2001 model, the effect of being arrested
in Queens and Staten Island lost statistical significance. However, the effect of being arrested in
Brooklyn became significant--these defendants were more likely to be re-arrested than
defendants with the average effect of that variable. The type of first release variable was
included in the 1998 model only. In the 1998 sample, its effect on the likelihood of re-arrest was
not consistent. When examined in a univariate logistic regression model, defendants released on
recognizance were less likely to be re-arrested than defendants released on bail (table not
shown). The relationship was reversed when other variables were included in the model--the
probability of re-arrest was lower among defendants who were released on bail (Table 10). In
the 2001 sample, it was not found to be significantly correlated with pretrial re-arrest and,
therefore, was excluded from the multivariate analysis.
In both models, top offense type and severity were significantly related with re-arrest.
However, differences were observed in the interpretation of the individual categories. Beginning
with the offense type, the effect of being arrested on property offenses was not statistically
significant in the 1998 model. In the 2001 model, property offenders were less likely to be re-
arrested than those with the mean effect of the variable. Regarding the offense severity, the
effect of being arrested on a B felony was statistically significant in the 1998 model--these
-32-
defendants were more likely to be re-arrested than those with the mean effect of that variable.
This category lost significance in the 2001 model.
Finally, the values of R2 for the two models were examined. The comparison suggested
that the proportion of the variance explained by all of the independent variables was higher for
the 1998 model than for the 2001 model (23% vs. 18%).
In sum, most of the variables that were significant in the 1998 sample remained
significant in the 2001 model. Nonetheless, differences were observed in the interpretation of the
some of the variables.
F. A Comparison of the Re-arrest Model with the FTA Model
To answer whether the same variables would predict both types of pretrial failure
(pretrial FTA and pretrial re-arrest), a model predicting the likelihood of pretrial FTA
for the 2001 sample of at-risk defendants was developed. In addition to all of the
variables from the re-arrest model, the FTA model controlled for two additional
community-ties variables, which were found to have a statistically significant effect on
the likelihood of FTA in the 1998 and 2001 point scale analyses--expecting someone at
arraignment and living at a New York City area residence. The re-arrest model was also
re-estimated. The variables that lost significance in the 2001 sample (Table 10) were
dropped from the re-estimated model. These variable included living at a New York
City area address and prior arrests.18 Table 11 presents both the final re-arrest and
FTA models for the 2001 sample. The table shows that the two models differed with
respect to a number of variables. Furthermore, for variables that were useful in
predicting both outcomes, the interpretation for some was altered, depending upon the
type of failure under scrutiny. The findings are presented as follows:
18As mentioned earlier, when prior arrests and prior felony convictions were simultaneously controlled for, only prior arrests attained statistical significance. Since the variable reflecting prior felony convictions was a more certain indicator of defendant’s criminal history, it was retained in the re-estimated model.
-33-
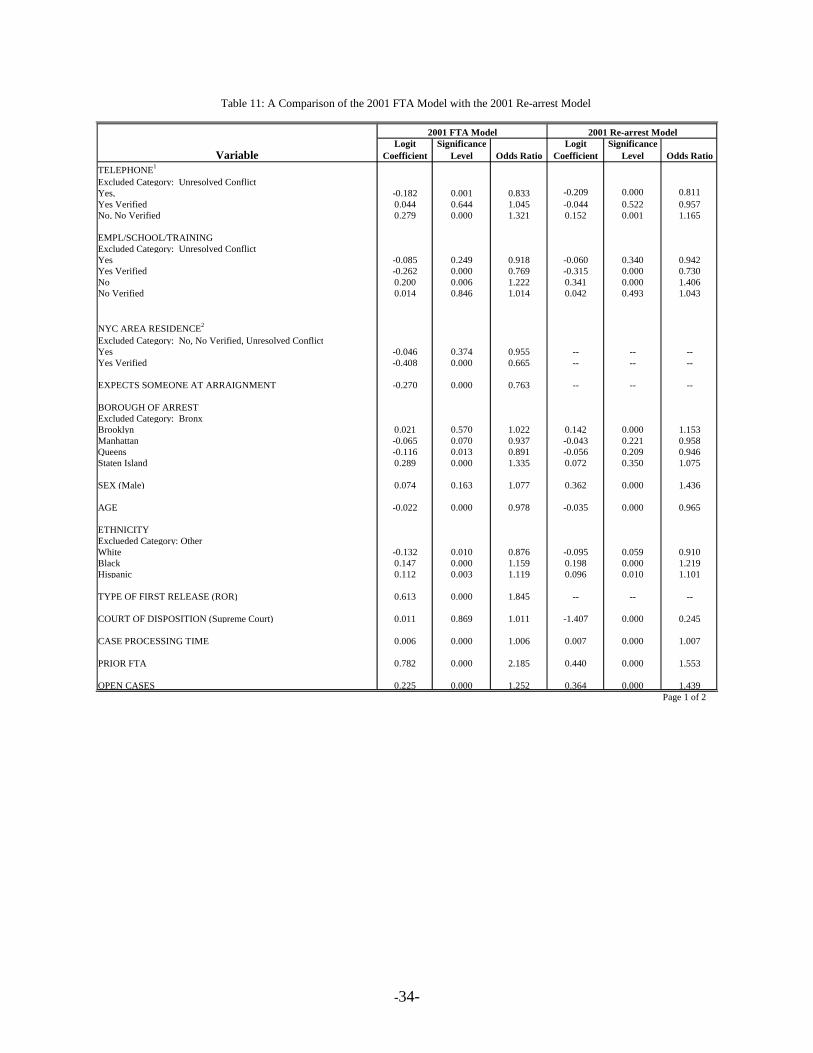
-34-
Logit Coefficient
Significance Level Odds Ratio
Logit Coefficient
Significance Level Odds Ratio
TELEPHONE1
Excluded Category: Unresolved ConflictYes, -0.182 0.001 0.833 -0.209 0.000 0.811Yes Verified 0.044 0.644 1.045 -0.044 0.522 0.957No, No Verified 0.279 0.000 1.321 0.152 0.001 1.165
EMPL/SCHOOL/TRAININGExcluded Category: Unresolved ConflictYes -0.085 0.249 0.918 -0.060 0.340 0.942Yes Verified -0.262 0.000 0.769 -0.315 0.000 0.730No 0.200 0.006 1.222 0.341 0.000 1.406No Verified 0.014 0.846 1.014 0.042 0.493 1.043
NYC AREA RESIDENCE2
Excluded Category: No, No Verified, Unresolved ConflictYes -0.046 0.374 0.955 -- -- --Yes Verified -0.408 0.000 0.665 -- -- --
EXPECTS SOMEONE AT ARRAIGNMENT -0.270 0.000 0.763 -- -- --
BOROUGH OF ARRESTExcluded Category: Bronx Brooklyn 0.021 0.570 1.022 0.142 0.000 1.153Manhattan -0.065 0.070 0.937 -0.043 0.221 0.958Queens -0.116 0.013 0.891 -0.056 0.209 0.946Staten Island 0.289 0.000 1.335 0.072 0.350 1.075
SEX (Male) 0.074 0.163 1.077 0.362 0.000 1.436
AGE -0.022 0.000 0.978 -0.035 0.000 0.965
ETHNICITYExclueded Category: OtherWhite -0.132 0.010 0.876 -0.095 0.059 0.910Black 0.147 0.000 1.159 0.198 0.000 1.219Hispanic 0.112 0.003 1.119 0.096 0.010 1.101
TYPE OF FIRST RELEASE (ROR) 0.613 0.000 1.845 -- -- --
COURT OF DISPOSITION (Supreme Court) 0.011 0.869 1.011 -1.407 0.000 0.245
CASE PROCESSING TIME 0.006 0.000 1.006 0.007 0.000 1.007
PRIOR FTA 0.782 0.000 2.185 0.440 0.000 1.553
OPEN CASES 0.225 0.000 1.252 0.364 0.000 1.439Page 1 of 2
Table 11: A Comparison of the 2001 FTA Model with the 2001 Re-arrest Model
Variable
2001 FTA Model 2001 Re-arrest Model

-35-
Logit Coefficient
Significance Level Odds Ratio
Logit Coefficient
Significance Level Odds Ratio
TOP ARREST CHARGE SEVERITYExcluded Category: B Misd/ OtherA Felony 0.014 0.924 1.014 -0.694 0.000 0.500B Felony -0.169 0.003 0.844 0.008 0.894 1.008C Felony -0.170 0.030 0.844 0.144 0.055 1.155D Felony -0.063 0.223 0.939 0.052 0.338 1.053E Felony -0.030 0.638 0.970 0.237 0.000 1.268A Misdemeanor 0.228 0.000 1.256 0.229 0.000 1.257
PRIOR MISDEMEANOR CONVICTIONS 0.053 0.307 1.054 0.430 0.000 1.538
PRIOR FELONY CONVICTIONS 0.011 0.824 1.011 0.111 0.019 1.117
TOP ARREST CHARGEExcluded Category: OtherViolent -0.209 0.000 0.811 -0.137 0.000 0.872Property 0.088 0.048 1.092 -0.099 0.022 0.905Drug 0.163 0.000 1.178 0.192 0.000 1.212Public Order 0.094 0.030 1.099 -0.032 0.455 0.969
Nagelkerke R2 for the 2001 Re-Arrest Model = 17%Nagelkerke R2 for the 2001 FTA Model = 15%
the no category.
the no category. This variable was not significant in the rearrest model.Page 2 of 2
1Due to an insufficient number of defendants with no verified responses, this category was collapsed with the
2Due to an insufficient number of defendants, the no verified and unresolved conflict categories were collapsed with
TABLE 11(contd.)
Variable
2001 FTA Model 2001 Re-arrest Model

First, more community-ties variables predicted FTA than re-arrest. To be specific,
holding all other variables constant, having a telephone in the residence/cellular phone, residing
in the New York City area, expecting someone at arraignment, and being employed, in school, or
in a training program full-time were significantly related to the likelihood of pretrial FTA. Only
two of them were statistically significant in the re-arrest model--having a telephone in the
residence/cellular phone and being engaged in a full-time activity.
Second, more criminal-history variables were significantly related with pretrial re-arrest
than with pretrial FTA. Having prior felony convictions, prior misdemeanor convictions, open
cases and prior FTA increased the chances that a defendant would be re-arrested pretrial. Only
two of those variables predicted the likelihood of pretrial FTA; consistent with the findings from
the re-arrest model, defendants with prior FTA and open cases were more likely to fail to appear
for scheduled court appearances.19 An examination of the logit coefficients revealed that prior
FTA was a stronger predictor of pretrial FTA than pretrial re-arrest (B=.78 vs. .44). In contrast,
open cases was a stronger predictor of the likelihood of re-arrest than FTA (B=.36 vs. .22).
Third, the two models behaved differently with respect to several demographic attributes
and case-processing characteristics. For example, gender was a significant predictor of pretrial
re-arrest only. Males were more likely to be re-arrested than females. The type of first release
was included in the FTA model only. The likelihood of failure was lower among defendants who
were released on bail. The borough of initial arrest predicted both types of pretrial misconduct,
with some differences in interpretation. Defendants arrested in Queens were less likely to fail to
appear, whereas defendants arrested in Staten Island were more likely to fail to appear pretrial.
In the re-arrest model, the re-arrest rates were higher for defendants initially arrested in
Brooklyn. Defendants in the other categories had no significant effect on the likelihood of
pretrial re-arrest. For both re-arrest and FTA models, the chances that a defendant would either
not appear for scheduled court appearances or be re-arrested prior to case disposition were
19In initial analysis, prior arrest was found to be a significant predictor of FTA. Since it was correlated with open cases, it was not included in the final FTA model.
-36-

higher when the defendant was younger, rather than older. In both models, black and Hispanic
defendants were more likely to FTA, or to be re-arrested, than defendants with the mean effect of
that variable. White defendants had a lower probability of failure to appear for scheduled court
appearances. The variable controlling for the court of disposition was significant in the re-arrest
model only; the likelihood of being re-arrested pretrial was lower among defendants whose cases
were disposed in Supreme Court.
Fourth, the severity of the top initial arrest charge significantly predicted both types of
pretrial failure. In both models, the likelihood of pretrial failure was higher among defendants
arrested for an A misdemeanor. There were some differences in the interpretation of the other
categories. In the FTA model, defendants arrested on C felonies were less likely to FTA than
defendants with the mean effect of the variable. This category was not statistically significant in
the re-arrest model. Defendants arrested on an E felony had a significant effect on the likelihood
of re-arrest only.
Fifth, the type of top initial arrest charge significantly predicted both outcomes.
Nonetheless, slight differences were observed in the interpretation of the individual categories.
For example, in the FTA model, defendants arrested for property, drug or public order offenses
had higher FTA rates. In the re-arrest model, property offenders were less likely to be re-
arrested, whereas drug offenders were more likely to be re-arrested pretrial. The effect of being
arrested on a public order offense was not significant in the re-arrest model. In both models, the
odds of pretrial failure were lower for defendants initially arrested for violent offenses.
To summarize, although several variables predicted both outcomes, some were
statistically significant in one model only. Furthermore, the strength and interpretation for some
of the variables changed.
-37-
SUMMARY AND CONCLUSIONS
The present research shows a consistent decline in the pretrial re-arrest rate since 1989.
In 1989, 30 percent of the at-risk defendants were re-arrested pretrial. The numbers for the 1998
and 2001 samples were 20 percent and 17 percent, respectively. Furthermore, the re-arrest rate
for defendants initially charged with a violent felony offense dropped from 19 percent in 1998 to
In the 1998 sample, defendants initially arrested for a non-violent felony offense had the highest
re-arrest rate (23%), followed by defendants charged with a violent felony offense (19%) and
defendants with misdemeanor or lesser charges (18%).
In the 2001 sample, the re-arrest rate for defendants initially charged with a violent
felony offense (16%) was similar to those arrested for a non-violent felony offense (17%), or a
misdemeanor or lesser severity offense (18%). Our research shows that the median time from
arraignment to first pretrial re-arrest also declined from 48 days in 1989 and 1998, to 37 days in
2001. The proportion of defendants re-arrested for felonies also decreased from 67 percent in
1989 to 40 percent in 2001. The comparable number for the 1998 sample was 52 percent. In the
2001 sample, slightly less than one-third of the re-arrests were made for drug offenses. This was
somewhat lower than that reported for the 1989 and 1998 samples where more than one-third of
the re-arrests were made for those offenses. In the 2001 at-risk sample, half of the re-arrested
defendants who were initially arrested for a felony were re-arrested for a felony. This was
slightly lower than that reported for the 1998 (54%) and 1989 (58%) samples. The bivariate
relationship between the top initial arrest charge type and top re-arrest charge type suggested that
there was more of an overlap for some offense types than others. Furthermore, in addition to
being re-arrested for the same offense, defendants in each of the offense types were arrested on
entirely new offenses.
The present research identified variables that were consistent predictors of pretrial re-
arrest in the 1998 and 2001 samples. Almost all of them were significantly related with the
likelihood of pretrial recidivism in the 1989 model. Some of them were examined previously in
-38-
studies on recidivism in general. However, how they would behave during the pretrial period
was unknown. The findings pertaining to their effect on pretrial re-arrest are summarized below.
1. In both the 1998 and 2001 samples, defendants with a criminal history were more likely to be
re-arrested pretrial than defendants without a criminal history. This was consistent with findings
derived from the general literature and those from pretrial recidivism (Gendreau et al., 1996;
Bureau of Justice Statistics, 1994).
2. Previous research suggested that the type of offense influenced the likelihood of recidivism.
However, a definitive conclusion could not be offered here, as the impact of specific types of
offenses varied from one study to the next. In both the 1998 and 2001 models, the type of
offense at the time of initial arrest had a significant effect on the likelihood of re-arrest.
However, the two samples differed somewhat with respect to the specific type of offense. In
both the 1998 and 2001 models, defendants initially arrested for violent offenses were less likely
to be re-arrested pretrial than defendants with the mean effect of that variable. In contrast, the
likelihood of re-arrest was higher among defendants initially arrested for drug offenses. In the
1998 model, being arrested on property offenses had no significant effect on the likelihood of re-
arrest. In the 2001 model, they were less likely to be re-arrested than defendants with the mean
effect of the offense type variable.
3. The two models suggested higher re-arrest rates among blacks. Review of the literature
pertaining to the effect of race/ethnicity did not offer consistent findings, as some studies found a
significant relationship between blacks and recidivism (Hepburn and Albonetti, 1994; Clarke and
Harrison, 1992, Whitehead, 1991) while others failed to find such an effect (Jones, 1991).
4. In both the 1998 and 2001 models, gender was significantly related to pretrial recidivism:
males were more likely to be re-arrested than females. This was consistent with previous
research (Clarke and Harrison, 1992; Bureau of Justice Statistics, 1987, 1989).
5. Consistent with prior research, in both samples, age at the time of initial arrest was found to be
a significant predictor of re-arrest. Older defendants were less likely to be re-arrested pretrial
-39-
than younger defendants (Belenko et al., 1994; Clarke and Harrison, 1992; Bureau of Justice
Statistics, 1994, 1987, 1985).
6. In both samples, being employed, in school, or in a training program full-time contributed
significantly to predicting pretrial re-arrest. The effect of employment or education on recidivism
in previous studies is not clear, as only a few researchers have examined these variables. Some
researchers have found a significant relationship between unemployment and likelihood of
recidivism (Clarke and Harrison, 1992; Liberton et al., 1992, Whitehead, 1991, Bureau of Justice
Statistics, 1985), while others did not find such an effect (Jones, 1991).
7. The borough of initial arrest contributed significantly to the likelihood of pretrial re-arrest:
defendants initially arrested in Brooklyn were more likely to be re-arrested than defendants with
the mean effect of that variable. This variable is unique to data collected on New York City
defendants and therefore its effect could not be compared with previous research.
8. Having a telephone in the residence was a significant predictor of re-arrest in both the 1998
and 2001 samples. This variable has not been examined previously and therefore its effect on
recidivism is not known.
The variables from the 2001 re-arrest model were compared with the 2001 FTA model.
The goal was to determine whether the same variables were useful in predicting both outcomes.
It was found that the two models differed on a number of predictor variables. More community-
ties variables contributed significantly to the prediction of pretrial FTA than re-arrest. In
contrast, more criminal history variables were observed to predict pretrial re-arrest than pretrial
FTA. For the variables that predicted both outcomes, the interpretation for some of the variables
was altered, depending upon the type of failure analyzed.
Altogether, these findings suggest that while both types of pretrial failure share certain
similarities, they are empirically distinct events. In other words, knowing what predicts pretrial
FTA may not be adequate when attempting to discern what predicts pretrial re-arrest. Thus,
researchers and policymakers should be cautious when making inferences concerning who is
likely to "fail" during the course of case processing; one type of failure may not be the same as
-40-

the other. In jurisdictions where assessing the risk of pretrial danger is allowed, the findings
contained herein may be instrumental to researchers and administrators interested in conducting
research and/or constructing predictive instruments assessing potential pretrial “dangerousness,”
as is often defined as the risk of (pretrial) re-arrest.
-41-
REFERENCES Ares, Charles E., Anne Rankin, and Herbert Sturtz. 1963. "The Manhattan Bail Project: An Interim Report on the Use of Pre-trial Parole.” New York University Law Review 38: 67. Belenko, Steven, Jeffrey A. Fagan, and Tamara Dumanovsky. 1994. “The Effect of Legal Sanctions on Recidivism in Special Drug Courts.” The Justice System Journal 17 (1): 53-81. Bureau of Justice Statistics. February 1994. Pretrial Release of Federal Felony Defendants. Washington D.C.: U.S. Department of Justice, Special Report, NCJ-145322. --June 1988. Drug Law Violators. Washington, D.C.: U.S. Department of Justice, Special Report, NCJ-11763. --February 1985. Examining Recidivism. Washington, D.C.: U. S. Department of Justice, Special Report, NCJ-96501. --January 1985. Pretrial Release and Misconduct. Washington, D.C.: U.S. Department of Justice, Special Report, NCJ-96132. Clarke, Stevens H. and Anita Harrison. 1992. Recidivism of Criminal Offenders Assigned to Community Service Correctional Programs or Released from Prison in North Carolina in 1989. University of North Carolina at Chapel Hill: Institute of Government. Gendrau, Paul, Tracy Little and Claire Goggin. 1996. “A Meta-Analysis of the Predictors of Adult Offender Recidivism. What Works!” Criminology 34 (4): 575-596. Hepburn John R. and Celesta A. Albonetti. 1994. “Recidivism Among Drug Offenders: A Survival Analysis of the Effects of Offender Characteristics, Type of Offense, and Two Types of Intervention.” Journal of Quantitative Criminology 10 (2): 159-179 Jones, Peter R. 1991. “The Risk of Recidivism: Evaluating the Public-Safety Implications of a Community Corrections Program.” Journal of Criminal Justice 19: 45-66. Liberton, Michael, Mitchell Silverman, and William R. Blount. 1992. “Predicting Probation Success for the First-Time Offender.” International Journal of Offender Therapy and Comparative Criminology 36 (4): 335-347. Norusis, Marija J. 1990. SPSS Advanced Statistics User’s Guide. Chicago, Illinois. Thomas, Wayne. 1976. Bail Reform in America. Berkeley, CA: University of California Press. Whitehead, John T. 1991. “The Effectiveness of Felony Probation: Results From an Eastern State.” Justice Quarterly 8 (4): 525-543.
-42-
APPENDIX A
RECODING OF OFFENSE TYPES
Violent offenses include murder, non-negligent manslaughter, negligent manslaughter,
forcible rape, robbery, aggravated assault, simple assault and kidnapping.
Property offenses include burglary, larceny-theft, arson, motor vehicle theft, possession
of burglar’s tools, embezzlement, fraud, forgery and counterfeiting, and stolen property.
Drug offenses include: A) sale/manufacture of controlled substance including opium,
cocaine or derivatives, marijuana, synthetic narcotics and other dangerous drugs, and B)
use/possession of controlled substance including opium, cocaine or derivatives, marijuana,
synthetic narcotics and other dangerous drugs.
Public-order offenses include coercion, criminal mischief, fraud, gambling, offenses
against public order, bribery, promoting prostitution, prostitution, patronizing prostitutes,
extortion, offense against family, disorderly conduct, liquor-law violation, public narcotic
intoxication, sex offenses (excluding forcible rape and prostitution) and use/possession of
dangerous weapons.
The other category consists of all other offenses not included in the aforementioned
categories but which are included in the UCR codes.
-43-