preparing for the lending test · since last exam through a “cut-off” or “as ... foundation...
TRANSCRIPT

1
DEMYSTIFYING THE LENDING TEST

2
The Lending Test evaluates a bank’s record of helping to meet the credit needs of its assessment areas
Home mortgage lendingHome mortgage lending
Small business/farm lendingSmall business/farm lending
Community development Community development lendinglending
Consumer lending Consumer lending
3
Management should provide data for all lending they want considered
Generally, should include all lending data Generally, should include all lending data since last exam through a “cutsince last exam through a “cut--off” or “as off” or “as of” dateof” dateThis includes data on optional affiliate and This includes data on optional affiliate and consortia/third party lendingconsortia/third party lendingOther loan dataOther loan data
4
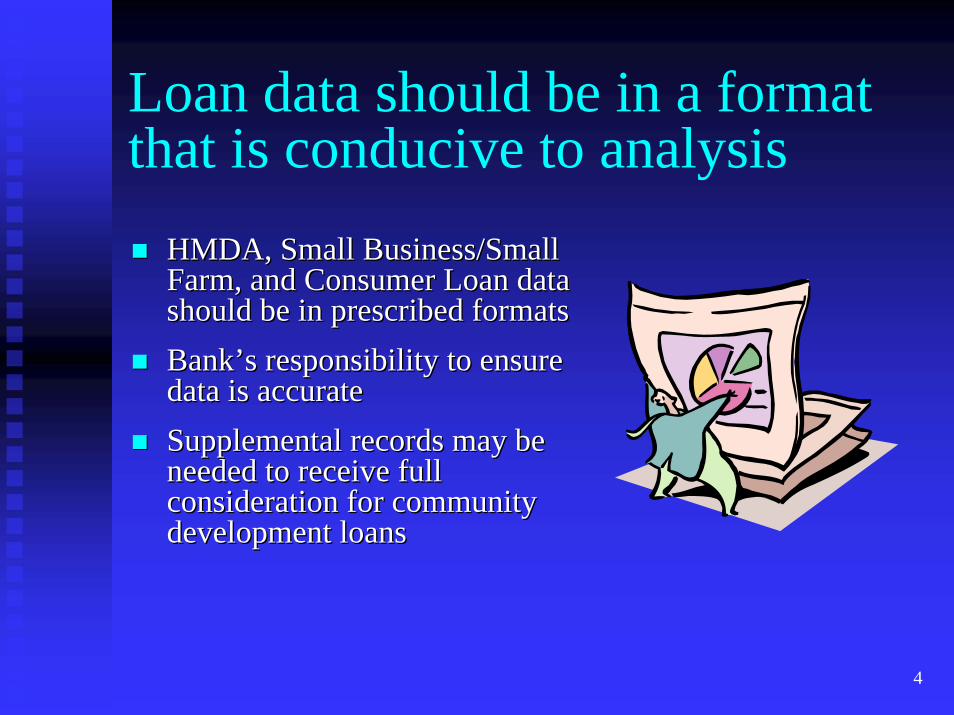
Loan data should be in a format that is conducive to analysis
HMDA, Small Business/Small HMDA, Small Business/Small Farm, and Consumer Loan data Farm, and Consumer Loan data should be in prescribed formatsshould be in prescribed formatsBank’s responsibility to ensure Bank’s responsibility to ensure data is accuratedata is accurateSupplemental records may be Supplemental records may be needed to receive full needed to receive full consideration for community consideration for community development loansdevelopment loans
5
Lending Test Components Lending activityLending activityAssessment area concentration Assessment area concentration Geographic distribution Geographic distribution Borrower distributionBorrower distributionCommunity development lendingCommunity development lendingProduct innovation and flexible lending practicesProduct innovation and flexible lending practices

6
Lending Activity Foundation of the lending test ratingFoundation of the lending test ratingMarket share and market rank primary way Market share and market rank primary way to put activity into contextto put activity into contextContextual information considered, Contextual information considered, including credit needs and the competitive including credit needs and the competitive environmentenvironmentBe prepared to discuss anomalies in the dataBe prepared to discuss anomalies in the data

7
Assessment Area ConcentrationCompares lending inside assessment area versus Compares lending inside assessment area versus outsideoutsidePerformed at the state or bank levelPerformed at the state or bank levelDoes not include affiliate lendingDoes not include affiliate lendingBusiness strategy and contextual data may affect Business strategy and contextual data may affect this performance criteriathis performance criteriaBe prepared to tell “your story” to explain a low Be prepared to tell “your story” to explain a low in/out ratioin/out ratio

8
Geographic DistributionConsiders performance in lending to all geographies in an Considers performance in lending to all geographies in an assessment area, particularly in lowassessment area, particularly in low-- and moderateand moderate--income income geographiesgeographiesLending distribution is compared to certain demographic Lending distribution is compared to certain demographic informationinformationOther comparators might also be usedOther comparators might also be usedLending gap analysis used to identify conspicuous gaps Lending gap analysis used to identify conspicuous gaps Contextual information may affect conclusionContextual information may affect conclusionManagement should be prepared to explain any significant Management should be prepared to explain any significant disparitiesdisparities

9
Example: Geographic Distribution Table –HMDA Loans
Geographic Distribution: HOME PURCHASE State: ANYSTATE Evaluation Period: JAN 1, 2004 TO DEC 31, 2006
Total HomePurchase
Loans
Low-IncomeGeographies
Moderate-Income
Geographies
Middle-IncomeGeographies
Upper-IncomeGeographies Market Share (%) by Geography *
# % ofTotal**
% Owner
Occ Units***
% BankLoans
% Owner
Occ Units***
% BankLoans
% Owner
Occ Units***
% BankLoans
% Owner
Occ Units***
% BankLoans
Over-all Low Mod Mid Upp
Large City MSA #1 219 44.88 2.63 3.71 15.30 9.18 44.34 39.81 37.74 47.30 .86 .83 .83 .46 .90
Large City MSA #2 269 55.12 1.19 .75 16.35 16.00 36.63 39.30 45.84 43.95 1.09 0.00 0.81 0.95 1.51
MSA/Assessment Area:
• Based on 2006 Peer Mortgage Data** Home purchase loans originated and purchased in the MA/AA as a percentage of all home loan originated and purchased in the rated area.***Percentage of Owner Occupied Units is the number of owner occupied units in a particular geography divided by the number of owner occupied housing units in the area based on 2000
Census information.
Focus on performance in low- and moderate-income geographies

10
Example: Geographic Distribution Table –Small Business Loans
Geographic Distribution: SMALL LOANS TO BUSINESSES State: ANYSTATE Evaluation Period: JAN 1, 2004 TO DEC 31, 2006
Total Small Business
Loans
Low-IncomeGeographies
Moderate-Income
Geographies
Middle-IncomeGeographies
Upper-IncomeGeographies Market Share (%) by Geography *
# % ofTotal**
% of Bus***
% BankLoans
% of Bus***
% BankLoans
% of Bus***
% BankLoans
% of Bus***
% BankLoans
Over-all Low Mod Mid Upp
Large City MSA #1 879 76.04 4.45 6.03 32.06 38.57 34.76 32.65 28.73 22.75 1.94 4.23 2.64 1.95 1.34
Large City MSA #2 277 23.96 0.00 0.00 25.33 23.83 46.44 40.79 28.23 35.38 4.47 0.00 4.01 4.66 5.09
MSA/Assessment Area:
• Based on 2006 Peer Mortgage Data.** Small loans to businesses originated and purchased in the MA/AA as a percentage of all small loans to businesses originated and purchased in the rated area.*** Source Data – Dun and Bradstreet (2006).
Focus on performance in low- and moderate-income geographies

11
Lending Gap Analysis

12
Best Practices
Perform self assessmentPerform self assessment
Generate tablesGenerate tables
Identify areas of poor performance and take actionIdentify areas of poor performance and take action
Perform the analysis frequentlyPerform the analysis frequently
Understand your performance contextUnderstand your performance context

13
Geographic Distribution Exercise - 1
Distribution of Home Purchase Loans By Income Level of the Geography2006 2007 Total
# % # % # %
Low 3% 5 5% 1 1% 6 4%Moderate 23% 16 17% 26 33% 42 25%Middle 31% 40 44% 30 38% 70 41%Upper 43% 31 34% 22 28% 53 31%
Total 100% 92 100% 79 100% 171 100%
Geography Income Level
% of Owner Occupied
Housing Units

14
Borrower DistributionConsiders distribution among borrowers Considers distribution among borrowers based on income and business size, based on income and business size, especially LMI borrowers & small especially LMI borrowers & small businessesbusinessesRegulators consider different Regulators consider different measurementsmeasurementsContextual data may affect conclusionContextual data may affect conclusionManagement should be prepared to Management should be prepared to discuss any disparitiesdiscuss any disparities

15
Borrower Profile – Small Business Loans
Table X – Lending Distribution of Commercial Loans Based on Gross Annual Revenues of the Business
Gross Annual Revenue Less than$50,000
$50,000 to$99,999
$100,000 to
$249,999
$250,000 to
$499,999
$500,000 to
$999,999
$1,000,000 and
Greater
Percentage of Businesses by Gross Annual Revenues
11% 25% 31% 13% 8% 12%
Number of Loans 3 4 2 2 1 6
Percentage by Number 17% 22% 11% 11% 6% 33%
Dollar Amount of Loans $353,025 $308,344 $185,025 $30,050 $50,025 $1,091,154
Percentage by Dollar Amount 18% 15% 9% 1% 2% 54%
16
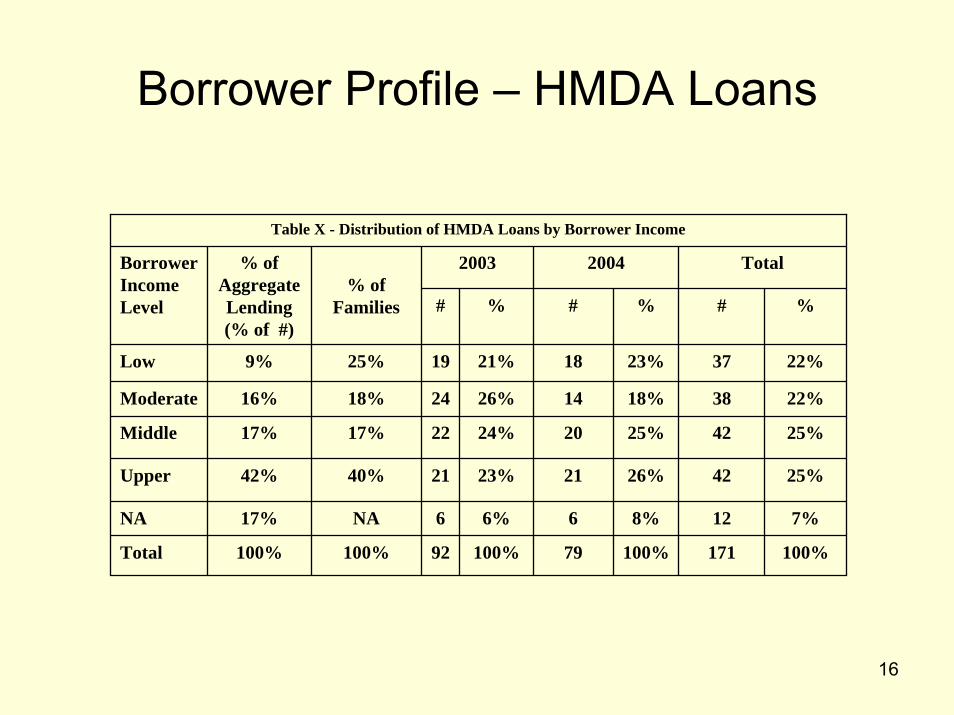
Borrower Profile – HMDA Loans
Table X - Distribution of HMDA Loans by Borrower Income
2003 2004 Total
# % # % # %
Low 9% 25% 19 21% 18 23% 37 22%
Moderate 16% 18% 24 26% 14 18% 38 22%
Middle 17% 17% 22 24% 20 25% 42 25%
Upper 42% 40% 21 23% 21 26% 42 25%
NA 17% NA 6 6% 6 8% 12 7%
Total 100% 100% 92 100% 79 100% 171 100%
Borrower Income Level
% of Aggregate Lending (% of #)
% of Families
17
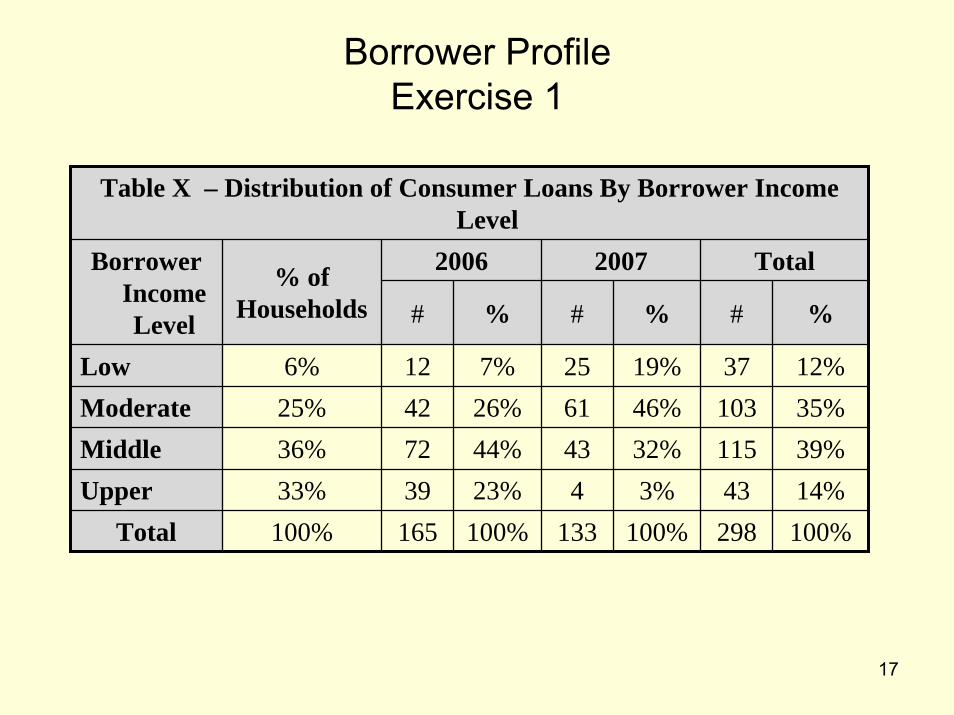
Borrower ProfileExercise 1
Table X – Distribution of Consumer Loans By Borrower Income Level
2006 2007 Total
# % # % # %
Low 6% 12 7% 25 19% 37 12%Moderate 25% 42 26% 61 46% 103 35%Middle 36% 72 44% 43 32% 115 39%Upper 33% 39 23% 4 3% 43 14%
Total 100% 165 100% 133 100% 298 100%
Borrower Income Level
% ofHouseholds

18
Borrower Profile Exercise 2
Gross Annual Revenue (000s)
Area Businesses (D&B)
Bank Loans%
< $100 44% 22%$100 to $249 35% 18%$250 to $499 12% 20%$500 to $999 5% 21%≥ $1,000 4% 19%
19
Responsiveness
Measures Bank’s responsiveness to lowMeasures Bank’s responsiveness to low--income areas and borrowers, and to very income areas and borrowers, and to very small businessessmall businessesReviewed similar to Geographic and Reviewed similar to Geographic and Borrower elementsBorrower elementsMultiple measures typically usedMultiple measures typically usedContextual data may affect conclusionsContextual data may affect conclusionsManagement should be prepared to discuss Management should be prepared to discuss any disparitiesany disparities

20
Community DevelopmentMeasures the Bank’s responsiveness and Measures the Bank’s responsiveness and leadership in community development lendingleadership in community development lending
Number and amountNumber and amountComplexity and innovativenessComplexity and innovativeness
A community development loan must have a A community development loan must have a primary purpose of community developmentprimary purpose of community development
An understanding of community An understanding of community development is critical, and this is an development is critical, and this is an evolving areaevolving area
21
Community DevelopmentAffordable housingAffordable housingCommunity services targeted Community services targeted to LMI residentsto LMI residentsActivities that promote Activities that promote economic development by economic development by financing small businesses or financing small businesses or farmsfarmsActivities that revitalize or Activities that revitalize or stabilize LMI geographiesstabilize LMI geographies

22
Community Development
For nonFor non--OTS institutions, revitalizing or OTS institutions, revitalizing or stabilizing LMI geographies has been stabilizing LMI geographies has been expanded to include:expanded to include:
Revitalizing designated disaster areasRevitalizing designated disaster areas“Distressed or underserved” middle“Distressed or underserved” middle--income nonmetropolitan areasincome nonmetropolitan areas
23
Designated Disaster Area
Areas designated by the federal Areas designated by the federal government(for example, major disaster government(for example, major disaster declarations by FEMA)declarations by FEMA)Eligible for 36 months following the date of Eligible for 36 months following the date of designationdesignationRefer to FEMA website (http:/www.fema.gov) Refer to FEMA website (http:/www.fema.gov) for disaster designationsfor disaster designations

24
Distressed or Underserved AreaIncludes middleIncludes middle--income income tracts in nonmetropolitan tracts in nonmetropolitan areasareas“Nonmetropolitan” means “Nonmetropolitan” means outside an MSAoutside an MSAThe agencies will publish The agencies will publish a list of covered tracts a list of covered tracts Refer to FFIEC website Refer to FFIEC website ((http://www.ffiec.govhttp://www.ffiec.gov) for ) for listinglisting
25
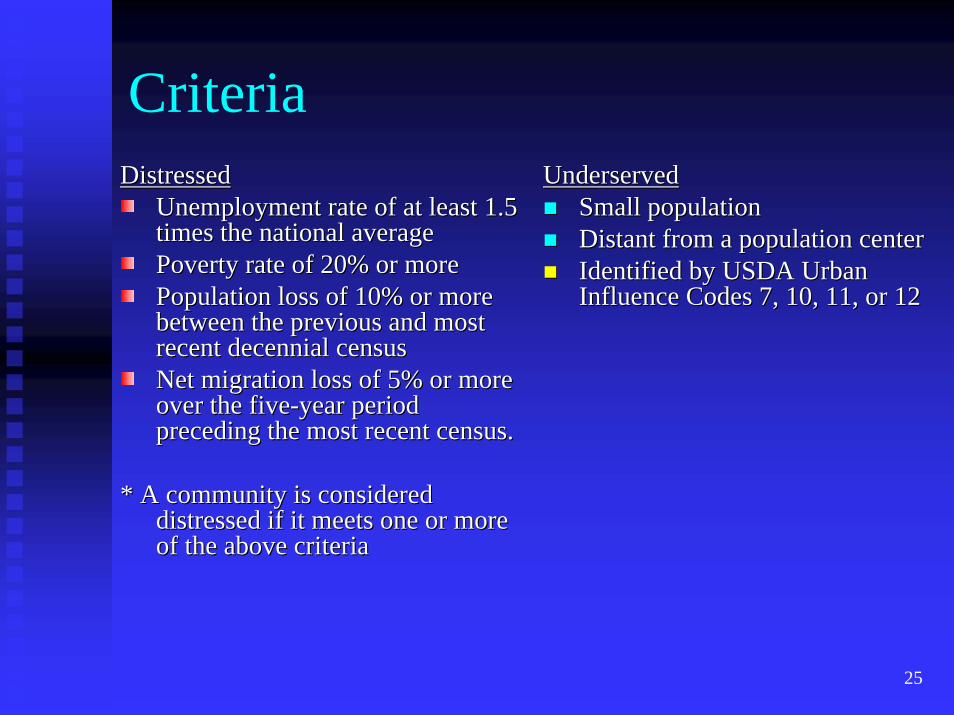
CriteriaDistressedDistressed
Unemployment rate of at least 1.5 Unemployment rate of at least 1.5 times the national averagetimes the national averagePoverty rate of 20% or morePoverty rate of 20% or morePopulation loss of 10% or more Population loss of 10% or more between the previous and most between the previous and most recent decennial census recent decennial census Net migration loss of 5% or more Net migration loss of 5% or more over the fiveover the five--year period year period preceding the most recent census.preceding the most recent census.
* A community is considered * A community is considered distressed if it meets one or more distressed if it meets one or more of the above criteriaof the above criteria
UnderservedUnderservedSmall populationSmall populationDistant from a population centerDistant from a population centerIdentified by USDA Urban Identified by USDA Urban Influence Codes 7, 10, 11, or 12Influence Codes 7, 10, 11, or 12

26
Document Your Activities
Make sure you document Make sure you document the elements that qualify the elements that qualify the loan(s) under the the loan(s) under the regulationregulation
Community Community development primary development primary purposepurposeArea benefitedArea benefitedImpactImpact

27
Be prepared to explain why it’s a community development loan
Management should be prepared to explain Management should be prepared to explain how a loan meets community development how a loan meets community development purposespurposesTime invested in making these loans and Time invested in making these loans and tracking the activity helps distinguish an tracking the activity helps distinguish an institution’s level of performanceinstitution’s level of performanceContextual data again is reviewed in Contextual data again is reviewed in evaluating performanceevaluating performance
28
Product Innovation
Looks at the number and Looks at the number and complexity of various specialized complexity of various specialized loan programs the institution offersloan programs the institution offers
Be prepared to provide number Be prepared to provide number and $ amount of lending under and $ amount of lending under such programssuch programs

29
Common Issues/ProblemsFor BankersFor Bankers
Data collectionData collectionCommunity development lending Community development lending opportunitiesopportunitiesResource constraintsResource constraints
For ExaminersFor ExaminersActivities not sufficiently Activities not sufficiently documenteddocumentedData integrityData integrityData dump w/o analysisData dump w/o analysis

30
Illegal lending practices
CRA evaluation adversely affected by CRA evaluation adversely affected by discriminatory or other illegal lending discriminatory or other illegal lending practicespracticesApplies to the bank and its affiliatesApplies to the bank and its affiliatesRegulators will consider extent of Regulators will consider extent of evidence, bank policies and procedures, evidence, bank policies and procedures, and any corrective action takenand any corrective action takenIncludes Includes
ECOAECOAFHAFHAFTC ActFTC ActRESPARESPATILATILA