preparatory survey (f/s) for tashkent ...open_jicareport.jica.go.jp/pdf/12260816.pdfpreparatory...
TRANSCRIPT
PREPARATORY SURVEY (F/S)
FOR
TASHKENT THERMAL POWER COGENERATION PLANT CONSTRUCTION
PROJECT
AND
MASTER PLAN STUDY
IN
THE REPUBLIC OF UZBEKISTAN
Vol.2
MASTER PLAN STUDY
May 2016
Japan International Cooperation Agency (JICA)
Yachiyo Engineering Co., Ltd. Tohoku Electric Power Co., Inc.
Uzbekenergo Joint-stock Company
The Republic of Uzbekistan
3RJR
16-021
i
Table of Contents
Table of Contents
Location Map
List of Figures and Tables
Abbreviations
Chapter 1 Review of the Power Development Concept
1.1 The content of the power development concept ..................................................... 1-1
1.2 Flow of the power development concept planning ................................................. 1-1
Chapter 2 Fuel Supply Plan
2.1 Review of primary energy ..................................................................................... 2-1
2.2 Possibility of natural gas supply for power generation .......................................... 2-6
2.3 Possibility of coal supply for power generation ..................................................... 2-16
2.4 Supply potential of alternative energy .................................................................. 2-24
Chapter 3 Power Development Concept
3.1 Optimal Power Development Concept selection method ........................................ 3-1
3.2 Review conditions ................................................................................................ 3-4
3.2.1 Electricity demand .................................................................................... 3-4
3.2.2 Load duration curve .................................................................................. 3-17
3.2.3 Supply reliability ...................................................................................... 3-18
3.2.4 Power sources determined for development ............................................... 3-18
3.2.5 Existing power plants decommissioning plan ............................................ 3-19
3.2.6 Power sources proposed for development .................................................. 3-21
3.2.7 Fuel price ................................................................................................. 3-22
3.3 Power development scenarios ............................................................................... 3-23
3.4 Result of WASP simulation .................................................................................. 3-23
3.4.1 Comparison of economic efficiency of Power development scenarios ........ 3-14
3.4.2 Gas consumption for power generation ..................................................... 3-16
3.5 Evaluation of Power Development Concept........................................................... 3-29
3.6 Review of Power Development Concept ............................................................... 3-33
ii
Chapter 4 Network Development Plan
4.1 Study method for planning optimal network development ..................................... 4-1
4.2 Study Condition.................................................................................................... 4-1
4.2.1 Geographical distribution of load and generation ...................................... 4-1
4.2.2 Supply Reliability ..................................................................................... 4-4
4.2.3 Review of Existing Electricity Network Facilities ..................................... 4-5
4.2.4 Uzbekenergo JSC’s network development plan ......................................... 4-11
4.3 Network Analysis ................................................................................................. 4-16
4.3.1 Network analysis condition ....................................................................... 4-16
4.3.2 Network analysis results ........................................................................... 4-18
4.3.3 Conclusion ............................................................................................... 4-27
Chapter 5 Priority Potential Projects
5.1 Outline of thermal power plants in Uzbekistan ...................................................... 5-1
5.2 Overall condition of priority potential project sites ............................................... 5-4
5.2.1 Navoi TPP ................................................................................................ 5-5
5.2.2 Talimardjan TPP ....................................................................................... 5-10
5.2.3 Syrdarya TPP............................................................................................ 5-14
5.2.4 Turakurgan TPP (construction place) ........................................................ 5-19
5.2.5 Tashkent TPP ........................................................................................... 5-22
5.2.6 Angren TPP .............................................................................................. 5-27
5.2.7 Novo-Angren TPP .................................................................................... 5-32
5.2.8 Tashkent CHP........................................................................................... 5-37
5.2.9 Mubarek CHP ........................................................................................... 5-41
5.2.10 Fergana CHP ............................................................................................ 5-45
5.3 Evaluation of priority potential project sites ......................................................... 5-49
5.4 Selection of priority projects................................................................................. 5-52
Chapter 6 Investment Plan
6.1 Investment program, which is based on the power development plan ..................... 6-1
6.2 Financing plan ...................................................................................................... 6-3
iii
Chapter 7 Environmental and Social Considerations
7.1 Strategic Environmental Assessment (SEA) .......................................................... 7-1
7.1.1 Laws, regulations and organizations related to
Environmental and Social Considerations .......................................................... 7-1
7.1.2 Relevant organizations ...................................................................................... 7-19
7.1.3 Current Status of Environment and Society ....................................................... 7-21
7.1.4 Examination of alternatives to the power development plan ............................... 7-28
7.1.5 Mitigation measures on assumed environmental and social impacts ................... 7-30
7.1.6 Examination of monitoring structure at the planning stage ................................. 7-31
7.2 Scoping on Priority Projects ................................................................................. 7-32
7.2.1 Outline of priority projects ................................................................................ 7-32
7.2.2 Result of scoping on priority projects ................................................................ 7-33
7.2.3 Recommendation of monitoring structure and monitoring method ..................... 7-35
7.3 Stakeholders’ Meeting .......................................................................................... 7-38
7.3.1 Objective of the Stakeholders’ Meeting ............................................................. 7-38
7.3.2 Result of the Stakeholders’ Meeting .................................................................. 7-38

Power network map of the Republic of Uzbekistan
Area b
”Area b”
”Area a”
Area a
Source: Prepared by JICA Study Team on the basis of materials provided by Uzbekenergo JSC

LIST OF FIGURES AND TABLES
Chapter 1
Figure 1.2-1 Flow of power development concept planning ........................................................... 1-2
Figure 1.2-2 Flow of network development planning ..................................................................... 1-3
Chapter 2
Figure 2.1-1 Primary energy production and consumption ............................................................. 2-2
Figure 2.1-2 Natural gas production and consumption ................................................................... 2-2
Figure 2.1-3 Primary energy consumption intensity in terms of GDP ............................................. 2-3
Figure 2.1-4 Primary energy consumption structure of neighboring countries by fuel type (%,
as of 2013) ................................................................................................................. 2-4
Figure 2.1-5 Fossil fuel reserves structure ...................................................................................... 2-5
Figure 2.1-6 Recoverablef fossil fuel (as of 2012) .......................................................................... 2-6
Figure 2.2-1 Energy supply and demand structure (natural gas) ..................................................... 2-8
Figure 2.2-2 Natural gas demand forecast except to generate power and exports ........................... 2-9
Figure 2.2-3 Prediction of natural gas production ......................................................................... 2-10
Figure 2.2-4 Supply potential of natural gas to generate power and export ................................... 2-12
Figure 2.2-5 Comparison of recoverable years ............................................................................. 2-14
Figure 2.3-1 Coal production, consumption and import................................................................ 2-17
Figure 2.3-2 Comparison of coal production data between IEA and Uzbekugol ........................... 2-17
Figure 2.3-3 Energy supply and demand structure (coal) .............................................................. 2-18
Figure 2.3-4 Coal demand forecast except to generate power ....................................................... 2-19
Figure 2.3-5 Coal production prediction (Part 1) .......................................................................... 2-20
Figure 2.3-6 Coal production prediction (Part 2) .......................................................................... 2-21
Figure 2.3-7 Supply potential of coal to generate power ............................................................... 2-22
Figure 2.3-8 Comparison between coal power generation demand and its supply potential .......... 2-23
Figure 2.4-1 Global horizontal irradiation map ............................................................................. 2-25
Table 2.1-1 Fossil fuel reserves ..................................................................................................... 2-4
Table 2.2-1 Maximum and minimum values of natural gas production prediction ...................... 2-11
Table 2.4-1 Power mix (actual record and planning) ................................................................... 2-24
Chapter 3
Figure 3.1-1 Flowchart of WASP-IV ............................................................................................. 3-4
Figure 3.2.1-1 Structure of Model ..................................................................................................... 3-5
Figure 3.2.1-2 Simulation Result Comparison by Case (2013, 2020, 2030)..................................... 3-14
Figure 3.2.1-3 Peak Demand Forecast ............................................................................................. 3-18
Figure 3.2.2-1 Daily Load for Typical Summer and Winter Day ..................................................... 3-19
Figure 3.2.2-2 Load Duration Curve of Uzbekistan Power System (as proposed by the Study Team) ......... 3-19
Figure 3.4.1-1 Part-load Relative Efficiency of Gas-fired Conventional Power Plant ...................... 3-28

Figure 3.5-1 Volume of possible natural gas supply for power generation and export .................. 3-30
Figure 3.5-1 Comparison of peak demand by regions and volume of generated capacity ............. 3-32
Figure 3.5-2 Peak demand/generation capacity ratio by regions ................................................... 3-33
Figure 3.6-1 Comparison of LOLP in Uzbekenergo JSC s Plan and JICA Review Plan ............. 3-35
Figure 3.6-2 Addition of Generation Capacity for Each Year from 2021 till 2030 ........................ 3-35
Figure 3.6-3 Generation Capacity and Peak Demand by Regions in 2021 .................................... 3-36
Table 3.1-1 The Power Development Plan up to 2030, developed by Uzbekenergo JSC (including
renovation of existing hydropower plants) ...................................................................... 3-2
Table 3.2.1-1 Population Projection of Uzbekistan (2014 - 2030) .................................................... 3-7
Table 3.2.1-2 Uzbekistan Macro Economy Sub-model Simulation Results
(Base Case and Saving Case, 2013 - 2030) ................................................................ 3-9
Table 3.2.1-3 Forecast of Final Electric Power Demand by Sector in Uzbekistan
(Base Case, 2013 - 2030) ......................................................................................... 3-11
Table 3.2.1-4 Forecast results for Electric Power Demand by Provinces / Regions
(Base Case, 2013 - 2030) ......................................................................................... 3-12
Table 3.2.1-6 Forecast of Final Electric Power Demand by Sector in Uzbekistan
(Saving Case, 2013 - 2030) ...................................................................................... 3-14
Table 3.2.1-7 Forecast results for Electric Power Demand by Provinces / Regions
(Saving Case, 2013 - 2030) ...................................................................................... 3-14
Table 3.2.1-9 Macro Economy Sub-model Simulation Result
(Low Case, 2013 - 2030) .......................................................................................... 3-16
Table 3.2.1-10 Forecast of Final Electric Power Demand of Uzbekistan
(Low Case, 2013 - 2030) .......................................................................................... 3-16
Table 3.2.1-11 Forecast results for Electric Power Demand by Provinces /
Regions (Low Case, 2013 - 2030) ............................................................................ 3-17
Table 3.2.1-12 Comparison of Power Demand Forecast .................................................................. 3-17
Table 3.2.4-1 Power plant construction: projects already under way .............................................. 3-20
Table 3.2.5-1 SJSC Uzbekenergo JSC – Existing plants decommission plan ................................. 3-20
Table 3.2.6-1 Basic Characteristics of thermal power plants, proposed as development candidates ...... 3-21
Table 3.2.6-2 Basic characteristics of hydropower plants, proposed as development candidates ............. 3-22
Table 3.2.7-1 Fuel prices ................................................................................................................ 3-22
Table 3.4.1-1 Comparison of power development scenarios .......................................................... 3-24
Table 3.4.1-2 Economic comparison of power development scenarios .......................................... 3-24
Table 3.4.1-3 Types of power system adjustment .......................................................................... 3-25
Table 3.4.1-4 Types of power reserve ............................................................................................ 3-26
Table 3.4.1-5 Power output adjustment range and power output change rate at TPP ...................... 3-27
Table 3.4.2-1 Natural gas consumption for each power development scenario............................... 3-28
Table 3.4.2-2 Gas consumption per unit of electric energy for each power development scenario .......... 3-28
Table 3.4.2-3 Volume of gas saved for each power development scenario
(comparison with Base mode in 2015) ..................................................................... 3-29
Table 3.5-1 Comparison of Power Development Plans ............................................................... 3-31
Table 3.6-1 Power Development Concept Review Results.......................................................... 3-34
Table 3.6-2 Generation Capacity/ Peak Demand Ratio by Regions in 2021 .............................. 3-36
Chapter 4
Figure 4.2.1.1 Areawise networks in Uzbekistan .............................................................................. 4-2
Figure 4.2.1.2 Distribution chart of load and generation ................................................................... 4-3
Figure 4.2.1.3 Proportional comparison of load and generation ........................................................ 4-3
Figure 4.2.4.1 Network development plan (220 kV, 500 kV facility) .............................................. 4-13
Figure 4.3.1.1 Network configuration of the original data ............................................................... 4-17
Figure 4.3.2.1 Power flow in winter of 2020 ................................................................................... 4-21
Figure 4.3.2.2 Power flow in summer of 2020 ................................................................................ 4-22
Figure 4.3.2.3 Fault current in 2020 ................................................................................................ 4-25
Figure 4.3.2.4 Generator internal voltage angle fluctuation ............................................................. 4-27
Table 4.2.2.1 Transmitting capacity of lines .................................................................................... 4-4
Table 4.2.2.2 Short time capacity of transformers ............................................................................ 4-4
Table 4.2.3-1 Voltage classes and stretch of electric grids for each voltage class in Uzbekistan ................ 4-5
Table 4.2.3-2 (1) Metal transmission line towers (220 kV) .................................................................... 4-6
Table 4.2.3-2 (2) Metal transmission line towers (500 kV) .................................................................... 4-6
Table 4.2.3-3 Parameters of electric condition in Uzbekistan ........................................................... 4-8
Table 4.2.3-4 Standards for safe distances from high voltage lines .................................................. 4-8
Table 4.2.4.1 Network development plan (220 kV, 500 kV facility) .............................................. 4-10
Table 4.3.2.1 Maximum power flow and utilization rate ................................................................ 4-18
Table 4.3.2.2 Power flow under single contingency condition (N-1 condition) .............................. 4-19
Table 4.3.2.3 220 kV substation below 90% voltage ................................................................... 4-23
Table 4.3.2.4 Fault current ............................................................................................................. 4-24
Table 4.3.2.5 Cases for stability study ........................................................................................... 4-26
Chapter 5
Figure 5.2.1-1 Location of Navoi TPP............................................................................................... 5-5
Figure 5.2.1-2 Potential project sites for construction of GTCC3 of Navoi TPP ................................ 5-7
Figure 5.2.2-1 Location of Talimardjan TPP ................................................................................... 5-10
Figure 5.2.3-1 Location of Syrdarya TPP ........................................................................................ 5-14
Figure 5.2.3-2 Layout drawing of units No.1 and No.2 ................................................................... 5-16
Figure 5.2.4-1 Location of Turakurgan TPP .................................................................................... 5-19
Figure 5.2.5-1 Location of Tashkent TPP ........................................................................................ 5-22
Figure 5.2.5-2 Potential project sites for construction of GTCC2 of Tashkent TPP ......................... 5-24
Figure 5.2.6-1 Location of Angren TPP .......................................................................................... 5-27
Figure 5.2.6-2 Planned construction sites of 150 MW unit at Angren TPP ...................................... 5-29
Figure 5.2.7-1 Location of Novo-Angren TPP ................................................................................ 5-32

Figure 5.2.7-2 Planned construction site for unit No.8 of Novo-Angren TPP .................................. 5-34
Figure 5.2.8-1 Location of Tashkent CHP ..................................................................................... 5-37
Figure 5.2.8-2 Planned construction site for GTCS No.2 and No.3 ................................................. 5-38
Figure 5.2.9-1 Location of Mubarek CHP ..................................................................................... 5-41
Figure 5.2.9-2 Planned construction site for construction of GTCS at Mubarek CHP ..................... 5-42
Figure 5.2.10-1 Location of Fergana CHP ......................................................................................... 5-45
Figure 5.2.10-2 Fergana CHP, placement plan of new equipment ..................................................... 5-46
Figure 5.4-1 The ratio of generation capacity to electricity demand by regions and
power development concept ..................................................................................... 5-53
Figure 5.4-2 The ratio of generation capacity to electricity demand by regions in case of
absence of the unit No. 3 of Navoi TPP and the unit No. 3 of Turakurgan TPP ........ 5-54
Table 5.1-1 Efficiency of gas thermal power plants Efficiency of generating side
(based on calculation of low calorific value) (%) ....................................................... 5-1
Table 5.1-2 Uzbekenergo JSC Thermal power plants (including CHP) ......................................... 5-2
Table 5.2-1 The concept of development of electric power industry until 2030 by
Uzbekenergo JSC (TPP&CHP) .................................................................................. 5-4
Table 5.3-1 Evaluation of priority potential project sites ............................................................. 5-50
Chapter 6
Figure 6.2-1 Changes in total loan amount ................................................................................... 6-4
Figure 6.2-2 Amount of interest payments during construction ...................................................... 6-5
Table 6.2-1 Investment plan based on the power development plan .............................................. 6-6
Table 6.2-2 Volume of power supply, the revenues based on the power development
plan and loan repayment plan ..................................................................................... 6-9
Chapter 7
Figure 7.1.1-1 Procedure of EIA in Uzbekistan ................................................................................. 7-5
Figure 7.1.2-1 Organizational Structure of Uzbekenergo JSC ......................................................... 7-20
Figure 7.1.3-1 Geographical configuration of Uzbekistan ............................................................... 7-21
Figure 7.1.3-2 Hydrological map of Uzbekistan and neighboring countries .................................... 7-23
Figure 7.1.3-3 Location of nature reserve and ecological center in Uzbekistan ............................... 7-25
Table 7.1.1-1 EIA procedure difference by category ........................................................................ 7-3
Table 7.1.1-2 Regulation of Hazard Contents of the Main Pollutants Generated by
Thermal Power Plants (MPC) .................................................................................. 7-11
Table 7.1.1-3 Quotas of Polluting Substances emitted in the atmosphere by enterprises ................ 7-12
Table 7.1.1-4 Standard on Pollutant Concentrations in Emissions .................................................. 7-12
Table 7.1.1-5 Environmental Standard for Surface Water Protection ............................................. 7-13
Table 7.1.1-6 Maximum Permissible Concentration (MPC) of Pollutants in Surface
Water ....................................................................................................................... 7-14
Table 7.1.1-7 Environmental standard for noise (residential area) .................................................. 7-15
Table 7.1.1-8 DB sound pressure levels in octave bands with frequency in Hz .............................. 7-15

Table 7.1.1-9 Hazard class of waste ............................................................................................... 7-16
Table 7.1.1-10 Comparison between JICA Guideline/WB Safeguard Policy and
Uzbekistan EIA Laws .............................................................................................. 7-17
Table 7.1.2-1 Administration List
(corresponding to the above organizational structure) .............................................. 7-20
Table 7.1.3-1 Monthly average temperatures in Uzbekistan by Province/Republic ........................ 7-22
Table 7.1.3-2 Monthly average precipitation in Uzbekistan by Province/Republic ........................ 7-22
Table 7.1.3-3 List of Critically Endangered (CR) and Endangered (EN) species in
Uzbekistan ............................................................................................................... 7-24
Table 7.1.3-4 Current status of population and social conditions of Uzbekistan by City,
Province and Republic ............................................................................................. 7-27
Table 7.1.4-1 Comparison of power development scenarios (same as Table 3.4.1-1) ..................... 7-28
Table 7.1.4-2 Scoping on the Power Development Plan ................................................................. 7-29
Table 7.1.4-3 Evaluation of development scenarios ....................................................................... 7-30
Table 7.1.5-1 Expected measures for avoidance/mitigation at the planning stage........................... 7-31
Table 7.2.1-1 Outline of priority projects (extracted from Chapter 5)............................................. 7-32
Table 7.2.2-1 Scoping table ........................................................................................................... 7-33
Table 7.2.3-1 Expected monitoring methods and responsible organizations ................................... 7-36
ABBREVIATIONS
ADB Asian Development Bank
AS Steel-Aluminum
ASO Steel-Aluminum Lightweight structure
ASTM American Society for Testing and Materials
BAU Business As Usual
BP British Petroleum
CEB Ceylon Electricity Board
CHP Combined Heat and Power Plants
DSS Daily Start and Stop
EIA U. S. Energy Information Administration
EIA Environmental Impact Assessment
F/S Feasibility Study
FAO Food and Agriculture Organization
GDE Gross Domestic Expenditure
GDP Gross Domestic Product
GTCC Gas Turbine Combined Cycle
GTCS Gas Turbine Cogeneration System
GTG Gas Turbine Generator
HPP Hydro Power Plant
IAEA International Atomic Energy Agency
IEA International Energy Agency
IFMR Institute of Forecasting and Macroeconomic Research
IMF International Monetary Fund
JICA Japan International Cooperation Agency
JSC Joint-Stock Company
L/A Loan Agreement
LFC Load Frequency Control
LOLP Loss Of Load Probability
NDC National Dispatch Center
NEDO New Energy and Industrial Technology Development Organization
NERC North American Electric Reliability Corporation
NPV Net Present Value
PLN Perusahaan Listrik Negara
PTE Pravila Tekhnicheskoy Ekspluatatsii Elektricheskikh Stantsiy i Setey
[Rules of technical operation of power plants and grids]
PUE Pravila Ustroystva Elektroustanovok [Rules for electric installations]
R/P ratio Reserves to Production Ratio

SPES Spravochnik po Proyektirovaniyu Elektricheskikh Setey
[Handbook for designing of electrical grids]
UFRD Uzbekistan Fund for Reconstruction and Development
UNSTAT United Nations Statistics Division
WASP Wien Automatic System Planning package, version-IV
WSS Weekly Start and Stop

Chapter 1 Review of the Power Development
Concept

1-1
Chapter 1 Review of the Power Development Concept
1.1 The content of the power development concept
The power development concept for the next 16 years, from 2015 to 2030, proposes a power
development model that meets the energy demand and requirements for power supply reliability and
which is based on minimum cost requirements. This model comprises development projects based on
the scope of works and generation capacities for each year.
Unlike the common Master Plan for power development, the power development concept used
within the framework of this Study does not provide for simultaneous implementation of the power
development plan. Therefore, in the absence of system restrictions, the plan will be prepared based
on minimum cost requirements. Accordingly, prior to implementing the proposed power development
concept, it is recommended to perform power system analysis and ensure that no problems in the
system will be used. In case any problems occur, it is advisable to take the necessary measures to
expand the system.
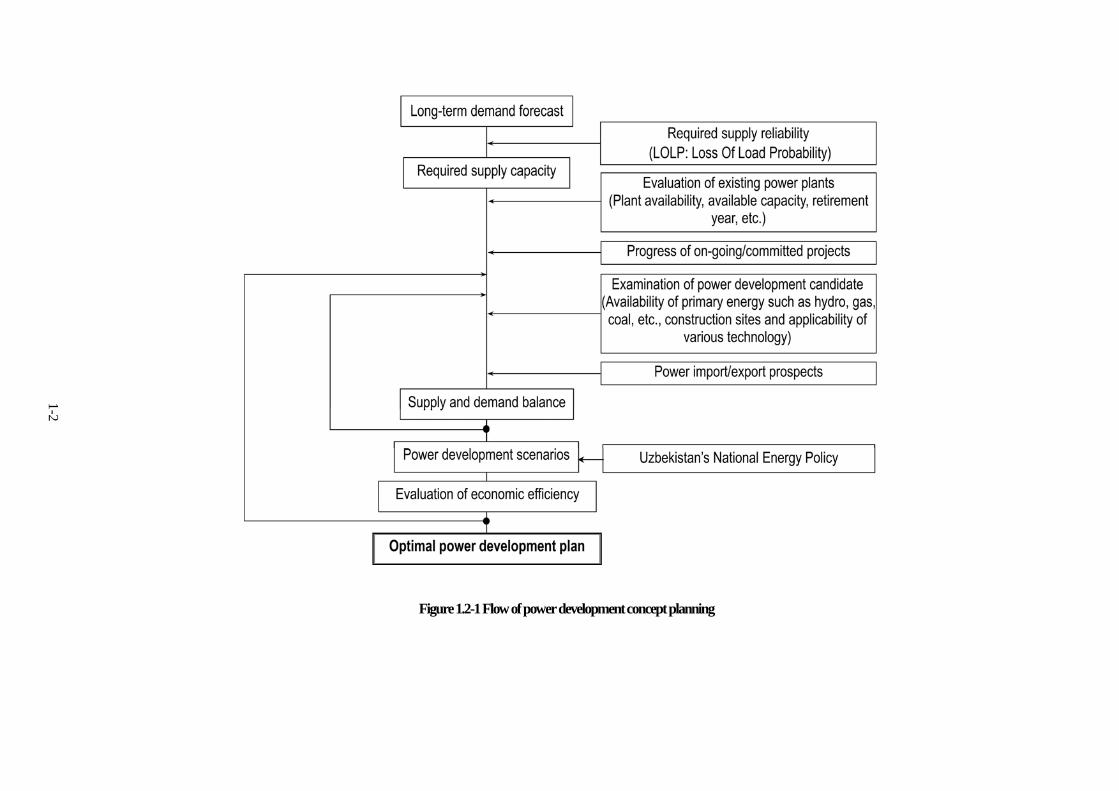
1.2 Flow of the power development concept planning.
The flow of the power development concept planning is shown in Figure 1.2-1.
1-2
Figure 1.2-1 Flow of power development concept planning
1-3
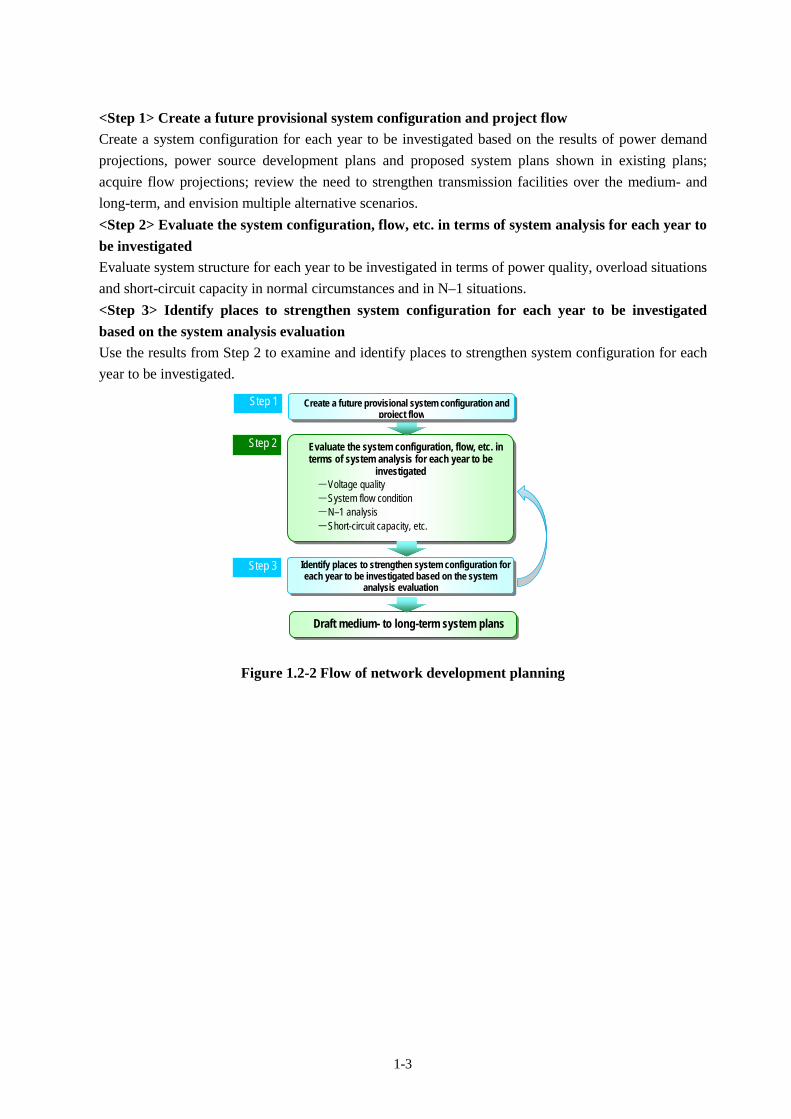
<Step 1> Create a future provisional system configuration and project flow
Create a system configuration for each year to be investigated based on the results of power demand
projections, power source development plans and proposed system plans shown in existing plans;
acquire flow projections; review the need to strengthen transmission facilities over the medium- and
long-term, and envision multiple alternative scenarios.
<Step 2> Evaluate the system configuration, flow, etc. in terms of system analysis for each year to
be investigated
Evaluate system structure for each year to be investigated in terms of power quality, overload situations
and short-circuit capacity in normal circumstances and in N–1 situations.
<Step 3> Identify places to strengthen system configuration for each year to be investigated
based on the system analysis evaluation
Use the results from Step 2 to examine and identify places to strengthen system configuration for each
year to be investigated.
Figure 1.2-2 Flow of network development planning
Evaluate the system configuration, flow, etc. in terms of system analysis for each year to be
investigated -Voltage quality -System flow condition -N–1 analysis -Short-circuit capacity, etc.
Draft medium- to long-term system plans
Step 1
Step 3
Step 2
Create a future provisional system configuration and project flow
Identify places to strengthen system configuration for each year to be investigated based on the system
analysis evaluation

Chapter 2 Fuel Supply Plan

2-1
Chapter 2 Fuel Supply Plan 2.1 Overview of primary energy
This Chapter looks at whether natural gas and coal can be supplied stably as fuels required to meet
the power source development plan up to 2030, as prepared by Uzbekenergo JSC. First, the supply
and demand situation on primary energy and reserves are reviewed, whereupon the status of natural
gas and coal in primary energy are investigated to confirm the supply potential of natural gas and
coal used to generate power.
(1) Supply and demand situations on primary energy
The supply and demand situations, etc. of all primary energy sources, including oil, coal as well
as natural gas, are to be reviewed using mainly IEA and BP data sources in which relatively
substantial data are available. This is because it was impossible to obtain information and data on
natural gas and oil from Uzbekistan directly. The reliability and accuracy of the data was inspected
as follows:
Firstly natural gas - IEA’s data on fuel consumption to generate power and those on fuel purchase
obtained from Uzbekenergo JSC were compared. The average deviation was as low as 1.6% for the
9 years from 2004 to 2012 between both data for natural gas, meaning there is no problem to utilize
IEA’s data. Though the data of BP and EIA differed slightly from those of the IEA, the average
deviation between the data of IEA and BP was 8.6 % and that between the data of IEA and EIA was
0.6 %1, when data for 13 years from 2000 to 2012 were compared.
Data for Uzbekenergo JSC and the IEA were also compared for oil and coal as well as natural gas
and it emerged that the average deviation over 9 years was 25.9 % for oil and 3.3 % for coal.
According to Uzbekenergo JSC data, however, the average proportional purchase volume of oil and
coal against natural gas was as small as 3.7 and 8.3 % respectively in terms of calorific value.
Accordingly, even in the event of a significant deviation2 for oil and coal (data on coal matches
considerably well between IEA and Uzbekenergo JSC), the impacts in terms of a deviation of total
energy are relatively smaller than the impact of natural gas.
Figure 2.1-1 represents the primary energy production and consumption in Uzbekistan (the latter
of which is equal to primary energy supply.) According to Figure 2.1-1, production exceeds
consumption, which means that Uzbekistan has export potential as far as primary energy is
concerned. Though primary energy production increased slightly up to 2008, it decreased to level in
2004 to 2006 after that year. Primary energy consumption also showed slight growth from 2000 to
2002, but decreased continuously until 2010, before growing again, although fluctuating slightly
since 2002. Figure 2.1-2 represents the production and consumption of natural gas that comprises
the largest share of primary energy. Natural gas is also a self-sufficient and exportable resource.
1 EIA data are basically quoted from IEA data. 2 Since oil consumption is as small as 3.7 % compared with natural gas consumption (in terms of calorific value), the
deviation would increase when estimated with accuracy equivalent to that of natural gas consumption.
2-2
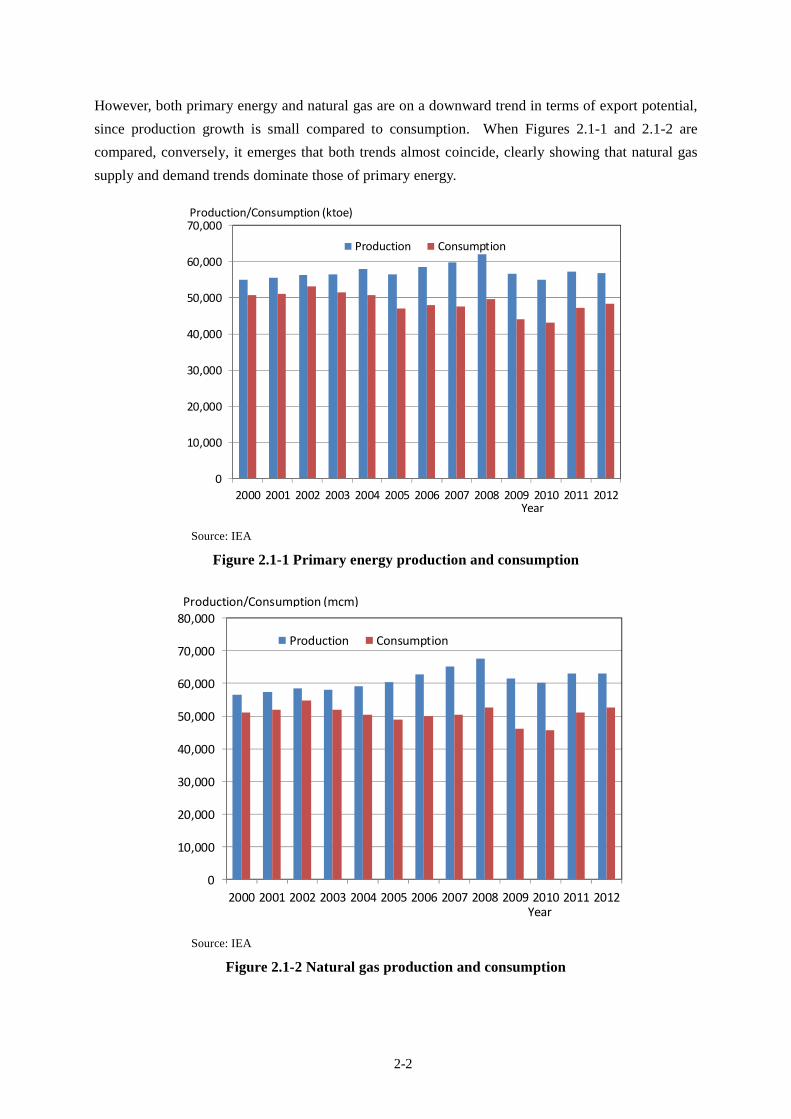
However, both primary energy and natural gas are on a downward trend in terms of export potential,
since production growth is small compared to consumption. When Figures 2.1-1 and 2.1-2 are
compared, conversely, it emerges that both trends almost coincide, clearly showing that natural gas
supply and demand trends dominate those of primary energy.
Source: IEA
Figure 2.1-1 Primary energy production and consumption
Source: IEA
Figure 2.1-2 Natural gas production and consumption
0
10,000
20,000
30,000
40,000
50,000
60,000
70,000
2000 2001 2002 2003 2004 2005 2006 2007 2008 2009 2010 2011 2012
Production Consumption
Production/Consumption (ktoe)
Year
0
10,000
20,000
30,000
40,000
50,000
60,000
70,000
80,000
2000 2001 2002 2003 2004 2005 2006 2007 2008 2009 2010 2011 2012
Production Consumption
Production/Consumption (mcm)
Year

2-3
Figure 2.1-3 represents primary energy consumption intensity in terms of GDP (primary energy
consumption divided by GDP3) to determine the economic efficiency of primary energy consumption
compared to neighboring countries, including Japan. Although the previous energy consumption
intensity in Uzbekistan was extremely high compared to neighboring countries, it has declined
significantly since 2000. It is considered that such decline was attributable to a history in which the
share of primary industry represented by cotton growing with low added value, left over from the
planned economy during the USSR period, remained high in the early 2000s, whereupon the shares
of secondary and tertiary industries with relatively high added value have increased.
Source: JICA study team based on data from BP and the World Bank
Figure 2.1-3 Primary energy consumption intensity in terms of GDP
Figure 2.1-4 represents primary energy consumption structure by fuel type compared to that
among neighboring countries. It is clear that Uzbekistan is significantly dependent on natural gas
compared to neighboring countries.
3 Real GDP in year 2005 US dollars
0
1,000
2,000
3,000
4,000
5,000
6,000
2000 2001 2002 2003 2004 2005 2006 2007 2008 2009 2010 2011 2012 2013
Kazakhstan Turkmenistan Uzbekistan Japan
Primary Energy Consumption Intensity (ktoe/million US$)
year

2-4
Source: BP
Figure 2.1-4 Primary energy consumption structure of neighboring countries by fuel type
( %, as of 2013)
(2) Energy reserves situation
Table 2.1-1 represents the oil, natural gas and coal reserves in Uzbekistan. According to this table,
data of the World Bank and BP coincide for oil and coal but data of BP show a far lower figure
compared to the World Bank data for natural gas. As the data of the World Bank coincide with that
of the IEA as widely quoted by international energy research organizations, etc., the data of the
World Bank will be utilized hereinafter for natural gas reserves.
Table 2.1-1 Fossil fuel reserves
Organization Year Fuel type Unit Proven reserves
Estimated undiscovered
reserves
World Bank 2012
Oil million bbl 594 5,700
Natural gas billion cm 1,841 4,000
Coal million ton 1,900 4,700
BP 2014
Oil million bbl 594 -
Natural gas billion cm 1,086 -
Coal million ton 1,900 -
Source: World Bank and BP
21.9
22.3
23.9
7.0
53.2
16.6
76.1
85.1
13.4
58.2
2.5
5.6
‐
5.9
3.0
5.4
^
‐
‐
‐
RUSSIA
KAZAKHSTAN
TURKMENISTAN
UZBEKISTAN
Oil Natural gas Coal Nuclear Hydro Renewable

2-5
Figure 2.1-5 represents the structure of these reserves in terms of calorific value. According to
2.1-5, although the share of natural gas is as much as 77 %, it should be noted that the share of coal
reaches 19 %4 and that of oil is as small as 4 %.
Source: Prepared by the JICA study team based on World Bank data
Figure 2.1-5 Fossil fuel reserves structure
(3) Supply potential of primary energy
Next, it is investigated whether or not natural gas, oil and coal have supply potential as fuels to
generate power. Figure 2.1-6 represents the recoverable years of oil, natural gas and coal as of 2012.
Recoverable yeas (R/P ratio) refer to the figure obtained by dividing reserves by production in a
certain year and is the figure dictating the number of years for which production will be able to
continue as of that time.
As reserves increase when new oil, gas and coal fields are developed or technology progresses, the
years shown in Figure 2.1-6 do not necessarily indicate the actual number of years within which
resources will be exhausted but are guideline figures. Accordingly, it is clear that lignite has
sufficient potential in terms of a resource as far as recoverable years are concerned.
4 According to BP, the breakdown of proven reserves for coal of 1,900 million tons comprises 47 million tons of anthracite
and bituminous coal and 1,853 million tons of sub-bituminous and lignite coal. As only the latter is used to generate power, the latter will be treated as proven reserves of coal to generate power.
77%
4%
19%
Natural Gas Oil Coal

2-6
Source: Prepared by the JICA study team based on data from the World Bank, IEA and Uzbekgol
Figure 2.1-6 Recoverable period of fossil fuel (as of 2012)
2.2 Supply potential of natural gas to generate power
(1) Investigation of the supply potential of natural gas to generate power and its evaluation
method
In this section, the following procedures are to be applied to investigate and evaluate the supply
potential of the fuel to generate power (natural gas in this section) in future:
i. Natural gas demand in the transformation sector except power generation (including heat and
power generation) and final energy consumption sector is to be predicted.
ii. Demand except power generation and export and possible production are to be compared,
whereupon the possible supply volume of natural gas allocable to generate power is to be
investigated and evaluated.
iii. Assuming that the natural gas production applied to item ii above is to be determined based
on the protection facility capacity rather than demand, information required to predict
production is sought, whereupon investigation and evaluation will be conducted by analyzing
said information.
iv. Whether or not natural gas resources that guarantee future production exist as proven
reserves will be investigated and evaluated, when natural gas production is made by the
volume investigated and predicted on item iii above.
However as the information and data on natural gas are classified as confidential and unavailable,
the following investigation and evaluation are approximated.
24 29.3
496
0
100
200
300
400
500
600
Oil Natural gas Coal (lignite)
Year
2-7
(2) Natural gas demand forecast
Natural gas demand forecast is to be undertaken by integrating the natural gas demand
econometrics model into power demand econometrics model for three cases comprising Base, Saving
and Low Cases set for forecasting a power demand. Base case is that in which a forecast is made,
assuming the economic growth rate in Uzbekistan is to be increased to 8-something percent by
implementing an expanded fiscal policy on a continuous basis and maintaining average annual
growth of 13.5 % in terms of government expenditures until 2030. Saving Case is that in which a
forecast is to be made assuming considerable energy conservation potential for the Base Case, given
the high energy consumption intensity in Uzbekistan as shown by Figure 2.1-3. Low Case is that in
which a forecast is to be made assuming current economic, social and energy consumption structure
changes based on past records as the so-called BAU Case. In this section, the natural gas demand
forecast was made based on the Base Case forecast result, which leads to energy consumption
peaking (annual growth rate of power demand is 3.6 %.) As other cases result in smaller power
demand growth than the Base Case and lower natural gas demand, the total natural gas demand does
not exceed that of the Base Case, meaning issues concerning the natural gas supply are less serious
compared to the Base Case.
Natural gas demand in all sectors except power generation and export is equal to that in the final
energy consumption and transformation sectors, except for the power generation sector. According
to the IEA energy balance table, the energy consumption structure concerning natural gas and coal in
Uzbekistan comprises five items, namely power generation plants, combined heat and power (CHP)
plants, heat supply plants, energy industry own use and losses. Among them, four items except heat
supply are summarized in the power generation sector5.
Consequently, natural gas demand in the transformation sector, except that used to generate power,
is equal to that of heat supply plants. Accordingly, the natural gas to be allocated to generate power
and export can be obtained by deducting the consumption in the final energy consumption sector and
heat supply plants from primary energy consumption. This structure is represented in Figure 2.2-1.
5 In a strict sense, energy industry own use includes that at heat supply plants but as its share is considered small compared with that at power generation and CHP plants, all the own use is assumed to be included in the power generation sector only.

2-8
Primary Energy Production
Primary Energy Consumption Export
Energy Consumption at Final Energy Transformation Sector Consumption
Transformation Sector
Power Generation except Power Generation
Sector (Heat Supply Sector)
Source: JICA study team
Figure 2.2-1 Energy supply and demand structure (natural gas)
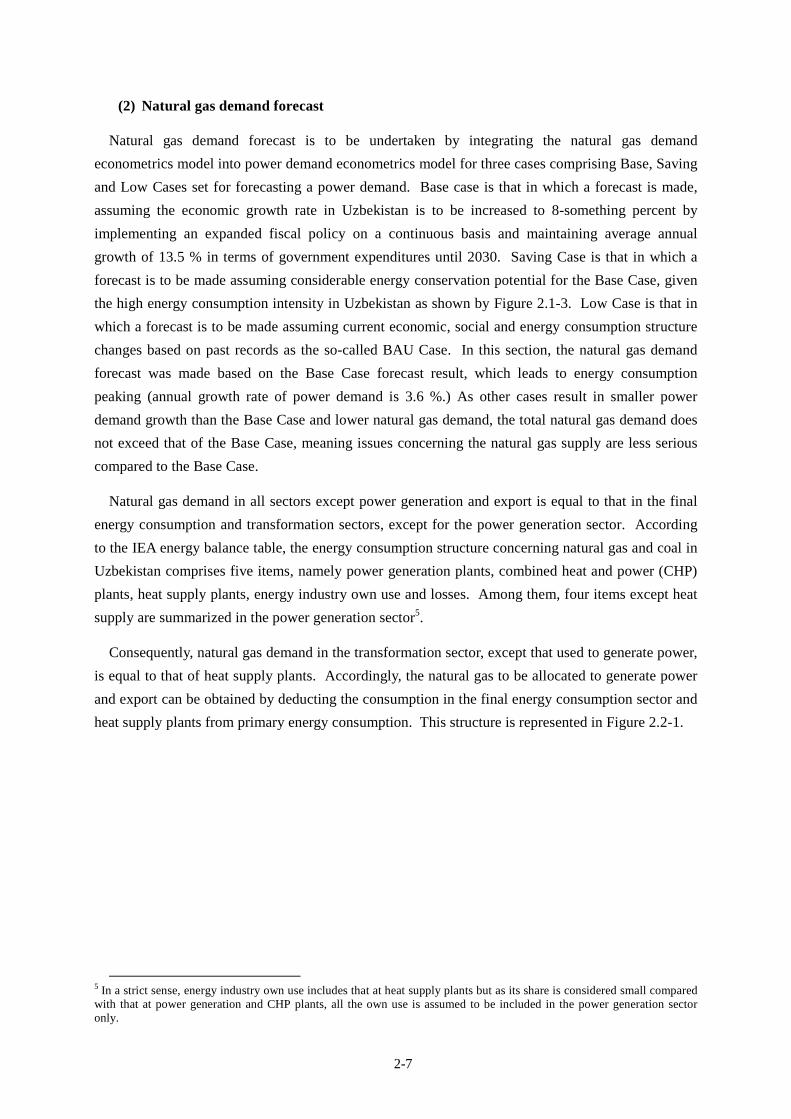
Figure 2.2-2 represents the natural gas demand forecast, except to generate power and exports,
which was obtained using the same assumptions, preconditions, etc. as those for the Base Case of
the power demand forecast model (original model) described on Section 3.2.1 in Chapter 3 and by
incorporating the fuel demand forecast model into the original model. The assumptions and
preconditions comprise three items, namely the population, foreign and government factors. As the
population factor, the growth rate in the United Nations Population Prospect result is introduced into
the model, since fluctuations in population affect energy supply and demand. The foreign factor
mainly comprises economic trends in trading partner countries, exchange rates and international
energy prices. The economic trend in trading partner countries affects imports and exports of
Uzbekistan and consequently also affects energy supply and demand. Since the share of imports and
exports with Russia and China is large, economic growth in both countries is integrated into the
model. Since exchange rates and international energy prices are important factors to evaluate
domestic energy price and energy price taking the exchange rate into consideration and energy
supply and demand are closely interrelated, these factors are also integrated into the model.
2-9
Source: JICA study team
Figure 2.2-2 Natural gas demand forecast except to generate power and exports
The government factor is key for the model analysis and energy supply and demand are closely
related to economic growth. Since government financial expenditure is an effective macro-economic
political measure for Uzbekistan’s economy and government expenditure and investigation drive
economic growth, these are integrated into the model as variables. An energy supply demand
forecast is implemented assuming the economic growth of 8- something percent is maintained by
changing the government expenditure and investigation as variables (refer to footnote15.)
Natural gas production prediction is necessary to investigate and evaluate the supply potential as
described below. In this chapter, the supply potential of natural gas to generate power until 2030 is
investigated and evaluated, but investigation on supply potential for 2030 onward is limited within
qualitative terms without any quantity.
(3) Natural gas production prediction
Natural gas production is influenced by the introduction of new gas fields and decreased
productivity due to ongoing depletion in old fields, etc. It is not impossible to build an econometrics-
based forecast model, in which these factors are taken into consideration. However, information and
data for forecasting such production capacity are insufficient and classified as confidential, making it
impossible to evaluate with guaranteed accuracy. Accordingly, an evaluation was made using
information announced on production capacity. The following information on the production
capacity or amount has been announced to date:
20
22
24
26
28
30
32
34
36
38
40
2005 2010 2015 2020 2025 2030
Heat Supply Plants Final Energy Consumption Sector
Actual
Natural Gas Demand (bcm)
Forecast
year

2-10
i. According to Uzbekneftegas, Uzbekistan intends to increase natural gas production to 66
bcm by 20206 (production in 2012 was 62.9 bcm)
ii. According to Eagle ford formation, recently (as of 29 December, 2013) the capacity of
Uzbekneftegas allowed it to produce around 70 bcm of natural gas7
iii. According to ADB, intensified exploration and production efforts in the southwestern Gazli
region will boost natural gas production, from 60 bcm in 2010 to 71 bcm in 2015 and 80 bcm
in 20358
While item iii covers the period from 2010 to 2035, items i and ii cover only a partial period,
namely item i - from 2012 to 2020 and item ii - as of 2013 (actual capacity enhancement considered
to be implemented slightly later.) Accordingly, it was assumed that for item i, the same annual
growth rate from 2012 to 2020 would apply to that of the period until 2035 and for item ii, increased
production would also apply to that of the same period. Namely, it is assumed that the production
will increase by 0.39 bcm annually from 2020 to 2035 for item i and production will remain at a
constant 71 bcm up to 2035. The year-to-year production for these three cases is compared and the
maximum and minimum levels in each year are sought. Figure 2.2-3 represents the predicted
maximum and minimum production levels.
Source: JICA study team
Figure 2.2-3 Prediction of natural gas production
6 Natural Gas Asia, http://www.naturalgasasia.com/uzbekistan-expects-gas-output-to-reach-66-bcm-by-2020-12478 7 https://eaglefordtexas.com/news/id/89/oil-gas-uzbekistan/ 8 Energy Outlook for Asia and the Pacific, October 2013, ADB
50.0
55.0
60.0
65.0
70.0
75.0
80.0
85.0
90.0
2010 2015 2020 2025 2030 2035
Min Max
Natural Gas Production (bcm)
year
2-11
Production in 2015 is predicted to be 71 bcm but as production in 2012 was 62.9 bcm, it means
that the production increases by 8.1 bcm only for three years. According to Figure 2.1-2, as
production increased by 7.3 bcm from 60.3 bcm in 2005 to 67.6 bcm in 2008, a production increase
of 8.1 bcm seems achievable. However, another figure shows 2014 production of 57.3 bcm9. If this
is the case10, production in item iii would have to increase by as much as 13.7 bcm for one year from
2014 to 2015, which is considered unlikely.
Of the three kinds of data, item iii comprises the maximum value throughout the entire period
from 2010 to 2035, but as item iii is unlikely, item i or ii should be adopted as the predicted
production value. It is desirable to adopt a smaller value for item i or ii so that production prediction
would not be overestimated. However, even if a smaller value is adopted, actual production would
undeniably be smaller than the minimum planned value. When consumption including to generate
power in 2012 and 2025 is compared for example, it was 52.7 bcm (actual record) in 2012 but it is
expected that consumption would decrease to 48.2 bcm (prediction) due to the contribution of
improvement in generating efficiency. Conversely, as the minimum planned value in 2025 is 67.9
bcm, the difference between planned value and demand reaches 19.7 bcm. Furthermore, it is not
theoretically impossible to adjust the exported volume. Accordingly, there is not considered to be
any problem, even if actual production is smaller than the minimum planned value to some extent.
Therefore, it is considered appropriate to apply the minimum level to Figure 2.2-3 to predict
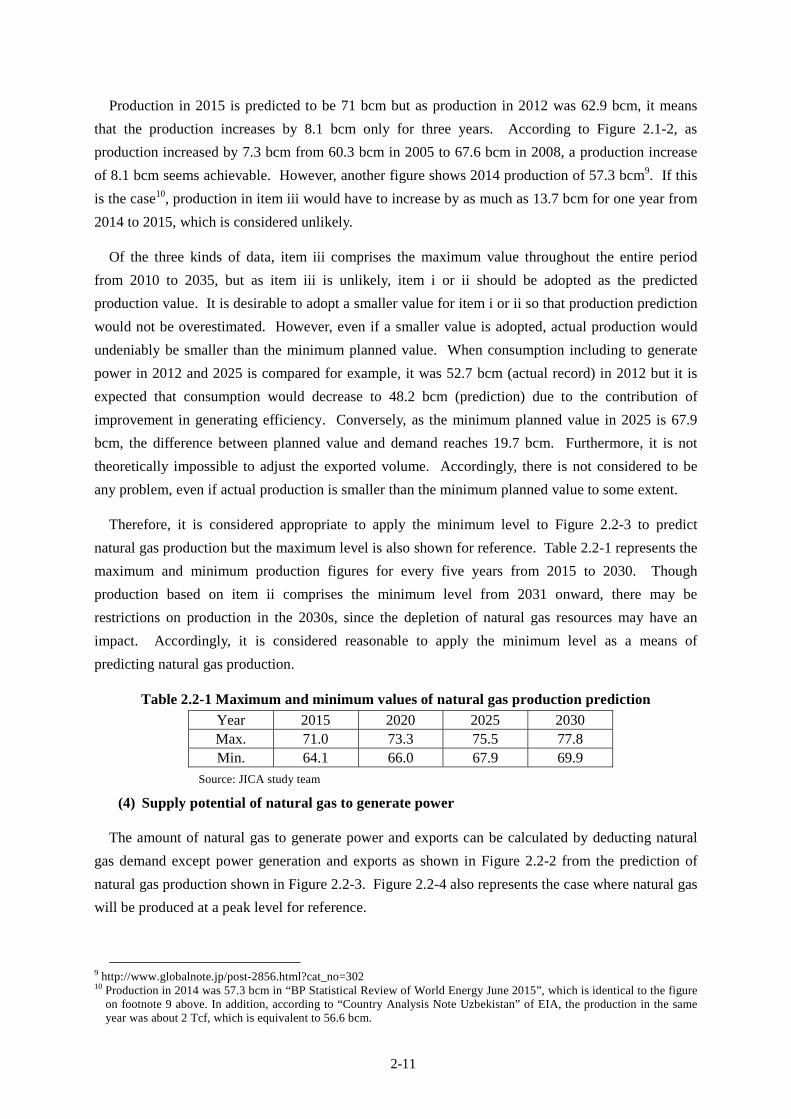
natural gas production but the maximum level is also shown for reference. Table 2.2-1 represents the
maximum and minimum production figures for every five years from 2015 to 2030. Though
production based on item ii comprises the minimum level from 2031 onward, there may be
restrictions on production in the 2030s, since the depletion of natural gas resources may have an
impact. Accordingly, it is considered reasonable to apply the minimum level as a means of
predicting natural gas production.
Table 2.2-1 Maximum and minimum values of natural gas production prediction
Year 2015 2020 2025 2030 Max. 71.0 73.3 75.5 77.8 Min. 64.1 66.0 67.9 69.9
Source: JICA study team
(4) Supply potential of natural gas to generate power
The amount of natural gas to generate power and exports can be calculated by deducting natural
gas demand except power generation and exports as shown in Figure 2.2-2 from the prediction of
natural gas production shown in Figure 2.2-3. Figure 2.2-4 also represents the case where natural gas
will be produced at a peak level for reference.
9 http://www.globalnote.jp/post-2856.html?cat_no=302 10 Production in 2014 was 57.3 bcm in “BP Statistical Review of World Energy June 2015”, which is identical to the figure
on footnote 9 above. In addition, according to “Country Analysis Note Uzbekistan” of EIA, the production in the same year was about 2 Tcf, which is equivalent to 56.6 bcm.

2-12
According to Figure 2.2-4, where the minimum amount of natural gas is allocated to generate
power and exports increase slightly from 2012 to around 2025 and then subsequently decline. In the
maximum case, natural gas allocated to generate power and export will soar due to the rapid increase
in production from 2012 to 2014 but the upward and downward trends are almost identical to the
minimum case. As the natural gas shown in Figure 2.2-4 includes that for export, if the security of
natural gas to generate power is prioritized, it will be possible to secure the natural gas necessary to
generate power fully and there will be no problem with supply potential, because the power
generation system introduced in future is mainly a gas turbine combined cycle with higher efficiency.
Source: JICA study team
Figure 2.2-4 Supply potential of natural gas to generate power and export
Introducing a more efficient power generation facility means that future natural gas consumption
to generate power will decrease compared to current consumption. In other words, comparing
natural gas consumption to generate power between 2013 and 2025, for example, shows that in 2025,
average generation efficiency is estimated at 48.4 % (though the generating efficiency of 450 MW
class combined cycle was estimated at 53.2 %, combined cycle plants are operated at partial load
with lower efficiency periodically and in addition some conventional steam plants will be still in
service at that time. Therefore, overall efficiency drops) and natural gas consumption at 13,789 mcm
with power generation of 59,758 GWh for scenario 1 in Chapter 3, while in 2013 average generating
efficiency was 34 % for whole plants and natural gas consumption was 14,915 mcm11 with 45,076
GWh. Consequently, total generating efficiency becomes lower than that of the combined cycle,
meaning natural gas consumption in 2025 will decrease compared to that in 2013.
11 According to Table 3.4.2-1 of Chapter 3 natural gas consumption for power generation is estimated at 12,848 mNcm, but in Uzbekistan natural gas volume is counted at standard gas temperature condition of 20 deg. C but not 0 deg. C.
20.0
25.0
30.0
35.0
40.0
45.0
2010 2015 2020 2025 2030
Min Max
Natural Gas Supply Potential (bcm)
year
2-13
(5) Evaluation of proven reserves
In this clause, we investigate how many years it will take before natural gas reserves are
exhausted, when natural gas is produced at the maximum and minimum predicted levels as shown in
Figure 2.2-3. As the optimum power source planning covers the period up to 2030, the evaluation
criterion is whether or not calculated proven reserves will exist in 2060. If a power generation
facility enters into service in 2030, it will be operated for 30 years.
Proven natural gas reserves are presented in Table 2.1-1. Though the figures between the World
Bank and BP differ, the former is selected because it is consistent with IEA data from which other
energy research organizations quote frequently, namely proven reserves as of 2012 were 1,841 bcm.
As natural gas production in 2012 was 62.9 bcm, the number of recoverable years (R/P ratio) is 29.3.
Accordingly, if proven reserves do not increase from now on, proven reserves will gradually decline
with no further increase in natural gas production and it can be calculated that production will
become impossible some 30 years later from 2012, i.e. around after 2040.
However, proven reserves will increase through new discovery of gas fields and decrease when
production rises. In addition, there is the potential for reserves to increase alongside price and
improved exploration and development technology. Accordingly, current recoverable years do not
necessarily mean expiry of resources. According to Business Monitoring International (BMI12), the
following outlook for reserves is presented; “Some discoveries and exploration activity would keep
gas reserves stagnant at about 1,800 bcm through to 2018, though Uzbekistan would need to
accelerate the rate of exploration and discovery should it wish to prevent a fall in gas reserves to
about 1,700 bcm by 2023”13. Though proven reserves decrease through production as mentioned
above, it is unclear what level of production from 2012 to 2018 will trigger a decrease from 1,841 to
1,800 bcm. The same applies for the period from 2018 to 2023. As a matter of fact, changes in
proven reserves cannot be calculated without knowing production.
Accordingly, production in 2023 is assumed to be the same as 62.9 bcm, namely the production
level in 2012. This is an assumption on the safe side, because if production increases from 2012
onward and proven reserves result in 1,800 bcm, proven reserves in this case should exceed the case
where production is constant.
It is assumed that production at the minimum level shown in Figure 2.2-3 will increase every year
until 2031 and then become constant. It is assumed that peak production will increase until 2035 and
then become constant. As proven reserves decline with increasing production, for both maximum
and minimum level cases, proven reserves decrease by the difference between production in each
case and production in 2012 compared to the case where production is equivalent to the 2012 level.
Accordingly, proven reserves are deducted by the increase in production from the 2012 level and
12 BMI is a research firm that provides macroeconomic, industry and financial market analysis. It was founded in 1984. 13
Oil and Gas: Uzbekistan Oil and Gas Report Q3 2014, BMI Research, June 4, 2014
2-14
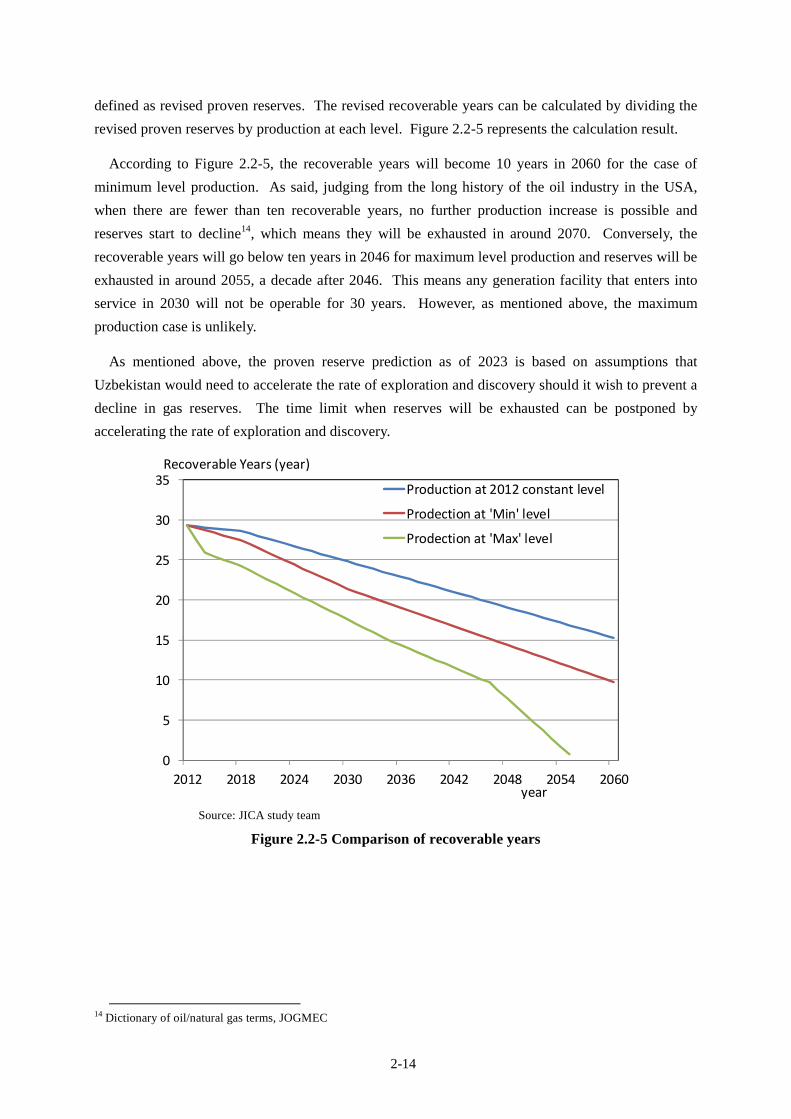
defined as revised proven reserves. The revised recoverable years can be calculated by dividing the
revised proven reserves by production at each level. Figure 2.2-5 represents the calculation result.
According to Figure 2.2-5, the recoverable years will become 10 years in 2060 for the case of
minimum level production. As said, judging from the long history of the oil industry in the USA,
when there are fewer than ten recoverable years, no further production increase is possible and
reserves start to decline14, which means they will be exhausted in around 2070. Conversely, the
recoverable years will go below ten years in 2046 for maximum level production and reserves will be
exhausted in around 2055, a decade after 2046. This means any generation facility that enters into
service in 2030 will not be operable for 30 years. However, as mentioned above, the maximum
production case is unlikely.
As mentioned above, the proven reserve prediction as of 2023 is based on assumptions that
Uzbekistan would need to accelerate the rate of exploration and discovery should it wish to prevent a
decline in gas reserves. The time limit when reserves will be exhausted can be postponed by
accelerating the rate of exploration and discovery.
Source: JICA study team
Figure 2.2-5 Comparison of recoverable years
14 Dictionary of oil/natural gas terms, JOGMEC
0
5
10
15
20
25
30
35
2012 2018 2024 2030 2036 2042 2048 2054 2060
Production at 2012 constant level
Prodection at 'Min' level
Prodection at 'Max' level
year
Recoverable Years (year)
2-15
(6) Consideration
As mentioned in clause (4) above, he following points should be noted with respect to the supply
potential of natural gas for power:
Firstly, the use of such fuel to generate power is to be prioritized over exports. If this is the case,
the supply of natural gas to generate power is not considered problematic.
Even if there is no problem to supply natural gas, conversely, it is necessary to confirm whether or
not the transportation capacity for supplying such volumes of natural gas to power stations and other
consumers would accept an increase in production. For example, though the total transportation
capacity of the three trunk pipelines connected to Tashkent city includes sufficient room on a year-
round basis, there is a possibility of a potential shortage of transportation capacity in winter with
higher demand. It is necessary to investigate whether or not pipelines elsewhere, particularly trunk
pipelines connected to power stations, have sufficient room in transportation capacity in winter.
However, to do so, data must be collected on the transportation capacity of trunk pipelines connected
to each power station, including those newly built in future and actual data on current monthly
transportation volume.
As the annual growth rate in electricity demand is 3.6 % for the Base Case, electricity demand
growth must be controlled first. It is generally unlikely to implement energy conservation in which
the increased consumption of fossil fuels such as oil and natural gas can be controlled without
reducing growth in electricity demand. Accordingly, an energy demand structure with high
electricity demand growth will inevitably bring with it high fossil fuel demand.
In the model used for the forecast shown in Figure 2.2-3 for example, natural gas demand as
primary energy will be 73.6 bcm in 2030. Conversely, natural gas demand will increase by 1.7 % in
terms of the annual growth rate according to the forecast undertaken by ADB (refer to footnote 8.)
When this annual growth rate is applied, natural gas demand is calculated at 71.4 bcm, which differs
slightly from the figure forecast by the JICA study team. However, the annual growth rate of
electricity demand is 0.8 % according to ADB’s forecast and 3.6 % for the Base Case as mentioned
above15. Accordingly, the figure of 73.6 bcm is considered reasonable compared to ADB’s figure of
71.4 bcm.
As described in clause 2.2(4) it is expected that natural gas demand to generate power would
rather decrease in future and in addition it is possible to transfer the natural gas from export to power
generation use in an emergency. In conclusion, it is considered that the supply potential of natural
gas to generate power by 2060 would not be problematic, even taking resource restrictions into
consideration.
15 In this study, power demand forecast was undertaken based on the economic growth forecast implemented by the
Institute of Forecasting and Macroeconomic Research (IFMR) in Uzbekistan. The economic growth forecast by IFMR shows an economic growth rate up to 2030 of 8.3 to 9 percent. Conversely, according to the power demand forecast by ADB, the economic growth rate will be 8.0 % between 2010 and 2020 and 5.3 % between 2020 and 2035. Consequently, the difference in the economic growth forecast is considered the main reason for the difference in power demand.

2-16
2.3 Supply potential of coal to generate power
(1) Investigation of the supply potential of coal to generate power and its evaluation method
Data on production, consumption and reserves, etc. were given by Uzbekugol for coal and some
data were also given by Uzbekenergo JSC. An investigation followed by comparing these data with
IEA data, etc. in this section. In Uzbekistan, coal reserved and consumed includes a small amount of
bituminous coal as well as lignite (including sub-bituminous coal.) The investigation was undertaken
by focusing on lignite, because the coal used to generate power is lignite only16 according to the
IEA’s energy balance table.
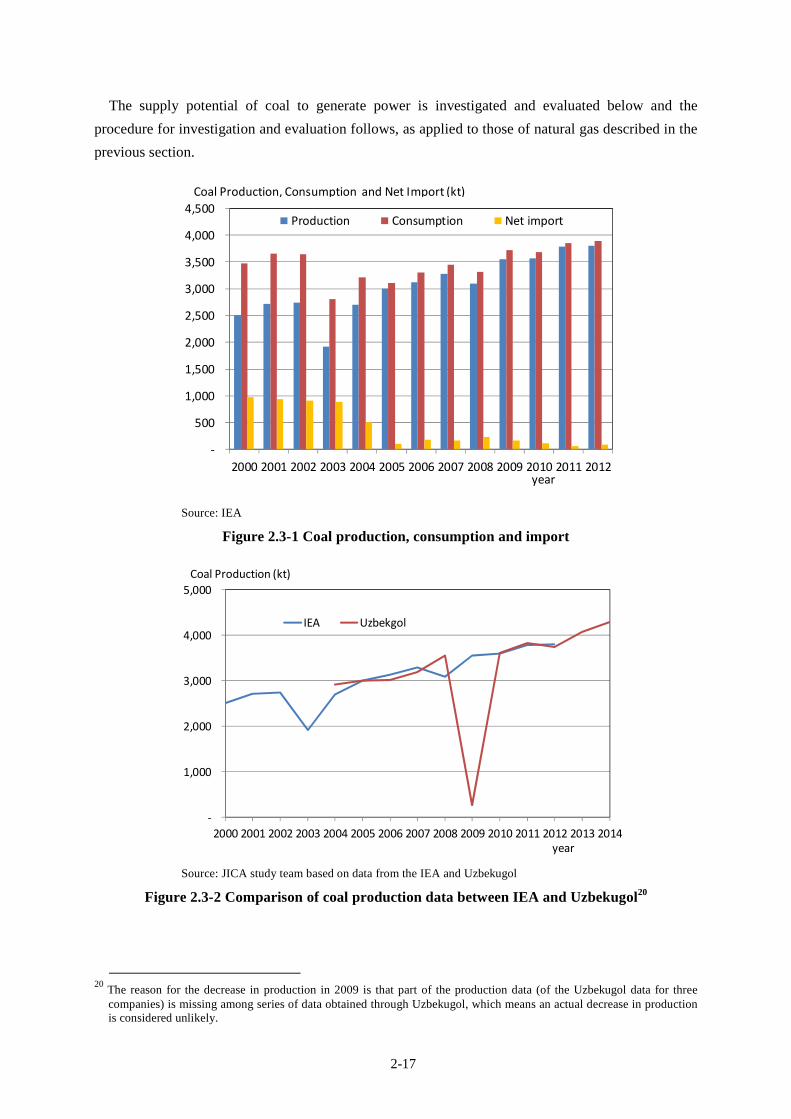
Figure 2.3-1 represents coal production, consumption (equal to domestic supply) and imports.
Unlike natural gas, Uzbekistan is a net importer of coal, albeit in small amounts. Coal is produced
by three companies 17 , Uzbekugol, Apartak and Shargukumir (all of which Uzbekenergo JSC
subsidiaries.) The companies who produce lignite (whose low calorific value is 1,910 kcal/kg) are
Uzbekugol and Apartak and Shargukumir mainly produces bituminous coal. Uzbekugol had a
94.0 % share of lignite production from 2010 to 2014 and Apartak 6.0 %18. It was confirmed that
bituminous coal is not used to generate power according to the data obtained from Uzbekenergo JSC.
Figure 2.3-2 represents a comparison between IEA data and data arranged by Uzbekugol. These
data effectively match except for the Uzbekugol data for 2009, where a mistake occurred when
copying. As described in clause 2.1(1), the average deviation for nine years was as small as 3.3 %
for coal consumption to generate power. However, as for natural gas, IEA data was mainly used to
analyze and evaluate the same, given the lack of available data related to coal demand due to the
nature of Uzbekugol as a coal production company.
According to Figure 2.3-1, while coal production rose since 2000, despite fluctuating slightly,
consumption showed a milder upward trend than overall production, despite fluctuating slightly.
Consequently, net imports since 2005 were almost zero. According to the IEA, the breakdown of
coal consumption by application type is as follows: that to generate power (including heat supply) is
68 % and for uses other than power generation is 32 % as of 2012. Furthermore, the breakdown of
consumption for applications other than power generation is as follows: that for heat supply plants
0.5 %, for industry 21.2 %, for households 3.7 %, for agriculture/fishery 1.1 % and unspecified
73.5 %, when the total is set at 100 %19.
16 Strictly speaking, Uzbekenergo JSC consumes charcoal as well as lignite. However the share of charcoal is a few
percentage points in terms of calorific value compared with that of lignite. In addition, as there were many years when no charcoal at all was consumed at all according to Uzbekenergo JSC, the focus was solely on lignite.
17 There is also a company named Erostigaz in addition to these three companies, which produces coal mine gas. However
as coal mine gas is excluded from IEA data, it is also excluded from this section. 18
“Production from 2004 to 2014”, Uzbekugol’s response to the additional questionnaire “Questionnaire on primary energy (coal)” asked during the third site visit.
19 http://www.iea.org/countries/non-membercountries/uzbekistan/
2-17
The supply potential of coal to generate power is investigated and evaluated below and the
procedure for investigation and evaluation follows, as applied to those of natural gas described in the
previous section.
Source: IEA
Figure 2.3-1 Coal production, consumption and import
Source: JICA study team based on data from the IEA and Uzbekugol
Figure 2.3-2 Comparison of coal production data between IEA and Uzbekugol20
20 The reason for the decrease in production in 2009 is that part of the production data (of the Uzbekugol data for three
companies) is missing among series of data obtained through Uzbekugol, which means an actual decrease in production is considered unlikely.
‐
500
1,000
1,500
2,000
2,500
3,000
3,500
4,000
4,500
2000 2001 2002 2003 2004 2005 2006 2007 2008 2009 2010 2011 2012
Production Consumption Net import
Coal Production, Consumption and Net Import (kt)
year
‐
1,000
2,000
3,000
4,000
5,000
2000 2001 2002 2003 2004 2005 2006 2007 2008 2009 2010 2011 2012 2013 2014
IEA Uzbekgol
Coal Production (kt)
year

2-18
(2) Coal demand forecast
The coal demand forecast was also undertaken by the econometric model established to forecast
the demand to generate power as well as natural gas. Figure 2.3-3 represents the coal demand except
the power generation sector for the Base Case. Domestic demand is represented as the sum of
demand in the transformation and final energy consumption sectors, similar to natural gas, while for
the transformation sector, the coal to be allocated to generate power can be obtained by deducting the
consumption at heat supply plants from that in the transformation sector. Unlike natural gas, coal
has been in a situation of net import (imported volume exceeds that exported) to date. As this means
that domestic demand exceeded production, it could not be allocated for export21. Applying Figure
2.2-1 representing supply and demand structure of natural gas to coal, its supply and demand
structure is as represented in Figure 2.3-3.
Primary Energy Production Import
Net Import
Primary Energy Consumption Export Energy Consumption at Final Energy Transformation Secor Consumption
Transformation Sector
Power Generation less Power Generation
Sector (Heat Supply Sector)
Source: JICA study team
Figure 2.3-3 Energy supply and demand structure (coal)
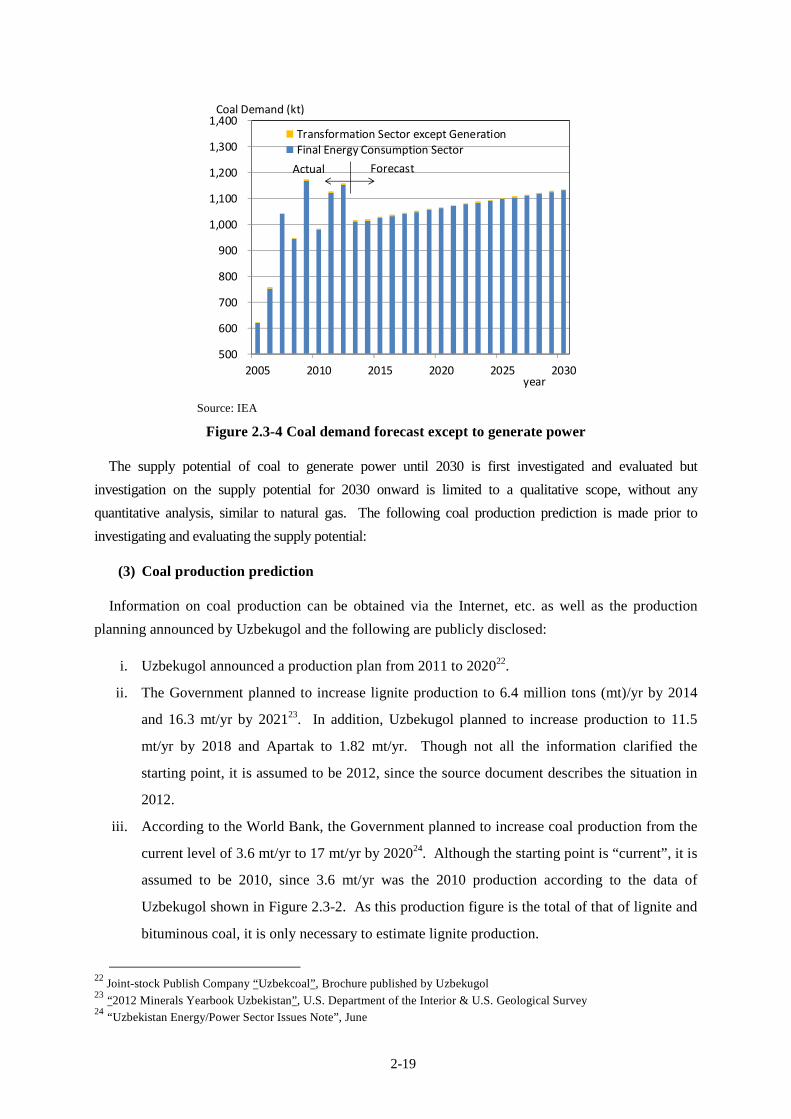
Figure 2.3-4 represents the resulting demand forecast except for the power generation sector. As
shown, almost all the coal is consumed in the final energy consumption sector except for power
generation but its consumption is extremely small.
21 According to IEA, some 1 % of the production volume was exported as of 2012 (imported volume is 3.4 %).
2-19
Source: IEA
Figure 2.3-4 Coal demand forecast except to generate power
The supply potential of coal to generate power until 2030 is first investigated and evaluated but
investigation on the supply potential for 2030 onward is limited to a qualitative scope, without any
quantitative analysis, similar to natural gas. The following coal production prediction is made prior to
investigating and evaluating the supply potential:
(3) Coal production prediction
Information on coal production can be obtained via the Internet, etc. as well as the production
planning announced by Uzbekugol and the following are publicly disclosed:
i. Uzbekugol announced a production plan from 2011 to 202022.
ii. The Government planned to increase lignite production to 6.4 million tons (mt)/yr by 2014
and 16.3 mt/yr by 202123. In addition, Uzbekugol planned to increase production to 11.5
mt/yr by 2018 and Apartak to 1.82 mt/yr. Though not all the information clarified the
starting point, it is assumed to be 2012, since the source document describes the situation in
2012.
iii. According to the World Bank, the Government planned to increase coal production from the
current level of 3.6 mt/yr to 17 mt/yr by 202024. Although the starting point is “current”, it is
assumed to be 2010, since 3.6 mt/yr was the 2010 production according to the data of
Uzbekugol shown in Figure 2.3-2. As this production figure is the total of that of lignite and
bituminous coal, it is only necessary to estimate lignite production.
22
Joint-stock Publish Company “Uzbekcoal”, Brochure published by Uzbekugol 23 “2012 Minerals Yearbook Uzbekistan”, U.S. Department of the Interior & U.S. Geological Survey 24 “Uzbekistan Energy/Power Sector Issues Note”, June
500
600
700
800
900
1,000
1,100
1,200
1,300
1,400
2005 2010 2015 2020 2025 2030
Transformation Sector except GenerationFinal Energy Consumption Sector
Coal Demand (kt)
Actual Forecast
year

2-20
There is a breakdown comprising total production and that of Uzbekugol and Apartak in
Uzbekugol data that are the source of Figure 2.3-2 (footnote 18) concerning item i. As for the
average production share of each company from 2010 to 2014, Uzbekugol’s share is 94.0 % and that
of Apartak is 6.0 %. Accordingly, total production can be assumed by dividing the figures shown on
Uzbekugol’s production plan by 0.94 for item i. Furthermore, Uzbekugol data on which Figure 2.3-4
is based include a breakdown of lignite 25 production and bituminous coal 26 production and the
average share of each coal type from 2010 to 2014, as 99.1 and 0.9 %, respectively. Accordingly,
lignite production can be assumed by multiplying coal production by 0.991.
Figure 2.3-5 represents a coal production prediction, in which production is calculated based on
items i to iii and organized. Figure 2.3-5 also includes a production record from 2010 to 2015 based
on Uzbekugol data. The Uzbekugol data cover the period 2010 to 2014 only. However, according to
the latest information on coal production, it decreased by 11.4 % during the period January to June
2015 compared to the same period in 201427. The production record shown in Figure 2.3-5 showed a
decrease of 11.4 % assumed to be applicable; not only to the first half but also year-round.
According to Figure 2.3-5, it is obvious that the production record has not been able to keep pace
with various production plans.
Source: JICA study team
Figure 2.3-5 Coal production prediction (Part 1)
25 Lignite is formed from peat at shallow depths and at temperatures lower than 100 deg. C. It is the first product of
coalification. Lignite has a calorific value lower than 4,610 kcal/kg according to ASTM’s standard. (ASTM: American Society for Testing and Materials)
26 Bituminous coal has far higher coalification than lignite and is rich in volatile hydrocarbons. Bituminous coal has a calorific value exceeding 6,390 kcal/kg according to ASTM’s standard.
27 http://en.trend.az/business/economy/2425894.html
‐
2,000
4,000
6,000
8,000
10,000
12,000
14,000
16,000
18,000
2010 2011 2012 2013 2014 2015 2016 2017 2018 2019 2020 2021
Uzbekugol's plan(Apartak inclusive)
Uzbekugol's + Apartak's plan
Government
World Bank prediction
Production record
Coal Production (kt)
year
2-21
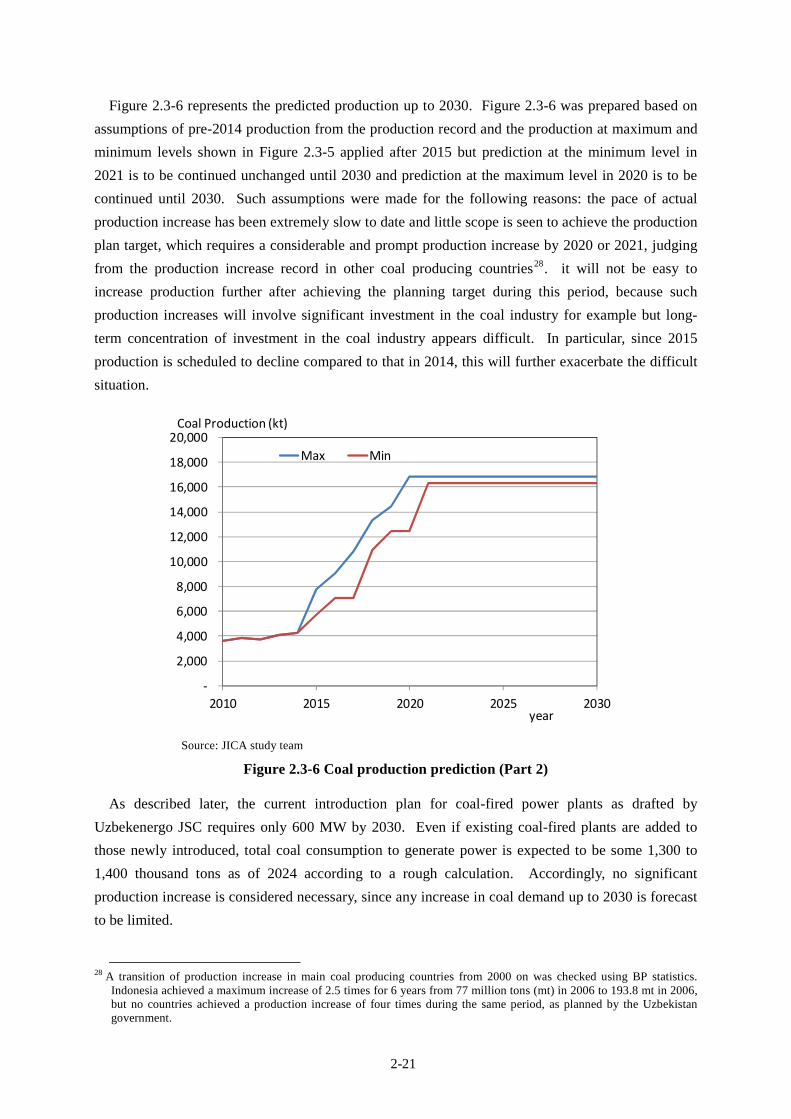
Figure 2.3-6 represents the predicted production up to 2030. Figure 2.3-6 was prepared based on
assumptions of pre-2014 production from the production record and the production at maximum and
minimum levels shown in Figure 2.3-5 applied after 2015 but prediction at the minimum level in
2021 is to be continued unchanged until 2030 and prediction at the maximum level in 2020 is to be
continued until 2030. Such assumptions were made for the following reasons: the pace of actual
production increase has been extremely slow to date and little scope is seen to achieve the production
plan target, which requires a considerable and prompt production increase by 2020 or 2021, judging
from the production increase record in other coal producing countries28. it will not be easy to
increase production further after achieving the planning target during this period, because such
production increases will involve significant investment in the coal industry for example but long-
term concentration of investment in the coal industry appears difficult. In particular, since 2015
production is scheduled to decline compared to that in 2014, this will further exacerbate the difficult
situation.
Source: JICA study team
Figure 2.3-6 Coal production prediction (Part 2)
As described later, the current introduction plan for coal-fired power plants as drafted by
Uzbekenergo JSC requires only 600 MW by 2030. Even if existing coal-fired plants are added to
those newly introduced, total coal consumption to generate power is expected to be some 1,300 to
1,400 thousand tons as of 2024 according to a rough calculation. Accordingly, no significant
production increase is considered necessary, since any increase in coal demand up to 2030 is forecast
to be limited.
28 A transition of production increase in main coal producing countries from 2000 on was checked using BP statistics.
Indonesia achieved a maximum increase of 2.5 times for 6 years from 77 million tons (mt) in 2006 to 193.8 mt in 2006, but no countries achieved a production increase of four times during the same period, as planned by the Uzbekistan government.
‐
2,000
4,000
6,000
8,000
10,000
12,000
14,000
16,000
18,000
20,000
2010 2015 2020 2025 2030
Max Min
Coal Production (kt)
year
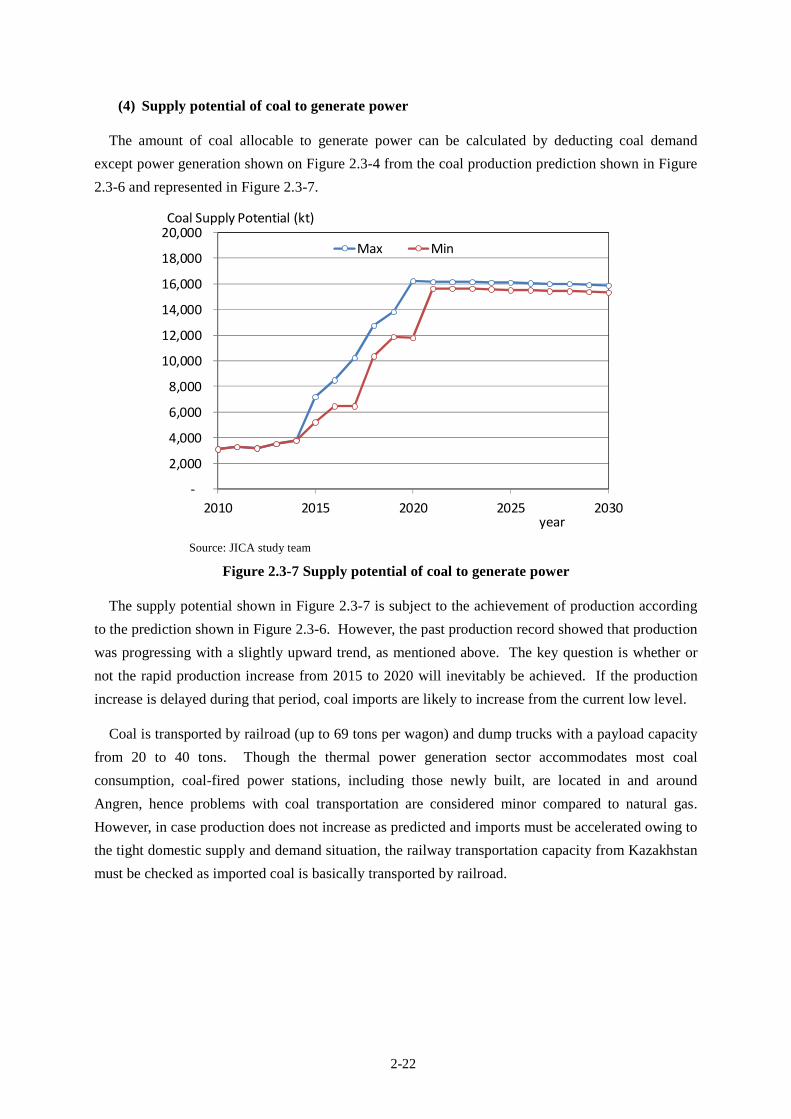
2-22
(4) Supply potential of coal to generate power
The amount of coal allocable to generate power can be calculated by deducting coal demand
except power generation shown on Figure 2.3-4 from the coal production prediction shown in Figure
2.3-6 and represented in Figure 2.3-7.
Source: JICA study team
Figure 2.3-7 Supply potential of coal to generate power
The supply potential shown in Figure 2.3-7 is subject to the achievement of production according
to the prediction shown in Figure 2.3-6. However, the past production record showed that production
was progressing with a slightly upward trend, as mentioned above. The key question is whether or
not the rapid production increase from 2015 to 2020 will inevitably be achieved. If the production
increase is delayed during that period, coal imports are likely to increase from the current low level.
Coal is transported by railroad (up to 69 tons per wagon) and dump trucks with a payload capacity
from 20 to 40 tons. Though the thermal power generation sector accommodates most coal
consumption, coal-fired power stations, including those newly built, are located in and around
Angren, hence problems with coal transportation are considered minor compared to natural gas.
However, in case production does not increase as predicted and imports must be accelerated owing to
the tight domestic supply and demand situation, the railway transportation capacity from Kazakhstan
must be checked as imported coal is basically transported by railroad.
‐
2,000
4,000
6,000
8,000
10,000
12,000
14,000
16,000
18,000
20,000
2010 2015 2020 2025 2030
Max Min
Coal Supply Potential (kt)
year
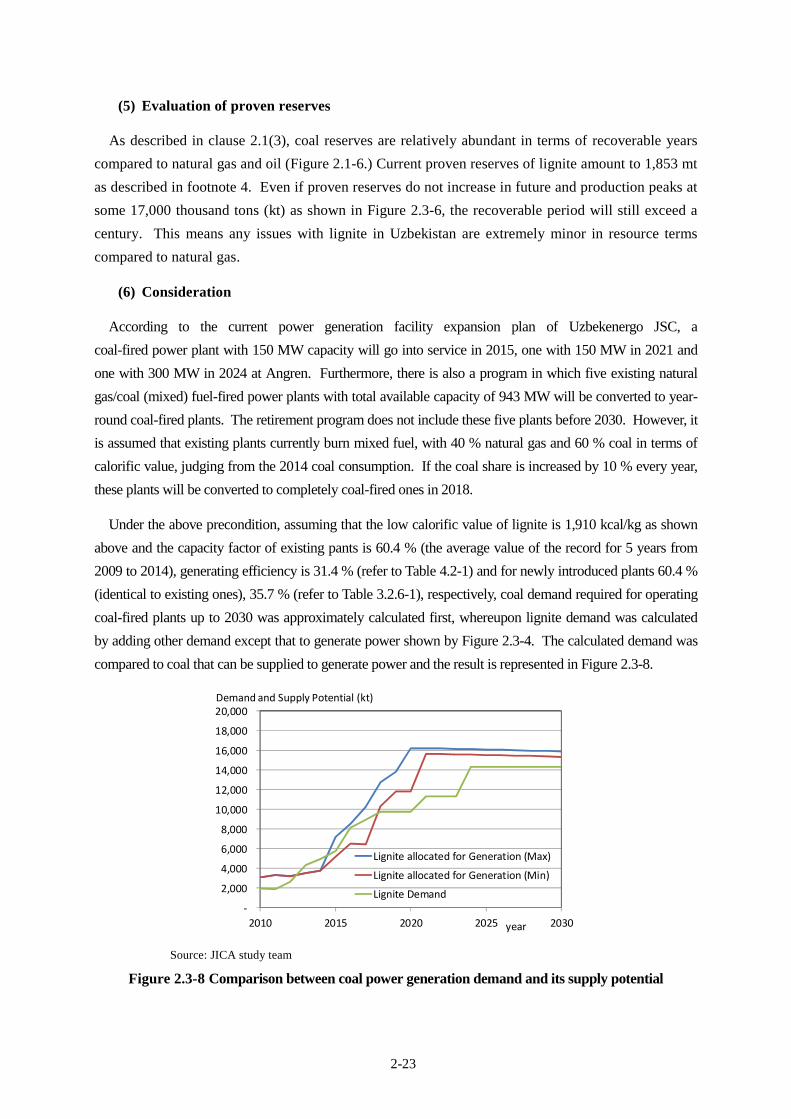
2-23
(5) Evaluation of proven reserves
As described in clause 2.1(3), coal reserves are relatively abundant in terms of recoverable years
compared to natural gas and oil (Figure 2.1-6.) Current proven reserves of lignite amount to 1,853 mt
as described in footnote 4. Even if proven reserves do not increase in future and production peaks at
some 17,000 thousand tons (kt) as shown in Figure 2.3-6, the recoverable period will still exceed a
century. This means any issues with lignite in Uzbekistan are extremely minor in resource terms
compared to natural gas.
(6) Consideration
According to the current power generation facility expansion plan of Uzbekenergo JSC, a
coal-fired power plant with 150 MW capacity will go into service in 2015, one with 150 MW in 2021 and
one with 300 MW in 2024 at Angren. Furthermore, there is also a program in which five existing natural
gas/coal (mixed) fuel-fired power plants with total available capacity of 943 MW will be converted to year-
round coal-fired plants. The retirement program does not include these five plants before 2030. However, it
is assumed that existing plants currently burn mixed fuel, with 40 % natural gas and 60 % coal in terms of
calorific value, judging from the 2014 coal consumption. If the coal share is increased by 10 % every year,
these plants will be converted to completely coal-fired ones in 2018.
Under the above precondition, assuming that the low calorific value of lignite is 1,910 kcal/kg as shown
above and the capacity factor of existing pants is 60.4 % (the average value of the record for 5 years from
2009 to 2014), generating efficiency is 31.4 % (refer to Table 4.2-1) and for newly introduced plants 60.4 %
(identical to existing ones), 35.7 % (refer to Table 3.2.6-1), respectively, coal demand required for operating
coal-fired plants up to 2030 was approximately calculated first, whereupon lignite demand was calculated
by adding other demand except that to generate power shown by Figure 2.3-4. The calculated demand was
compared to coal that can be supplied to generate power and the result is represented in Figure 2.3-8.
Source: JICA study team
Figure 2.3-8 Comparison between coal power generation demand and its supply potential
‐
2,000
4,000
6,000
8,000
10,000
12,000
14,000
16,000
18,000
20,000
2010 2015 2020 2025 2030
Lignite allocated for Generation (Max)
Lignite allocated for Generation (Min)
Lignite Demand
Demand and Supply Potential (kt)
year
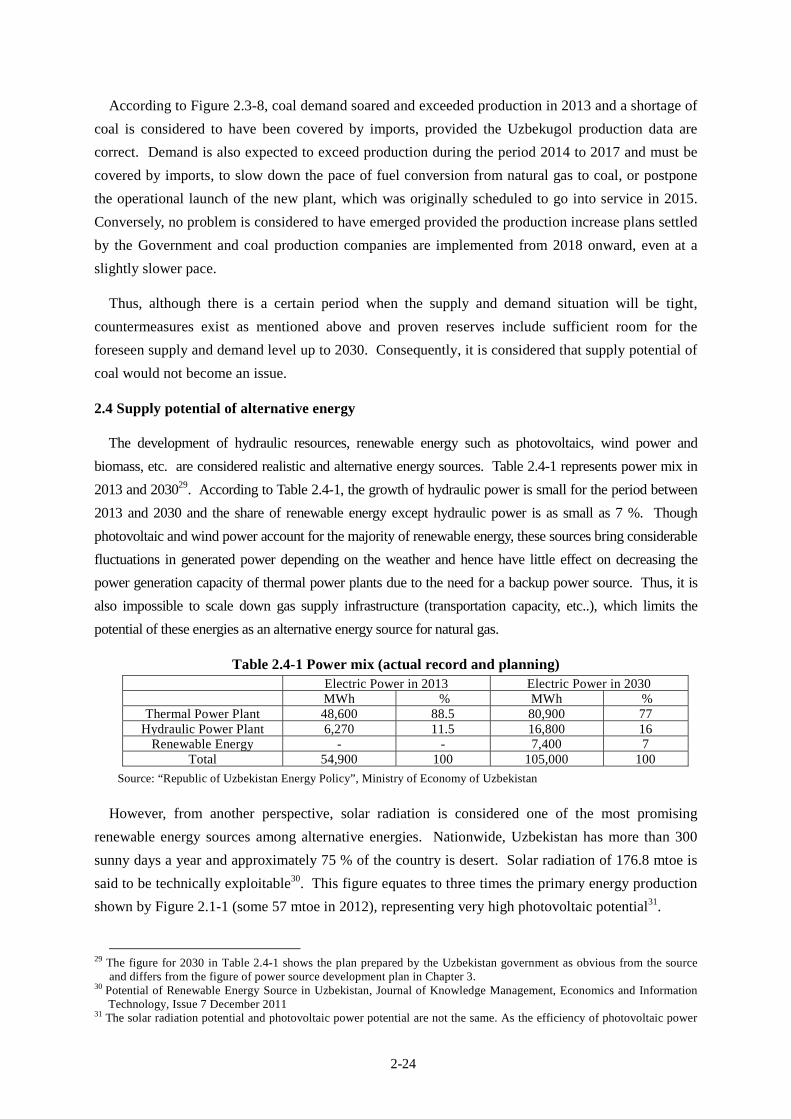
2-24
According to Figure 2.3-8, coal demand soared and exceeded production in 2013 and a shortage of
coal is considered to have been covered by imports, provided the Uzbekugol production data are
correct. Demand is also expected to exceed production during the period 2014 to 2017 and must be
covered by imports, to slow down the pace of fuel conversion from natural gas to coal, or postpone
the operational launch of the new plant, which was originally scheduled to go into service in 2015.
Conversely, no problem is considered to have emerged provided the production increase plans settled
by the Government and coal production companies are implemented from 2018 onward, even at a
slightly slower pace.
Thus, although there is a certain period when the supply and demand situation will be tight,
countermeasures exist as mentioned above and proven reserves include sufficient room for the
foreseen supply and demand level up to 2030. Consequently, it is considered that supply potential of
coal would not become an issue.
2.4 Supply potential of alternative energy
The development of hydraulic resources, renewable energy such as photovoltaics, wind power and
biomass, etc. are considered realistic and alternative energy sources. Table 2.4-1 represents power mix in
2013 and 203029. According to Table 2.4-1, the growth of hydraulic power is small for the period between
2013 and 2030 and the share of renewable energy except hydraulic power is as small as 7 %. Though
photovoltaic and wind power account for the majority of renewable energy, these sources bring considerable
fluctuations in generated power depending on the weather and hence have little effect on decreasing the
power generation capacity of thermal power plants due to the need for a backup power source. Thus, it is
also impossible to scale down gas supply infrastructure (transportation capacity, etc..), which limits the
potential of these energies as an alternative energy source for natural gas.
Table 2.4-1 Power mix (actual record and planning) Electric Power in 2013 Electric Power in 2030 MWh % MWh %
Thermal Power Plant 48,600 88.5 80,900 77Hydraulic Power Plant 6,270 11.5 16,800 16
Renewable Energy - - 7,400 7Total 54,900 100 105,000 100
Source: “Republic of Uzbekistan Energy Policy”, Ministry of Economy of Uzbekistan
However, from another perspective, solar radiation is considered one of the most promising
renewable energy sources among alternative energies. Nationwide, Uzbekistan has more than 300
sunny days a year and approximately 75 % of the country is desert. Solar radiation of 176.8 mtoe is
said to be technically exploitable30. This figure equates to three times the primary energy production
shown by Figure 2.1-1 (some 57 mtoe in 2012), representing very high photovoltaic potential31.
29 The figure for 2030 in Table 2.4-1 shows the plan prepared by the Uzbekistan government as obvious from the source
and differs from the figure of power source development plan in Chapter 3. 30 Potential of Renewable Energy Source in Uzbekistan, Journal of Knowledge Management, Economics and Information
Technology, Issue 7 December 2011 31 The solar radiation potential and photovoltaic power potential are not the same. As the efficiency of photovoltaic power

2-25
As photovoltaic (PV) power, as mentioned above, is a relatively unstable power source and
involves high generating cost, its large-scale introduction is problematic. However, PV power can
play a role as alternative energy and help improve the current balance by transferring the natural gas
saved through the operation of PV power system to export. In this sense, it necessary to investigate
the economic feasibility of PV power by relating the increased exports of saved natural gas to
economic effects but not by comparing its unit generation cost with that of existing power sources. It
is considered fully likely that PV power would become economically feasible depending on the
export price of natural gas.
As shown in Figure 2.4-1 below, Uzbekistan receives a good amount of insolation at 5kWh/m2/day
and there are many clear days, which collectively indicate the high potential of solar energy as a
renewable energy source. Conversely, the potential of wind energy is limited because Uzbekistan is
a double land-locked country with no seashore. As for biomass, Uzbekistan is a leading cotton
producer and generates 3 million tons of cotton stalk as leftover each year. If all of this could be
used to produce electric energy 1.5 TW/year would be produced, but there are some issues: (1) cotton
stalk is used as a fuel for cooking and heating in countryside homes, (2) a supply chain for collecting,
drying and storing the biofuel will need to be established, (3) existing gas burning boilers will need
to be converted into biomass burning.
In conclusion, solar radiation can be considered to have the highest potential among renewable
energy sources in Uzbekistan.
Source: Solargis homepage, http://solargis.info
Figure 2.4-1 Global horizontal irradiation map
generation is 15 to 20 percent, photovoltaic potential is 15 to 20 percent of solar radiation potential.
Uzbekistan

Chapter 3 Power Development Concept
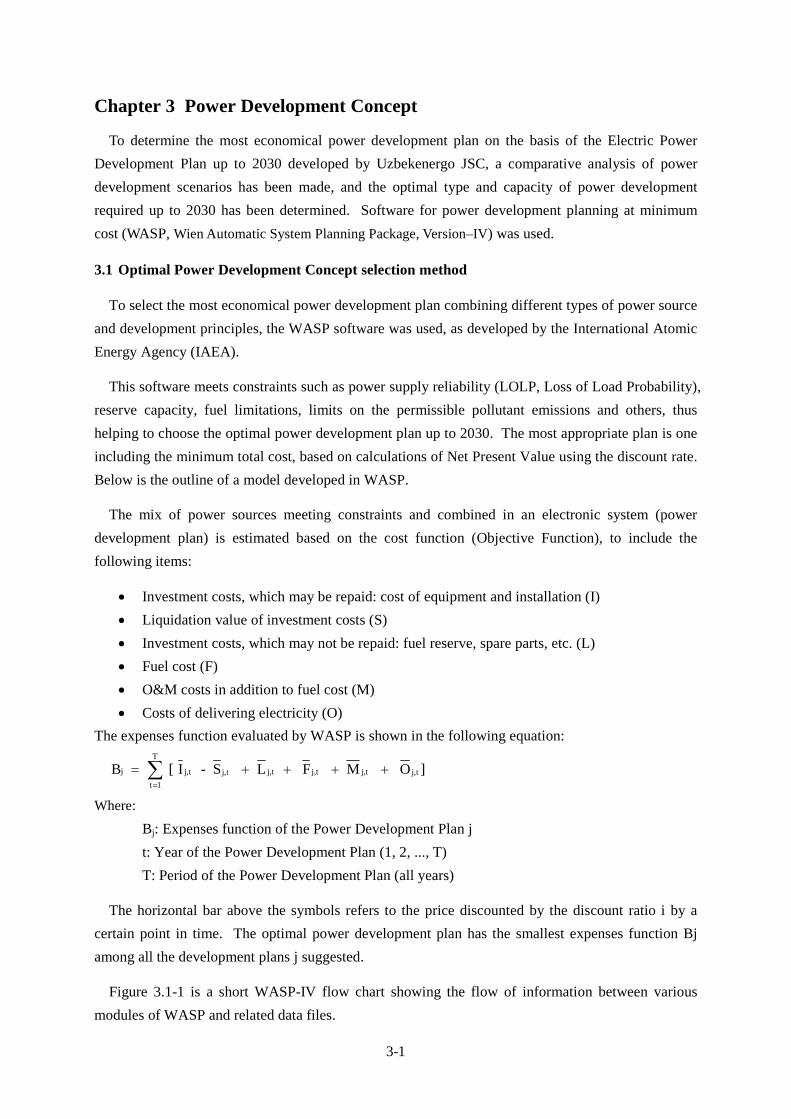
3-1
Chapter 3 Power Development Concept
To determine the most economical power development plan on the basis of the Electric Power
Development Plan up to 2030 developed by Uzbekenergo JSC, a comparative analysis of power
development scenarios has been made, and the optimal type and capacity of power development
required up to 2030 has been determined. Software for power development planning at minimum
cost (WASP, Wien Automatic System Planning Package, Version–IV) was used.
3.1 Optimal Power Development Concept selection method
To select the most economical power development plan combining different types of power source
and development principles, the WASP software was used, as developed by the International Atomic
Energy Agency (IAEA).
This software meets constraints such as power supply reliability (LOLP, Loss of Load Probability),
reserve capacity, fuel limitations, limits on the permissible pollutant emissions and others, thus
helping to choose the optimal power development plan up to 2030. The most appropriate plan is one
including the minimum total cost, based on calculations of Net Present Value using the discount rate.
Below is the outline of a model developed in WASP.
The mix of power sources meeting constraints and combined in an electronic system (power
development plan) is estimated based on the cost function (Objective Function), to include the
following items:
Investment costs, which may be repaid: cost of equipment and installation (I)
Liquidation value of investment costs (S)
Investment costs, which may not be repaid: fuel reserve, spare parts, etc. (L)
Fuel cost (F)
O&M costs in addition to fuel cost (M)
Costs of delivering electricity (O)
The expenses function evaluated by WASP is shown in the following equation: T
j j,t j,t j,t j,tj,t j,t
t 1
B [ I - S L F M O ]
Where:
Bj: Expenses function of the Power Development Plan j
t: Year of the Power Development Plan (1, 2, ..., T)
T: Period of the Power Development Plan (all years)
The horizontal bar above the symbols refers to the price discounted by the discount ratio i by a
certain point in time. The optimal power development plan has the smallest expenses function Bj
among all the development plans j suggested.
Figure 3.1-1 is a short WASP-IV flow chart showing the flow of information between various
modules of WASP and related data files.

3-2
Table 3.1-1 The Power Development Plan up to 2030, developed by Uzbekenergo JSC (including renovation of existing hydropower plants)
No. Name of the power plant Unit 2015 2016 2017 2018 2019 2020 2021 2022 2023 2024 2025 2026 2027 2028 2029 2030 [MW]
1 Talimarjan TPP GTCC 450 450 450 450 450 450 2,700
2 Navoi TPP GTCC 450 450 900
3 Syrdarya TPP Steam 50 50
4 Tashkent TPP GTCC 370 450 450 450 450 450 450 3,070
5 Angren TPP Steam 150 150 300
6 Novo-Angren TPP Steam 300 300
7 Takhiatash TPP GTCC 250 250 500
8 Turakurgan TPP GTCC 450 450 450 450 1,800
9 Syrdarya province, new TPP GTCC 450 450 900
10 Mubarek CHPP GTCS 140 140
11 Ferghana CHPP GTCC 57,7 57,7
12 Tashkent CHPP GTCS 2×27 54
13 Tashkent CHPP GTCS 4×27 108
Total for CPP 50 970 1350 1,065.7 840 304 1,500 900 - 750 450 450 450 450 450 90010,880
Per five (5) years 50 4,529.7 3,600 2,700
14 Renovation of existing hydropower plants
45 17.3 6.9 8.7 11.8 2.4 10.8 2.1 1.3 0.4 0.3 107
1HPP 2HPP 3HPP 4HPP 3HPP 3HPP 2HPP 3HPP 3HPP 2HPP 2HPP
Per five (5) years 45 47.1 14,9
15 Kamolot HPP 8 8
16 Irgailiksai HPP 13.6 15
17 Nijne-Koksu HPP 20 20
18 Nijne-Chatkal HPP 100 100
19 Khodjikent HPP 200 200
20 Mullalak HPP 240 240
21 Akbulak HPP 60 60
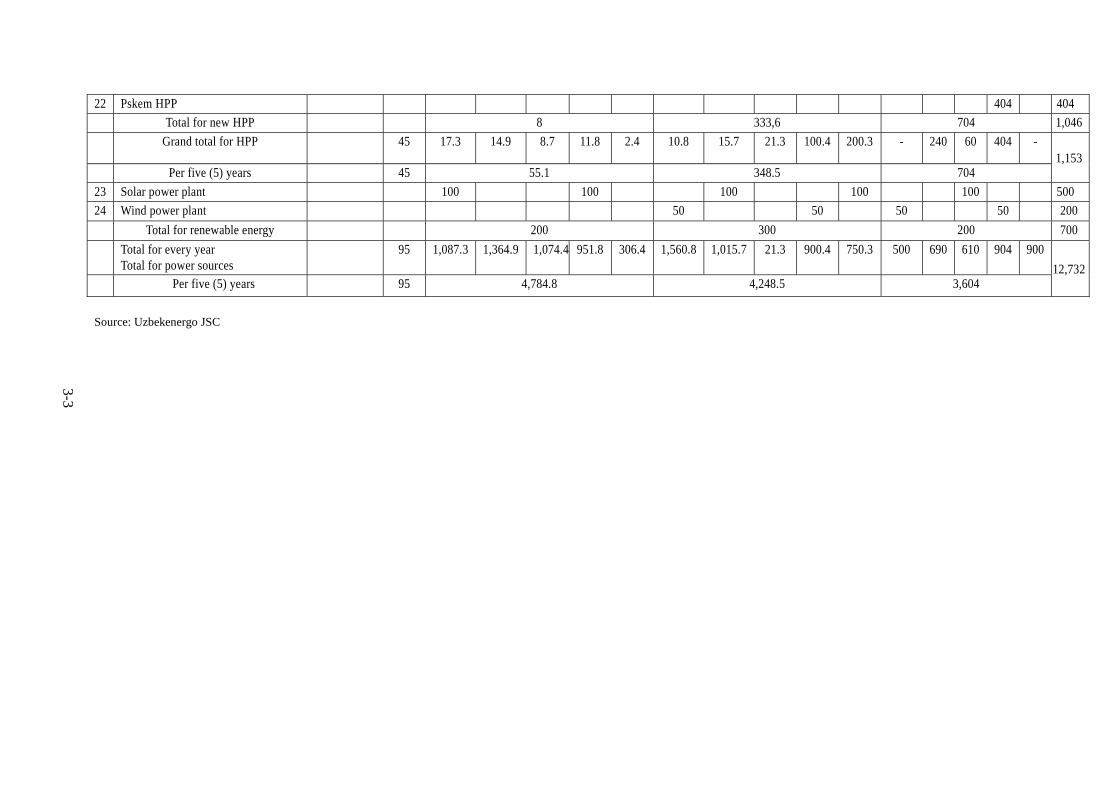
3-3
Source: Uzbekenergo JSC
22 Pskem HPP 404 404
Total for new HPP 8 333,6 704 1,046
Grand total for HPP 45 17.3 14.9 8.7 11.8 2.4 10.8 15.7 21.3 100.4 200.3 - 240 60 404 - 1,153
Per five (5) years 45 55.1 348.5 704
23 Solar power plant 100 100 100 100 100 500
24 Wind power plant 50 50 50 50 200
Total for renewable energy 200 300 200 700
Total for every year Total for power sources
95 1,087.3 1,364.9 1,074.4 951.8 306.4 1,560.8 1,015.7 21.3 900.4 750.3 500 690 610 904 900
12,732 Per five (5) years 95 4,784.8 4,248.5 3,604
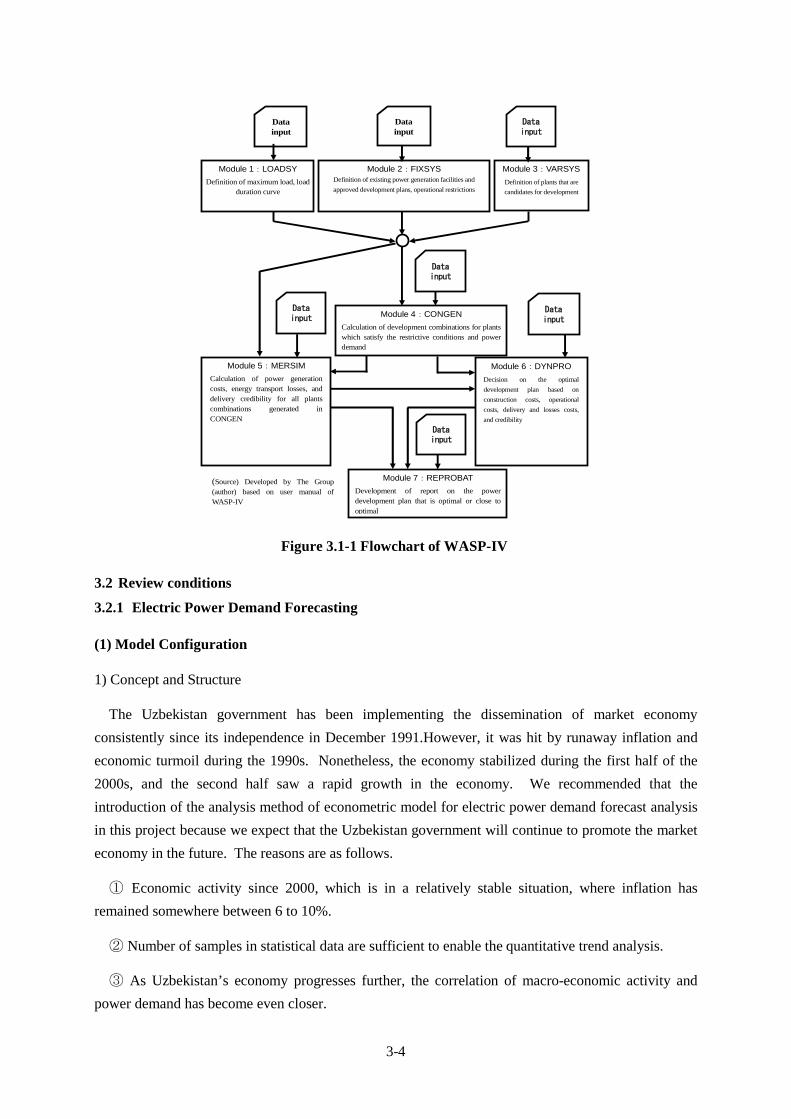
3-4
Module 5:MERSIM
Calculation of power generation costs, energy transport losses, and delivery credibility for all plants combinations generated in CONGEN
Module 6:DYNPRO
Decision on the optimal
development plan based on
construction costs, operational
costs, delivery and losses costs,
and credibility
Module 7:REPROBAT
Development of report on the power development plan that is optimal or close to optimal
Data input
Data input
Module 1:LOADSY
Definition of maximum load, load duration curve
Data input
Data input
Data input
Data input
Data input
Module 2:FIXSYS Definition of existing power generation facilities and
approved development plans, operational restrictions
Module 3:VARSYS
Definition of plants that are
candidates for development
Module 4:CONGEN
Calculation of development combinations for plants which satisfy the restrictive conditions and power demand
(Source) Developed by The Group (author) based on user manual of WASP-IV
Figure 3.1-1 Flowchart of WASP-IV
3.2 Review conditions
3.2.1 Electric Power Demand Forecasting
(1) Model Configuration
1) Concept and Structure
The Uzbekistan government has been implementing the dissemination of market economy
consistently since its independence in December 1991.However, it was hit by runaway inflation and
economic turmoil during the 1990s. Nonetheless, the economy stabilized during the first half of the
2000s, and the second half saw a rapid growth in the economy. We recommended that the
introduction of the analysis method of econometric model for electric power demand forecast analysis
in this project because we expect that the Uzbekistan government will continue to promote the market
economy in the future. The reasons are as follows.
① Economic activity since 2000, which is in a relatively stable situation, where inflation has
remained somewhere between 6 to 10%.
② Number of samples in statistical data are sufficient to enable the quantitative trend analysis.
③ As Uzbekistan’s economy progresses further, the correlation of macro-economic activity and
power demand has become even closer.

3-5
Source: JICA Study Team
Figure 3.2.1-1 Structure of Model
The structure of the modeling is composed of the “Macro Economic Sub-Model”, the “Electric
Power Demand Sub-Model” and the “Heat Demand Sub-Model”, These three sub-models are shown
in the general configuration diagram, Figure 3.2.1-1. The simulation analysis will be based on these
three sub-models to estimate the electric power demand and heat demand of Uzbekistan by 2030.
This integrated quantitative analysis model can easily verify the correlation between macro-economic
indicators and power demand. Furthermore, there is an advantage which is easy to explain the
changes of electric power demand in future by economic activity.
Macro-Economy Sub-Model
The Institute of Forecasting and Macroeconomic Research (IFMR) is one of the main institutions
that prepare the short-term (2016 - 2018) and long term (until 2030) forecasting for the economy and
energy demand in Uzbekistan. IFMR is not entirely relianent on the model, but scenario analysis has
also became an important part of the long-term projection process. As a result, the country’s
economic growth rate is projected at an average annual rate of 8.3 to 9.0 % by 2030. Gross Domestic
Product (GDP) in 2030 is projected to expand 3.7 times compared to now. The population has been
estimated to reache 37 million by 2030 at an average annual rate of 1.28%. IFMR also points out that

3-6
Uzbekistan is also facing a big challenge in ensuring the stability of the labor force, investment and
resources (fuel and water) in order to to maintain high economic growth by 20301.
After consideration of the above IFMR forecasting method in the electric power demand projection
model study, an econometric analysis method for modeling construction was introduced. The
economic model was constructed based on gross domestic expenditures (GDE), and the economic
growth rate of Uzbekistan was estimated. Industrial structure analysis on the present point is difficult
without the input-output (IO) tables2, but the GDP by sector is simulated by share functions, which
are based on the history of the industrial sector trends and changes in the structure.
The macroeconomic sub-model has been constructed on data from variables such as private
consumption, government expenditure (investment), and imports and exports which simulate the
gross domestic expenditure (GDE). The main characteristics of the model are trade factors (trade
partner’s economy change, foreign exchange), government factors (public investment, interest rates,
etc.) and population factors, which are given as external variable to simulated the economic growth
rate and production by each sector.
Electric Power Demand Sub-model
The core part of the entire model is the “Electric Power Demand Sub-model”. As an explanatory
variable indicators has obtained from the “Macro-economic Sub-model such as the GDP by sector,
electricity tariff, population, income and number of customers is used to determine the electric power
demand by sector in final sector. The sum of final sector power demand, transmission loss, own use3
and net import-export will become the total electric power demand of Uzbekistan. The peak load
(MW) can be calculated when multiplying the load factor by the total electric power demand. Power
capacity development plan is created based on this peak load. Thepower capacity composition is
calculated by optimization the software “WASP”.
The electric power demand in each province / region is calculatated according to the ratio of total
electric power demand of Uzbekistan.
2) Projection Period and Model Scale
The Model estimation period is over 17 years from 2014 to 2030.The model has a total of 232
equations consisting of 97 function equations and 135 definitional equation. All equation in the
model will be calculated by simultaneous equations. The historical data of macro-economics is from
1995 to 2013, and electricity and heat data is from 2000 to 2013.
127th January 2015, by interviews to “Institute of Forecasting and Macroeconomic Research” (IFMR). (Refer to interview
minutes) 2According to IFMR, the input-output (IO) tables that Uzbekistan has been created now is divided into 36 sectors, and the table has become a relatively simple structure. Although the development of IO table has supported by international organizations, but to reflect fully the real economy to the table is expected to take time. 3It means the demand of Generators, Substations and Uzbekenergo JSC offices usage.

3-7
3) Data
The historical data sources of macroeconomic are based on data from the International Monetary
Fund (IMF) and the United Nations statistic Division (UNSTAT), whereas the data sources of electric
power and heat are provided by Uzbekenergo JSC.
(2) Assumptions
1) Population Factor
Uzbekistan’s population at the end of 2013 was 30.24 million. In December 1991, the annual
growth rate of Uzbekistan was 2.0% compared to the previous year. However, after gaining
independence, the growth rate started to drop and slowed down to 1.2% in 2006. Nonetheless, the
expansion of economy since 2007 has stimulated a growth in the population. In 2010, for example,
the annual growth rate of the population rose to 2.9%. In 2013, the annual growth rate of the
population dropped to 1.6%, and this trend is expected to continue in the future. The growth rate of
the population, as recorded by the United Nations Statistic Division, has been included in the electric
power demand model as an external variable. According to the same population estimation results,
the increase rate of the population in Uzbekistan will decelerate gradually from 1.35%after 2013 to
0.61% in 2030.
However, much of the population in Uzbekistan consists of migrant workers from neighboring
Kazakhstan and Russia, population factors as explanatory variables might be contained elements of
uncertainty.
Table 3.2.1‐1 Population Projection of Uzbekistan (2014 - 2030) Year Population (Million) Annual Growth Rate (%)
2014 30.61 1.35 2015 31.01 1.31
2016 31.40 1.27 2017 31.79 1.22 2018 32.16 1.17 2019 32.52 1.13 2020 32.87 1.08
2021 33.21 1.03 2022 33.54 0.98 2023 33.85 0.93 2024 34.15 0.88 2025 34.43 0.83
2026 34.70 0.78 2027 34.96 0.73 2028 35.20 0.69 2029 35.43 0.65 2030 35.64 0.61
Source: United Nations, Department of Economic and Social Affairs, Population Division (2013). “World Population Prospects: The 2012 Revision”

3-8
2) Overseas Factor
Overseas factors are mainly economic trends of trading partners, currency exchange rate and
international energy prices. The economic trends of Russia and China especially have a high impact
to Uzbekistan’s economy. The trade balance of Uzbekistan after 2010 has always had a surplus at
national level, but has fallen short against Russia and China. In 2012, the share of exports to Russia
accounted for 9.0%, and the share of exports to China accounted for 7% in total. When we look at
imports, the share from Russia accounted for 21.0% and the share from China accounted for 16.0% in
total. The economic growth in both countries became external variables in determining the imports
and exports of Uzbekistan.
Exchange rates and international energy prices are important elements for evaluating domestic
energy costs. Exporting natural gases to Russia and China are especially important for gaining
foreign currency in order to raise the value of net exports.
3) Government Factor
The government factor is the most important key factor in this model analysis. As described above,
Uzbekistan is in the process of formatting a market economy, and the government’s fiscal spending is
an effective macro policy which aims to promote economic growth. In this model government
expenditure and investment, as drivers of economic development, have been incorporated as external
variables in the macro-economic sub-model. By sensitive analysis in changing this variable to
calculate the government budget introduced amount required to maintain the growth of the 8% level.
(3) Scenario Setting
1) Base Case
The Uzbekistani government has implemented a continually expanding fiscal policy to sustain the
growth rate at an average annual rate of 13.5% by 2030.Implementation of the structural reform of
industry corresponding to this financial expenditure makes it possible to boost the country's economic
growth rate of 8%. When calculated based on the exchange rate of dollars in 2013 as a basis year, this
fiscal expenditure plan, it is necessary to ensure the financial resources of 75.5 billion USD in 2030.
2) Energy Saving Case
Energy saving case is a case that made the implementation of 20% energy savings policy based on
the base case. World bank study reports have pointed out that Uzbekistan’s energy intensive
industries will remain high for the long term, and therefore there is a high potential for energy saving.
According to the same report, the energy-saving potential in the power sector showed the order of
about 20%4. In Uzbekistan, where energy-related equipment is aging, updating such equipment will
have a positive impact on energy saving. In this case, the power plant, cogeneration plants, heat
4 World Bank, “Uzbekistan Energy Efficiency Strategy for Industrial Enterprises”, June 2013, page ix
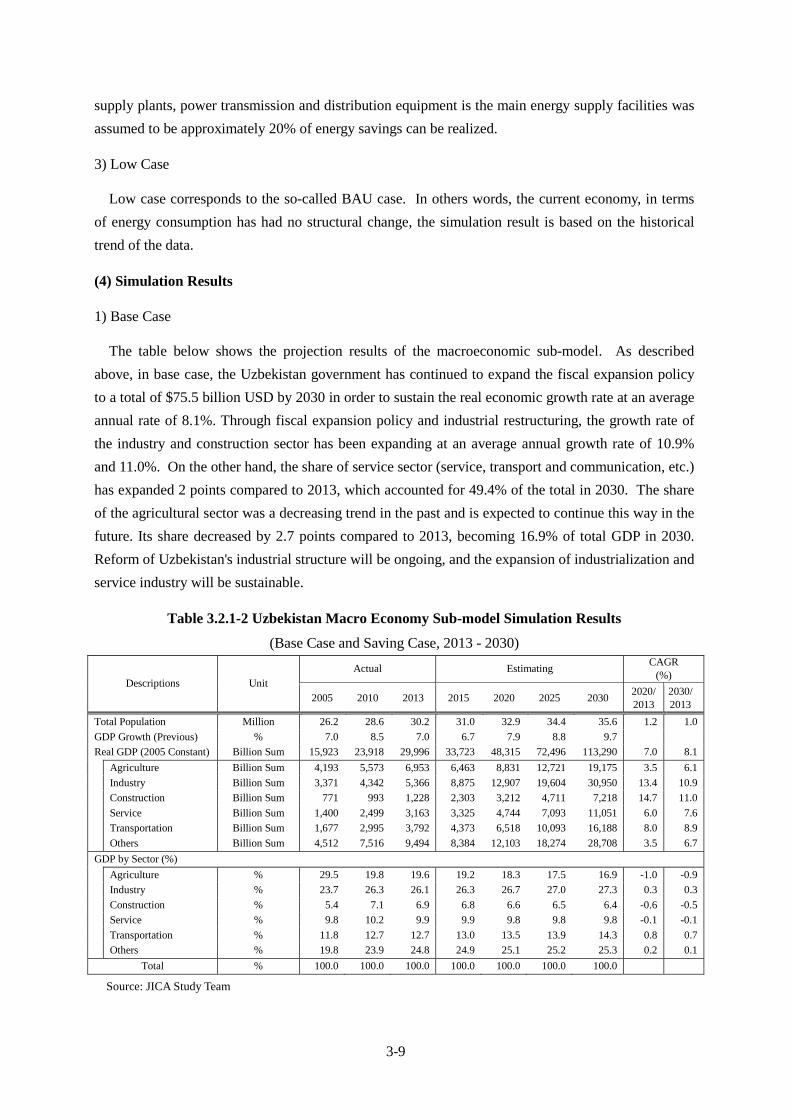
3-9
supply plants, power transmission and distribution equipment is the main energy supply facilities was
assumed to be approximately 20% of energy savings can be realized.
3) Low Case
Low case corresponds to the so-called BAU case. In others words, the current economy, in terms
of energy consumption has had no structural change, the simulation result is based on the historical
trend of the data.
(4) Simulation Results
1) Base Case
The table below shows the projection results of the macroeconomic sub-model. As described
above, in base case, the Uzbekistan government has continued to expand the fiscal expansion policy
to a total of $75.5 billion USD by 2030 in order to sustain the real economic growth rate at an average
annual rate of 8.1%. Through fiscal expansion policy and industrial restructuring, the growth rate of
the industry and construction sector has been expanding at an average annual growth rate of 10.9%
and 11.0%. On the other hand, the share of service sector (service, transport and communication, etc.)
has expanded 2 points compared to 2013, which accounted for 49.4% of the total in 2030. The share
of the agricultural sector was a decreasing trend in the past and is expected to continue this way in the
future. Its share decreased by 2.7 points compared to 2013, becoming 16.9% of total GDP in 2030.
Reform of Uzbekistan's industrial structure will be ongoing, and the expansion of industrialization and
service industry will be sustainable.
Table 3.2.1-2 Uzbekistan Macro Economy Sub-model Simulation Results
(Base Case and Saving Case, 2013 - 2030)
Descriptions Unit Actual Estimating
CAGR (%)
2005 2010 2013 2015 2020 2025 2030 2020/2013
2030/ 2013
Total Population Million 26.2 28.6 30.2 31.0 32.9 34.4 35.6 1.2 1.0
GDP Growth (Previous) % 7.0 8.5 7.0 6.7 7.9 8.8 9.7
Real GDP (2005 Constant) Billion Sum 15,923 23,918 29,996 33,723 48,315 72,496 113,290 7.0 8.1
Agriculture Billion Sum 4,193 5,573 6,953 6,463 8,831 12,721 19,175 3.5 6.1
Industry Billion Sum 3,371 4,342 5,366 8,875 12,907 19,604 30,950 13.4 10.9
Construction Billion Sum 771 993 1,228 2,303 3,212 4,711 7,218 14.7 11.0
Service Billion Sum 1,400 2,499 3,163 3,325 4,744 7,093 11,051 6.0 7.6
Transportation Billion Sum 1,677 2,995 3,792 4,373 6,518 10,093 16,188 8.0 8.9
Others Billion Sum 4,512 7,516 9,494 8,384 12,103 18,274 28,708 3.5 6.7
GDP by Sector (%)
Agriculture % 29.5 19.8 19.6 19.2 18.3 17.5 16.9 -1.0 -0.9
Industry % 23.7 26.3 26.1 26.3 26.7 27.0 27.3 0.3 0.3
Construction % 5.4 7.1 6.9 6.8 6.6 6.5 6.4 -0.6 -0.5
Service % 9.8 10.2 9.9 9.9 9.8 9.8 9.8 -0.1 -0.1
Transportation % 11.8 12.7 12.7 13.0 13.5 13.9 14.3 0.8 0.7
Others % 19.8 23.9 24.8 24.9 25.1 25.2 25.3 0.2 0.1
Total % 100.0 100.0 100.0 100.0 100.0 100.0 100.0
Source: JICA Study Team

3-10
According to “The Institute of Forecasting and Macroeconomic Research” (IFMR), Uzbekistan
electric power demand has doubled compared to 2013 became 105,000 GWh in 2030.In present,
Uzbekistan have no plans to introduce nuclear power in future. The increase of energy demand in the
future will be supplemented by renewable energy and coal. According to the projection result
provided by IFMR, the ratio of renewable energy to total energy consumption in 2030 is estimated to
reach 6% of the total energy supply. The energy supply and demand modeling simulated by IFMR is
based on the software tool “e-views” and “Excel” base optimization model. “e-view” is one of the
famous software tool on econometric analysis.
Electric power demand forecast of this study, estimates based on the data of Uzbekenergo JSC.
Explanatory variable such as Macro-economic, population, number of households, floor space and
electricity tariff will be used to estimate the electric power demand by each sector. The total of
projection result by sector became electric power demand of final sector. The total electric power
demand for Uzbekistan is calculated by final electricity demand, transmission losses and private use.
In the case of electricity demand, the total power demand is growing at an average annual growth
rate of 3.7% from 54,980 GWh in 2013, and is expected to reach 101,271 GWh in 2030.According to
the power development plan of Uzbekenergo JSC, the company will continue to promote the power
exports to neighboring countries where the target is to reach 3,600 GWh by 2030. Export of power is
mainly to Afghanistan, but some of the power exportsare under plans to be supplied to the northern
part of Pakistan in the future. Domestic electric power demand is projected to increase at an average
annual growth rate of 3.6% in 2030, resulting in 97,671 GWh. The amount of 75,989 GWh will be
consumed in the final sector, and the remaining 21,683 GWh will be supplied for power plant private
use and transmission loss. According to the Uzbekenergo JSC’s documents, the average transmission
line loss is about 15.7% and power plant private use at an average of 5.1% in the past ten years from
2003 to 2012. From the interviews conducted by Uzbekenergo JSC, it has been revealed that about
approximately 16% of the total electric supply is transmission and distribution loss. If this is proven,
on the assumption that not seen technology improves, the transmission and distribution loss of 2030
will become 18,279 GWh (15.7%) and power plant private use will become 3,404 GWh (5.1%).
In the final sector, the residential sector will become the maximum electric power demand sector in
2030, and its share will reach 43.1% (32,780 GWh), growing to an average annual rate of 4.9% from
2013 to 2030.It will become the second highest growth rate following the 7.5% rate of the
construction sector. In total, the residential sector is the main driving force behind the growth of
electric power demand in the country. In terms of the industrial sector, the effects of the industry
reform have appeared gradually through a long period of adjustment between 1991 (when the country
gained independence) and2007. In recent years, and as as an industrial policy, the government has
supported the industrial park construction and a special economic zone to each region of small and
medium-sized enterprises. It seems that if such a policy is conducted continuously, the electric power
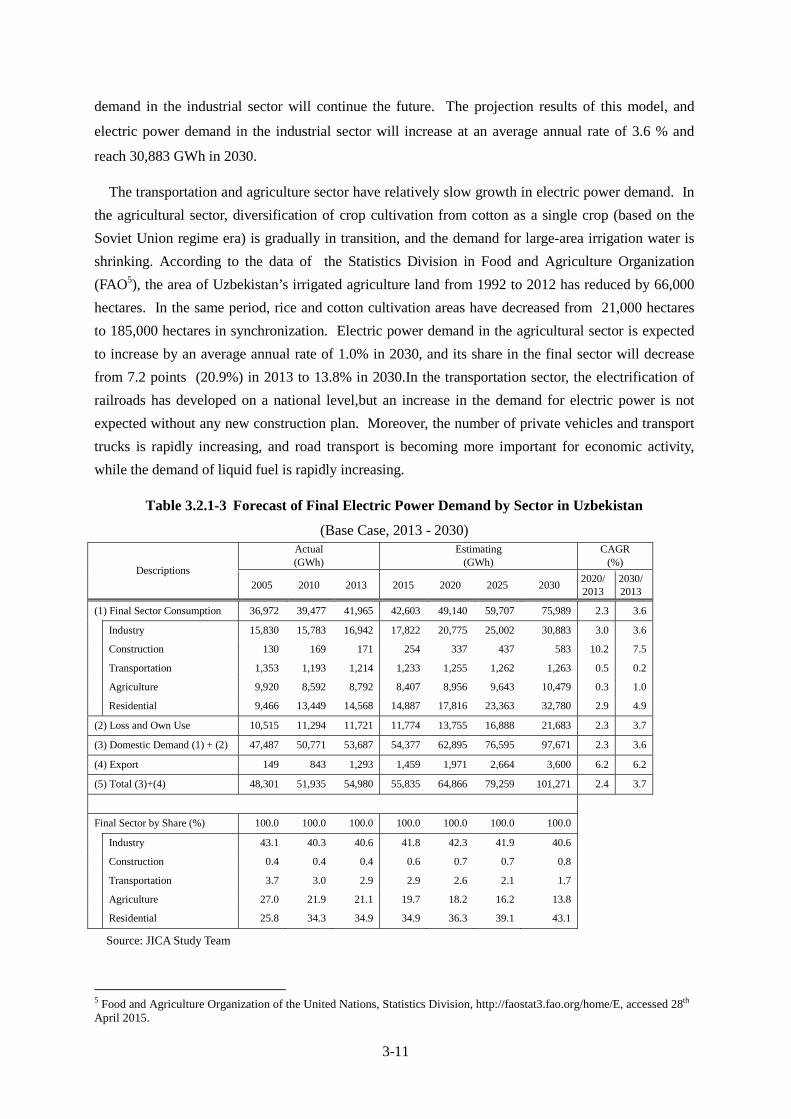
3-11
demand in the industrial sector will continue the future. The projection results of this model, and
electric power demand in the industrial sector will increase at an average annual rate of 3.6 % and
reach 30,883 GWh in 2030.
The transportation and agriculture sector have relatively slow growth in electric power demand. In
the agricultural sector, diversification of crop cultivation from cotton as a single crop (based on the
Soviet Union regime era) is gradually in transition, and the demand for large-area irrigation water is
shrinking. According to the data of the Statistics Division in Food and Agriculture Organization
(FAO5), the area of Uzbekistan’s irrigated agriculture land from 1992 to 2012 has reduced by 66,000
hectares. In the same period, rice and cotton cultivation areas have decreased from 21,000 hectares
to 185,000 hectares in synchronization. Electric power demand in the agricultural sector is expected
to increase by an average annual rate of 1.0% in 2030, and its share in the final sector will decrease
from 7.2 points (20.9%) in 2013 to 13.8% in 2030.In the transportation sector, the electrification of
railroads has developed on a national level,but an increase in the demand for electric power is not
expected without any new construction plan. Moreover, the number of private vehicles and transport
trucks is rapidly increasing, and road transport is becoming more important for economic activity,
while the demand of liquid fuel is rapidly increasing.
Table 3.2.1-3 Forecast of Final Electric Power Demand by Sector in Uzbekistan
(Base Case, 2013 - 2030)
Descriptions
Actual (GWh)
Estimating (GWh)
CAGR (%)
2005 2010 2013 2015 2020 2025 2030 2020/2013
2030/2013
(1) Final Sector Consumption 36,972 39,477 41,965 42,603 49,140 59,707 75,989 2.3 3.6
Industry 15,830 15,783 16,942 17,822 20,775 25,002 30,883 3.0 3.6
Construction 130 169 171 254 337 437 583 10.2 7.5
Transportation 1,353 1,193 1,214 1,233 1,255 1,262 1,263 0.5 0.2
Agriculture 9,920 8,592 8,792 8,407 8,956 9,643 10,479 0.3 1.0
Residential 9,466 13,449 14,568 14,887 17,816 23,363 32,780 2.9 4.9
(2) Loss and Own Use 10,515 11,294 11,721 11,774 13,755 16,888 21,683 2.3 3.7
(3) Domestic Demand (1) + (2) 47,487 50,771 53,687 54,377 62,895 76,595 97,671 2.3 3.6
(4) Export 149 843 1,293 1,459 1,971 2,664 3,600 6.2 6.2
(5) Total (3)+(4) 48,301 51,935 54,980 55,835 64,866 79,259 101,271 2.4 3.7
Final Sector by Share (%) 100.0 100.0 100.0 100.0 100.0 100.0 100.0
Industry 43.1 40.3 40.6 41.8 42.3 41.9 40.6
Construction 0.4 0.4 0.4 0.6 0.7 0.7 0.8
Transportation 3.7 3.0 2.9 2.9 2.6 2.1 1.7
Agriculture 27.0 21.9 21.1 19.7 18.2 16.2 13.8
Residential 25.8 34.3 34.9 34.9 36.3 39.1 43.1
Source: JICA Study Team
5 Food and Agriculture Organization of the United Nations, Statistics Division, http://faostat3.fao.org/home/E, accessed 28th April 2015.
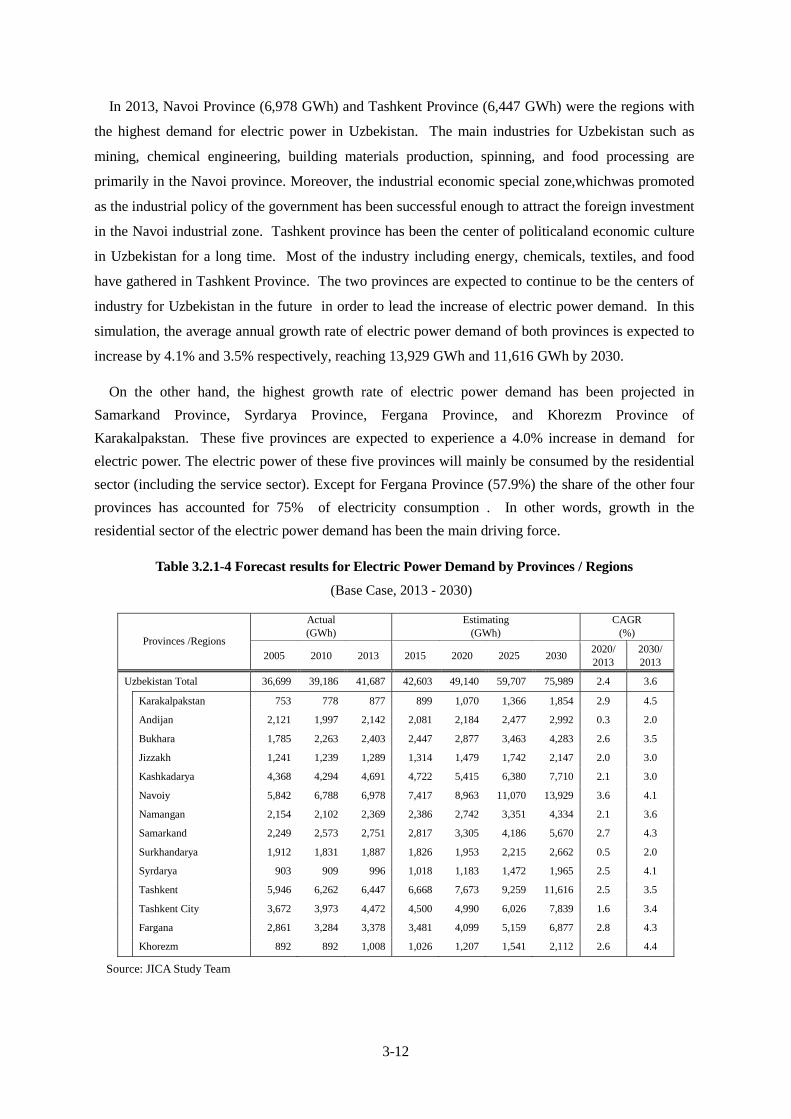
3-12
In 2013, Navoi Province (6,978 GWh) and Tashkent Province (6,447 GWh) were the regions with
the highest demand for electric power in Uzbekistan. The main industries for Uzbekistan such as
mining, chemical engineering, building materials production, spinning, and food processing are
primarily in the Navoi province. Moreover, the industrial economic special zone,whichwas promoted
as the industrial policy of the government has been successful enough to attract the foreign investment
in the Navoi industrial zone. Tashkent province has been the center of politicaland economic culture
in Uzbekistan for a long time. Most of the industry including energy, chemicals, textiles, and food
have gathered in Tashkent Province. The two provinces are expected to continue to be the centers of
industry for Uzbekistan in the future in order to lead the increase of electric power demand. In this
simulation, the average annual growth rate of electric power demand of both provinces is expected to
increase by 4.1% and 3.5% respectively, reaching 13,929 GWh and 11,616 GWh by 2030.
On the other hand, the highest growth rate of electric power demand has been projected in
Samarkand Province, Syrdarya Province, Fergana Province, and Khorezm Province of
Karakalpakstan. These five provinces are expected to experience a 4.0% increase in demand for
electric power. The electric power of these five provinces will mainly be consumed by the residential
sector (including the service sector). Except for Fergana Province (57.9%) the share of the other four
provinces has accounted for 75% of electricity consumption . In other words, growth in the
residential sector of the electric power demand has been the main driving force.
Table 3.2.1-4 Forecast results for Electric Power Demand by Provinces / Regions
(Base Case, 2013 - 2030)
Provinces /Regions
Actual (GWh)
Estimating (GWh)
CAGR (%)
2005 2010 2013 2015 2020 2025 2030 2020/ 2013
2030/ 2013
Uzbekistan Total 36,699 39,186 41,687 42,603 49,140 59,707 75,989 2.4 3.6
Karakalpakstan 753 778 877 899 1,070 1,366 1,854 2.9 4.5
Andijan 2,121 1,997 2,142 2,081 2,184 2,477 2,992 0.3 2.0
Bukhara 1,785 2,263 2,403 2,447 2,877 3,463 4,283 2.6 3.5
Jizzakh 1,241 1,239 1,289 1,314 1,479 1,742 2,147 2.0 3.0
Kashkadarya 4,368 4,294 4,691 4,722 5,415 6,380 7,710 2.1 3.0
Navoiy 5,842 6,788 6,978 7,417 8,963 11,070 13,929 3.6 4.1
Namangan 2,154 2,102 2,369 2,386 2,742 3,351 4,334 2.1 3.6
Samarkand 2,249 2,573 2,751 2,817 3,305 4,186 5,670 2.7 4.3
Surkhandarya 1,912 1,831 1,887 1,826 1,953 2,215 2,662 0.5 2.0
Syrdarya 903 909 996 1,018 1,183 1,472 1,965 2.5 4.1
Tashkent 5,946 6,262 6,447 6,668 7,673 9,259 11,616 2.5 3.5
Tashkent City 3,672 3,973 4,472 4,500 4,990 6,026 7,839 1.6 3.4
Fargana 2,861 3,284 3,378 3,481 4,099 5,159 6,877 2.8 4.3
Khorezm 892 892 1,008 1,026 1,207 1,541 2,112 2.6 4.4
Source: JICA Study Team

3-13
2) Conclusion of the Simulation Result
Figure 3.2.1-2 shows the comparison between the results of the three scenarios. On the basis of
these results, the following features have been observed.
① In the base case, the government fiscal expansion policy will maintain high economic growth at
8.1% by 2030. At the same time the demand for electric power will increase at an average
annual rate of 3.7% by 2030. The demand for electric power in 2030 will reach 101,270 GWh,
which is double that of 2013. Although the GDP elasticity value of the electric power demand of
2013 was abnormally low as 0.35 (the demand for power is not reflected because of the power
shortage issue), the value will rise to 0.56 in 2030. It means the relationship between the
economic activity and the demand for electric power has become stronger. In the same period,
per capita electric power consumption was increased to 2,841 kWh from 1,844 kWh in 2013.
② In the saving case, the growth rate of electric power demand during the forecast period will be
loosely 2.4%, if 20% of the energy saving potential of power sector has been reduced. Electric
power demand in 2030 has predicted at 82,900 GWh, and if we compare this to the base case
amount of 18,371 GWh, then electricity can be saved. In particular, if compared to transmission
and distribution losses in developed countries, which is about 6% of total electricity supply,
Uzbekistan has high potential on reducing the loss at about 16% at this movement. It also mean
that, about 10% reduction can be achieved by improving the transmission and distribution
technology.
③ In the low case, electric power demand of Uzbekistan is projected to increase at an average
annual rate of 2.1% from 2013to 2030, reaching 78,026 GWh in 2030. This amount of demand
at about 77% is compared to the base case of 2030. As a result, the contribution of residential
sector is projected more higher than industry sector on electricity demand of Uzbekistan. The
demand for electric power for residential sector is projected to increase at an average annual rate
of 2.9% by 2030, compared to 1.6% in the industry sector.
Source: JICA Study Team
Figure 3.2.1-2 Simulation Result Comparison by Case (2013, 2020, 2030)
54,980 54,980 54,980
64,866 64,23960,498
101,271
82,90078,026
0
20,000
40,000
60,000
80,000
100,000
120,000
Base Case Saving Case Low Case
(GWh)
2013 2020 2030
3.7%
2.4%2.1%

3-14
3) Other Simulation Results
Energy Saving Case
Macroeconomic indicator projection results are the same as the base case (see table 3.2.1-2).
Table 3.2.1-5 Forecast of Final Electric Power Demand by Sector in Uzbekistan
(Saving Case, 2013 - 2030)
Descriptions
Actual (GWh)
Estimating (GWh)
CAGR (%)
2005 2010 2013 2015 2020 2025 2030 2020/2013
2030/2013
(1) Final Sector Consumption 36,972 39,477 41,965 43,524 48,650 54,652 61,696 2.1 2.3
Industry 15,830 15,783 16,942 17,580 19,283 21,150 23,198 1.9 1.9
Construction 130 169 171 185 225 273 332 4.0 4.0
Transportation 1,353 1,193 1,214 1,214 1,214 1,214 1,214 0.0 0.0
Agriculture 9,920 8,592 8,792 8,816 8,877 8,939 9,001 0.1 0.1
Residential 9,466 13,449 14,568 15,729 19,051 23,076 27,950 3.9 3.9
(2) Loss and Own Use 10,515 11,294 11,721 12,028 13,618 15,458 17,604 2.2 2.4
(3) Domestic Demand (1) + (2) 47,487 50,771 53,687 55,552 62,268 70,110 79,300 2.1 2.3
(4) Export 149 843 1,293 1,459 1,971 2,664 3,600 6.2 6.2
(5) Total (3)+(4) 48,301 51,935 54,980 57,011 64,239 72,774 82,900 2.2 2.4
Share by Share (%) 100.0 100.0 100.0 100.0 100.0 100.0 100.0
Industry 43.1 40.3 40.6 40.4 39.6 38.7 37.6
Construction 0.4 0.4 0.4 0.4 0.5 0.5 0.5
Transportation 3.7 3.0 2.9 2.8 2.5 2.2 2.0
Agriculture 27.0 21.9 21.1 20.3 18.2 16.4 14.6
Residential 25.8 34.3 34.9 36.1 39.2 42.2 45.3
Source: JICA Study Team
Table 3.2.1-6 Forecast results for Electric Power Demand by Provinces / Regions
(Saving Case, 2013 - 2030)
Provinces /Regions
Actual (GWh)
Estimating (GWh)
CAGR (%)
2005 2010 2013 2015 2020 2025 2030 2020/ 2013
2030/ 2013
Uzbekistan Total 36,699 39,186 41,687 43,524 48,650 54,652 61,696 2.2 2.3
Karakalpakstan 753 778 877 937 1,110 1,322 1,579 3.4 3.5
Andijan 2,121 1,997 2,142 2,151 2,207 2,304 2,435 0.4 0.8
Bukhara 1,785 2,263 2,403 2,537 2,873 3,221 3,597 2.6 2.4
Jizzakh 1,241 1,239 1,289 1,341 1,481 1,641 1,825 2.0 2.1
Kashkadarya 4,368 4,294 4,691 4,884 5,364 5,855 6,371 1.9 1.8
Navoiy 5,842 6,788 6,978 7,386 8,417 9,486 10,611 2.7 2.5
Namangan 2,154 2,102 2,369 2,473 2,777 3,152 3,611 2.3 2.5
Samarkand 2,249 2,573 2,751 2,911 3,390 3,997 4,753 3.0 3.3
Surkhandarya 1,912 1,831 1,887 1,904 1,977 2,093 2,253 0.7 1.0
Syrdarya 903 909 996 1,049 1,209 1,417 1,682 2.8 3.1
Tashkent 5,946 6,262 6,447 6,698 7,391 8,183 9,088 2.0 2.0
Tashkent City 3,672 3,973 4,472 4,629 5,119 5,757 6,563 1.9 2.3
Fargana 2,861 3,284 3,378 3,559 4,094 4,759 5,576 2.8 3.0
Khorezm 892 892 1,008 1,065 1,239 1,466 1,752 3.0 3.3
Source: JICA Study Team
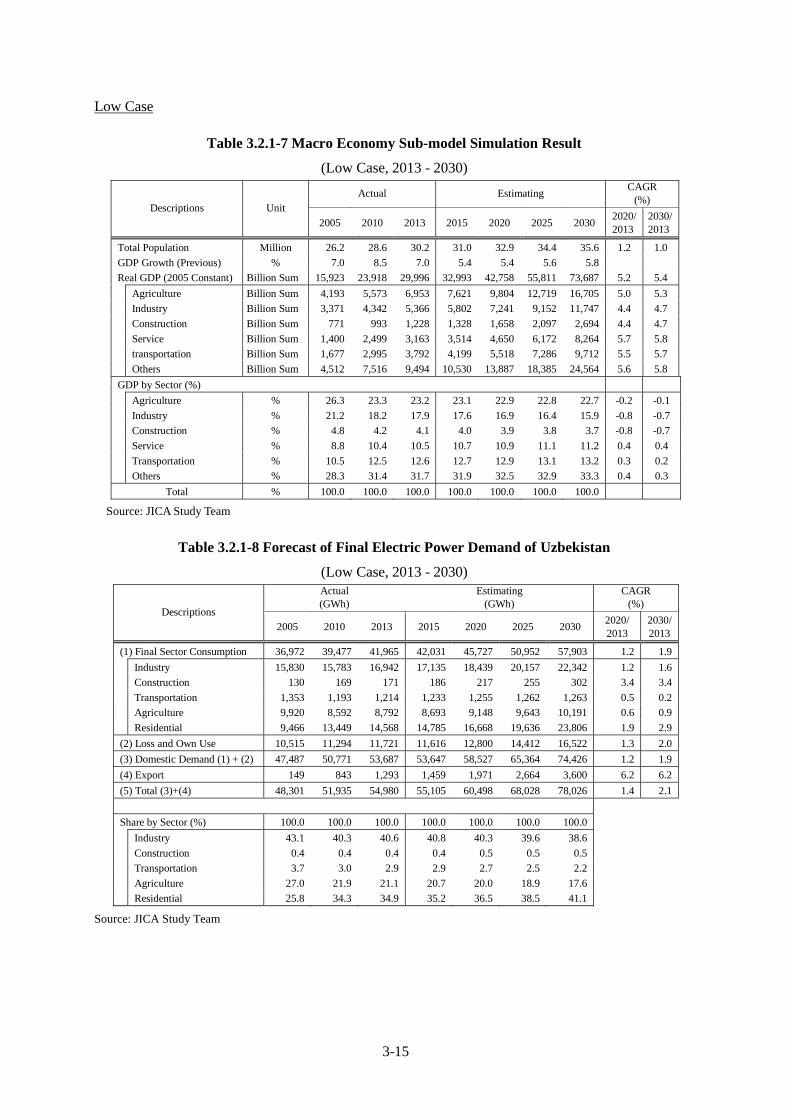
3-15
Low Case
Table 3.2.1-7 Macro Economy Sub-model Simulation Result
(Low Case, 2013 - 2030)
Descriptions Unit Actual Estimating
CAGR (%)
2005 2010 2013 2015 2020 2025 20302020/2013
2030/2013
Total Population Million 26.2 28.6 30.2 31.0 32.9 34.4 35.6 1.2 1.0
GDP Growth (Previous) % 7.0 8.5 7.0 5.4 5.4 5.6 5.8
Real GDP (2005 Constant) Billion Sum 15,923 23,918 29,996 32,993 42,758 55,811 73,687 5.2 5.4
Agriculture Billion Sum 4,193 5,573 6,953 7,621 9,804 12,719 16,705 5.0 5.3
Industry Billion Sum 3,371 4,342 5,366 5,802 7,241 9,152 11,747 4.4 4.7
Construction Billion Sum 771 993 1,228 1,328 1,658 2,097 2,694 4.4 4.7
Service Billion Sum 1,400 2,499 3,163 3,514 4,650 6,172 8,264 5.7 5.8
transportation Billion Sum 1,677 2,995 3,792 4,199 5,518 7,286 9,712 5.5 5.7
Others Billion Sum 4,512 7,516 9,494 10,530 13,887 18,385 24,564 5.6 5.8
GDP by Sector (%)
Agriculture % 26.3 23.3 23.2 23.1 22.9 22.8 22.7 -0.2 -0.1
Industry % 21.2 18.2 17.9 17.6 16.9 16.4 15.9 -0.8 -0.7
Construction % 4.8 4.2 4.1 4.0 3.9 3.8 3.7 -0.8 -0.7
Service % 8.8 10.4 10.5 10.7 10.9 11.1 11.2 0.4 0.4
Transportation % 10.5 12.5 12.6 12.7 12.9 13.1 13.2 0.3 0.2
Others % 28.3 31.4 31.7 31.9 32.5 32.9 33.3 0.4 0.3
Total % 100.0 100.0 100.0 100.0 100.0 100.0 100.0
Source: JICA Study Team
Table 3.2.1-8 Forecast of Final Electric Power Demand of Uzbekistan
(Low Case, 2013 - 2030)
Descriptions
Actual (GWh)
Estimating (GWh)
CAGR (%)
2005 2010 2013 2015 2020 2025 2030 2020/ 2013
2030/2013
(1) Final Sector Consumption 36,972 39,477 41,965 42,031 45,727 50,952 57,903 1.2 1.9
Industry 15,830 15,783 16,942 17,135 18,439 20,157 22,342 1.2 1.6
Construction 130 169 171 186 217 255 302 3.4 3.4
Transportation 1,353 1,193 1,214 1,233 1,255 1,262 1,263 0.5 0.2
Agriculture 9,920 8,592 8,792 8,693 9,148 9,643 10,191 0.6 0.9
Residential 9,466 13,449 14,568 14,785 16,668 19,636 23,806 1.9 2.9
(2) Loss and Own Use 10,515 11,294 11,721 11,616 12,800 14,412 16,522 1.3 2.0
(3) Domestic Demand (1) + (2) 47,487 50,771 53,687 53,647 58,527 65,364 74,426 1.2 1.9
(4) Export 149 843 1,293 1,459 1,971 2,664 3,600 6.2 6.2
(5) Total (3)+(4) 48,301 51,935 54,980 55,105 60,498 68,028 78,026 1.4 2.1
Share by Sector (%) 100.0 100.0 100.0 100.0 100.0 100.0 100.0
Industry 43.1 40.3 40.6 40.8 40.3 39.6 38.6
Construction 0.4 0.4 0.4 0.4 0.5 0.5 0.5
Transportation 3.7 3.0 2.9 2.9 2.7 2.5 2.2
Agriculture 27.0 21.9 21.1 20.7 20.0 18.9 17.6
Residential 25.8 34.3 34.9 35.2 36.5 38.5 41.1
Source: JICA Study Team

3-16
Table 3.2.1-9 Forecast results for Electric Power Demand by Provinces / Regions
(Low Case, 2013 - 2030)
Provinces / Regions
Actual (GWh)
Estimating (GWh)
CAGR (%)
2005 2010 2013 2015 2020 2025 2030 2020/ 2013
2030/ 2013
Uzbekistan Total 36,699 39,186 41,687 42,031 45,727 50,952 57,903 1.3 1.9
Karakalpakstan 753 778 877 896 1,017 1,189 1,423 2.1 2.9
Andijan 2,121 1,997 2,142 2,061 2,030 2,082 2,201 -0.8 0.2
Bukhara 1,785 2,263 2,403 2,471 2,809 3,197 3,653 2.3 2.5
Jizzakh 1,241 1,239 1,289 1,306 1,411 1,551 1,734 1.3 1.8
Kashkadarya 4,368 4,294 4,691 4,753 5,243 5,820 6,498 1.6 1.9
Navoiy 5,842 6,788 6,978 7,194 8,081 9,119 10,347 2.1 2.3
Namangan 2,154 2,102 2,369 2,383 2,607 2,932 3,375 1.4 2.1
Samarkand 2,249 2,573 2,751 2,787 3,086 3,546 4,197 1.7 2.5
Surkhandarya 1,912 1,831 1,887 1,846 1,903 2,018 2,195 0.1 0.9
Syrdarya 903 909 996 1,015 1,126 1,289 1,518 1.8 2.5
Tashkent 5,946 6,262 6,447 6,478 6,937 7,609 8,510 1.1 1.6
Tashkent City 3,672 3,973 4,472 4,409 4,594 5,023 5,703 0.4 1.4
Fargana 2,861 3,284 3,378 3,417 3,763 4,284 5,013 1.6 2.3
Khorezm 892 892 1,008 1,016 1,122 1,292 1,537 1.5 2.5
Source: JICA Study Team
(5) Electric power demand applied in the power development plan
For future electric power demand applied in the power development plan, we adopted the base case
demand forecast from the above-mentioned power demand forecasts. Table 3.2.1-10 shows a
comparison of the base case power demand forecast made in this study and that made by Uzbekenergo
JSC.
Table 3.2.1-10 Comparison of Power Demand Forecast
(Unit: GW/h)
Year 2015 2020 2025 2030
Uzbekenergo JSC 59,800 71,800 86,800 106,800
JICA Study Team (base load) 55,835 64,866 79,259 101,271
Source: JICA Study Team
In contrast to the demand forecast shown in Table 3.2.1-10 the peak power must be calculated by
applying the load factor (0.757), which will be described later. The Figure 3.2.1-3 shows the peak
demand forecast.
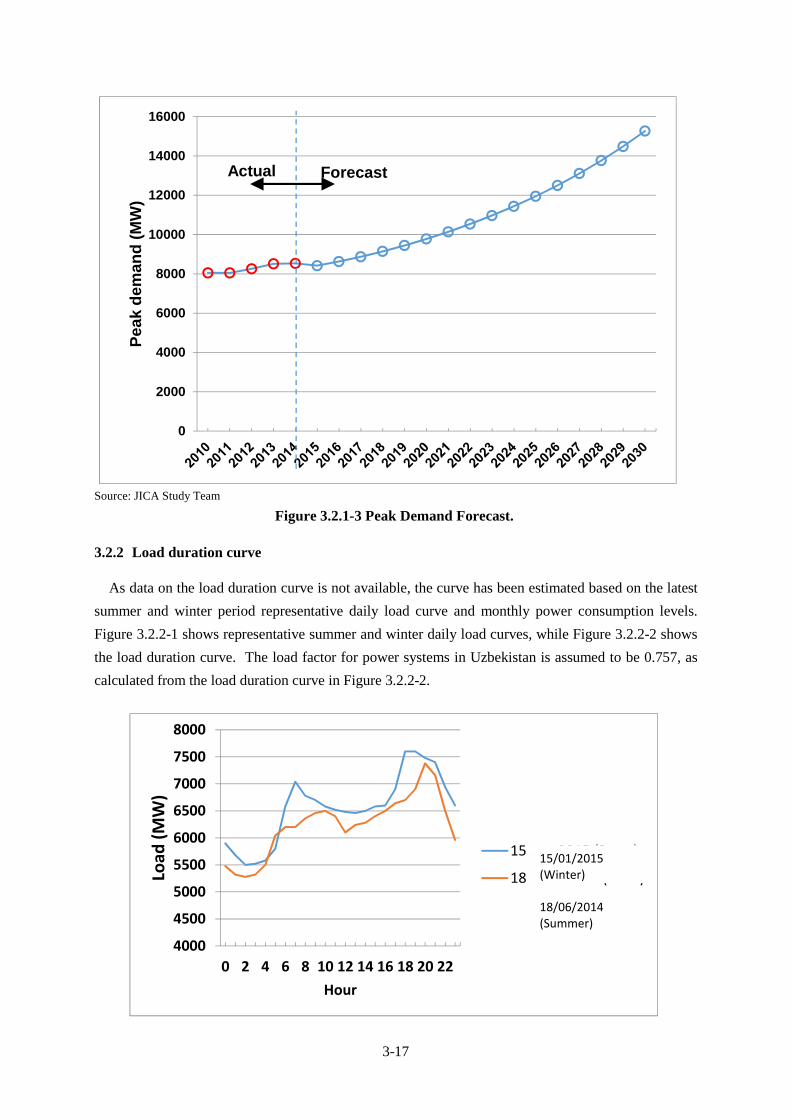
3-17
Source: JICA Study Team
Figure 3.2.1-3 Peak Demand Forecast.
3.2.2 Load duration curve
As data on the load duration curve is not available, the curve has been estimated based on the latest
summer and winter period representative daily load curve and monthly power consumption levels.
Figure 3.2.2-1 shows representative summer and winter daily load curves, while Figure 3.2.2-2 shows
the load duration curve. The load factor for power systems in Uzbekistan is assumed to be 0.757, as
calculated from the load duration curve in Figure 3.2.2-2.
0
2000
4000
6000
8000
10000
12000
14000
16000
Pe
ak
de
ma
nd
(M
W)
ForecastActual
4000
4500
5000
5500
6000
6500
7000
7500
8000
0 2 4 6 8 10 12 14 16 18 20 22
Load
(MW)
Hour
15 янв.2015 (Зима)
18 июня 2014(Лето)
15/01/2015 (Winter)
18/06/2014 (Summer)
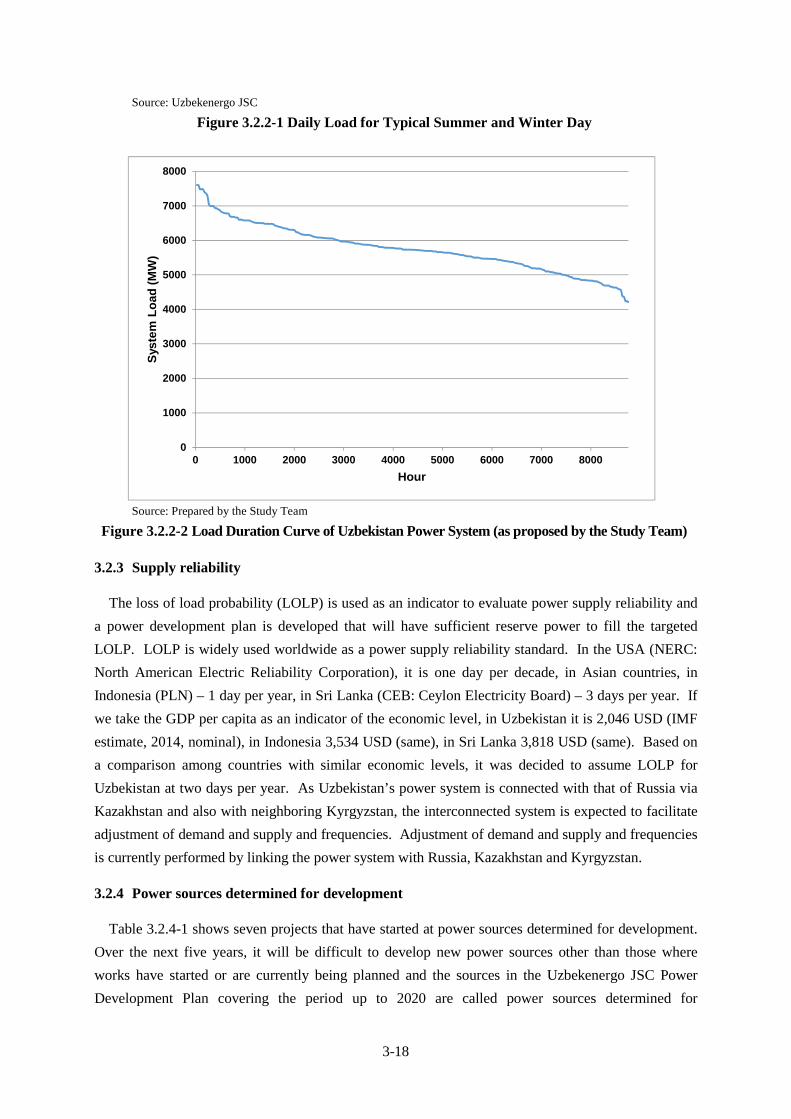
3-18
Source: Uzbekenergo JSC
Figure 3.2.2-1 Daily Load for Typical Summer and Winter Day
Source: Prepared by the Study Team
Figure 3.2.2-2 Load Duration Curve of Uzbekistan Power System (as proposed by the Study Team)
3.2.3 Supply reliability
The loss of load probability (LOLP) is used as an indicator to evaluate power supply reliability and
a power development plan is developed that will have sufficient reserve power to fill the targeted
LOLP. LOLP is widely used worldwide as a power supply reliability standard. In the USA (NERC:
North American Electric Reliability Corporation), it is one day per decade, in Asian countries, in
Indonesia (PLN) – 1 day per year, in Sri Lanka (CEB: Ceylon Electricity Board) – 3 days per year. If
we take the GDP per capita as an indicator of the economic level, in Uzbekistan it is 2,046 USD (IMF
estimate, 2014, nominal), in Indonesia 3,534 USD (same), in Sri Lanka 3,818 USD (same). Based on
a comparison among countries with similar economic levels, it was decided to assume LOLP for
Uzbekistan at two days per year. As Uzbekistan’s power system is connected with that of Russia via
Kazakhstan and also with neighboring Kyrgyzstan, the interconnected system is expected to facilitate
adjustment of demand and supply and frequencies. Adjustment of demand and supply and frequencies
is currently performed by linking the power system with Russia, Kazakhstan and Kyrgyzstan.
3.2.4 Power sources determined for development
Table 3.2.4-1 shows seven projects that have started at power sources determined for development.
Over the next five years, it will be difficult to develop new power sources other than those where
works have started or are currently being planned and the sources in the Uzbekenergo JSC Power
Development Plan covering the period up to 2020 are called power sources determined for
0
1000
2000
3000
4000
5000
6000
7000
8000
0 1000 2000 3000 4000 5000 6000 7000 8000
Sys
tem
Lo
ad
(MW
)
Hour

3-19
development. As for the development plans for power plants using renewable energy sources such as
solar and wind energy, the Power Development Plan developed by Uzbekenergo JSC will be used in
this study as it reflects the official energy policy.
Table 3.2.4-1 Power plant construction: projects already under way
Plant name Capacity (MW), type Expected year of commissioning
Source of funding
Syrdarya TPP 50 MW steam turbine 2014 UFRD
Tashkent TPP 370 MW GTCC 2015 UFRD, Uzbekenergo JSC’s own funds, local banks, foreign investors
Talimarjan TPP 900 MW GTCC (450 MW×2)
2016 UFRD, ADB, JICA, Uzbekenergo JSC’s own funds, public capital
Angren TPP 130-150 MW steam turbine 2016 China’s credit for SCO member-countries, Uzbekenergo JSC’s own funds
Navoi TPP-2 450 MW GTCC 2017 UFRD, JICA, Uzbekenergo JSC’s own funds
Turakurgan TPP 900 MW GTCC (450 MW×2)
2017 UFRD, JICA, Uzbekenergo JSC’s own funds
Takhiatash TPP 250 MW×2 units GTCC 2020 UFRD, ADB, Uzbekenergo JSC’s own funds
Tashkent CHP 30MW×4units GTCS 2020 UFRD, JICA, Uzbekenergo JSC’s own funds
Source: Uzbekenergo JSC
3.2.5 Existing power plants decommissioning plan
Existing power plants will be discontinued according to the plan shown in Table 3.2.5-1 “Existing
Uzbekenergo JSC plants decommission plan”.

3-20
Table 3.2.5-1 SJSC Uzbekenergo JSC – Existing plants decommission plan
Source: Uzbekenergo JSC
Power unit
Commissioning Year
Installed capacity (MW)
Proposed year for decommissioning 2015 2016 2017 2018 2019 2020 2021 2022 2023 2024 2025 2026 2027 2028 2029 2030
Tashkent TPP
1 1963 150 Decom. 2 1964 150 Decom. 3 1965 150 Decom. 4 1965 150 Decom. 5 1966 150 Decom. 6 1967 155 Decom. 7 1967 165 Decom. 8 1968 165 Decom. 9 1969 150 Decom. 10 1970 165 Decom. 11 1970 155 Decom. 12 1971 155 Decom.
Navoi TPP
3 1964 150 Decom. 4 1965 150 Decom. 8 1968 160 Decom.
9 1969 160 Decom.
11 1980 210 12 1981 210 1 1963 25 Decom. 2 1963 25 Decom. 5 1966 50 Decom. 6 1967 60 Decom. 7 1971 50 Decom.
Takhiatash TPP
1 1967 100 Decom. 2 1968 100 Decom. 3 1974 110 Decom.
Angren TPP
1 1957 52.5 Decom. 2 1958 54.5 Decom. 3 1958 53 Decom. 4 1958 52 Decom. 5 1960 68 Decom. 6 1961 68 Decom. 7 1962 68 Decom. 8 1963 68 Decom.

3-21
3.2.6 Power sources proposed for development
The thermal power plants considered as development candidates in the development plans
in this study are those for which fuel can be procured from within Uzbekistan and Table
3.2.6-1 shows information on the gas turbine combined cycle, coal-firing and simple cycle
gas turbine plants already introduced. As for the basic characteristics of thermal power
plants, proposed as development candidates, GTCC is assumed to be similar to those of
450MW class which are being introduced in Uzbekistan. As for the others, the characteristics
have been set on the basis of data from Gas turbine world and U.S. Department Of Energy,
U.S. Energy Information Administration 6 , and Power Development Master Plans of other
countries 7.
The candidates for hydropower development based on existing plans are shown in Table
3.2.6-2. As shown in Figure 3.1-1, these various conditions are put into Module-2 FIXSYS,
Module-3 VARYSYS of WASP and the combination of development candidates with
minimal cost is calculated.
Table 3.2.6-1 Basic Characteristics of thermal power plants, proposed as development candidates
Type
Capacity of
one unit
Type
Heat rate
(kCal/kW/h)
Heat efficie
ncy
Environmental measures
Construction cost (USD/k
W)
Construction phase
Operating lifeDenitrati
on Desulfuri
zation
Combined cycle
450 MW
1300 °C Class GT
1,616 53.2% Yes No 900 2 years20
years Simple cycle gas turbines
140 MW
1100°C Class GT
2,845 30.2% No No 900 1 year20
years
Coal-fired thermal power plants
150 MW
Subcritical 2,115 40.7% Yes Yes 2,000 3 years25
years
300 MW
High-efficiency, Subcritical
2,050 42.0% Yes Yes 2,000 3 years25
years
Source: JICA Study Team
6U.S. Energy Information Administration (April 2013) “Updated Capital Cost Estimates for Utility Scale
Electricity Generating Plants” 7JICA (March, 2014) ” The Project for Formulation of Power System Master Plan in Dar es Salaam and Review of Power System Master Plan”

3-22
Table 3.2.6-2 Basic characteristics of hydropower plants, proposed as development candidates Name of plant Type Installed
capacity (MW)
Construction cost (USD, kW)
Kamolot HPP Dam 8 MW 1,512.5Irgailiksai HPP Dam 13,6 MW 1,838.2Nijne-Koksu HPP Dam 20 MW 2,500.0Nijne-Chatkal HPP Dam 100 MW 1,055.0Khodjikent pumped-storage HPP
Pumped storage 200 MW 1,600.0
Mullalak HPP Dam 240 MW 1,973.8Akbulak HPP Dam 60 MW 1,046.7Pskem HPP Dam 404 MW 2,072.3
Source: Uzbekenergo JSC
3.2.7 Fuel price
Selling prices of the second half of 2014 targeted at Uzbekenergo JSC are used as fuel
prices for economic calculations in power development plans.
Table 3.2.7-1 Fuel prices
Fuel type Heat value Price Price per unit of heat
released Natural gas 8,200 kCal/Nm³
(normal cubic meters)181, 620 UZS/1,000
m³22.1 UZS/MCal*
Coal (lignite) 1,911 kCal/kg 115, 700 UZS/ton 60.5 UZS/MCal*
Source: Uzbekenergo JSC Note*: M (Mega) –106, MCal = 106 Cal = 1000 kCal
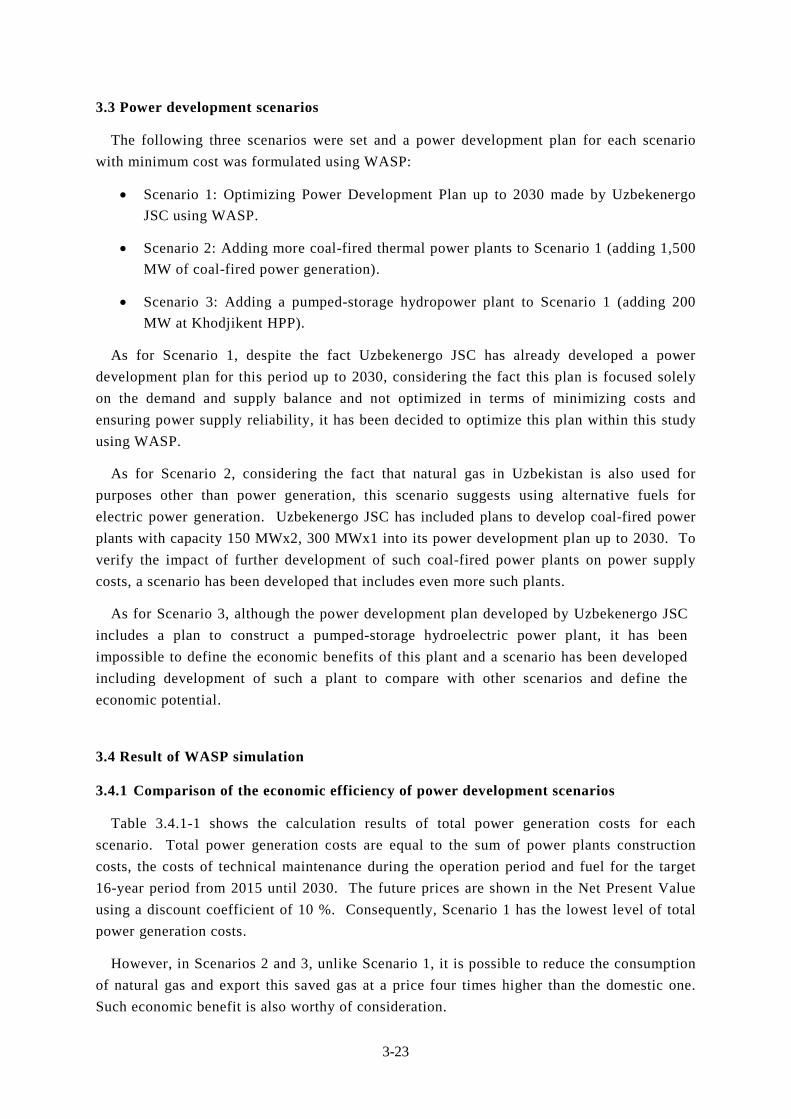
3-23
3.3 Power development scenarios
The following three scenarios were set and a power development plan for each scenario
with minimum cost was formulated using WASP:
Scenario 1: Optimizing Power Development Plan up to 2030 made by Uzbekenergo
JSC using WASP.
Scenario 2: Adding more coal-fired thermal power plants to Scenario 1 (adding 1,500
MW of coal-fired power generation).
Scenario 3: Adding a pumped-storage hydropower plant to Scenario 1 (adding 200
MW at Khodjikent HPP).
As for Scenario 1, despite the fact Uzbekenergo JSC has already developed a power
development plan for this period up to 2030, considering the fact this plan is focused solely
on the demand and supply balance and not optimized in terms of minimizing costs and
ensuring power supply reliability, it has been decided to optimize this plan within this study
using WASP.
As for Scenario 2, considering the fact that natural gas in Uzbekistan is also used for
purposes other than power generation, this scenario suggests using alternative fuels for
electric power generation. Uzbekenergo JSC has included plans to develop coal-fired power
plants with capacity 150 MWx2, 300 MWx1 into its power development plan up to 2030. To
verify the impact of further development of such coal-fired power plants on power supply
costs, a scenario has been developed that includes even more such plants.
As for Scenario 3, although the power development plan developed by Uzbekenergo JSC
includes a plan to construct a pumped-storage hydroelectric power plant, it has been
impossible to define the economic benefits of this plant and a scenario has been developed
including development of such a plant to compare with other scenarios and define the
economic potential.
3.4 Result of WASP simulation
3.4.1 Comparison of the economic efficiency of power development scenarios
Table 3.4.1-1 shows the calculation results of total power generation costs for each
scenario. Total power generation costs are equal to the sum of power plants construction
costs, the costs of technical maintenance during the operation period and fuel for the target
16-year period from 2015 until 2030. The future prices are shown in the Net Present Value
using a discount coefficient of 10 %. Consequently, Scenario 1 has the lowest level of total
power generation costs.
However, in Scenarios 2 and 3, unlike Scenario 1, it is possible to reduce the consumption
of natural gas and export this saved gas at a price four times higher than the domestic one.
Such economic benefit is also worthy of consideration.
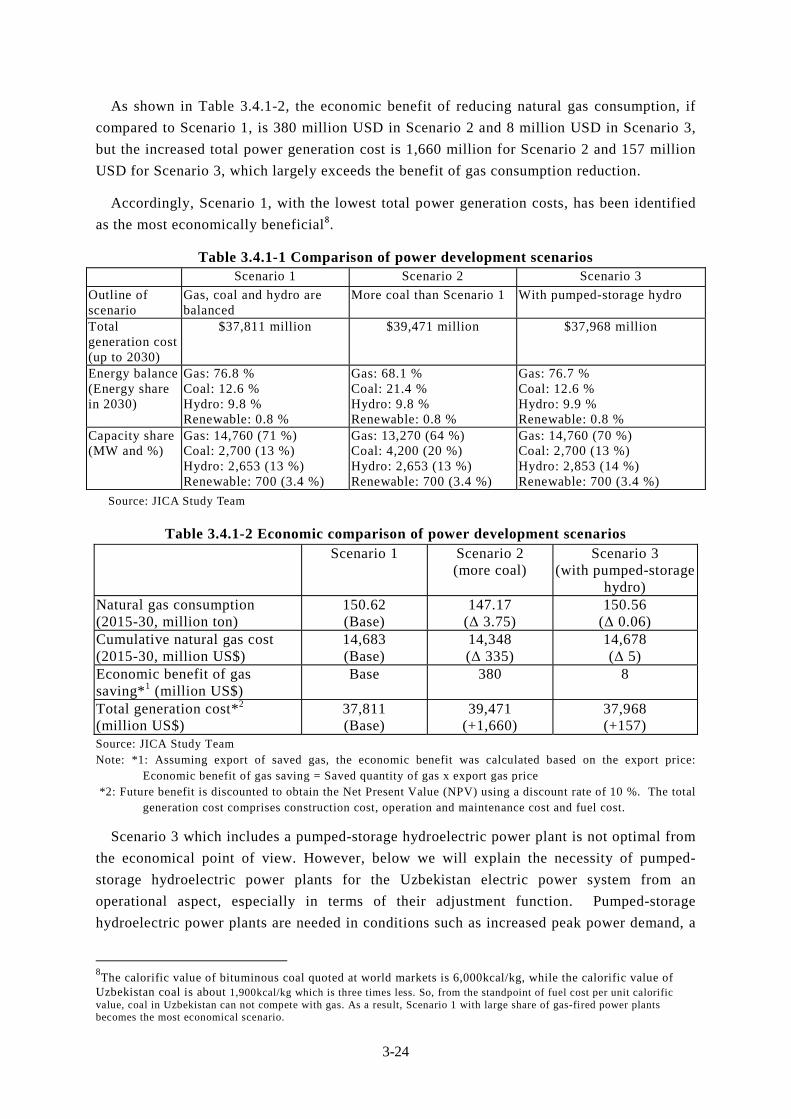
3-24
As shown in Table 3.4.1-2, the economic benefit of reducing natural gas consumption, if
compared to Scenario 1, is 380 million USD in Scenario 2 and 8 million USD in Scenario 3,
but the increased total power generation cost is 1,660 million for Scenario 2 and 157 million
USD for Scenario 3, which largely exceeds the benefit of gas consumption reduction.
Accordingly, Scenario 1, with the lowest total power generation costs, has been identified
as the most economically beneficial8.
Table 3.4.1-1 Comparison of power development scenarios Scenario 1 Scenario 2 Scenario 3
Outline of scenario
Gas, coal and hydro are balanced
More coal than Scenario 1 With pumped-storage hydro
Total generation cost (up to 2030)
$37,811 million $39,471 million $37,968 million
Energy balance (Energy share in 2030)
Gas: 76.8 % Coal: 12.6 % Hydro: 9.8 % Renewable: 0.8 %
Gas: 68.1 % Coal: 21.4 % Hydro: 9.8 % Renewable: 0.8 %
Gas: 76.7 % Coal: 12.6 % Hydro: 9.9 % Renewable: 0.8 %
Capacity share (MW and %)
Gas: 14,760 (71 %) Coal: 2,700 (13 %) Hydro: 2,653 (13 %) Renewable: 700 (3.4 %)
Gas: 13,270 (64 %) Coal: 4,200 (20 %) Hydro: 2,653 (13 %) Renewable: 700 (3.4 %)
Gas: 14,760 (70 %) Coal: 2,700 (13 %) Hydro: 2,853 (14 %) Renewable: 700 (3.4 %)
Source: JICA Study Team
Table 3.4.1-2 Economic comparison of power development scenarios Scenario 1 Scenario 2
(more coal) Scenario 3
(with pumped-storage hydro)
Natural gas consumption (2015-30, million ton)
150.62 (Base)
147.17 (Δ 3.75)
150.56 (Δ 0.06)
Cumulative natural gas cost (2015-30, million US$)
14,683 (Base)
14,348 (Δ 335)
14,678 (Δ 5)
Economic benefit of gas saving*1 (million US$)
Base 380 8
Total generation cost*2 (million US$)
37,811 (Base)
39,471 (+1,660)
37,968 (+157)
Source: JICA Study Team Note: *1: Assuming export of saved gas, the economic benefit was calculated based on the export price:
Economic benefit of gas saving = Saved quantity of gas x export gas price *2: Future benefit is discounted to obtain the Net Present Value (NPV) using a discount rate of 10 %. The total
generation cost comprises construction cost, operation and maintenance cost and fuel cost.
Scenario 3 which includes a pumped-storage hydroelectric power plant is not optimal from
the economical point of view. However, below we will explain the necessity of pumped-
storage hydroelectric power plants for the Uzbekistan electric power system from an
operational aspect, especially in terms of their adjustment function. Pumped-storage
hydroelectric power plants are needed in conditions such as increased peak power demand, a
8The calorific value of bituminous coal quoted at world markets is 6,000kcal/kg, while the calorific value of
Uzbekistan coal is about 1,900kcal/kg which is three times less. So, from the standpoint of fuel cost per unit calorific value, coal in Uzbekistan can not compete with gas. As a result, Scenario 1 with large share of gas-fired power plants becomes the most economical scenario.
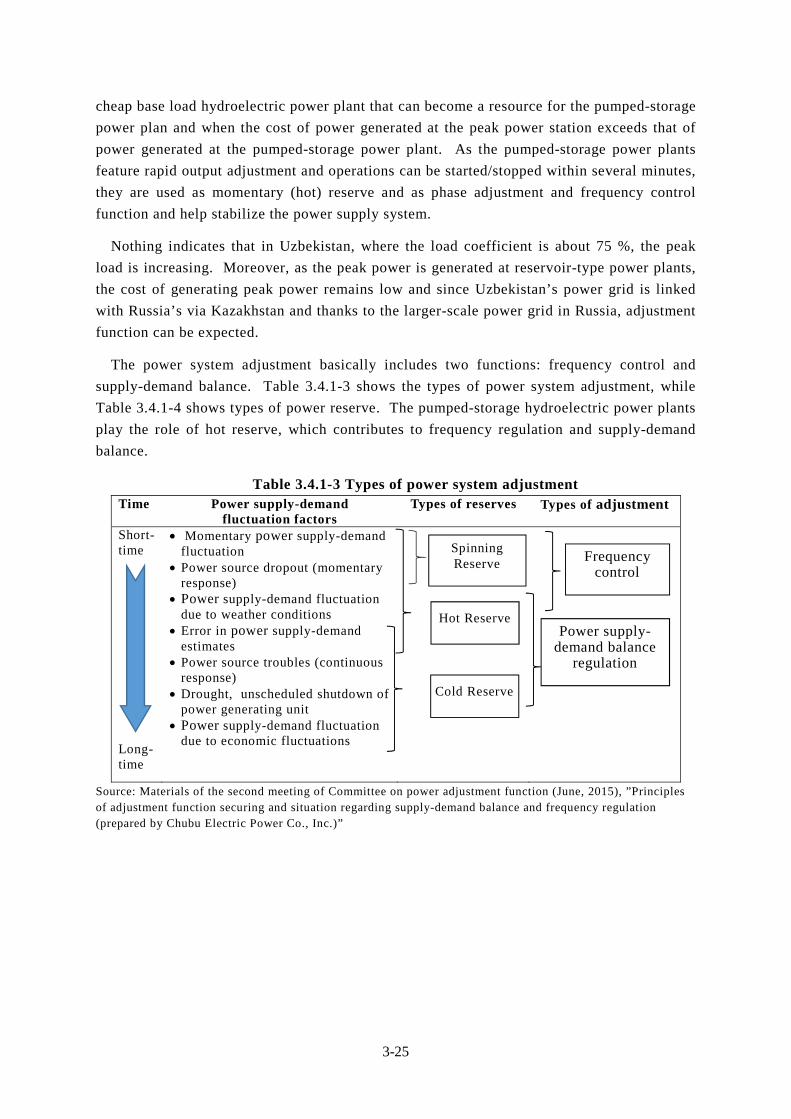
3-25
cheap base load hydroelectric power plant that can become a resource for the pumped-storage
power plan and when the cost of power generated at the peak power station exceeds that of
power generated at the pumped-storage power plant. As the pumped-storage power plants
feature rapid output adjustment and operations can be started/stopped within several minutes,
they are used as momentary (hot) reserve and as phase adjustment and frequency control
function and help stabilize the power supply system.
Nothing indicates that in Uzbekistan, where the load coefficient is about 75 %, the peak
load is increasing. Moreover, as the peak power is generated at reservoir-type power plants,
the cost of generating peak power remains low and since Uzbekistan’s power grid is linked
with Russia’s via Kazakhstan and thanks to the larger-scale power grid in Russia, adjustment
function can be expected.
The power system adjustment basically includes two functions: frequency control and
supply-demand balance. Table 3.4.1-3 shows the types of power system adjustment, while
Table 3.4.1-4 shows types of power reserve. The pumped-storage hydroelectric power plants
play the role of hot reserve, which contributes to frequency regulation and supply-demand
balance.
Table 3.4.1-3 Types of power system adjustment Time Power supply-demand
fluctuation factors Types of reserves Types of adjustment
Short-time Long-time
Momentary power supply-demand fluctuation
Power source dropout (momentary response)
Power supply-demand fluctuation due to weather conditions
Error in power supply-demand estimates
Power source troubles (continuous response)
Drought, unscheduled shutdown of power generating unit
Power supply-demand fluctuation due to economic fluctuations
Source: Materials of the second meeting of Committee on power adjustment function (June, 2015), ”Principles of adjustment function securing and situation regarding supply-demand balance and frequency regulation (prepared by Chubu Electric Power Co., Inc.)”
Spinning Reserve
Hot Reserve
Cold Reserve
Frequency control
Power supply-demand balance
regulation

3-26
Table 3.4.1-4 Types of power reserve
Type Function Equipment
Spinning
Reserve
Starts operation immediately in case of decrease
in power system frequency due to load fluctuation
and power source dropout, increases the power
output (within 10 seconds), ensures continuous
automatic power generation till Hot Reserve is
put into action.
Reserve capacity of
governor-free 9 generator
operated in partial load mode
Hot Reserve Power generating units operated in
synchronization mode, and units which can be put
into action in a short time (within 10 minutes),
take over a load, and ensure continuous automatic
power generation till Cold Reserve is put into
action and takes over a load.
Reserve capacity of generator
operated in partial load mode
Shutdown or standby hydroelectric power plants,
gas turbines
Cold Reserve The reserve which requires several hours from
start till synchronization and taking over a load.
Shutdown or standby thermal
power plants Source: Materials of the second meeting of Committee on power adjustment function (June,
2015), ”Principles of adjustment function securing and situation regarding supply-demand balance and frequency regulation (prepared by Chubu Electric Power Co., Inc.)”
Besides pumped-storage hydroelectric power plants, reserve capacity of generators
operated in partial load mode and hydroelectric power plants are used as hot reserve. At the
present time in Uzbekistan steam-power generation makes up most of power generation10.
Steam-power generation units are operated in partial load mode as hot reserve to regulate the
power supply-demand balance. As shown in Table 3.4.1-5, steam-power generation units
have a wide power output adjustment range. However, the power output change rate is low,
and the start-up time is long. On the other hand, as compared to steam-power generation in
the case of combined cycle power generation, the power output change rate is high and the
start-up time is short. Thus, combined cycle power generation units have high readiness as
hot reserves.
In Japan the minimum required hot reserve is 8 % of the maximum expected demand. This
value is the sum of error in power supply-demand estimates (5 %) or the largest unit capacity,
and short-time demand fluctuations (3 %).
In Uzbekistan the peak power demand in winter of 2020 is forecasted at 9,782 MW, so if
hot reserve is assumed to be 8 %, the required hot reserve capacity will constitute 783 MW.
In the winter of 2020, available hydroelectric power generation capacity will be 609 MW If
about 50 % of this capacity would be used as hot reserve, the remaining 300 MW of hot
reserve will be ensured by partial load of operating TPPs. Accordingly, the plans of
Uzbekenergo JSC, Navoi-2, Talimardjan, Turakurgan, Tachiatash and other GTCCs will be
gradually introduced by 2020.Therefore, installed capacity of GTCC is expected to constitute
9Governor-free operation: in order to maintain the generator rotation speed constant regardless of load, depending on the
changes in system frequency the generator output is increased or decreased by the governor which automatically controls the volume of working fluid (steam, water). 10
In 2015 the installed capacity constituted 11,761 MW, of which 9,530 MW (81%) is steam-power generation, 450MW (4%) is combined cycle power generation, and 1,755 MW (15%) is hydroelectric power generation.
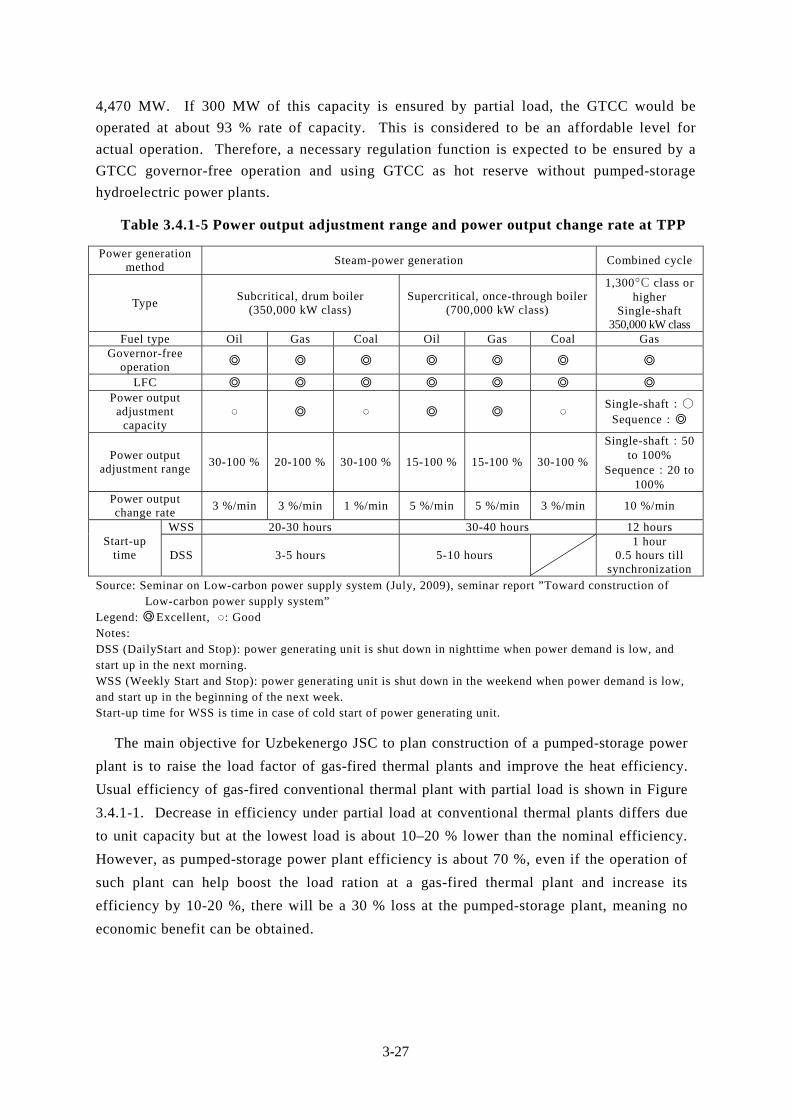
3-27
4,470 MW. If 300 MW of this capacity is ensured by partial load, the GTCC would be
operated at about 93 % rate of capacity. This is considered to be an affordable level for
actual operation. Therefore, a necessary regulation function is expected to be ensured by a
GTCC governor-free operation and using GTCC as hot reserve without pumped-storage
hydroelectric power plants.
Table 3.4.1-5 Power output adjustment range and power output change rate at TPP
Power generation method
Steam-power generation Combined cycle
Type Subcritical, drum boiler
(350,000 kW class) Supercritical, once-through boiler
(700,000 kW class)
1,300°C class or higher
Single-shaft 350,000 kW class
Fuel type Oil Gas Coal Oil Gas Coal Gas Governor-free
operation ◎ ◎ ◎ ◎ ◎ ◎ ◎
LFC ◎ ◎ ◎ ◎ ◎ ◎ ◎ Power output
adjustment capacity
◎ ◎ ◎ Single-shaft:〇
Sequence:◎
Power output adjustment range
30-100 % 20-100 % 30-100 % 15-100 % 15-100 % 30-100 %
Single-shaft:50to 100%
Sequence:20 to 100%
Power output change rate
3 %/min 3 %/min 1 %/min 5 %/min 5 %/min 3 %/min 10 %/min
Start-up time
WSS 20-30 hours 30-40 hours 12 hours
DSS 3-5 hours 5-10 hours 1 hour
0.5 hours till synchronization
Source: Seminar on Low-carbon power supply system (July, 2009), seminar report ”Toward construction of Low-carbon power supply system”
Legend: ◎: Excellent, : Good Notes: DSS (DailyStart and Stop): power generating unit is shut down in nighttime when power demand is low, and start up in the next morning. WSS (Weekly Start and Stop): power generating unit is shut down in the weekend when power demand is low, and start up in the beginning of the next week. Start-up time for WSS is time in case of cold start of power generating unit.
The main objective for Uzbekenergo JSC to plan construction of a pumped-storage power
plant is to raise the load factor of gas-fired thermal plants and improve the heat efficiency.
Usual efficiency of gas-fired conventional thermal plant with partial load is shown in Figure
3.4.1-1. Decrease in efficiency under partial load at conventional thermal plants differs due
to unit capacity but at the lowest load is about 10–20 % lower than the nominal efficiency.
However, as pumped-storage power plant efficiency is about 70 %, even if the operation of
such plant can help boost the load ration at a gas-fired thermal plant and increase its
efficiency by 10-20 %, there will be a 30 % loss at the pumped-storage plant, meaning no
economic benefit can be obtained.
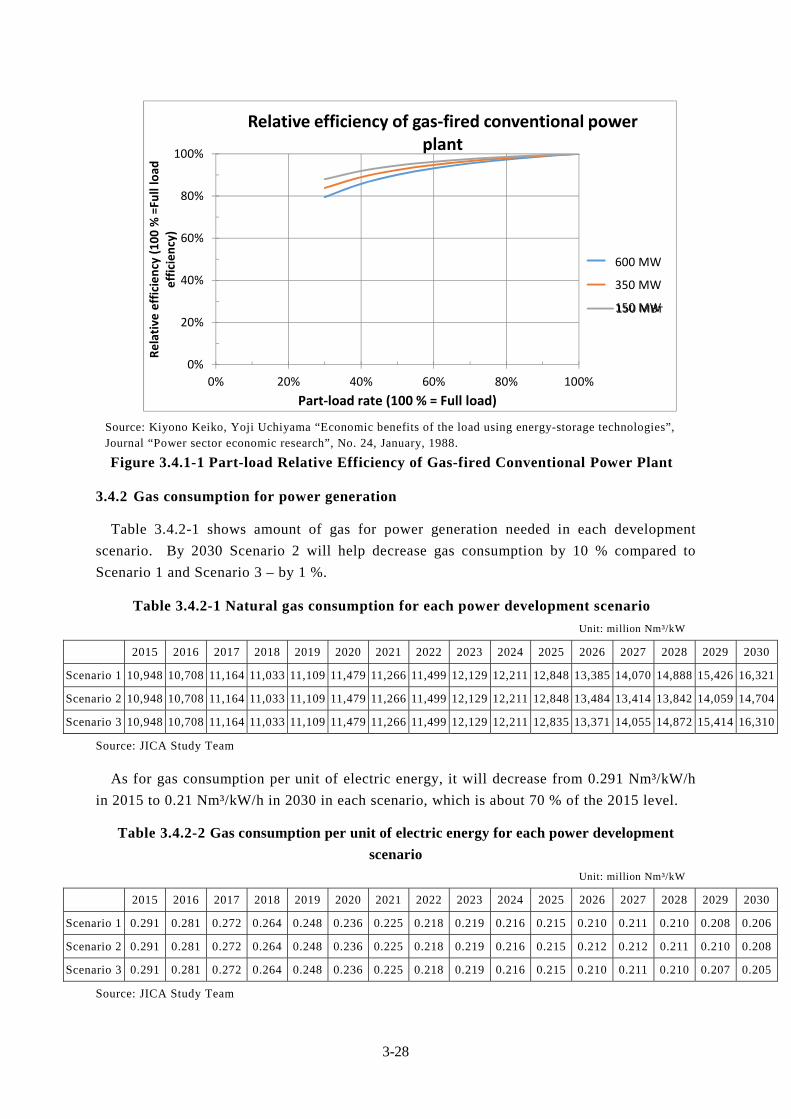
3-28
Source: Kiyono Keiko, Yoji Uchiyama “Economic benefits of the load using energy-storage technologies”, Journal “Power sector economic research”, No. 24, January, 1988.
Figure 3.4.1-1 Part-load Relative Efficiency of Gas-fired Conventional Power Plant
3.4.2 Gas consumption for power generation
Table 3.4.2-1 shows amount of gas for power generation needed in each development
scenario. By 2030 Scenario 2 will help decrease gas consumption by 10 % compared to
Scenario 1 and Scenario 3 – by 1 %.
Table 3.4.2-1 Natural gas consumption for each power development scenario
Unit: million Nm³/kW
2015 2016 2017 2018 2019 2020 2021 2022 2023 2024 2025 2026 2027 2028 2029 2030
Scenario 1 10,948 10,708 11,164 11,033 11,109 11,479 11,266 11,499 12,129 12,211 12,848 13,385 14,070 14,888 15,426 16,321
Scenario 2 10,948 10,708 11,164 11,033 11,109 11,479 11,266 11,499 12,129 12,211 12,848 13,484 13,414 13,842 14,059 14,704
Scenario 3 10,948 10,708 11,164 11,033 11,109 11,479 11,266 11,499 12,129 12,211 12,835 13,371 14,055 14,872 15,414 16,310
Source: JICA Study Team
As for gas consumption per unit of electric energy, it will decrease from 0.291 Nm³/kW/h
in 2015 to 0.21 Nm³/kW/h in 2030 in each scenario, which is about 70 % of the 2015 level.
Table 3.4.2-2 Gas consumption per unit of electric energy for each power development
scenario
Unit: million Nm³/kW
2015 2016 2017 2018 2019 2020 2021 2022 2023 2024 2025 2026 2027 2028 2029 2030
Scenario 1 0.291 0.281 0.272 0.264 0.248 0.236 0.225 0.218 0.219 0.216 0.215 0.210 0.211 0.210 0.208 0.206
Scenario 2 0.291 0.281 0.272 0.264 0.248 0.236 0.225 0.218 0.219 0.216 0.215 0.212 0.212 0.211 0.210 0.208
Scenario 3 0.291 0.281 0.272 0.264 0.248 0.236 0.225 0.218 0.219 0.216 0.215 0.210 0.211 0.210 0.207 0.205
Source: JICA Study Team
0%
20%
40%
60%
80%
100%
0% 20% 40% 60% 80% 100%
Relative
efficiency (100 %
=Full load
efficiency)
Part‐load rate (100 % = Full load)
Relative efficiency of gas‐fired conventional power plant
600 МВт
350 МВт
150 МВт
600 MW
350 MW
150 MW
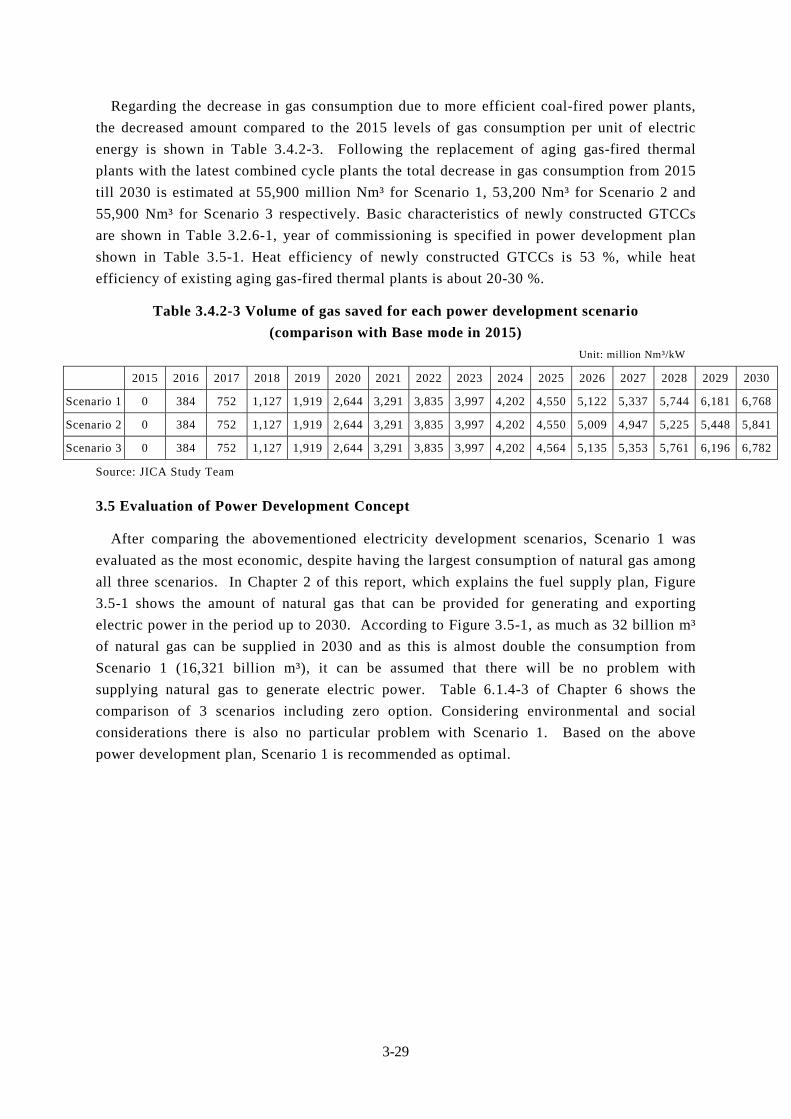
3-29
Regarding the decrease in gas consumption due to more efficient coal-fired power plants,
the decreased amount compared to the 2015 levels of gas consumption per unit of electric
energy is shown in Table 3.4.2-3. Following the replacement of aging gas-fired thermal
plants with the latest combined cycle plants the total decrease in gas consumption from 2015
till 2030 is estimated at 55,900 million Nm³ for Scenario 1, 53,200 Nm³ for Scenario 2 and
55,900 Nm³ for Scenario 3 respectively. Basic characteristics of newly constructed GTCCs
are shown in Table 3.2.6-1, year of commissioning is specified in power development plan
shown in Table 3.5-1. Heat efficiency of newly constructed GTCCs is 53 %, while heat
efficiency of existing aging gas-fired thermal plants is about 20-30 %.
Table 3.4.2-3 Volume of gas saved for each power development scenario
(comparison with Base mode in 2015)
Unit: million Nm³/kW
2015 2016 2017 2018 2019 2020 2021 2022 2023 2024 2025 2026 2027 2028 2029 2030
Scenario 1 0 384 752 1,127 1,919 2,644 3,291 3,835 3,997 4,202 4,550 5,122 5,337 5,744 6,181 6,768
Scenario 2 0 384 752 1,127 1,919 2,644 3,291 3,835 3,997 4,202 4,550 5,009 4,947 5,225 5,448 5,841
Scenario 3 0 384 752 1,127 1,919 2,644 3,291 3,835 3,997 4,202 4,564 5,135 5,353 5,761 6,196 6,782
Source: JICA Study Team
3.5 Evaluation of Power Development Concept
After comparing the abovementioned electricity development scenarios, Scenario 1 was
evaluated as the most economic, despite having the largest consumption of natural gas among
all three scenarios. In Chapter 2 of this report, which explains the fuel supply plan, Figure
3.5-1 shows the amount of natural gas that can be provided for generating and exporting
electric power in the period up to 2030. According to Figure 3.5-1, as much as 32 billion m³
of natural gas can be supplied in 2030 and as this is almost double the consumption from
Scenario 1 (16,321 billion m³), it can be assumed that there will be no problem with
supplying natural gas to generate electric power. Table 6.1.4-3 of Chapter 6 shows the
comparison of 3 scenarios including zero option. Considering environmental and social
considerations there is also no particular problem with Scenario 1. Based on the above
power development plan, Scenario 1 is recommended as optimal.
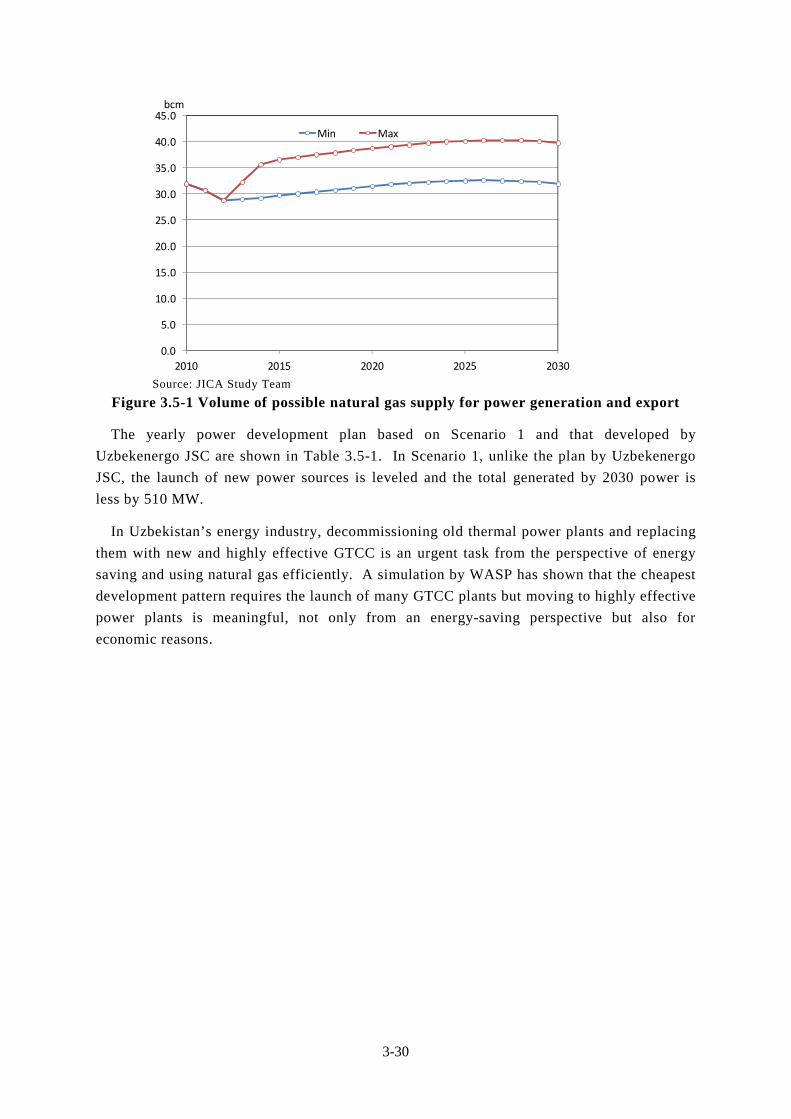
3-30
Source: JICA Study Team
Figure 3.5-1 Volume of possible natural gas supply for power generation and export
The yearly power development plan based on Scenario 1 and that developed by
Uzbekenergo JSC are shown in Table 3.5-1. In Scenario 1, unlike the plan by Uzbekenergo
JSC, the launch of new power sources is leveled and the total generated by 2030 power is
less by 510 MW.
In Uzbekistan’s energy industry, decommissioning old thermal power plants and replacing
them with new and highly effective GTCC is an urgent task from the perspective of energy
saving and using natural gas efficiently. A simulation by WASP has shown that the cheapest
development pattern requires the launch of many GTCC plants but moving to highly effective
power plants is meaningful, not only from an energy-saving perspective but also for
economic reasons.
0.0
5.0
10.0
15.0
20.0
25.0
30.0
35.0
40.0
45.0
2010 2015 2020 2025 2030
Min Max
bcm
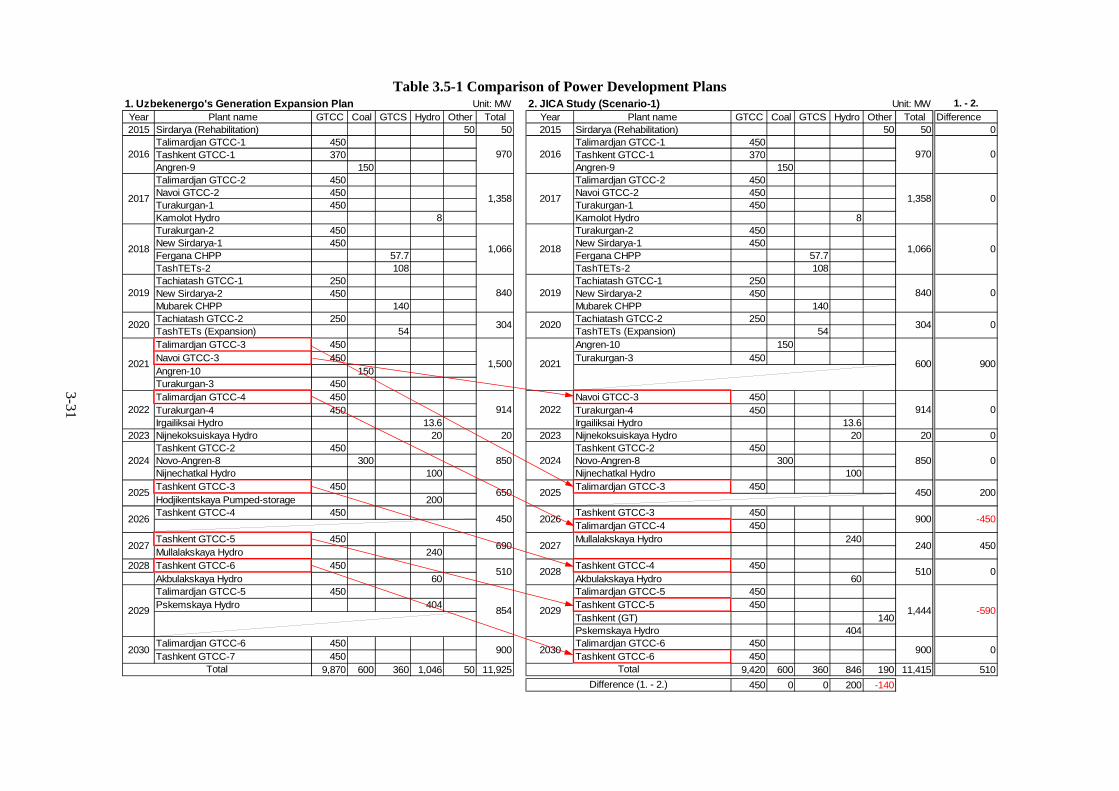
3-31
Table 3.5-1 Comparison of Power Development Plans
1. Uzbekenergo's Generation Expansion Plan Unit: MW 2. JICA Study (Scenario-1) Unit: MW 1. - 2.
Year Plant name GTCC Coal GTCS Hydro Other Total Year Plant name GTCC Coal GTCS Hydro Other Total Difference2015 Sirdarya (Rehabilitation) 50 50 2015 Sirdarya (Rehabilitation) 50 50 0
Talimardjan GTCC-1 450 Talimardjan GTCC-1 450Tashkent GTCC-1 370 Tashkent GTCC-1 370Angren-9 150 Angren-9 150Talimardjan GTCC-2 450 Talimardjan GTCC-2 450Navoi GTCC-2 450 Navoi GTCC-2 450Turakurgan-1 450 Turakurgan-1 450Kamolot Hydro 8 Kamolot Hydro 8Turakurgan-2 450 Turakurgan-2 450New Sirdarya-1 450 New Sirdarya-1 450Fergana CHPP 57.7 Fergana CHPP 57.7TashTETs-2 108 TashTETs-2 108Tachiatash GTCC-1 250 Tachiatash GTCC-1 250New Sirdarya-2 450 New Sirdarya-2 450Mubarek CHPP 140 Mubarek CHPP 140Tachiatash GTCC-2 250 Tachiatash GTCC-2 250TashTETs (Expansion) 54 TashTETs (Expansion) 54Talimardjan GTCC-3 450 Angren-10 150Navoi GTCC-3 450 Turakurgan-3 450Angren-10 150Turakurgan-3 450Talimardjan GTCC-4 450 Navoi GTCC-3 450Turakurgan-4 450 Turakurgan-4 450Irgailiksai Hydro 13.6 Irgailiksai Hydro 13.6
2023 Nijnekoksuiskaya Hydro 20 20 2023 Nijnekoksuiskaya Hydro 20 20 0Tashkent GTCC-2 450 Tashkent GTCC-2 450Novo-Angren-8 300 Novo-Angren-8 300Nijnechatkal Hydro 100 Nijnechatkal Hydro 100Tashkent GTCC-3 450 Talimardjan GTCC-3 450Hodjikentskaya Pumped-storage 200Tashkent GTCC-4 450 Tashkent GTCC-3 450
Talimardjan GTCC-4 450Tashkent GTCC-5 450 Mullalakskaya Hydro 240Mullalakskaya Hydro 240
2028 Tashkent GTCC-6 450 Tashkent GTCC-4 450Akbulakskaya Hydro 60 Akbulakskaya Hydro 60Talimardjan GTCC-5 450 Talimardjan GTCC-5 450Pskemskaya Hydro 404 Tashkent GTCC-5 450
Tashkent (GT) 140Pskemskaya Hydro 404
Talimardjan GTCC-6 450 Talimardjan GTCC-6 450Tashkent GTCC-7 450 Tashkent GTCC-6 450
9,870 600 360 1,046 50 11,925 9,420 600 360 846 190 11,415 510
450 0 0 200 -140
2021 2021
970
1,358
2016
2017
2018
2019
2020
1,066
840
304
2024
2025
2026
900
Total
2016 970
2017 1,358
2018 1,066
2019 840
914
850
650
690
510
854
2020 304
600
914
850
2030 2030
0
0
0
0
0
900
0
0
900450
2027
2028
2029
0
2022
2024
2025
1,500
2029
2022
Difference (1. - 2.)
200
-450
450
0
-590
240
510
1,444
900
Total
450
2026
2027
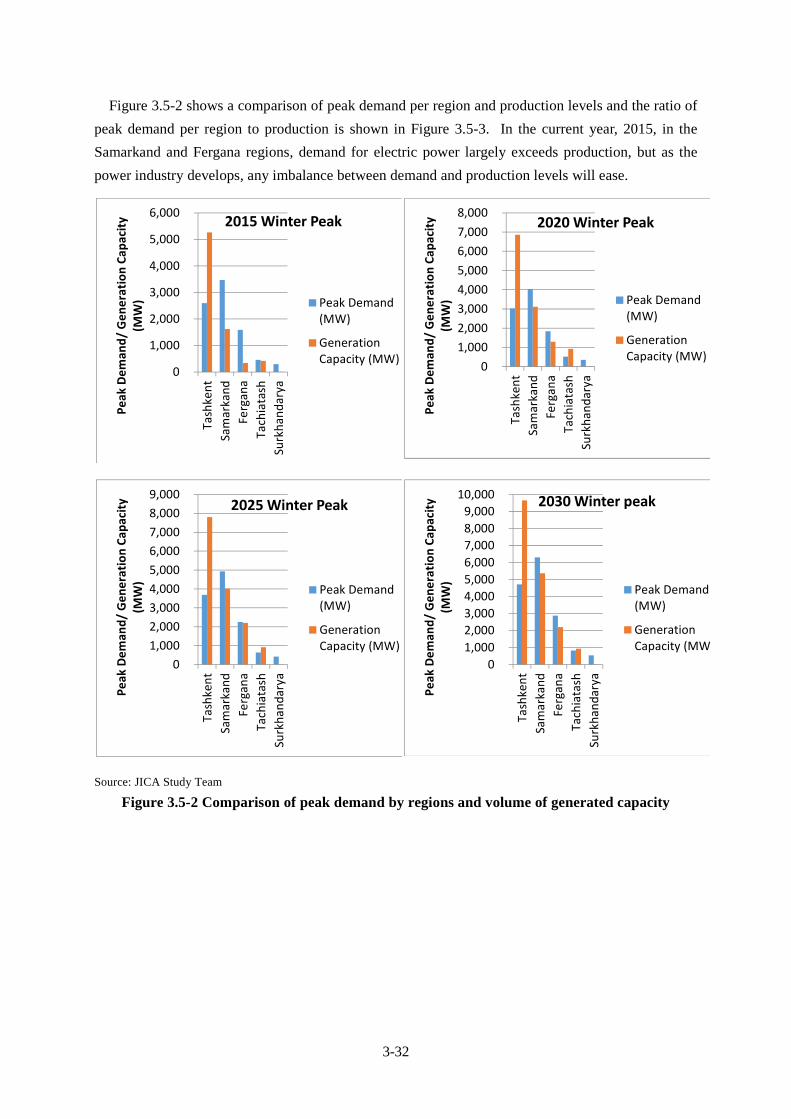
3-32
Figure 3.5-2 shows a comparison of peak demand per region and production levels and the ratio of
peak demand per region to production is shown in Figure 3.5-3. In the current year, 2015, in the
Samarkand and Fergana regions, demand for electric power largely exceeds production, but as the
power industry develops, any imbalance between demand and production levels will ease.
Source: JICA Study Team
Figure 3.5-2 Comparison of peak demand by regions and volume of generated capacity
0
1,000
2,000
3,000
4,000
5,000
6,000Tashkent
Samarkand
Fergan
a
Tachiatash
Surkhan
darya
Peak
Deman
d/ Generation Cap
acity
(MW)
2015 Winter Peak
Peak Demand(MW)
GenerationCapacity (MW)
0
1,000
2,000
3,000
4,000
5,000
6,000
7,000
8,000
Tashkent
Samarkand
Fergan
a
Tachiatash
Surkhan
darya
Peak
Deman
d/ Generation Cap
acity
(MW)
2020 Winter Peak
Peak Demand(MW)
GenerationCapacity (MW)
0
1,000
2,000
3,000
4,000
5,000
6,000
7,000
8,000
9,000
Tashkent
Samarkand
Fergan
a
Tachiatash
Surkhan
darya
Peak
Deman
d/ Generation Cap
acity
(MW)
2025 Winter Peak
Peak Demand(MW)
GenerationCapacity (MW)
0
1,000
2,000
3,000
4,000
5,000
6,000
7,000
8,000
9,000
10,000
Tashkent
Samarkand
Fergan
a
Tachiatash
Surkhan
darya
Peak
Deman
d/ Generation Cap
acity
(MW)
2030 Winter peak
Peak Demand(MW)
GenerationCapacity (MW

3-33
Source: JICA Study Team
Figure 3.5-3 Peak demand/generation capacity ratio by regions
3.6 Review of Power Development Concept
We have reviewed projects of Uzbekenergo JSC on Talimardjan-3, 4 expansion, Navoi TPP unit
№3 (expansion), Turakurgan-3, 4 expansion, Sirdarya (GTCC)-3, 4 expansion from the standpoint of
minimum cost plan and power supply-demand balance by regions developed by WASP. The results
of review are shown in Table 3.6-1.
As for Talimardjan-3, 4, Navoi-3, Turakurgan-3, 4 expansion projects, it is recommended to delay
the launching time. In the case of Uzbekenergo JSC s power development concept (Table 3.1‐1)(as
shown in Figure 3.6-1) the LOLP, which is the indicator of power supply reliability, will be much
below the target level of 2 days per year, i.e. the power supply reliability level will exceed the target
level, and excess in installed capacity will occur. Figure 3.6-2 shows the addition of generation
capacity for each year between 2021 and 2030. According to Uzbekenergo JSC s plan, 1,500 MW
power sources will be launched in 2021 which is 900 MW more than that of the optimum plan from
the JICA review. The JICA review plan is a power development concept selected through WASP,
which satisfies the power supply reliability needs and requires little cost. By carrying out power
development in accordance with this plan, the burden of capital investment can be eased.
In case the volume of power sources to be launched in 2021 (according to Uzbekenergo JSC s
plan) will be reduced by 900 MW, the launching of two of the following three units will have to be
delayed: Talimardjan-3 (450 MW, Samarkand region), Navoi-3 (450 MW, Samarkand region),
Turakurgan-3 (450 MW, Fergana region). According to power supply-demand balance by regions in
2021 shown in Figure 3.6-2 and Table 3.6-2, power generation capacity and demand by regions are
almost balanced except for the Tashkent region. In case launching of Talimardjan-3 and Navoi-3
located in Samarkand region is delayed, the power generation capacity/demand ratio in this region
0%
50%
100%
150%
200%
250%
2015 2020 2025 2030
Peak
Deman
d/ Cap
acity Ratio
Tashkent
Samarkand
Fergana
Tachiatash
Surkhandarya
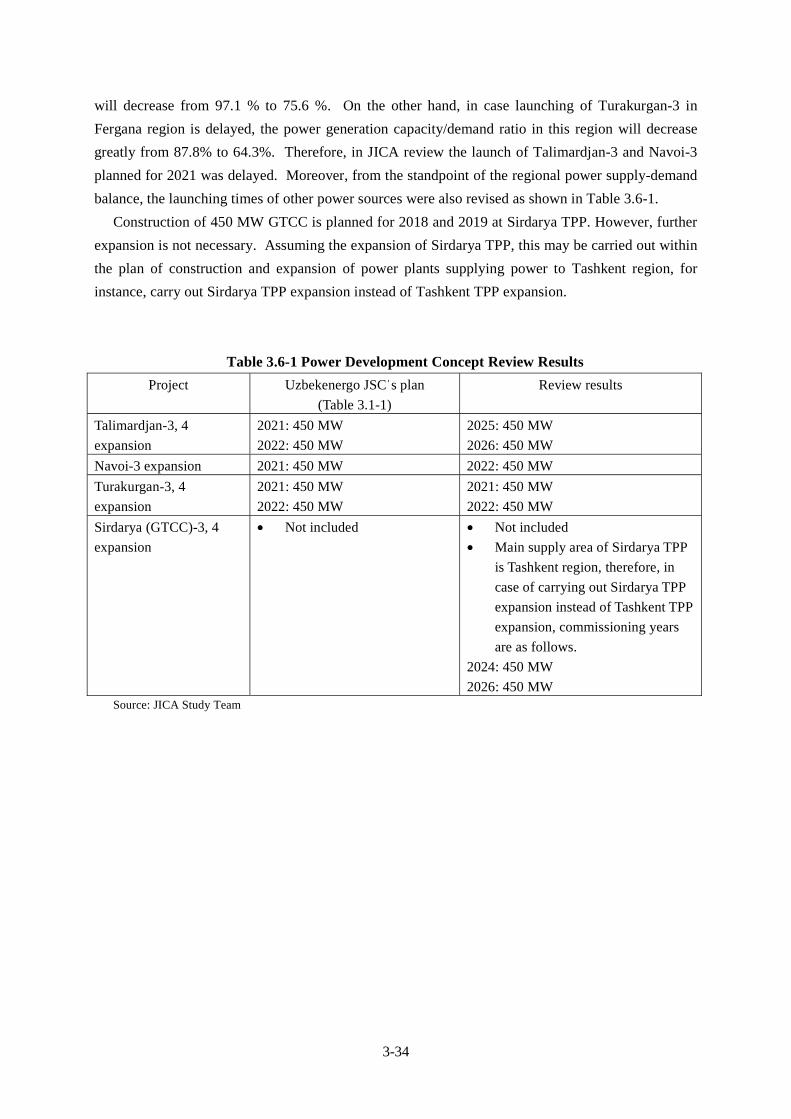
3-34
will decrease from 97.1 % to 75.6 %. On the other hand, in case launching of Turakurgan-3 in
Fergana region is delayed, the power generation capacity/demand ratio in this region will decrease
greatly from 87.8% to 64.3%. Therefore, in JICA review the launch of Talimardjan-3 and Navoi-3
planned for 2021 was delayed. Moreover, from the standpoint of the regional power supply-demand
balance, the launching times of other power sources were also revised as shown in Table 3.6-1.
Construction of 450 MW GTCC is planned for 2018 and 2019 at Sirdarya TPP. However, further
expansion is not necessary. Assuming the expansion of Sirdarya TPP, this may be carried out within
the plan of construction and expansion of power plants supplying power to Tashkent region, for
instance, carry out Sirdarya TPP expansion instead of Tashkent TPP expansion.
Table 3.6-1 Power Development Concept Review Results
Project Uzbekenergo JSC s plan
(Table 3.1-1)
Review results
Talimardjan-3, 4
expansion
2021: 450 MW
2022: 450 MW
2025: 450 MW
2026: 450 MW
Navoi-3 expansion 2021: 450 MW 2022: 450 MW
Turakurgan-3, 4
expansion
2021: 450 MW
2022: 450 MW
2021: 450 MW
2022: 450 MW
Sirdarya (GTCC)-3, 4
expansion
Not included Not included
Main supply area of Sirdarya TPP
is Tashkent region, therefore, in
case of carrying out Sirdarya TPP
expansion instead of Tashkent TPP
expansion, commissioning years
are as follows.
2024: 450 MW
2026: 450 MW Source: JICA Study Team
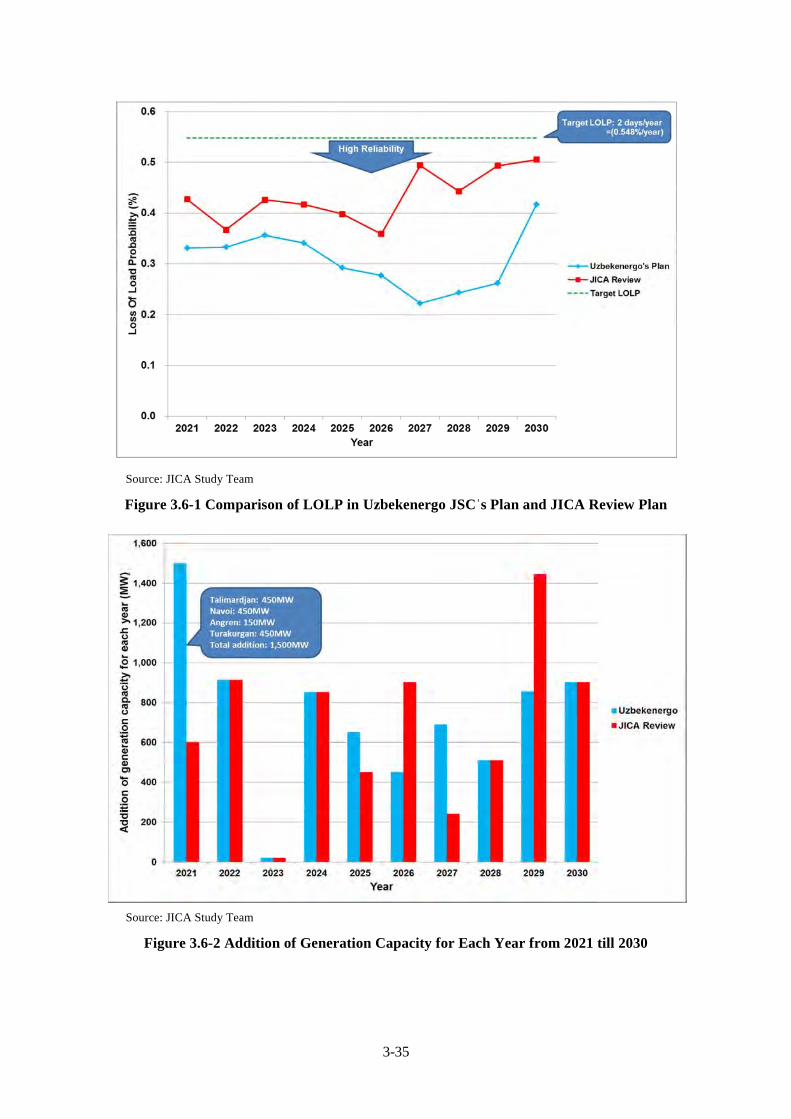
3-35
Source: JICA Study Team
Figure 3.6-1 Comparison of LOLP in Uzbekenergo JSC s Plan and JICA Review Plan
Source: JICA Study Team
Figure 3.6-2 Addition of Generation Capacity for Each Year from 2021 till 2030

3-36
Source: JICA Study Team
Figure 3.6-3 Generation Capacity and Peak Demand by Regions in 2021
Table 3.6-2 Generation Capacity/ Peak Demand Ratio by Regions in 2021
Source: JICA Study Team
Tas
hken
t
Sam
arka
nd
Fer
gana
Tac
hiat
ash
Sur
khan
dary
a
Tas
hken
t
Sam
arka
nd
Fer
gana
Tac
hiat
ash
Sur
khan
dary
a
Peak Demand (MW) 3,133 4,185 1,912 546 361 3,133 4,185 1,912 546 361Generation Capacity (MW) 8,553 4,062 1,679 851 9 8,553 3,162 1,679 851 9Capacity/Demand Ratio 273.0% 97.1% 87.8% 155.7% 2.5% 273.0% 75.6% 87.8% 155.7% 2.5%
2021 Uzbekenergo 2021 JICA Review

Chapter 4 Network Development Plan

4-1
Chapter 4 Network Development Plan
Reflecting the power development plan shown in Chapter 3, The Team reviewed the network
development plan until 2020 formulated by Uzbekenergo JSC. the Team used the network analysis
data provided by "EnergoSetProject" Institute, revised them to incorporate recent situation, and
conducted the network analysis utilizing network analysis software PSS/E to grasp problems, and
then proposed the measures necessary for stable network operation, if any.
4.1 Study method for planning optimal network development
Using network analysis software PSS/E which is de facto standard all over the world, the Team
inputed the data regarding power stations including the loads by areas and locations and outputs,
those regarding transmission lines including voltages, lengths and transmitting capacities, and those
regarding substations including voltages and capacities of transformers. The Team obtained power
flows in stations and transmission lines, voltages on busses in all stations, and verified whether they
are adequate or not. In the case of not adequate, the Team devised measures to resolve the problems.
And also by analyzing fault currents and network stabilities, the Team proposed the network which
satisfies three conditions (power flow and voltage, fault current and stability).
4.2 Study Condition
4.2.1 Geographical distribution of load and generation
Areawise classification of network (1)
Uzbekistan has an area of 447 thousand square kilometers, which is 1.2 times of that of Japan. As
shown in Figure 4.2.1.1, Uzbekistan is divided into 5 areas, and the network also can be similarly
divided into 5 networks: East Network, Central Network (which includes the capital city, Tashkent),
South West Network, North West Network and South Network. Since the South network is small, it
is actually considered as a part of South West Network. By the way, the terms noted in brackets
indicate major cities.
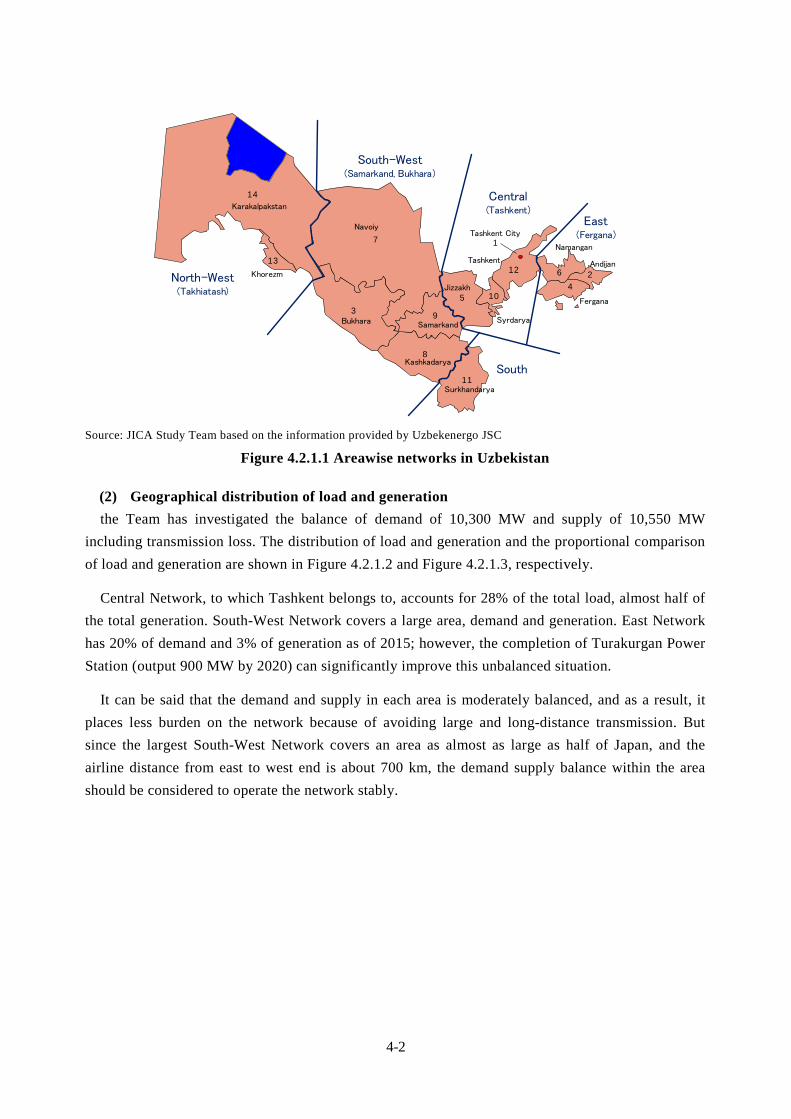
4-2
14
7
3 9
8
11
5 10
12 6 24
1
13
South-West(Samarkand, Bukhara)
Central(Tashkent)
East(Fergana)
South
North-West(Takhiatash)
Karakalpakstan
Navoiy
Khorezm
Bukhara Samarkand
Kashkadarya
Surkhandarya
Jizzakh
Syrdarya
Tashkent
Tashkent City
Namangan
Fergana
Andijan
Source: JICA Study Team based on the information provided by Uzbekenergo JSC
Figure 4.2.1.1 Areawise networks in Uzbekistan
Geographical distribution of load and generation (2)
the Team has investigated the balance of demand of 10,300 MW and supply of 10,550 MW
including transmission loss. The distribution of load and generation and the proportional comparison
of load and generation are shown in Figure 4.2.1.2 and Figure 4.2.1.3, respectively.
Central Network, to which Tashkent belongs to, accounts for 28% of the total load, almost half of
the total generation. South-West Network covers a large area, demand and generation. East Network
has 20% of demand and 3% of generation as of 2015; however, the completion of Turakurgan Power
Station (output 900 MW by 2020) can significantly improve this unbalanced situation.
It can be said that the demand and supply in each area is moderately balanced, and as a result, it
places less burden on the network because of avoiding large and long-distance transmission. But
since the largest South-West Network covers an area as almost as large as half of Japan, and the
airline distance from east to west end is about 700 km, the demand supply balance within the area
should be considered to operate the network stably.
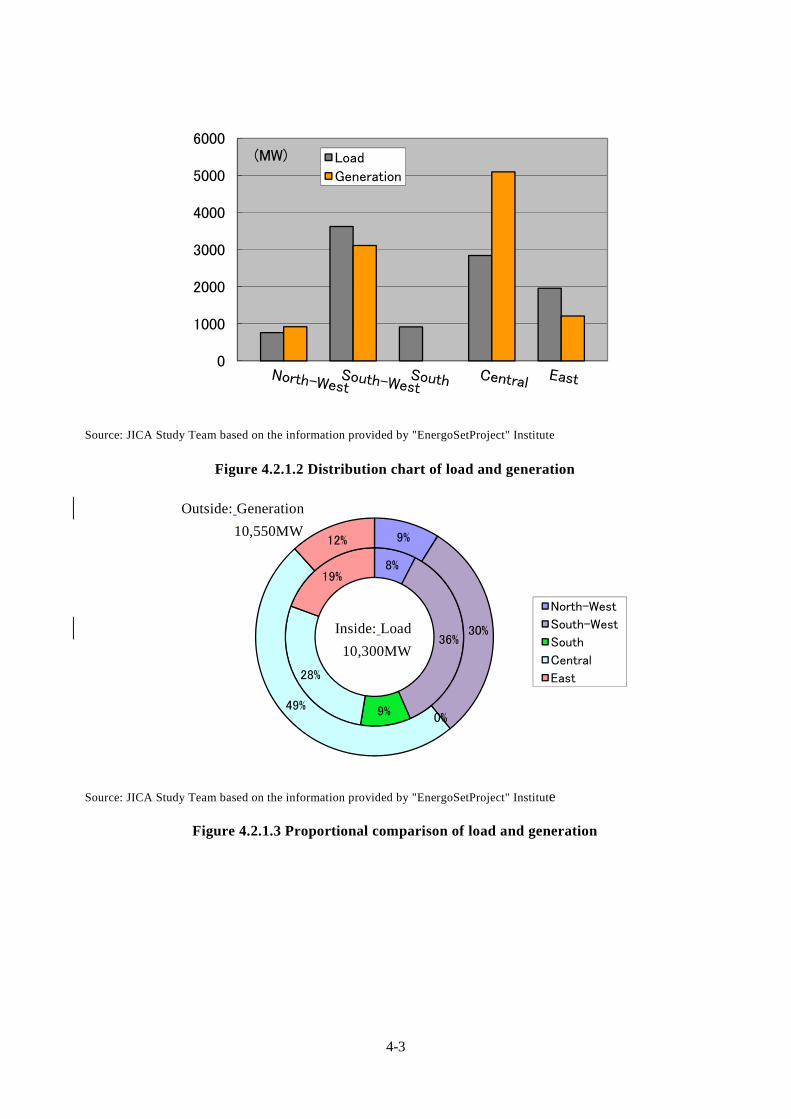
4-3
Source: JICA Study Team based on the information provided by "EnergoSetProject" Institute
Figure 4.2.1.2 Distribution chart of load and generation
Source: JICA Study Team based on the information provided by "EnergoSetProject" Institute
Figure 4.2.1.3 Proportional comparison of load and generation
0
1000
2000
3000
4000
5000
6000(MW) Load
Generation
8%
36%
9%
28%
19%
9%
30%
0%49%
12%
North-West
South-West
South
Central
East
Outside: Generation
10,550MW
Inside: Load
10,300MW

4-4
Supply Reliability 4.2.2
Supply Reliability (1)
Uzbekenergo JSC’s supply reliability applied for the bulk power network system (500 kV and 220
kV) is that the power supply should be kept under single contingency condition. This concept is
adopted in many countries, and referred to as N-1 standard.
Current-carrying capacity (2)
Transmission line (a)
Uzbekenergo JSC uses mainly conductors of AS240, AS300, AS400 and AS500 in bulk power
transmission lines, for 500 kV, triple conductor of AS300 or AS400, for 220 kV, single conductor of
any of the forementioned conductors except some double conductor lines.
The transmitting capacity of each conductor by voltage, season is indicated in Table 4.2.2.1. The
maximum permissible factor (short time capacity) is 1.2 times of the indicated values.
Table 4.2.2.1 Transmitting capacity of lines
Voltage No.×Conductor Temp. 25℃ Winter (5℃) Summer (45℃)
500 kV 3×AS300 2,070 A 2,484 A 1,532 A
3×AS400 2,475 A 2,970 A 1,832 A
220 kV AS240 610 A 732 A 451 A
AS300 690 A 828 A 517 A
AS400 835 A 1,002 A 618 A
AS500 945 A 1,134 A 699 A
Source: Uzbekenergo JSC
Transformer (b)
Uzbekenergo JSC adopts the values shown in Table 4.2.2.2 as the short time capacity of
transformers. Installing two units of 500 MVA transformer (composed by 3 units of 167 MVA
single-phase transformer) in 500/220 kV substation is standardized. An auxiliary 167 MVA
single-phase transformer is installed in substation where overloading is expected for replacement in
case of one transformer breakdown.
Table 4.2.2.2 Short time capacity of transformers
Oil cooling Overloading ratio 30% 45% 60% 75% 100%
Duration time 120 min 80 min 45 min 20 min 10 min
Oilless cooling Overloading ratio 20% 30% 40% 50% 60%
Duration time 60 min 48 min 32 min 20 min 5 min
Source : Uzbekenergo JSC
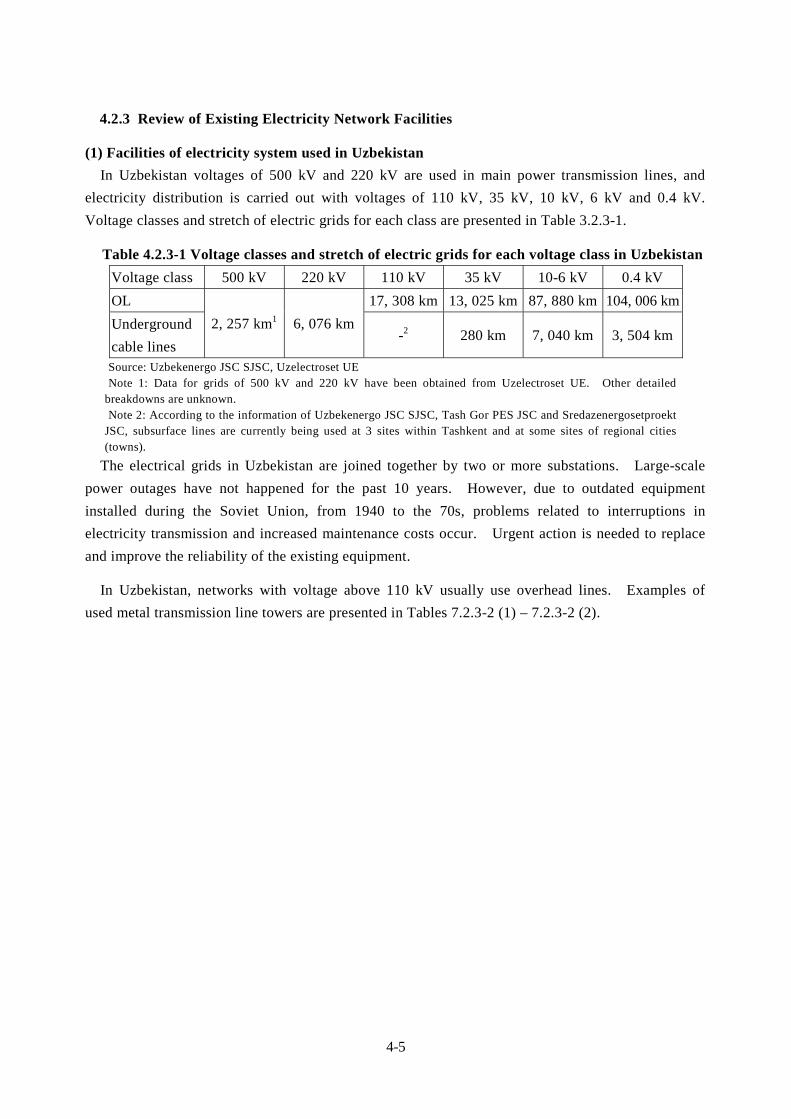
4-5
Review of Existing Electricity Network Facilities 4.2.3
(1) Facilities of electricity system used in Uzbekistan
In Uzbekistan voltages of 500 kV and 220 kV are used in main power transmission lines, and
electricity distribution is carried out with voltages of 110 kV, 35 kV, 10 kV, 6 kV and 0.4 kV.
Voltage classes and stretch of electric grids for each class are presented in Table 3.2.3-1.
Table 4.2.3-1 Voltage classes and stretch of electric grids for each voltage class in Uzbekistan
Voltage class 500 kV 220 kV 110 kV 35 kV 10-6 kV 0.4 kV
OL
2, 257 km1 6, 076 km
17, 308 km 13, 025 km 87, 880 km 104, 006 km
Underground
cable lines -2 280 km 7, 040 km 3, 504 km
Source: Uzbekenergo JSC SJSC, Uzelectroset UE Note 1: Data for grids of 500 kV and 220 kV have been obtained from Uzelectroset UE. Other detailed
breakdowns are unknown. Note 2: According to the information of Uzbekenergo JSC SJSC, Tash Gor PES JSC and Sredazenergosetproekt
JSC, subsurface lines are currently being used at 3 sites within Tashkent and at some sites of regional cities (towns).
The electrical grids in Uzbekistan are joined together by two or more substations. Large-scale
power outages have not happened for the past 10 years. However, due to outdated equipment
installed during the Soviet Union, from 1940 to the 70s, problems related to interruptions in
electricity transmission and increased maintenance costs occur. Urgent action is needed to replace
and improve the reliability of the existing equipment.
In Uzbekistan, networks with voltage above 110 kV usually use overhead lines. Examples of
used metal transmission line towers are presented in Tables 7.2.3-2 (1) – 7.2.3-2 (2).

4-6
Table 4.2.3-2(1) Metal transmission line towers (220 kV)
Name Straight tower Anchor angle tower
Drawing
Height (H) HT: 41.0 mHL: 22.5 m
HT: 31.6 mHL: 10.5 m
Base width (B) 5.4 m 5.2 mMaximum wind load 29 m/s 29 m/s
Wires AS-300/39 AS-300/39Angle - 0°–60°Mass 6.21 tons 14.4 tons
Table 4.2.3-2(2) Metal transmission line towers (500 kV)
Name Straight tower Anchor angle tower Angle tower
Drawing
Height (H) HT:38 mHL:32 m
HT: 27.2 mHL: 22.0 m
Hт: 32.0 mHL: 27.0 m
Base width (B) 9.05 m 28 m 37.9 mMaximum Wind
load 35 m/s 35 m/s 35 m/s
Wires 3xASO-400,3xASO-500
3xASO-400,3xASO-500
3xASO-400,3xASO-500
Angle 0° 0°-60° 5°-20°Mass 13.90 tons 15.18 tons 13.274 tons
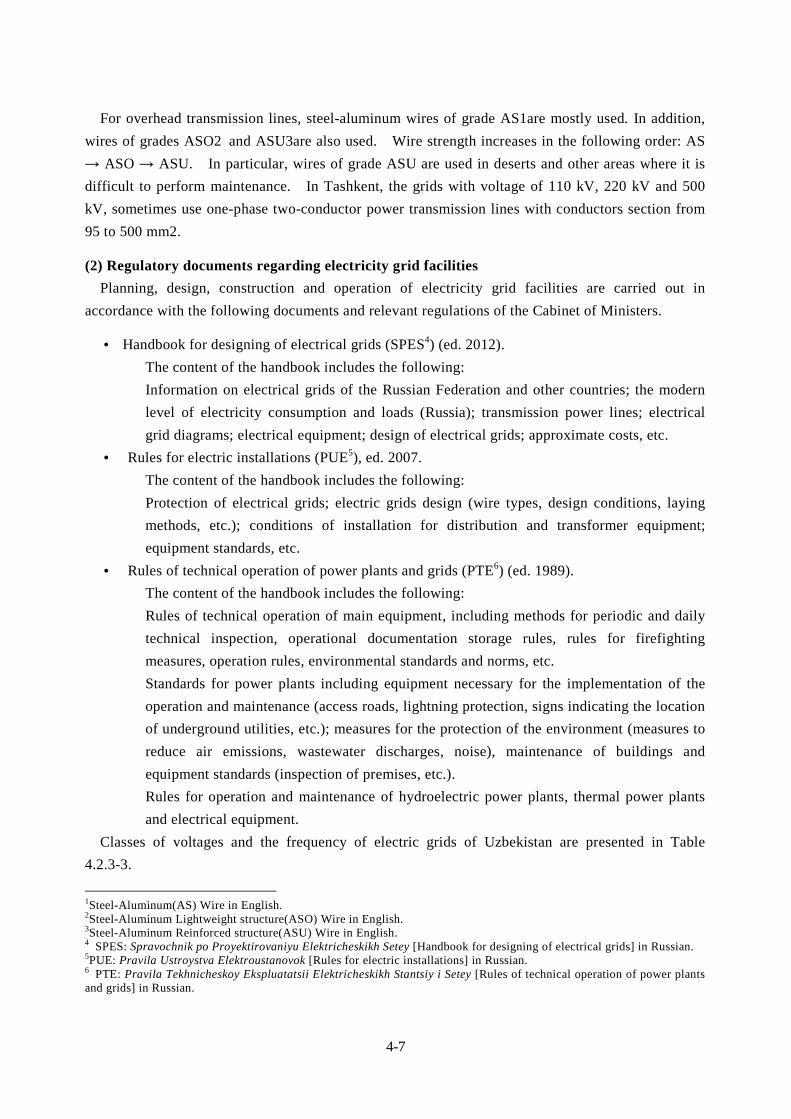
4-7
For overhead transmission lines, steel-aluminum wires of grade AS1are mostly used. In addition,
wires of grades ASO2 and ASU3are also used. Wire strength increases in the following order: AS
ASO ASU. In particular, wires of grade ASU are used in deserts and other areas where it is
difficult to perform maintenance. In Tashkent, the grids with voltage of 110 kV, 220 kV and 500
kV, sometimes use one-phase two-conductor power transmission lines with conductors section from
95 to 500 mm2.
(2) Regulatory documents regarding electricity grid facilities
Planning, design, construction and operation of electricity grid facilities are carried out in
accordance with the following documents and relevant regulations of the Cabinet of Ministers.
• Handbook for designing of electrical grids (SPES4) (ed. 2012).
The content of the handbook includes the following:
Information on electrical grids of the Russian Federation and other countries; the modern
level of electricity consumption and loads (Russia); transmission power lines; electrical
grid diagrams; electrical equipment; design of electrical grids; approximate costs, etc.
• Rules for electric installations (PUE5), ed. 2007.
The content of the handbook includes the following:
Protection of electrical grids; electric grids design (wire types, design conditions, laying
methods, etc.); conditions of installation for distribution and transformer equipment;
equipment standards, etc.
• Rules of technical operation of power plants and grids (PTE6) (ed. 1989).
The content of the handbook includes the following:
Rules of technical operation of main equipment, including methods for periodic and daily
technical inspection, operational documentation storage rules, rules for firefighting
measures, operation rules, environmental standards and norms, etc.
Standards for power plants including equipment necessary for the implementation of the
operation and maintenance (access roads, lightning protection, signs indicating the location
of underground utilities, etc.); measures for the protection of the environment (measures to
reduce air emissions, wastewater discharges, noise), maintenance of buildings and
equipment standards (inspection of premises, etc.).
Rules for operation and maintenance of hydroelectric power plants, thermal power plants
and electrical equipment.
Classes of voltages and the frequency of electric grids of Uzbekistan are presented in Table
4.2.3-3.
1Steel-Aluminum(AS) Wire in English. 2Steel-Aluminum Lightweight structure(ASO) Wire in English. 3Steel-Aluminum Reinforced structure(ASU) Wire in English. 4 SPES: Spravochnik po Proyektirovaniyu Elektricheskikh Setey [Handbook for designing of electrical grids] in Russian. 5PUE: Pravila Ustroystva Elektroustanovok [Rules for electric installations] in Russian. 6 PTE: Pravila Tekhnicheskoy Ekspluatatsii Elektricheskikh Stantsiy i Setey [Rules of technical operation of power plants and grids] in Russian.
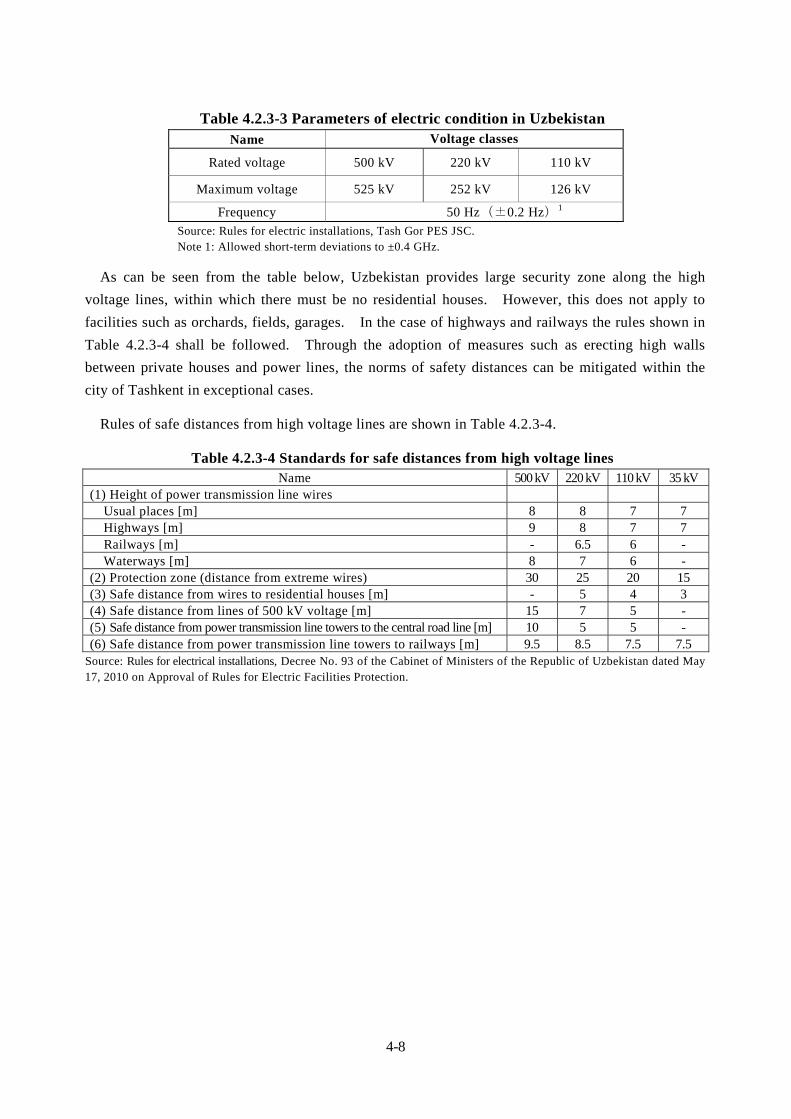
4-8
Table 4.2.3-3 Parameters of electric condition in Uzbekistan Name Voltage classes
Rated voltage 500 kV 220 kV 110 kV
Maximum voltage 525 kV 252 kV 126 kV
Frequency 50 Hz(±0.2 Hz)1
Source: Rules for electric installations, Tash Gor PES JSC. Note 1: Allowed short-term deviations to ±0.4 GHz.
As can be seen from the table below, Uzbekistan provides large security zone along the high
voltage lines, within which there must be no residential houses. However, this does not apply to
facilities such as orchards, fields, garages. In the case of highways and railways the rules shown in
Table 4.2.3-4 shall be followed. Through the adoption of measures such as erecting high walls
between private houses and power lines, the norms of safety distances can be mitigated within the
city of Tashkent in exceptional cases.
Rules of safe distances from high voltage lines are shown in Table 4.2.3-4.
Table 4.2.3-4 Standards for safe distances from high voltage lines Name 500 kV 220 kV 110 kV 35 kV
(1) Height of power transmission line wires Usual places [m] 8 8 7 7 Highways [m] 9 8 7 7 Railways [m] - 6.5 6 - Waterways [m] 8 7 6 - (2) Protection zone (distance from extreme wires) 30 25 20 15 (3) Safe distance from wires to residential houses [m] - 5 4 3 (4) Safe distance from lines of 500 kV voltage [m] 15 7 5 - (5) Safe distance from power transmission line towers to the central road line [m] 10 5 5 - (6) Safe distance from power transmission line towers to railways [m] 9.5 8.5 7.5 7.5
Source: Rules for electrical installations, Decree No. 93 of the Cabinet of Ministers of the Republic of Uzbekistan dated May 17, 2010 on Approval of Rules for Electric Facilities Protection.

4-9
(3) Maintenance conditions of existing electricity network facilities
Current maintenance conditions of existing electricity network facilities in Uzbekistan are shown
in the figure below.
(4) Operational conditions of existing electricity network facilities
Information on current state of electric grid facilities in 500 kV and 220 kV grids (including 110
kV substation system) was clarified with Uzelectroset UE.
According to information received from Uzelectroset UE, repairs and replacements of equipment
are made as and when problems arise, taking into account the potential budget, and when the wear of
the equipment increases. Except for the wear and tear of grid facilities, there are currently no
technological problems that require urgent solutions.
① Wear and tear
• A large part of transformer equipment was produced in the Soviet times and has already
served for 30–40 years. There are also oil circuit breakers (OCB with lifespan of about 50
years.
② Problems in the field of maintenance
• Old equipment, for which it is difficult to get spare parts, is used. Replacement parts have to
be produced locally.
In the event of a breakdown of the oil circuit breaker, it is not repaired but replaced with
gas circuit breaker (GCB).
③ Technical inspection plan
• Technical inspection of equipment is carried out periodically in accordance with the rules of
technical operation of power plants and grids, which set standards for maintenance of
electrical equipment.
Uzbekenergo SJSC
Management of electrical network facilities
UEES
Operation of the system and control of load allocation
NDC
Less than 110 kV
More than 220 kV
Uzelectroset UE
Regional enterprises of electric networks (TashGorPES JSC + 13 regional PES).
Instructions/Control
Instructions/Control
Communication Communication
More than 220 kV
RDC (5 centers)
4-10
④ Repair plan and replacement of equipment
• Due to the presence of a large number of old equipment that requires development of plan for
its repair and replacement, Sredazenergosetproekt is attracted additionally. However, due to
the limited budget the works do not always run according to the plan, resulting in a situation
where it is required to perform an emergency repair at occurrence of malfunctions.
• Selection of old equipment to be replaced is carried out on the basis of competitive bidding.
Chinese-made equipment often wins the competitive biddings.
The most important condition for the admission to biddings is compatibility with the
existing equipment.
⑤ Transformers replacement
• The lifespan of the transformers is 25 years. However, many transformers have been served
for 30–35 years. Normally, the transformers continue to be used until they come into
disrepair.
⑥ Types of switches
• Among the switches for voltages of 110 kV and above, air circuit breaker (ACB) with the
lifespan of over 30 years make up a significant portion.
• Retiring switches are replaced by GCB (one of the main suppliers of GCB-Siemens).
⑦ Gas Insulated Switchgear (GIS)
• Since there are no completed projects on site, we can say that the experience is missing.
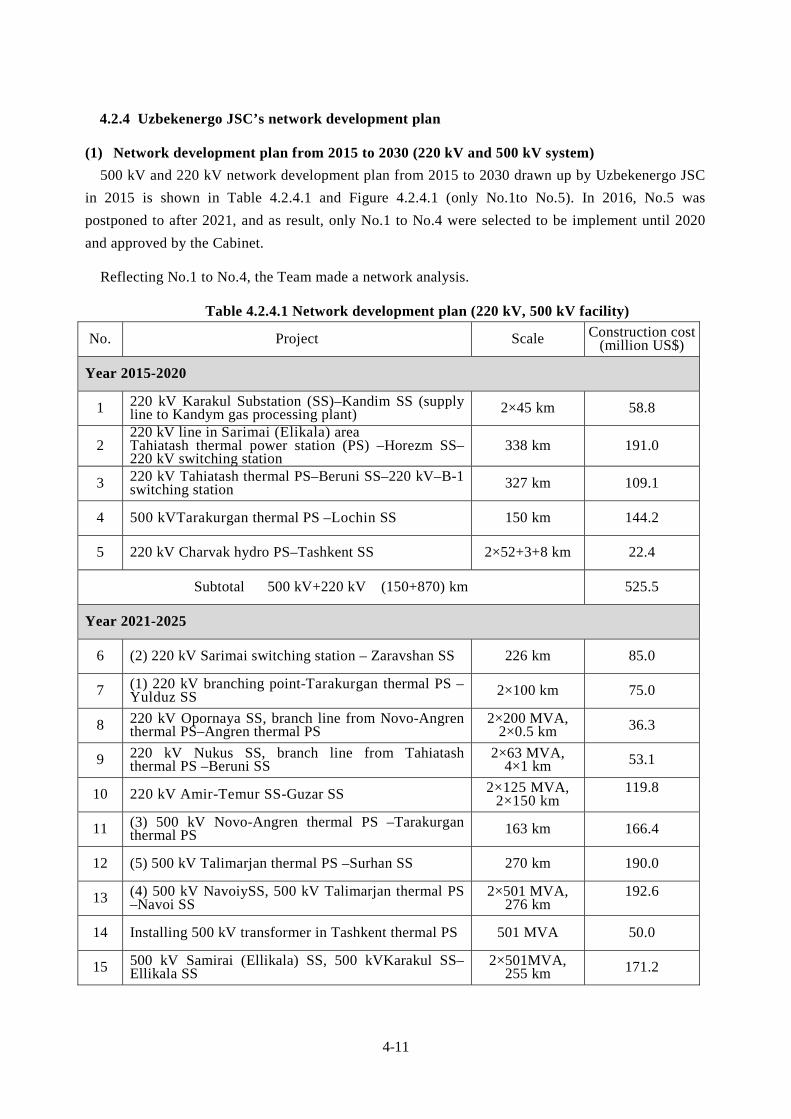
4-11
Uzbekenergo JSC’s network development plan 4.2.4
Network development plan from 2015 to 2030 (220 kV and 500 kV system) (1)
500 kV and 220 kV network development plan from 2015 to 2030 drawn up by Uzbekenergo JSC
in 2015 is shown in Table 4.2.4.1 and Figure 4.2.4.1 (only No.1to No.5). In 2016, No.5 was
postponed to after 2021, and as result, only No.1 to No.4 were selected to be implement until 2020
and approved by the Cabinet.
Reflecting No.1 to No.4, the Team made a network analysis.
Table 4.2.4.1 Network development plan (220 kV, 500 kV facility)
No. Project Scale Construction cost (million US$)
Year 2015-2020
1 220 kV Karakul Substation (SS)–Kandim SS (supply line to Kandym gas processing plant) 2×45 km 58.8
2 220 kV line in Sarimai (Elikala) areaTahiatash thermal power station (PS) –Horezm SS–220 kV switching station
338 km 191.0
3 220 kV Tahiatash thermal PS–Beruni SS–220 kV–B-1 switching station 327 km 109.1
4 500 kVTarakurgan thermal PS –Lochin SS 150 km 144.2
5 220 kV Charvak hydro PS–Tashkent SS 2×52+3+8 km 22.4
Subtotal 500 kV+220 kV (150+870) km 525.5
Year 2021-2025
6 (2) 220 kV Sarimai switching station – Zaravshan SS 226 km 85.0
7 (1) 220 kV branching point-Tarakurgan thermal PS –Yulduz SS 2×100 km 75.0
8 220 kV Opornaya SS, branch line from Novo-Angren thermal PS–Angren thermal PS
2×200 MVA, 2×0.5 km 36.3
9 220 kV Nukus SS, branch line from Tahiatash thermal PS –Beruni SS
2×63 MVA, 4×1 km 53.1
10 220 kV Amir-Temur SS-Guzar SS 2×125 MVA, 2×150 km
119.8
11 (3) 500 kV Novo-Angren thermal PS –Tarakurgan thermal PS 163 km 166.4
12 (5) 500 kV Talimarjan thermal PS –Surhan SS 270 km 190.0
13 (4) 500 kV NavoiySS, 500 kV Talimarjan thermal PS –Navoi SS
2×501 MVA, 276 km
192.6
14 Installing 500 kV transformer in Tashkent thermal PS 501 MVA 50.0
15 500 kV Samirai (Ellikala) SS, 500 kVKarakul SS– Ellikala SS
2×501MVA, 255 km 171.2

4-12
Subtotal 500 kV+220 kV (2,505+776)MVA,(964+731) km 1,139.4
Year 2026-2030
16 220 kV Gulistan SS, branch line from 220 kV Sirdarya thermal PS –Guzal SS
2×125 MVA, 2×63 km 49.6
17 220 kV Yangiyul SS, 220 kV Kuilyuk SS –Adolat SS 2×125 MVA 2×30 km 48.5
18 220 kV Novo-Vostochnaya SS, branch line from Kuilyuk SS –TashkentSS
2×125 MVA, 2× 5.5 km 34.0
19 220 kV Koshkupir SS, branch line from Tahiatash thermal PS –Horezm SS
2×125 MVA, 2×5 km 36.0
20 220 kV Kuvasaiskaya SS, 220 kV Sokin SS-Kuvasaiskaya SS
2×125 MVA, 2×33 km 38.7
21 220 kV Mullalakskaya hydro PS –Tashkent SS 2×65 km 40.3
22 220 kV Pskemskaya hydro PS – Mullakskaya hydro PS 2×20 km 17.5
23 500 kV Mullalakskaya hydro PS –Tashkent SS 65 km 37.0
24 500 kV Muruntau SS, 500 kV Navoiy SS –Muruntau SS
2×501 MVA, 168 km 143.6
25 500 kV Sarimai(Elliakala) SS –Muruntau SS 226km 90.4
26 500 kV Kolcevaya SS, 500 kV branch line from Sirdarya thermal PS –Tashkent SS
2×501 MVA, 2×26 km 127.1
27 500 kV Sirdarya thermal PS –Kolcevaya SS 150 km 68.0
28 500 kV Navoi SS – Sogdiana SS 256 km 102.4
29 500 kV Djizak SS, 500 kV branch line from Sirdarya therma PS – Sogdiana SS
2×501 MVA, 4×2 km 126.0
30 500 kV Talimarjan thermal PS –Guzar SS 83 km 55.3
Subtotal 500 kV+220 kV (3,006+ 1,250) MVA,(1,008+443) km 1,014.4
Grand total 500 kV + 220 kV (5,511+ 2,026) MVA,(2,122 + 2,044) km 2,679.3
Source: Uzbekenergo JSC

4-13
Source: JICA Study Team based on the information provided by Uzbekenergo JSC
Figure 4.2.4.1 Network development plan (220 kV, 500 kV facility)

4-14
Network development plan by 2020(No.1 to No.4) (2)
According to Uzbekenergo JSC, plans No.1 to No.4 of the Table 4.2.4.1 were modified after the
approval. The latest status pf the plans as of February 2016 is described as below. The costs do not
include consultant’s fee except for plan No.2. For plan No.2, L/A was concluded with ADB and
consultants will be procured according to the policy of ADB. For the other projects, procurements
of consultants depend on the policy of the donors.
No.1 Bukhara SS - Kandym Gas Plant & Karakul SS: 58. 8MUSD (Material & Construction)
Outline ・220 kV Transmission line : 83.5 km (AS-400/51, 1 Circuit, New Construction) and 7.6
km (AS-400/51, 1 Circuit, Renovation of Wire) Bukhara SS - Kadym Gas Plant
・Bukhara Substation : 220 kV Switch x 1 Cell (New Construction)
・Karakul Substation: 220 kV Switch x 2 Cells (New Construction)
Note The F/S implemented by gas plant company, Lukoil (Russia) was approved by the Cabinet
and Pre-F/S of Uzbek side will be completed by March 15 and submitted to the Cabinet on
April 15.
The aim of this Project is to supply power to New Gas Processing Plant at Kandym. The
plant is categorized as 1, that is power supply should not be stopped under any
circumstances. Through the Project, cells at Bukhara SS and Karakul SS and Transmission
Line from Bukhara to Kandym will be prepared by Uzbekenergo JSC, while cells of
Kandym will be prepared by the gas plant company, Lukoil.
There is enough bus space to install new cell at Bukhara Substation. And there is also
enough space at Karakul Substation, and the bus will be extended for the new cells.
No.2 Takhiatash PS – Horezm SS – Sarimai SS: 255 MUSD (incl. Consultant)
Outline ・220 kV Transmission line : 186.8 km (AS-400/51, 1 Circuit, New Construction)
Tahiatash PS – Horezm SS and 151.9 km (AS-400/51, 1 Circuit, New Construction)
Horezm SS – Sarimai SS
・Takhiatash PS: 220 kV Switch 1 Cell (New Construction)
・Horezm SS: 220/110 kV, 200 MVA x 2 and 220 kV Switch 10 Cell (Renovation Tr
125MVA→200MVA, ACB→GCB)
・Sarimai SS: 220 kV Switch 5 Cell (New Construction)
Note L/A was signed by ADB & Uzbekistan on November 12, 2015
The aim of this Project is to improve the reliability of the electricity supply to the North
West area, where one of the 220 kV Transmission Lines is located and maintenance is
difficult.
There is enough space for Takhiatash PS, which is under construction, and 220kV Switch
yard of Sarimai SS, while the space for Sarimai 500/220 kV Substation is under
consideration. The route for Transmission Line is determined and the land is already
prepared.
No.3 Takhiatash PS - Berniy SS - Sarimai SS: 109.1 MUSD (Material & Construction)
4-15
Outline ・220 kV Transmission line : 157.0 km (AS-400/51, 1 Circuit, New Construction)
Takhiatash PS – Berniy SS and 170.0 km (AS-400/51, 1 Circuit, New Construction)
Berniy SS – Sarimai SS
・Takhiatash PS: 220 kV Switch 1 Cell (New Construction)
・Berniy SS: 220/110 kV, 200 MVA x 2and 220 kV Switch 3 Cell (Renovation Tr
125MVA→200MVA, ACB→GCB)
・Sarimai SS: 220 kV Switch 1 Cell (New Construction)
Note This Project will be implemented after plan No.2 Project. Ministry of Economics wrote a
letter to defer the implementation of the Project to 2018-2020 time frame. Currently this
Project is under consideration.
The aim of this Project is to improve the reliability of the electricity supply to the North
West area, where one of the 220 kV Transmission Lines is located and maintenance is
difficult.
The spaces for the Project at Takhiatash PS, Berniy SS and Sarimai SS are prepared. At
Sarimai, Switching yard will be constructed in the Project No.2 and the space for 1 cell at
Sarimai will be prepared for installation in the Project No.3. Regarding Transmission line,
the route is not yet determined.
Because of the shortage of budget, construction of Nukus SS will be postponed or
cancelled at the moment.
No.4 Turakurgan PS – Lochin SS: 165MUSD
Outline ・500 kV Transmission line : 150.0 km (AS-300 x 3, 1 Circuit, New Construction)
Turakurgan PS – Lochin SS
・Turakurgan PS: 500/220 kV, (167 MVA x 3) x 2 and 500 kV Switch 4 Cells
・Lochin SS: 500 kV Switch 2 Cells
Note The F/S is implemented by Uzbekenergo JSC.
The aim of this Project is to improve power supply in East area.
There is enough space at Lochin while space at Turakurgan and space for Transmission
Line is under consideration.
4-16
4.3 Network Analysis
In order to review Uzbekenergo JSC’s network development plan, a network analysis on power
flow and voltage, fault current and stability was carried out.
Network analysis condition 4.3.1
Network to be reviewed (1)
The analysis data are composed based on the 2020 network data of built by "EnergoSetProject"
Institute in 2011.
All facilities in 500 kV and 220 kV, and some of 110 kV are simulated, and the simulation scale of
the original data is as follows:
Number of busses:208, transmission lines:206, substations:60
The total demand is 10,025 MW similar to 10,297 MW forecasted by the Team.
According to the network configuration of the original data, which were built in 2011, 500 kV
network would be distributed around and across the country by 2020, as Figure 4.3.1.1 shows. In this
figure, the existing 500 kV network as of 2015 is drawn by solid line and the planned one from 2016
to 2020 by dotted line.
The Team revised the data of loads and power stations. Furthermore, it excluded the 500 kV
transmission lines in the western area
(Korakul-Sarimai,Sarimai-Muruntau,Muruntau-Navoiy,Navoiy-Talimarjan,Navoiy-Sugdiena), and
Novo-Angren-Turakurgan line in the eastern area which will not be completed until 2020. And
necessary change was made in 220 kV network.

4-17
B-1
B-2
Horezm
Tahiatash B-3
Zarafshan
M
M-1
D
Navoi
Besopan
SuvliCemzavod
Buhoro
Muborak
KosonKarshi
HC-7
Kokdumalak
SHGHK
Surhon
Sherobod
Samarkand
IshtihanKattakurgonHimiya
Keles
Feruz
Ozodlik Chirchik
Karakalpakistan
M-2
Karernaya
O
Kandim
Hamza
Hamza
HC-4
HC-
HC-1
Amir
Amu-Z PA
Pachikamar
Denov
Akdjar
Saribozor
Gulcha
Guzal
Charvak
Andijan
Adolat
Yuksak TurakurganAngren
Lochin
Pechnaya
Zafar
Sarimai
Muruntau
Korakul
Navoiy
Talimarjan
Guzar
Sugdiena
Toshkent
Toshkent PS
Toshkent
N-Angren
Uzbekistan
Power station
Substation
Transmission line
Red:500 kV
Black:220 kV
Legend
Kazakhstan
Kyrgyz
Source : JICA Study Team based on the information provided by "EnergoSetProject" Institute
Figure 4.3.1.1 Network configuration of the original data
International power interchange (2)
Since Uzbekistan network is interconnected to Kazakhstan and Kyrgyzstan, the value of
international power interchange should be confirmed. The southern Kazakhstan, north of Uzbekistan,
has a large demand and small generation whereas Kyrgyzstan, east of Uzbekistan, has an affluent
hydro power. For this reason, Uzbekistan receives the power from Kyrgyzstan, and sends an
equivalent amount of the power to Kazakhstan through the Uzbekistan network.
Since the value of international power interchange in 2020 is not determined, the value is
forecasted based on the actual record in the winter of 2015 as follows.
・650 MW of the power is received from Kyrgyzstan at Lochin Substation
・390 MW is sent to Kazakhstan from 500 kV bus and 260 MW from 220 kV bus at Tashkent PS.
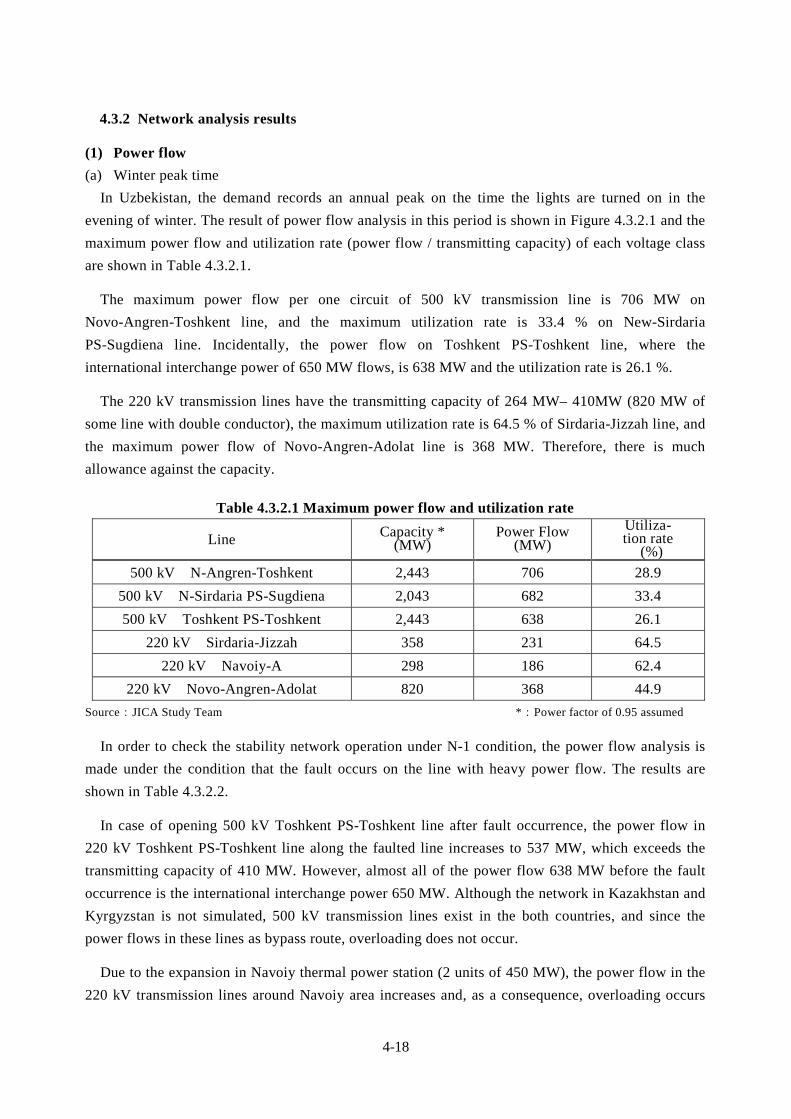
4-18
Network analysis results 4.3.2
Power flow (1)
Winter peak time (a)
In Uzbekistan, the demand records an annual peak on the time the lights are turned on in the
evening of winter. The result of power flow analysis in this period is shown in Figure 4.3.2.1 and the
maximum power flow and utilization rate (power flow / transmitting capacity) of each voltage class
are shown in Table 4.3.2.1.
The maximum power flow per one circuit of 500 kV transmission line is 706 MW on
Novo-Angren-Toshkent line, and the maximum utilization rate is 33.4 % on New-Sirdaria
PS-Sugdiena line. Incidentally, the power flow on Toshkent PS-Toshkent line, where the
international interchange power of 650 MW flows, is 638 MW and the utilization rate is 26.1 %.
The 220 kV transmission lines have the transmitting capacity of 264 MW– 410MW (820 MW of
some line with double conductor), the maximum utilization rate is 64.5 % of Sirdaria-Jizzah line, and
the maximum power flow of Novo-Angren-Adolat line is 368 MW. Therefore, there is much
allowance against the capacity.
Table 4.3.2.1 Maximum power flow and utilization rate
Line Capacity * (MW)
Power Flow (MW)
Utiliza-tion rate
(%)
500 kV N-Angren-Toshkent 2,443 706 28.9
500 kV N-Sirdaria PS-Sugdiena 2,043 682 33.4
500 kV Toshkent PS-Toshkent 2,443 638 26.1
220 kV Sirdaria-Jizzah 358 231 64.5
220 kV Navoiy-A 298 186 62.4
220 kV Novo-Angren-Adolat 820 368 44.9
Source:JICA Study Team *:Power factor of 0.95 assumed
In order to check the stability network operation under N-1 condition, the power flow analysis is
made under the condition that the fault occurs on the line with heavy power flow. The results are
shown in Table 4.3.2.2.
In case of opening 500 kV Toshkent PS-Toshkent line after fault occurrence, the power flow in
220 kV Toshkent PS-Toshkent line along the faulted line increases to 537 MW, which exceeds the
transmitting capacity of 410 MW. However, almost all of the power flow 638 MW before the fault
occurrence is the international interchange power 650 MW. Although the network in Kazakhstan and
Kyrgyzstan is not simulated, 500 kV transmission lines exist in the both countries, and since the
power flows in these lines as bypass route, overloading does not occur.
Due to the expansion in Navoiy thermal power station (2 units of 450 MW), the power flow in the
220 kV transmission lines around Navoiy area increases and, as a consequence, overloading occurs
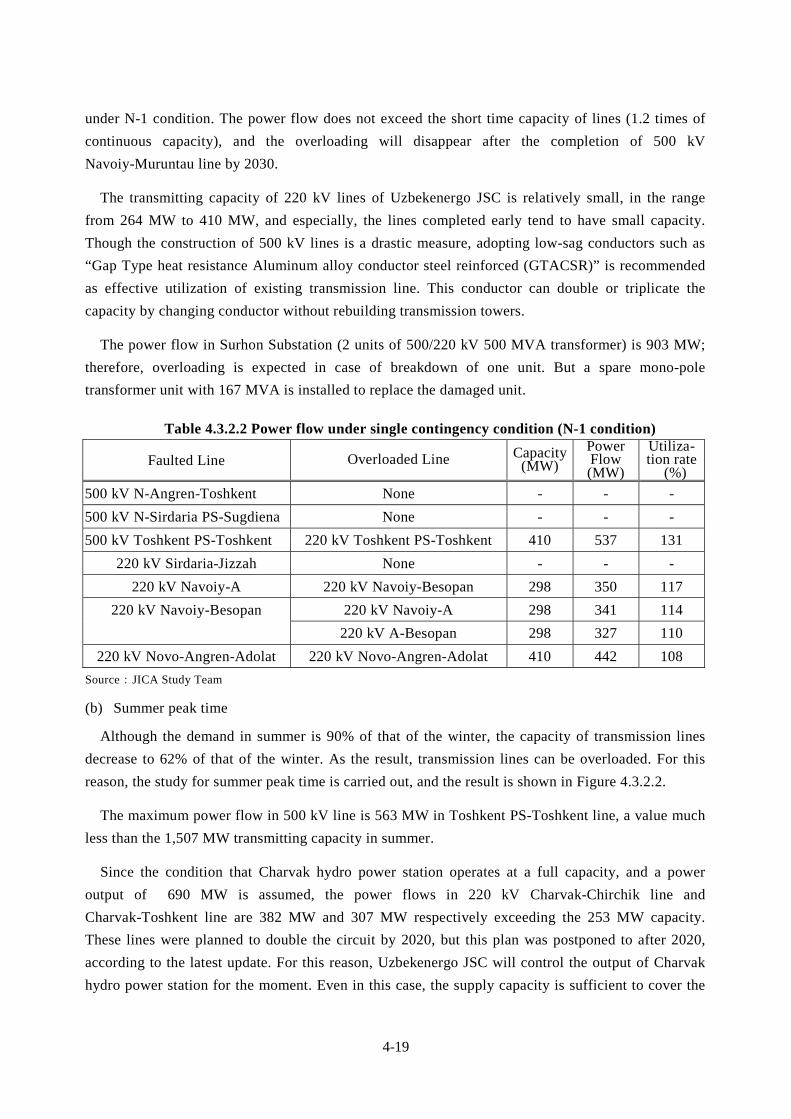
4-19
under N-1 condition. The power flow does not exceed the short time capacity of lines (1.2 times of
continuous capacity), and the overloading will disappear after the completion of 500 kV
Navoiy-Muruntau line by 2030.
The transmitting capacity of 220 kV lines of Uzbekenergo JSC is relatively small, in the range
from 264 MW to 410 MW, and especially, the lines completed early tend to have small capacity.
Though the construction of 500 kV lines is a drastic measure, adopting low-sag conductors such as
“Gap Type heat resistance Aluminum alloy conductor steel reinforced (GTACSR)” is recommended
as effective utilization of existing transmission line. This conductor can double or triplicate the
capacity by changing conductor without rebuilding transmission towers.
The power flow in Surhon Substation (2 units of 500/220 kV 500 MVA transformer) is 903 MW;
therefore, overloading is expected in case of breakdown of one unit. But a spare mono-pole
transformer unit with 167 MVA is installed to replace the damaged unit.
Table 4.3.2.2 Power flow under single contingency condition (N-1 condition)
Faulted Line Overloaded Line Capacity(MW)
Power Flow (MW)
Utiliza-tion rate
(%)
500 kV N-Angren-Toshkent None - - -
500 kV N-Sirdaria PS-Sugdiena None - - -
500 kV Toshkent PS-Toshkent 220 kV Toshkent PS-Toshkent 410 537 131
220 kV Sirdaria-Jizzah None - - -
220 kV Navoiy-A 220 kV Navoiy-Besopan 298 350 117
220 kV Navoiy-Besopan 220 kV Navoiy-A 298 341 114
220 kV A-Besopan 298 327 110
220 kV Novo-Angren-Adolat 220 kV Novo-Angren-Adolat 410 442 108
Source:JICA Study Team
Summer peak time (b)
Although the demand in summer is 90% of that of the winter, the capacity of transmission lines
decrease to 62% of that of the winter. As the result, transmission lines can be overloaded. For this
reason, the study for summer peak time is carried out, and the result is shown in Figure 4.3.2.2.
The maximum power flow in 500 kV line is 563 MW in Toshkent PS-Toshkent line, a value much
less than the 1,507 MW transmitting capacity in summer.
Since the condition that Charvak hydro power station operates at a full capacity, and a power
output of 690 MW is assumed, the power flows in 220 kV Charvak-Chirchik line and
Charvak-Toshkent line are 382 MW and 307 MW respectively exceeding the 253 MW capacity.
These lines were planned to double the circuit by 2020, but this plan was postponed to after 2020,
according to the latest update. For this reason, Uzbekenergo JSC will control the output of Charvak
hydro power station for the moment. Even in this case, the supply capacity is sufficient to cover the

4-20
demand which is 90% of that of the winter peak; furthermore, water can be utilized because the
power station is a dam plant.
The analysis result indicates that the operation will be at the output of 490 MW, 200 MW less than
the capacity, but this will not load to the overloading.
220 kV transmission lines have various capacities with thick and thin conductors; the maximum
utilization rate except the above two lines is 84% of Toshkent PS-Toshkent line, and no overloading
occurs.
In case of occurrence of overloading under contingency condition, Uzbekenergo JSC controls the
outputs of power stations to avoid the overloading problem, and it does not draw up a network
development plan responding to the summer peak condition.

4-21
506
368+21
7
323
110
125
Figure 4.3.2.1 Power flow in winter of 2020
Source:JICA Survey Team

4-22
Figure 4.3.2.2 Power flow in summer of 2020
Source:JICA Survey Team

4-23
Voltage (2)
The condition of 220 kV substations with voltages below 90% is shown in Table 4.3.2.3. All these
substations exist in the South-West network, far from power stations which can keep voltage. They
are influenced by postponement of the development of 500 kV transmission lines, which can supply
reactive power to raise the voltage. The voltages also tend to decrease to about 90% in North-West
and South networks.
The study to confirm the effect of measures against voltage drop is carried out. The result is shown
in Table 4.3.2.3. The proposed measures are installing capacitors (Beruniy 100 MVA, Besopan 200
MVA, Sherobod 100 MVA, Jizza 100 MVA, Keles 100MVA, Yulduz 200 MVA). As Table 4.3.2.3
shows, the measures are effective to recover the voltage at near 100%.
Table 4.3.2.3 220 kV substation below 90% voltage
Station Voltage (%)
Station Voltage (%)
Before Installation
AfterInstallation
BeforeInstallation
AfterInstallation
B-3 88 100 Zarafshan 85 98
F 82 97 O 82 97
Gornaya 83 98 Karernaya 83 98
M 83 98 M-1 83 98
M-2 83 98 Besopan 83 98
D 89 99 Tashhura 81 97
Source:JICA Study Team

4-24
Fault current (3)
Since Uzbekistan network is interconnected to Kazakhstan and Kyrgyzstan networks, the fault
current is supplied from these neighboring countries. As this value is not clear, it is assumed as a
severe case that 10 kA at Tashkent PS 500 kV bus from Kazakhstan and also 10 kA at Lochin
substation 500 kV bus from Kyrgyzstan are supplied. The results are shown in Figure 4.3.2.3 and
Table 4.3.2.4. The table also shows the fault currents without that of the neighboring countries also
shown.
The fault currents at Tashkent PS and Lochin without that of the neighboring countries are 13.0 kA
and 6.9 kA respectively; therefore, it can be said that the 10 kA assumption is sufficiently severe.
The maximum 3 of each voltage class are as follows.
500 kV (permissible value 31.5 kA):Sirdaria 25.0 kA, Toshkent 23.6 kA, Toshkent PS 23.3 kA
220 kV (permissible value 40.0 kA):Toshkent 33.2 kA, Toshkent PS 30.4 kA, Novo-Angren 29.5 kA.
Since the maximum values are much less than the permissible values, no problem exists.
Table 4.3.2.4 Fault current
500 kV Fault Current (kA) 220 kV Fault Current (kA)
Station [ ]: Excluding the current
from neighboring countries
Area Station [ ]: Excluding the current
from neighboring countries
Korakul 4.6 [5.0] North-West Tahiatash 13.0 [13.0]
Talimarjan 12.5 [12.4] South-West Besopan 4.3 [4.3]
Sugdiena 11.3 [11.0] Navoiy 22.6 [22.6]
Guzar 9.2 [9.1] Korakul 9.2 [9.2]
Surhon 4.2 [4.2] Talimarjan 22.5 [22.5]
Sirdaria 25.0 [22.8] Sugdiena 14.0 [13.8]
N-Sirdaria 22.6 [20.9] Guzar 13.3 [13.3]
Toshkent
PS 23.3 [13.0] South Surhon 6.0 [6.0]
Toshkent 23.6 [15.9] Central Sirdaria 20.4 [19.6]
N-Angren 22.2 [18.8] Toshkent
PS 30.4 [25.3]
Uzbekistan 13.3 [10.4] Toshkent 33.2 [28.6]
Turakurgan 9.4 [7.9] N-Angren 29.5 [27.9]
Lochin 17.0 [6.9] East Uzbekistan 17.1 [14.6]
Turakurgan 20.5 [17.3]
Lochin 18.7 [12.6]
Source:JICA Study Team
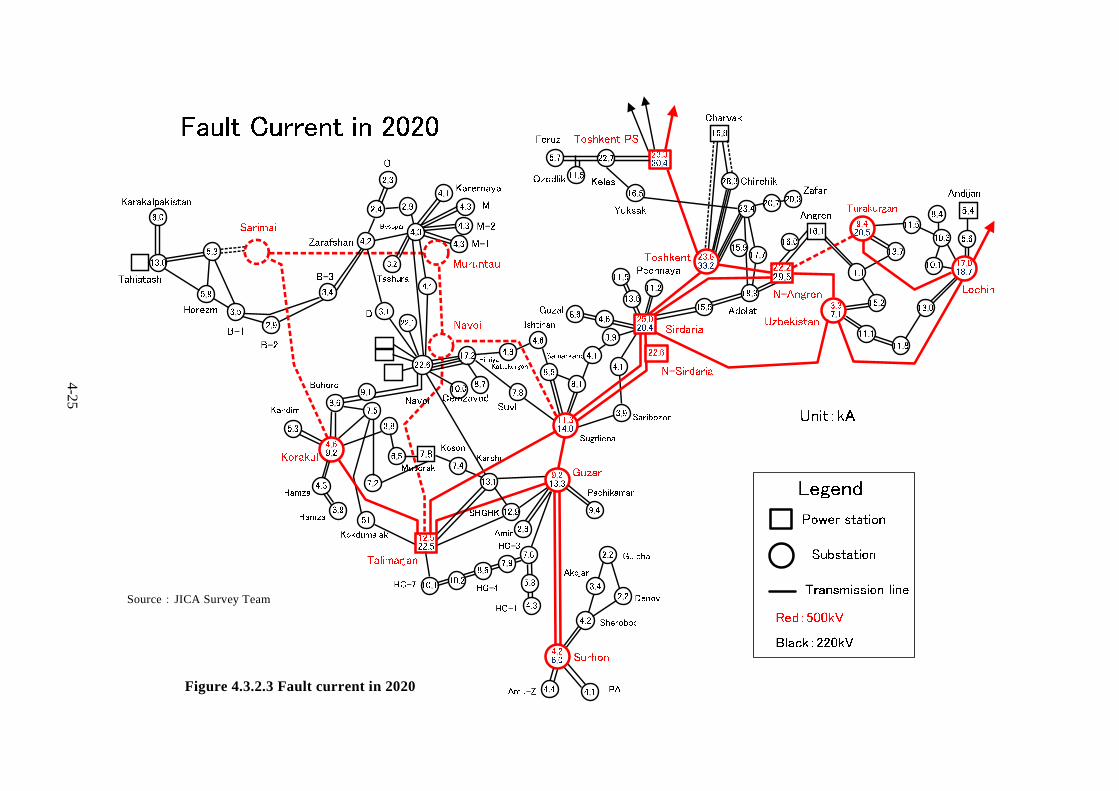
4-25
Figure 4.3.2.3 Fault current in 2020
Source:JICA Survey Team

4-26
Stability (4)
The next condition is set for the stability analysis.
Condition:three-phase short circuit fault occurs at 0 ms of a line and the faulted line is opened at
100 ms (220 kV and 500 kV).
The study cases are shown in Table 4.3.2.5.
The severe fault conditions in which the fault occurs at a location very close to the power station
are selected.
Figure 4.3.2.4 shows the transition of generator voltage angle in a period of 10 sec.
The generator voltage angles fluctuate widely after the fault occurs, but the fluctuation converges
with time. Therefore, the stability can be maintained in all cases.
Table 4.3.2.5 Cases for stability study
Case Voltage Faulted line Faulted point Fault clearing
time
Case 1 220 kV Tahiatash-Koshkupir Tahiatash
Case 2 500 kV Tarimarjan-Guzor Tarimarjan
Case 3 500 kV Sirdaria-Sugdiena Sirdaria
Case 4 220 kV Toshkent PS-Toshkent Toshkent PS 100 ms
Case 5 500 kV Toshkent PS-Toshkent Toshkent PS
Case 6 500 kV Novo-Angren-Uzbekistan Novo-Angren
Case 7 220 kV Turakurgan-Kizil-Ravat Turakurgan
Source:JICA Study Team
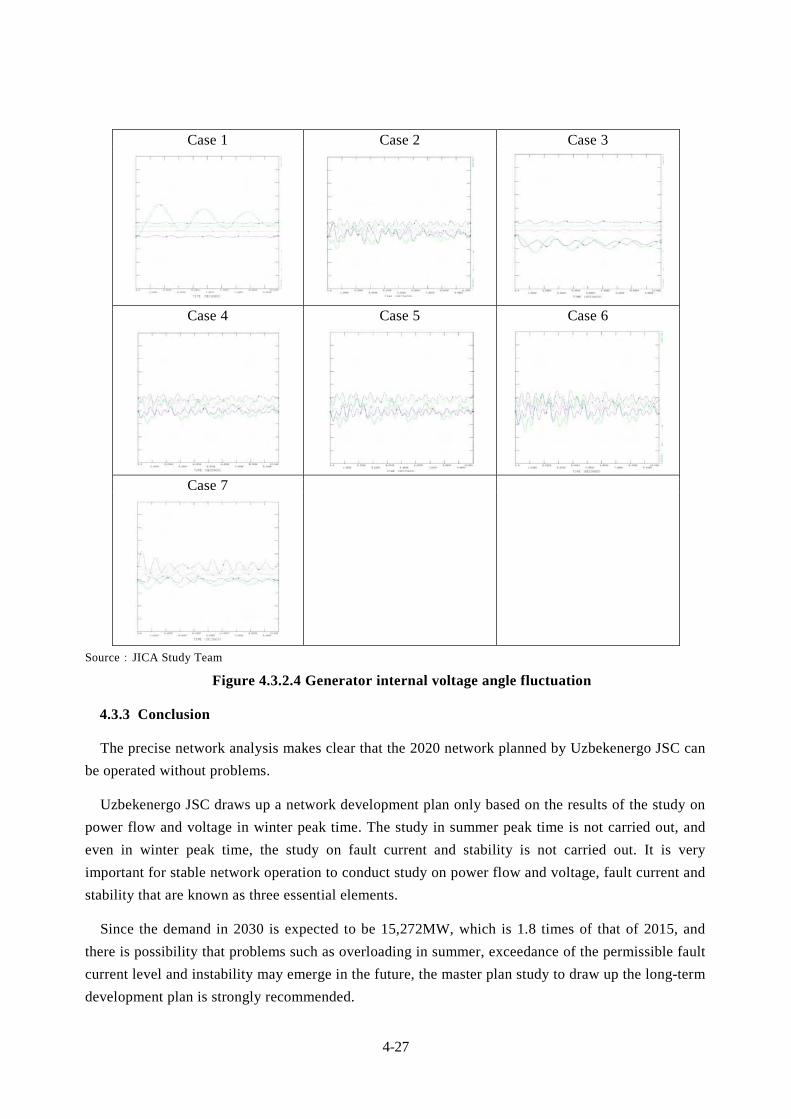
4-27
Case 1 Case 2 Case 3
Case 4 Case 5 Case 6
Case 7
Source:JICA Study Team
Figure 4.3.2.4 Generator internal voltage angle fluctuation
Conclusion 4.3.3
The precise network analysis makes clear that the 2020 network planned by Uzbekenergo JSC can
be operated without problems.
Uzbekenergo JSC draws up a network development plan only based on the results of the study on
power flow and voltage in winter peak time. The study in summer peak time is not carried out, and
even in winter peak time, the study on fault current and stability is not carried out. It is very
important for stable network operation to conduct study on power flow and voltage, fault current and
stability that are known as three essential elements.
Since the demand in 2030 is expected to be 15,272MW, which is 1.8 times of that of 2015, and
there is possibility that problems such as overloading in summer, exceedance of the permissible fault
current level and instability may emerge in the future, the master plan study to draw up the long-term
development plan is strongly recommended.

Chapter 5 Priority Potential Projects
5-1
Chapter 5 Priority Potential Projects
5.1 Outline of thermal power plants in Uzbekistan
According to Uzbekenergo JSC the installed capacity of Uzbekistan power plants as of
2014 is 12,468 MW, 85 % of which is occupied by thermal power stations, 14 % by
hydroelectric power stations and the remainder takes the solar power plant in Samarkand.
The main fuel for thermal power plants (TPP) is natural gas (80 %), with coal making up
the remaining 20 %. At most power plants, the co-firing of fuel-oil is foreseen as a reserve
fuel, when, for instance, examining gas supply equipment. Coal-fired power plants also
often use fuel-oil as reserve fuel.
Most Uzbekistan thermal power plants were built in 1950-1970 during the Soviet period
40-60 years ago and are obsolete. Amid peak electricity demand, reaching 8,000 MW, the
real ability to supply stopped at 8,200 MW with virtually no spare capacity, given the planned
stops during periodic inspections.
Moreover, most of the equipment continues to decline into obsolescence, except for
relatively new gas turbine combined-cycle 1 of, Navoi TPP, GTCC of the Talimardjan
thermal power plant and the gas turbine Cogeneration System2 of Tashkent CHP. As shown
in Tables 5.1-1 and 5.1-2, the efficiency of gas thermal power plants is low, even compared
to Russian data for 1990-1994 years when virtually no combined-cycle plants were
introduced. This suggests the need for planned development and renovation of power
stations.
Also, Uzbekistan also maintains a mutual turnover of electricity with Kazakhstan,
Kyrgyzstan and Afghanistan to recover from electricity shortages and stabilize the power grid.
Energy exchanges previously conducted with Turkmenistan and Tajikistan have now been
discontinued.
Table 5.1-1 Efficiency of gas thermal power plants
Efficiency of generating side (based on Lower Heating Value) (%) USA Russia Japan
1990 36.60 34.40 43.20 1991 34.70 30.80 43.40 1992 34.70 31.20 43.40 1993 35.80 32.70 43.10 1994 36.30 30.40 43.50
Source: RITE
1GTCC (Gas Turbine Combined Cycle) 2GTCS (Gas Turbine Cogeneration System)
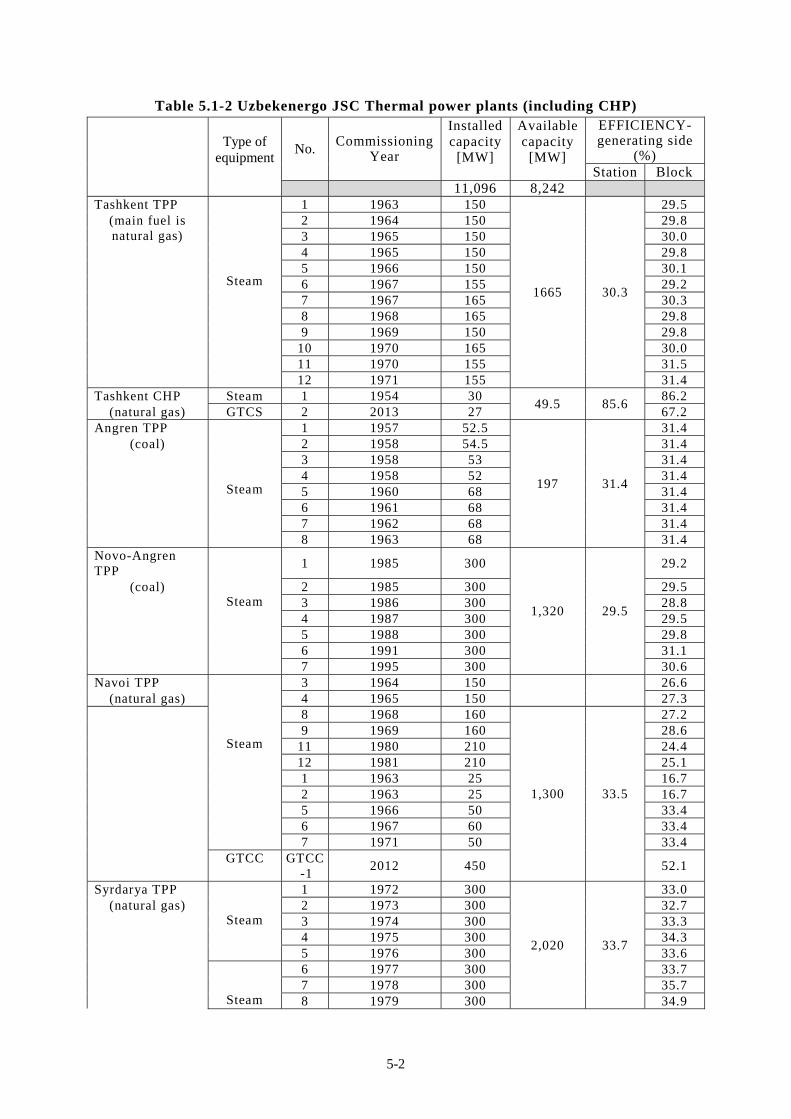
5-2
Table 5.1-2 Uzbekenergo JSC Thermal power plants (including CHP)
Type of
equipment No.
CommissioningYear
Installed capacity
[MW]
Available capacity
[MW]
EFFICIENCY-generating side
(%)Station Block
11,096 8,242Tashkent TPP
Steam
1 1963 150
1665 30.3
29.5 (main fuel is natural gas)
2 1964 150 29.8 3 1965 150 30.0
4 1965 150 29.8 5 1966 150 30.1 6 1967 155 29.2 7 1967 165 30.3 8 1968 165 29.8 9 1969 150 29.8 10 1970 165 30.0 11 1970 155 31.5 12 1971 155 31.4 Tashkent CHP Steam 1 1954 30
49.5 85.6 86.2
(natural gas) GTCS 2 2013 27 67.2 Angren TPP
Steam
1 1957 52.5
197 31.4
31.4 (coal) 2 1958 54.5 31.4
3 1958 53 31.4 4 1958 52 31.4 5 1960 68 31.4 6 1961 68 31.4 7 1962 68 31.4 8 1963 68 31.4 Novo-Angren TPP
Steam
1 1985 300
1,320 29.5
29.2
(coal) 2 1985 300 29.5 3 1986 300 28.8 4 1987 300 29.5 5 1988 300 29.8 6 1991 300 31.1 7 1995 300 30.6 Navoi TPP
Steam
3 1964 150
26.6 (natural gas) 4 1965 150 27.3
8 1968 160
1,300 33.5
27.2 9 1969 160 28.6 11 1980 210 24.4 12 1981 210 25.1 1 1963 25 16.7 2 1963 25 16.7 5 1966 50 33.4 6 1967 60 33.4 7 1971 50 33.4 GTCC GTCC
-1 2012 450 52.1
Syrdarya TPP
Steam
1 1972 300
2,020 33.7
33.0 (natural gas) 2 1973 300 32.7
3 1974 300 33.3 4 1975 300 34.3 5 1976 300 33.6
Steam
6 1977 300 33.7 7 1978 300 35.7 8 1979 300 34.9
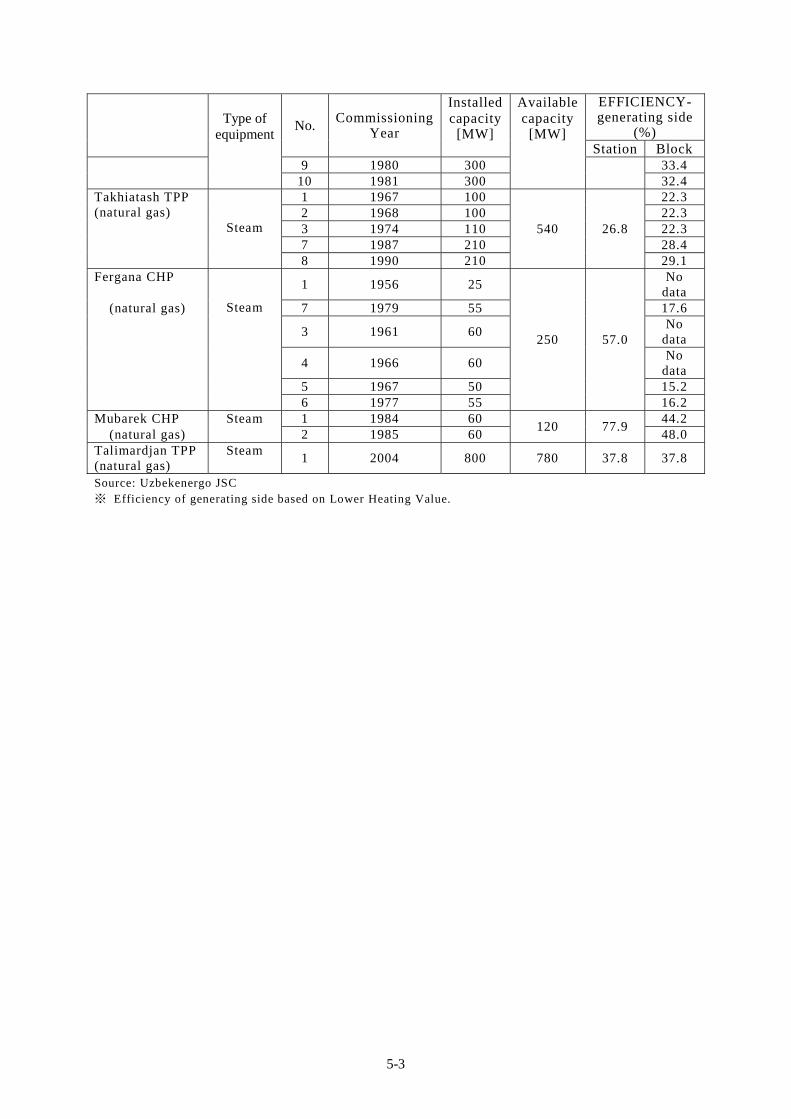
5-3
Type of
equipment No.
CommissioningYear
Installed capacity
[MW]
Available capacity
[MW]
EFFICIENCY-generating side
(%)Station Block
9 1980 300 33.4 10 1981 300 32.4 Takhiatash TPP (natural gas)
Steam
1 1967 100
540 26.8
22.3 2 1968 100 22.3
3 1974 110 22.3 7 1987 210 28.4 8 1990 210 29.1 Fergana CHP
Steam
1 1956 25
250 57.0
No data
(natural gas) 7 1979 55 17.6
3 1961 60 No
data
4 1966 60 No
data 5 1967 50 15.2 6 1977 55 16.2 Mubarek CHP Steam 1 1984 60
120 77.9 44.2
(natural gas) 2 1985 60 48.0 Talimardjan TPP (natural gas)
Steam 1 2004 800 780 37.8 37.8
Source: Uzbekenergo JSC ※ Efficiency of generating side based on Lower Heating Value.
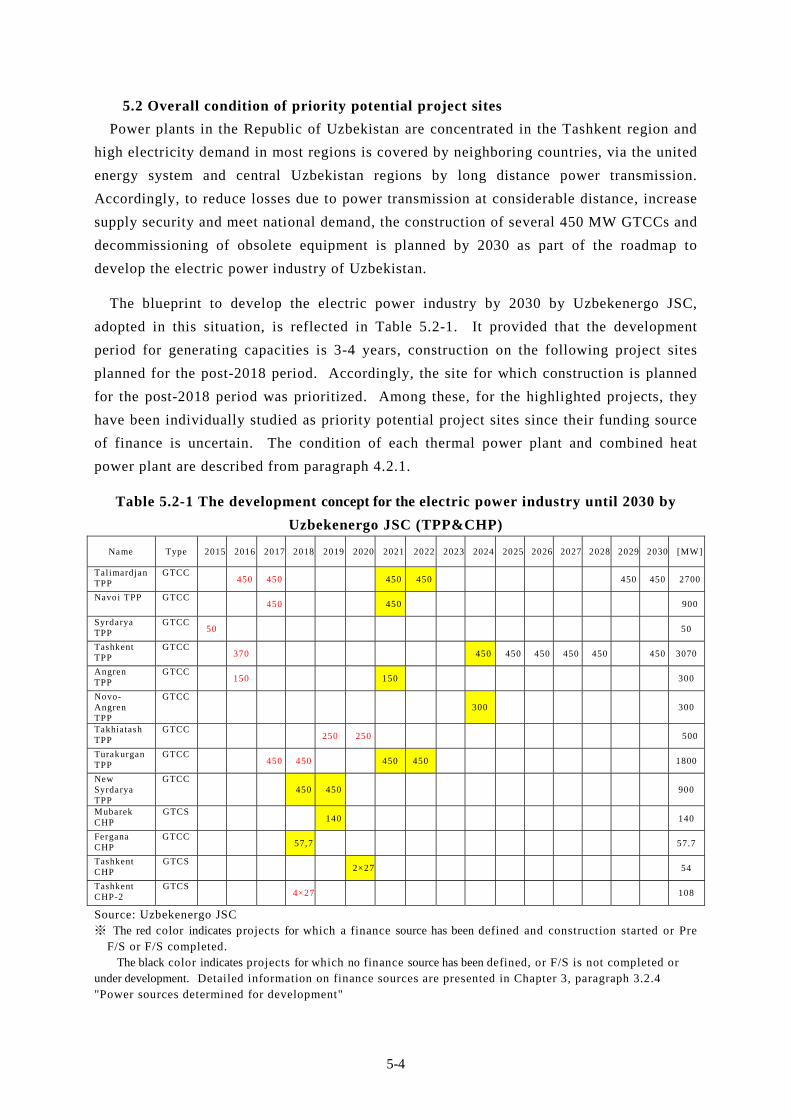
5-4
5.2 Overall condition of priority potential project sites
Power plants in the Republic of Uzbekistan are concentrated in the Tashkent region and
high electricity demand in most regions is covered by neighboring countries, via the united
energy system and central Uzbekistan regions by long distance power transmission.
Accordingly, to reduce losses due to power transmission at considerable distance, increase
supply security and meet national demand, the construction of several 450 MW GTCCs and
decommissioning of obsolete equipment is planned by 2030 as part of the roadmap to
develop the electric power industry of Uzbekistan.
The blueprint to develop the electric power industry by 2030 by Uzbekenergo JSC,
adopted in this situation, is reflected in Table 5.2-1. It provided that the development
period for generating capacities is 3-4 years, construction on the following project sites
planned for the post-2018 period. Accordingly, the site for which construction is planned
for the post-2018 period was prioritized. Among these, for the highlighted projects, they
have been individually studied as priority potential project sites since their funding source
of finance is uncertain. The condition of each thermal power plant and combined heat
power plant are described from paragraph 4.2.1.
Table 5.2-1 The development concept for the electric power industry until 2030 by
Uzbekenergo JSC (TPP&CHP)
Name Type 2015 2016 2017 2018 2019 2020 2021 2022 2023 2024 2025 2026 2027 2028 2029 2030 [MW]
Talimardjan TPP
GTCC 450 450 450 450 450 450 2700
Navoi TPP GTCC 450 450 900
Syrdarya TPP
GTCC 50 50
Tashkent TPP
GTCC 370 450 450 450 450 450 450 3070
Angren TPP
GTCC 150 150 300
Novo-Angren TPP
GTCC 300 300
Takhiatash TPP
GTCC 250 250 500
Turakurgan TPP
GTCC 450 450 450 450 1800
New Syrdarya TPP
GTCC 450 450 900
Mubarek CHP
GTCS 140 140
Fergana CHP
GTCC 57,7 57.7
Tashkent CHP
GTCS 2×27 54
Tashkent CHP-2
GTCS 4×27 108
Source: Uzbekenergo JSC ※ The red color indicates projects for which a finance source has been defined and construction started or Pre
F/S or F/S completed. The black color indicates projects for which no finance source has been defined, or F/S is not completed or
under development. Detailed information on finance sources are presented in Chapter 3, paragraph 3.2.4 "Power sources determined for development"

5-5
5.2.1 Navoi TPP
This paragraph shows the results of a study on a potential for further yen loans to construct
GTCC 3, which is scheduled for completion by 2021.
(1) Outline of the power plant
Figure 5.2.1-1 Location of Navoi TPP
Navoi TPP has been constructed to provide power to central and western parts of
Uzbekistan (Navoi, Bukhara, Samarkand regions). At present, Navoi TPP also
supplies heat to the adjacent Navoiyazot (fertilizer plant). Navoi TPP is a
cogeneration plant, which includes modern combined-cycle plants of the M701F type
produced by MHPS, but the remaining power-generating units were built in the 60s
and many have reached the end of their service life. Accordingly, although the total
plant capacity is 3,000 MW, the available capacity is 1,300 MW.
On August 22, 2013 the Government of Uzbekistan and the Japan International
Cooperation Agency (JICA) signed a loan agreement to grant a yen loan amounting to
34 billion 877 million yen, to cover the total construction cost of 53 billion 195
million yen, for the project to modernize the Navoi Thermal Power Plant. This project
aims to increase the efficiency and reliability of heat and electricity supply, develop
the economy in the long term and reduce the consumption of natural gas, helping reduce
CO2 emissions by introducing combined-cycle power plants (unit 2) to replace
obsolete equipment.
The construction of GTCC 3 at Navoi TPP is included in Appendix No. 3 to
Decree No. UP-4707 of the President of the Republic of Uzbekistan dated March 4,
2015.
Navoi TPP
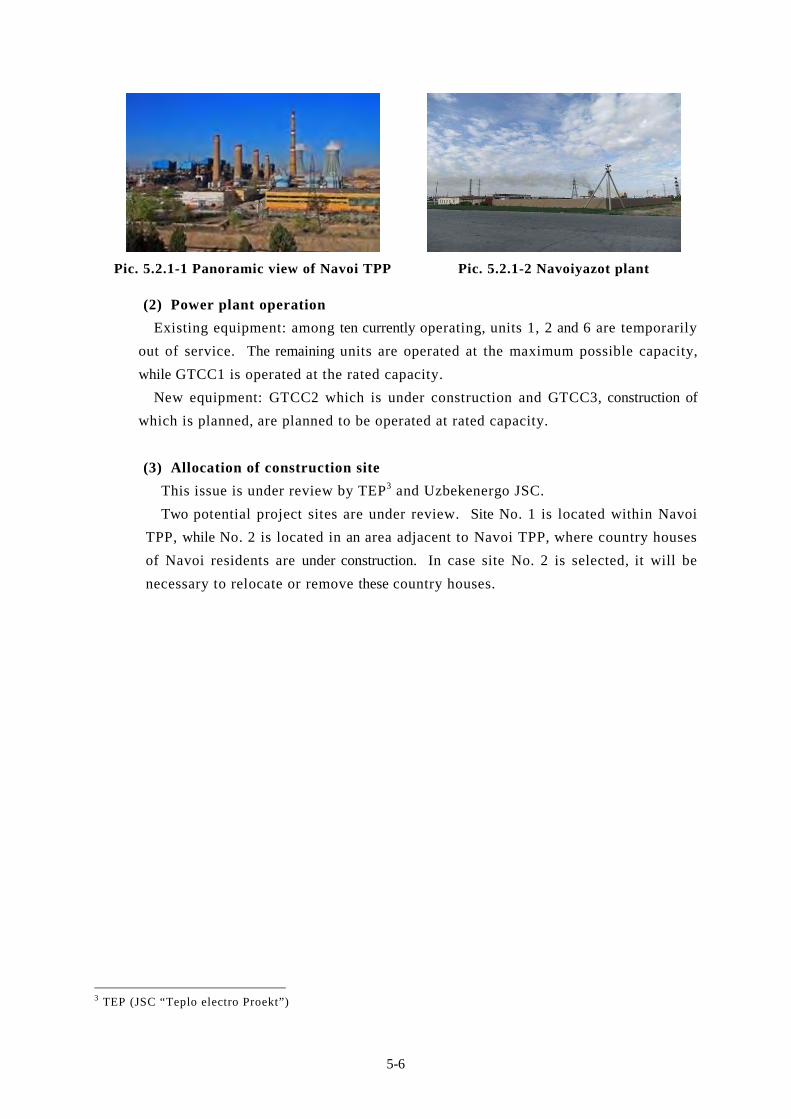
5-6
Pic. 5.2.1-1 Panoramic view of Navoi TPP
Pic. 5.2.1-2 Navoiyazot plant
(2) Power plant operation
Existing equipment: among ten currently operating, units 1, 2 and 6 are temporarily
out of service. The remaining units are operated at the maximum possible capacity,
while GTCC1 is operated at the rated capacity.
New equipment: GTCC2 which is under construction and GTCC3, construction of
which is planned, are planned to be operated at rated capacity.
(3) Allocation of construction site
This issue is under review by TEP3 and Uzbekenergo JSC.
Two potential project sites are under review. Site No. 1 is located within Navoi
TPP, while No. 2 is located in an area adjacent to Navoi TPP, where country houses
of Navoi residents are under construction. In case site No. 2 is selected, it will be
necessary to relocate or remove these country houses.
3 TEP (JSC “Teplo electro Proekt”)
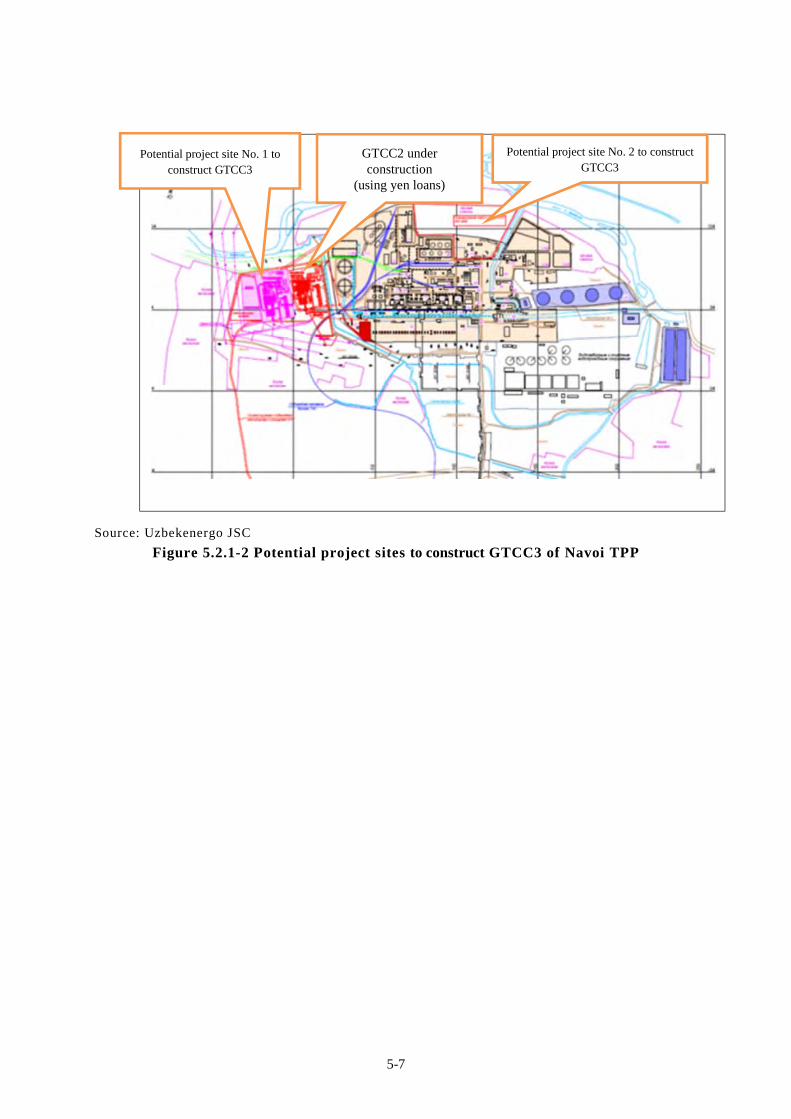
5-7
Source: Uzbekenergo JSC
Figure 5.2.1-2 Potential project sites to construct GTCC3 of Navoi TPP
Potential project site No. 2 to construct GTCC3
Potential project site No. 1 to construct GTCC3
GTCC2 under construction
(using yen loans)
5-8
(4) Fuel supply stability
No problem.
Pipeline: (current situation) 720.8mm diameter, two lines, capacity 400,000m3/h,
(during the construction of GTCC2) there are plans to construct an
additional line with capacity exceeding 50,000 m3/h. On completion to
construct unit No. 2, there are plans to decommission the existing unit 3,
whereupon sufficient supply capacity should be ensured.
(5) Provision of utilities
Feed water intake for boiler and cooling water is carried out from Zarafshan River
flowing near the station and feed water is treated before use. Henceforth, there are
plans to conduct F/S and consider expanding facilities before commissioning unit No.
3.
(6) Problems relating to the grid connection
There are plans to carry out the grid connection by two 220 kV lines and no problem
with transmission capacity. Henceforth, there are plans to conduct F/S and consider
expanding facilities before starting to construct unit No. 3.
(7) Funding for newly constructed equipment
Not determined.
(8) Environmental impact of newly constructed equipment
There is the potential for improvement.
Due to decommissioning of existing unit No. 1, 2 and 6 as well as constructing
GTCC3, specific fuel consumption will be improved by 9.2 % (based on calorific
value), so CO2 emissions will be reduced compared to a conventional gas thermal power
plant of similar capacity.
(9) Potential for resettlement and alienation of agricultural land
This possibility exists.
The project site among two proposed with the most potential is an area where several
country houses of Navoi city residents are under construction. In case the construction
is carried out there, it will be necessary to relocate or remove the country houses.
(10) Problems relating to transportation of the equipment
No particular problem.
There are past records of transportation of GTCC1 of the Navoi TPP, which will
be used as reference to draw up a transportation plan.
5-9
(11) Preparation progress regarding the new construction
The construction of GTCC 3 at Navoi TPP is included in Appendix No. 3 to
Decree No. UP-4707 of the President of the Republic of Uzbekistan, dated March 4,
2015. However, discussion of technical and other issues remains deadlocked at present.
(12) Challenges to power plant construction
As part of preparation to construct GTCC3, a 110 kV switchyard must be constructed.
It will also be necessary to take measures to resettle residents when selecting an area of
country houses (potential project site No. 2) as a construction site.
(13) Necessity for and urgency to construct new equipment
The construction of GTCC3 is necessary to address issues such as ensuring the
implementation of the state policy of the Republic of Uzbekistan on reducing gas
consumption and covering electricity of Uzbekistan. In addition, if constructing new
equipment reduces the use of existing equipment, it will provide an opportunity to
comply with emission standards; compliance with which is becoming difficult task given
the obsolescence of existing equipment.
(14) Evaluation of the construction site
The increased reliability and efficiency of the power supply following the
replacement of obsolete equipment via the scrap-and-build method will allow gas
consumption to be reduced, in line with the state policy of the Republic of Uzbekistan.
Besides, taking into account the fact that existing equipment does not meet emission
standards and is incurring penalties, from the perspective of environmental measures in
the region, new equipment can be constructed.
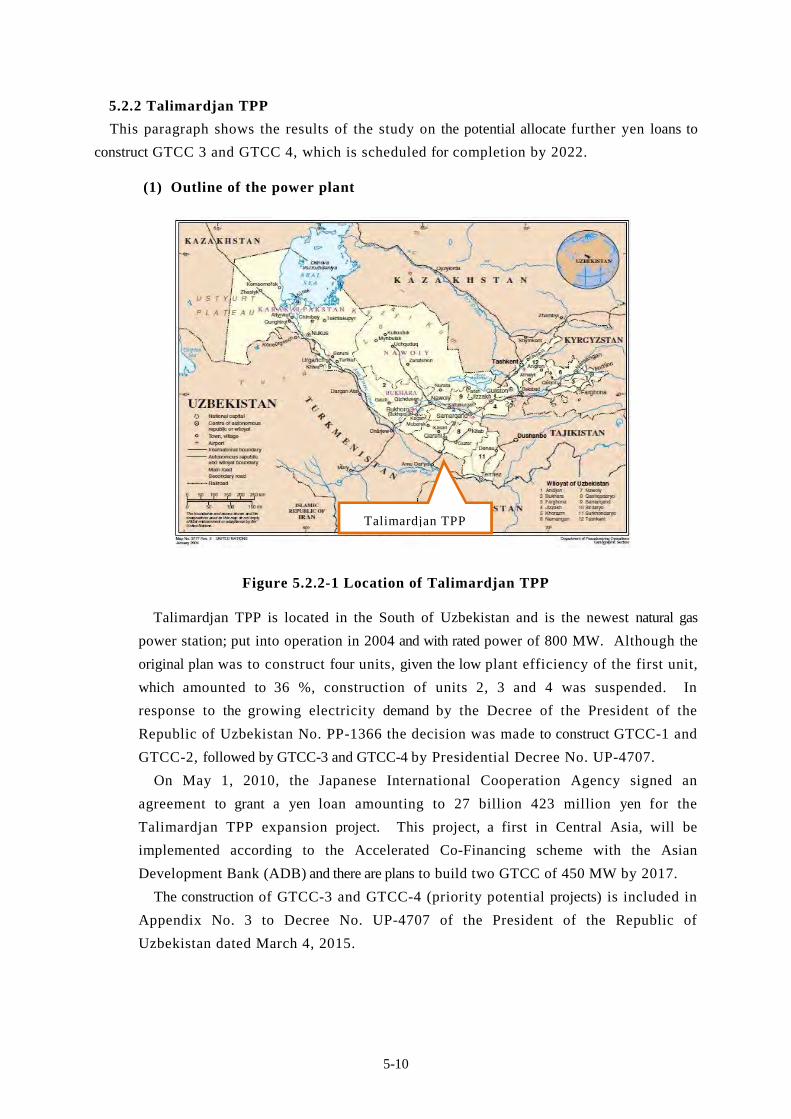
5-10
5.2.2 Talimardjan TPP
This paragraph shows the results of the study on the potential allocate further yen loans to
construct GTCC 3 and GTCC 4, which is scheduled for completion by 2022.
(1) Outline of the power plant
Figure 5.2.2-1 Location of Talimardjan TPP
Talimardjan TPP is located in the South of Uzbekistan and is the newest natural gas
power station; put into operation in 2004 and with rated power of 800 MW. Although the
original plan was to construct four units, given the low plant efficiency of the first unit,
which amounted to 36 %, construction of units 2, 3 and 4 was suspended. In
response to the growing electricity demand by the Decree of the President of the
Republic of Uzbekistan No. PP-1366 the decision was made to construct GTCC-1 and
GTCC-2, followed by GTCC-3 and GTCC-4 by Presidential Decree No. UP-4707.
On May 1, 2010, the Japanese International Cooperation Agency signed an
agreement to grant a yen loan amounting to 27 billion 423 million yen for the
Talimardjan TPP expansion project. This project, a first in Central Asia, will be
implemented according to the Accelerated Co-Financing scheme with the Asian
Development Bank (ADB) and there are plans to build two GTCC of 450 MW by 2017.
The construction of GTCC-3 and GTCC-4 (priority potential projects) is included in
Appendix No. 3 to Decree No. UP-4707 of the President of the Republic of
Uzbekistan dated March 4, 2015.
Talimardjan TPP

5-11
Pic. 5.2.2-1 Panoramic view of Talimardjan TPP
Pic. 5.2.2-2 Central control room of Talimardjan TPP
(2) Power plant operation
Existing equipment: operation at rated capacity is 800 MW, operation as a mid-
load thermal power plant is also possible.
New equipment: there are plans to operate it at rated capacity.
(3) Allocation of construction site
The construction site is determined.
Allocation of Since the construction site is located on the territory of the
Talimardjan TPP, there will not be any resettlement or alienation of agricultural land.
At the front of the following picture, GTCC 1 and 2 are under construction, with
construction of a third unit on the west side.
Pic. 5.2.2-3 Talimardjan TPP, construction site of GTCC 1 and 2 (in the front) and
panned construction site for Unit No. 3
Planned construction site of Unit No.3
5-12
(4) Fuel supply stability
For the new GTCC 1-4, the gas pipeline must be expanded.
Gas supply: gas pipeline, diameter 720 mm, capacity 425,000 m3/h, two lines.
Gas consumption: on the existing equipment it is 195,000 m3/h and on newly
constructed equipment, 85,000 m3/h.
(5) Provision of utilities
Feed water intake for boilers and cooling towers is carried out from the Karshi Canal
and feed water for the boiler is treated before use. From now, there are plans to
conduct F/S and consider expanding facilities.
(6) Problems relating to the grid connection
No particular problem.
There is one 500 kV switchyard (for the new GTCC 1, 2, 3, 4). There are plans to
complete the construction of a 500 kV transmission system with the commissioning of
units 1 and 2 (2017). No problem with transmission capacity.
(7) Funding for newly constructed equipment
Not determined.
(8) Environmental impact of newly constructed equipment
There is the potential for improvement.
Due to the construction of GTCC-3, specific fuel consumption will be improved
by 10 % (based on calorific value), so compared to a conventional gas thermal power
plant of similar capacity, CO2 emissions will be reduced.
(9) Potential for resettlement and alienation of agricultural land
No resettlement.
Construction is planned on the TPP territory.
(10) Problems relating to transportation of equipment
No particular problem.
There are past records of transportation of GTCC-1 and GTCC-2 equipment,
which will be used as benchmarks to draw up a transportation plan.
(11) Preparation progress regarding the new construction
Construction of GTCC-3 is included in Appendix No. 3 to Decree No. UP-4707 of
the President of the Republic of Uzbekistan dated March 4, 2015. However, there is
no current progress in discussing technical and other issues.

5-13
(12) Challenges to power plant construction
Construction of a 500 kV transmission system (under construction) and a gas
pipeline is required.
(13) Need for and urgency to construct new equipment
The third and fourth GTCC must be constructed to address issues such as ensuring
the implementation of the state policy of the Republic of Uzbekistan on reducing gas
consumption and meeting the electricity demand of Uzbekistan. In addition, if
constructing new equipment will help reduce dependence on existing equipment, it will
provide an opportunity to comply with emission standards, which is becoming
increasingly difficult task given the obsolescence of existing equipment.
(14) Evaluation of the construction site
Designed and constructed in the Soviet period, existing equipment lacks
efficiency. Moreover, taking into account the fact that the equipment does not meet
emission standards (NOx) and is operated with payments of penalties, construction
of new equipment is appropriate based on the regional environmental measures.
Constructing new GTCC will also boost plant-wide efficiency and reduce CO2
emissions.
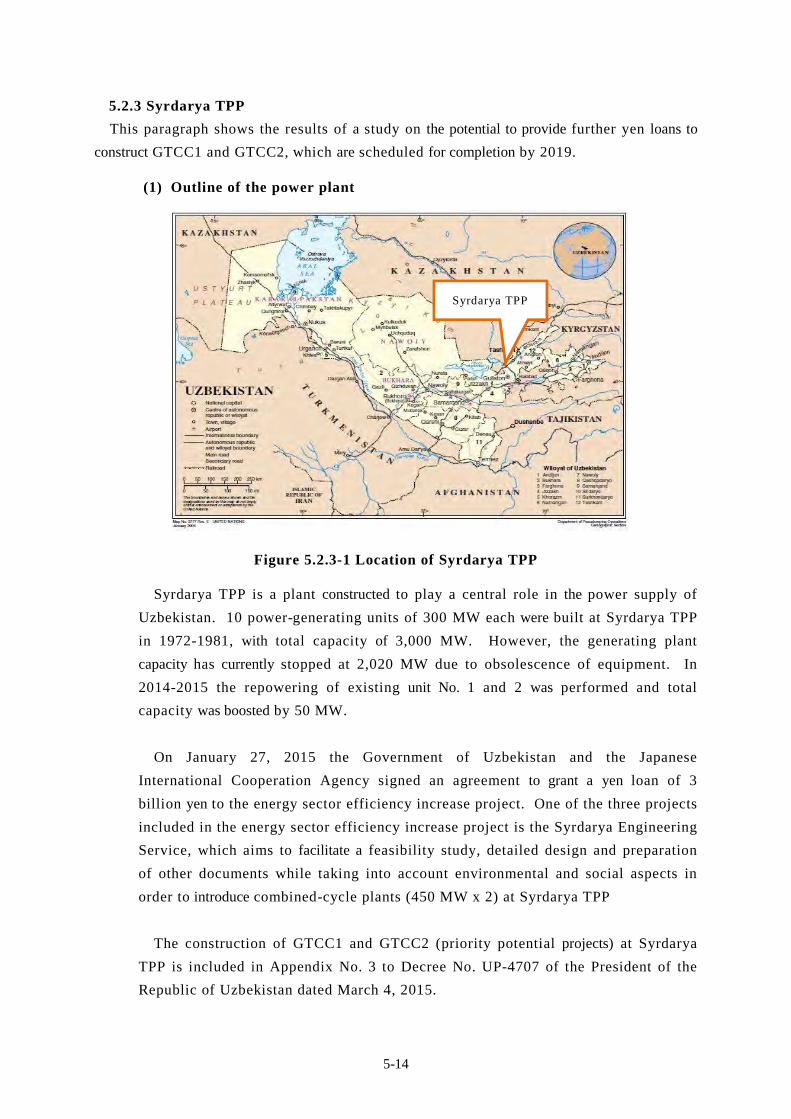
5-14
5.2.3 Syrdarya TPP
This paragraph shows the results of a study on the potential to provide further yen loans to
construct GTCC1 and GTCC2, which are scheduled for completion by 2019.
(1) Outline of the power plant
Figure 5.2.3-1 Location of Syrdarya TPP
Syrdarya TPP is a plant constructed to play a central role in the power supply of
Uzbekistan. 10 power-generating units of 300 MW each were built at Syrdarya TPP
in 1972-1981, with total capacity of 3,000 MW. However, the generating plant
capacity has currently stopped at 2,020 MW due to obsolescence of equipment. In
2014-2015 the repowering of existing unit No. 1 and 2 was performed and total
capacity was boosted by 50 MW.
On January 27, 2015 the Government of Uzbekistan and the Japanese
International Cooperation Agency signed an agreement to grant a yen loan of 3
billion yen to the energy sector efficiency increase project. One of the three projects
included in the energy sector efficiency increase project is the Syrdarya Engineering
Service, which aims to facilitate a feasibility study, detailed design and preparation
of other documents while taking into account environmental and social aspects in
order to introduce combined-cycle plants (450 MW x 2) at Syrdarya TPP
The construction of GTCC1 and GTCC2 (priority potential projects) at Syrdarya
TPP is included in Appendix No. 3 to Decree No. UP-4707 of the President of the
Republic of Uzbekistan dated March 4, 2015.
Syrdarya TPP
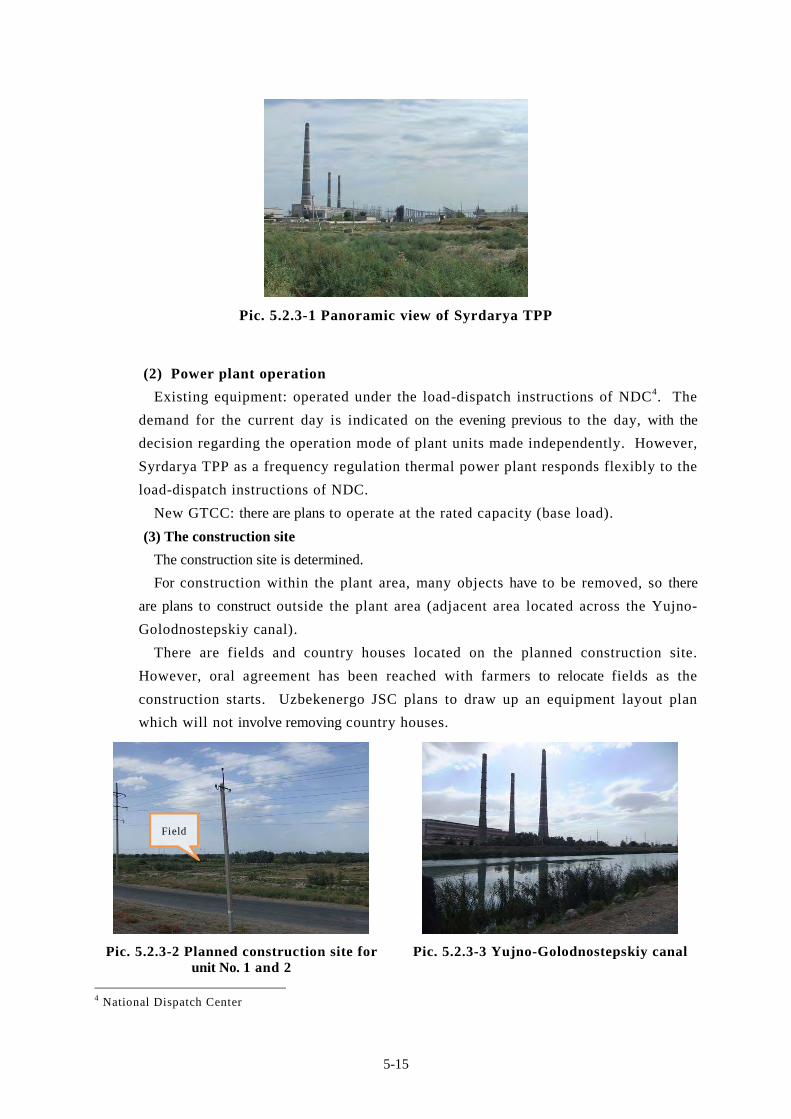
5-15
Pic. 5.2.3-1 Panoramic view of Syrdarya TPP
(2) Power plant operation
Existing equipment: operated under the load-dispatch instructions of NDC4. The
demand for the current day is indicated on the evening previous to the day, with the
decision regarding the operation mode of plant units made independently. However,
Syrdarya TPP as a frequency regulation thermal power plant responds flexibly to the
load-dispatch instructions of NDC.
New GTCC: there are plans to operate at the rated capacity (base load).
(3) The construction site
The construction site is determined.
For construction within the plant area, many objects have to be removed, so there
are plans to construct outside the plant area (adjacent area located across the Yujno-
Golodnostepskiy canal).
There are fields and country houses located on the planned construction site.
However, oral agreement has been reached with farmers to relocate fields as the
construction starts. Uzbekenergo JSC plans to draw up an equipment layout plan
which will not involve removing country houses.
Pic. 5.2.3-2 Planned construction site for unit No. 1 and 2
Pic. 5.2.3-3 Yujno-Golodnostepskiy canal
4 National Dispatch Center
Field

5-16
Source: Uzbekenergo JSC
Figure 5.2.3-2 Layout drawing of unit No. 1 and 2
(4) Fuel supply stability
Construction of a new gas pipeline is required.
Pipeline: 720mm diameter, 2 lines, each with capacity of 500,000m3/h (the gas
pipeline connected to the gas distribution station (GDS) located near
the plant is divided into two lines), incoming pressure of 12kg/cm2
(both new and existing equipment. However, the existing equipment is
operated under pressure reduced to 1.8-2.0 kg/cm2). There are plans to
construct 700mm×2 lines×500,000 m3/h when commissioning the new
GTCC.
Gas consumption: existing 3,000 MW equipment: 700,000 m3/h±5 %, newly
constructed GTCC: 75,000 m3/h, 2 units.
(5) Provision of utilities
There is no problem with the volume and quality of water.
Feed water for the boiler and cooling tower is supplied from the Yujno-
Golodnostepskiy canal and feed water for the boiler is treated before use. Henceforth,
there are plans to conduct F/S and consider the expansion of facilities before
commissioning unit No. 1 and 2.
Planned construction site
for units No.1 and No.2
Existing equipment
Yujno-Golodnostepskiy
canal
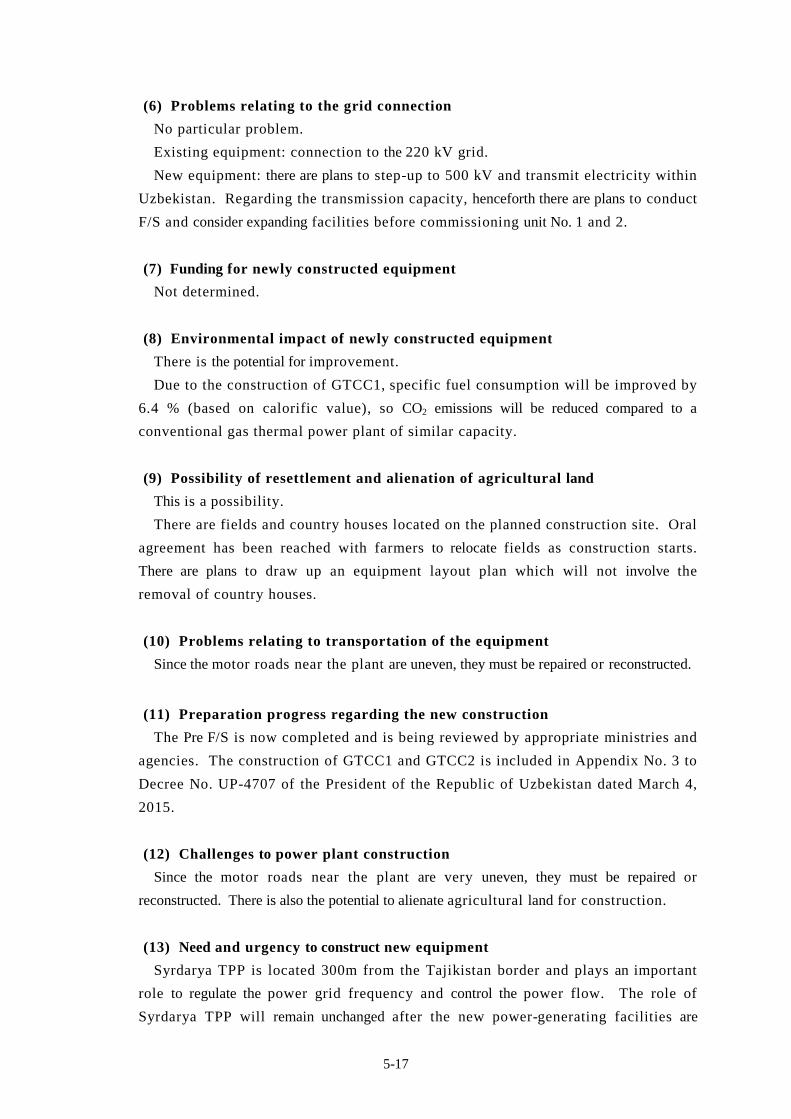
5-17
(6) Problems relating to the grid connection
No particular problem.
Existing equipment: connection to the 220 kV grid.
New equipment: there are plans to step-up to 500 kV and transmit electricity within
Uzbekistan. Regarding the transmission capacity, henceforth there are plans to conduct
F/S and consider expanding facilities before commissioning unit No. 1 and 2.
(7) Funding for newly constructed equipment
Not determined.
(8) Environmental impact of newly constructed equipment
There is the potential for improvement.
Due to the construction of GTCC1, specific fuel consumption will be improved by
6.4 % (based on calorific value), so CO2 emissions will be reduced compared to a
conventional gas thermal power plant of similar capacity.
(9) Possibility of resettlement and alienation of agricultural land
This is a possibility.
There are fields and country houses located on the planned construction site. Oral
agreement has been reached with farmers to relocate fields as construction starts.
There are plans to draw up an equipment layout plan which will not involve the
removal of country houses.
(10) Problems relating to transportation of the equipment
Since the motor roads near the plant are uneven, they must be repaired or reconstructed.
(11) Preparation progress regarding the new construction
The Pre F/S is now completed and is being reviewed by appropriate ministries and
agencies. The construction of GTCC1 and GTCC2 is included in Appendix No. 3 to
Decree No. UP-4707 of the President of the Republic of Uzbekistan dated March 4,
2015.
(12) Challenges to power plant construction
Since the motor roads near the plant are very uneven, they must be repaired or
reconstructed. There is also the potential to alienate agricultural land for construction.
(13) Need and urgency to construct new equipment
Syrdarya TPP is located 300m from the Tajikistan border and plays an important
role to regulate the power grid frequency and control the power flow. The role of
Syrdarya TPP will remain unchanged after the new power-generating facilities are

5-18
constructed, so the construction of the new GTCC is reasonable, given the need to
ensure sufficient capacity to regulate the power grid frequency and reliably meet the
electricity demand of Uzbekistan. In addition, obsolescence of existing equipment is
hindering efforts to comply with emission standards, which underlines the urgent need to
construct new equipment.
(14) Evaluation of the construction site
Syrdarya TPP is located only 180 km from Tashkent, which is a large-scale
electricity consumer, located in the center of Uzbekistan and with a number of
advantages from the perspective of power grid operation, making Syrdarya TPP an
appropriate plant for use as a base power supply facility. Taking into account the
further increase in electricity demand, the development of power-generating
facilities should be prioritized. The construction of the new GTCC will boost plant-wide
efficiency and thus reduce CO2 emissions, while in the short term, a contribution to the
economic development of Shirin city with the inflow of construction workers is also
expected.
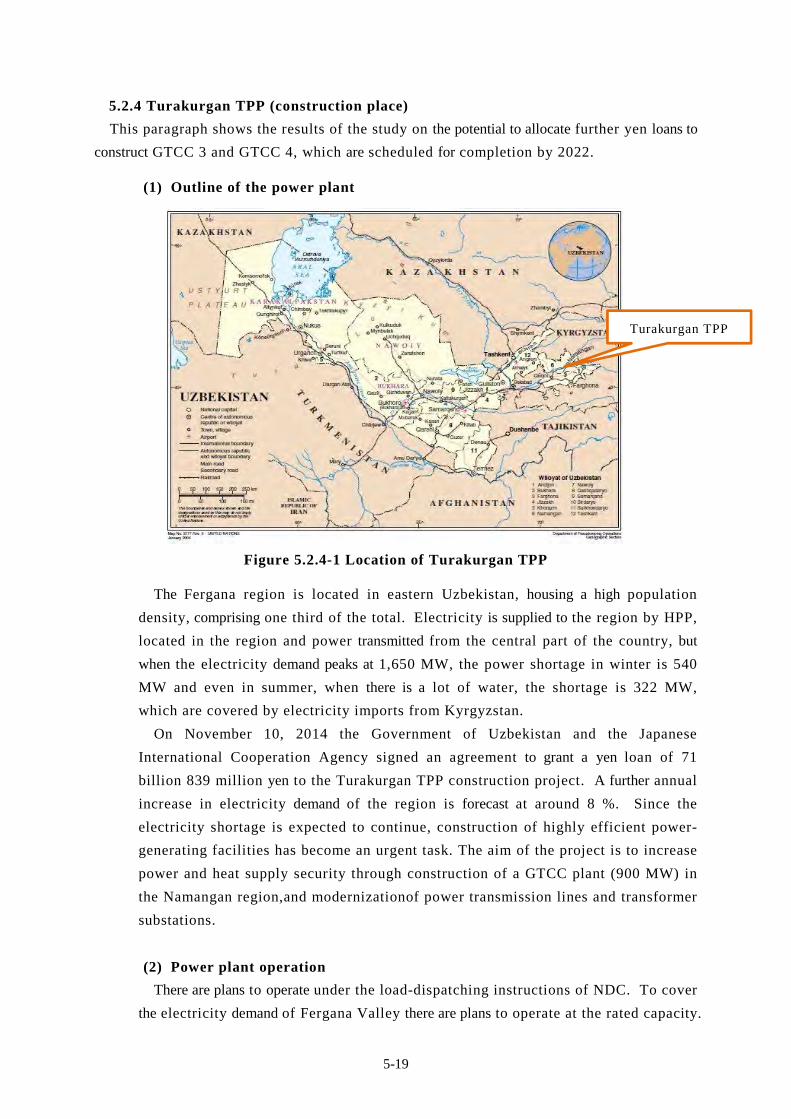
5-19
5.2.4 Turakurgan TPP (construction place)
This paragraph shows the results of the study on the potential to allocate further yen loans to
construct GTCC 3 and GTCC 4, which are scheduled for completion by 2022.
(1) Outline of the power plant
Figure 5.2.4-1 Location of Turakurgan TPP
The Fergana region is located in eastern Uzbekistan, housing a high population
density, comprising one third of the total. Electricity is supplied to the region by HPP,
located in the region and power transmitted from the central part of the country, but
when the electricity demand peaks at 1,650 MW, the power shortage in winter is 540
MW and even in summer, when there is a lot of water, the shortage is 322 MW,
which are covered by electricity imports from Kyrgyzstan.
On November 10, 2014 the Government of Uzbekistan and the Japanese
International Cooperation Agency signed an agreement to grant a yen loan of 71
billion 839 million yen to the Turakurgan TPP construction project. A further annual
increase in electricity demand of the region is forecast at around 8 %. Since the
electricity shortage is expected to continue, construction of highly efficient power-
generating facilities has become an urgent task. The aim of the project is to increase
power and heat supply security through construction of a GTCC plant (900 MW) in
the Namangan region,and modernizationof power transmission lines and transformer
substations.
(2) Power plant operation
There are plans to operate under the load-dispatching instructions of NDC. To cover
the electricity demand of Fergana Valley there are plans to operate at the rated capacity.
Turakurgan TPP
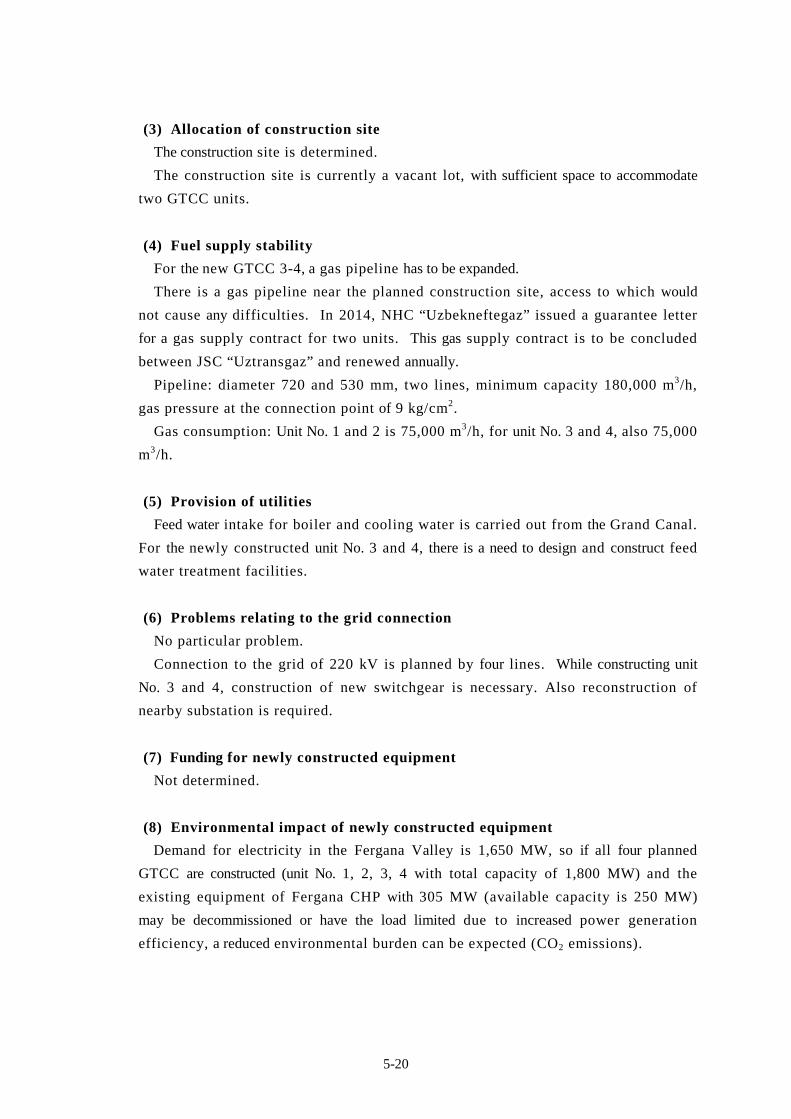
5-20
(3) Allocation of construction site
The construction site is determined.
The construction site is currently a vacant lot, with sufficient space to accommodate
two GTCC units.
(4) Fuel supply stability
For the new GTCC 3-4, a gas pipeline has to be expanded.
There is a gas pipeline near the planned construction site, access to which would
not cause any difficulties. In 2014, NHC “Uzbekneftegaz” issued a guarantee letter
for a gas supply contract for two units. This gas supply contract is to be concluded
between JSC “Uztransgaz” and renewed annually.
Pipeline: diameter 720 and 530 mm, two lines, minimum capacity 180,000 m3/h,
gas pressure at the connection point of 9 kg/cm2.
Gas consumption: Unit No. 1 and 2 is 75,000 m3/h, for unit No. 3 and 4, also 75,000
m3/h.
(5) Provision of utilities
Feed water intake for boiler and cooling water is carried out from the Grand Canal.
For the newly constructed unit No. 3 and 4, there is a need to design and construct feed
water treatment facilities.
(6) Problems relating to the grid connection
No particular problem.
Connection to the grid of 220 kV is planned by four lines. While constructing unit
No. 3 and 4, construction of new switchgear is necessary. Also reconstruction of
nearby substation is required.
(7) Funding for newly constructed equipment
Not determined.
(8) Environmental impact of newly constructed equipment
Demand for electricity in the Fergana Valley is 1,650 MW, so if all four planned
GTCC are constructed (unit No. 1, 2, 3, 4 with total capacity of 1,800 MW) and the
existing equipment of Fergana CHP with 305 MW (available capacity is 250 MW)
may be decommissioned or have the load limited due to increased power generation
efficiency, a reduced environmental burden can be expected (CO2 emissions).

5-21
(9) Possibility of resettlement and alienation of agricultural land
Since the construction site is a vacant lot, there is no resettlement or alienation of
agricultural land involved.
(10) Problems relating to transportation of the equipment
There are previous records for transportation of GTCC-1 and GTCC-2 equipment,
which will be used as a reference to draw up a transportation plan for GTCC-3 and
GTCC-4.
Access roads are currently under construction.
(11) Preparation progress regarding the new construction
The construction of the third and fourth units is planned taking future demand
trends into account, but no decision on construction has currently been accepted and
there has not been any progress in discussing technical issues, such as the drawing up
of Pre F/S.
Since the planning of units 1 and 2 excludes the construction of units 3 and 4, in
Uzbekenergo JSC, there are plans for reconsideration, provision of water and fuel and
expansion of switchgear.
(12) Challenges to power plant construction
Since the planning of units 1 and 2 excludes the construction of units 3 and 4,
there is a need to design and construct power transmission facilities, a fuel supply
facility and utility networks.
(13) Need and urgency to construct new equipment
The electricity demand in Fergana Valley is 1,650 MW, even if 900 MW from the
two GTCC of Turakurgan TPP is added to the capacity of the existing Fergana CHP
equipment, which is 305 MW (available capacity of 250 MW) plus a new GTCC of
57.7 MW (planned), it will not cover all the electricity demand, nor solve the issue
regarding the transfer of power at a considerable distance from western Uzbekistan. In
this regard, it becomes necessary to build a third GTCC unit (450 MW). Taking into
account the supply and demand balance at the time of construction, there is a need to
construct the fourth GTCC unit.
(14) Others
To construct GTCC-1 and GTCC-2, there are plans to attract yen loans of 71 billion
800 million yen.
As for unit No. 1 and 2, SV consultants of the project are currently making the
tender documents, scheduled for completion in mid-year.

5-22
(15) Evaluation of the construction site
The electricity demand in Fergana Valley is 1,650 MW, even if 900 MW from two GTCC of
Turakurgan TPP is added to the capacity of existing equipment of Fergana CHP, which is 305
MW (available capacity is 250 MW) plus a new GTCC of 57.7 MW (planned), it will not meet
all electricity demand nor solve the issue involving the transfer of power at distance from
western Uzbekistan. In this regard, a third GTCC unit will have to be constructed (450 MW).
Furthermore, regarding the construction of the fourth unit, it is advisable to determine the time
of construction, taking into account the demand-and-supply balance of electric power in
Uzbekistan.
5.2.5 Tashkent TPP
This paragraph shows the results of the study on the potential for further yen loans to
construct GTCC2,450 MW which is scheduled for completion by 2024.
(1) Outline of the power plant
Figure 5.2.5-1 Location of Tashkent TPP
Tashkent TPP is an obsolete thermal power plant built in 1963-1971 to supply to
Tashkent city with a view to interconnecting Kazakhstan, Kyrgyzstan, Tajikistan,
Turkmenistan. At that time Tashkent TPP was the largest power plant in Central
Asia.
There are 12 power-generating units, but only ten are currently operational and the
total capacity is 1,860 MW. Due to the obsolescence limiting the available capacity
to 1,665 MW, the plant efficiency is 30.3 %. Currently the 370 MW GTCC (GE
main equipment) is under construction, with commissioning planned for 2016.
Tashkent TPP
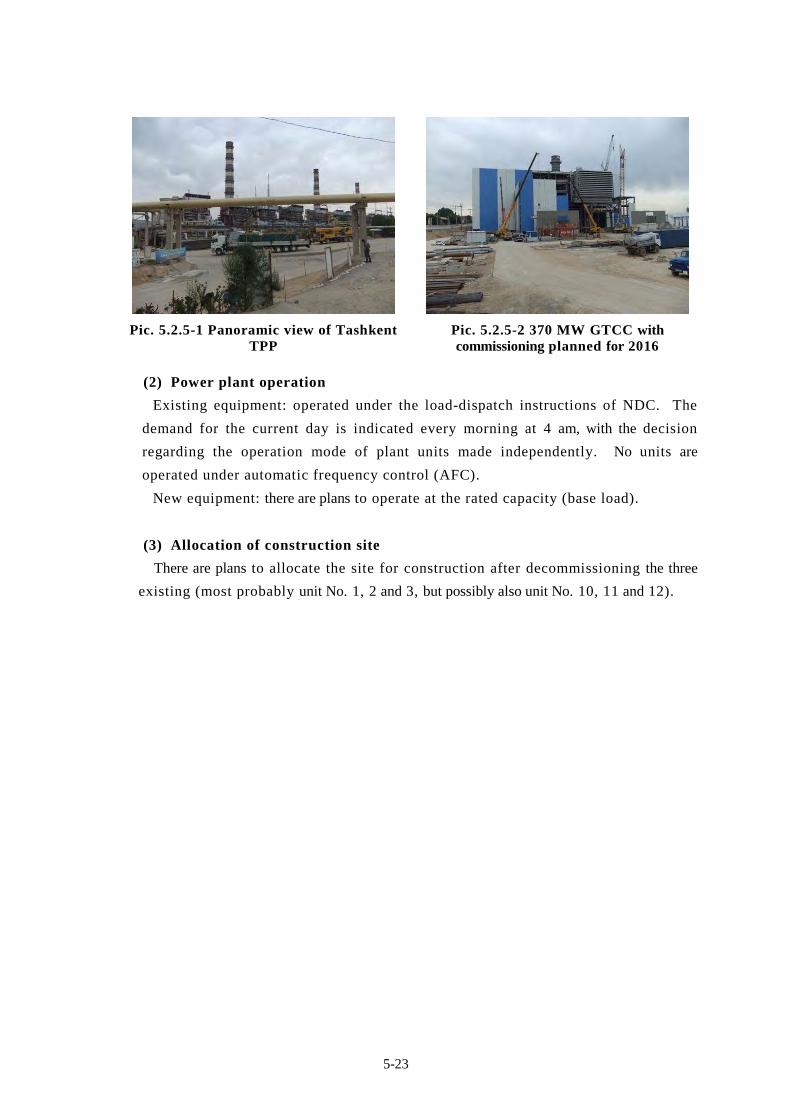
5-23
Pic. 5.2.5-1 Panoramic view of Tashkent TPP
Pic. 5.2.5-2 370 MW GTCC with commissioning planned for 2016
(2) Power plant operation
Existing equipment: operated under the load-dispatch instructions of NDC. The
demand for the current day is indicated every morning at 4 am, with the decision
regarding the operation mode of plant units made independently. No units are
operated under automatic frequency control (AFC).
New equipment: there are plans to operate at the rated capacity (base load).
(3) Allocation of construction site
There are plans to allocate the site for construction after decommissioning the three
existing (most probably unit No. 1, 2 and 3, but possibly also unit No. 10, 11 and 12).
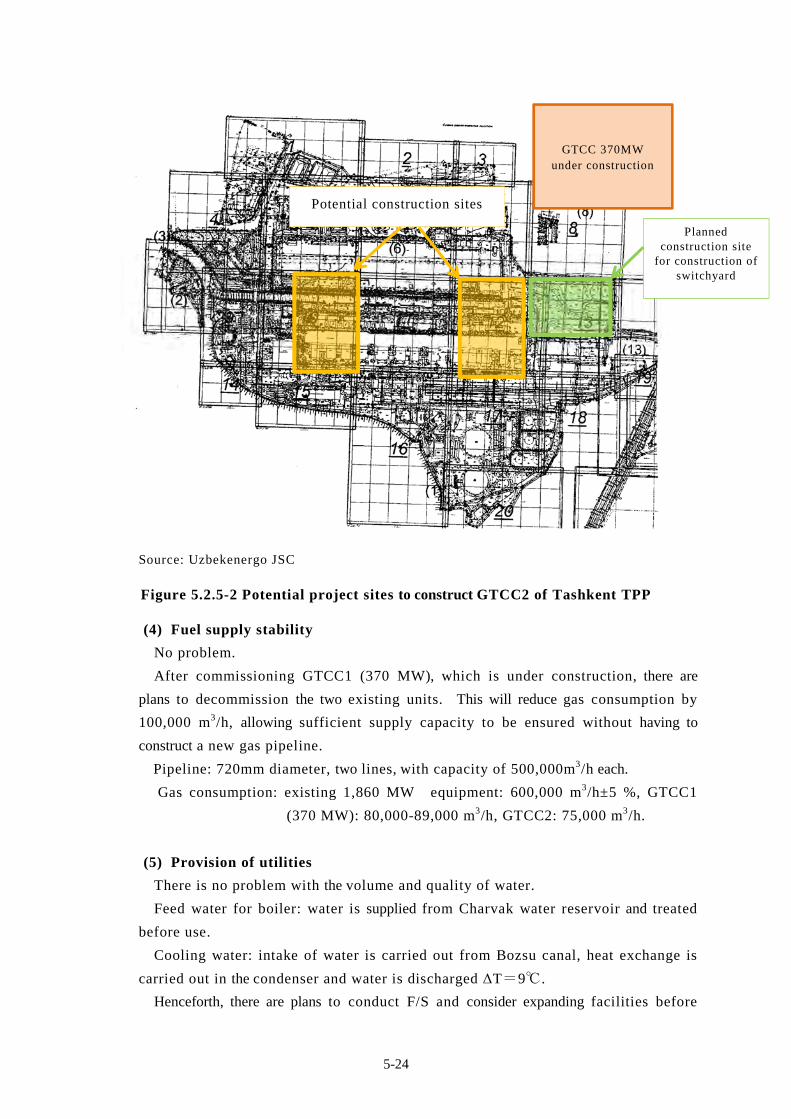
5-24
Source: Uzbekenergo JSC
Figure 5.2.5-2 Potential project sites to construct GTCC2 of Tashkent TPP
(4) Fuel supply stability
No problem.
After commissioning GTCC1 (370 MW), which is under construction, there are
plans to decommission the two existing units. This will reduce gas consumption by
100,000 m3/h, allowing sufficient supply capacity to be ensured without having to
construct a new gas pipeline.
Pipeline: 720mm diameter, two lines, with capacity of 500,000m3/h each.
Gas consumption: existing 1,860 MW equipment: 600,000 m3/h±5 %, GTCC1
(370 MW): 80,000-89,000 m3/h, GTCC2: 75,000 m3/h.
(5) Provision of utilities
There is no problem with the volume and quality of water.
Feed water for boiler: water is supplied from Charvak water reservoir and treated
before use.
Cooling water: intake of water is carried out from Bozsu canal, heat exchange is
carried out in the condenser and water is discharged ΔT=9℃.
Henceforth, there are plans to conduct F/S and consider expanding facilities before
Potential construction sites
Planned construction site
for construction of switchyard
GTCC 370MW under construction

5-25
starting to construct GTCC2.
(6) Problems relating to the grid connection
No particular problem.
Connection to the existing 220 kV grid. Along with the GTCC1 (370 MW)
commissioning, two existing units will be decommissioned, followed by a further three
units (about 450 MW), so there will be no problem with transmission capacity.
(7) Funding for newly constructed equipment
Not determined.
(8) Environmental impact of newly constructed equipment
There is the potential for improvement.
Due to the construction of GTCC2, specific fuel consumption will be improved by
8.9 % (based on calorific value), so CO2 emissions will be reduced compared to a
conventional gas thermal power plant of similar capacity.
(9) Possibility of resettlement and alienation of agricultural land
Possibility of resettlement and alienation of agricultural There is no such possibility.
There are plans to allocate the site for construction after decommissioning existing
units
(10) Problems relating to transportation of the equipment
No particular problem.
There are plans to draw up a transportation plan using past transportation records of
370 MW GTCC (GE main equipment) as reference.
(11) Preparation progress regarding the new construction
Currently there is no progress in the discussion of technical and other issues.
(12) Challenges to power plant construction
There are no particular challenges.
(13) Need and urgency to construct new equipment
New equipment needs to be constructed to increase the reliability of the power supply
and reducing gas consumption by replacing obsolete equipment using the scrap-and-
build method, to meet the electricity demand of Uzbekistan and reduce transmission
loss during the local production of electricity for local consumption.

5-26
(14) Evaluation of the construction site
Tashkent TPP is located in Tashkent city, which is a large-scale electricity
consumer and supplies electricity to the Tashkent region and Fergana Valley, ranking
third in Uzbekistan in terms of total capacity. However, the progressive obsolescence
of every unit built in 1960-1970 means Tashkent TPP ranks second in Uzbekistan
among the least efficient power plants. The increased reliability and efficiency of the
power supply due to replacing obsolete equipment using the scrap-and-build method
will allow gas consumption to be reduced, so the construction of the new GTCC
complies with the state policy of the Republic of Uzbekistan. Besides, taking into
account the fact that existing equipment does not meet emission standards and is
incurring penalties, from the perspective of regional environmental measures, it is
appropriate to construct new equipment.
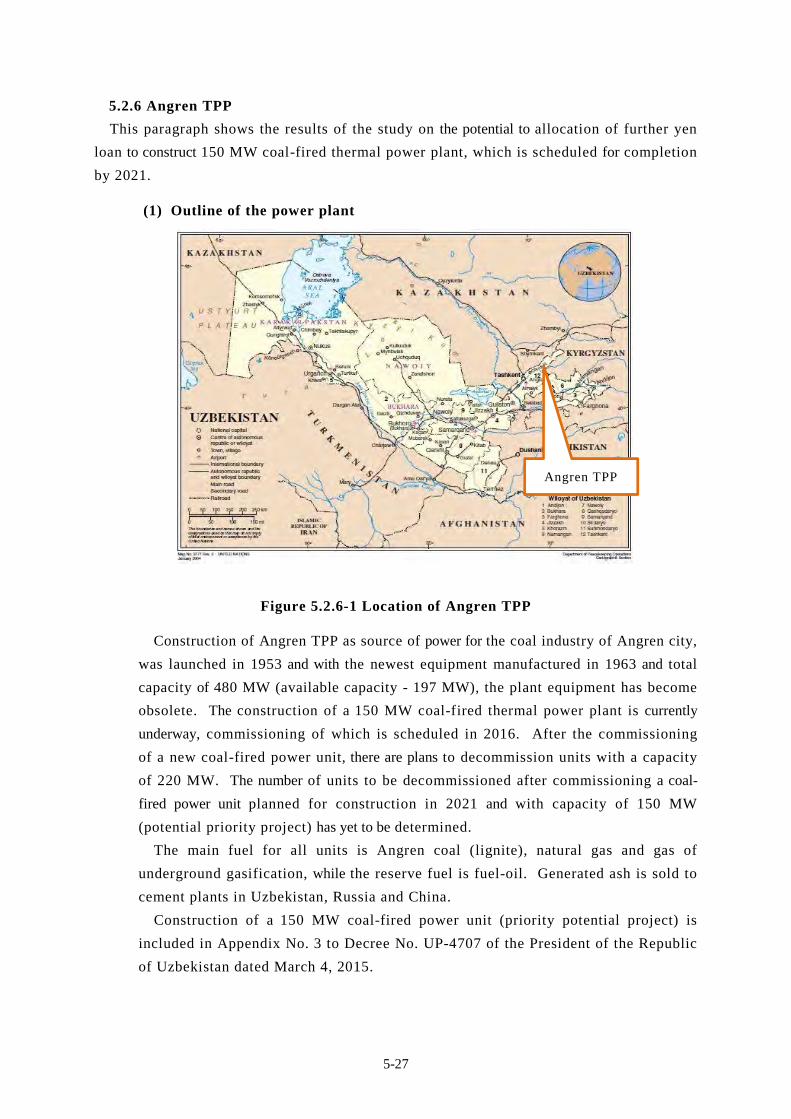
5-27
5.2.6 Angren TPP
This paragraph shows the results of the study on the potential to allocation of further yen
loan to construct 150 MW coal-fired thermal power plant, which is scheduled for completion
by 2021.
(1) Outline of the power plant
Figure 5.2.6-1 Location of Angren TPP
Construction of Angren TPP as source of power for the coal industry of Angren city,
was launched in 1953 and with the newest equipment manufactured in 1963 and total
capacity of 480 MW (available capacity - 197 MW), the plant equipment has become
obsolete. The construction of a 150 MW coal-fired thermal power plant is currently
underway, commissioning of which is scheduled in 2016. After the commissioning
of a new coal-fired power unit, there are plans to decommission units with a capacity
of 220 MW. The number of units to be decommissioned after commissioning a coal-
fired power unit planned for construction in 2021 and with capacity of 150 MW
(potential priority project) has yet to be determined.
The main fuel for all units is Angren coal (lignite), natural gas and gas of
underground gasification, while the reserve fuel is fuel-oil. Generated ash is sold to
cement plants in Uzbekistan, Russia and China.
Construction of a 150 MW coal-fired power unit (priority potential project) is
included in Appendix No. 3 to Decree No. UP-4707 of the President of the Republic
of Uzbekistan dated March 4, 2015.
Angren TPP
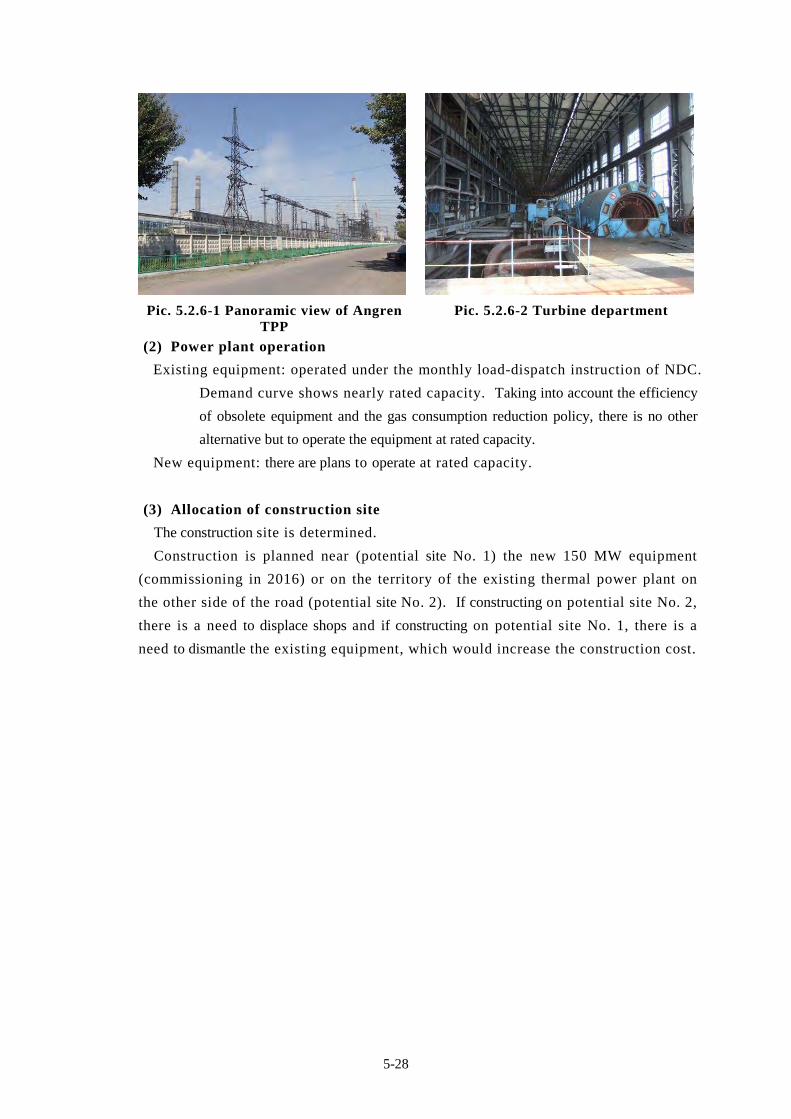
5-28
Pic. 5.2.6-1 Panoramic view of Angren TPP
Pic. 5.2.6-2 Turbine department
(2) Power plant operation
Existing equipment: operated under the monthly load-dispatch instruction of NDC.
Demand curve shows nearly rated capacity. Taking into account the efficiency
of obsolete equipment and the gas consumption reduction policy, there is no other
alternative but to operate the equipment at rated capacity.
New equipment: there are plans to operate at rated capacity.
(3) Allocation of construction site
The construction site is determined.
Construction is planned near (potential site No. 1) the new 150 MW equipment
(commissioning in 2016) or on the territory of the existing thermal power plant on
the other side of the road (potential site No. 2). If constructing on potential site No. 2,
there is a need to displace shops and if constructing on potential site No. 1, there is a
need to dismantle the existing equipment, which would increase the construction cost.
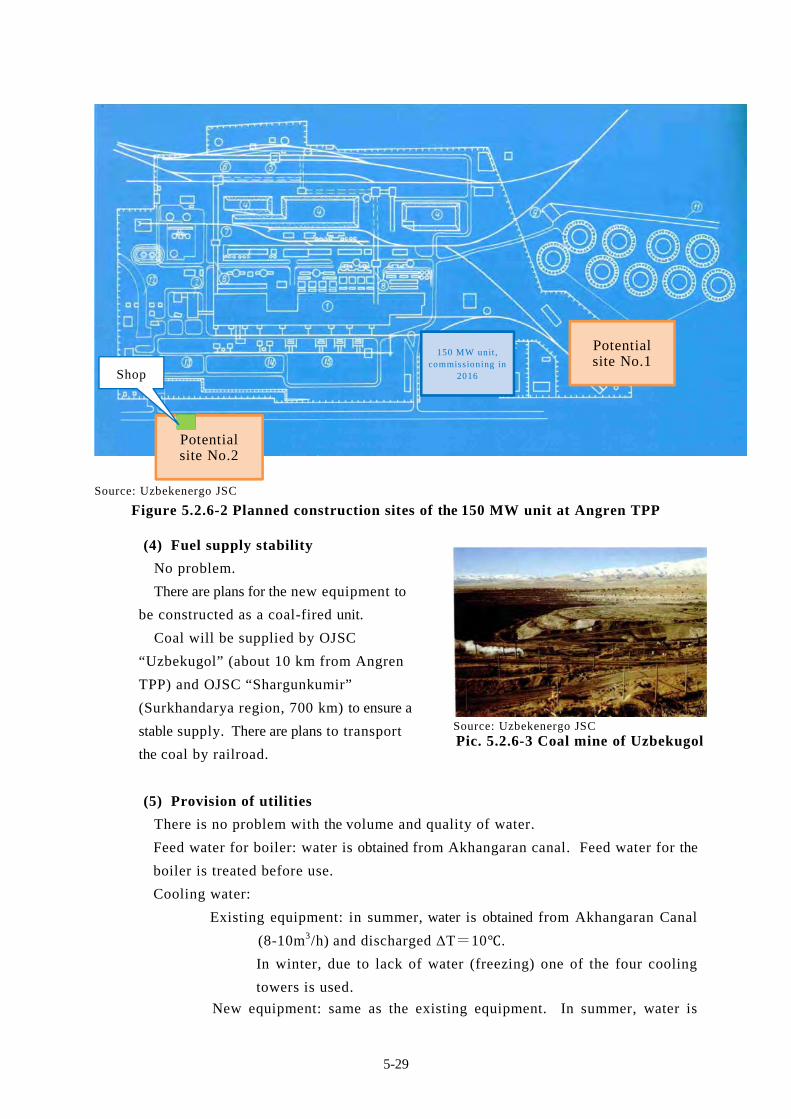
5-29
Source: Uzbekenergo JSC
Figure 5.2.6-2 Planned construction sites of the 150 MW unit at Angren TPP
(4) Fuel supply stability
No problem.
There are plans for the new equipment to
be constructed as a coal-fired unit.
Coal will be supplied by OJSC
“Uzbekugol” (about 10 km from Angren
TPP) and OJSC “Shargunkumir”
(Surkhandarya region, 700 km) to ensure a
stable supply. There are plans to transport
the coal by railroad.
(5) Provision of utilities
There is no problem with the volume and quality of water.
Feed water for boiler: water is obtained from Akhangaran canal. Feed water for the
boiler is treated before use.
Cooling water:
Existing equipment: in summer, water is obtained from Akhangaran Canal
(8-10m3/h) and discharged ΔT=10 .
In winter, due to lack of water (freezing) one of the four cooling
towers is used.
New equipment: same as the existing equipment. In summer, water is
150 MW unit , commissioning in
2016
Potential site No.1
Potential site No.2
Shop
Source: Uzbekenergo JSC
Pic. 5.2.6-3 Coal mine of Uzbekugol
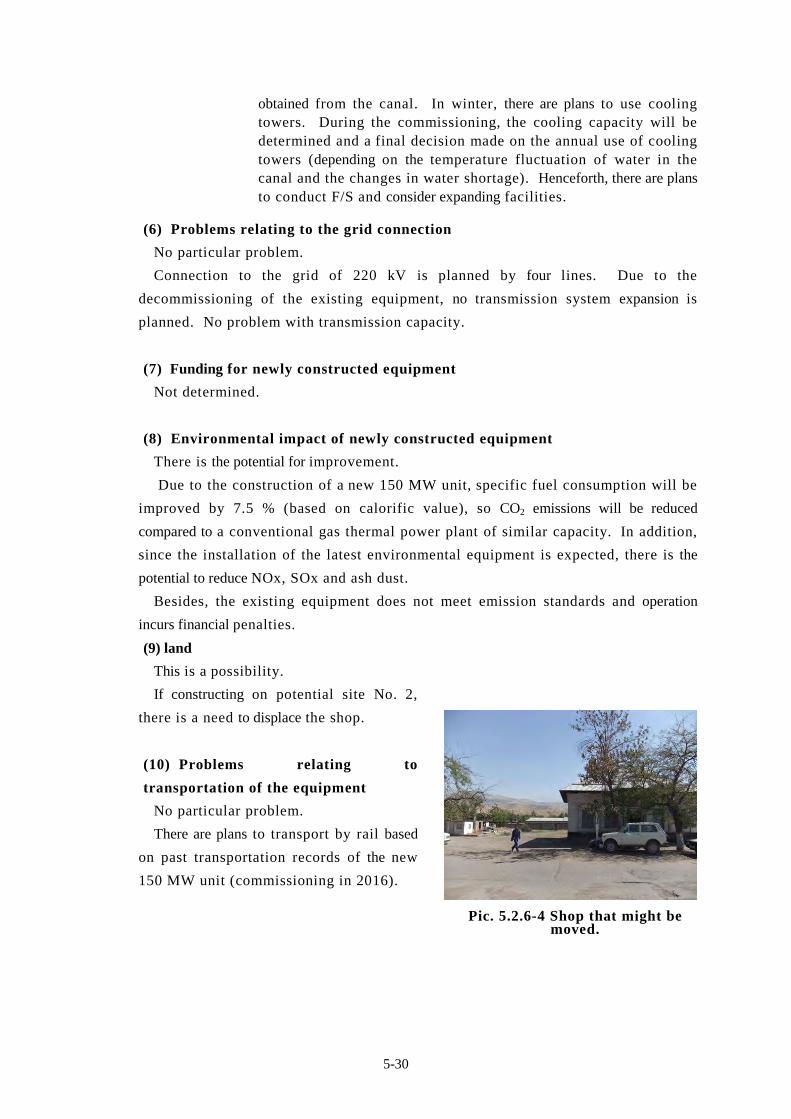
5-30
obtained from the canal. In winter, there are plans to use cooling towers. During the commissioning, the cooling capacity will be determined and a final decision made on the annual use of cooling towers (depending on the temperature fluctuation of water in the canal and the changes in water shortage). Henceforth, there are plans to conduct F/S and consider expanding facilities.
(6) Problems relating to the grid connection
No particular problem.
Connection to the grid of 220 kV is planned by four lines. Due to the
decommissioning of the existing equipment, no transmission system expansion is
planned. No problem with transmission capacity.
(7) Funding for newly constructed equipment
Not determined.
(8) Environmental impact of newly constructed equipment
There is the potential for improvement.
Due to the construction of a new 150 MW unit, specific fuel consumption will be
improved by 7.5 % (based on calorific value), so CO2 emissions will be reduced
compared to a conventional gas thermal power plant of similar capacity. In addition,
since the installation of the latest environmental equipment is expected, there is the
potential to reduce NOx, SOx and ash dust.
Besides, the existing equipment does not meet emission standards and operation
incurs financial penalties.
(9) land
This is a possibility.
If constructing on potential site No. 2,
there is a need to displace the shop.
(10) Problems relating to
transportation of the equipment
No particular problem.
There are plans to transport by rail based
on past transportation records of the new
150 MW unit (commissioning in 2016).
Pic. 5.2.6-4 Shop that might be moved.

5-31
(11) Preparation progress regarding the new construction
Currently, technical documentation is being developed, No pre F/S is carried out.
Construction of a 130-150 MW coal-fired power unit is included in Appendix No.
3 to Decree No. UP-4707 of the President of the Republic of Uzbekistan dated
March 4, 2015.
(12) Challenges to power plant construction
If constructing on potential site No. 2, there is a need to displace the shop.
(13) Need and urgency to construct new equipment
Existing equipment is significantly obsolete. New equipment needs to be
constructed to improve power supply reliability and boost electricity using coal, as well
as reducing gas consumption, which is part of the state policy of the Republic of
Uzbekistan. This is also to ensure a stable power supply to Almalyk industrial zone.
(14) Evaluation of the construction site
The increased reliability and efficiency of the power supply by replacing obsolete
equipment constructed in the 1950s-1960s, using the scrap-and-build method will
allow coal consumption to be reduced. Construction of the new equipment will
increase the consumption of local coal and reduce gas consumption, which complies
with the state policy of the Republic of Uzbekistan. Besides, taking into account
the fact that the equipment does not meet emission standards and operation incurs
financial penalties, from the perspective of regional environmental measures, the
construction of new equipment is appropriate. Regarding the new equipment, it is
recommended to construct a highly efficient coal-fired power unit with the latest
environmental technology of Japan, to ease the burden on the environment.

5-32
5.2.7 Novo-Angren TPP
This paragraph shows the results of the study on the potential for further yen loans to
construct a 300 MW coal-fired power-generating unit which is scheduled for completion by
2024.
(1) Outline of the power plant
Figure 5.2.7-1 Location of Novo-Angren TPP
Novo-Angren TPP is a relatively new plant built in 1985-1995 to supply
electricity to Angren city, Akhangaran region, Almalyk industrial zone. The plant is
adjacent to Tashkent region and Fergana Valley and thus plays an important role as a
central power-generating facility in Uzbekistan. There are seven units, each with 300
MW. The total capacity is 2,100 MW, which means it ranks second among the power
plants of Uzbekistan. However, the current available capacity is 1,320 MW, which
is extremely low.
The main fuel for unit No. 1-5 is Angren coal (brown coal) and natural gas from
Bukhara deposit, for units 6 and 7, the main fuel is natural gas of the Bukhara deposit.
The reserve fuel for all units is fuel-oil. Also, in future, there are plans to transfer unit
No. 6 and 7 to the burning of coal.
The generated coal ash is sold to cement plants in Uzbekistan, Russia and China.
Novo-Angren TPP
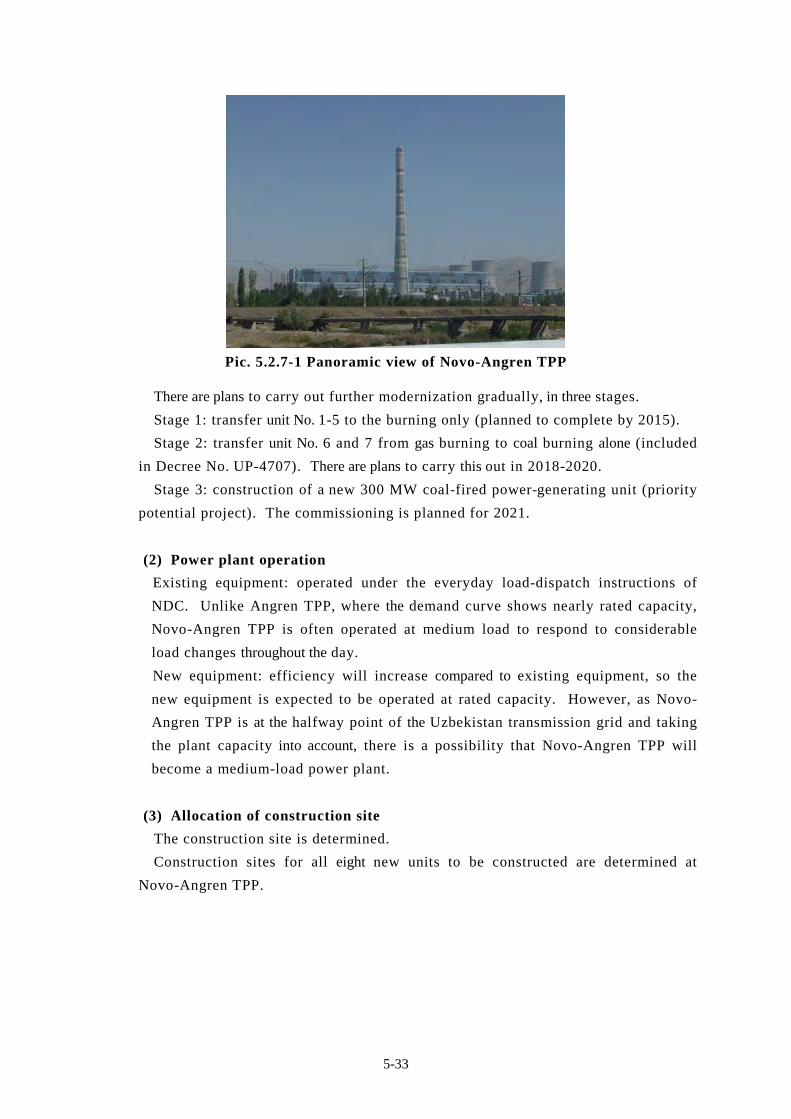
5-33
Pic. 5.2.7-1 Panoramic view of Novo-Angren TPP
There are plans to carry out further modernization gradually, in three stages.
Stage 1: transfer unit No. 1-5 to the burning only (planned to complete by 2015).
Stage 2: transfer unit No. 6 and 7 from gas burning to coal burning alone (included
in Decree No. UP-4707). There are plans to carry this out in 2018-2020.
Stage 3: construction of a new 300 MW coal-fired power-generating unit (priority
potential project). The commissioning is planned for 2021.
(2) Power plant operation
Existing equipment: operated under the everyday load-dispatch instructions of
NDC. Unlike Angren TPP, where the demand curve shows nearly rated capacity,
Novo-Angren TPP is often operated at medium load to respond to considerable
load changes throughout the day.
New equipment: efficiency will increase compared to existing equipment, so the
new equipment is expected to be operated at rated capacity. However, as Novo-
Angren TPP is at the halfway point of the Uzbekistan transmission grid and taking
the plant capacity into account, there is a possibility that Novo-Angren TPP will
become a medium-load power plant.
(3) Allocation of construction site
The construction site is determined.
Construction sites for all eight new units to be constructed are determined at
Novo-Angren TPP.

5-34
Source: Uzbekenergo JSC
Figure 5.2.7-2 Planned construction site for unit No.8 of Novo-Angren TPP
(4) Fuel supply stability
No problem.
There are plans for new equipment to be constructed as coal-fired equipment.
Coal will be supplied by OJSC “Uzbekugol” (about 10 km from Angren TPP) and
OJSC “Shargunkumir” (Surkhandarya region, 700 km) to ensure a stable supply. There
are plans to transport the coal by railroad.
(5) Provision of utilities
There is no problem with the volume and quality of water.
Feed water for boiler: water is obtained from the Akhangaran canal and treated
before use. There is no lack of flow of water. Cooling water: Existing
equipment Water is taken from the Akhangaran canal and supplied to three cooling towers. It is only necessary to resupply the evaporated water volume on a constant basis.
New equipment
Same as the existing equipment. Cooling is planned via cooling towers. However, it is necessary to construct a fourth cooling tower in addition to the three existing cooling towers. The second cooling tower is under construction, so it is not used.
Henceforth, there are plans to conduct F/S and consider expanding facilities.
冷却塔
Planned construction
s ite

5-35
Source: Uzbekenergo JSC
Pic. 5.2.7-2 Cooling towers
(6) Problems relating to the grid connection
No particular problem.
There are plans to carry out power transmission via four 220 kV lines. The
transmission grid was originally constructed taking into account the transmission
volume of all eight units, so there is no problem with transmission capacity.
However, as the construction period has not been determined, the grid has not been
worked out up to switchgears, so more connection cells, circuit breakers and other
equipment must be installed.
(7) Funding for newly constructed equipment
Not determined.
(8) Environmental impact of newly constructed equipment
There is the potential for improvement.
Due to the construction of a new 300 MW unit, specific fuel consumption will be
improved by 4.1 % (based on calorific value), so compared to a conventional coal-
fired thermal power plant of similar capacity, CO2 emissions will be reduced.
Besides, up-to-date environmental devices are expected to be installed, so there is
scope to reduce NOx, SOx, soot and dust emissions.
(9) Possibility of resettlement and alienation of agricultural land
There is no such possibility.
There are plans to carry out construction within the plant area.
Cooling tower No2
5-36
(10) Problems relating to transportation of the equipment
No particular problem.
There are plans to transport equipment by railroad referencing past transportation
records of 150 MW coal-fired power unit to Angren TPP, the commissioning of
which is planned for 2016.
(11) Preparation progress regarding the new construction
Currently there is no progress in the discussion of technical and other issues.
(12) Challenges to power plant construction
Reconstruction of cooling tower No. 2 and construction of new switchgear is
required.
(13) Need and urgency to construct new equipment
New equipment needs to be constructed to boost electricity production using coal, as
well as reducing the gas consumption, decreasing the environmental burden and
ensuring a stable power supply to Almalyk industrial zone.
(14) Evaluation of the construction site
Although existing equipment with total capacity of 2,100 ranking second in
Uzbekistan was built in the 1980s, the current plant efficiency is 29.5 %, which is the
lowest value among the thermal power plants held by Uzbekenergo JSC. The
existing equipment does not meet emission standards and is incurring penalties,
however, taking the service life of the equipment into account, the option of scrap-
and-build method should not be prioritized.
It is recommended to increase the efficiency and extend the life of existing
equipment by properly maintaining environmental devices of existing equipment, as
well as taking measures to increase the efficiency of main BTG equipment (boilers,
turbines, generators).

5-37
5.2.8 Tashkent CHP
This paragraph shows the results of the study on the potential for further yen loans to
construct GTCS 2, 3, which is scheduled for completion by 2020.
(1) Outline of the power plant
Figure 5.2.8-1 Location of Tashkent CHP
In 2013, under the NEDO project at Tashkent CHP, the MHPS Gas Turbine Unit of
the H-25 type was introduced, the remaining equipment was built in the 1930s-1950s
and is extremely outdated. The rated capacity is 57 MW, but the current available
capacity is 49.5 MW. The construction of two GTCS (priority potential project) is
included in Appendix No. 3 to Decree No. UP-4707 of the President of the Republic
of Uzbekistan dated March 4, 2015.
Pic. 5.2.8-1 Panoramic view of Tashkent CHP (left side is conventional equipment, right side is NEDO demonstration project equipment)
Tashkent CHP

5-38
(2) Power plant operation
Existing equipment: operated under the load-dispatch instructions of NDC. The
demand for the current day is indicated once a month, however, the plant is mostly
operated at the rated capacity.
New equipment: there are plans to operate at the rated capacity as NEDO project
equipment.
(3) Allocation of construction site
The construction site is determined.
There are plans to carry out construction aside of the NEDO project equipment.
Figure 5.2.8-2 Planned construction site for GTCS No. 2 and 3
NEDO demonstra
tion project
equipment
Planned construction site for unit No. 2
and 3
5-39
(4) Fuel supply stability
No problem.
The gas pipeline capacity was originally designed taking into account the
construction of 27 MW GTCS×2 in addition to NEDO project equipment (27 MW
GTCS×1), so there is enough supply capacity. Problems with incoming pressure and
quality of gas which occurred during the NEDO project have been solved due to
construction of a new pipeline.
Pipeline: 530mm diameter with capacity of 300,000m3/h, incoming pressure of
4.5kg/cm2.
Gas consumption: existing equipment: 40,000 m3/h, NEDO project equipment:
10,000 m3/h.
New GTCS No. 2 and 3: expected to be about 10,000 m3/h.
(5) Provision of utilities
There is no problem with the volume and quality of water.
Feed water for boiler: tap water is used and treated before use.
Cooling water: tap water.
The construction site, electric transmission facilities, fuel pipeline and others
have been completed during NEDO equipment planning, however, the supply
contract must be amended.
As for the water treatment facilities, henceforth there are plans to conduct F/S and
consider expanding facilities.
(6) Problems relating to the grid connection
No particular problem.
There are plans to connect to the existing 110 kV grid.
The switchgear, transmission grid necessary for GTCS No. 2 and 3 were already
constructed during the construction of NEDO project equipment.
(7) Funding for newly constructed equipment
Not determined.
(8) Environmental impact of newly constructed equipment
There is the potential for improvement.
Due to the construction of GTCS No. 2 and 3, specific fuel consumption will be
improved by 0.8 % (based on calorific value), so CO2 emissions will be reduced
compared to a conventional gas thermal power plant of similar capacity. In addition,
if the use of existing low-efficient equipment is reduced, it will help reduce the CO2
emission intensity of the energy system.
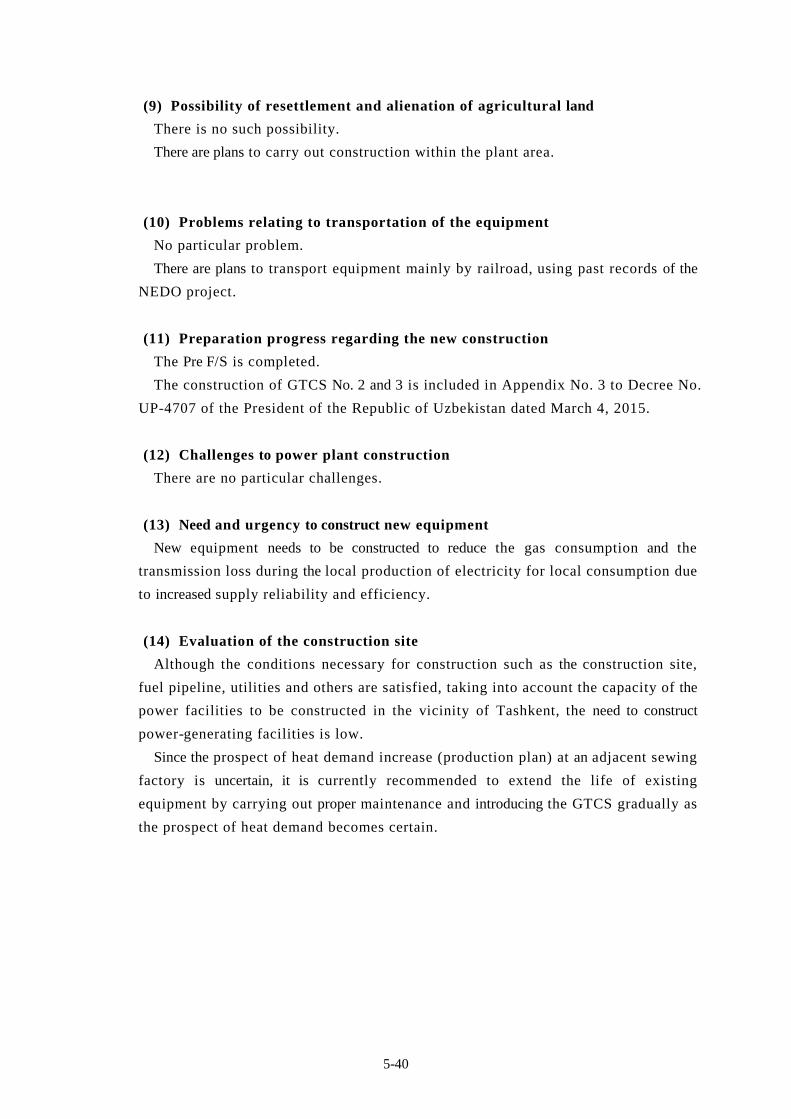
5-40
(9) Possibility of resettlement and alienation of agricultural land
There is no such possibility.
There are plans to carry out construction within the plant area.
(10) Problems relating to transportation of the equipment
No particular problem.
There are plans to transport equipment mainly by railroad, using past records of the
NEDO project.
(11) Preparation progress regarding the new construction
The Pre F/S is completed.
The construction of GTCS No. 2 and 3 is included in Appendix No. 3 to Decree No.
UP-4707 of the President of the Republic of Uzbekistan dated March 4, 2015.
(12) Challenges to power plant construction
There are no particular challenges.
(13) Need and urgency to construct new equipment
New equipment needs to be constructed to reduce the gas consumption and the
transmission loss during the local production of electricity for local consumption due
to increased supply reliability and efficiency.
(14) Evaluation of the construction site
Although the conditions necessary for construction such as the construction site,
fuel pipeline, utilities and others are satisfied, taking into account the capacity of the
power facilities to be constructed in the vicinity of Tashkent, the need to construct
power-generating facilities is low.
Since the prospect of heat demand increase (production plan) at an adjacent sewing
factory is uncertain, it is currently recommended to extend the life of existing
equipment by carrying out proper maintenance and introducing the GTCS gradually as
the prospect of heat demand becomes certain.

5-41
5.2.9 Mubarek CHP
This paragraph shows the results of the study on the potential for further yen loans to
construct 150 MW GTCS which is scheduled for completion by 2019.
(1) Outline of the power plant
Figure 5.2.9-1 Location of Mubarek CHP
Mubarek CHP is a relatively new plant in Uzbekistan, which supplies steam to the
Mubarek gas processing plant. The total power of the plant is 120 MW. The entire
volume of produced heat and almost the entire volume of electricity is supplied to
the gas processing plant, while the remaining electricity is supplied to the power grid.
After the construction of the 140 MW GTCS (priority potential project) is
completed the existing equipment is planned to be used as backup equipment.
Pic. 5.2.9-1 Panoramic view of Mubarek CHP
Mubarek CHP
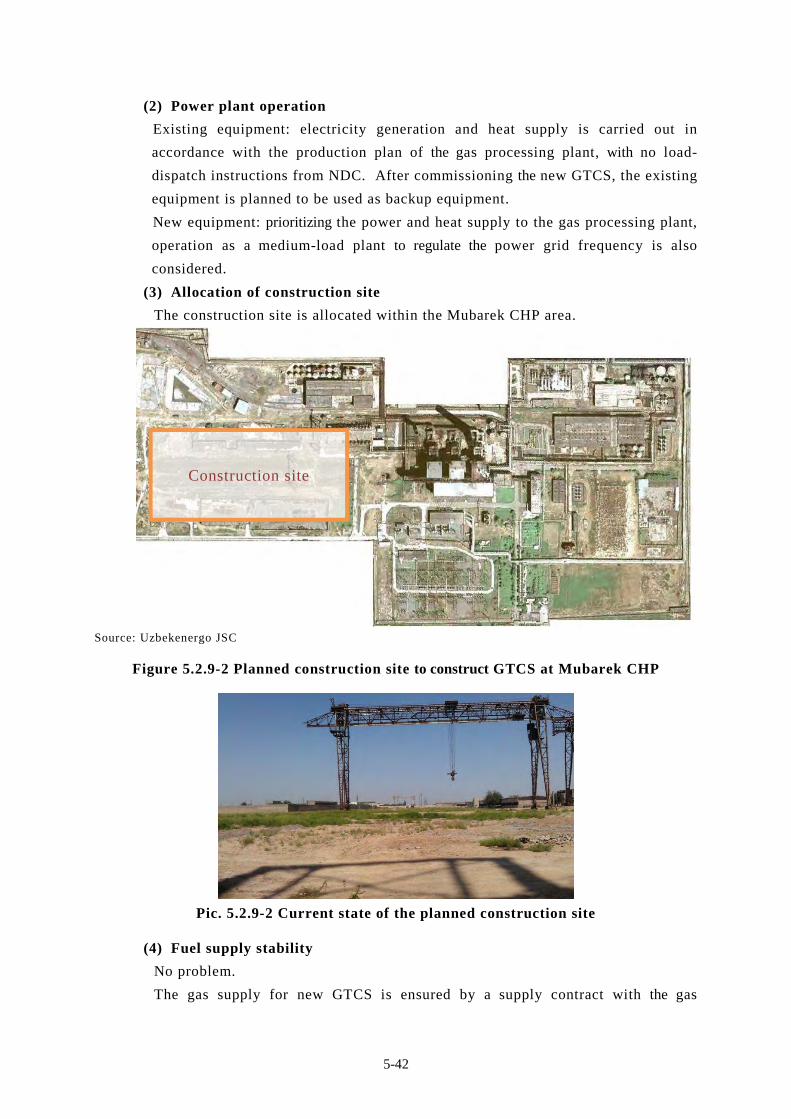
5-42
(2) Power plant operation
Existing equipment: electricity generation and heat supply is carried out in
accordance with the production plan of the gas processing plant, with no load-
dispatch instructions from NDC. After commissioning the new GTCS, the existing
equipment is planned to be used as backup equipment.
New equipment: prioritizing the power and heat supply to the gas processing plant,
operation as a medium-load plant to regulate the power grid frequency is also
considered.
(3) Allocation of construction site
The construction site is allocated within the Mubarek CHP area.
Source: Uzbekenergo JSC
Figure 5.2.9-2 Planned construction site to construct GTCS at Mubarek CHP
Pic. 5.2.9-2 Current state of the planned construction site
(4) Fuel supply stability
No problem.
The gas supply for new GTCS is ensured by a supply contract with the gas
Construction site
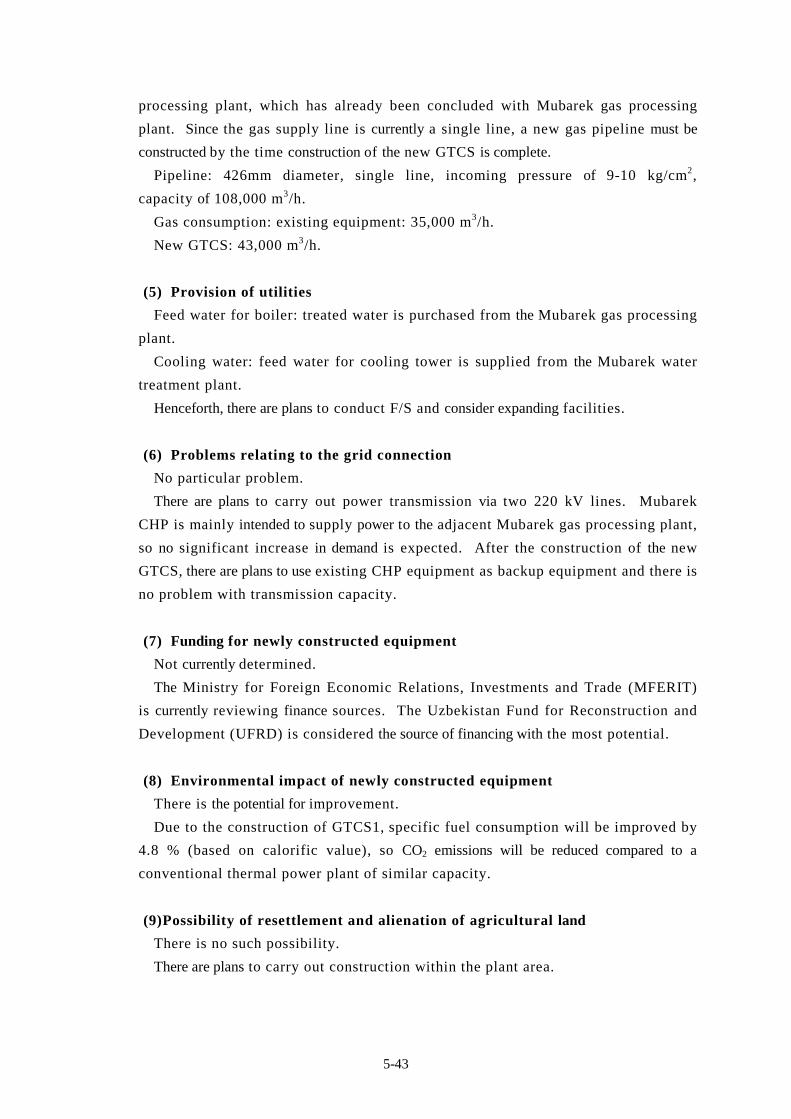
5-43
processing plant, which has already been concluded with Mubarek gas processing
plant. Since the gas supply line is currently a single line, a new gas pipeline must be
constructed by the time construction of the new GTCS is complete.
Pipeline: 426mm diameter, single line, incoming pressure of 9-10 kg/cm2,
capacity of 108,000 m3/h.
Gas consumption: existing equipment: 35,000 m3/h.
New GTCS: 43,000 m3/h.
(5) Provision of utilities
Feed water for boiler: treated water is purchased from the Mubarek gas processing
plant.
Cooling water: feed water for cooling tower is supplied from the Mubarek water
treatment plant.
Henceforth, there are plans to conduct F/S and consider expanding facilities.
(6) Problems relating to the grid connection
No particular problem.
There are plans to carry out power transmission via two 220 kV lines. Mubarek
CHP is mainly intended to supply power to the adjacent Mubarek gas processing plant,
so no significant increase in demand is expected. After the construction of the new
GTCS, there are plans to use existing CHP equipment as backup equipment and there is
no problem with transmission capacity.
(7) Funding for newly constructed equipment
Not currently determined.
The Ministry for Foreign Economic Relations, Investments and Trade (MFERIT)
is currently reviewing finance sources. The Uzbekistan Fund for Reconstruction and
Development (UFRD) is considered the source of financing with the most potential.
(8) Environmental impact of newly constructed equipment
There is the potential for improvement.
Due to the construction of GTCS1, specific fuel consumption will be improved by
4.8 % (based on calorific value), so CO2 emissions will be reduced compared to a
conventional thermal power plant of similar capacity.
(9)Possibility of resettlement and alienation of agricultural land
There is no such possibility.
There are plans to carry out construction within the plant area.
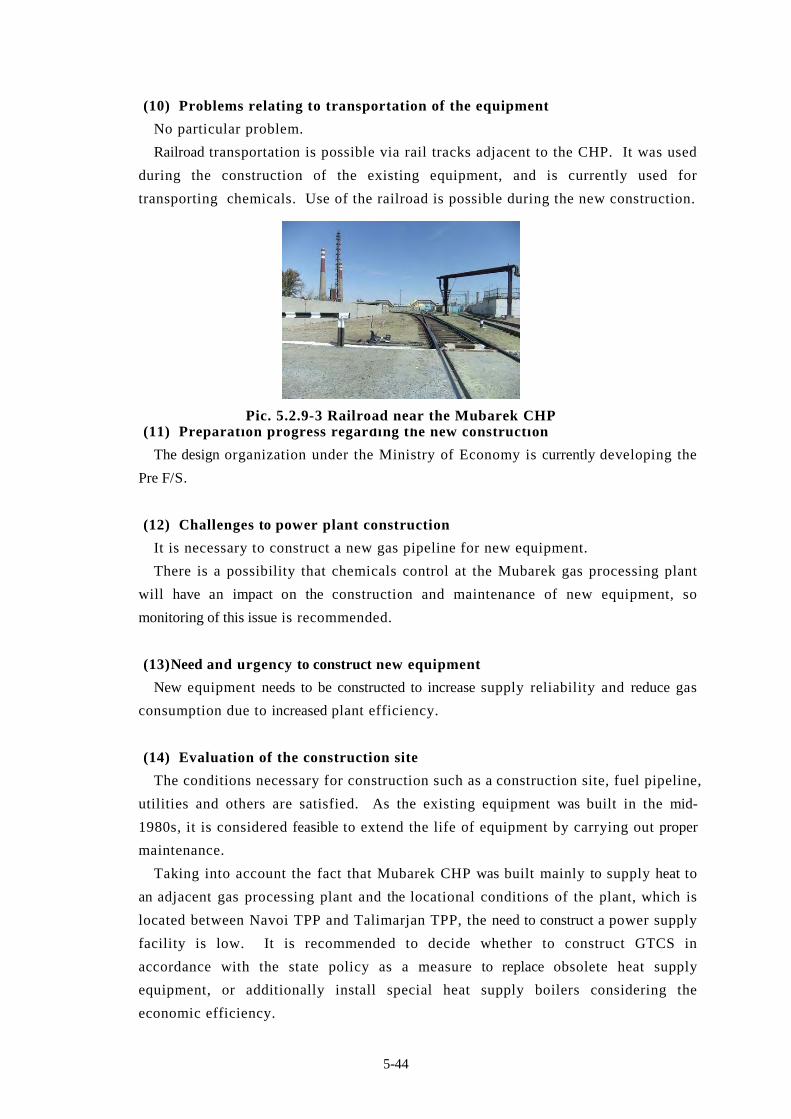
5-44
(10) Problems relating to transportation of the equipment
No particular problem.
Railroad transportation is possible via rail tracks adjacent to the CHP. It was used
during the construction of the existing equipment, and is currently used for
transporting chemicals. Use of the railroad is possible during the new construction.
(11) Preparation progress regarding the new construction
The design organization under the Ministry of Economy is currently developing the
Pre F/S.
(12) Challenges to power plant construction
It is necessary to construct a new gas pipeline for new equipment.
There is a possibility that chemicals control at the Mubarek gas processing plant
will have an impact on the construction and maintenance of new equipment, so
monitoring of this issue is recommended.
(13)Need and urgency to construct new equipment
New equipment needs to be constructed to increase supply reliability and reduce gas
consumption due to increased plant efficiency.
(14) Evaluation of the construction site
The conditions necessary for construction such as a construction site, fuel pipeline,
utilities and others are satisfied. As the existing equipment was built in the mid-
1980s, it is considered feasible to extend the life of equipment by carrying out proper
maintenance.
Taking into account the fact that Mubarek CHP was built mainly to supply heat to
an adjacent gas processing plant and the locational conditions of the plant, which is
located between Navoi TPP and Talimarjan TPP, the need to construct a power supply
facility is low. It is recommended to decide whether to construct GTCS in
accordance with the state policy as a measure to replace obsolete heat supply
equipment, or additionally install special heat supply boilers considering the
economic efficiency.
Pic. 5.2.9-3 Railroad near the Mubarek CHP
5-45
5.2.10 Fergana CHP
This paragraph shows the results of the study on the potential to allocate further yen loans to
construct a 57.7 MW GTCC, which is scheduled for completion by 2018.
(1) Outline of the power plant
Figure 5.2.10-1 Location of Fergana CHP
The Fergana CHP was designed to supply heat and power to nearby plants. Steam
is supplied to the fertilizer plant (SC “Ferganaazot”) and Fergana refinery (NHC
“Uzbekneftegaz”) in the Fergana-Margilan industrial zone. Most of the production
capacity of CHP aims to produce heat. The plant equipment was built from the early
1950s to the beginning of the 1980s and is extremely outdated. The rated capacity is
305 MW, but the currently available capacity is 250 MW.
Although coal was originally used as fuel, the main fuel is currently natural gas and
the reserve fuel is fuel-oil.
In 2014, in Fergana CHP, a study to disseminate technology within the NEDO
project in Tashkent CHP was conducted and it was recommended to construct two
30 MW class GTCS and expand GTCC in the view of demand.
Construction of 57.7 MW GTCC (priority potential project) is included in
Appendix No. 3 to Decree No. UP-4707 of the President of the Republic of
Uzbekistan dated March 4, 2015.
Fergana CHP

5-46
Pic. 5.2.10-1 Panoramic view of Fergana
CHP Pic. 5.2.10-2 Turbine department
(2) Power plant operation
Existing equipment: since the CHP was mainly built and operated to supply heat
and electricity to the Fergana refinery (NHC “Uzbekneftegaz”) and SC “Ferganaazot”
(fertilizer plant), the demand depends on the production plan of consumers.
New equipment: there are plans to operate at rated capacity to cover electricity
demand of Fergana Valley.
(3) Allocation of construction site
The construction site is determined on the territory of Fergana CHP (coal storage yard).
Source: Prepared by JICA Study Team based on Fergana CHP Pre F/S of Uzbek side.
Figure 5.2.10-2 Fergana CHP, placement plan of new equipment
Existing turbine/boiler department
Switchyard
Construction site for new equipment
(coal storage yard)

5-47
(4) Fuel supply stability
No problem.
Gas pipeline expansion is planned when constructing new equipment.
Gas supply: gas pipe, diameter 530 mm, two lines with total capacity of 100,000 m3/h.
Gas consumption: for existing equipment 60,000 m3/h and for newly constructed
equipment, 25,000 m3/h.
(5) Provision of utilities
Feed water for boiler: treated water is purchased from the nearby SC
“Ferganaazot”. Part of the treated water is produced in the Fergana CHP.
Cooling water: feed water for cooling towers is purchased.
Henceforth, there are plans to conduct F/S and consider expanding facilities.
(6) Problems relating to the grid connection
No particular problem
There are plans to connect to the existing 110 kV grid.
Most of the generated electric power will be directly delivered to the nearby
refinery and fertilizer plant, the rest will be supplied to the grid, which is currently
possible through existing equipment.
(7) Funding for newly constructed equipment
Not determined.
(8) Environmental impact of newly constructed equipment
No such impact.
Due to the construction of the new GTCC unit, CO2 emissions of the Fergana CHP
will not be reduced, but if the use of existing low-efficient equipment will be
reduced, it will help reduce the CO2 emission intensity of the energy system.
(9) Possibility of resettlement and alienation of agricultural land
No such possibility.
Construction is planned on the territory of CHP.
(10) Problems relating to transportation of the equipment
For the overland route, since it traverses Tajikistan territory, verification of the
transportation route is essential, i.e. the feasibility for safe passage of trucks with
bulky equipment, flatness and width of roads, load-carrying capacity of bridges.
Transportation of GTCC-1 and GTCC-2 cannot serve as a reference as their
construction was later than GTCC of Fergana CHP.
For rail, opening of the tunnel on the Angren-Pap railroad is imperative.
5-48
(11) Preparation progress regarding the new construction.
By August 2015, NEDO had completed a feasibility study to construct three 17 MW
class gas turbines. Construction of 57.7 MW GTCC (priority potential project) is
included in Appendix No. 3 to Decree No. UP-4707 of the President of the Republic
of Uzbekistan dated March 4, 2015.
(12) Challenges to power plant construction
In recent years, there was no experience of transporting bulky power-generating units
in Fergana Valley, hence a safe and secure transportation route must be considered.
(13) Need and urgency to construct new equipment
Construction of the new equipment will help increase the reliability of heat (steam,
hot water) and power supply of Fergana refinery and SC “Ferganaazot” and slightly
increase the energy supply capacity of Fergana Valley.
However, the electricity demand in Fergana Valley is 1,650 MW, so even if 900
MW from two GTCC of Turakurgan TPP is added to the capacity of existing
equipment of Fergana CHP, which is 305 MW (available capacity is 250 MW) plus a
new GTCC of 57.7 MW (planned), it will not meet all electricity demand nor solve the
issue involving the transfer of power at distance from western Uzbekistan.
(14) Others
In 2015, NEDO conducted a primary study of the Model project to construct three
17 MW class gas turbines in Fergana CHP, which was completed before August. No
MOU with the Uzbek side has yet been signed, nor has any decision on project
implementation been made.
Construction of a 57.7 MW GTCC is included in Appendix No. 3 to Decree No.
UP-4707 of the President of the Republic of Uzbekistan dated March 4, 2015.
(15) Evaluation of the construction site
Although, all the necessary conditions for construction, such as the construction
site, fuel supply, utilities, a study on the NEDO Model Project to construct three 17
MW class gas turbines (total capacity of 51 MW) moving forward, the construction
period of the NEDO project matches the construction period of 57 MW GTCC, as
mentioned in Decree No. UP-4707 of the President of the Republic of Uzbekistan.
From the perspective of the original objectives of Fergana CHP, namely to replace
obsolete equipment and heat supply to the nearby refinery, the construction of gas
turbines is reasonable.
Accordingly, if it is supposed that the power shortage of Fergana Valley will
remain after implementing the NEDO project and constructing two GTCC units on
Turakurgan TPP, the construction of 57.7 GTCC can be considered.

5-49
5.3 Evaluation of priority potential project sites
Based on the circumstances of the potential project sites described in paragraph 4.2 the
evaluation was conducted as shown in Table 5.3-1.
The priority projects selected taking into account the fuel supply plan, environmental and
social considerations, an optimal electric power development scenario in Uzbekistan and
other issues are listed in the next section.

5-50
Table 5.3-1 Evaluation of priority potential project sites Navoi TPP Talimardjan TPP Syrdarya TPP Turakurgan TPP Tashkent TPP Angren TPP Novo-Angren TPP Tashkent CHP Mubarek CHP Fergana CHP
Scheduled commissioning of priority potential projects
450MW GTCC in 2021
450MW GTCC in 2021 450MW GTCC in 2022
450MW GTCC in 2018 450MW GTCC in 2019
450MW GTCC in 2021 450MW GTCC in 2022
450MW GTCC in 2024
150MW coal-fired TPP in 2021
300MW coal-fired TPP in 2024
27MWx2 GTCS in 2020
140MW GTCS in 2019
57.7MW GTCC in 2018
Preparation progress regarding the new construction.
Technical study
There is no progress in the discussion of the technical and other issues.
There is no progress in the discussion of the technical and other issues.
Pre F/S is completed. Pre F/S is under verification in state agencies.
There is no progress in the discussion of the technical and other issues.
There is no progress in the discussion of the technical and other issues.
Technical documentation is being developed. Pre F/F is not done. Consultant is not selected.
There is no progress in the discussion of the technical and other issues.
Pre F/S is completed.
Pre F/S stage (being developed by research institute under the Ministry of Economics)
NEDO has completed feasibility study of the Project on construction of three 17MW GTCS.
Authorization by Presidential Decree
The Project is included in Appendix No.3 to the Presidential Decree No. UP-4707
The Project is included in Appendix No.3 to the Presidential Decree No. UP-4707
The Project is included in Appendix No.3 to the Presidential Decree No. UP-4707
N/A N/A
The Project is included in Appendix No.3 to the Presidential Decree No. UP-4707
N/A
The Project is included in Appendix No.3 to the Presidential Decree No. UP-4707
N/A
The Project is included in Appendix No.3 to the Presidential Decree No. UP-4707
Possibility of resettlement and alienation of agricultural land
There is a possibility No such possibility There is a possibility No such possibility No such possibility There is a possibility No such possibility No such possibility No such possibility No such possibility
Challenges
Allocation of construction site Determined Determined Determined Determined
Will be determined after the decommissioning of the existing equipment
Determined Determined Determined Determined Determined
Fuel supply stability No problem Gas pipeline should be constructed
Gas pipeline should be constructed
Gas pipeline should be constructed
No problem No problem No problem No problem No problem No problem
Provision of utilities No problem No problem No problem Designing and construction is necessary
No problem No problem No problem No problem No problem No problem
Problems relating to the grid connection
No particular problem No particular problem No particular problem No particular problem No particular problem No particular problem No particular problem No particular problem No particular problem No particular problem
Transportation No problem No problem Access roads are rough and needs to be repaired.
No problem No problem No problem No problem No problem No problemReconnaissance required
Challenges in power plant construction
To be solved within the plant
Construction of new 110kV Switchyard (is being planned by Uzbekenergo JSC)
N/A N/A
Transmission line, gas pipeline and utilities for Phase-2 (Unit 3 and 4) need to be constructed because Phase-1 (Unit 1 and 2) does not consider future expansion.
N/A N/A N/A N/A N/A N/A
To be solved outside the plant
Necessary to discuss with the residents regarding the construction site.
Construction of 500kV transmission system (is being planned by Uzbekenergo JSC)
Necessary to discuss with the residents regarding the construction site.
Necessary to discuss with the residents regarding the construction site.
To be solved by the third party
N/A
Construction of gas pipeline for new GTCC (Uzbekneftegaz)
Construction of gas pipeline for new GTCC (Uzbekneftegaz)
N/A Construction of gas pipeline for new GTCS (Uzbekneftegaz)
Necessity and urgency of the construction of new equipment
Improvement of power demand and supply balance
Meeting the needs of Uzbekistan in electric power.
Meeting the needs of Uzbekistan in electric power.
Meeting the needs of Uzbekistan in electric power.
Ensure increase of power supply capacity of Fergana Valley and decrease power transmission loss by local generation and consumption.
Meeting the needs of Uzbekistan in electric power.
Stable power supply to Almalyk industrial zone
Stable power supply to Almalyk industrial zone
Ensure increase of power supply capacity of Fergana Valley and decrease power transmission loss by local generation and consumption.
Regional division of power grid
South-West (Samarkand)
South-West (Samarkand)
Central region (Tashkent)
East (Fergana) Central region (Tashkent)
Central region (Tashkent)
Central region (Tashkent)
Central region (Tashkent)
South-West (Samarkand)
East (Fergana)
Environmental benefit
At obsolescence of existing equipment, it is difficult to comply with emission standards (gas emission)
At obsolescence of existing equipment, it is difficult to comply with emission standards (gas emission)
At obsolescence of existing equipment, it is difficult to comply with emission standards (gas emission)
At obsolescence of existing equipment, it is difficult to comply with emission standards (gas emission)
At obsolescence of existing equipment, it is difficult to comply with emission standards (gas emission)
At obsolescence of existing equipment, it is difficult to comply with emission standards (gas emission)

5-51
Navoi TPP Talimardjan TPP Syrdarya TPP Turakurgan TPP Tashkent TPP Angren TPP Novo-Angren TPP Tashkent CHP Mubarek CHP Fergana CHP
Others Reduction of gas consumption
Reduction of gas consumption
Ensuring allowance for frequency control in the power system ②Reduction of gas consumption
Decrease of reliability of power supply due to the obsolescence of the equipment and reduction of gas consumption
Decrease of reliability of power supply due to the obsolescence of the equipment and reduction of gas consumption due to the use of coal
Decrease of reliability of power supply due to the obsolescence of the equipment and reduction of gas consumption due to the use of coal
Decrease of reliability of power supply due to the obsolescence of the equipment
Reduction of gas consumption
Decrease of reliability of power supply due to the obsolescence of the equipment and reduction of gas consumption
Evaluation
The increase of reliability and efficiency of power supply by the replacement of obsolete equipment using scrap-and-build method will allow reducing the gas consumption, which complies with the state policy of the Republic of Uzbekistan. Besides, taking into account the fact that existing equipment does not meet emission standards and is being operated with payment of penalties, from the point of view of environmental measures of the region the construction of new equipment is appropriate.
Designed and constructed in the Soviet period, existing equipment has a low efficiency, furthermore, taking into account the fact that the equipment does not meet the emission standards (NOx) and being operated with payments of penalties, from the point of view of environmental measures of the region construction of new equipment is appropriate. Also, construction of new GTCC will increase the entire efficiency of the plant and reduce gas consumption. In the short term the contribution to economic development of Karshi city due to inflow of construction workers is also expected.
Syrdarya TPP is located only 180 km from Tashkent which is a large-scale consumer of electricity, and located in the center of Uzbekistan, and has a number of advantages from the point of view of power grid operation, so Syrdarya TPP is an appropriate plant to be used as a base power supply facility. Taking into account the further increase of electricity demand, the priority should be given to the development of power generating facilities. The construction of new GTCC will lead to increase of the entire plant efficiency, thus leading to the reduction of gas consumption. In the short term the contribution to economic development of Shirin city due to inflow of construction workers is also expected.
The demand for electricity in Fergana Valley is 1,650 MW, even if 900 MW from two GTCC of Turakurgan TPP will be added to the capacity of existing equipment of Fergana CHP, which is 305 MW (available capacity is 250 MW) plus a new GTCC of 57.7 MW (planned), it will not cover the entire demand for electricity and will not solve the issue with the transfer of power at a great distance from the western part of Uzbekistan. In this regard, it becomes necessary to build a 3rd unit of GTCC (450 MW). Furthermore, regarding the construction of the 4th unit, it is advisable to determine the time of construction, taking into account the demand-and-supply balance of electric power in Uzbekistan.
Tashkent TPP is located in Tashkent city which is a large-scale consumer of electricity, and supplies electricity to Tashkent region and Fergana Valley ranking 3rd in Uzbekistan by total capacity. However, due to the progress of obsolescence of every unit built in 1960-1970 Tashkent TPP ranks 2nd in Uzbekistan among the power plants with the lowest efficiency. The increase of reliability and efficiency of power supply due to replacement of obsolete equipment using scrap-and-build method will allow reducing gas consumption, so the construction of new GTCC complies with the state policy of the Republic of Uzbekistan. Besides, taking into account the fact that existing equipment does not meet emission standards and is being operated with payment of penalties, from the point of view of environmental measures of the region the construction of new equipment is appropriate.
The increase of reliability and efficiency of power supply due to replacement of obsolete equipment, which was constructed in 1950-1960s, using scrap-and-build method will allow reducing coal consumption. Construction of the new equipment will increase the consumption of local coal and reduce gas consumption, which comply with the state policy of the Republic of Uzbekistan. Besides, taking into account the fact that the equipment does not meet the emission standards and being operated with payments of penalties, from the point of view of environmental measures of the region construction of new equipment is appropriate.
Although existing equipment with total capacity of 2,100 ranking 2nd in Uzbekistan has been built in 1980s, the current plant efficiency is 29.5% which is the lowest value among the thermal power plants held by SC «Uzbekenergo JSC». The existing equipment does not meet emission standards and is being operated with payment of penalties, however, taking into account the service life of equipment, the option of scrap-and-build method should not be given priority. It is recommended to increase the efficiency and extend the life of existing equipment by carrying out properly the maintenance of environmental devices of existing equipment, as well as taking measures to increase the efficiency of main equipment BTG (boilers, turbines, generators).
Although the conditions necessary for construction such as construction site, fuel pipeline, utilities and others are satisfied, taking into account the capacity of power facilities to be constructed in the vicinity of Tashkent the necessity of construction of power generating facilities is low. The prospect of heat demand increase (production plan) at adjacent sewing factory is not certain, so currently it is recommended to extend the life of existing equipment by carrying out properly its maintenance, and introduce the GTCS gradually as the prospect of heat demand becomes certain.
The conditions necessary for construction such as construction site, fuel pipeline, utilities and others are satisfied. As the existing equipment has been built in the middle 1980s, it is considered possible to extend the life of equipment by carrying out properly its maintenance. Taking into account the fact that Mubarek CHP has been built mainly for heat supply to adjacent gas processing plant, and locational conditions of the plant which is located between Navoi TPP and Talimarjan TPP, the necessity of construction of power supply facility is low. It is recommended to decide whether to construct GTCS in accordance with the state policy as a measure for replacement of obsolete heat supply equipment, or additionally install the special heat supply boilers considering the economic efficiency.
Although, there are all necessary conditions for construction, such as construction site, fuel supply, utilities, study on the NEDO Model Project on construction of three 17 MW class gas turbines (total capacity of 51 MW) moving forward, the construction period of the NEDO Project duplicates with the construction period of 57 MW GTCC, which is mentioned in the Decree No. UP-4707 of the President of the Republic of Uzbekistan. From the viewpoint of the original objectives of Fergana CHP, that is the replacement of obsolete equipment and heat supply to nearby refinery, the construction of gas turbines is reasonable. Thus, if it is supposed that the power shortage of Fergana Valley will remain after the implementation of NEDO Project and the construction of two GTCC units on Turakurgan TPP, the construction can be considered.
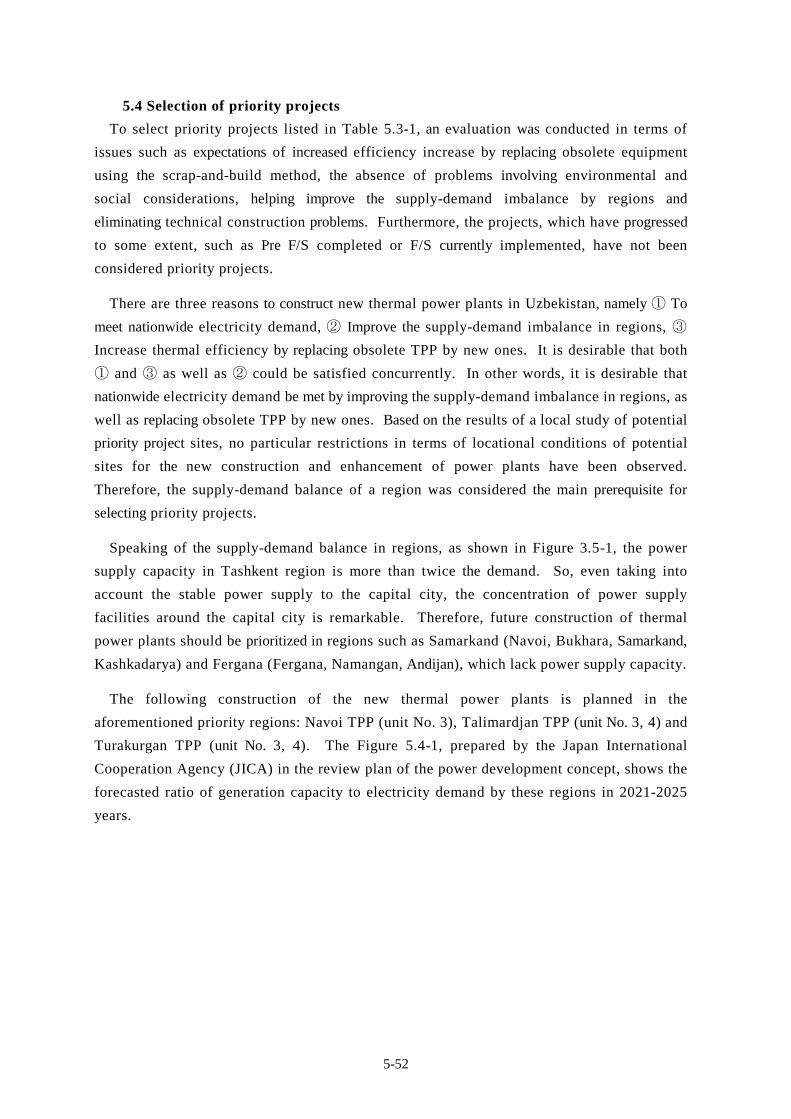
5-52
5.4 Selection of priority projects
To select priority projects listed in Table 5.3-1, an evaluation was conducted in terms of
issues such as expectations of increased efficiency increase by replacing obsolete equipment
using the scrap-and-build method, the absence of problems involving environmental and
social considerations, helping improve the supply-demand imbalance by regions and
eliminating technical construction problems. Furthermore, the projects, which have progressed
to some extent, such as Pre F/S completed or F/S currently implemented, have not been
considered priority projects.
There are three reasons to construct new thermal power plants in Uzbekistan, namely ① To
meet nationwide electricity demand, ② Improve the supply-demand imbalance in regions, ③
Increase thermal efficiency by replacing obsolete TPP by new ones. It is desirable that both
① and ③ as well as ② could be satisfied concurrently. In other words, it is desirable that
nationwide electricity demand be met by improving the supply-demand imbalance in regions, as
well as replacing obsolete TPP by new ones. Based on the results of a local study of potential
priority project sites, no particular restrictions in terms of locational conditions of potential
sites for the new construction and enhancement of power plants have been observed.
Therefore, the supply-demand balance of a region was considered the main prerequisite for
selecting priority projects.
Speaking of the supply-demand balance in regions, as shown in Figure 3.5-1, the power
supply capacity in Tashkent region is more than twice the demand. So, even taking into
account the stable power supply to the capital city, the concentration of power supply
facilities around the capital city is remarkable. Therefore, future construction of thermal
power plants should be prioritized in regions such as Samarkand (Navoi, Bukhara, Samarkand,
Kashkadarya) and Fergana (Fergana, Namangan, Andijan), which lack power supply capacity.
The following construction of the new thermal power plants is planned in the
aforementioned priority regions: Navoi TPP (unit No. 3), Talimardjan TPP (unit No. 3, 4) and
Turakurgan TPP (unit No. 3, 4). The Figure 5.4-1, prepared by the Japan International
Cooperation Agency (JICA) in the review plan of the power development concept, shows the
forecasted ratio of generation capacity to electricity demand by these regions in 2021-2025
years.

5-53
Source: JICA Study Team
Figure 5.4-1 The ratio of generation capacity to electricity demand by regions and
power development concept
Figure 5.4-2 shows the ratio of generation capacity to electricity demand by the
aforementioned regions, excluding the generation of unit No. 3 in Navoi TPP and unit No. 3
in Turakurgan TPP; the commencement of these units is scheduled for the near future. In
case unit No. 3 in Navoi TPP is excluded, the ratio of generation capacity to demand in
Samarkand region will gradually decrease to 76 % in 2021, and to 67 % in 2024. If these of
unit No.3 Talimardjan TPP commences in 2025, the ratio will return to 73 %. In case unit
No. 3 of Talimardjan TPP is excluded, the ratio of generation capacity to demand in Fergana
region will decrease to 64 % in 2021, and after use of unit No.4 commences at Turakurgan
TPP in 2022, the ratio will increase to t 85 %. However, in 2025 the ratio will decrease to
75 %.
5-54
Source: JICA Study Team
Figure 5.4-2 The ratio of generation capacity to electricity demand by regions in case
of absence of the unit No. 3 of Navoi TPP and the unit No. 3 of Turakurgan TPP
In view of the foregoing, it can be concluded that unit No. 3 of Navoi TPP and unit No. 3
of Turakurgan TPP are essential in maintaining a balance between generation capacity and
demand in Samarkand and Fergana regions, respectively, and that these projects are
prioritized.

Chapter 6 Investment Plan
6-1
Chapter 6 Investment Plan
6.1 An investment program based on the power development plan
Based on the power development plan, a 15-year investment plan, from 2015 to 2030, was
developed to meet long-term power demand in Uzbekistan. The following are the preliminary
assessment conditions:
(1) Investments in power generation equipment: by years
Based on the method of consideration for the optimal power development plan, as presented in
Chapter 3, a breakdown of the investment amount was performed and presented on an annual basis
(Figure 5.2-1). The investment amount was calculated using the WASP model. The WASP model is
designed for calculating operational expenses (maintenance, fuel) by stochastic simulation of
demand and supply according to the structure of power sources by year, which covers the maximum
power demand and takes into consideration technical maintenance of power generation equipment
annually. These operation expenses and other expenses related to changes in the power source
structure (which were converted to the current price of generation equipment) were taken as annual
expenses in the planning scenario. These expenses will be taken into account during the dynamic
planning phase, where minimal expenses will be used from the start of operation until the
decommission year.
(2) Power generation by each power plant
The electricity supply volume was calculated based on the power demand forecast (Base case) and
the total volume of electricity supply, as generated by each power generation facility, was calculated
by modeling the optimal primary energy source development (Table 5.2-2).
(3) Operating period
Taking into account a 30-year operating period for thermal power plant equipment, the volume of
electricity generation was calculated for a 30-year period starting from 2030, which is the last year of
investment, up to 2060.
The normal operating period for hydropower plant equipment is 50 years, so there will be no new
hydropower plant expired before 2060. Volume of electricity to be produced until 2060 was has
been calculated in the same way as for thermal power plants (Table 5.2-2).
(4) Electricity tariffs
The price at which power companies sell electricity to Uzbekenergo JSC is decided by the
Ministry of Finance based on the decree of the Cabinet of Ministers 1The price at which electricity is
sold is different for each power plant taking into consideration the power generation costs and certain 1 Decree #239 of the Cabinet of Ministers, of 28 October 2010

6-2
profit margin. Wholesale prices, at which power plants in this investment plan are to sell electricity
to Uzbekenergo JSC, will also be decided by the Ministry of Finance considering their profitability.
In the meantime, however, these prices have yet to be decided. For this reason, wherever electricity
tariffs need to be calculated in this plan, we will use the price at which TashTETS, an affiliate
company of Uzbekenergo JSC, sells electricity to Uzbekenergo JSC.
In 2014 the average wholesale electricity price, at which TashTETs, as an affiliate of Uzbekenergo
JSC, delivered to Uzbekenergo JSC, was 78.10 UZS (per kWh). However, according to financial
statements of TashTETs for 2014, its operating costs exceed sales revenues and operating profit was
not calculated, based on this price level. The margin on sales of Uzbekenergo JSC was about 10 %,
but to reach such operating profit it was estimated that the wholesale electricity price should exceed
the price for 2014, namely 78.10 UZS per kWh, by 12 % and should be 87.78 UZS (per kWh). In
addition, taking into account the fact that in recent years, the increase in the electricity price to the
end consumer was about 20 % per year, it was proposed in this investment plan to establish a
wholesale electricity price for 2015 of 110 UZS (per kWh), which is equivalent to $0.0427 USD
(kWh), or 42,685 USD (GWh).
(5) Electricity sale revenues
According to Uzbekenergo JSC, transmission losses comprise 16 % of the total generation. The
electricity volume after deducting a 16 % transmission loss from the total generation was taken for
the delivery volume. Based on the above tariff, annual electricity sales revenues were calculated.
(6) Operations and maintenance costs and fuel costs
The Operation and Maintenance (O&M) costs required to generate power were calculated based
on the investment plan and fuel prices (Table 5.2-2). The O&M costs are not published in Uzbekistan
and similar examples of other countries and “Updated Capital Cost Estimates for Utility Scale
Electricity Generating Plants” published by the Ministry of Energy of the USA were referenced to set
the fixed and variable O&M costs and which were then used in WASP to calculate O&M costs for
each type of power plants.
(7) Price growth ratio
It is hard to forecast the inflation rate for the long term, but if we assume that future costs and
benefits will grow in equal proportions, inflation would be compensated for in relation to costs and
benefits. Accordingly, 2015, which is the first year of the investment plan implementation, will be
taken as a base year and the price growth ratio for each specific category shall not be considered.
6-3
6.2 Financing plan
(1) Consideration of proposed investors
Below are the organizations that provide investment required for construction under the power
source development plan.
International Aid Organizations: provide investment to the government of Uzbekistan, and
in the form of credit through UFRD2.
UFRD: provides credits from its own funds.
(2) Funds attraction plan
As the investment plan assumes credits in US dollars, the amount of investment must also be
calculated in USD in order to avoid risks caused by changes in exchange rate. Although investment
from international aid organizations may be received not only in USD, but also in Japanese yen and
other currencies, the funds attraction plan was developed with both principal and interest converted
to USD.
All investments will be covered by credits and as these support development, they will be provided
for the long term under mild conditions. Credit conditions will be similar for both international aid
organizations and UFRD. For this reason, the proportion of credits from international organizations
and UFRD will not be considered.
2 UFRD is a government fund established in 2006 by the Government of Uzbekistan to finance key sectors for national economic growth, such as the power sector, heavy and chemical industry, metal mining, transportation, infrastructure and others.

6-4
(3) Preliminary loan terms and conditions
The total loan is the funding received as a sum of annual credit balances; the annual credit is the
funding capable of covering financing deficit, which is based on the balance of expenditure incurred for
annual investment, operating costs, fuel costs and loan repayment amount, and income in the form of
proceeds from electricity sales. The interest on the loan during the construction period will be paid by the
organization performing the project.
Interest: Fixed in USD 3.00 %
Due to investors nor the interest on investments being defined in this plan, the interest
isbased on the level of credits from international organizations3 that have worked on
similar projects, and the level of credits in USD4 in recent years.
Repayment period: 30 years, including 15-year period of concessions on repayment, with
equal repayment of principal.
Loan amount: the total loan is USD 5,348,000,000 (5 billion and 348 million) (the total
amount as of 2030, see Figure 5.2-1, Figure and Table 5.2-2).
Figure 5.2-1 Changes in total loan amount
3 According to a report of ADB, the cumulative interest expenses on the loan received from ADB to implement the Samarkand Solar Power Project in Uzbekistan, which commenced in 2015, amounts to 2.50 % in USD. 4 At the moment of development of this report, the US Treasury interest rates on 10 year bonds was 1.81 %, on 30 year bonds – 2.67 %.
‐1,000
0
1,000
2,000
3,000
4,000
5,000
6,000
1 2 3 4 5 6 7 8 9 101112131415161718192021222324252627282930
Loan Outstanding(USD, million, 30 years)
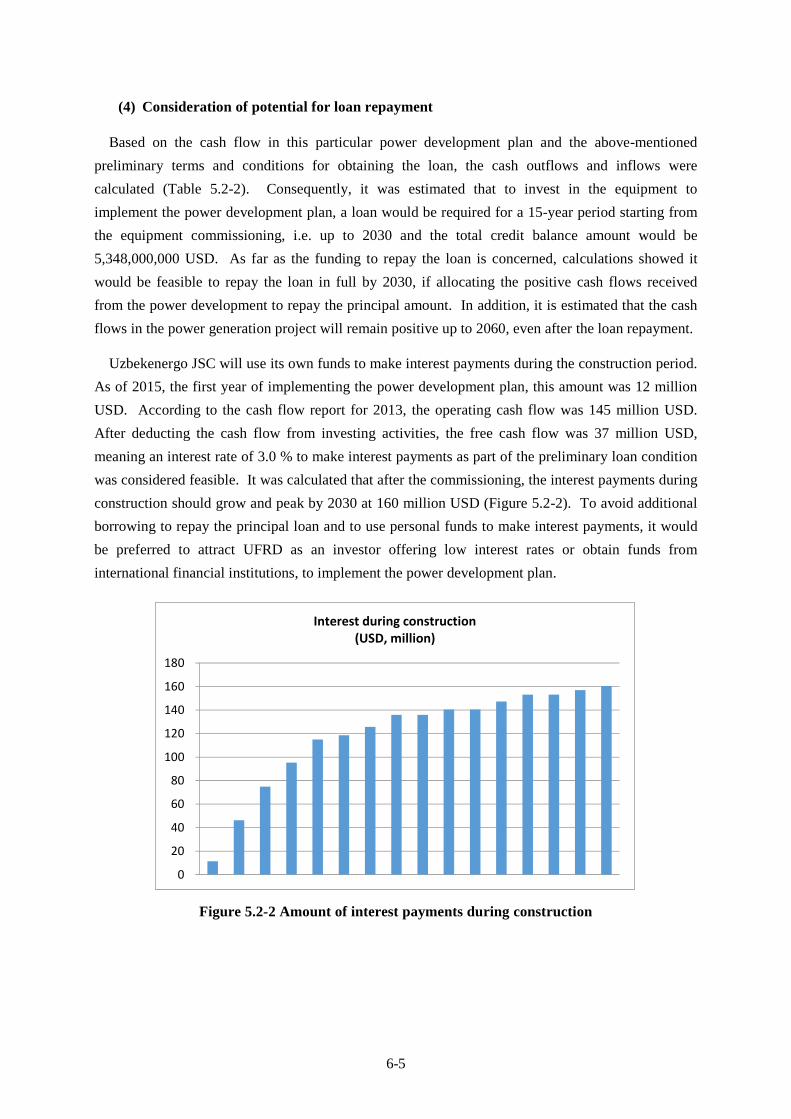
6-5
(4) Consideration of potential for loan repayment
Based on the cash flow in this particular power development plan and the above-mentioned
preliminary terms and conditions for obtaining the loan, the cash outflows and inflows were
calculated (Table 5.2-2). Consequently, it was estimated that to invest in the equipment to
implement the power development plan, a loan would be required for a 15-year period starting from
the equipment commissioning, i.e. up to 2030 and the total credit balance amount would be
5,348,000,000 USD. As far as the funding to repay the loan is concerned, calculations showed it
would be feasible to repay the loan in full by 2030, if allocating the positive cash flows received
from the power development to repay the principal amount. In addition, it is estimated that the cash
flows in the power generation project will remain positive up to 2060, even after the loan repayment.
Uzbekenergo JSC will use its own funds to make interest payments during the construction period.
As of 2015, the first year of implementing the power development plan, this amount was 12 million
USD. According to the cash flow report for 2013, the operating cash flow was 145 million USD.
After deducting the cash flow from investing activities, the free cash flow was 37 million USD,
meaning an interest rate of 3.0 % to make interest payments as part of the preliminary loan condition
was considered feasible. It was calculated that after the commissioning, the interest payments during
construction should grow and peak by 2030 at 160 million USD (Figure 5.2-2). To avoid additional
borrowing to repay the principal loan and to use personal funds to make interest payments, it would
be preferred to attract UFRD as an investor offering low interest rates or obtain funds from
international financial institutions, to implement the power development plan.
Figure 5.2-2 Amount of interest payments during construction
0
20
40
60
80
100
120
140
160
180
Interest during construction(USD, million)

6-6
Table 5.2-1 Investment plan based on the power development plan As of September 11, 2015
Unit
Yea
r of
co
mm
issi
onin
g
Inst
alle
d ca
paci
ty (
MW
)/
Con
stru
ctio
n co
st (
mill
ion
USD
)
Con
stru
ctio
n pe
riod
Annual expenditure on power plant construction (million USD)
Plant Name
2015
2016
2017
2018
2019
2020
2021
2022
2023
2024
2025
2026
2027
2028
2029
2030
Thermal Power Plants
Talimarjan TPP 2 2016 450 405 2 126 279
3 2017 450 405 2 126 279
4 2025 450 405 2 126 279
5 2026 450 405 2 126 279
6 2029 450 405 2 126 279
7 2030 450 405 2 126 279
New-Syrdarya TPP GTCC-1 2018 450 405 2 126 279
GTCC-2 2019 450 405 2 126 279
Novo-Angren TPP 8 2024 300 570 3 57 331 182
Tashkent TPP GTCC-1 2016 370 333 2 103 230
GTCC-2 2024 450 405 2 126 279
GTCC-3 2026 450 405 2 126 279
GTCC-4 2028 450 405 2 126 279
GTCC-5 2029 450 405 2 126 279
GTCC-6 2030 450 405 2 126 279
GT-1 2029 140 140 1 43 97
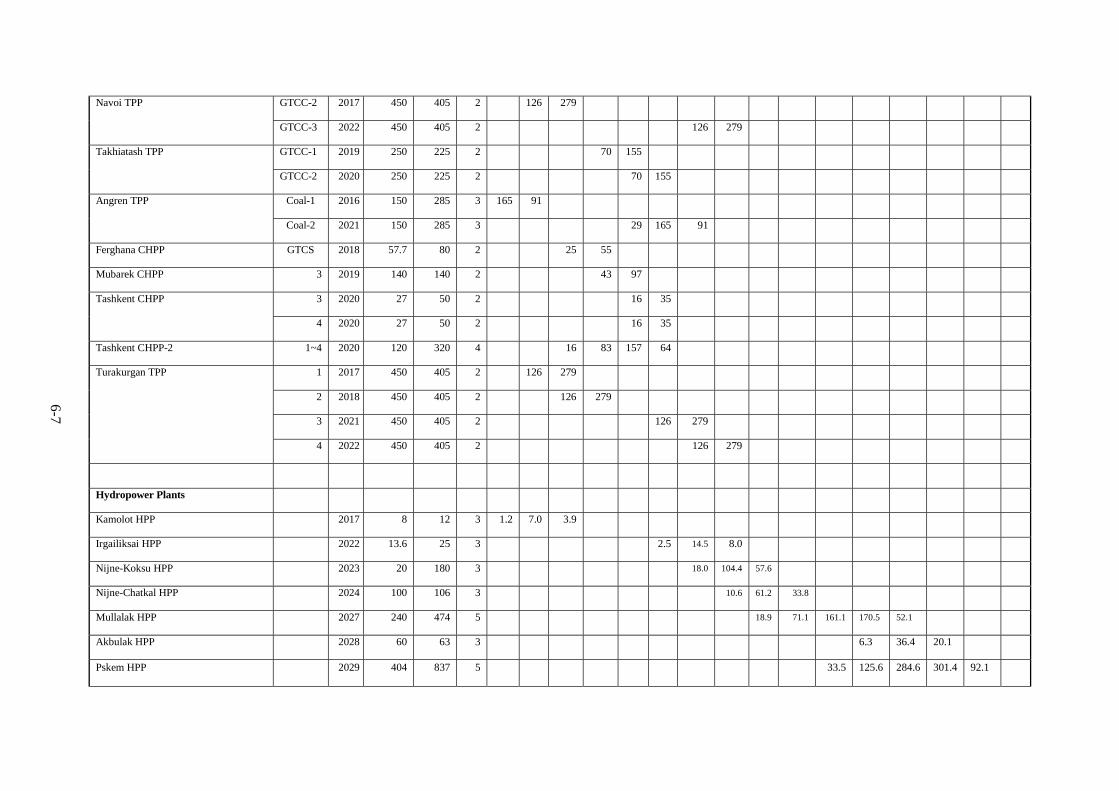
6-7
Navoi TPP GTCC-2 2017 450 405 2 126 279
GTCC-3 2022 450 405 2 126 279
Takhiatash TPP GTCC-1 2019 250 225 2 70 155
GTCC-2 2020 250 225 2 70 155
Angren TPP Coal-1 2016 150 285 3 165 91
Coal-2 2021 150 285 3 29 165 91
Ferghana CHPP GTCS 2018 57.7 80 2 25 55
Mubarek CHPP 3 2019 140 140 2 43 97
Tashkent CHPP 3 2020 27 50 2 16 35
4 2020 27 50 2 16 35
Tashkent CHPP-2 1~4 2020 120 320 4 16 83 157 64
Turakurgan TPP 1 2017 450 405 2 126 279
2 2018 450 405 2 126 279
3 2021 450 405 2 126 279
4 2022 450 405 2 126 279
Hydropower Plants
Kamolot HPP 2017 8 12 3 1.2 7.0 3.9
Irgailiksai HPP 2022 13.6 25 3 2.5 14.5 8.0
Nijne-Koksu HPP 2023 20 180 3 18.0 104.4 57.6
Nijne-Chatkal HPP 2024 100 106 3 10.6 61.2 33.8
Mullalak HPP 2027 240 474 5 18.9 71.1 161.1 170.5 52.1
Akbulak HPP 2028 60 63 3 6.3 36.4 20.1
Pskem HPP 2029 404 837 5 33.5 125.6 284.6 301.4 92.1
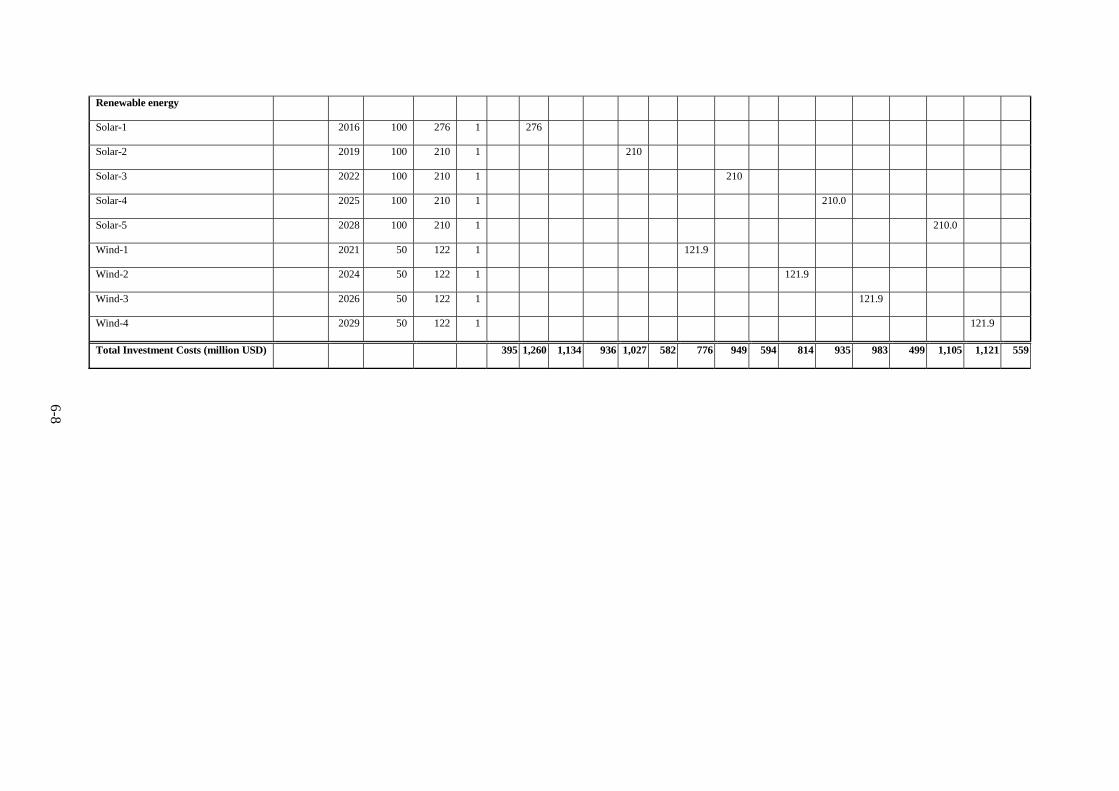
6-8
Renewable energy
Solar-1 2016 100 276 1 276
Solar-2 2019 100 210 1 210
Solar-3 2022 100 210 1 210
Solar-4 2025 100 210 1 210.0
Solar-5 2028 100 210 1 210.0
Wind-1 2021 50 122 1 121.9
Wind-2 2024 50 122 1 121.9
Wind-3 2026 50 122 1 121.9
Wind-4 2029 50 122 1 121.9
Total Investment Costs (million USD) 395 1,260 1,134 936 1,027 582 776 949 594 814 935 983 499 1,105 1,121 559

6-9
Table 5.2-2 Volume of power supply, the revenues based on the power development plan and loan repayment plan
Year
Outflow (USD, million) Electricity Production/Distribution Inflow (USD, million)
Cash Balance
New
Inv
estm
ent
Fuel
cos
t for
The
rmal
Po
wer
Pla
nts
O&
M c
osts
for
The
rmal
Po
wer
Pla
nts
O&
M c
osts
for
Hyd
ro
Pow
er P
lant
s
UFRD Loan
Tot
al O
utfl
ow
The
rmal
Pow
er P
lant
s ca
paci
ty (
GW
h)
Hyd
ro P
ower
Pla
nts
capa
city
(G
Wh)
Tot
al
Pow
er g
ener
atio
n (G
Wh)
Tot
al E
lect
rici
ty
Dis
trib
utio
n af
ter
Los
s (G
Wh)
Rev
enue
fro
m
inve
stm
ent i
n on
e ne
w
pow
er p
lant
UFR
D L
oan
Inte
rest
dur
ing
cons
truc
tion
Tot
al in
flow
Deb
t
re
paym
ent
Inte
rest
1 2015 395 0 0 0 395 0 0 0 0 0 384 12 396 0
2 2016 1,260 67 31 0 1,358 4,181 0 4,181 3,512 150 1,162 46 1,358 0
3 2017 1,134 111 54 0 1,299 7,620 31 7,651 6,427 274 950 75 1,299 (0)
4 2018 936 165 80 0 1,181 11,223 31 11,254 9,454 404 682 95 1,181 0
5 2019 1,027 268 131 0 1,426 18,255 31 18,286 15,361 656 655 115 1,426 (0)
6 2020 582 383 187 0 1,152 25,519 31 25,550 21,462 916 117 119 1,152 (0)
7 2021 776 470 233 0 1,479 30,966 31 30,998 26,038 1,111 242 126 1,479 (0)
8 2022 949 533 270 1 1,753 35,608 84 35,692 29,982 1,280 337 136 1,753 (0)
9 2023 594 553 276 1 1,424 37,307 162 37,469 31,474 1,343 0 136 1,479 55
10 2024 814 634 316 5 1,769 40,466 551 41,018 34,455 1,471 157 141 1,768 (0)
11 2025 935 677 338 5 0 1,955 43,738 551 44,289 37,203 1,588 226 141 1,955 (0)
12 2026 983 746 377 5 0 2,111 48,854 551 49,405 41,500 1,771 192 147 2,111 (0)
13 2027 499 768 384 12 0 1,663 50,857 1,486 52,343 43,968 1,877 0 153 2,030 367
14 2028 1,105 819 408 14 0 2,347 54,710 1,720 56,430 47,401 2,023 171 153 2,347 0
15 2029 1,121 891 448 27 0 2,487 59,251 3,294 62,545 52,538 2,243 86 158 2,487 (0)
16 2030 559 961 486 27 357 2,391 64,621 3,294 67,915 57,048 2,435 161 2,596 205
17 2031 961 486 27 357 150 1,982 64,621 3,294 67,915 57,048 2,435 2,435 453
18 2032 961 486 27 357 139 1,972 64,621 3,294 67,915 57,048 2,435 2,435 464
19 2033 961 486 27 357 129 1,961 64,621 3,294 67,915 57,048 2,435 2,435 474
20 2034 961 486 27 357 118 1,950 64,621 3,294 67,915 57,048 2,435 2,435 485
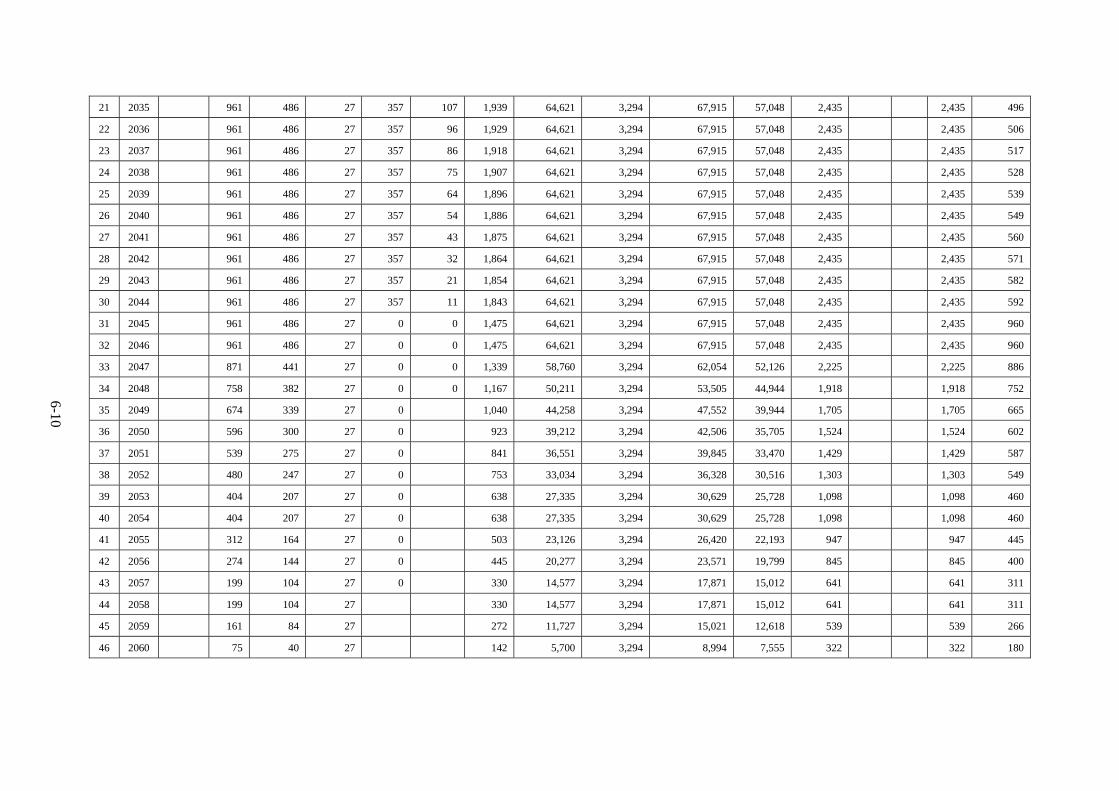
6-10
21 2035 961 486 27 357 107 1,939 64,621 3,294 67,915 57,048 2,435 2,435 496
22 2036 961 486 27 357 96 1,929 64,621 3,294 67,915 57,048 2,435 2,435 506
23 2037 961 486 27 357 86 1,918 64,621 3,294 67,915 57,048 2,435 2,435 517
24 2038 961 486 27 357 75 1,907 64,621 3,294 67,915 57,048 2,435 2,435 528
25 2039 961 486 27 357 64 1,896 64,621 3,294 67,915 57,048 2,435 2,435 539
26 2040 961 486 27 357 54 1,886 64,621 3,294 67,915 57,048 2,435 2,435 549
27 2041 961 486 27 357 43 1,875 64,621 3,294 67,915 57,048 2,435 2,435 560
28 2042 961 486 27 357 32 1,864 64,621 3,294 67,915 57,048 2,435 2,435 571
29 2043 961 486 27 357 21 1,854 64,621 3,294 67,915 57,048 2,435 2,435 582
30 2044 961 486 27 357 11 1,843 64,621 3,294 67,915 57,048 2,435 2,435 592
31 2045 961 486 27 0 0 1,475 64,621 3,294 67,915 57,048 2,435 2,435 960
32 2046 961 486 27 0 0 1,475 64,621 3,294 67,915 57,048 2,435 2,435 960
33 2047 871 441 27 0 0 1,339 58,760 3,294 62,054 52,126 2,225 2,225 886
34 2048 758 382 27 0 0 1,167 50,211 3,294 53,505 44,944 1,918 1,918 752
35 2049 674 339 27 0 1,040 44,258 3,294 47,552 39,944 1,705 1,705 665
36 2050 596 300 27 0 923 39,212 3,294 42,506 35,705 1,524 1,524 602
37 2051 539 275 27 0 841 36,551 3,294 39,845 33,470 1,429 1,429 587
38 2052 480 247 27 0 753 33,034 3,294 36,328 30,516 1,303 1,303 549
39 2053 404 207 27 0 638 27,335 3,294 30,629 25,728 1,098 1,098 460
40 2054 404 207 27 0 638 27,335 3,294 30,629 25,728 1,098 1,098 460
41 2055 312 164 27 0 503 23,126 3,294 26,420 22,193 947 947 445
42 2056 274 144 27 0 445 20,277 3,294 23,571 19,799 845 845 400
43 2057 199 104 27 0 330 14,577 3,294 17,871 15,012 641 641 311
44 2058 199 104 27 330 14,577 3,294 17,871 15,012 641 641 311
45 2059 161 84 27 272 11,727 3,294 15,021 12,618 539 539 266
46 2060 75 40 27 142 5,700 3,294 8,994 7,555 322 322 180

Chapter 7 Environmental and Social
Considerations

7-1
Chapter 7 Environmental and Social Considerations
7.1 Strategic Environmental Assessment (SEA)
7.1.1 Laws, regulations and organizations related to Environmental and Social
Considerations
(1) Legal framework
The legislation of the Republic of Uzbekistan in the field of protection and use of natural resources
and environmental protection consists of laws, Presidential Decrees, decisions of the Government,
departmental normative legal acts, and also local acts of local authorities.
The Constitution of the Republic of Uzbekistan establishes principles of environmental legislation.
It is reflected in Article 55, defining that the earth, its subsoil, waters, flora and fauna and other
natural resources are national wealth, and shall be rationally used and protected by the state; in Article
47&48, defining responsibilities of citizens to observe the Constitution and law; in Article 50,
establishes the obligation of citizens to use surrounding environment sparingly; in Article 51, obliging
citizens to pay statutory taxes and other constitutional provisions defining powers of state authorities,
including in the field of regulation of the environmental relations.
The legislation system in the field of regulation of relations on nature management and
environmental protection consists of the following areas of environmental legislation: land, water,
mining, legislation on flora and fauna, as well as environmental protection.
The main act regulating environmental relations is the Law from December 9, 1992 “On
Environmental Protection.” Followings are the basic but important laws in the field of
environmental protection:
• The Law of the Republic of Uzbekistan «On environmental protection» (December 9
1992, No. 754-XII)
• The Law of the Republic of Uzbekistan «On water and water use» (May 6, 1993, No.
837-XII)
• The Law of the Republic of Uzbekistan «On protection of atmospheric air» (December
27, 1996, No. 353-I)
• The Law of the Republic of Uzbekistan «On protection and use of flora» (December 26,
1997, No.543-I)
• The Law of the Republic of Uzbekistan «On protection and use of fauna» (December 26,
1997, No.545-I)
• Land Code of the Republic of Uzbekistan (April 30 1998, No.599-I)
• The Law of the Republic of Uzbekistan «On forest» (April 15, 1999, No.770-I)
• The Law of the Republic of Uzbekistan «On protection of the population and territories
against emergency situations of natural and technogenic nature» (August 20, 1999,
7-2
No.824-I)
• The Law of the Republic of Uzbekistan «On ecological expertise» (May 25, 2000,
No.73-II)
• The Law of the Republic of Uzbekistan «On radiation safety» (August 31, 2000,
No.120-II)
• The Law of the Republic of Uzbekistan «On protection of agricultural plants against
pests, diseases and weeds» (August 31, 2000, No.116-II)
• The Law of the Republic of Uzbekistan «On waste» (April 5, 2002, No.362-II)
• The Law of the Republic of Uzbekistan «On subsoil» (New edition), (December 13,
2002, No.444-II)
• The Law of the Republic of Uzbekistan «On protected natural territories» (December 3,
2004, No.710-II)
• The Law of the Republic of Uzbekistan «About ratification of Amendments to the
Montreal protocol on the substances that deplete the ozone layer» (September 7, 2006,
No.ZRU-44, 45)
Any laws in relation to the SEA have not been enacted as of April 2015.
(2) Environmental Impact Assessment (EIA)
1) Outline of the EIA in Uzbekistan
On May 25, 2000 Oliy Majlis (Parliament) of the Republic of Uzbekistan enacted law of the
Republic of Uzbekistan “On Ecological Expertise,” which, along with the Law “On Environmental
Protection” provides the basis of materials of the environmental impact assessment. Specially
authorized state body in the State Ecological Expertise is the State Committee for Nature Protection
of the Republic of Uzbekistan (Article 12).
According to Annex 2 of the Resolution No.491 dated December 31, 2001 “Regulations on the
State Ecological Expertise in the Republic of Uzbekistan,” all economic activities in Uzbekistan are
divided into four categories (categories I-IV), depending on the degree of the potential impact.
Category I and II should be under the control of Goskompriroda (State Committee of the Republic of
Uzbekistan for Nature Protection), and Category III and IV should be under the Regional
Goskompriroda for approval process.
The EIA category of a power plant varies by plant capacity: over 300 MW to be category I,
between 100 and 300 MW to be category II, and less than 100 MW to be category III. The related
projects of power transmission lines and gas pipeline developments are under the category II, and
required for EIA preparation. Besides, any projects considered in the protected/vulnerable lands or
inter-regional development shall be considered as category I, but there is no size or scale based
definition between categories.
Plan of EIA procedure difference by category is shown in Table 7.1.1-1.

7-3
Table 7.1.1-1 EIA procedure difference by category
Point Category I Category Ⅱ Category Ⅲ Category Ⅳ Preparation of pre-project and project documentation before commissioning of the object
Stage I. EIA Draft Stage II EIA*
Stage III Statement of environmental effects (SEE)
Stage I. EIA Draft Stage II EIA*
Stage III SEE
Stage I. EIA Draft
Stage II SEE
EIA Draft
Considering authorities Goskompriroda Goskompriroda Regional Goskompriroda
Regional Goskompriroda
Fee for petition to conduct expertise of the application
Minimum salary of 25 people
Minimum salary of 15 people
Minimum salary of 7.5 people
Minimum salary of 1 person
Period of the ecological expertise
30 days (By the decision of Goskompriroda on complicated objects period may be extended, but not more than 2 months)
30 days (By the decision of Goskompriroda on complicated objects period may be extended, but not more than 2 months)
20 days 10 days
*Developed only on demand of Goskompriroda by results of consideration the EIA Draft, in case of insufficiency of data to establish the impact on the environment. Source: Goskompriroda
2) Procedure of the EIA
As defined in the Regulations No.491, the development of EIA materials is composed of 3 stages,
which are carried out in the following sequence: Draft EIA during the planning stage; EIA, on
demand of Goskompriroda in case of the need for further research; and the development of the
Statement of environmental effects (SEE) of an object on the environment before commissioning.
【Planning stage】
I. Preparation of the EIA Draft
EIA Draft should be prepared at the planning stage of the project and submitted to the
State Committee for Nature Protection. The validity of conclusions of Goskompriroda is
three (3) years. In case of the expiration of the validity of Conclusion or changes during
the design process, the EIA Draft must undergo state geological expertise again.
II. EIA
When considering the EIA Draft, in case that lack of data and/or the results of the survey
is identified, Goskompriroda makes decision on the redevelopment of EIA.
【Preparation stage for commissioning of the object】
Statement of environmental effects (environmental regulations for the enterprise) is the
final stage of the EIA procedure, and must be prepared and submitted to Goskompriroda
before commercial exploitation of projected object.
Commissioning of the facility is not permitted without a positive conclusion of
Goskompriroda of Uzbekistan, in which environmental standards for emissions, discharges

7-4
and wastes, for which the company makes payments, as well as action plans to reduce the
impact on air, water and waste management are approved.
This procedure is similar to the approval procedure of the application for
pre-commissioning stage in Japan.
The following Figure 7.1.1-1 illustrates typical procedure of the EIA activities.

7-5
Source: JICA Study Team
Figure 7.1.1-1 Procedure of EIA in Uzbekistan
State Environmental Expertise (SEE) Department of State
Committee for Nature Protection of the Republic of Uzbekistan – conducting of the environmental expertise (for the objects of I-II
categories the period of consideration is 30 days), for
complex objects – the period of consideration is up to 2 months; regional bodies of SEE – for the
objects of III category (the period of consideration is 20 days) and
for the objects of IV category (the period of consideration is 10 days). For complex objects of III-IV categories the period of
consideration is extended up to 1 month.
Issue of conclusion for EIA, which is valid for
3 years
Regional Committee for Nature Protection or the relevant
inspections of the territorial committees for control (for the
objects of III-IV categories)
Bank or credit institution – for financing
The application letter for EIA development to
environmental consultant
Submission of EIA for expertise
Positive reply?
Transfer of the conclusion for EIA to the competent
authorities and to the implementing organization
Decision to proceed
with EIA
Submitting the remarks for revision
of the project
Rejection of the expected activity
Yes
No
Pass
Fail
Development of first stage of EIA (Project of the Application for
Environmental Impact Assessment (EIA Application))
Submission of EIA for the confirmation
and approval
Development of second stage of EIA (Application for
Environmental Impact Assessment) – exclusively
by the request of SEE in the conclusion for the EIA
Application or at final stage of EIA – Environmental Impact Statement (EIS)
Revision of the materials for EIA according to the
remarks of SEE.
If the second stage of EIA is requested by SEE
Completion of EIA
Project Implementation

7-6
3) Public Consultations
In Uzbekistan, public meeting as part of the EIS or the SEA is not particularly regulated in the
Resolution of the Cabinet of Ministers No.491. Article 11 of the aforementioned Resolution states
that the results of the public consultation should be described, if necessary, in the development of
Stage II of the EIA – Environmental Impact Statement. As a practice of EIA material development
shows, Goskompriroda of Uzbekistan necessarily requires public hearings in problem areas of the
projected objects (without breaks with residential buildings, or non-compliance with the size of the
sanitary protection zone or in the prediction of level increase of noise and air emissions) in order to
decrease in a degree of concern at people, opportunity to explain the presence of actions to reduce the
impact to standard level. For power generation projects in Uzbekistan, public meeting is usually
held by the company as instructed that produces electric power within the environmental impact
assessment, in case if project location is in close proximity to residential areas.
4) Comparison between JICA’s ESC Guidelines and Uzbekistan EIA Laws
The result of comparison between JICA’s ESC Guidelines and Uzbekistan EIA Laws is shown in
Table 7.1.1-2. In the EIA laws of Uzbekistan, items such as information disclosure of the EIA and
public consultations are not the obligation of project proponents. In addition, necessity of social
considerations is not sufficiently mentioned in the EIA laws of Uzbekistan in comparison with JICA’s
ESC Guidelines.
Table 7.1.1-2 Comparison between JICA Guidelines and Uzbekistan EIA Laws
No. Item JICA Guidelines EIA Laws of Uzbekistan Gaps
1 Information disclosure
In principle, project proponents etc. disclose information about the environmental and social considerations of their projects.
Project proponents etc. are able to disclose information about the EIA of their projects.
As project proponents are not obliged to disclose the information about the EIA in Uzbekistan legal norms, there is no equivalence.
2 Categorization -Category A for a project in which significant adverse impacts on the environment and society are expected -Category B for a project whose potential adverse impacts are less than those of Category A projects -Category C for a project which has minimal or little adverse impact -Category FI
-Category I for a project which has high risks of environmental deterioration -Category II for a project which has middle risks of environmental deterioration -Category III for a project in which minimal negative impact is expected -Category IV for a project in which little negative impact is expected and which is the subject to draft EIA only
There is no equivalence since the consideration of adverse impacts on the society as classification criteria of the categories is not clearly and broadly mentioned in Uzbekistan legal norms.

7-7
No. Item JICA Guidelines EIA Laws of Uzbekistan Gaps
3 Impacts to be assessed
As shown in scoping items in Table 7.2.2-1 below
Items of social consideration such as poor people, ethnic minorities, social capital and social organizations, gender, rights of the child, and infectious diseases, etc. are not mentioned in Uzbekistan legal norms.
As some items are not included in Uzbekistan legal norms, there is no equivalence.
4 Public consultations
In principle, project proponents etc. consult with local stakeholders through means that induce broad public participation to a reasonable extent, in order to take into consideration the environmental and social factors in a way that is most suitable to local situations, and in order to reach an appropriate consensus.
The results of the public consultation should be described, if necessary, in the development of the EIA.
As project proponents are not obliged to implement public consultations, there is no equivalence.
Source: JICA Study Team
(3) Land acquisition and resettlement
1) Codes and resolutions on land acquisition and resettlement
There are no laws or legislation, especially on matters concerning specifically the acquisition of
land and resettlement. Land acquisition and resettlement are regulated by the following laws:
Civil Code: This code, adopted by the Oliy Majlis of the Republic of Uzbekistan, No.
257-I dated 29 August 1996, was amended in accordance with the laws of the Republic of
Uzbekistan of 1996-2012.
Land Code: This Code was approved by Law of the Republic of Uzbekistan No. 598-I
dated 30 April 1998, and amended under Section XIX of the Legislation Act of the
Republic of Uzbekistan dated 30 August 2003, Para 41 of Legislative Act of the Republic
of Uzbekistan dated 3 December 2004. Amendments govern matters relating to the
release and the withdrawal of land for non-agricultural purposes and compensation for
losses of agricultural production.
State Land Cadastre: This law was approved by the Parliament of the Republic of
Uzbekistan by Act No. 666-I dated 28 August 1998, and it was amended in accordance
with the laws of the Republic of Uzbekistan of 2002-2004.
State Cadastre: This law was approved by the Parliament of the Republic of Uzbekistan
by Act No. 171-II dated 15 December 2000, and it was amended in accordance with the
laws of the Republic of Uzbekistan of 2002-2011.
7-8
The key legal instruments are the Land Code and the following Resolutions of the Cabinet of
Ministers of the Republic of Uzbekistan as listed:
The Resolution of the Cabinet of Ministers No. 146 dated 25 May 2011 “On Measures to
Improve the Provision of Land for Urban Construction and other Non-Agricultural
Needs”
Resolution of the Cabinet of Ministers No. 54 dated 25 February 2013 “On Measures to
Radically Simplify the System of Lands Provision for Urban Construction and other
Non-Agricultural Needs, as well as the Issuance of Permits for Construction of Facilities”
According to the Land Code, all the land in the country are government property and land use
permits are provided and controlled by the government through the district, region and city
administrations. National legislation defines two types of land transfer: (a) For use, lease or
ownership by legal entities engaged in various kinds of trade and services for the inherited usage
throughout the life (with housing provision), and (b) for the use or rent by individuals. Since all land
belongs to the government, ultimately land plots cannot be sold without buildings on that land. In
case of certain lands, lands can be purchased only with buildings located on the subject land. A
similar provision applies to land used by legal entities (owners of trade or services facilities).
All the land occupied by permanent structures necessary for the project, in particular, the
transmission lines, wells, sewer and river outlets, water-measuring devices, manifolds and relative
safety perimeters (“sanitary zone”) are provided by the Government of the Republic of Uzbekistan
through local authorities and remain the property of the Government of the Republic of Uzbekistan
upon termination of the projects.
2) Rights for Land Use
According to the law of the Republic of Uzbekistan No. 598-I dated 30 April 1998, and amended
under Section XIX of the Legislation Act of the Republic of Uzbekistan dated 30 August 2003, all
land (both above and under-ground) is owned by the state government and registered to the central
government. General public and people can use the national land with land use permit issued by the
government.
3) Compensation and recovery policy
The legislation provides the payment of compensation for the damage caused by land users in full,
including loss of income, as in the following examples: (i) Seizure, purchase or temporary occupation
of lands; (ii) Restriction of the rights of users; and (iii) Land degradation as a result of construction
and maintenance and other activities that lead to a decrease in the quantity or quality of agricultural
products. In case of the acquisition of agricultural land, in addition to compensation for damages,
the legislation provides for compensation for the loss of agricultural production. The Land Code
defines the following user categories of arable lands, which are entitled to compensation for loss or
damage in connection with the acquisition of land:

7-9
Land owners: citizens who were allocated plots of land for private housing or agriculture,
based on the life of the property with right to inheritance.
Leaseholders: farmers who were allocated plots of land for agricultural production on the
basis of long-term leasing.
Land users: users of land plots occupied by merchants and services which are used as
private property.
Other land users: all other enterprises and institutions which are entitled to use
non-agricultural land. It is the largest category, which includes businesses and institutions
of all types (private and public). Examples include hospitals, schools, businesses and
factories.
Analysis of the legal framework governing land acquisition for public use reveals that in
Uzbekistan the following guidelines are observed:
Compensation to affected families rebuilds their pre-project income and standard of
living after the resettlement.
Affected families are entitled to compensation for the full replacement cost for lost assets,
including temporary loss or impacts.
Compensation is fully provided up to the acquisition of land for construction or
demolition.
Affected families are consulted during the preparation and implementation of
resettlement.
Affected families fully informed of their options for compensation.
Mechanisms for complaints about compensation are established.
All the affected families receive compensation regardless of the legal status of land use
and land resources.
Provision of equivalent lands is the preferred type of compensation for lost land, if the
aggrieved family does not select a monetary compensation.
Compensation is available, giving equal emphasis to women and men.
In the law of the Republic of Uzbekistan, the cut-off date resettlement is defined as the date, when
the district division office of the State Committee for Land Resources, Geodesy, Cartography and
State Cadaster signs the Certificate of agreement for purchase of lands.

7-10
The cut-off date, however, in LARAP shall be set to the date in which the first public consultation
is held, and the project outline and its environmental and social impact should be explained to the
local residents.
Recovery policy in respect of the acquisition of land is as follows:
Compensation for loss of property is carried out on the basis of full recovery of the
replacement cost, regardless of the legal status of land and land use rights.
The level of income and life should be protected until the implementation of the project.
Loss of rights to land and agricultural production means are reimbursed on the basis of
the Resolution of the Cabinet of Ministers of the Republic of Uzbekistan No. 54 dated 25
February 2013.
Loss of the right to use of land is compensated with the provision of alternative lands, or
money, if the affected families wish to be refunded by money. The District Administration
is not responsible for the arrangement of alternative lands. Affected households have the
opportunity to choose alternative lands among the lands offered by the district
administration.
4) Grievance System
Complaints may be received from the public concerning the assessments, payments, other forms of
reimbursement or assistance, as well as other aspects of the project implementation, for example, the
effects of the construction. In this regard, the following mechanisms should be involved to ensure that
all complaints are processed and administrative authorities are taking steps to address the matter.
Initially, the aggrieved person may lodge a complaint with the District Administration Office,
which will register the complaint and take action to address it. A committee - comprising
representatives of the cadaster, agronomists, and the tax authority, Chairmen of local committees and
officials of the project proponent - is organized. If the applicant receives a satisfactory evaluation,
he/she can hire an independent evaluator and submit evaluations of the land for decision of the
Committee. By enabling farmers to the Committee, the risk of complaints is minimal, and the
possibility for compromise among stakeholders will be maximized. However, should complaints not
be resolved in two weeks, a claim is transferred to the regional administration.
At the level of regional administration a complaint is considered by the Commission, similar to the
district administration, which includes the Chairmen of the respective regional authorities and
representatives of the project proponent. The responsible authority in the regional administration
receives and registers complaints and takes action to resolve the situation. The applicant may also
take legal action, should the district or regional authority not be capable to resolve the issue.
Reports and claims processing procedures are controlled by employees of the Project Management
Unit responsible for internal monitoring and evaluation. Any person, who is not satisfied with their

7-11
complaints, should contact the Project Management Unit directly at any time to request assistance in
the search for a settlement of the complaint. During public consultations detailed information shall be
provided to the local population.
5) Implementation System and Organizational Structure
Procedures, functions and powers of the bodies responsible for implementation and compliance
procedures for the purchase of land for purposes other than agriculture and forestry shall be
established by Resolution of the Cabinet of Ministers No. 54 dated 25 February 2013.
The extent of the losses of owners, users, leaseholders and owners of land plots due to withdrawal
(redemption) of their lands and the sizes of the losses in the agricultural and forestry production are
determined in the manner prescribed by Resolutions of the Cabinet of Ministers No. 97 dated 29 May
2006 “On Approval of the Regulation on the Procedure for Compensation of Damages to Citizens and
Legal Entities in Connection with the Withdrawal of Lands for Public Purposes,” and No. 146 dated
25 May 2011 “On Measures to Improve the Provision of Land for the Implementation of Urban
Construction and other Non-Agricultural Need.” (In the presence of damages and losses).
1. Specify the location of the structures and facilities provided by the project;
2. Select land plots for construction;
3. Prepare and approves certificates of land acquisition agreement; and
4. Approve certificates for the right to land use specifying area of acquired lands for
agricultural crops, agreed terms and total loss costs from agricultural production. The
Commission, together with the permanent members, also includes representatives of
companies or organizations that are allocated with lands for construction and agricultural
organizations from which land plots are being purchased.
Losses of agricultural production are assessed by the Evaluation Commission, which is established
by order of the Governor of the district administration, together with the definition of losses incurred
by the landowners and land users, due to the acquisition of land for public use, based on information
submitted to the Design Institute, which has developed a plan for the acquisition of land.
Conclusions of the Evaluation Commission are executed as certificates for the right to land use
specifying area of acquired lands for agricultural crops, agreed terms and total loss costs from
agricultural production.
Upon request of the Division (Department) for architecture and construction of the district (City)
for the inclusion of material of land allocation, within five days the competent authorities shall submit
the following conclusions:
Conclusion of relevant Goskompriroda authority on State Ecological Expertise for
facilities stipulated by Resolution No. 491 dated 31 December 2001 “On Approval of the
Regulations on State Ecological Expertise in the Republic of Uzbekistan”;

7-12
Conclusion of the Department for Land Resources and the State Cadastre of District
(City);
Conclusion of District (City) Sanitary-Epidemiological Service; and
Conclusion of territorial body of the State Fire Inspectorate.
6) Comparison between JICA’s ESC Guideline/WB Safeguard Policy and Uzbekistan EIA
Laws in Terms of Land Acquisition and Resettlement
The result of comparison between JICA’s ESC Guideline/WB Safeguard Policy and Uzbekistan
EIA Laws in terms of land acquisition and Resettlement is shown in Table 7.1.1-3. In the EIA laws
of Uzbekistan, there is no provision of such items as exploring all viable alternatives in the case of
involuntary resettlement (No.1), preparation of the RAP (No.6), and the manner of public
consultations which should be understandable to the affected people (No.8), etc.
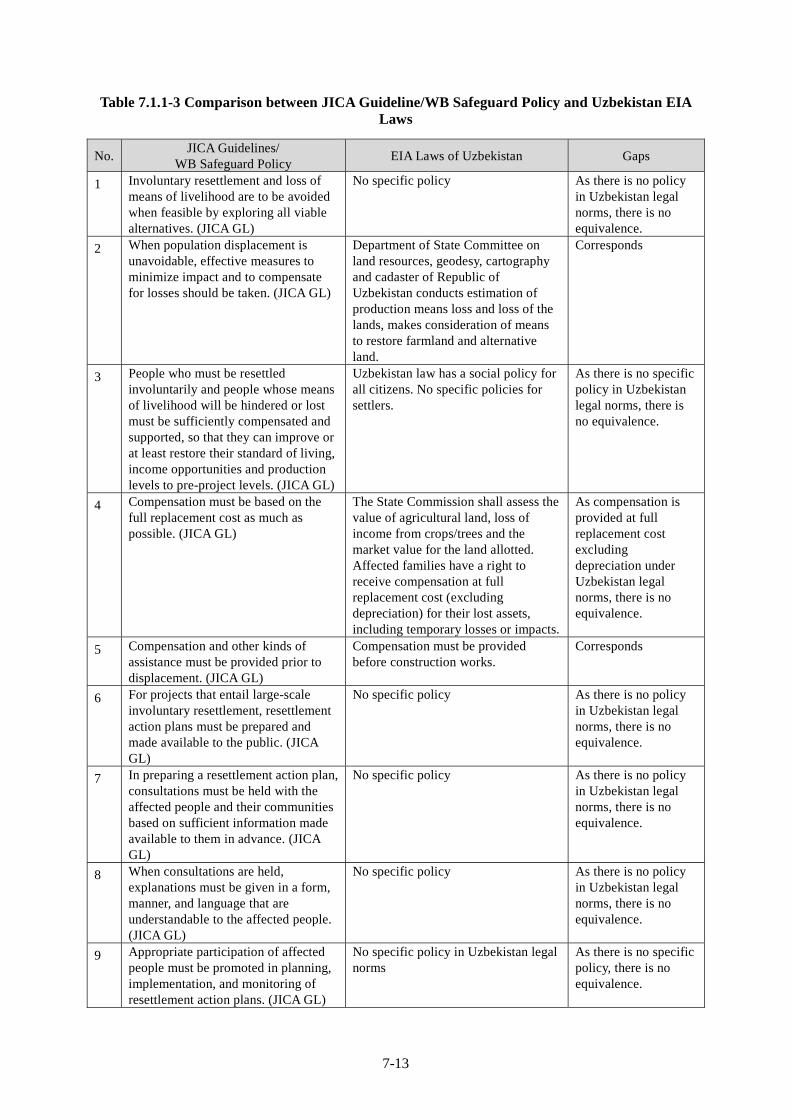
7-13
Table 7.1.1-3 Comparison between JICA Guideline/WB Safeguard Policy and Uzbekistan EIA Laws
No. JICA Guidelines/
WB Safeguard Policy EIA Laws of Uzbekistan Gaps
1 Involuntary resettlement and loss of means of livelihood are to be avoided when feasible by exploring all viable alternatives. (JICA GL)
No specific policy As there is no policy in Uzbekistan legal norms, there is no equivalence.
2 When population displacement is unavoidable, effective measures to minimize impact and to compensate for losses should be taken. (JICA GL)
Department of State Committee on land resources, geodesy, cartography and cadaster of Republic of Uzbekistan conducts estimation of production means loss and loss of the lands, makes consideration of means to restore farmland and alternative land.
Corresponds
3 People who must be resettled involuntarily and people whose means of livelihood will be hindered or lost must be sufficiently compensated and supported, so that they can improve or at least restore their standard of living, income opportunities and production levels to pre-project levels. (JICA GL)
Uzbekistan law has a social policy for all citizens. No specific policies for settlers.
As there is no specific policy in Uzbekistan legal norms, there is no equivalence.
4 Compensation must be based on the full replacement cost as much as possible. (JICA GL)
The State Commission shall assess the value of agricultural land, loss of income from crops/trees and the market value for the land allotted. Affected families have a right to receive compensation at full replacement cost (excluding depreciation) for their lost assets, including temporary losses or impacts.
As compensation is provided at full replacement cost excluding depreciation under Uzbekistan legal norms, there is no equivalence.
5 Compensation and other kinds of assistance must be provided prior to displacement. (JICA GL)
Compensation must be provided before construction works.
Corresponds
6 For projects that entail large-scale involuntary resettlement, resettlement action plans must be prepared and made available to the public. (JICA GL)
No specific policy As there is no policy in Uzbekistan legal norms, there is no equivalence.
7 In preparing a resettlement action plan, consultations must be held with the affected people and their communities based on sufficient information made available to them in advance. (JICA GL)
No specific policy As there is no policy in Uzbekistan legal norms, there is no equivalence.
8 When consultations are held, explanations must be given in a form, manner, and language that are understandable to the affected people. (JICA GL)
No specific policy As there is no policy in Uzbekistan legal norms, there is no equivalence.
9 Appropriate participation of affected people must be promoted in planning, implementation, and monitoring of resettlement action plans. (JICA GL)
No specific policy in Uzbekistan legal norms
As there is no specific policy, there is no equivalence.
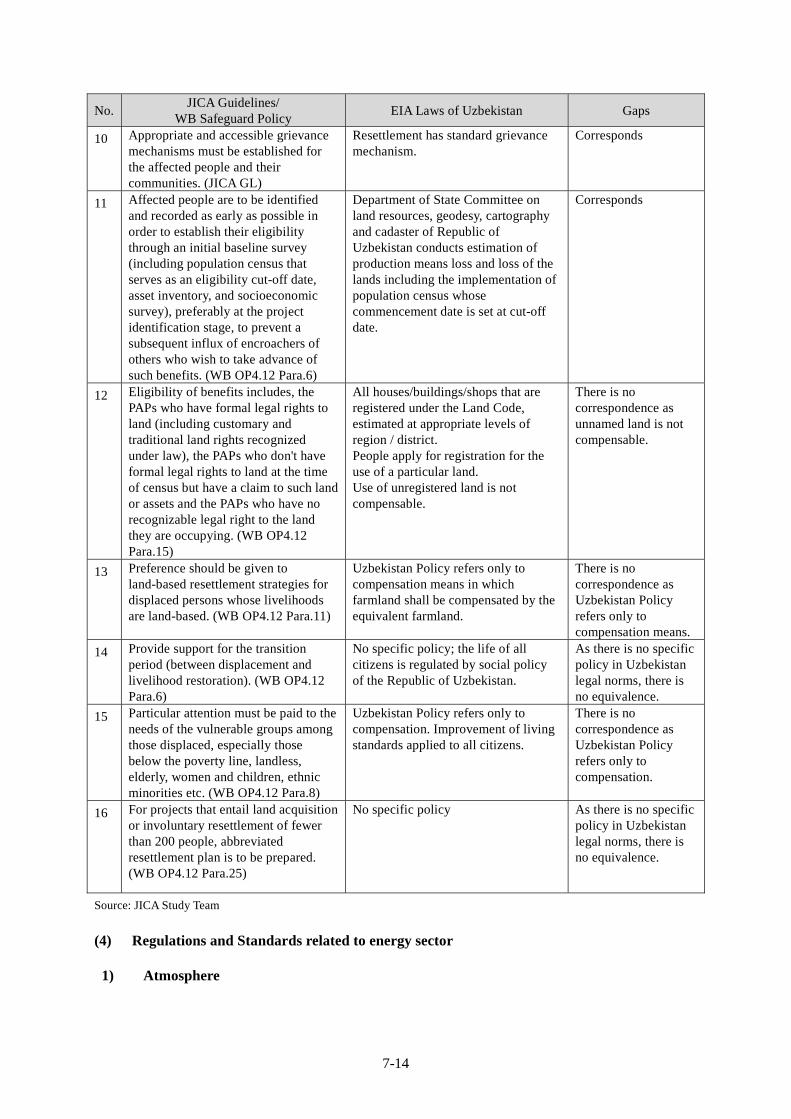
7-14
No. JICA Guidelines/
WB Safeguard Policy EIA Laws of Uzbekistan Gaps
10 Appropriate and accessible grievance mechanisms must be established for the affected people and their communities. (JICA GL)
Resettlement has standard grievance mechanism.
Corresponds
11 Affected people are to be identified and recorded as early as possible in order to establish their eligibility through an initial baseline survey (including population census that serves as an eligibility cut-off date, asset inventory, and socioeconomic survey), preferably at the project identification stage, to prevent a subsequent influx of encroachers of others who wish to take advance of such benefits. (WB OP4.12 Para.6)
Department of State Committee on land resources, geodesy, cartography and cadaster of Republic of Uzbekistan conducts estimation of production means loss and loss of the lands including the implementation of population census whose commencement date is set at cut-off date.
Corresponds
12 Eligibility of benefits includes, the PAPs who have formal legal rights to land (including customary and traditional land rights recognized under law), the PAPs who don't have formal legal rights to land at the time of census but have a claim to such land or assets and the PAPs who have no recognizable legal right to the land they are occupying. (WB OP4.12 Para.15)
All houses/buildings/shops that are registered under the Land Code, estimated at appropriate levels of region / district. People apply for registration for the use of a particular land. Use of unregistered land is not compensable.
There is no correspondence as unnamed land is not compensable.
13 Preference should be given to land-based resettlement strategies for displaced persons whose livelihoods are land-based. (WB OP4.12 Para.11)
Uzbekistan Policy refers only to compensation means in which farmland shall be compensated by the equivalent farmland.
There is no correspondence as Uzbekistan Policy refers only to compensation means.
14 Provide support for the transition period (between displacement and livelihood restoration). (WB OP4.12 Para.6)
No specific policy; the life of all citizens is regulated by social policy of the Republic of Uzbekistan.
As there is no specific policy in Uzbekistan legal norms, there is no equivalence.
15 Particular attention must be paid to the needs of the vulnerable groups among those displaced, especially those below the poverty line, landless, elderly, women and children, ethnic minorities etc. (WB OP4.12 Para.8)
Uzbekistan Policy refers only to compensation. Improvement of living standards applied to all citizens.
There is no correspondence as Uzbekistan Policy refers only to compensation.
16 For projects that entail land acquisition or involuntary resettlement of fewer than 200 people, abbreviated resettlement plan is to be prepared. (WB OP4.12 Para.25)
No specific policy As there is no specific policy in Uzbekistan legal norms, there is no equivalence.
Source: JICA Study Team
(4) Regulations and Standards related to energy sector
1) Atmosphere

7-15
The maximum permissible concentration (MPC) for the protection of human health is set to
ambient air of populated areas and work area in Uzbekistan. Table 7.1.1-4 illustrates MPC and
hazard categories of main pollutants produced by emissions of thermal power plants. The 30 min
MPC value for NO2 in Uzbekistan is very strict comparing to the one hour average value of common
fundamental principles of IFC / WB EHS and environmental standards of EU.
Table 7.1.1-4 Regulation of Hazard Contents of the Main Pollutants Generated by Thermal Power Plant (MPC)
Pollutant
Maximum Permissible Concentration MPC)**
(mg/m3) Hazard category*
IFC / WB EHS Guideline Fundamental principles
(mg/m3 (2007))
EU Environmental standard(mg/m3)
30 min Daily average
Workzone
Nitrogen dioxide (NO2)
0,085 0,06 2,0 2 0,2 (on the average 1 hour)0.04 (annual average)
0,2 (on the average 1 hour)0.04 (annual average)
Nitrogen oxide (NO) 0,6 0,25 - 3 - -
Sulphur dioxide (SO2)
0,5 0,2 10,0 3 0.5(10 min) 0,125 (Daily average)
0,35 (on the average 1 hour)0,125 (daily average) 0.02 (annual average)
Carbon oxide (CO) 5,0 4,0 20,0 4 - -
Suspended particles (Dust)
0,15 0,1 - 3 0,15 (daily average) 0,07 (annual average)
0,05 (daily average) 0.04 (annual average)
Note:*Hazard category it is classified as follows according to the Russian standard: 1. Polluting substance of extreme danger 2. Polluting substance of high danger 3. Polluting substance of medium danger 4. Polluting substance of low danger Source: * * The sanitary norms, rules and hygienic standards of the Republic of Uzbekistan (San PiN №0179-04, Hygienic standards), the list of maximum permissible concentration (MPC) of pollutants in the ambient air of populated areas on the territory of the Republic of Uzbekistan") ※ Because Uzbekistan previously was a part of Soviet Union, the government utilizes any Russian regulations where there is no referring codes and regulations as the Uzbekistan government permits.
2) Emission
In the Republic of Uzbekistan the pollutants in the exhaust gas emitted by power plants are
regulated by the concentration of air pollutants in the surface layer of the atmosphere created by the
release from each exhaust pipe or chimney instead of the exhaust air quality at the emission point,
such as stack.
The standard values of maximum pollutant concentration calculated and they should not exceed the
value of MPC shown on Table 7.1.1-5. The surface layer MPC calculation should be made based on
the guideline1, and the result will be compared with the 30 minute MPC in order to set the
permissible exhaust air amount. The implementation agency, after the EIA approval is obtained,
must prepare Normative Document illustrates actual design and calculated air distribution for
approval by Goskompriroda, since the EIA reported figure is only assumption. According to the
1 Ministry of Justice, Reg. No. 1553 from 03.01.2006 “Guidelines for the inventory of pollution sources and regulation of
pollutants emission into the atmosphere for the enterprises of the Republic of Uzbekistan” , Tashkent, 2006

7-16
Approval on the Normative Document by Goskompriroda, final MPC figure of air emission and
quality that the implementation agency must comply with will be set.
Table 7.1.1-5 Quotas on Polluting Substances emitted in atmosphere by enterprises
Location Quota shares of MPC based on the class of risk of emitted substances
1 2 3 4Region: Tashkent, Fergana, Andijan, Namangan City: Navoi, Samarkand, Bukhara 0.17 0.20 0.25 0.33
Area: Bukhara, Djizak, Kashkadarya, Navoi, Samarkand, Surkhandarya, Syrdarya 0.20 0.25 0.33 0.50
The Republic of Karakalpakstan, the Khorezm province 0.25 0.33 0.50 1.00Source: Instruction on the inventory of sources of pollution and regulation of emissions into the atmosphere for the enterprises of the Republic of Uzbekistan, the Ministry of Justice of the EGR. No. 1553, Tashkent, 2006. Category 1, 2, 3 and 4 refers to the hazard category applied in Table 7.1.1-4.
The concentration of NOx should refer to Russian Standard (GOST 29328-92), shown in
Table 7.1.1-6 in this project, as there is no particular rules on concentrations of pollutants in
exhaust gases in Uzbekistan.
Table 7.1.1-6 Standard on Concentration of Pollutants in Emissions
The Polluter GOST 29328-92* Basic principle OOSMFK/WB for thermal power plant (2008)
Nitrogen oxides (NOx)
50 mg/Nm3
(25 mg/m3)50 mg/Nm3
(25 mg/m3)* GOST 29328-92: the plant turbine to drive the turbo generator Note: the dry gas, O2 = 15% Source: Ministry of Justice of the EGR
3) Water Quality
The discharged water also should comply with the regulation of surface water protection (San PiN
RUz No. 0172-04) as shown in Table 7.1.1-7, and the allowable water temperature increase is
maximum three (3) degree Celsius.
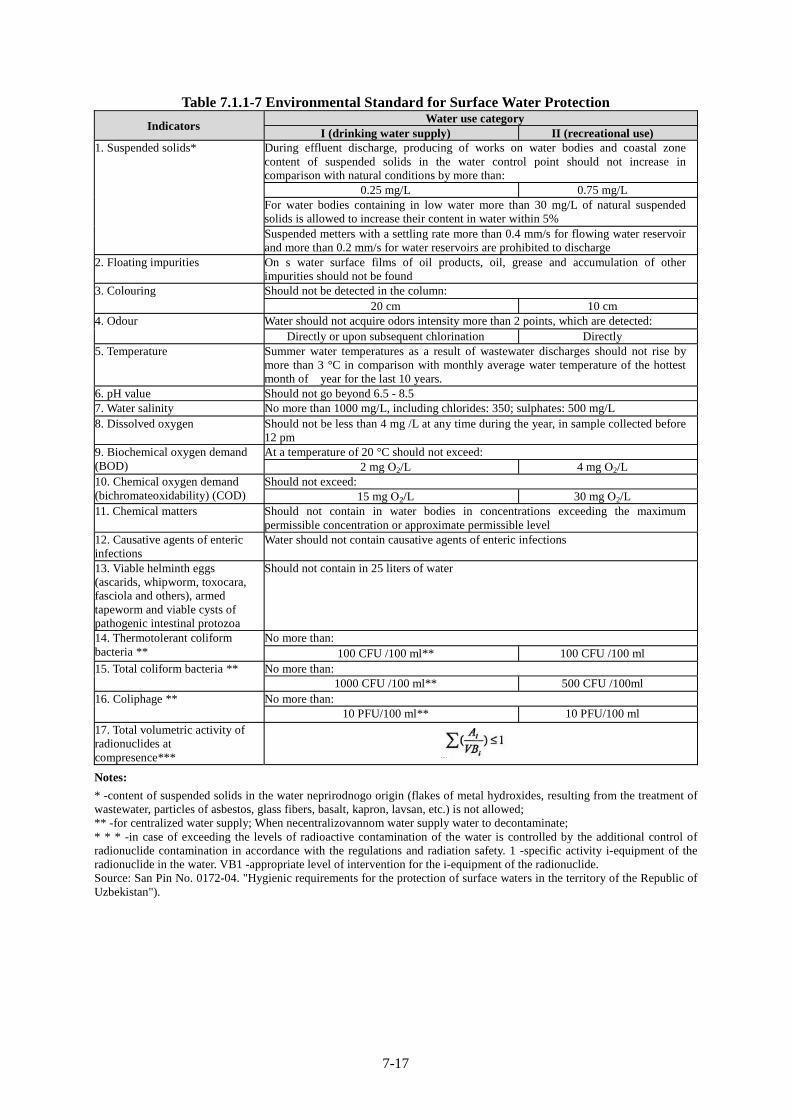
7-17
Table 7.1.1-7 Environmental Standard for Surface Water Protection
Indicators Water use category
I (drinking water supply) II (recreational use) 1. Suspended solids* During effluent discharge, producing of works on water bodies and coastal zone
content of suspended solids in the water control point should not increase in comparison with natural conditions by more than:
0.25 mg/L 0.75 mg/L For water bodies containing in low water more than 30 mg/L of natural suspended solids is allowed to increase their content in water within 5% Suspended metters with a settling rate more than 0.4 mm/s for flowing water reservoir and more than 0.2 mm/s for water reservoirs are prohibited to discharge
2. Floating impurities On s water surface films of oil products, oil, grease and accumulation of other impurities should not be found
3. Colouring Should not be detected in the column: 20 cm 10 cm
4. Odour Water should not acquire odors intensity more than 2 points, which are detected: Directly or upon subsequent chlorination Directly
5. Temperature Summer water temperatures as a result of wastewater discharges should not rise by more than 3 °C in comparison with monthly average water temperature of the hottest month of year for the last 10 years.
6. pH value Should not go beyond 6.5 - 8.5 7. Water salinity No more than 1000 mg/L, including chlorides: 350; sulphates: 500 mg/L 8. Dissolved oxygen Should not be less than 4 mg /L at any time during the year, in sample collected before
12 pm 9. Biochemical oxygen demand (BOD)
At a temperature of 20 °C should not exceed: 2 mg О2/L 4 mg О2/L
10. Chemical oxygen demand (bichromateoxidability) (COD)
Should not exceed: 15 mg О2/L 30 mg О2/L
11. Chemical matters Should not contain in water bodies in concentrations exceeding the maximumpermissible concentration or approximate permissible level
12. Causative agents of enteric infections
Water should not contain causative agents of enteric infections
13. Viable helminth eggs (ascarids, whipworm, toxocara, fasciola and others), armed tapeworm and viable cysts of pathogenic intestinal protozoa
Should not contain in 25 liters of water
14. Thermotolerant coliform bacteria **
No more than: 100 CFU /100 ml** 100 CFU /100 ml
15. Total coliform bacteria ** No more than: 1000 CFU /100 ml** 500 CFU /100ml
16. Coliphage ** No more than: 10 PFU/100 ml** 10 PFU/100 ml
17. Total volumetric activity of radionuclides at compresence***
Notes:
* -content of suspended solids in the water neprirodnogo origin (flakes of metal hydroxides, resulting from the treatment of wastewater, particles of asbestos, glass fibers, basalt, kapron, lavsan, etc.) is not allowed; ** -for centralized water supply; When necentralizovannom water supply water to decontaminate; * * * -in case of exceeding the levels of radioactive contamination of the water is controlled by the additional control of radionuclide contamination in accordance with the regulations and radiation safety. 1 -specific activity i-equipment of the radionuclide in the water. VB1 -appropriate level of intervention for the i-equipment of the radionuclide. Source: San Pin No. 0172-04. "Hygienic requirements for the protection of surface waters in the territory of the Republic of Uzbekistan").
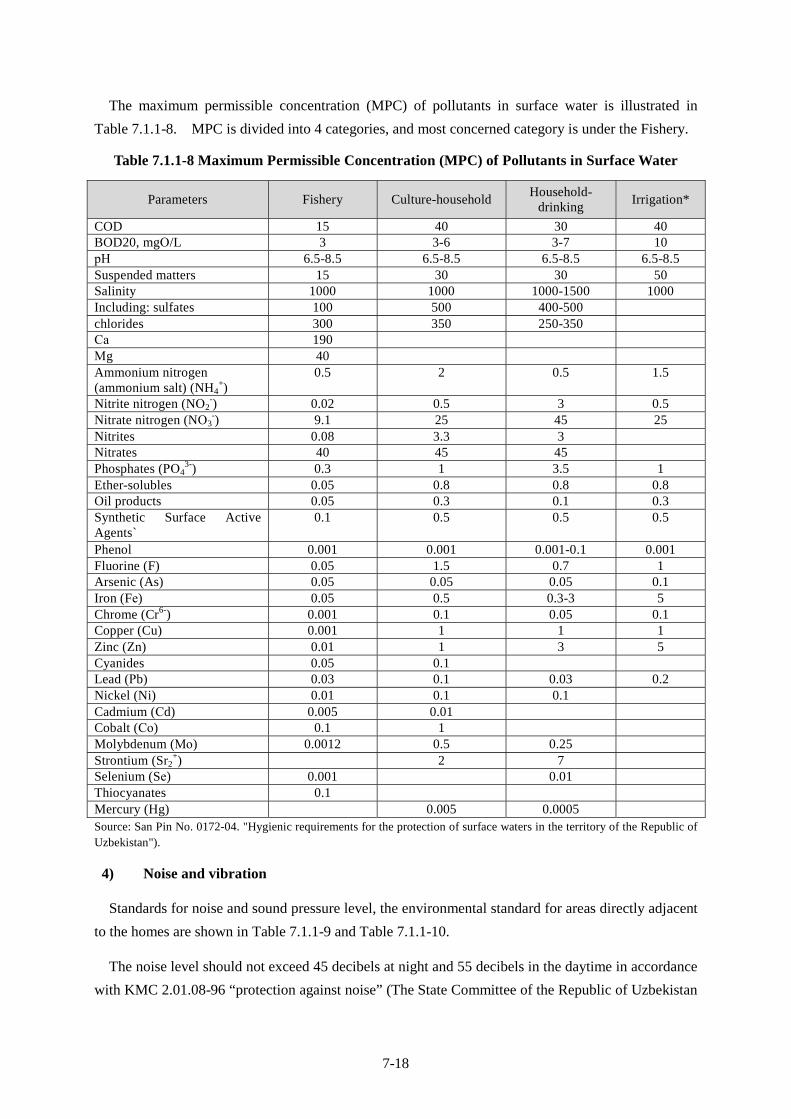
7-18
The maximum permissible concentration (MPC) of pollutants in surface water is illustrated in
Table 7.1.1-8. MPC is divided into 4 categories, and most concerned category is under the Fishery.
Table 7.1.1-8 Maximum Permissible Concentration (MPC) of Pollutants in Surface Water
Parameters Fishery Culture-household Household-
drinking Irrigation*
COD 15 40 30 40 BOD20, mgО/L 3 3-6 3-7 10 рН 6.5-8.5 6.5-8.5 6.5-8.5 6.5-8.5 Suspended matters 15 30 30 50 Salinity 1000 1000 1000-1500 1000 Including: sulfates 100 500 400-500 chlorides 300 350 250-350 Са 190 Мg 40 Ammonium nitrogen (ammonium salt) (NH4
+) 0.5 2 0.5 1.5
Nitrite nitrogen (NО2-) 0.02 0.5 3 0.5
Nitrate nitrogen (NО3-) 9.1 25 45 25
Nitrites 0.08 3.3 3 Nitrates 40 45 45 Phosphates (РО4
3-) 0.3 1 3.5 1 Ether-solubles 0.05 0.8 0.8 0.8 Oil products 0.05 0.3 0.1 0.3 Synthetic Surface Active Agents`
0.1 0.5 0.5 0.5
Phenol 0.001 0.001 0.001-0.1 0.001 Fluorine (F) 0.05 1.5 0.7 1 Arsenic (As) 0.05 0.05 0.05 0.1 Iron (Fе) 0.05 0.5 0.3-3 5 Chrome (Cr6-) 0.001 0.1 0.05 0.1 Copper (Cu) 0.001 1 1 1 Zinc (Zn) 0.01 1 3 5 Cyanides 0.05 0.1 Lead (Рb) 0.03 0.1 0.03 0.2 Nickel (Ni) 0.01 0.1 0.1 Cadmium (Сd) 0.005 0.01 Cobalt (Со) 0.1 1 Molybdenum (Мо) 0.0012 0.5 0.25 Strontium (Sr2
+) 2 7 Selenium (Sе) 0.001 0.01 Thiocyanates 0.1 Mercury (Нg) 0.005 0.0005 Source: San Pin No. 0172-04. "Hygienic requirements for the protection of surface waters in the territory of the Republic of Uzbekistan").
4) Noise and vibration
Standards for noise and sound pressure level, the environmental standard for areas directly adjacent
to the homes are shown in Table 7.1.1-9 and Table 7.1.1-10.
The noise level should not exceed 45 decibels at night and 55 decibels in the daytime in accordance
with KMC 2.01.08-96 “protection against noise” (The State Committee of the Republic of Uzbekistan
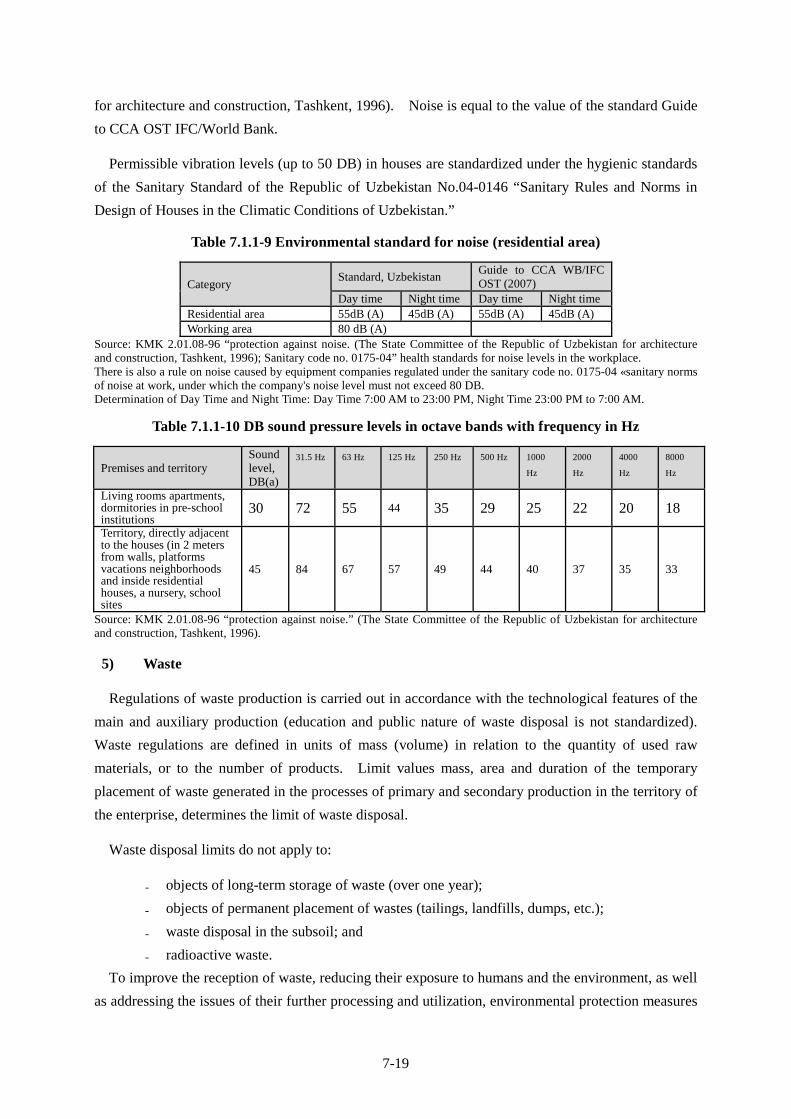
7-19
for architecture and construction, Tashkent, 1996). Noise is equal to the value of the standard Guide
to CCA OST IFC/World Bank.
Permissible vibration levels (up to 50 DB) in houses are standardized under the hygienic standards
of the Sanitary Standard of the Republic of Uzbekistan No.04-0146 “Sanitary Rules and Norms in
Design of Houses in the Climatic Conditions of Uzbekistan.”
Table 7.1.1-9 Environmental standard for noise (residential area)
Category Standard, Uzbekistan Guide to CCA WB/IFC OST (2007)
Day time Night time Day time Night timeResidential area 55dB (A) 45dB (A) 55dB (A) 45dB (A)Working area 80 dB (A)
Source: KMK 2.01.08-96 “protection against noise. (The State Committee of the Republic of Uzbekistan for architecture and construction, Tashkent, 1996); Sanitary code no. 0175-04” health standards for noise levels in the workplace. There is also a rule on noise caused by equipment companies regulated under the sanitary code no. 0175-04 «sanitary norms of noise at work, under which the company's noise level must not exceed 80 DB. Determination of Day Time and Night Time: Day Time 7:00 AM to 23:00 PM, Night Time 23:00 PM to 7:00 AM.
Table 7.1.1-10 DB sound pressure levels in octave bands with frequency in Hz
Premises and territory Sound level, DB(a)
31.5 Hz 63 Hz 125 Hz 250 Hz 500 Hz 1000
Hz 2000
Hz 4000
Hz 8000
Hz
Living rooms apartments, dormitories in pre-school institutions
30 72 55 44 35 29 25 22 20 18
Territory, directly adjacent to the houses (in 2 meters from walls, platforms vacations neighborhoods and inside residential houses, a nursery, school sites
45 84 67 57 49 44 40 37 35 33
Source: KMK 2.01.08-96 “protection against noise.” (The State Committee of the Republic of Uzbekistan for architecture and construction, Tashkent, 1996).
5) Waste
Regulations of waste production is carried out in accordance with the technological features of the
main and auxiliary production (education and public nature of waste disposal is not standardized).
Waste regulations are defined in units of mass (volume) in relation to the quantity of used raw
materials, or to the number of products. Limit values mass, area and duration of the temporary
placement of waste generated in the processes of primary and secondary production in the territory of
the enterprise, determines the limit of waste disposal.
Waste disposal limits do not apply to:
objects of long-term storage of waste (over one year);
objects of permanent placement of wastes (tailings, landfills, dumps, etc.);
waste disposal in the subsoil; and
radioactive waste.
To improve the reception of waste, reducing their exposure to humans and the environment, as well
as addressing the issues of their further processing and utilization, environmental protection measures
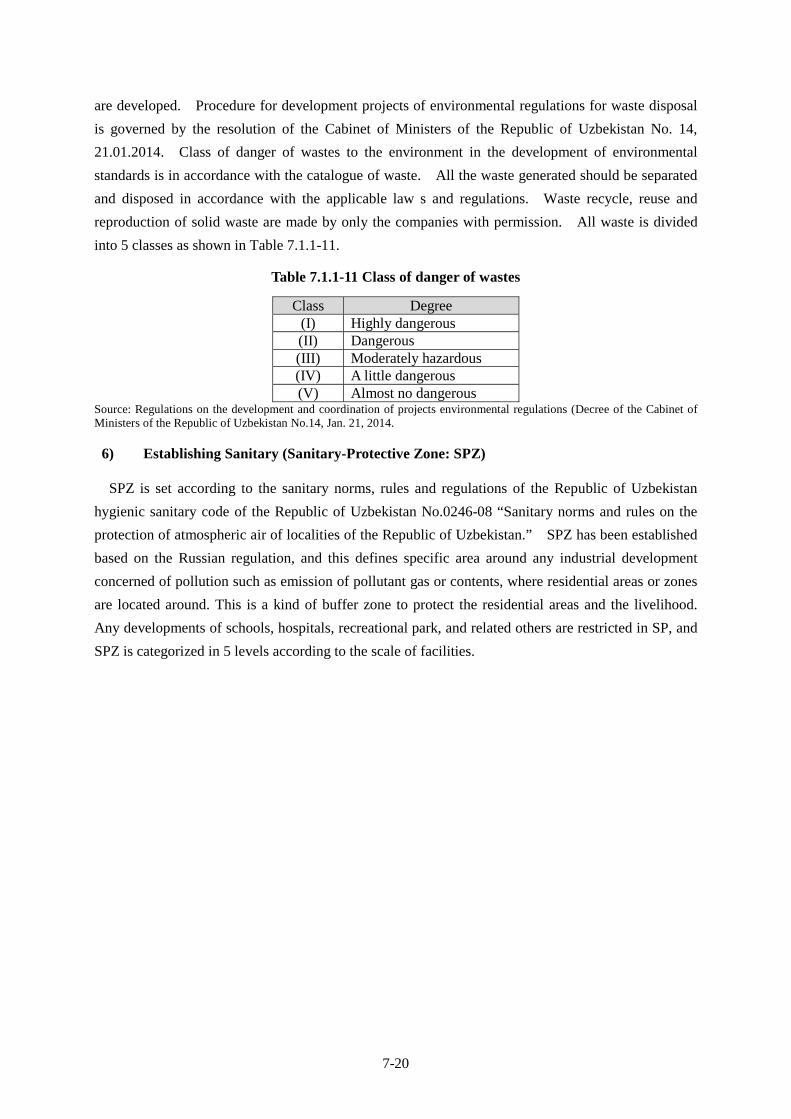
7-20
are developed. Procedure for development projects of environmental regulations for waste disposal
is governed by the resolution of the Cabinet of Ministers of the Republic of Uzbekistan No. 14,
21.01.2014. Class of danger of wastes to the environment in the development of environmental
standards is in accordance with the catalogue of waste. All the waste generated should be separated
and disposed in accordance with the applicable law s and regulations. Waste recycle, reuse and
reproduction of solid waste are made by only the companies with permission. All waste is divided
into 5 classes as shown in Table 7.1.1-11.
Table 7.1.1-11 Class of danger of wastes
Class Degree (I) Highly dangerous (II) Dangerous (III) Moderately hazardous (IV) A little dangerous (V) Almost no dangerous
Source: Regulations on the development and coordination of projects environmental regulations (Decree of the Cabinet of Ministers of the Republic of Uzbekistan No.14, Jan. 21, 2014.
6) Establishing Sanitary (Sanitary-Protective Zone: SPZ)
SPZ is set according to the sanitary norms, rules and regulations of the Republic of Uzbekistan
hygienic sanitary code of the Republic of Uzbekistan No.0246-08 “Sanitary norms and rules on the
protection of atmospheric air of localities of the Republic of Uzbekistan.” SPZ has been established
based on the Russian regulation, and this defines specific area around any industrial development
concerned of pollution such as emission of pollutant gas or contents, where residential areas or zones
are located around. This is a kind of buffer zone to protect the residential areas and the livelihood.
Any developments of schools, hospitals, recreational park, and related others are restricted in SP, and
SPZ is categorized in 5 levels according to the scale of facilities.
7-21
7.1.2 Relevant organizations
The following public officials and institutions play a major role regarding environmental
management in the Republic of Uzbekistan.
(1) Goskompriroda (State Committee of the Republic of Uzbekistan for Nature Protection)
In Uzbekistan in 1989 State System of Nature Protection was created, which is controlled by the
State Committee for Nature Protection (Goskompriroda), which is specifically authorized, superior
departmental and coordinating body responsible for control and inter-sectoral management of nature
protection as well as use and reproduction of natural resources in nation level or inter-regional or
inter-state, and it functions as the main authority of EIA for permission. Local Nature Protection
Committees (Regional Goskompriroda) are in charge of state level and large city including the
Republic of Karakalpakstan and in large cities, and these should monitor the condition of air and
water discharge and quality as well as soil condition of the facilities within their jurisdiction.
(2) Uzhydromet (Center of Hydrometeorological Service at Cabinet of Ministers of the
Republic of Uzbekistan)
It is under the Cabinet of Ministers, and conducting monitoring on water, air and soil environment
in wider regional environment.
(3) Goskomzemgeodezkadastr (State Committee of the Republic of Uzbekistan on Land
Resource, Geodesy, Cartography and State Cadaster)
This is to control and manage land in Uzbekistan.
(4) Ministry of Health
It is to monitor the environment on the basis of health and sanitary point of views, such as soil and
noise.
(5) Ministry of Agriculture and Water Resource
It is to monitor the quality of water of irrigation, canal and river in the country.
(6) Ministry of Internal Affairs
This organization is to monitor environmentally related activities in the country. If illegal
activities or violation are identified, this will investigate, further monitor, instruct the concerned
parties, and check the procedure of activities in order to make it improved.
Organizational Structure of Uzbekenergo JSC including EPS for environmental sector is illustrated
in Figure 7.1.2-1, and its administration list is shown in Table 7.1.2-1.

7-22
Source: Uzbekenergo JSC
Figure 7.1.2-1 Organizational Structure of Uzbekenergo JSC
Table 7.1.2-1 Administration List (corresponding to the above organization structure)
CD Correspondence department TPW Thermal power workshop AD Accounting department TAMD Thermal automatics and measurements departmentPD Personnel department MSW Metal and steampipe workshop Civil Defense Civil defense department WCW Water chemistry workshop PTD Production and technical department MIRW Metrology and instrument repair workshop EPD Economic planning department EPMSIW Electric power metering systems and instruments
workshop LPD Logistics and procurement department EPACW Electrical process automatic control workshop LP&JS Labor protection and job safety department RP&AD Relay protection and automation department ACSG Automatic control system group GSDPG General system documentation preparation group PBFCD Production buildings and facilities control
department PSOS Power station operation service
EP&ISD Environmental protection and industrial sanitation department
PERS Power equipment repair service
BFRS Buildings and facilities repair section HTS Hydrotechnical service STIC Scientific and technical information center
“Uzinformenergo” MSS Metrology and standardization service
CDD Chief Designer Department EPS* Environmental protection service CS Cadastral service TCMG Technical conditions modernization group EPW Electric power workshop
Source: Uzbekenergo JSC
Director
Chief Engineer
Chief Engineer Assistant
PERS
HTS
MSS
TCMG
GSDPG
EPW
RP&AD
EPACW
PBFCD
PTD
CDD
TPW
MIRW
WCW
EPS
MSW
EPMSIW
EP&ISD
CS
TAMD
PSOS
ACSG
Deputy Director
STIC
TCMG
BFRS
Security
CD
AD
EPD
PD
Civil Defense
LP&JS
LPD
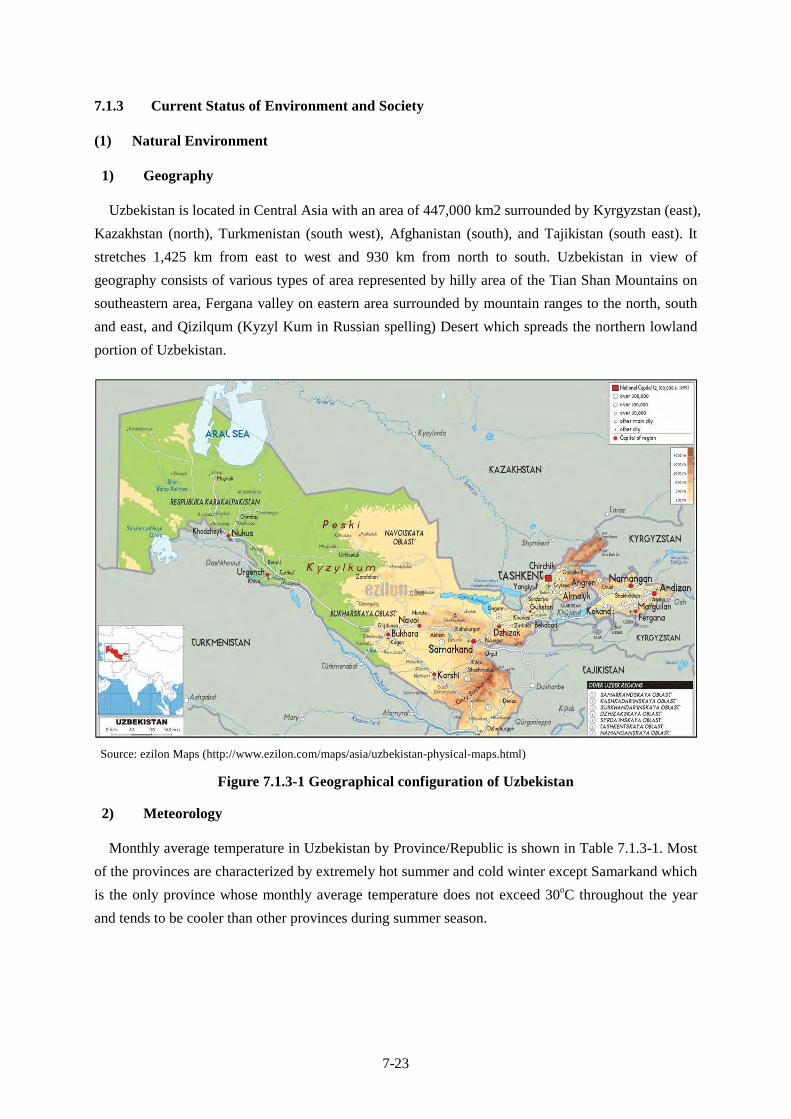
7-23
7.1.3 Current Status of Environment and Society
(1) Natural Environment
1) Geography
Uzbekistan is located in Central Asia with an area of 447,000 km2 surrounded by Kyrgyzstan (east),
Kazakhstan (north), Turkmenistan (south west), Afghanistan (south), and Tajikistan (south east). It
stretches 1,425 km from east to west and 930 km from north to south. Uzbekistan in view of
geography consists of various types of area represented by hilly area of the Tian Shan Mountains on
southeastern area, Fergana valley on eastern area surrounded by mountain ranges to the north, south
and east, and Qizilqum (Kyzyl Kum in Russian spelling) Desert which spreads the northern lowland
portion of Uzbekistan.
Source: ezilon Maps (http://www.ezilon.com/maps/asia/uzbekistan-physical-maps.html)
Figure 7.1.3-1 Geographical configuration of Uzbekistan
2) Meteorology
Monthly average temperature in Uzbekistan by Province/Republic is shown in Table 7.1.3-1. Most
of the provinces are characterized by extremely hot summer and cold winter except Samarkand which
is the only province whose monthly average temperature does not exceed 30oC throughout the year
and tends to be cooler than other provinces during summer season.
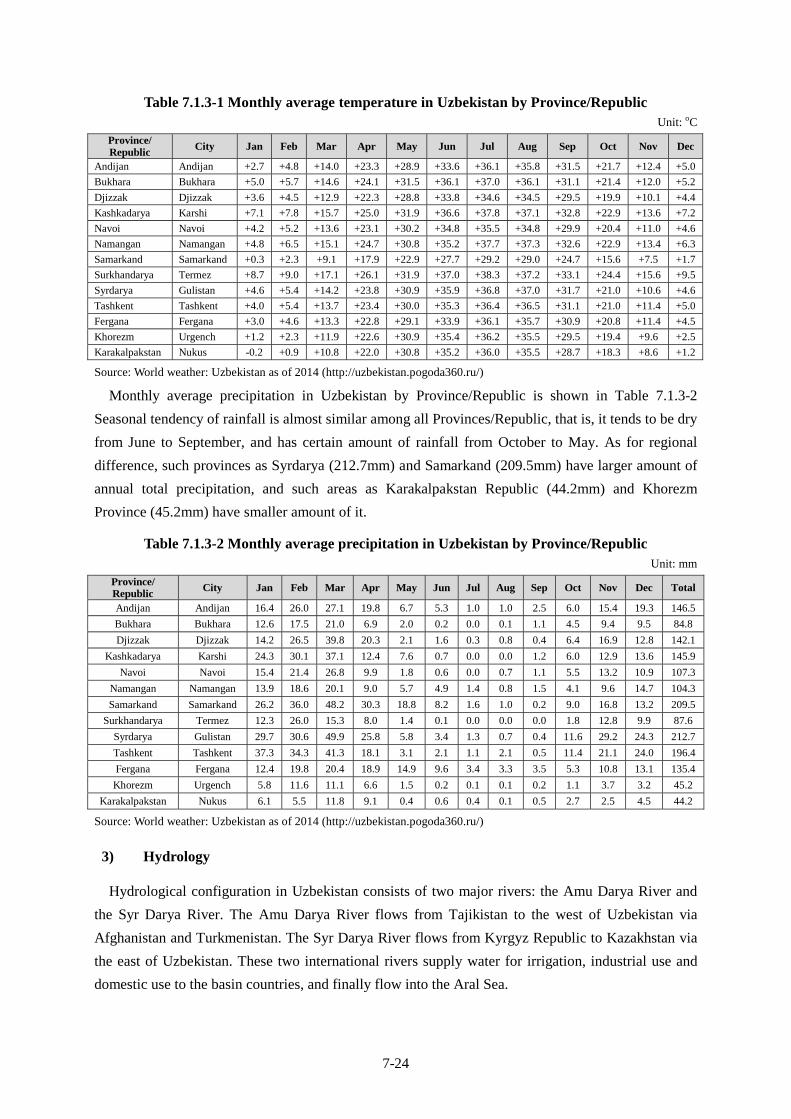
7-24
Table 7.1.3-1 Monthly average temperature in Uzbekistan by Province/Republic Unit: oC
Province/ Republic City Jan Feb Mar Apr May Jun Jul Aug Sep Oct Nov Dec
Andijan Andijan +2.7 +4.8 +14.0 +23.3 +28.9 +33.6 +36.1 +35.8 +31.5 +21.7 +12.4 +5.0
Bukhara Bukhara +5.0 +5.7 +14.6 +24.1 +31.5 +36.1 +37.0 +36.1 +31.1 +21.4 +12.0 +5.2
Djizzak Djizzak +3.6 +4.5 +12.9 +22.3 +28.8 +33.8 +34.6 +34.5 +29.5 +19.9 +10.1 +4.4
Kashkadarya Karshi +7.1 +7.8 +15.7 +25.0 +31.9 +36.6 +37.8 +37.1 +32.8 +22.9 +13.6 +7.2
Navoi Navoi +4.2 +5.2 +13.6 +23.1 +30.2 +34.8 +35.5 +34.8 +29.9 +20.4 +11.0 +4.6
Namangan Namangan +4.8 +6.5 +15.1 +24.7 +30.8 +35.2 +37.7 +37.3 +32.6 +22.9 +13.4 +6.3
Samarkand Samarkand +0.3 +2.3 +9.1 +17.9 +22.9 +27.7 +29.2 +29.0 +24.7 +15.6 +7.5 +1.7
Surkhandarya Termez +8.7 +9.0 +17.1 +26.1 +31.9 +37.0 +38.3 +37.2 +33.1 +24.4 +15.6 +9.5
Syrdarya Gulistan +4.6 +5.4 +14.2 +23.8 +30.9 +35.9 +36.8 +37.0 +31.7 +21.0 +10.6 +4.6
Tashkent Tashkent +4.0 +5.4 +13.7 +23.4 +30.0 +35.3 +36.4 +36.5 +31.1 +21.0 +11.4 +5.0
Fergana Fergana +3.0 +4.6 +13.3 +22.8 +29.1 +33.9 +36.1 +35.7 +30.9 +20.8 +11.4 +4.5
Khorezm Urgench +1.2 +2.3 +11.9 +22.6 +30.9 +35.4 +36.2 +35.5 +29.5 +19.4 +9.6 +2.5
Karakalpakstan Nukus -0.2 +0.9 +10.8 +22.0 +30.8 +35.2 +36.0 +35.5 +28.7 +18.3 +8.6 +1.2
Source: World weather: Uzbekistan as of 2014 (http://uzbekistan.pogoda360.ru/)
Monthly average precipitation in Uzbekistan by Province/Republic is shown in Table 7.1.3-2
Seasonal tendency of rainfall is almost similar among all Provinces/Republic, that is, it tends to be dry
from June to September, and has certain amount of rainfall from October to May. As for regional
difference, such provinces as Syrdarya (212.7mm) and Samarkand (209.5mm) have larger amount of
annual total precipitation, and such areas as Karakalpakstan Republic (44.2mm) and Khorezm
Province (45.2mm) have smaller amount of it.
Table 7.1.3-2 Monthly average precipitation in Uzbekistan by Province/Republic Unit: mm
Province/ Republic
City Jan Feb Mar Apr May Jun Jul Aug Sep Oct Nov Dec Total
Andijan Andijan 16.4 26.0 27.1 19.8 6.7 5.3 1.0 1.0 2.5 6.0 15.4 19.3 146.5
Bukhara Bukhara 12.6 17.5 21.0 6.9 2.0 0.2 0.0 0.1 1.1 4.5 9.4 9.5 84.8
Djizzak Djizzak 14.2 26.5 39.8 20.3 2.1 1.6 0.3 0.8 0.4 6.4 16.9 12.8 142.1
Kashkadarya Karshi 24.3 30.1 37.1 12.4 7.6 0.7 0.0 0.0 1.2 6.0 12.9 13.6 145.9
Navoi Navoi 15.4 21.4 26.8 9.9 1.8 0.6 0.0 0.7 1.1 5.5 13.2 10.9 107.3
Namangan Namangan 13.9 18.6 20.1 9.0 5.7 4.9 1.4 0.8 1.5 4.1 9.6 14.7 104.3
Samarkand Samarkand 26.2 36.0 48.2 30.3 18.8 8.2 1.6 1.0 0.2 9.0 16.8 13.2 209.5
Surkhandarya Termez 12.3 26.0 15.3 8.0 1.4 0.1 0.0 0.0 0.0 1.8 12.8 9.9 87.6
Syrdarya Gulistan 29.7 30.6 49.9 25.8 5.8 3.4 1.3 0.7 0.4 11.6 29.2 24.3 212.7
Tashkent Tashkent 37.3 34.3 41.3 18.1 3.1 2.1 1.1 2.1 0.5 11.4 21.1 24.0 196.4
Fergana Fergana 12.4 19.8 20.4 18.9 14.9 9.6 3.4 3.3 3.5 5.3 10.8 13.1 135.4
Khorezm Urgench 5.8 11.6 11.1 6.6 1.5 0.2 0.1 0.1 0.2 1.1 3.7 3.2 45.2
Karakalpakstan Nukus 6.1 5.5 11.8 9.1 0.4 0.6 0.4 0.1 0.5 2.7 2.5 4.5 44.2
Source: World weather: Uzbekistan as of 2014 (http://uzbekistan.pogoda360.ru/)
3) Hydrology
Hydrological configuration in Uzbekistan consists of two major rivers: the Amu Darya River and
the Syr Darya River. The Amu Darya River flows from Tajikistan to the west of Uzbekistan via
Afghanistan and Turkmenistan. The Syr Darya River flows from Kyrgyz Republic to Kazakhstan via
the east of Uzbekistan. These two international rivers supply water for irrigation, industrial use and
domestic use to the basin countries, and finally flow into the Aral Sea.
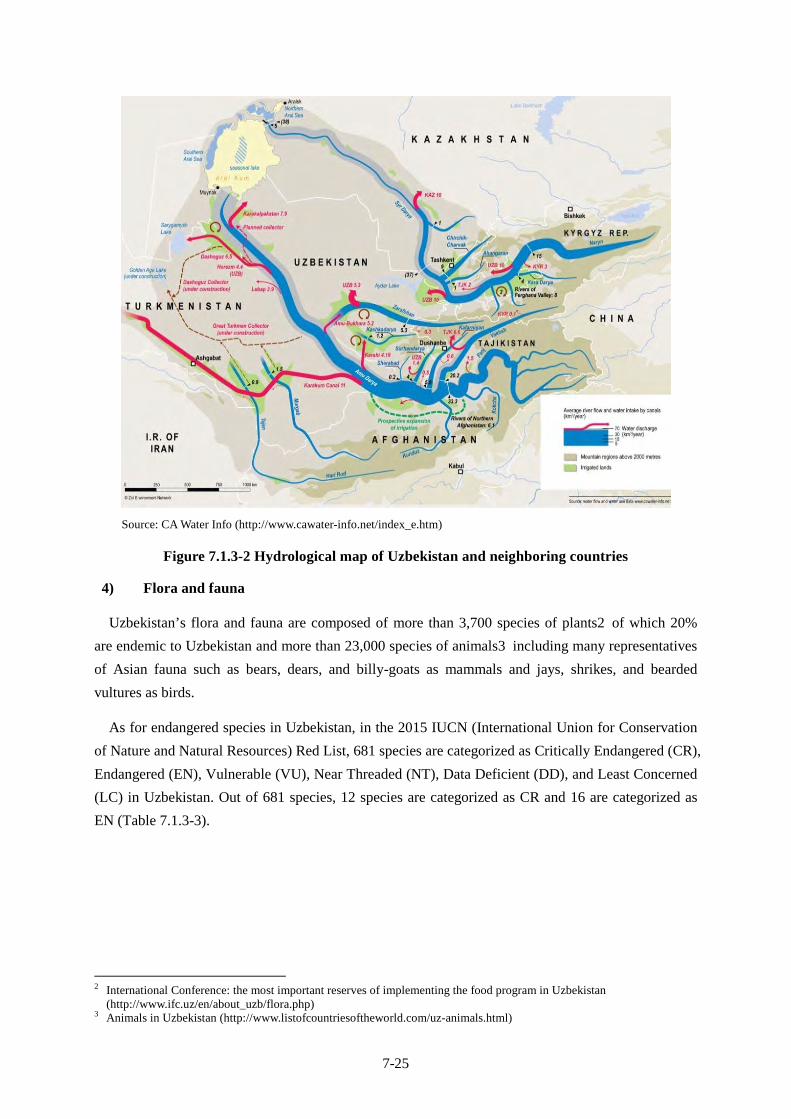
7-25
Source: CA Water Info (http://www.cawater-info.net/index_e.htm)
Figure 7.1.3-2 Hydrological map of Uzbekistan and neighboring countries
4) Flora and fauna
Uzbekistan’s flora and fauna are composed of more than 3,700 species of plants2 of which 20%
are endemic to Uzbekistan and more than 23,000 species of animals3 including many representatives
of Asian fauna such as bears, dears, and billy-goats as mammals and jays, shrikes, and bearded
vultures as birds.
As for endangered species in Uzbekistan, in the 2015 IUCN (International Union for Conservation
of Nature and Natural Resources) Red List, 681 species are categorized as Critically Endangered (CR),
Endangered (EN), Vulnerable (VU), Near Threaded (NT), Data Deficient (DD), and Least Concerned
(LC) in Uzbekistan. Out of 681 species, 12 species are categorized as CR and 16 are categorized as
EN (Table 7.1.3-3).
2 International Conference: the most important reserves of implementing the food program in Uzbekistan
(http://www.ifc.uz/en/about_uzb/flora.php) 3 Animals in Uzbekistan (http://www.listofcountriesoftheworld.com/uz-animals.html)
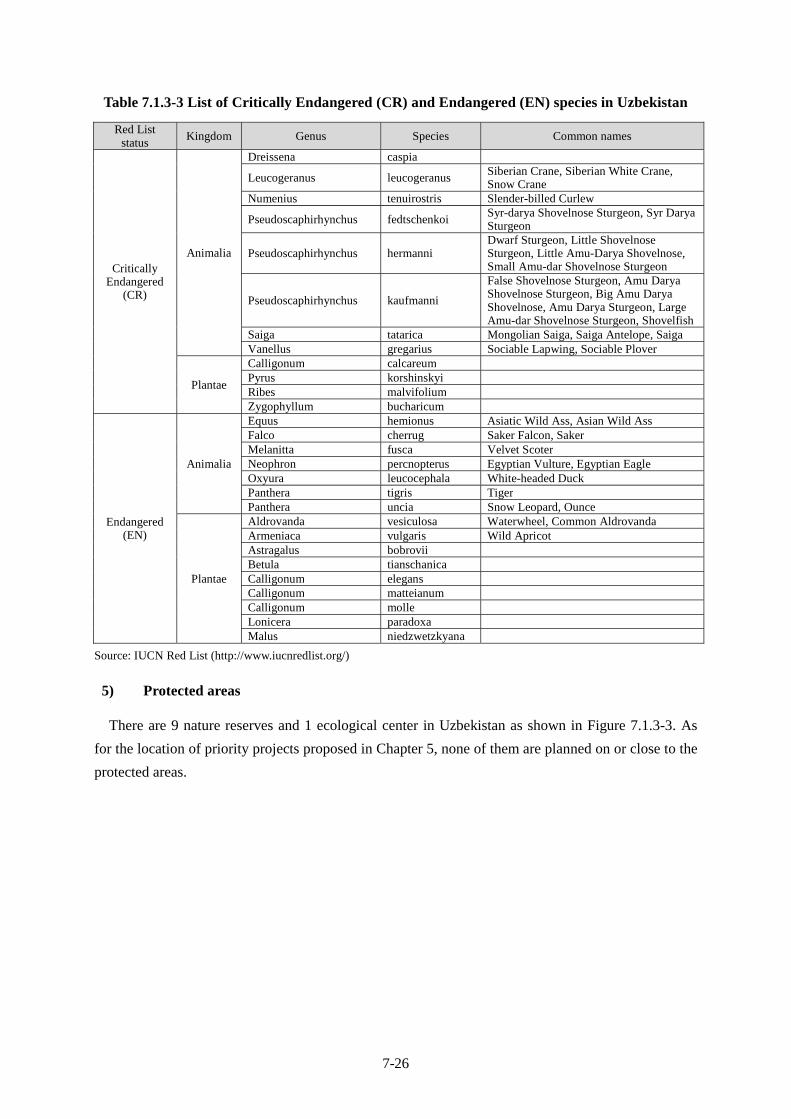
7-26
Table 7.1.3-3 List of Critically Endangered (CR) and Endangered (EN) species in Uzbekistan
Red List status
Kingdom Genus Species Common names
Critically Endangered
(CR)
Animalia
Dreissena caspia
Leucogeranus leucogeranus Siberian Crane, Siberian White Crane, Snow Crane
Numenius tenuirostris Slender-billed Curlew
Pseudoscaphirhynchus fedtschenkoi Syr-darya Shovelnose Sturgeon, Syr Darya Sturgeon
Pseudoscaphirhynchus hermanni Dwarf Sturgeon, Little Shovelnose Sturgeon, Little Amu-Darya Shovelnose, Small Amu-dar Shovelnose Sturgeon
Pseudoscaphirhynchus kaufmanni
False Shovelnose Sturgeon, Amu Darya Shovelnose Sturgeon, Big Amu Darya Shovelnose, Amu Darya Sturgeon, Large Amu-dar Shovelnose Sturgeon, Shovelfish
Saiga tatarica Mongolian Saiga, Saiga Antelope, SaigaVanellus gregarius Sociable Lapwing, Sociable Plover
Plantae
Calligonum calcareumPyrus korshinskyiRibes malvifoliumZygophyllum bucharicum
Endangered (EN)
Animalia
Equus hemionus Asiatic Wild Ass, Asian Wild AssFalco cherrug Saker Falcon, SakerMelanitta fusca Velvet ScoterNeophron percnopterus Egyptian Vulture, Egyptian EagleOxyura leucocephala White-headed DuckPanthera tigris TigerPanthera uncia Snow Leopard, Ounce
Plantae
Aldrovanda vesiculosa Waterwheel, Common AldrovandaArmeniaca vulgaris Wild ApricotAstragalus bobroviiBetula tianschanicaCalligonum elegansCalligonum matteianumCalligonum molleLonicera paradoxaMalus niedzwetzkyana
Source: IUCN Red List (http://www.iucnredlist.org/)
5) Protected areas
There are 9 nature reserves and 1 ecological center in Uzbekistan as shown in Figure 7.1.3-3. As
for the location of priority projects proposed in Chapter 5, none of them are planned on or close to the
protected areas.
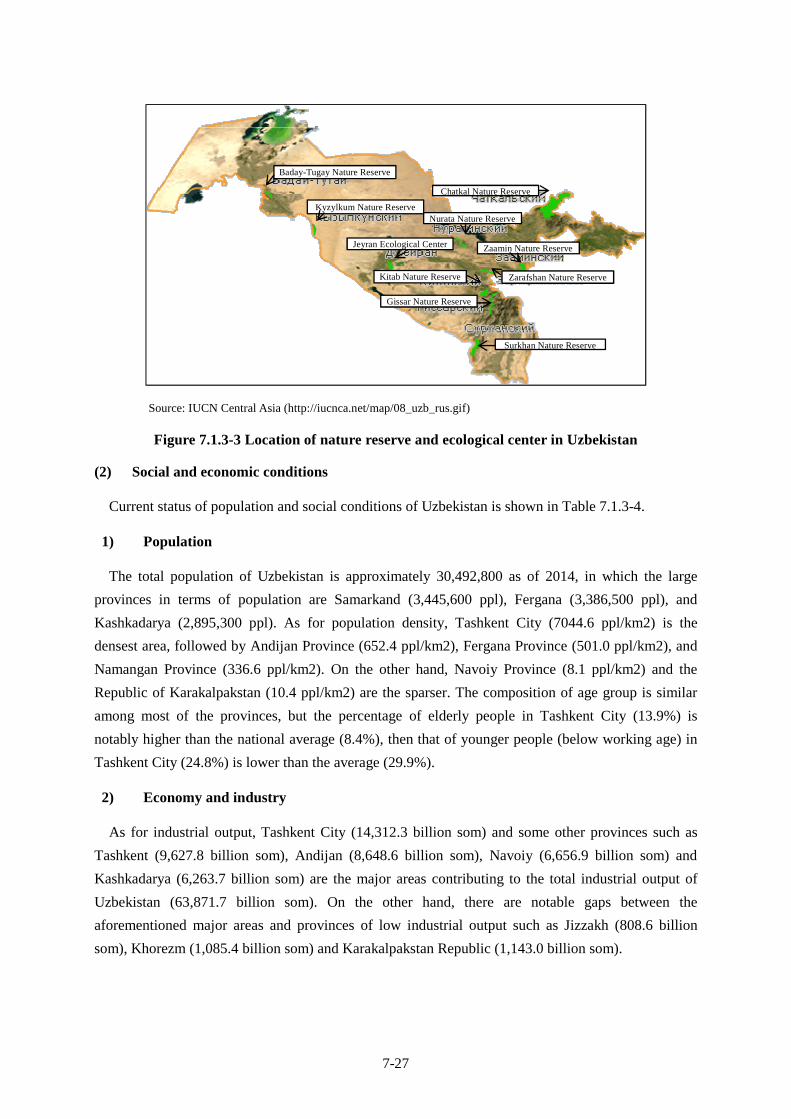
7-27
Source: IUCN Central Asia (http://iucnca.net/map/08_uzb_rus.gif)
Figure 7.1.3-3 Location of nature reserve and ecological center in Uzbekistan
(2) Social and economic conditions
Current status of population and social conditions of Uzbekistan is shown in Table 7.1.3-4.
1) Population
The total population of Uzbekistan is approximately 30,492,800 as of 2014, in which the large
provinces in terms of population are Samarkand (3,445,600 ppl), Fergana (3,386,500 ppl), and
Kashkadarya (2,895,300 ppl). As for population density, Tashkent City (7044.6 ppl/km2) is the
densest area, followed by Andijan Province (652.4 ppl/km2), Fergana Province (501.0 ppl/km2), and
Namangan Province (336.6 ppl/km2). On the other hand, Navoiy Province (8.1 ppl/km2) and the
Republic of Karakalpakstan (10.4 ppl/km2) are the sparser. The composition of age group is similar
among most of the provinces, but the percentage of elderly people in Tashkent City (13.9%) is
notably higher than the national average (8.4%), then that of younger people (below working age) in
Tashkent City (24.8%) is lower than the average (29.9%).
2) Economy and industry
As for industrial output, Tashkent City (14,312.3 billion som) and some other provinces such as
Tashkent (9,627.8 billion som), Andijan (8,648.6 billion som), Navoiy (6,656.9 billion som) and
Kashkadarya (6,263.7 billion som) are the major areas contributing to the total industrial output of
Uzbekistan (63,871.7 billion som). On the other hand, there are notable gaps between the
aforementioned major areas and provinces of low industrial output such as Jizzakh (808.6 billion
som), Khorezm (1,085.4 billion som) and Karakalpakstan Republic (1,143.0 billion som).
Chatkal Nature Reserve
Baday-Tugay Nature Reserve
Nurata Nature Reserve
Zaamin Nature Reserve
Zarafshan Nature Reserve
Surkhan Nature Reserve
Gissar Nature Reserve
Kitab Nature Reserve
Kyzylkum Nature Reserve
Jeyran Ecological Center

7-28
3) Public infrastructure and service
As for infrastructure for public service, sanitation and electricity are fully provided in the whole
Uzbekistan. The coverage of centralized water supply is 81.0% and that of natural gas is 90.0% at
national average, while most people in Tashkent City are able to access water (99.7%) and natural gas
(98.0%).
As for health service, hospitals and medical sites are widely distributed in the whole Uzbekistan. In
view of population per 1 physician, Tashkent City (210) has the best access to medical service. In
contrast, such provinces as Jizzakh (618) and Surkhandarya (618) have worse access compared to the
national average.
Educational facilities are also widely distributed in the whole Uzbekistan, though out of 66 higher
education institutions in Uzbekistan, more than a half of them are located in Tashkent City (34).
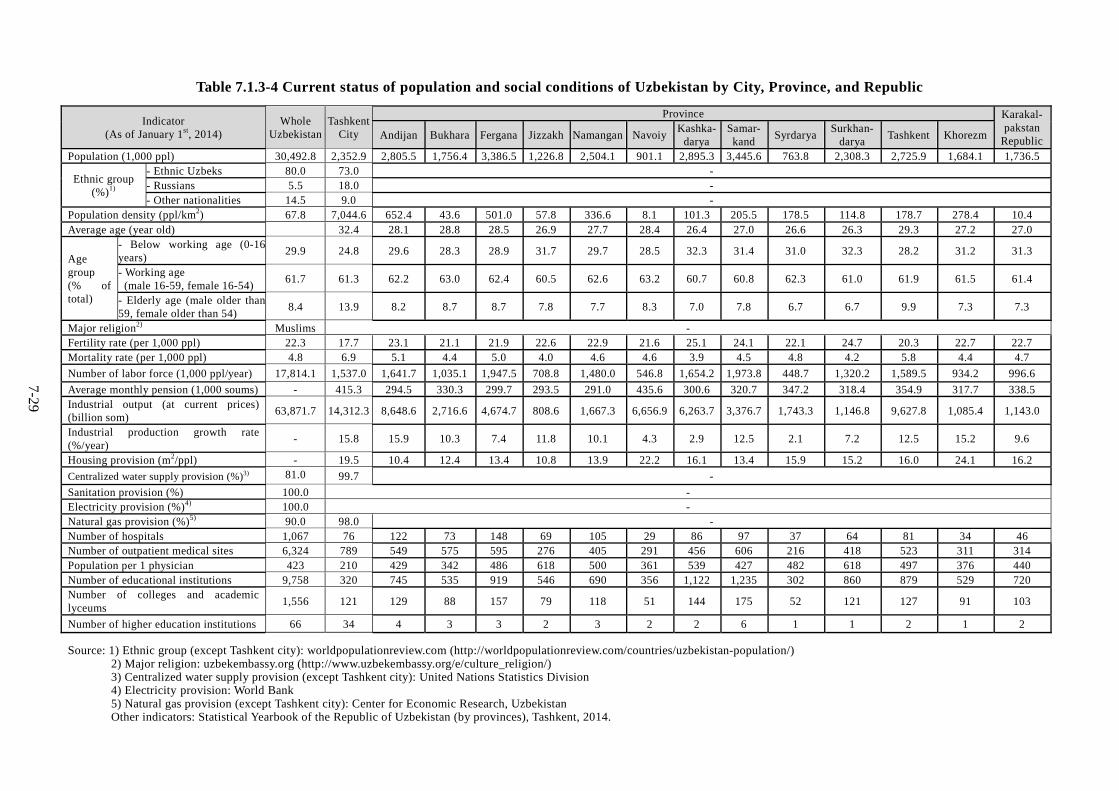
7-29
Table 7.1.3-4 Current status of population and social conditions of Uzbekistan by City, Province, and Republic
Indicator (As of January 1st, 2014)
Whole Uzbekistan
Tashkent City
Province Karakal-pakstan
RepublicAndijan Bukhara Fergana Jizzakh Namangan NavoiyKashka-
daryaSamar-kand
SyrdaryaSurkhan-
darya Tashkent Khorezm
Population (1,000 ppl) 30,492.8 2,352.9 2,805.5 1,756.4 3,386.5 1,226.8 2,504.1 901.1 2,895.3 3,445.6 763.8 2,308.3 2,725.9 1,684.1 1,736.5
Ethnic group (%)1)
- Ethnic Uzbeks 80.0 73.0 -- Russians 5.5 18.0 - - Other nationalities 14.5 9.0 -
Population density (ppl/km2) 67.8 7,044.6 652.4 43.6 501.0 57.8 336.6 8.1 101.3 205.5 178.5 114.8 178.7 278.4 10.4 Average age (year old) 32.4 28.1 28.8 28.5 26.9 27.7 28.4 26.4 27.0 26.6 26.3 29.3 27.2 27.0
Age group (% of total)
- Below working age (0-16 years)
29.9 24.8 29.6 28.3 28.9 31.7 29.7 28.5 32.3 31.4 31.0 32.3 28.2 31.2 31.3
- Working age (male 16-59, female 16-54)
61.7 61.3 62.2 63.0 62.4 60.5 62.6 63.2 60.7 60.8 62.3 61.0 61.9 61.5 61.4
- Elderly age (male older than 59, female older than 54)
8.4 13.9 8.2 8.7 8.7 7.8 7.7 8.3 7.0 7.8 6.7 6.7 9.9 7.3 7.3
Major religion2) Muslims -Fertility rate (per 1,000 ppl) 22.3 17.7 23.1 21.1 21.9 22.6 22.9 21.6 25.1 24.1 22.1 24.7 20.3 22.7 22.7 Mortality rate (per 1,000 ppl) 4.8 6.9 5.1 4.4 5.0 4.0 4.6 4.6 3.9 4.5 4.8 4.2 5.8 4.4 4.7
Number of labor force (1,000 ppl/year) 17,814.1 1,537.0 1,641.7 1,035.1 1,947.5 708.8 1,480.0 546.8 1,654.2 1,973.8 448.7 1,320.2 1,589.5 934.2 996.6
Average monthly pension (1,000 soums) - 415.3 294.5 330.3 299.7 293.5 291.0 435.6 300.6 320.7 347.2 318.4 354.9 317.7 338.5Industrial output (at current prices) (billion som)
63,871.7 14,312.3 8,648.6 2,716.6 4,674.7 808.6 1,667.3 6,656.9 6,263.7 3,376.7 1,743.3 1,146.8 9,627.8 1,085.4 1,143.0
Industrial production growth rate (%/year)
- 15.8 15.9 10.3 7.4 11.8 10.1 4.3 2.9 12.5 2.1 7.2 12.5 15.2 9.6
Housing provision (m2/ppl) - 19.5 10.4 12.4 13.4 10.8 13.9 22.2 16.1 13.4 15.9 15.2 16.0 24.1 16.2
Centralized water supply provision (%)3) 81.0 99.7 -
Sanitation provision (%) 100.0 -Electricity provision (%)4) 100.0 - Natural gas provision (%)5) 90.0 98.0 -Number of hospitals 1,067 76 122 73 148 69 105 29 86 97 37 64 81 34 46Number of outpatient medical sites 6,324 789 549 575 595 276 405 291 456 606 216 418 523 311 314 Population per 1 physician 423 210 429 342 486 618 500 361 539 427 482 618 497 376 440Number of educational institutions 9,758 320 745 535 919 546 690 356 1,122 1,235 302 860 879 529 720Number of colleges and academic lyceums
1,556 121 129 88 157 79 118 51 144 175 52 121 127 91 103
Number of higher education institutions 66 34 4 3 3 2 3 2 2 6 1 1 2 1 2
Source: 1) Ethnic group (except Tashkent city): worldpopulationreview.com (http://worldpopulationreview.com/countries/uzbekistan-population/) 2) Major religion: uzbekembassy.org (http://www.uzbekembassy.org/e/culture_religion/) 3) Centralized water supply provision (except Tashkent city): United Nations Statistics Division 4) Electricity provision: World Bank 5) Natural gas provision (except Tashkent city): Center for Economic Research, Uzbekistan Other indicators: Statistical Yearbook of the Republic of Uzbekistan (by provinces), Tashkent, 2014.
7-30
7.1.4 Examination of alternatives of the power development plan
(1) Outline of the power development plan
Based on Power Development Plan up to 2030 made by Uzbekenergo JSC, optimal type and
capacity of power development to be necessary up to 2030 is clarified through comparison of power
development scenarios using the software for power development planning with minimum cost
(WASP). Such conditions as power demand, load duration curve, power supply reliability, ongoing
power development projects, abolition plan of the existing power plant, development candidate of
power plant, and fuel price are taken into account to examine optimal power development plan.
Details are described in Chapter 3 “Power Development Plan”.
(2) Examination of alternatives to achieve the objective of the power development plan
1) Setting the development scenarios
As described in Chapter 3, three scenarios shown in Table 7.1.4-1 were set, and power
development plan of each scenario with minimum cost was formulated using WASP.
Scenario 1: Optimizing Power Development Plan up to 2030 made by Uzbekenergo JSC
using WASP
Scenario 2: Adding 1,500MW of coal-fired power generation to Scenario-1
Scenario 3: Adding 200MW of pumped storage hydro power generation to Scenario-1
In the examination of alternatives, the percentages of energy balance and capacity share of
renewable energy of the three scenarios are set at the same figure (0.8% and 3.4%, respectively), and
there is no scenario which has more percentage of renewable energy than others. The reason is that if
the generation capacity of renewable energy whose output is not necessarily stable exceeds 10% of
system capacity, additional investment is needed for system stabilization measures, while the first
priority of investment is capital investment to satisfy power demand in Uzbekistan. Given the above
situation, existing power development plan in which generation capacity of renewable energy to be
developed accounts for approximately 6% of system capacity is regarded as sufficiently
environment-friendly plan.
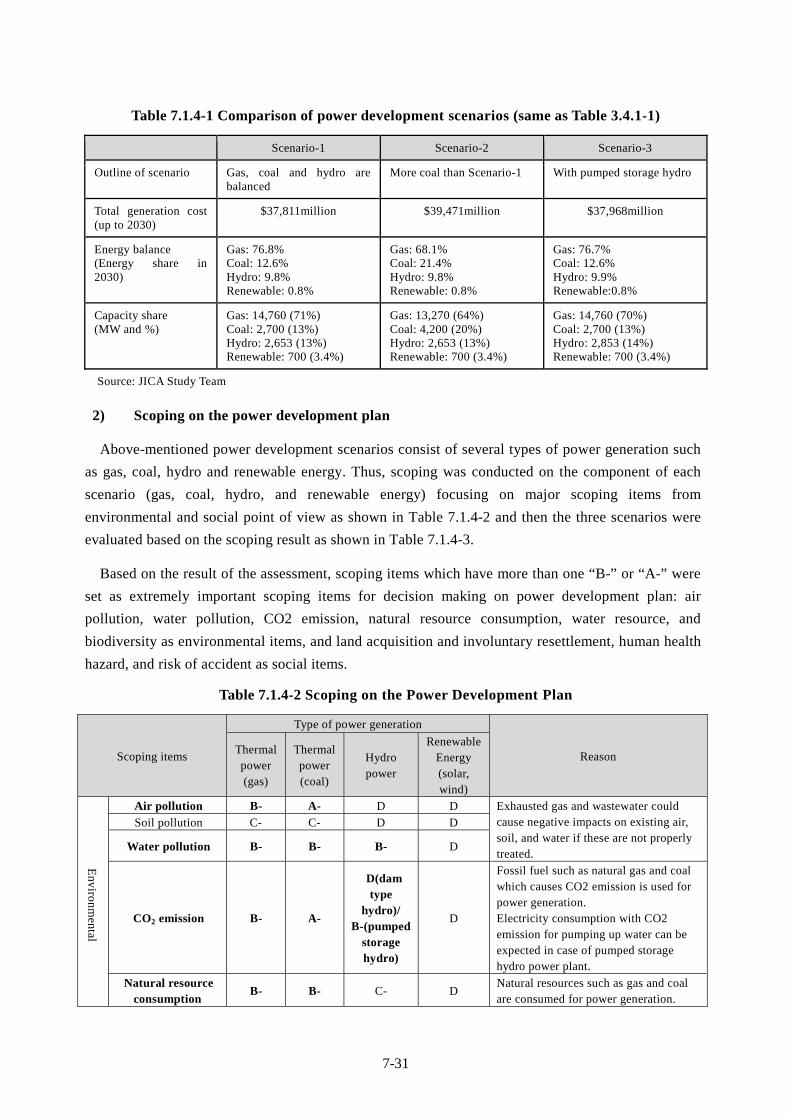
7-31
Table 7.1.4-1 Comparison of power development scenarios (same as Table 3.4.1-1)
Scenario-1 Scenario-2 Scenario-3
Outline of scenario Gas, coal and hydro are balanced
More coal than Scenario-1 With pumped storage hydro
Total generation cost (up to 2030)
$37,811million $39,471million $37,968million
Energy balance (Energy share in 2030)
Gas: 76.8% Coal: 12.6% Hydro: 9.8% Renewable: 0.8%
Gas: 68.1% Coal: 21.4% Hydro: 9.8% Renewable: 0.8%
Gas: 76.7% Coal: 12.6% Hydro: 9.9% Renewable:0.8%
Capacity share (MW and %)
Gas: 14,760 (71%) Coal: 2,700 (13%) Hydro: 2,653 (13%) Renewable: 700 (3.4%)
Gas: 13,270 (64%) Coal: 4,200 (20%) Hydro: 2,653 (13%) Renewable: 700 (3.4%)
Gas: 14,760 (70%) Coal: 2,700 (13%) Hydro: 2,853 (14%) Renewable: 700 (3.4%)
Source: JICA Study Team
2) Scoping on the power development plan
Above-mentioned power development scenarios consist of several types of power generation such
as gas, coal, hydro and renewable energy. Thus, scoping was conducted on the component of each
scenario (gas, coal, hydro, and renewable energy) focusing on major scoping items from
environmental and social point of view as shown in Table 7.1.4-2 and then the three scenarios were
evaluated based on the scoping result as shown in Table 7.1.4-3.
Based on the result of the assessment, scoping items which have more than one “B-” or “A-” were
set as extremely important scoping items for decision making on power development plan: air
pollution, water pollution, CO2 emission, natural resource consumption, water resource, and
biodiversity as environmental items, and land acquisition and involuntary resettlement, human health
hazard, and risk of accident as social items.
Table 7.1.4-2 Scoping on the Power Development Plan
Scoping items
Type of power generation
Reason Thermal power (gas)
Thermalpower (coal)
Hydro power
RenewableEnergy (solar, wind)
Environm
ental
Air pollution B- A- D D Exhausted gas and wastewater could cause negative impacts on existing air, soil, and water if these are not properly treated.
Soil pollution C- C- D D
Water pollution B- B- B- D
CO2 emission B- A-
D(dam type
hydro)/ B-(pumped
storage hydro)
D
Fossil fuel such as natural gas and coal which causes CO2 emission is used for power generation. Electricity consumption with CO2 emission for pumping up water can be expected in case of pumped storage hydro power plant.
Natural resource consumption
B- B- C- D Natural resources such as gas and coal are consumed for power generation.
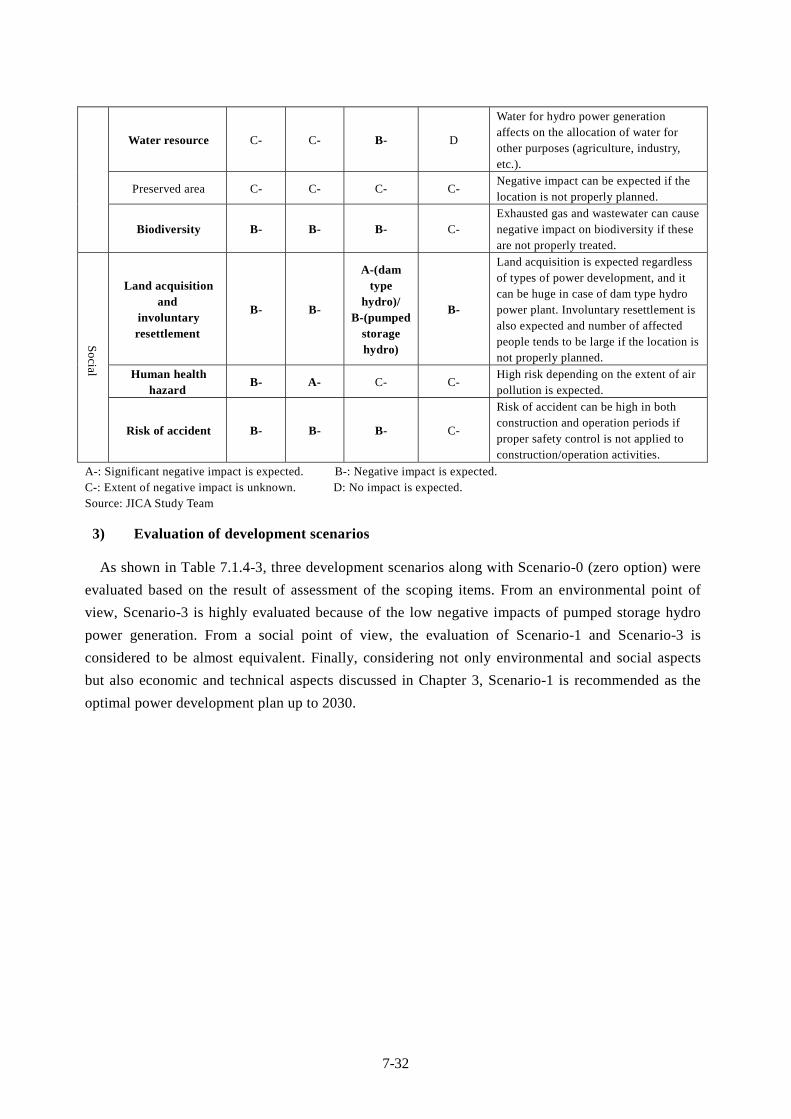
7-32
Water resource C- C- B- D
Water for hydro power generation affects on the allocation of water for other purposes (agriculture, industry, etc.).
Preserved area C- C- C- C- Negative impact can be expected if the location is not properly planned.
Biodiversity B- B- B- C- Exhausted gas and wastewater can cause negative impact on biodiversity if these are not properly treated.
Social
Land acquisition and
involuntary resettlement
B- B-
A-(dam type
hydro)/ B-(pumped
storage hydro)
B-
Land acquisition is expected regardless of types of power development, and it can be huge in case of dam type hydro power plant. Involuntary resettlement is also expected and number of affected people tends to be large if the location is not properly planned.
Human health hazard
B- A- C- C- High risk depending on the extent of air pollution is expected.
Risk of accident B- B- B- C-
Risk of accident can be high in both construction and operation periods if proper safety control is not applied to construction/operation activities.
A-: Significant negative impact is expected. B-: Negative impact is expected. C-: Extent of negative impact is unknown. D: No impact is expected. Source: JICA Study Team
3) Evaluation of development scenarios
As shown in Table 7.1.4-3, three development scenarios along with Scenario-0 (zero option) were
evaluated based on the result of assessment of the scoping items. From an environmental point of
view, Scenario-3 is highly evaluated because of the low negative impacts of pumped storage hydro
power generation. From a social point of view, the evaluation of Scenario-1 and Scenario-3 is
considered to be almost equivalent. Finally, considering not only environmental and social aspects
but also economic and technical aspects discussed in Chapter 3, Scenario-1 is recommended as the
optimal power development plan up to 2030.
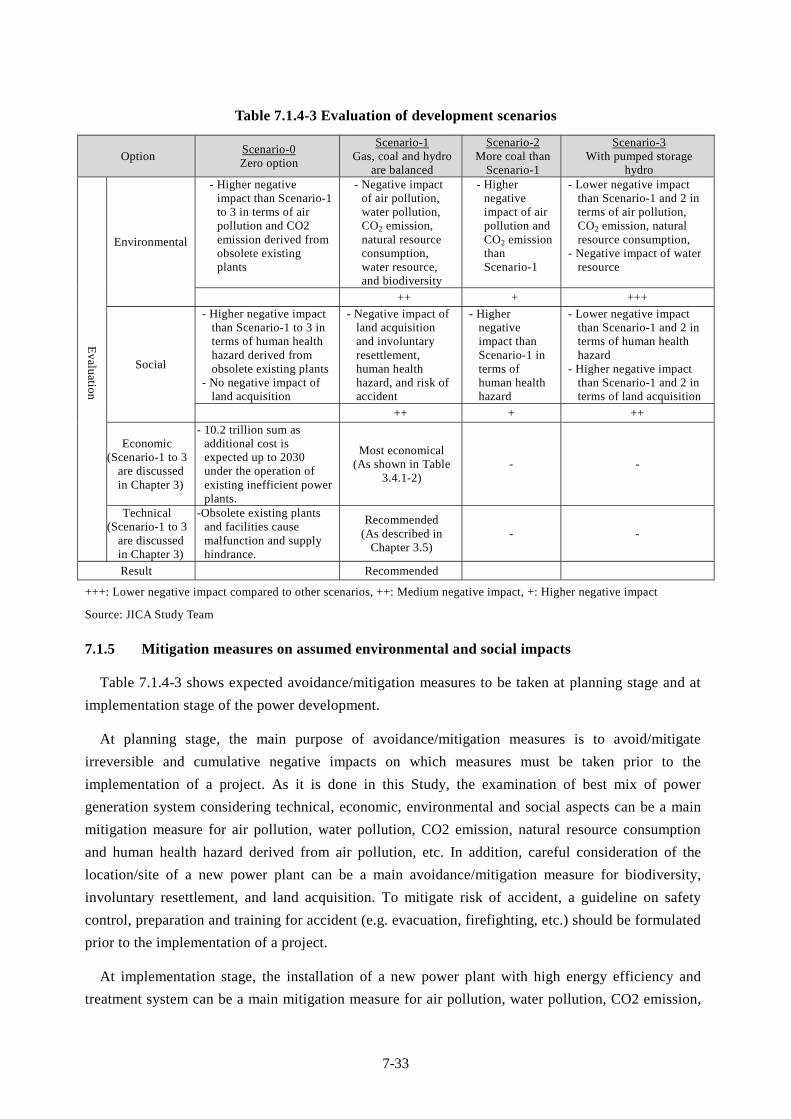
7-33
Table 7.1.4-3 Evaluation of development scenarios
Option Scenario-0 Zero option
Scenario-1 Gas, coal and hydro
are balanced
Scenario-2 More coal than
Scenario-1
Scenario-3 With pumped storage
hydro
Evaluation
Environmental
- Higher negative impact than Scenario-1 to 3 in terms of air pollution and CO2 emission derived from obsolete existing plants
- Negative impact of air pollution, water pollution, CO2 emission, natural resource consumption, water resource, and biodiversity
- Higher negative impact of air pollution and CO2 emission than Scenario-1
- Lower negative impact than Scenario-1 and 2 in terms of air pollution, CO2 emission, natural resource consumption,
- Negative impact of water resource
++ + +++
Social
- Higher negative impact than Scenario-1 to 3 in terms of human health hazard derived from obsolete existing plants
- No negative impact of land acquisition
- Negative impact of land acquisition and involuntary resettlement, human health hazard, and risk of accident
- Higher negative impact than Scenario-1 in terms of human health hazard
- Lower negative impact than Scenario-1 and 2 in terms of human health hazard
- Higher negative impact than Scenario-1 and 2 in terms of land acquisition
++ + ++
Economic (Scenario-1 to 3
are discussed in Chapter 3)
- 10.2 trillion sum as additional cost is expected up to 2030 under the operation of existing inefficient power plants.
Most economical (As shown in Table
3.4.1-2) - -
Technical (Scenario-1 to 3
are discussed in Chapter 3)
-Obsolete existing plants and facilities cause malfunction and supply hindrance.
Recommended (As described in
Chapter 3.5) - -
Result Recommended
+++: Lower negative impact compared to other scenarios, ++: Medium negative impact, +: Higher negative impact
Source: JICA Study Team
7.1.5 Mitigation measures on assumed environmental and social impacts
Table 7.1.4-3 shows expected avoidance/mitigation measures to be taken at planning stage and at
implementation stage of the power development.
At planning stage, the main purpose of avoidance/mitigation measures is to avoid/mitigate
irreversible and cumulative negative impacts on which measures must be taken prior to the
implementation of a project. As it is done in this Study, the examination of best mix of power
generation system considering technical, economic, environmental and social aspects can be a main
mitigation measure for air pollution, water pollution, CO2 emission, natural resource consumption
and human health hazard derived from air pollution, etc. In addition, careful consideration of the
location/site of a new power plant can be a main avoidance/mitigation measure for biodiversity,
involuntary resettlement, and land acquisition. To mitigate risk of accident, a guideline on safety
control, preparation and training for accident (e.g. evacuation, firefighting, etc.) should be formulated
prior to the implementation of a project.
At implementation stage, the installation of a new power plant with high energy efficiency and
treatment system can be a main mitigation measure for air pollution, water pollution, CO2 emission,
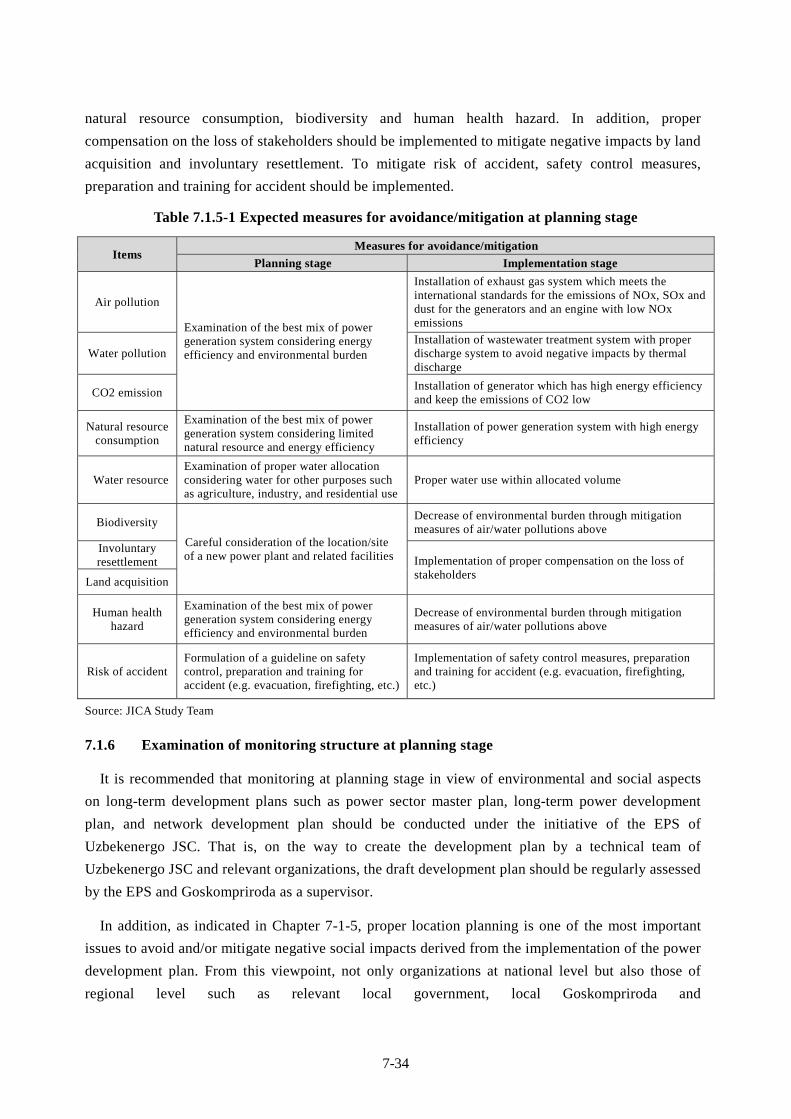
7-34
natural resource consumption, biodiversity and human health hazard. In addition, proper
compensation on the loss of stakeholders should be implemented to mitigate negative impacts by land
acquisition and involuntary resettlement. To mitigate risk of accident, safety control measures,
preparation and training for accident should be implemented.
Table 7.1.5-1 Expected measures for avoidance/mitigation at planning stage
Items Measures for avoidance/mitigation
Planning stage Implementation stage
Air pollution
Examination of the best mix of power generation system considering energy efficiency and environmental burden
Installation of exhaust gas system which meets the international standards for the emissions of NOx, SOx and dust for the generators and an engine with low NOx emissions
Water pollution Installation of wastewater treatment system with proper discharge system to avoid negative impacts by thermal discharge
CO2 emission Installation of generator which has high energy efficiency and keep the emissions of CO2 low
Natural resource consumption
Examination of the best mix of power generation system considering limited natural resource and energy efficiency
Installation of power generation system with high energy efficiency
Water resource Examination of proper water allocation considering water for other purposes such as agriculture, industry, and residential use
Proper water use within allocated volume
Biodiversity
Careful consideration of the location/site of a new power plant and related facilities
Decrease of environmental burden through mitigation measures of air/water pollutions above
Involuntary resettlement Implementation of proper compensation on the loss of
stakeholders Land acquisition
Human health hazard
Examination of the best mix of power generation system considering energy efficiency and environmental burden
Decrease of environmental burden through mitigation measures of air/water pollutions above
Risk of accident Formulation of a guideline on safety control, preparation and training for accident (e.g. evacuation, firefighting, etc.)
Implementation of safety control measures, preparation and training for accident (e.g. evacuation, firefighting, etc.)
Source: JICA Study Team
7.1.6 Examination of monitoring structure at planning stage
It is recommended that monitoring at planning stage in view of environmental and social aspects
on long-term development plans such as power sector master plan, long-term power development
plan, and network development plan should be conducted under the initiative of the EPS of
Uzbekenergo JSC. That is, on the way to create the development plan by a technical team of
Uzbekenergo JSC and relevant organizations, the draft development plan should be regularly assessed
by the EPS and Goskompriroda as a supervisor.
In addition, as indicated in Chapter 7-1-5, proper location planning is one of the most important
issues to avoid and/or mitigate negative social impacts derived from the implementation of the power
development plan. From this viewpoint, not only organizations at national level but also those of
regional level such as relevant local government, local Goskompriroda and

7-35
Goskomzemgeodezkadastr should also be involved in the assessment on the draft development plan if
necessary.
Monitoring structure at implementation stage which project proponent (construction stage) and
operator (operation stage) are involved is discussed in Chapter 7-2-3 below.
7.2 Scoping on Priority Projects
7.2.1 Outline of priority projects
Candidates of priority projects proposed in the power development plan consist of ten power plants
including five gas power plants, two coal power plants, and three heat and power supply stations as
shown in Table 7.2.1-1. In Table 7.2.1-1, “Availability of building lot”, “Possibility of the
improvement of environmental impact”, and “Possibility of land acquisition/ involuntary resettlement”
are based on the result of existing site survey.
Further details are described in Chapter 5 “Priority Projects”.
Table 7.2.1-1 Outline of priority projects (extracted from Chapter 5)
No. Name of power plant Type of power plant/ Generation capacity
Expected operation
year
Availability ofbuilding lot
Possibility of the improvement of environmental
impact
Possibility of land
acquisition/ involuntary resettlement
1 Navoiy
thermal power plant GTCC/450MW 2021 Reserved
Improvement expected
Partly expected
2 Talimarjan
thermal power plant GTCC/450MW GTCC/450MW
2021 2022
Reserved Improvement
expected Not expected
3 Syrdarya
thermal power plant GTCC/450MW GTCC/450MW
2018 2019
Reserved Improvement
expected Partly
expected
4 Turakurgan
thermal power plant GTCC/450MW 2024 Reserved None Not expected
5 Tashkent
thermal power plant GTCC/450MW 2024
To be replaced with existing
plant
Improvement expected
Not expected
6 Angren
coal-fired power plantCoal-fired/150MW 2021 Reserved
Improvement expected
Partly expected
7 Novoangren
coal-fired power plantCoal-fired/300MW 2024 Reserved
Improvement expected
Not expected
8 Tashkent heat and
power supply station GTCS/27MW
(2 units) 2020 Reserved
Improvement expected
Not expected
9 Mubarek heat and
power supply station GTCS/140MW 2019 Reserved
Improvement expected
Not expected
10 Fergana heat and
power supply station GTCC/57.7MW 2018 Reserved None Not expected
Source: JICA Study Team
7.2.2 Result of scoping on priority projects
Priority projects can be categorized by types of power generation: gas and coal. And, there are a lot
of common positive/negative impacts derived from power generation by gas and by coal respectively.
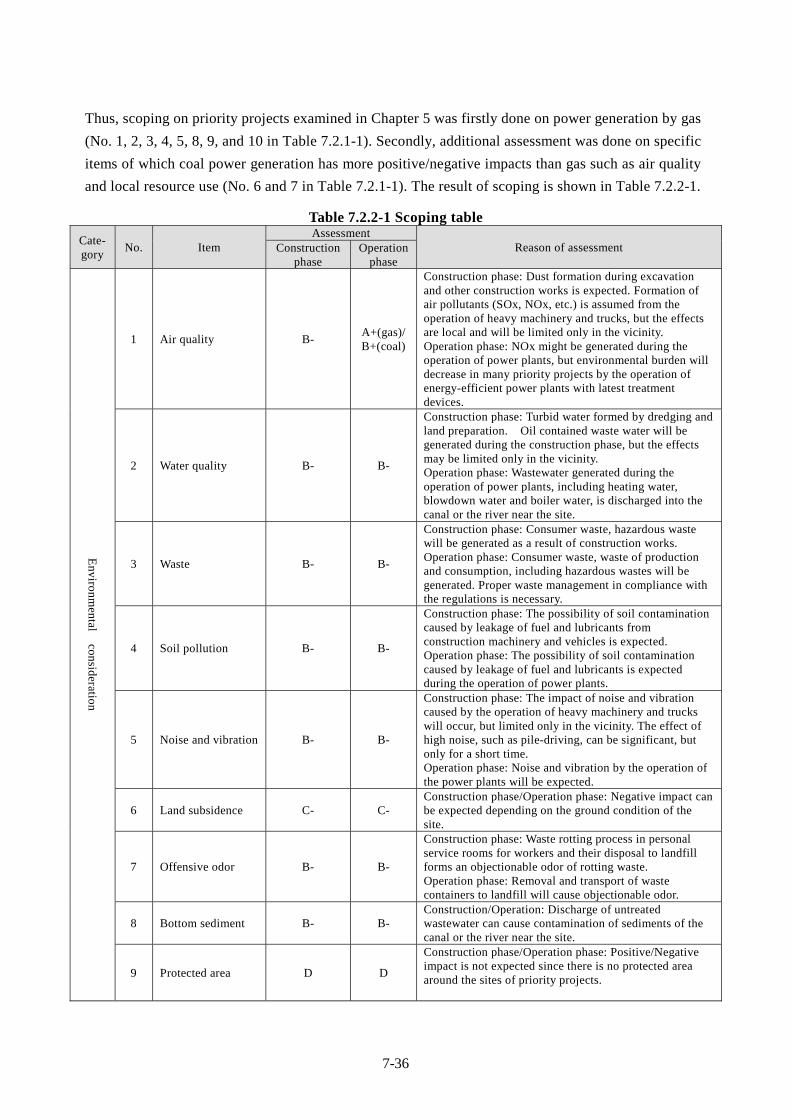
7-36
Thus, scoping on priority projects examined in Chapter 5 was firstly done on power generation by gas
(No. 1, 2, 3, 4, 5, 8, 9, and 10 in Table 7.2.1-1). Secondly, additional assessment was done on specific
items of which coal power generation has more positive/negative impacts than gas such as air quality
and local resource use (No. 6 and 7 in Table 7.2.1-1). The result of scoping is shown in Table 7.2.2-1.
Table 7.2.2-1 Scoping table
Cate-gory
No. Item Assessment
Reason of assessment Construction phase
Operation phase
Environm
ental consideration
1 Air quality B- A+(gas)/ B+(coal)
Construction phase: Dust formation during excavation and other construction works is expected. Formation of air pollutants (SOx, NOx, etc.) is assumed from the operation of heavy machinery and trucks, but the effects are local and will be limited only in the vicinity. Operation phase: NOx might be generated during the operation of power plants, but environmental burden will decrease in many priority projects by the operation of energy-efficient power plants with latest treatment devices.
2 Water quality B- B-
Construction phase: Turbid water formed by dredging and land preparation. Oil contained waste water will be generated during the construction phase, but the effects may be limited only in the vicinity. Operation phase: Wastewater generated during the operation of power plants, including heating water, blowdown water and boiler water, is discharged into the canal or the river near the site.
3 Waste B- B-
Construction phase: Consumer waste, hazardous waste will be generated as a result of construction works. Operation phase: Consumer waste, waste of production and consumption, including hazardous wastes will be generated. Proper waste management in compliance with the regulations is necessary.
4 Soil pollution B- B-
Construction phase: The possibility of soil contamination caused by leakage of fuel and lubricants from construction machinery and vehicles is expected. Operation phase: The possibility of soil contamination caused by leakage of fuel and lubricants is expected during the operation of power plants.
5 Noise and vibration B- B-
Construction phase: The impact of noise and vibration caused by the operation of heavy machinery and trucks will occur, but limited only in the vicinity. The effect of high noise, such as pile-driving, can be significant, but only for a short time. Operation phase: Noise and vibration by the operation of the power plants will be expected.
6 Land subsidence C- C- Construction phase/Operation phase: Negative impact can be expected depending on the ground condition of the site.
7 Offensive odor B- B-
Construction phase: Waste rotting process in personal service rooms for workers and their disposal to landfill forms an objectionable odor of rotting waste. Operation phase: Removal and transport of waste containers to landfill will cause objectionable odor.
8 Bottom sediment B- B- Construction/Operation: Discharge of untreated wastewater can cause contamination of sediments of the canal or the river near the site.
9 Protected area D D
Construction phase/Operation phase: Positive/Negative impact is not expected since there is no protected area around the sites of priority projects.

7-37
Cate-gory
No. Item Assessment
Reason of assessment Construction phase
Operation phase
10 Ecosystem C- C- Construction phase/Operation phase: Negative impact can be expected depending on the natural environmental condition of the site.
11 Hydrology C- C- Construction phase/Operation phase: Negative impact can be expected depending on the condition of water use for construction and operation of the power plant.
12 Topography, geological feature
C- C- Construction phase/Operation phase: Negative impact can be expected depending on the ground condition of the site.
Social consideration
13 Involuntary resettlement and land acquisition
B- D Construction phase: Involuntary resettlement and land acquisition near the project site are partly expected in Navoiy, Syrdaria, and Angren power plants.
14 Poor people C- C- Construction phase/Operation phase: Negative impact can be expected depending on the condition of the project affected people.
15 Ethnic minorities and indigenous peoples
C- C- Construction phase/Operation phase: Negative impact can be expected depending on the condition of the project affected people.
16 Local economy
B+/ C-(in case of
land acquisition)
B+
Both job creations at construction phase and that at operation phase contribute to the activation of local economy. In case of land acquisition, negative impact on local economy can be expected depending on the condition of land owner.
17 Land use and local resource use
C- B+(gas)/ A+(coal)
Construction phase: In addition to the land of existing power plants, additional land for extension and/or adjoining facilities might be needed. Operation phase: Gas and/or coal as local resources will be consumed, but fuel efficiency will become much higher than that of existing power plants.
18 Water use C- C- Construction phase/Operation phase: Negative impact can be expected depending on the condition of water use for construction and operation of the power plant.
19 Existing social infrastructure and social service
D A+ Operation phase: Power supply as a part of social infrastructure will be stable and reliable.
20 Social capital and social organizations
D D
Construction/Operation: Negative impact is not expected since construction/operation of the priority projects do not affect on existing/future social capital and specific social organization.
21 Equality of benefits and losses
D D
Construction/Operation: Negative impact in terms of equality of benefits and losses is not expected since the beneficiaries of the priority projects are not limited to people of specific economic/social stratum.
22 Local conflict C- C- Construction phase/Operation phase: Negative impact such as conflict between workers and residents can be expected depending on the condition of the site.
23 Cultural heritage D D Construction/Operation: Negative impact is not expected since there is no cultural heritage around the sites of priority projects.
24 Landscape C- C- Construction phase/Operation phase: Negative impact can be expected depending on the condition of the site and types of plant to be constructed.
25 Gender C- C- Construction phase/Operation phase: Negative impact can be expected depending on the condition of the project affected people.
26 Rights of the child C- C-
Construction phase/Operation phase: Negative impact can be expected depending on the condition of the project affected people and the situation of child labor in construction sector of Uzbekistan.

7-38
Cate-gory
No. Item Assessment
Reason of assessment Construction phase
Operation phase
27 Infectious diseases B- D
Construction phase: Temporary influx of migrants during the construction period may increase the risk of infectious diseases. Therefore, periodic medical examinations are required. Operation phase: only limited personnel will access to the facility and property. Therefore, there is no high risk of infections envisaged.
28 Work Environment B- B- Construction/Operation: Occupational injuries of workers are projected during the construction and operation works.
Others
29 Accident B- B-
Construction phase: Possibility of accidents during the construction works and operation of construction machines. Operation phase: Probability of accidents during operation of the facility and operation of vehicles.
30 Cross-boundary impact and climate change
C- A+
Construction phase: Negative impact can be expected depending on the condition of the site. Operation phase: CO2 generated during operation of priority projects is lower than that from existing power plants. So, the impact on climate change will be positive.
Evaluation A+/-: Significant positive / negative impact is expected. Evaluation B+/-: Positive / negative impact is expected to some extent. Evaluation C+/-: Positive / Negative impact is not clear. (Further examination is necessary, and level of impact becomes clear by the progress of the examination.) Evaluation D: No impact is expected Source: JICA Study Team
7.2.3 Recommendation of monitoring structure and monitoring method
Table 7.2.3-1 shows expected monitoring methods and responsible organizations for the
monitoring on priority projects at implementation stage which is composed of construction phase and
operation phase.
In construction phase, it is recommended that monitoring on environmental and social aspects is
conducted by main contractor under the supervision of Project Management Unit to be formulated in
Uzbekenergo JSC in cooperation with private consultant which has expertise in specific field such as
environment and health. In addition, regularly measured indicators shown in Table 7.2.3-1 should be
properly reported to the local Goskompriroda via the PMU of Uzbekenergo JSC. The budget for
monitoring should be included in contract cost by main contractor prior to the conclusion of contract.
In operation phase, monitoring should be conducted by the operator of a priority project under the
supervision of local Goskompriroda. In addition, necessary expense for regular monitoring should be
included in operation cost in advance.
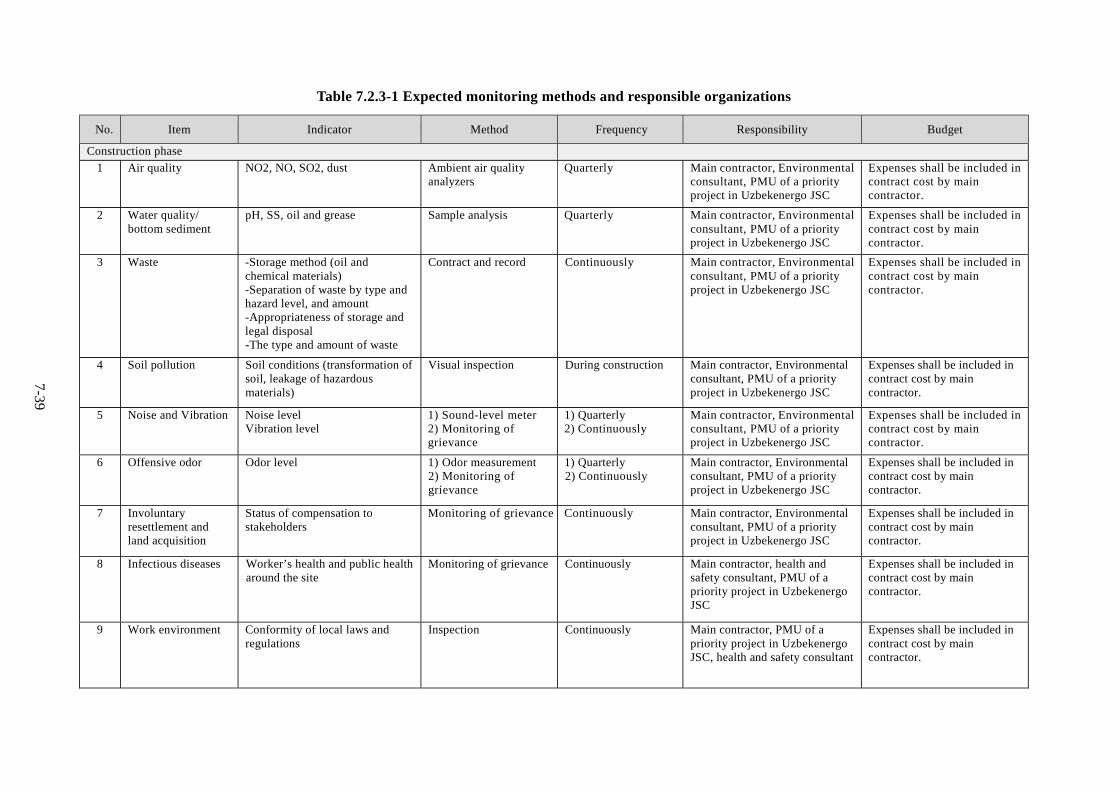
7-39
Table 7.2.3-1 Expected monitoring methods and responsible organizations
No. Item Indicator Method Frequency Responsibility Budget
Construction phase
1 Air quality NO2, NO, SO2, dust Ambient air quality analyzers
Quarterly
Main contractor, Environmental consultant, PMU of a priority project in Uzbekenergo JSC
Expenses shall be included in contract cost by main contractor.
2 Water quality/ bottom sediment
pH, SS, oil and grease Sample analysis Quarterly
Main contractor, Environmental consultant, PMU of a priority project in Uzbekenergo JSC
Expenses shall be included in contract cost by main contractor.
3 Waste -Storage method (oil and chemical materials) -Separation of waste by type and hazard level, and amount -Appropriateness of storage and legal disposal -The type and amount of waste
Contract and record Continuously Main contractor, Environmental consultant, PMU of a priority project in Uzbekenergo JSC
Expenses shall be included in contract cost by main contractor.
4 Soil pollution Soil conditions (transformation of soil, leakage of hazardous materials)
Visual inspection During construction Main contractor, Environmental consultant, PMU of a priority project in Uzbekenergo JSC
Expenses shall be included in contract cost by main contractor.
5 Noise and Vibration Noise level Vibration level
1) Sound-level meter 2) Monitoring of grievance
1) Quarterly 2) Continuously
Main contractor, Environmental consultant, PMU of a priority project in Uzbekenergo JSC
Expenses shall be included in contract cost by main contractor.
6 Offensive odor Odor level 1) Odor measurement 2) Monitoring of grievance
1) Quarterly 2) Continuously
Main contractor, Environmental consultant, PMU of a priority project in Uzbekenergo JSC
Expenses shall be included in contract cost by main contractor.
7 Involuntary resettlement and land acquisition
Status of compensation to stakeholders
Monitoring of grievance Continuously Main contractor, Environmental consultant, PMU of a priority project in Uzbekenergo JSC
Expenses shall be included in contract cost by main contractor.
8 Infectious diseases Worker’s health and public health around the site
Monitoring of grievance Continuously Main contractor, health and safety consultant, PMU of a priority project in Uzbekenergo JSC
Expenses shall be included in contract cost by main contractor.
9 Work environment Conformity of local laws and regulations
Inspection Continuously Main contractor, PMU of a priority project in Uzbekenergo JSC, health and safety consultant
Expenses shall be included in contract cost by main contractor.
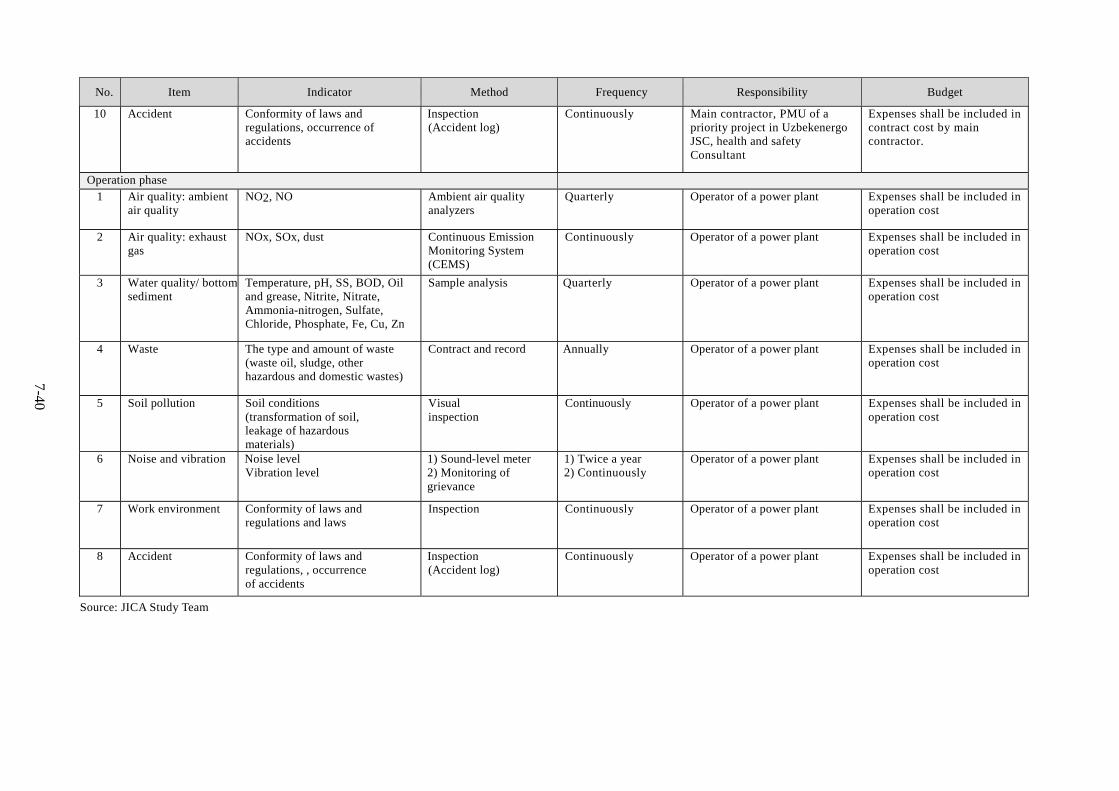
7-40
No. Item Indicator Method Frequency Responsibility Budget
10 Accident Conformity of laws and regulations, occurrence of accidents
Inspection (Accident log)
Continuously Main contractor, PMU of a priority project in Uzbekenergo JSC, health and safety Consultant
Expenses shall be included in contract cost by main contractor.
Operation phase
1 Air quality: ambient air quality
NO2, NO Ambient air quality analyzers
Quarterly Operator of a power plant Expenses shall be included in operation cost
2 Air quality: exhaust gas
NOx, SOx, dust Continuous Emission Monitoring System (CEMS)
Continuously Operator of a power plant Expenses shall be included in operation cost
3 Water quality/ bottom sediment
Temperature, pH, SS, BOD, Oil and grease, Nitrite, Nitrate, Ammonia-nitrogen, Sulfate, Chloride, Phosphate, Fe, Cu, Zn
Sample analysis Quarterly
Operator of a power plant Expenses shall be included in operation cost
4 Waste The type and amount of waste (waste oil, sludge, other hazardous and domestic wastes)
Contract and record Annually
Operator of a power plant Expenses shall be included in operation cost
5 Soil pollution Soil conditions (transformation of soil, leakage of hazardous materials)
Visual inspection
Continuously Operator of a power plant Expenses shall be included in operation cost
6 Noise and vibration Noise level Vibration level
1) Sound-level meter 2) Monitoring of grievance
1) Twice a year 2) Continuously
Operator of a power plant Expenses shall be included in operation cost
7 Work environment Conformity of laws and regulations and laws
Inspection Continuously Operator of a power plant Expenses shall be included in operation cost
8 Accident Conformity of laws and regulations, , occurrence of accidents
Inspection (Accident log)
Continuously Operator of a power plant Expenses shall be included in operation cost
Source: JICA Study Team

7-41
7.3 Stakeholder’s Meeting
7.3.1 Objective of the Stakeholder’s Meeting
The objective of the Stakeholder’s Meeting is to collect stakeholders’ opinions and concerns in
view of environmental, biophysical, economic, and social aspects at the early stage of the
examination of the development plan and to reflect the opinions to the development plan.
7.3.2 Result of the Stakeholder’s Meeting
As a part of the SEA activity for making power development plan, two Stakeholder’s Meetings
were held during the examination of the power development plan in the following manner.
(1) The first Stakeholder’s Meeting held on 8th April, 2015
1) Agenda
Objectives of the implementation of
JICA projects
A summary of the Master Plan Study
for Power Sector Development in
Uzbekistan
Outline and objective of the SEA
2) Participants
Representatives from environmental
protection service of Uzbekenergo JSC,
Goskompriroda, Ministry of Agriculture and water resources, design institutes, JICA Study
team and 20 engineers of Uzbekenergo JSC
3) Main points discussed
Economic activity in Uzbekistan should shift to more environmentally friendly way, and
the power sector master plan should correspond to this trend.
Power development and network development should be properly combined in the master
plan.
Development of renewable energy should be further promoted in the master plan.
The result of existing power sector study done by German consultant4 should be taken
into account for making the master plan.
Though legislative structure for SEA has not been established in Uzbekistan, experience
4 Asian Development Bank Technical Assistance Consultant’s Report “Central Asia Regional Economic Cooperation:
Power Sector Regional Master Plan” (Cofinanced by the Regional Cooperation and Integration Fund under the Regional Cooperation and Integration Financing Partnership Facility) Prepared by Siegfried Grunwald Fichtner GmbH & Co. KG Stuttgart, Germany, October 2012
The first Stakeholder’s Meeting
held on 8th April, 2015
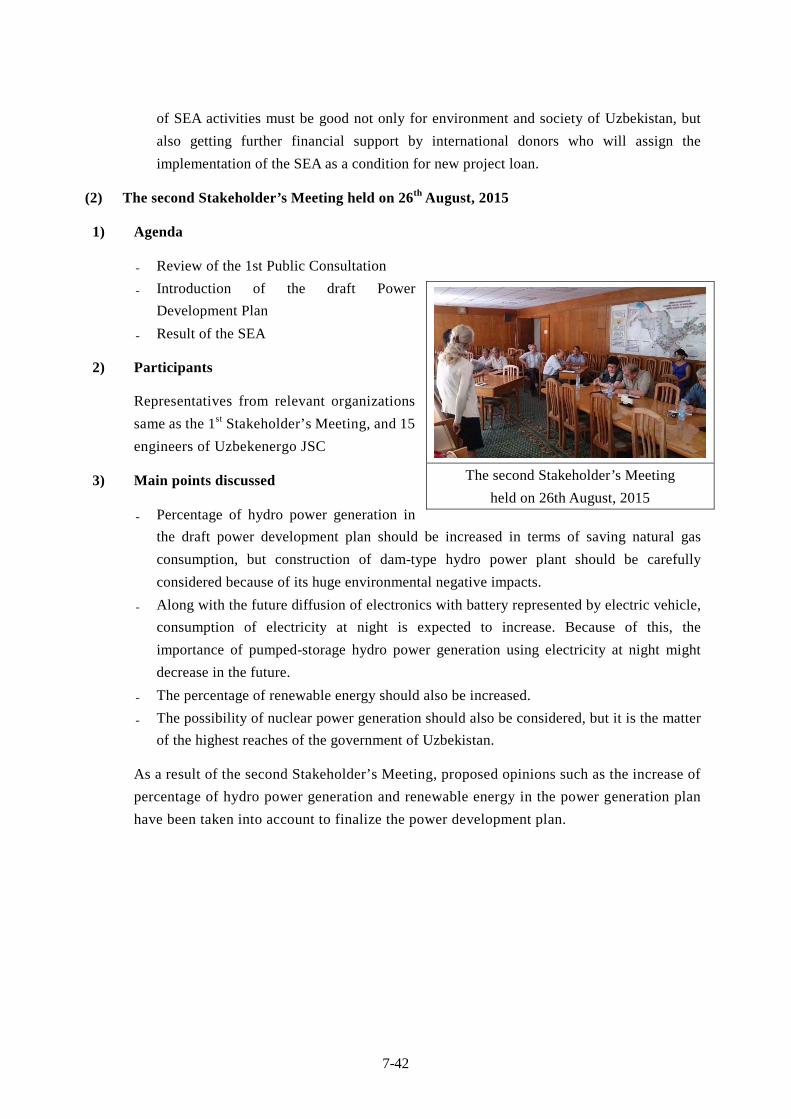
7-42
of SEA activities must be good not only for environment and society of Uzbekistan, but
also getting further financial support by international donors who will assign the
implementation of the SEA as a condition for new project loan.
(2) The second Stakeholder’s Meeting held on 26th August, 2015
1) Agenda
Review of the 1st Public Consultation
Introduction of the draft Power
Development Plan
Result of the SEA
2) Participants
Representatives from relevant organizations
same as the 1st Stakeholder’s Meeting, and 15
engineers of Uzbekenergo JSC
3) Main points discussed
Percentage of hydro power generation in
the draft power development plan should be increased in terms of saving natural gas
consumption, but construction of dam-type hydro power plant should be carefully
considered because of its huge environmental negative impacts.
Along with the future diffusion of electronics with battery represented by electric vehicle,
consumption of electricity at night is expected to increase. Because of this, the
importance of pumped-storage hydro power generation using electricity at night might
decrease in the future.
The percentage of renewable energy should also be increased.
The possibility of nuclear power generation should also be considered, but it is the matter
of the highest reaches of the government of Uzbekistan.
As a result of the second Stakeholder’s Meeting, proposed opinions such as the increase of
percentage of hydro power generation and renewable energy in the power generation plan
have been taken into account to finalize the power development plan.
The second Stakeholder’s Meeting
held on 26th August, 2015

ATTACHMENT Contact List

A-1
ATTACHMENT Contact List
Name Title
Uzbekenergo JSC
Mr. Djamshid Abdusalamov Head of the Department for Foreign Economic Relations and Investments
Mr. Artikov Rovshan Head of the Department for the long-term development of the energy sector
Mr. Mirzaev Abdurashid Chief, National Load Diapatch Center
Mr. Shamsiev Khamidulla Omonovich Chief, Coordinating Dispatch Center
Mr. Nurullaev Lutfulla Chief Spacialist, Department of Operation of Electrical Networks (UEES)
Mr. Djuma Аbdulaevich Specialist, Department of operation and maintenance of the power plants
Mr. Dusmamatov Adkham Chief Enginieer, UE "Uzelectroset"
Ms. Magfirat Muminova Head of the Environmental Protection Department
Mr. Akhmedov Abdulla Deputy Head, Department of Realization of Investment Projects (URIP)
Mr. Kamalov Zafarjon Deputy Chief Engineer, UK "Uzelektrtarmok"
Mr. Krushennikov Evgeniy Head of service, Central service of relay protection and electroautomatic
Mr. Sultonmurod Tukhtaev Specialist, Foreign Economic Relations and Investments Department
Tashkent Combined Heat and Power Plant (TashTETs)
Mr. Ruslan Mubarakshin Director
Mrs. Maksudova Svetlana Deputy Director
Mr. Nagiev Aleksandr Head of Department
Mr. Khalikov Zukhriddin Head Engineer

A-2
Uzbekenergo JSC (Navoi TPP)
Tulkin Chief Engineer
Yakubov Azimjon Deputy Chief Engineer
Uzbekenergo JSC (Mubarek TPC)
Khaitov Rakhatali Mashrabalievich Chief Engineer
Khudaikulov Ilkhom Abdibakhramovich Head of Section
Khaitov Ikhtiyor Batirovich Deputy Director
Rakhmanov Khudoishukur Murodullaevich Head of Section
Uzbekenergo JSC (Talimardzhan TPP)
Khudoikulov Abdibahrom Gadoevich Chief Engineer
Kadirov Rakhmatilla Deputy Chief Engineer
Chorshanbiev Soat Head of Operation and Technical Department
Alisher aka Director Assistant
Uzbekenergo JSC (Tashkent TPC)
Maksudova Svetlana Mukhitdinovna Deputy Director
Uzbekenergo JSC (Tashkent TPP)
Ercenin Oleg Glebovich Head of Operation and Technical Department
Uzbekenergo JSC (Syr-Darya TPP)
Mamadjanov Gairat Deputy Director of Capital Construction
Uzbekenergo JSC (Angren TPP)
Makhamatkulov Karim Akramovich Chief Engineer
Umirov Bakhrom Deputy Chief Engineer
Uzbekenergo JSC (Novo-Angren TPP)
Oltibaev Bektimir Tashbaltaevich Deputy Director of Capital Construction
Merganov Gairat Ganievich Chief Engineer
A-3
Ministry of Economy
Mr. Khurshid Kh. Rakhmatullaev Head of Department for Fuel & Energy Sector
Mr. Vakhobov Javokhir Leading Specialist, International Depertment
Mr. Shamsiddinov Sherzod Head Specialist
Mr. Djuraev Ilhom Head Specialist
Uzbek State institute Uztyazhneftegazkhim project
Mr. Markhamat M. Nasretdinova The first deputy of director - the general Engineer
Mrs. Nasretdinova Markhamat Specialist
Fund for Reconstruction and Development of Uzbekistan (FRDU)
Mr. Iskander Buranov Chief of Department
Ministry of foreign economic relations, investment and trade (MFERIT)
Mr. Egamov Ulugbek Chief Specialist
Ministry of Finance
Mr. Egamov Ulugbek Chief Specialist
OJSC Tashteplocentral
Mr. Pichulin Aleksei Head of section
Mr. Ismailov Sandjar Deputy Chief Engineer
Mrs. Samonova Natalya Head of service
Tashteploenergo
Mr. Anatoliy Kiryushenkov Director
Mr. Sultonov Sherzod Chief Engineer
Mr. Jalilov Zuhriddin Deputy Chief Engineer
Tashkent City Territorial Communal-operational Association (TGTKEO)
Mr. Ilkhom R. Makhkamov General Director
Mr. Bekmirzaev Oybek Head of Department
Mr. Jalilov Zukhriddin Deputy Chief Engineer

A-4
"TeploElectroProject" OJSC (TEP)
Mr. Sayfulla Shaismatov Director
Mrs. Aleftina Polegaeva Chief Project Engineer
Mrs. Tatyana B. Baymatova Technical Director
Mr. Evgeniy Kalinin Deputy Technical Director
Mr. Salyamov Abduvali Chief of Electrical Engineering Department
"SredazEnergoSetProject" JSC
Mr. Kulbackiy Dmitry Ivanovich Director
Mrs. Karataeva Natalya Head of design energy system sector
TashGorPES
Mr. Zamaliddinov Genady Abdurakhmanovich Head of dispatch service
Mr. Saydullaev Dilmurod Chief Engineer, TashGorPES
Mrs. Kim Svetlana Deputy Head, "Production and technical service"
Mr. Mamarahimov Sayfiddin Head of Keles Substation
Mr. Tadzhihodzhaev Saidulla Head of Severnaya Substation
Mr. Inoyatov Nazim Head of Department, TashGorPES
Mr. Djavharov Abdukakhor Head of section, TashGorPES
Institute of Forecasting and Macroeconomic Research(IFMR)
Mr. Sergey Chepel Chef of Macro Economic
Ms. Elvirar Bikeyeva Leader Researcher of Energy sector Projection
Ms. Sanemkhan Nurillarva International Department
Mr. Djahongir Muinov Head of Project
The State Committee of the Republic of Uzbekistan on Nature Protection
Mr. Alexander Grigoryants Acting for the Chief of the State Biology Control
Mr. Makhamatmusso Babakhodjaev The Chief of Land and Water Control
Mr. Akmal Sidykov Deputy Chief of the State Environmental Assessment
Mr. Elena Kim Chief Specialist of the International Relations and Programs
Mr. Victor Tarasov Chief Specialist of State Environmental Assessment
Mr. Timur Khudaybergenov Chief Specialist of State Environmental Assessment
Mr. Umid Abdudjalilov Chief Specialist of the State Atmosphere Control

A-5
NHC Uzbekneftegas
Mr. Azarov Eleg Head of Balanced Development of Industries Department
Uztransgas
Mr. Bashirov Sabir Chief of Underground Pipelines Service Department
Mr. Sadullaev Zafar Head of Gas Pipelines Department
Mr. Muhamedov Skuhrat Deputy Chief of Main Gas Pipelines Department
Mr. Usmankhodjaev Nodir Representative
Tashkentshahargas
Mr. Abdusattar Kayumov Director
Mr. Soatov Mirsadyk Chief
Mr. Saviev Takhir Deputy Chief of Gas Suuply Department
Mr. Tadjief Shukhrat Chief Engineer
Mr. Asadullaev Abdulla Chief Specialist
Mr. Usmonov Komiljon Chief of Wholesale Consumers Department
Mr. Usmonov Komiljon Chief of Wholesale Consumers Department
Mrs. Usadova Gulya Chief Dispatcher
Mrs. Yelena Kashkarova Instrument & Control Engineer
Uzbekistan Railways
Mr. Mamatmuradov Gairat Chief Engineer of power supply Center
Mr. Kunanbaev Bekzod Head of OPMS-203
Mr. Savchenko Viktor Deputy Head of OPMS-203
Mr. Yusupov Jamshid Chief Engineer of PCH-1
Mr. Oripov Farrukh Senior Engineer of strategic development department
Mr. Padgamirov Ruslan Senior electrician of Chukursay substation, Tashkent distance power supply
Mr. Safaev Safarboy Deputy Head of the track facilities Department
Mr. Raimov Farukh Deputy Head of distance, signaling and communication Department
Mr. Atalaev Khabibullo Deputy Head of signaling and communication Center
Mr. Salimov Saidakbar Deputy General Director of UP Uzbekjeldorekspediciya
Mr. Gimatillaev Takhir Head of the track facilities Department
Mr. Akbarov M. Head signaling Centre

A-6
Mr. Pulatov Shukhrat Head of strategic development Department
Mr. Norkabilov Sirojiddin Head of transportation Department
Mr. Narzullaev Zufar Head of Management of capital construction
Mr. Pirov Rakhim Head of Freigt transportation Department
Mr. Khamidov Aziz Deputy Head of power supply Centre
Mr. Ismailov Khalmurod Director, OJSC Tashtemiryulloyiha
Mr. Ruziev Rustam Director, JSC Boshtransloyiha
The World Bank Uzbekistan Country Office
Mr. Iskander Buranov Energy Specialist
Embassy of Japan in Uzbekistan
Mr. Fumihiko KATO Ambassador
Mr. Masayuki ICHIKAWA Second Secretary
JICA Uzbekistan Office
Mr. SHIKANO Masao Chief Representative
Mr. ASAMI Eiji Senior Representative
Mr. HUKUMORI Daisuke Representative
Ms. MIYAKE Yukako Representative
Mr. Bakhodir Mardonov Program Officer
