preparation for college mathematics - hawkes learning€¦ · vertical lines. recognize the...
TRANSCRIPT

685 Chapter 6 Graphing Linear Equations
© H
awke
s Le
arn
ing
Sys
tem
s. A
ll ri
gh
ts re
serv
ed.
6.3 The Slope-Intercept Form
Objective A The Meaning of Slope
If you ride a bicycle up a mountain road, you certainly know when the slope (a measure of steepness called the grade for roads) increases because you have to pedal harder. The contractor who built the road was aware of the slope because trucks traveling the road must be able to control their downhill speed and be able to stop in a safe manner. A carpenter given a set of house plans calling for a roof with a pitch of 7 : 12 knows that for every 7 feet of rise (vertical distance) there are 12 feet of run (horizontal distance). That is, the
ratio of rise to run is riserun
=7
12.
12’ run7’ rise
Figure 1
Note that this ratio can be in units other than feet, such as inches or meters. (See Figure 2.)
riserun
= = =7
123 56
1424
inches inches
feet feet
feet feet
.
24' run
12' run
6' run 12"
12" run
14' r
ise7'
ris
e
3.5'
ris
e
7"
7" rise
Figure 2
For a line, the ratio of rise to run is called the slope of the line. The graph of
the linear equation y x= +13
2 is shown in Figure 3. What do you think is the
slope of the line? Do you think that the slope is positive or negative? Do you
think the slope might be 13
31
2? ? ?
Interpret the slope of a line as a rate of change.
Calculate the slope of a line given two points that lie on the line.
Find the slopes of and graph horizontal and vertical lines.
Recognize the slope-intercept form for a linear equation in two variables: y = mx + b.
A
B
C
D
Objectives
HAWKES LE
ARNING
SAMPLE
© All R
ights
Rese
rved.

© H
awke
s Le
arn
ing
Sys
tem
s. A
ll ri
gh
ts re
serv
ed.
The Slope-Intercept Form Section 6.3 686
run = 9
rise = 33
1
y
x
13
slope = = =39
riserun
Figure 3
The concept of slope also relates to situations that involve rate of change. For example, the graphs in Figure 4 illustrate slope as miles per hour that a car travels and as pages per minute that a printer prints.
mile
s
hours2 4 6 8 10
45
135
225
315
405
495
45 mph
rise = 90
run = 2
page
s
minutes2 4
50
75
100
125
25 pagesper minute
6
rise = 50
run = 2
slope = rate of change slope = rate of change =
=
90 miles hours mph
245
=
=
50225
pages minutes pages per minute
Figure 4
In general, the ratio of a change in one variable (say y) to a change in another variable (say x) is called the rate of change of y with respect to x. Figure 5 shows how the rate of change (the slope) can change over periods of time.
014001600170018001900200021002200
2005 2006 2007 2008 2009
Year
In M
illio
ns o
f Dol
lars
Personal Computer Sales
010203040506070
2000 2002 2006 2008
Year
Per
cent
with
Inte
rnet
2004 20072001 2003 2005 2009
U.S. Households with Internet Access
Source: Consumer Electronics Association Source: U.S. Dept. of Commerce
Figure 5
HAWKES LE
ARNING
SAMPLE
© All R
ights
Rese
rved.
687 Chapter 6 Graphing Linear Equations
© H
awke
s Le
arn
ing
Sys
tem
s. A
ll ri
gh
ts re
serv
ed.
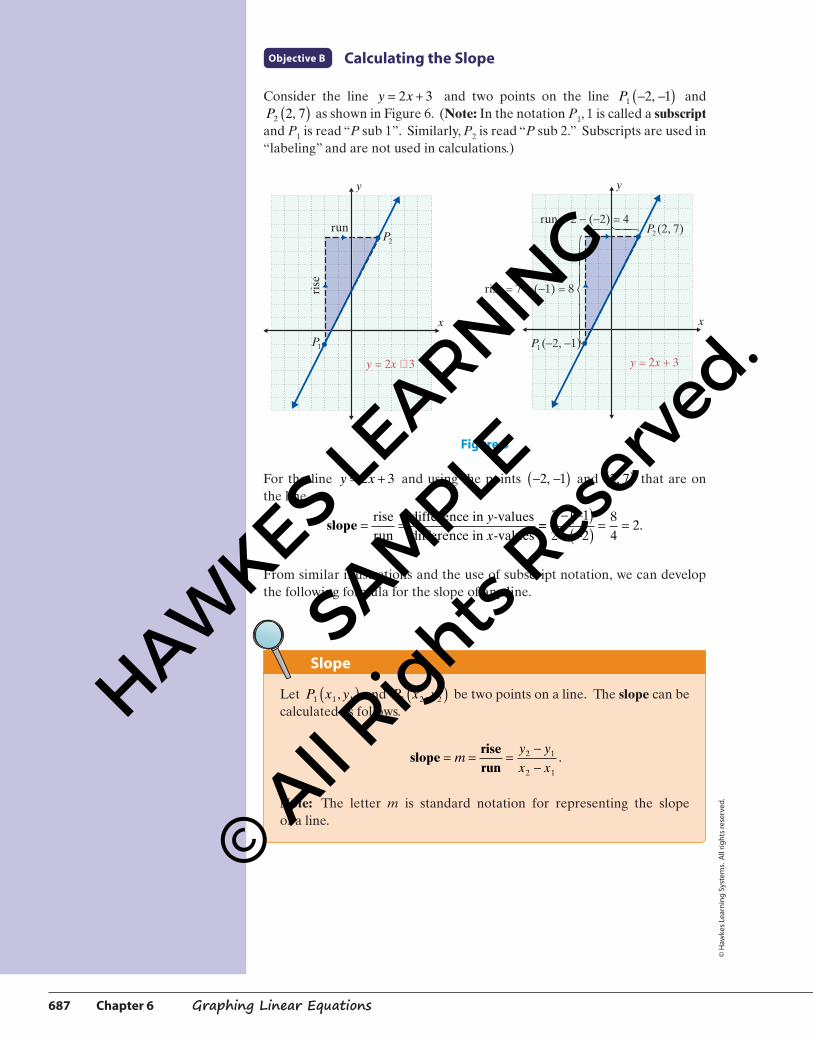
Objective B Calculating the Slope
Consider the line y x= +2 3 and two points on the line P1 2 1− −( ), and P2 2 7,( ) as shown in Figure 6. (Note: In the notation P1, 1 is called a subscript and P1 is read “P sub 1”. Similarly, P2 is read “P sub 2.” Subscripts are used in “labeling” and are not used in calculations.)
y
x
run
rise
y = 2x + 3
P1
P2
run = 2 − (−2) = 4
rise = 7 − (−1) = 8
P (−2, −1)1
P (2, 7)2
y
x
y = 2x + 3
Figure 6
For the line y x= +2 3 and using the points − −( )2 1, and 2 7,( ) that are on the line,
slope = =riserun
difference in -valuesdifference in -values
yx
==7 1
2 284
2− −( )− −( ) = = .
From similar illustrations and the use of subscript notation, we can develop the following formula for the slope of any line.
Let P x y1 1 1,( ) and P x y2 2 2,( ) be two points on a line. The slope can be calculated as follows.
sloperiserun
= = =−−
my y
x x2 1
2 1
.
Note: The letter m is standard notation for representing the slope of a line.
Slope
HAWKES LE
ARNING
SAMPLE
© All R
ights
Rese
rved.

© H
awke
s Le
arn
ing
Sys
tem
s. A
ll ri
gh
ts re
serv
ed.
The Slope-Intercept Form Section 6.3 688
P x y1 1 1,( )
y
xrise = −y y
run = −x x2 1
P x y2 2 2,
sloperiserun
= = =−−
my y
x x2 1
2 1
Figure 7
Example 1
Finding the Slope of a Line
Find the slope of the line that contains the points −( )1 2, and 3 5, ,( ) and then graph the line.
Solution
Using −( )
( )
1 2
1 1
,
,x y
and 3 5
2 2
, ,
,
( )
( )x y
slope = =−−
=−
− ( )=
−
my
x
y
x2
2
1
1
53
21
34
Or, using 3 5
1 1
,
,
( )
( )x y
and −( )
( )
1 2
2 2
, ,
,x y
slope = =−−
=−−
=−−
=
−
my
x
y
x2
2
1
1
21
53
34
34
y
x(−1, 2)
(3, 5)rise = 3run = 4
rise = −3
run = −4
1. Find the slope of the line that contains the points ( , ) ( , ),3 1 4 2− and and then graph the line.
Now work margin exercise 1.
As we see in Example 1, the slope is the same even if the order of the points is reversed. The important part of the procedure is that the coordinates must be subtracted in the same order in both the numerator and the denominator.
In general,slope =
−−
=−−
y y
x x
y y
x x2 1
2 1
1 2
1 2
.
HAWKES LE
ARNING
SAMPLE
© All R
ights
Rese
rved.

689 Chapter 6 Graphing Linear Equations
© H
awke
s Le
arn
ing
Sys
tem
s. A
ll ri
gh
ts re
serv
ed.
Example 2
Finding the Slope of a Line
Find the slope of the line that contains the points 1 3,( ) and 5 1, ,( ) and then graph the line.
Solution
Using 1 3
1 1
,
,
( )
( )x y
and 5 1
2 2
, ,
,
( )
( )x y
slope = =−−
=−
= −
m15
31
2412
y
x
(1, 3)
(5, 1)run = 4
rise = −2
2. Find the slope of the line that contains the points ( , ),( , )0 5 4 2 .
Now work margin exercise 2.
notesLines with positive slope go up (increase) as we move along the line from left to right.
Lines with negative slope go down (decrease) as we move along the line from left to right.
Objective C Slopes of Horizontal and Vertical Lines
Suppose that two points on a line have the same y-coordinate, such as −( )2 3, and 5 3, .( ) Then the line through these two points will be horizontal as shown in Figure 8. In this case, the y-coordinates of points on the horizontal line are all 3, and the equation of the line is simply y = 3. The slope is
m =− −( ) = =
−3 35 2
07
0.
For any horizontal line, all of the y-values will be the same. Consequently, the formula for slope will always have 0 in the numerator. Therefore, the slope of every horizontal line is 0.
HAWKES LE
ARNING
SAMPLE
© All R
ights
Rese
rved.

© H
awke
s Le
arn
ing
Sys
tem
s. A
ll ri
gh
ts re
serv
ed.
The Slope-Intercept Form Section 6.3 690
y
x
y = 3
(−2, 3) (5, 3)
Figure 8
If two points have the same x-coordinates, such as 1 3,( ) and 1 2, ,−( ) then the line through these two points will be vertical as in Figure 9. The x-coordinates for every point on the vertical line are all 1, and the equation of the line is simply x = 1. The slope is
m =− −
=−
−2 3 5
01 1, . which is undefined
x = 1
y
x
(1, 3)
(1, −2)
Figure 9
The following two general statements are true for horizontal and vertical lines.1. For horizontal lines (of the form y = b), the slope is 0.2. For vertical lines (of the form x = a), the slope is undefined.
Horizontal and Vertical LinesHAW
KES LEARNIN
G
SAMPLE
© All R
ights
Rese
rved.

691 Chapter 6 Graphing Linear Equations
© H
awke
s Le
arn
ing
Sys
tem
s. A
ll ri
gh
ts re
serv
ed.
Example 3
Slopes of Horizontal and Vertical Lines
a. Find the equation and slope of the horizontal line through the point −( )2 5, .
Solution
The equation is y = 5 and the slope is 0.
y
x
y = 5(−2, 5)
b. Find the equation and slope of the vertical line through the point 3 2, .( ) Solution
The equation is x = 3 and the slope is undefined.
y
x
(3, 2)
x = 3
3. Find the equation and slope of the indicated line.
a. horizonal line through( , )3 2−
b. vertical line through( , )2 4
Now work margin exercise 3.
HAWKES LE
ARNING
SAMPLE
© All R
ights
Rese
rved.

© H
awke
s Le
arn
ing
Sys
tem
s. A
ll ri
gh
ts re
serv
ed.
The Slope-Intercept Form Section 6.3 692
Objective D Slope-Intercept Form
There are certain relationships between the coefficients in the equation of a line and the graph of that line. For example, consider the equation
y = 5x − 7.
First, find two points on the line and calculate the slope. 0 7, −( ) and 2 3,( ) both satisfy the equation.
slope = =− −( )
−= =m
3 7
2 0102
5
Observe that the slope, m = 5, is the same as the coefficient of x in the equation y x= −5 7. This is not just a coincidence. In fact, if a linear equation is solved for y, then the coefficient of x will always be the slope of the line.
For an equation in the form y = mx + b, the slope of the line is m.
For y = mx + b, m is the Slope
For the line y mx b= + , the point where x = 0 is the point where the line crosses the y-axis. Recall that this point is called the y-intercept. By letting x = 0, we get
y mx b
y m b
y b
= += ⋅ +=
0
.
Thus the point 0, b( ) is the y-intercept. The concepts of slope and y-intercept lead to the following definition.
y = mx + b is called the slope-intercept form for the equation of a line, where m is the slope and 0, b( ) is the y-intercept.
Slope-Intercept Form
As illustrated in Example 4, an equation in the standard form
Ax + By = C with B ≠ 0
can be written in the slope-intercept form by solving for y.
HAWKES LE
ARNING
SAMPLE
© All R
ights
Rese
rved.

693 Chapter 6 Graphing Linear Equations
© H
awke
s Le
arn
ing
Sys
tem
s. A
ll ri
gh
ts re
serv
ed.
Example 4
Using the Form y = m x + b
a. Find the slope and y-intercept of − + =2 3 6x y and graph the line.
Solution
Solve for y.
− + == +
= +
= +
2 3 6
3 2 6
33
23
63
23
2
x y
y x
y x
y x
Thus m = 23
, which is the slope,
and b is 2, making the y-intercept equal to 0 2, .( )
As shown in the graph, if we “rise” 2 units up and “run” 3 units to the right from the y-intercept 0 2,( ), we locate another point 3 4, .( ) The line can be drawn through these two points. Note: As shown in the graph on the right, we could also first “run” 3 units right and “rise” 2 units up from the y-intercept to locate the point
3 4,( ) on the graph.
b. Find the slope and y-intercept of x y+ = −2 6 and graph the line. Solution
Solve for y.
x y
y x
y x
y x
+ = −= − −
=−
−
= − −
2 6
2 6
22 2
62
12
3
Thus m = −12
, which is the
slope, and b is −3, making the y-intercept equal to 0 3, .−( )
y
x(0, 2)
(3, 4)run = 3
rise = 2
y x= +23
2
y
x
(0, 2)
(3, 4)
run = 3rise = 2
y x= +23
2
y
xy x= − −
12
3
(0, −3)(2, −4)rise = −1
run = 2
HAWKES LE
ARNING
SAMPLE
© All R
ights
Rese
rved.

© H
awke
s Le
arn
ing
Sys
tem
s. A
ll ri
gh
ts re
serv
ed.
The Slope-Intercept Form Section 6.3 694
We can treat m = −12
as m =−12
and the “rise” as −1 and the “run”
as 2. Moving from 0 3, −( ) as shown in the graph above, we locate another point 2 4, −( ) on the graph and draw the line.
c. Find the equation of the line through the point 0 2, −( ) with slope 12
.
Solution
Because the x-coordinate is 0, we know that the point 0 2, −( ) is the
y-intercept. So b = −2. The slope is 12
. So m =12
. Substituting in
slope-intercept form y mx b= + gives the result: y x= −12
2.
4. a. Find the slope and y-intercept of − + =4 2 12x y and graph the line.
b. Find the slope and y-intercept of 3 2 10x y+ = − and graph the line.
c. Find the equation of the line through the point ( , )0 3− with a
slope of 23
.
Now work margin exercise 4.
1. Find the slope of the line through the two points 1 3 4 6, , .( ) ( )and Graph the line.
2. Find the equation of the line through the point 0 5,( ) with slope −13
.
3. Find the slope and y-intercept for the line 2 7x y+ = .
4. Write the equation for the horizontal line through the point −( )1 3, . What is the slope of this line?
5. Write the equation for the vertical line through the point −( )1 3, . What is the slope of this line?
Practice Problems
Practice Problem Answers
1. m = 1 x
y
(4, 6)(4, 6)
(1, 3)(1, 3) 2. y x= − +13
5
3. m = -2; y-intercept = 0 7,( ) 4. y = 3; slope is 0 5. x = -1; slope is undefined
HAWKES LE
ARNING
SAMPLE
© All R
ights
Rese
rved.
© H
awke
s Le
arn
ing
Sys
tem
s. A
ll ri
gh
ts re
serv
ed.
695 Chapter 6 Graphing Linear Equations
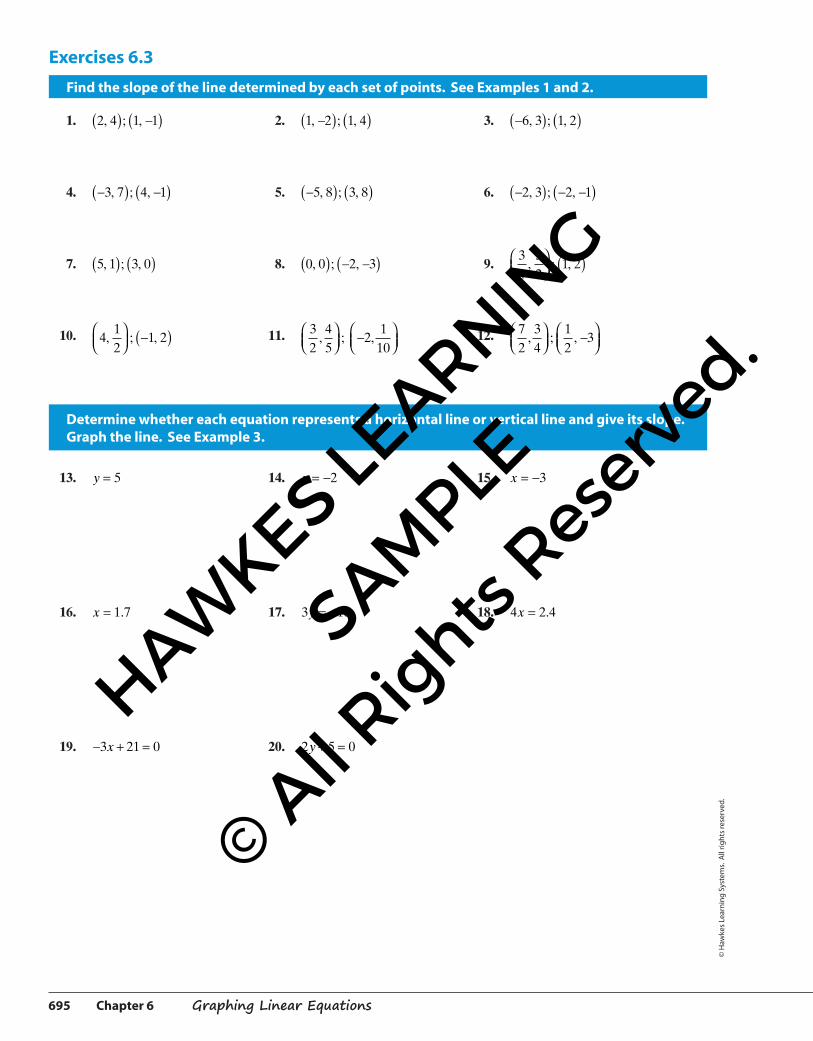
Exercises 6.3
Find the slope of the line determined by each set of points. See Examples 1 and 2.
1. 2 4 1 1, ; ,( ) −( ) 2. 1 2 1 4, ; ,−( ) ( ) 3. −( ) ( )6 3 1 2, ; ,
4. −( ) −( )3 7 4 1, ; , 5. −( ) ( )5 8 3 8, ; , 6. −( ) − −( )2 3 2 1, ; ,
7. 5 1 3 0, ; ,( ) ( ) 8. 0 0 2 3, ; ,( ) − −( ) 9. 34
32
1 2, ; ,
( )
10. 412
1 2, ; ,
−( ) 11. 32
45
21
10, ; ,
−
12. 72
34
12
3, ; ,
−
Determine whether each equation represents a horizontal line or vertical line and give its slope. Graph the line. See Example 3.
13. y = 5 14. y = −2 15. x = −3
16. x = 1 7. 17. 3 18y = − 18. 4 2 4x = .
19. − + =3 21 0x 20. 2 5 0y + =
HAWKES LE
ARNING
SAMPLE
© All R
ights
Rese
rved.

© H
awke
s Le
arn
ing
Sys
tem
s. A
ll ri
gh
ts re
serv
ed.
The Slope-Intercept Form Section 6.3 696
Write each equation in slope-intercept form. Find the slope and the y-intercept, and then use them to draw the graph. See Example 4.
21. y = 2x − 1 22. y = 3x − 4 23. y = 5 − 4x 24. y = 4 − x
25. y = 23
3x − 26. y = 25
2x + 27. x + y = 5 28. x − 2y = 6
29. x + 5y = 10 30. 4x + y = 0 31. 4x + y + 3 = 0 32. 2x + 7y + 7 = 0
33. 2y − 8 = 0 34. 3y − 9 = 0 35. 2x = 3y 36. 4x = y
37. 3x + 9 = 0 38. 4x + 7 = 0 39. 5x − 6y = 18 40. 3x + 6 = 6y
41. 5 − 3x = 4y 42. 5x = 11 − 2y 43. 6x + 4y = −8 44. 7x + 2y = 4
45. 6y = −6 + 3x 46. 4x = 3y − 7 47. 5x − 2y + 5 = 0 48. 6x + 5y = −15
HAWKES LE
ARNING
SAMPLE
© All R
ights
Rese
rved.

© H
awke
s Le
arn
ing
Sys
tem
s. A
ll ri
gh
ts re
serv
ed.
697 Chapter 6 Graphing Linear Equations
In reference to the equation y = mx + b, sketch the graph of three lines for each of the two characteristics listed below.
49. m b> >0 0 and 50. m b< >0 0 and 51. m b> <0 0 and 52. m b< <0 0 and
Find an equation in slope-intercept form for the line passing through the given point with the given slope. See Example 4.
53. 0 312
, ;( ) = −m 54. 0 213
, ;( ) =m 55. 0 325
, ;−( ) =m 56. 0 643
, ;−( ) =m
57. 0 5 4, ;−( ) =m 58. 0 9 1, ;( ) = −m 59. 0 4 1, ;−( ) =m 60. 0 6 5, ;( ) = −m
61. 0 356
, ;−( ) = −m 62. 0 132
, ;−( ) = −m
The graph of a line is shown with two points highlighted. Find a. the slope, b. the y-intercept (if there is one), and c. the equation of the line in slope-intercept form.
63. y
x
(2, 10)
(−4, 1)
64. y
x(3, 2)
(3, −4)
65. y
x
(5, −6)
(2, −6)
66. y
x(−2, 3)
(1, −6)
HAWKES LE
ARNING
SAMPLE
© All R
ights
Rese
rved.

© H
awke
s Le
arn
ing
Sys
tem
s. A
ll ri
gh
ts re
serv
ed.
The Slope-Intercept Form Section 6.3 698
67. y
x
(−5, −5.5)
(5, −0.5)
68.y
x
(5, 7.25)
(−3, −2.75)
69. y
x
(−3, 3)
(9, −1)
70. y
x(1, 2)
(3, 10)
Points are said to be collinear if they are on a straight line. If points are collinear, then the slope of the line through any two of them must be the same (because the line is the same line). Use this idea to determine whether or not the three points in each of the sets are collinear.
71. −( ) ( ) −( ){ }1 3 0 1 5 9, , , , , 72. − −( ) ( ) ( ){ }2 4 0 2 3 11, , , , , 73. −( ) ( ) ( ){ }2 0 0 30 1 5 5 25, , , , . , .
74. − −( ) ( ) ( ){ }1 7 1 1 2 5 7, , , , . , 75. 23
12
056
34
2924
, , , , ,
−
76. 32
13
016
12
34
, , , , ,−
−
Solve the following word problems.
77. Buying a New Car: John bought his new car for $35,000 in the year 2007. He knows that the value of his car has depreciated linearly. If the value of the car in 2010 was $23,000, what was the annual rate of depreciation of his car? Show this information on a graph. (When graphing, use years as the x-coordinates and the corresponding values of the car as the y-coordinates.)
78. Cell Phone Usage: The number of people in the United States with mobile cellular phones was about 180 million in 2004 and about 286 million in 2009. If the growth in mobile cellular phones was linear, what was the approximate rate of growth per year from 2004 to 2009. Show this information on a graph. (When graphing, use years as the x-coordinates and the corresponding number of users as the y-coordinates.)
HAWKES LE
ARNING
SAMPLE
© All R
ights
Rese
rved.

© H
awke
s Le
arn
ing
Sys
tem
s. A
ll ri
gh
ts re
serv
ed.
699 Chapter 6 Graphing Linear Equations
79. Internet Usage: The given table shows the estimated number of internet users from 2004 to 2008. The number of users for each year is shown in millions.
a. Plot these points on a graph.
b. Connect the points with line segments.
c. Find the slope of each line segment.
d. Interpret each slope as a rate of change. Source: International Telecommunications Union Yearbook of Statistics
80. Urban Growth: The following table shows the urban growth from 1850 to 2000 in New York, NY.
a. Plot these points on a graph.
b. Connect the points with line segments.
c. Find the slope of each line segment.
d. Interpret each slope as a rate of change. Source: U.S. Census Bureau
81. Military: The following graph shows the number of female active duty military personnel over a span from 1945 to 2009. The number of women listed includes both officers and enlisted personnel from the Army, the Navy, the Marine Corps, and the Air Force.
a. Plot these points on a graph.
b. Connect the points with line segments.
c. Find the slope of each line segment.
d. Interpret each slope as a rate of change. Source: U.S. Dept. of Defense
YearInternet Users
(in millions)
2004 185
2005 198
2006 210
2007 220
2008 231
Year Population
1850 515,547
1900 3,437,202
1950 7,891,957
2000 8,008,278
0 50,000 100,000 150,000 200,000 250,000 300,000
1945
1960
1975
1990
2000
2005
2009
Women in Uniform
Year
Women in the Department of Defense
266,256
31,550
96,868
227,018
202,601
201,575
203,375
HAWKES LE
ARNING
SAMPLE
© All R
ights
Rese
rved.

© H
awke
s Le
arn
ing
Sys
tem
s. A
ll ri
gh
ts re
serv
ed.
The Slope-Intercept Form Section 6.3 700
82. Marriage: The following graph shows the rates of marriage per 1000 people in the U.S., over a span from 1920 to 2008.
a. Plot these points on a graph.
b. Connect the points with line segments.
c. Find the slope of each line segment.
d. Interpret each slope as a rate of change. Source : U.S. National Center for Health Statistics
83. The class should be divided into teams of 2 or 3 students. Each team will need access to a digital camera, a printer, and a ruler.
a. Take pictures of 8 things with a defined slope. (Suggestions: A roof, a stair railing, a beach umbrella, a crooked tree, etc. Be creative!)
b. Print each picture.
c. Use a ruler to draw a coordinate system on top of each picture. You will probably want to use increments of in. or cm, depending on the size of your picture.
d. Identify the line in each picture whose slope you are calculating and then use the coordinate systems you created to identify the coordinates of two points on each line.
e. Use the points you just found to calculate the slope of the line in each picture.
f. Share your findings with the class.
Collaborative Learning
0
3
6
9
12
15Marriages in the U.S.
Year
Rate
per
100
0 p
eop
le
12 12.1
8.5
10 9.8
8.5
7.1
1920 1940 1960 1980 1990 2000 2008
HAWKES LE
ARNING
SAMPLE
© All R
ights
Rese
rved.

© H
awke
s Le
arn
ing
Sys
tem
s. A
ll ri
gh
ts re
serv
ed.
701 Chapter 6 Graphing Linear Equations
84. a. Explain in your own words why the slope of a horizontal line must be 0.
b. Explain in your own words why the slope of a vertical line must be undefined.
85. a. Describe the graph of the line y = 0. b. Describe the graph of the line x = 0.
86. In the formula y mx b= + explain the meaning of m and the meaning of b.
87. The slope of a road is called a grade. A steep grade is cause for truck drivers to have slow speed limits in mountains. What do you think that a “grade of 12%” means? Draw a picture of a right triangle that would indicate a grade of 12%.
Writing & Thinking
HAWKES LE
ARNING
SAMPLE
© All R
ights
Rese
rved.