preparation for college admission exams - nacac homepage
TRANSCRIPT

Preparation for College Admission Exams
2009 NACAC Discussion Paper
Derek C. Briggs, Ph.D.University of Colorado at Boulder
This report was commissioned by the National Association for College
Admission Counseling as part of an ongoing effort to inform the association
and the public about current issues in college admission.
The views and opinions expressed in this report are solely those of the author
and not necessarily those of NACAC.

Copyright © 2009
by the National Association for College Admission Counseling.
All rights reserved. Printed in the United States of America.
No part of this paper may be reproduced in any form or by any means
electronic or mechanical, including photocopying, recording, or by any
information storage and retrieval system, without permission in writing
from the publisher, except for brief quotations embodied in critical
articles and reviews.
NACAC
1050 N. Highland Street
Suite 400
Arlington, VA 22201
800/822-6285
703/243-9375 fax
www.nacacnet.org

Preparation for College Admission Exams • National Association for College Admission Counseling1
NACAC IntroductionIn September 2008, NACAC released the Report of the Commission on the Use of Standardized Tests in Undergradu-
ate Admission. NACAC appointed this commission to determine the extent to which current practice regarding test
score use reflects the conclusions made in the National Research Council’s 1999 Myths and Tradeoffs report, and to
make recommendations to NACAC, institutions of higher education and other stakeholder groups that will encourage
reassessment of test usage and foster renewed discussion about the appropriate role of standardized admission tests
as higher education continues to evolve.
One of the primary concerns addressed by NACAC’s Testing Commission is the inequality that may result from uneven access
to test preparation resources. The commission’s set of recommendations related to test preparation included the following:
• Test Preparation Research: NACAC pursue relationships with academic researchers and foundations that may
support an extended “objective assessment” of the effects of test coaching methods to provide current, unbiased
information to colleges and universities.
• Building the Base of Research: High schools and colleges share their own institutional research on test preparation
to fully develop a knowledge center on test preparation.
• Considerations for Admission Formulas: Admission policymakers and practitioners remain aware of the implications
of inequitable access to test preparation as they design and implement index systems.
• Comprehensive College Preparation: Secondary schools offering test preparation do so as part of a continuum of
college preparatory activities that includes other informational coursework about the admission process.
• Collecting Promising Test Preparation Research: High schools and other organizations submit research to NACAC
with the purpose of establishing a trusted source for best practice and professional development.
This discussion paper, authored by Dr. Derek Briggs, represents one of NACAC’s first post-Testing Commission steps in
advancing the knowledge base and dialogue about test preparation. It describes various types of test preparation pro-
grams and summarizes the existing academic research on the effects of test preparation on standardized test scores.
The paper also presents newly published data collected by the author in cooperation with NACAC and its members
about how colleges are currently using test scores in the process of making admission decisions.
Summary of Test Preparation ResearchThe existing academic research base indicates that, on average, test preparation efforts yield a positive but small ef-
fect on standardized admission test scores. Contrary to the claims made by many test preparation providers of large
increases of 100 points or more on the SAT, research suggests that average gains are more in the neighborhood of 30
points. Although extensive, the academic research base does have limitations. Most notably, few published studies
have been conducted on students taking admission tests since 2000. Only two studies have been published on the
effects for ACT scores, and no studies have been published since the 2005 change to the SAT, which added the Writ-
ing section among other changes. In addition, many previous studies were conducted on small samples or had other
methodological flaws. Additional large-scale studies of test preparation—including both the ACT and SAT and examin-
ing a variety of test preparation methods—will be important to understanding more about the relative value of different
types of test preparation. However, even with these caveats in mind, students and families would be wise to consider
whether the cost of a given test preparation option is worth what is likely to be a small gain in test scores.

Preparation for College Admission Exams • National Association for College Admission Counseling2
How Score Increases Influence CollegesThe paper also conducts new research to ascertain how small gains in test scores might have practical signifi-
cance in admission decisions based on how admission officers evaluate scores. A survey of NACAC-member
colleges unexpectedly revealed that in a substantial minority of cases, colleges report either that they use
a cut-off test score in the admission process or that a small increase in test score could have a significant
impact on an applicant’s chances of being admitted. These realities are likely to complicate the decisions of
students and families trying to determine how best to allocate resources (both time and money) for the transi-
tion to college.
Future Directions for Admission Professionals: Affirmation of Testing CommissionBased on the information collected in the NACAC-member survey, the author cautions that admission professionals
—particularly those at more selective institutions—“should be careful about the use of SAT or ACT scores to make
fine-grained distinctions between applicants. This is important because a 20 point SAT Math difference between
two college applicants could be explained by measurement error, differential access to coaching or both.” The
author strongly recommends that admission counselors receive training to emphasize this issue, which reinforces
a primary recommendation of NACAC’s Testing Commission that both college admission officers and school coun-
selors need access to training on the fundamentals of standardized test score interpretation.
The content of this discussion paper also points to the need for continued research on the effects of test preparation,
particularly as it becomes more widely accessible through a variety of formats and delivery systems. Although the
existing academic research base suggests a consensus on the magnitude of test preparation effects, some important
practical questions remain unanswered:
• Is the newest version of the SAT more or less “coachable” than previous versions, which have been the
subject of academic studies? What is the magnitude of test preparation effects for the ACT?
• Are there certain characteristics of particular test prep programs (quality, setting, duration) that may result
in higher than average test score increases?
• Is the magnitude of test preparation effects influenced by any student characteristics that have yet to be
identified?
• Are commercial forms of test preparation any more effective than student-driven test preparation?
As recommended by the NACAC Testing Commission, NACAC will continue to play a role in increasing the
research base in order to provide the best information to students and families about how to allocate test
preparation resources and to provide guidance and training to admission offices about appropriate use of test
scores in admission decisions.

Preparation for College Admission Exams • National Association for College Admission Counseling3
About the AuthorDerek Briggs is chair of the Research and Evaluation Methodology Program at the University of Colorado
at Boulder, where he also serves as an associate professor of quantitative methods and policy analysis. His
research agenda focuses upon building sound methodological approaches for the valid measurement and
evaluation of growth in student achievement. Examples of his research interests in the area of educational
measurement include 1) evaluating the use of developmental (i.e., vertical) score scales to assess student
achievement over time, and 2) modeling student understanding longitudinally through the use of diagnostic
learning progressions.
Dr. Briggs is a member of numerous professional organizations. He has given research presentations at the
annual meetings of the American Educational Research Association, the National Council on Measurement
in Education, and the Psychometric Society, as well as at places such as the National Research Council, The
College Board, Educational Testing Service, RAND, and the University of California (Berkeley, Los Angeles
and Santa Barbara).
Preparation for College Admission Exams • National Association for College Admission Counseling4
IntroductionMost students who take a college admission test spend time preparing themselves for the exam. Some stu-
dents do practice problems via the Internet, some work through exercises in practice books. Some students
go so far as to pay for commercial forms of preparation that may involve a formal class or even one-on-one
tutoring. The immediate goal of all such preparatory activities is to improve subsequent performance on an
admission test over and above what would have been obtained otherwise. In turn, higher test scores should
improve a student’s likelihood of college admission, if all other characteristics of a student’s application profile
are held constant. The potential benefits of test preparation are clear, but they must be balanced by the as-
sociated costs in both money and time. Do the benefits that can be expected for the typical student outweigh
the costs? This is the fundamental question addressed in the present report.
The purposes of this report are to 1) describe and summarize formal and informal methods of admission
test preparation; 2) synthesize and summarize existing academic research on the effects of admission test
preparation; 3) arrive at conclusions about the effectiveness of test preparation for admission testing; and 4)
suggest future research needs in this area. The report concludes with recommendations to admission officers
and high school counselors for implementing policies and training that can account for the effects of test
preparation in the college admission process.
Sources of DataTwo principal sources of data are used in this report. The first was a survey developed by the author and
staff from the National Association for College Admission Counseling (NACAC) to obtain information about
the way that standardized test scores are used and interpreted to make admission decisions at four-year,
degree-granting postsecondary institutions in the United States. The NACAC Test Preparation Survey (referred
to hereafter as the “NACAC Survey”) was sent to the directors of admission at 1,075 postsecondary institu-
tions with a NACAC membership. All of these institutions are four-year colleges (not-for-profit, baccalaureate-
granting, Title IV-participating). A total of 246 institutions completed the survey for a response rate of 23
percent. The second source of data derives from the US Department of Education’s Integrated Postsecondary
Education Data System (IPEDS). Because each institution to whom a NACAC survey was sent has a known
IPEDS identification code, it was possible to evaluate the comparability of NACAC survey responders and
non-responders with respect to a subset of variables in the IPEDS data. Comparisons between NACAC survey
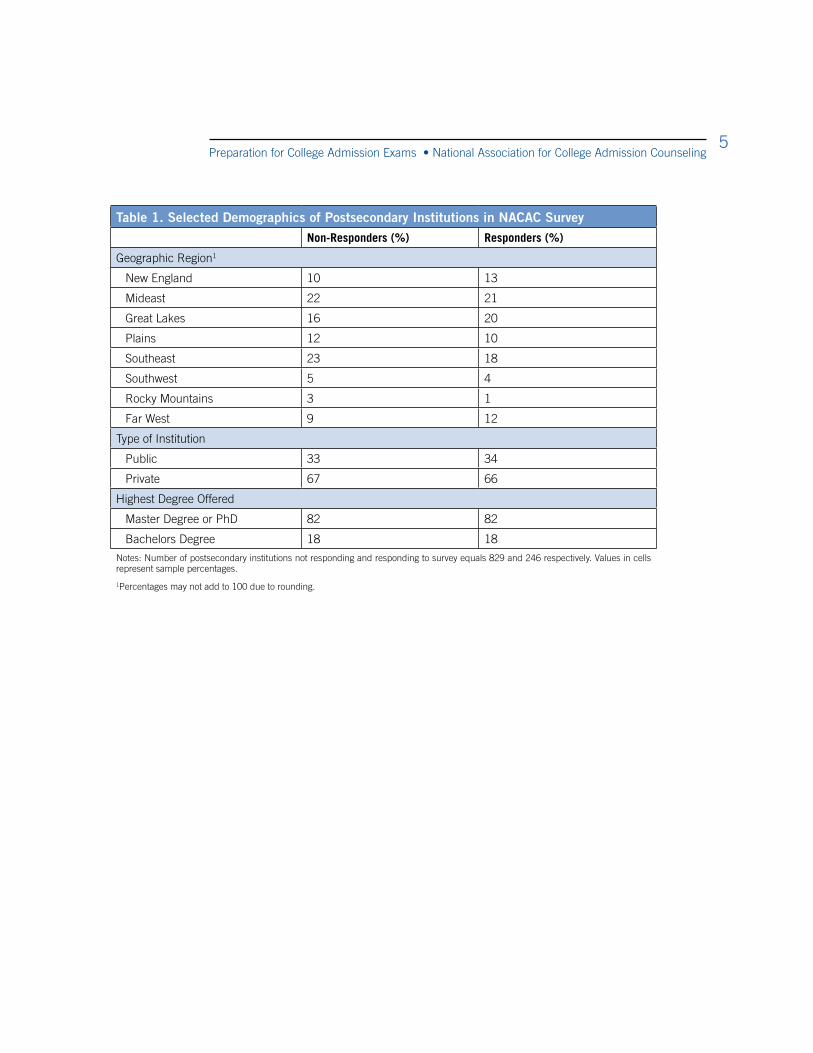
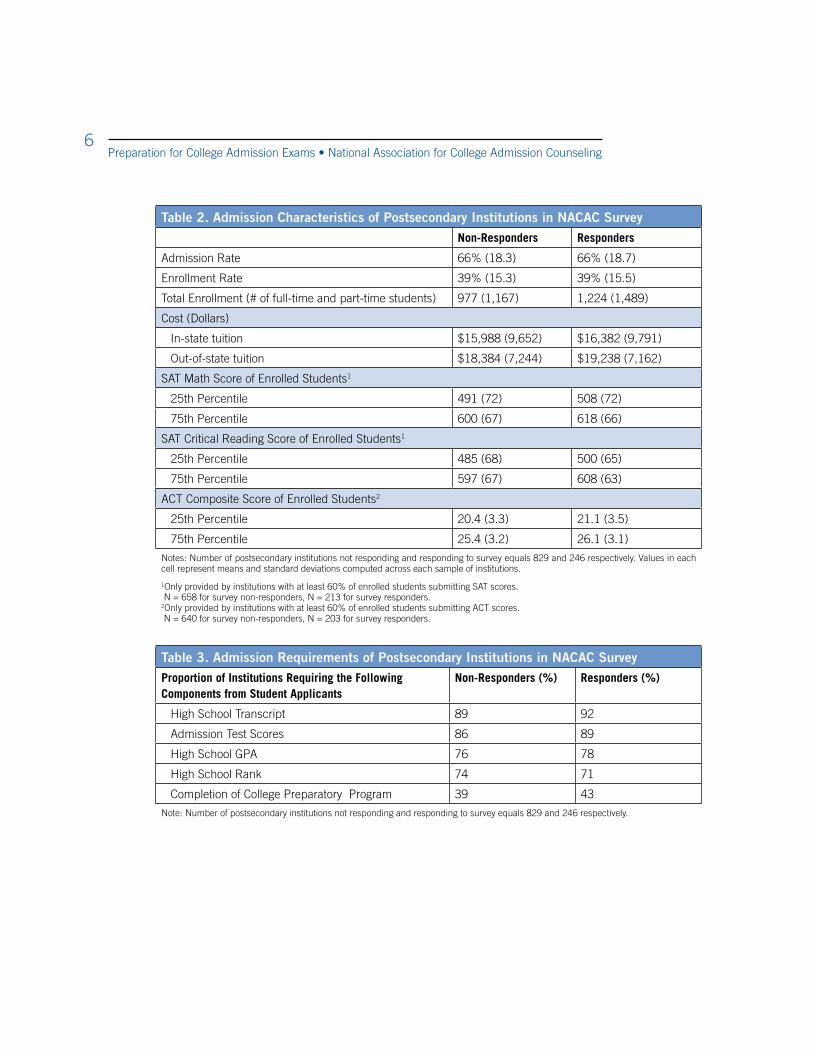
responders and non-responders are made explicitly in Tables 1–3. These results indicate that, in general,
those postsecondary institutions that responded to the NACAC survey are similar to non-responders with
respect to geographic region, public vs. private control, highest degree offered, admission requirements, and
selectivity. (This similarity is illustrated graphically in Figure 1, which contrasts the distribution of admission
rates for responders and non-responders.) The only noticeable differences are that survey responders tended
to come from institutions that are somewhat larger, more costly and enroll students with slightly higher SAT
and ACT scores than the institutions of non-responders.
Preparation for College Admission Exams • National Association for College Admission Counseling5
Table 1. Selected Demographics of Postsecondary Institutions in NACAC SurveyNon-Responders (%) Responders (%)
Geographic Region1
New England 10 13
Mideast 22 21
Great Lakes 16 20
Plains 12 10
Southeast 23 18
Southwest 5 4
Rocky Mountains 3 1
Far West 9 12
Type of Institution
Public 33 34
Private 67 66
Highest Degree Offered
Master Degree or PhD 82 82
Bachelors Degree 18 18
Notes: Number of postsecondary institutions not responding and responding to survey equals 829 and 246 respectively. Values in cells represent sample percentages.
1Percentages may not add to 100 due to rounding.
Preparation for College Admission Exams • National Association for College Admission Counseling6
Table 2. Admission Characteristics of Postsecondary Institutions in NACAC SurveyNon-Responders Responders
Admission Rate 66% (18.3) 66% (18.7)
Enrollment Rate 39% (15.3) 39% (15.5)
Total Enrollment (# of full-time and part-time students) 977 (1,167) 1,224 (1,489)
Cost (Dollars)
In-state tuition $15,988 (9,652) $16,382 (9,791)
Out-of-state tuition $18,384 (7,244) $19,238 (7,162)
SAT Math Score of Enrolled Students1
25th Percentile 491 (72) 508 (72)
75th Percentile 600 (67) 618 (66)
SAT Critical Reading Score of Enrolled Students1
25th Percentile 485 (68) 500 (65)
75th Percentile 597 (67) 608 (63)
ACT Composite Score of Enrolled Students2
25th Percentile 20.4 (3.3) 21.1 (3.5)
75th Percentile 25.4 (3.2) 26.1 (3.1)
Notes: Number of postsecondary institutions not responding and responding to survey equals 829 and 246 respectively. Values in each cell represent means and standard deviations computed across each sample of institutions.
1Only provided by institutions with at least 60% of enrolled students submitting SAT scores. N = 658 for survey non-responders, N = 213 for survey responders.2Only provided by institutions with at least 60% of enrolled students submitting ACT scores. N = 640 for survey non-responders, N = 203 for survey responders.
Table 3. Admission Requirements of Postsecondary Institutions in NACAC SurveyProportion of Institutions Requiring the Following Components from Student Applicants
Non-Responders (%) Responders (%)
High School Transcript 89 92
Admission Test Scores 86 89
High School GPA 76 78
High School Rank 74 71
Completion of College Preparatory Program 39 43
Note: Number of postsecondary institutions not responding and responding to survey equals 829 and 246 respectively.

Preparation for College Admission Exams • National Association for College Admission Counseling7
Figure 1. Selectivity of Postsecondary Institutions Responding and Not Responding to the NACAC Survey on Test Preparation.

Preparation for College Admission Exams • National Association for College Admission Counseling8
The Use of Standardized Tests for College AdmissionStandardized tests play a prominent role in the college admission process. Out of the 246 institutions re-
sponding to the NACAC survey, 73 percent (180) indicated that they used the SAT as a tool for admission
decisions, 81 percent (198) indicated that they used the ACT, and 89 percent (219) indicated that they used
one or the other. Table 4 summarizes the responses from institutions when asked whether test scores are
used 1) holistically (i.e., as part of a portfolio of evidence), 2) as part of a quantitative index and/or 3) to define
a cut-off threshold for admission. Most institutions report using test scores holistically, followed by a smaller
subset that report using the scores as part of a index to define a cut-off threshold for admission.
Table 4. Specific Uses of Test Scores to Inform Admission Decisions
In what way are test scores used to make admission decisions at your institution?
Method ACT Scores SAT Scores
Holistically 78% 76%
Quantitative Index 32% 31%
Define Cut-off Threshold 24% 21%
N = 198 institutions using ACT scores, 180 using SAT scores.
When asked to rate the importance of test scores to admission decisions (“How important are the following
criteria in admission decisions made at your institution?” Options: No/Limited/Moderate/Considerable Impor-
tance), 58 percent (127) of institutions chose “considerable importance,” with an average response between
the categories of “moderate” and “considerable” importance. Only two other admission criteria were given
higher ratings than test scores: strength of curriculum and grades in college prep courses. These findings
remained the same when institutions were asked to rank the importance of the various criteria for admission
relative to one another.
Admission Test PreparationWhat College Admission Tests MeasureBoth the ACT and SAT exams are intended to provide measures of a student’s “college readiness.” Superfi-
cially, the ways both ACT Inc. and The College Board define what each exam measures are quite similar.
Your ACT scores are a measure of your current level of educational development in English, mathemat-
ics, reading, and science—and writing, if you took the ACT Plus Writing. Knowledge and skills in these
areas are generally essential for admission to college and are considered important for success in college
studies (ACT Inc, Using Your ACT Results 2008/2009, p. 3).
The SAT tests students’ basic knowledge of subjects they have learned in the classroom—such as read-
ing, writing, and math—in addition to how students think, solve problems and communicate. The SAT
tells students how well they use the skills and knowledge they have attained in and outside of the class-
room (The College Board, The SAT Program Handbook, 2008, p. 1).
Preparation for College Admission Exams • National Association for College Admission Counseling9
There is, however, an important historical distinction between the two exams. In its inception as a tool for col-
lege admission in the late 1940s, the SAT was devised as a test of aptitude, and its acronym—the Scholastic
Aptitude Test—reflected this belief. Over time, both the format of the test and the position of its developers
as to the construct it measures has changed. Messick (1980) and Anastasi (1981) suggested that standard-
ized tests can be conceptualized as solely measuring either achievement or aptitude, and that the SAT falls
somewhere in between these two poles. Messick wrote:
1 Prior to March 2005, this section was known as the verbal section of the exam: the SAT-V.
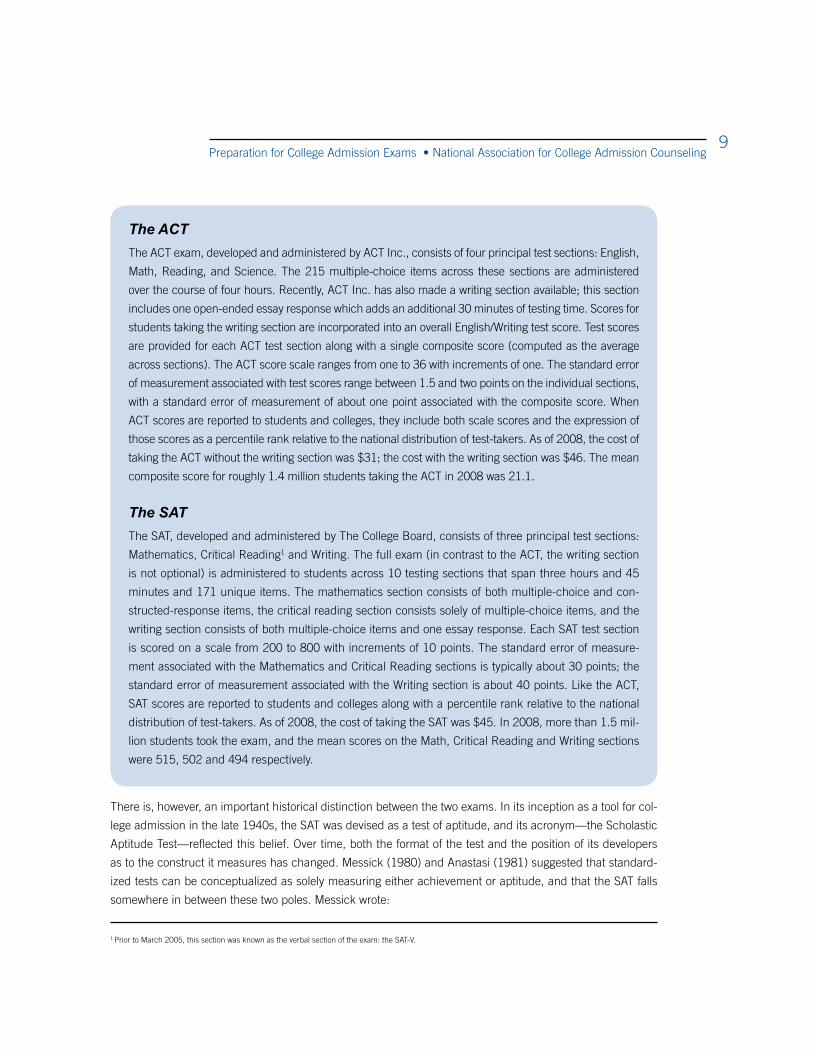
The ACTThe ACT exam, developed and administered by ACT Inc., consists of four principal test sections: English,
Math, Reading, and Science. The 215 multiple-choice items across these sections are administered
over the course of four hours. Recently, ACT Inc. has also made a writing section available; this section
includes one open-ended essay response which adds an additional 30 minutes of testing time. Scores for
students taking the writing section are incorporated into an overall English/Writing test score. Test scores
are provided for each ACT test section along with a single composite score (computed as the average
across sections). The ACT score scale ranges from one to 36 with increments of one. The standard error
of measurement associated with test scores range between 1.5 and two points on the individual sections,
with a standard error of measurement of about one point associated with the composite score. When
ACT scores are reported to students and colleges, they include both scale scores and the expression of
those scores as a percentile rank relative to the national distribution of test-takers. As of 2008, the cost of
taking the ACT without the writing section was $31; the cost with the writing section was $46. The mean
composite score for roughly 1.4 million students taking the ACT in 2008 was 21.1.
The SATThe SAT, developed and administered by The College Board, consists of three principal test sections:
Mathematics, Critical Reading1 and Writing. The full exam (in contrast to the ACT, the writing section
is not optional) is administered to students across 10 testing sections that span three hours and 45
minutes and 171 unique items. The mathematics section consists of both multiple-choice and con-
structed-response items, the critical reading section consists solely of multiple-choice items, and the
writing section consists of both multiple-choice items and one essay response. Each SAT test section
is scored on a scale from 200 to 800 with increments of 10 points. The standard error of measure-
ment associated with the Mathematics and Critical Reading sections is typically about 30 points; the
standard error of measurement associated with the Writing section is about 40 points. Like the ACT,
SAT scores are reported to students and colleges along with a percentile rank relative to the national
distribution of test-takers. As of 2008, the cost of taking the SAT was $45. In 2008, more than 1.5 mil-
lion students took the exam, and the mean scores on the Math, Critical Reading and Writing sections
were 515, 502 and 494 respectively.

Preparation for College Admission Exams • National Association for College Admission Counseling10
The Scholastic Aptitude Test was developed as a measure of academic abilities, to be used toward the
end of secondary school as a predictor of academic performance in college… The SAT was explicitly
designed to differ from achievement tests in school subjects in the sense that its content is drawn from
a wide variety of substantive areas, not tied to a particular course of study, curriculum or program.
Moreover, it taps intellectual processes of comprehension and reasoning that may be influenced by
experiences outside as well as inside the classroom… The specific item content on the SAT attempts to
sample the sort of cognitive skills underlying college-level performance (1980, p. 7).
A key element in Messick’s description of the SAT, and one which The College Board has maintained in
subsequent revisions to the exam, is the notion that the SAT measures reasoning abilities that are developed
gradually over the years of primary and secondary schooling that precede college. While these reasoning abili-
ties should be associated with a student’s curricular exposure, there is no explicit link made between the high
school curriculum and the content of the SAT.
In contrast, the developers of the ACT have long emphasized the link between the content of its tests of Eng-
lish, math, reading, and science and the high school curricula of American schools.
The ACT is curriculum-based. The ACT is not an aptitude or an IQ test. Instead, the questions on the
ACT are directly related to what students have learned in high school courses in English, mathematics
and science. Because the ACT tests are based on what is taught in the high school curriculum, students
are generally more comfortable with the ACT than they are with traditional aptitude tests or tests with
narrower content (www.act.org/news/aapfacts.html).
In other words, with respect to the aptitude-achievement continuum described above, the ACT has always
been promoted as an achievement test, and ACT Inc. makes evidence available that supports a link be-
tween the content of most college preparatory high school curricula and its tests. Nonetheless, it is worth
noting that the scores for corresponding sections of the SAT and ACT exams are both similarly reliable
(Alpha coefficient of about 0.9) and tend to be very strongly correlated (between 0.8 and 0.9). Correspon-
dence tables between the two tests are available (and widely used) to transform a score on the SAT to a
score on the ACT and vice versa.2
2 See for example, www.act.org/aap/concordance/index.html or http://professionals.collegeboard.com/data-reports-research/sat/sat-act
Preparation for College Admission Exams • National Association for College Admission Counseling11
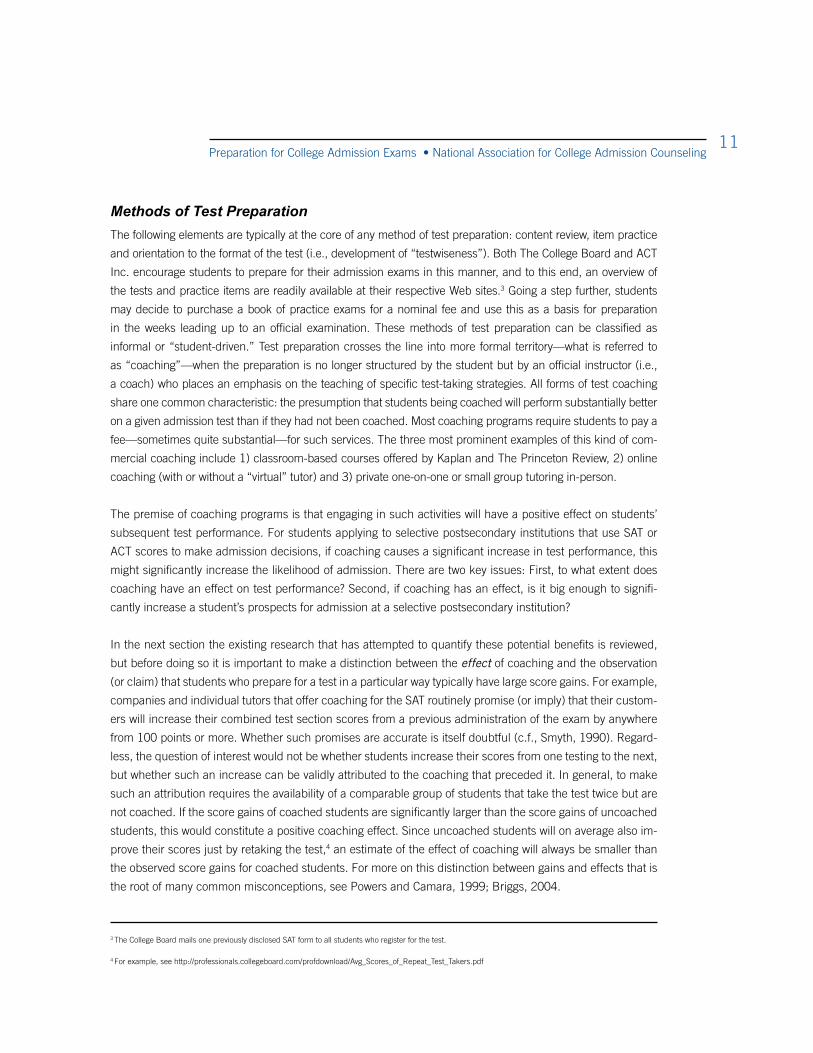
Methods of Test PreparationThe following elements are typically at the core of any method of test preparation: content review, item practice
and orientation to the format of the test (i.e., development of “testwiseness”). Both The College Board and ACT
Inc. encourage students to prepare for their admission exams in this manner, and to this end, an overview of
the tests and practice items are readily available at their respective Web sites.3 Going a step further, students
may decide to purchase a book of practice exams for a nominal fee and use this as a basis for preparation
in the weeks leading up to an official examination. These methods of test preparation can be classified as
informal or “student-driven.” Test preparation crosses the line into more formal territory—what is referred to
as “coaching”—when the preparation is no longer structured by the student but by an official instructor (i.e.,
a coach) who places an emphasis on the teaching of specific test-taking strategies. All forms of test coaching
share one common characteristic: the presumption that students being coached will perform substantially better
on a given admission test than if they had not been coached. Most coaching programs require students to pay a
fee—sometimes quite substantial—for such services. The three most prominent examples of this kind of com-
mercial coaching include 1) classroom-based courses offered by Kaplan and The Princeton Review, 2) online
coaching (with or without a “virtual” tutor) and 3) private one-on-one or small group tutoring in-person.
The premise of coaching programs is that engaging in such activities will have a positive effect on students’
subsequent test performance. For students applying to selective postsecondary institutions that use SAT or
ACT scores to make admission decisions, if coaching causes a significant increase in test performance, this
might significantly increase the likelihood of admission. There are two key issues: First, to what extent does
coaching have an effect on test performance? Second, if coaching has an effect, is it big enough to signifi-
cantly increase a student’s prospects for admission at a selective postsecondary institution?
In the next section the existing research that has attempted to quantify these potential benefits is reviewed,
but before doing so it is important to make a distinction between the effect of coaching and the observation
(or claim) that students who prepare for a test in a particular way typically have large score gains. For example,
companies and individual tutors that offer coaching for the SAT routinely promise (or imply) that their custom-
ers will increase their combined test section scores from a previous administration of the exam by anywhere
from 100 points or more. Whether such promises are accurate is itself doubtful (c.f., Smyth, 1990). Regard-
less, the question of interest would not be whether students increase their scores from one testing to the next,
but whether such an increase can be validly attributed to the coaching that preceded it. In general, to make
such an attribution requires the availability of a comparable group of students that take the test twice but are
not coached. If the score gains of coached students are significantly larger than the score gains of uncoached
students, this would constitute a positive coaching effect. Since uncoached students will on average also im-
prove their scores just by retaking the test,4 an estimate of the effect of coaching will always be smaller than
the observed score gains for coached students. For more on this distinction between gains and effects that is
the root of many common misconceptions, see Powers and Camara, 1999; Briggs, 2004.
3 The College Board mails one previously disclosed SAT form to all students who register for the test.
4 For example, see http://professionals.collegeboard.com/profdownload/Avg_Scores_of_Repeat_Test_Takers.pdf

Preparation for College Admission Exams • National Association for College Admission Counseling12
The Effects of Admission Test PreparationSince 1953, there have been more than 30 studies conducted to evaluate the effect of coaching on specific
sections of the SAT, and two studies conducted to evaluate the effect with respect to the ACT. The characteris-
tics of the SAT studies and estimated coaching effects are summarized in Tables A-1 and A-2 in the appendix
of this report. The reviews of coaching and its effect on SAT performance have been almost as numerous as
the individual studies under review. Fourteen reviews, listed in appendix A have been conducted on subsets
of these studies between 1978 and 2005. While one might assume from this that the empirical effectiveness
of coaching on SAT performance has been well-established, this is only somewhat true. One principal rea-
son for this is that the vast majority of coaching studies conducted over a 40 year period between 1951 and
1991 tended to involve small samples that were not necessarily representative of the national population of
high school seniors taking college admission exams, and of the programs offering test coaching. In addition,
a good number of these studies contained a variety of methodological flaws that compromised the validity of
their conclusions.
Nonetheless, over the past 10 years evidence has emerged from three large-scale evaluations of coaching that
point to a consensus position about its average effects on admission exams. This consensus is as follows:
• Coaching has a positive effect on SAT performance, but the magnitude of the effect is small.
• The effect of coaching is larger on the math section of the exam (10–20 points) than it is for the critical
reading section (5–10 points).
• There is mixed evidence with respect to the effect of coaching on ACT performance. Only two studies have
been conducted. The most recent evidence indicates that only private tutoring has a small effect of .4
points on the math section of the exam.
The next two subsections substantiate these statements, primarily on the basis of large-scale studies con-
ducted by Powers and Rock (1999), Briggs (2002) and Briggs and Domingue (2009).
Powers and Rock Study (1995–1996 test-takers)The study by Powers and Rock (1999) was the first to provide national estimates for the effect of com-
mercial coaching programs. Powers and Rock surveyed a stratified random sample of 3,311 students who
had taken the SAT nationally between the fall of 1995 and the spring of 1996. A total of 2,086 students (63
percent) responded to the survey. Students were asked to indicate by what method and how long they had
prepared for the SAT. Those reporting that they had participated in coaching from a commercial company
were prompted to specify the name of the organization providing the service. Powers and Rock estimated a
series of coaching effects using a variety of statistical models to adjust for pre-existing differences between
coached and uncoached students using variables measuring socioeconomic status, academic achieve-
ment and motivation. In their simplest model, coaching effects were estimated by simply comparing the
mean SAT score changes among coached students to those among uncoached students. These effects

Preparation for College Admission Exams • National Association for College Admission Counseling13
amounted to eight points on the verbal section (SAT-V)5 and 18 points on the math section (SAT-M), both
statistically significant. Interestingly, the use of more complex statistical models had little impact on the
estimated coaching effects.
Powers and Rock examined separately the subset of students in their sample who reported that they had been
coached by either Kaplan or The Princeton Review, two of the most widely known commercial test preparation
companies. For one company, an estimated coaching effect on the SAT-M of 33 points was significantly larger
than the overall effect of about 18 points, but other than this, the estimated coaching effects remained fairly
consistent with those from the pooled estimates.
Studies by Briggs (1990–1992 test-takers), and Briggs and Domingue (2002–2004 test-takers)Three compelling features of the Briggs (2002) and Briggs and Domingue (2009) studies are that 1)
they were both based on nationally representative samples of American high school students gathered
through surveys administered by the National Center for Education Statistics; 2) the latter study was a
replication of the former study using a new longitudinal cohort of students; and 3) these studies included
evaluations of the effects of multiple forms of test preparation on both the SAT and ACT. The sample for
the Briggs study derives from the National Education Longitudinal Study of 1988 (NELS); the sample
for the Briggs and Domingue study derives from the Educational Longitudinal Study of 2002 (ELS). The
admission test-taking time frame for the NELS data was between 1990 (grade 10) and 1992 (grade 12);
the respective timeframe for the ELS data was between 2002 (grade 10) and 2004 (grade 12). Students
in each NELS and ELS cohort were categorized into four mutually exclusive groups as a function of
whether survey information indicated that they had taken particular combinations of college admission
exams.6 These groups and changes in the proportions of students in them from 1992 to 2004 are shown
in Table 5.
Table 5. Changes in Admission Test-Taking Patterns Among American High School Seniors from 1992 to 2004.Admission Test-taking Pattern NELS (1992) ELS (2004)
POP1: Took PSAT or PLAN and SAT or ACT 28.8% 26.3%
POP2: Took SAT or ACT, but not PSAT or PLAN 22.1% 37.1%
POP3: Took PSAT or PLAN but not SAT or ACT 3.9% 6.2%
POP4: Did not take the PSAT, PLAN, SAT, or ACT 45.2% 30.4%
Note: The percentages in these cells are relative to the population weighted numbers of American high school students in the NELS and ELS cohorts. The 1992 population size was 2,820,927; the 2004 population size was 2,914,759.
5 Since the three studies reviewed in this section all involved students taking admission exams prior to March 2005, the SAT-CR section is denoted by its acronym at that time SAT-V.
6 The PLAN and the PSAT/NMQST (hereafter referred to as simply the PSAT) are essentially pre-tests for the ACT and SAT respectively. Students who take these “pre-tests” tend to be more academically motivated, socioeconomically advantaged or both. The PLAN did not exist during the early 1990s, so it was not part of the NELS data. Hence the mutually exclusive groups formed from NELS data were based only on test-taking patterns with respect to the PSAT, SAT and ACT.

Preparation for College Admission Exams • National Association for College Admission Counseling14
As Table 5 indicates, while only about 51 percent of high school seniors took admission tests in 1992, by 2004
this proportion had increased to a little over 63 percent. Both NELS and ELS samples were asked exactly the
same questions about how they had prepared to take either the SAT or ACT.
To prepare for the SAT and/or ACT, did you do any of the following?7
A. Take a special course at your high school
B. Take a course offered by a commercial test preparation service
C. Receive private one-to-one tutoring
D. Study from test preparation books
E. Use a test preparation computer program
Table 6. Changes in Test Preparation Activities from 1992 to 2004.Test Preparation Activity POP1 POP2
2004 Change since 1992 2004 Change since 1992
High School Course 22% -1 20% +4
Commercial Course 16% +3 14% +5
Private Tutor 9% +3 10% +2
Books 63% +1 60% -4
Computer Program 36% +21 36% +25
Note: POP1 = Took PSAT or PLAN and SAT or ACT; POP2 = Took SAT or ACT, but not PSAT or PLAN
Table 6 shows the frequency distribution of the different test preparation activities listed on both the NELS
and ELS surveys for those high school students in the POP1 and POP2 test-taking groups. The columns of
the table with the label “2004” reflect the population weighted proportions for the ELS samples responding in
the fall of 2004. The columns labeled “Change since 1992” indicate the magnitude of the percentage point
increase (or decrease) relative to the proportions that were reported by the NELS samples responding in the
fall of 1992. The most dramatic—though not unexpected—change since 1992 is the increase in computer-
based test preparation due to the growth of the Internet, which took off during the mid-1990s. The use of high
school courses, commercial coaching, private tutoring, and books has generally either remained constant or
slightly increased.
7 Students were also asked whether they had prepared with a video in both surveys, but this category was excluded by Briggs and Domingue because such use was never widespread to begin with, and is largely nonexistent as of 2008. Note also that the computer program category is likely to have changed meaning from the use of something akin to a CD-rom in 1992 to use of the internet in 2004.

Preparation for College Admission Exams • National Association for College Admission Counseling15
Using the NELS data, Briggs compared the average score gains for the sample of 3,492 students taking both
the PSAT and SAT as a function of whether students had used or not used different forms of test preparation.
The only methods of test preparation to have a significant effect on SAT-V and SAT-M score gains were formal
modes of coaching: use of a private tutor and enrollment in a commercial coaching class. The magnitude of
the effects was small—about 20 points and 10 points on the SAT-M and SAT-V respectively. These effect esti-
mates were also optimistic in the sense that they did not control for preexisting differences in socioeconomic
status, academic background and motivation among the groups of students being compared.
The effects of commercial coaching were subsequently estimated for all students taking either the SAT or
ACT after controlling for confounding variables using a linear regression model similar to those that had been
specified in the analysis by Powers and Rock. Briggs concluded that the average commercial coaching effect
on the SAT-M was about 15 points, while the average effect on the SAT-V was about eight points. With respect
to the ACT, Briggs found no evidence for a coaching effect on the math section of the exam, a small positive
effect of .55 on the English section of the test and a surprising small negative effect of -.66 on the reading
section of the test. No statistically significant coaching effects were found on any sections of the SAT or ACT
for students who had not previously taken the PSAT (students in the POP2 sample).
More recently, using the ELS data, Briggs and Domingue also evaluated the effects of different forms of test
preparation on both the SAT and ACT for students in the POP1 and POP2 samples.
• Among the 3,146 students who had taken the SAT, enrollment in a commercial course and private tutoring
were found to have a small but positive and statistically significant effect on SAT-M scores of about 13 and
15 points respectively.
• For the subset of students taking the SAT who had previously taken the PSAT, the use of a computer program
was found to have a small but statistically significant negative effect on SAT-M scores of seven points.
• For students who had not previously taken the PSAT, the use of books had a small but statistically signifi-
cant positive effect on SAT-M score of seven points.
• No forms of test preparation had statistically significant positive effects on SAT-V scores. In fact, for students
who had not previously taken the PSAT, enrollment in a special high school class to prepare for the SAT was
associated with a statistically significant negative effect of 10 points on the SAT-V.
• Among the students who had taken the PLAN and the ACT, the only forms of test preparation to have sta-
tistically significant effects were private tutoring and the use of books. The former had an effect of .43 on
ACT-M scores; the latter had an effect of .6 on ACT-E scores.
• For students who took the ACT but did not take the PLAN, no forms of preparation had significant effects
on test performance.

Preparation for College Admission Exams • National Association for College Admission Counseling16
Limitations in the Research LiteratureThere are four principal reasons why the consensus position across most prior coaching studies—that coach-
ing programs typically have either a small effect or no effect on admission test performance—may not tell the
full story about the effectiveness of admission test coaching programs.
1) Heterogeneity of coaching quality and coaching effects. In most of the available empirical studies, the
form of test preparation being evaluated can be classified as coaching because it involves an instruc-
tor that is teaching students not just the content represented on the test, but specific strategies for
answering test questions correctly. However, coaching can differ in its quality, setting and duration. In
the large-scale evaluations that have been conducted, these sorts of fine-grained distinctions about the
characteristics of different coaching programs are unavailable. It is possible that there are specific high-
quality coaching programs with larger effects than the average effects found in these studies. For one
such example, see Kaplan, 2005. In addition, it may be that coaching is somewhat more or less effective
for certain kinds of students. The studies by Briggs, and Briggs and Domingue suggest that coaching
is more effective for students with strong academic backgrounds and high socioeconomic status who
underperformed on the PSAT.
2) The design of studies evaluating coaching vary in quality. The optimal design for an evaluation of the
effect of test preparation would involve the random assignment of students into different preparatory
conditions. To date no such study has been successfully conducted on a large scale. Instead, existing
coaching studies typically make some form of statistical adjustment that takes into account known dif-
ferences in the characteristics of coached and uncoached students. There is no guarantee that such
adjustments will be successful.8
3) The changing format of admission tests. The SAT has undergone substantial changes to its format
over the years (Lawrence et al, 2004). The SAT of 2008 bears scant resemblance to the SAT adminis-
tered from 1953 through 1992, the period during which the bulk of coaching studies were conducted.
Beyond the addition of a writing section in 2006, the types of items thought to be most coachable
in the critical reading and math sections have been replaced (antonyms and analogies in the critical
reading section; quantitative comparisons in the mathematics section). Some similar changes are also
evident with the ACT, which added an (optional) writing section in 2006. To date, there have been no
studies that have evaluated the effects of coaching for the newest versions of the SAT and ACT. Of
particular interest would be an evaluation of the effect of coaching on the new writing sections that
have been added to both tests.9
4) The emergence of computer-based coaching. Over the past 10 years, there has been a dramatic in-
crease in the availability of computer-based coaching options via the Internet. It is very likely that as of
2008, a majority of students taking the SAT or ACT are preparing by taking advantage of practice test
items available at a variety of Web sites both commercially and for free. Little is known about the efficacy
of specific Internet-based coaching services.
8 However, to the extent that coaching estimates are biased, it seems likely that they will have been overestimated, since omitted variables such as student motiva-tion are probably positively correlated with admission test performance and coaching status.
9 See Hardison and Sackett (2008) for a recent study that has evaluated, in a more general sense, the susceptibility of writing samples on standardized tests to “rules-based” coaching.
Preparation for College Admission Exams • National Association for College Admission Counseling17
While these are all legitimate limitations in the research literature, and are suggestive of areas for further study,
they do little to undermine one key central message: To the extent that coaching has an effect on admission
test scores, such effects are considerably smaller than that which has been implied or promised by most
commercial coaching companies. However, whether these effects are in some sense practically significant is
another issue altogether, one that is addressed in the next section.
The Practical Significance of Coaching EffectsFrom a psychometric standpoint, when the average effects of coaching are attributed to individual students
who have been coached, these effects cannot be distinguished from measurement error. Recall that the stan-
dard error of measurement on any section of the SAT tends to be about 30 points; for the ACT it is between
1.5 and two points. Using this as a benchmark, none of the coaching effects estimated in the large-scale
studies by Powers and Rock, Briggs, and Briggs and Domingue are practically significant. On the other hand,
if marginal college admission decisions are made on the basis of very small differences in test scores, a small
coaching effect might be practically significant after all.
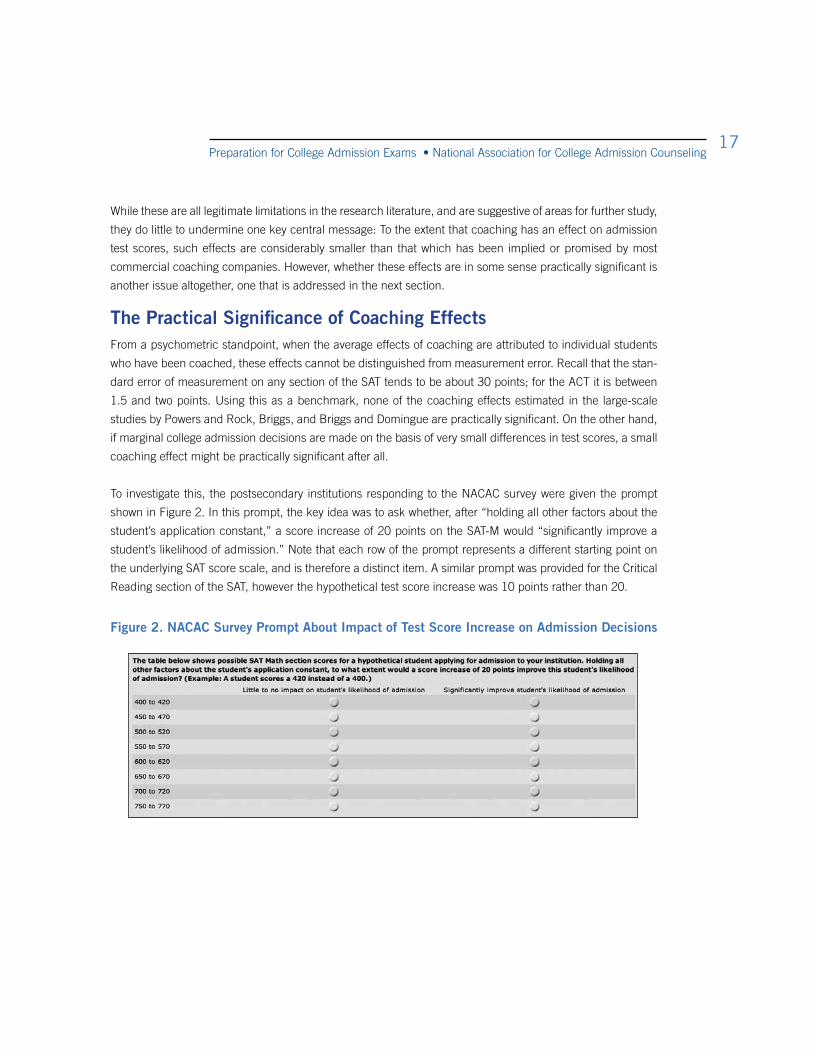
To investigate this, the postsecondary institutions responding to the NACAC survey were given the prompt
shown in Figure 2. In this prompt, the key idea was to ask whether, after “holding all other factors about the
student’s application constant,” a score increase of 20 points on the SAT-M would “significantly improve a
student’s likelihood of admission.” Note that each row of the prompt represents a different starting point on
the underlying SAT score scale, and is therefore a distinct item. A similar prompt was provided for the Critical
Reading section of the SAT, however the hypothetical test score increase was 10 points rather than 20.
Figure 2. NACAC Survey Prompt About Impact of Test Score Increase on Admission Decisions

Preparation for College Admission Exams • National Association for College Admission Counseling18
There were a total of 130 out of 246 admission counselors who indicated that their postsecondary institutions
used the SAT to make admission decisions and who responded to all prompts about score increases on the
SAT-M and SAR-CR. These institutions were further subdivided into those who admitted less than 50 percent
of their applicants (“more selective,” N=33) and those who admitted 50 percent or more of their applicants
(“less selective,” N=97). Finally, the proportion of respondents endorsing option two (“Significantly improve
student’s likelihood of admission”) was plotted by selectivity for each of the eight SAT scale score options for
the items described in Figure 2. The results are shown in Figures 3 and 4.
Figure 3. Practical Significance of Coaching Effect on SAT-Math
Would a 20 Point Effect Increase Likelihood of Admission?

Preparation for College Admission Exams • National Association for College Admission Counseling19
Figure 4. Practical Significance of Coaching Effect on SAT-Critical Reading
These results indicate that in some cases more than one third of postsecondary institutions agreed that a score
increase on the SAT-M of 20 points, or a score increase on the SAT-CR of 10 points, would “significantly improve
student’s likelihood of admission.” This proportion tends to rise as the base level of the SAT score before the 20 or 10
point score improvement rises. This is especially true for the more selective institutions. At lower scores on the SAT
scale, a small score increase does the most to improve a student’s chances of admission at less selective institutions;
at higher scores, the same increase appears to have an equally large or even larger impact at more selective institu-
tions. This is probably because at the most selective institutions, the SAT scores of applicants fall in a relatively narrow
range at the top end of the scale, artificially magnifying the importance of a 10 or 20 point score difference.
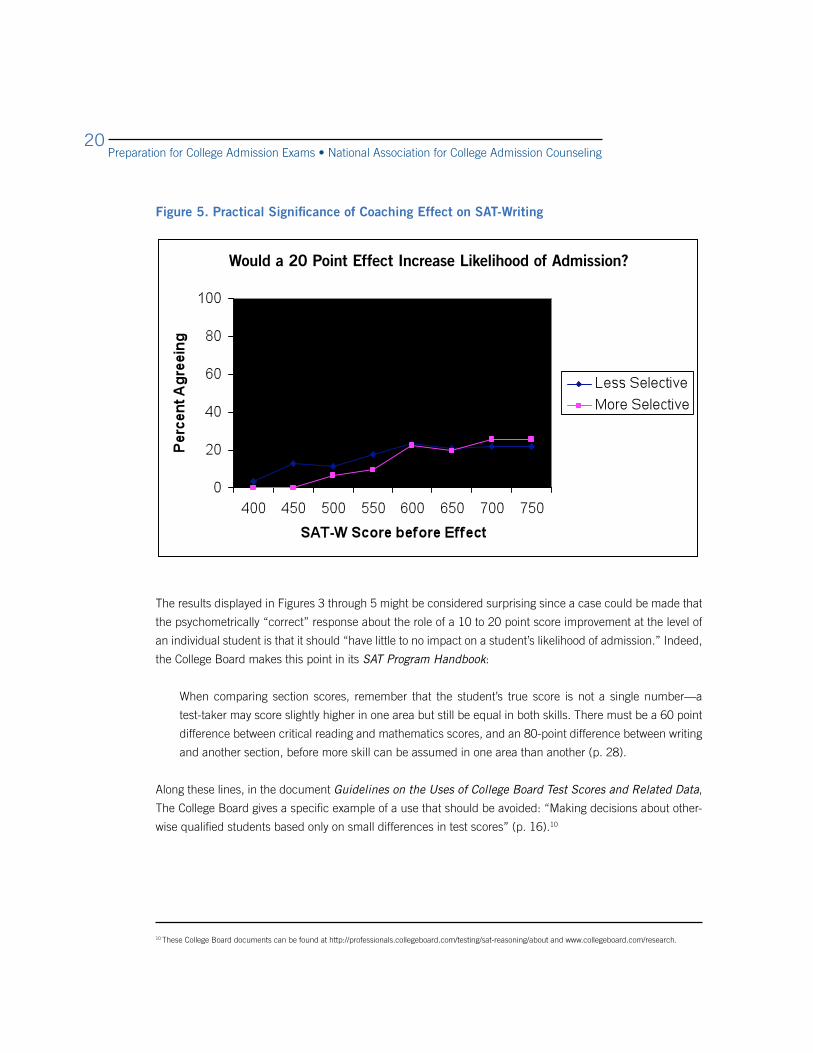
The score improvements of 10 and 20 points for the SAT-CR and SAT-M were chosen to reflect the sorts of score
increases the average student might be likely to experience because of coaching. Since there is no evidence as
to the size of the coaching effect on the SAT-W section, the same prompt was posed with hypothetical score in-
creases of 20 points, under the assumption that it might be possible for coaching to produce the same effect on
the writing section as has been found on the math section. A total of 117 out of 245 institutions using SAT scores
to make admission decisions responded to this prompt. The results are shown in Figure 5. Here the impact of
score increases—while still considerable—is smaller than that shown in Figures 3 and 4, perhaps because the
writing section is relatively new and has less of a history as a device for high-stakes admission decisions.
Would a 10 Point Effect Increase Likelihood of Admission?
Preparation for College Admission Exams • National Association for College Admission Counseling20
Figure 5. Practical Significance of Coaching Effect on SAT-Writing
The results displayed in Figures 3 through 5 might be considered surprising since a case could be made that
the psychometrically “correct” response about the role of a 10 to 20 point score improvement at the level of
an individual student is that it should “have little to no impact on a student’s likelihood of admission.” Indeed,
the College Board makes this point in its SAT Program Handbook:
When comparing section scores, remember that the student’s true score is not a single number—a
test-taker may score slightly higher in one area but still be equal in both skills. There must be a 60 point
difference between critical reading and mathematics scores, and an 80-point difference between writing
and another section, before more skill can be assumed in one area than another (p. 28).
Along these lines, in the document Guidelines on the Uses of College Board Test Scores and Related Data,
The College Board gives a specific example of a use that should be avoided: “Making decisions about other-
wise qualified students based only on small differences in test scores” (p. 16).10
10 These College Board documents can be found at http://professionals.collegeboard.com/testing/sat-reasoning/about and www.collegeboard.com/research.
Would a 20 Point Effect Increase Likelihood of Admission?
Preparation for College Admission Exams • National Association for College Admission Counseling21
The results here seem to indicate that at some postsecondary institutions such advice has gone unread or is not
being taken to heart. Those institutions agreeing that a 10 or 20 point score increase would improve a student’s
chance of admission were much more likely to have responded that the SAT is used to define a cut-off threshold
for admission. At such institutions, a 10 or 20 point coaching effect is clearly very practically significant if it
crosses a cut-off threshold. Although similar prompts were not provided with respect to the ACT exam, it is very
likely that such small differences in ACT scores would have similar impacts on admission decisions. In fact, in
the documents it makes available to postsecondary institutions (see www.act.org/aap/resources.html).11 ACT
Inc. makes little to no mention about the role that measurement error plays in test score interpretations.
The Costs of Test PreparationBeyond that which occurs naturally during students’ years of schooling, the only free test preparation is no
test preparation at all. This is because all test preparation involves two costs: monetary cost and opportunity
cost. The monetary cost of test preparation is relatively transparent. Practice items and tests for student-driven
preparation from the SAT and ACT are available online for no cost or in books for a nominal cost (between
$10 and $20). Commercial coaching is available for a considerable cost ($400 online, $1,100 for a physical
class, $100–200 per hour for in-person tutoring). In contrast, opportunity cost depends upon the duration
of test preparation. Any time spent preparing for an admission exam is time that could have otherwise been
spent doing other sorts of activities that might either improve students’ chances of college admission or better
prepare them for the challenges that await once they matriculate. Hence test preparation with low opportunity
cost will tend to constrain the number of hours students spend, while test preparation with high opportunity
cost does not.
The costs associated with different forms of test preparation are used to characterize the axes in Figure 6,
where the horizontal axis represents monetary cost and the vertical axis represents opportunity cost. Though
in reality the axes represent a continuum, for simplicity, three levels of cost have been specified on each axis:
none, small or large. With respect to opportunity cost, 10–20 hours of preparation is classified as small to
medium. This would represent a student that spends four weekend days the month before the test taking and
reviewing a preliminary practice exam (three to five hours), reviewing content and practicing items (four to
eight hours) and taking and reviewing a final practice exam (three to five hours). On the other hand, 40 hours
or more of preparation is classified as large. This represents the same amount of time as a single high school
course meeting 45 minutes a day over the length of a semester.12
11 The relevant documents are entitled “Your Guide to the ACT”, “2008-2009 User Handbook” and “Using ACT Scores in Admission and Placement Decisions: An Update.”
12 One could argue that coaching programs that involve this amount of student contact time in preparation for a single SAT or ACT test section would seem more reasonably classified as traditional instruction. Previous researchers have used 40 hours as a threshold between short- and long-term preparation (Jackson 1980), but clearly there is ample gray in this distinction.

Preparation for College Admission Exams • National Association for College Admission Counseling22
There are essentially seven relevant cells in Figure 6 that can be used to distinguish methods of test preparation by
their combination of monetary and opportunity cost. The names and test preparation activities of hypothetical stu-
dents have been inserted to illustrate some important differences in the costs students incur, depending upon how
they choose to prepare. The differences depicted in Figure 6 raise at least three important empirical questions.
1) Is some test preparation better than none? This would ideally involve comparing the admission test per-
formance of students like Denny to the performance of all the other hypothetical students in Figure 6.
(Such comparisons were made in the recent study by Briggs and Domingue, 2009.)
2) Does the duration of test preparation matter? This would ideally involve comparing the admission test
performance of students like Eric, Naomi and Matilda to the performance of students like Lucinda, Jane,
Seppy, and John. (For examples of studies addressing this issue, see Messick and Jungeblut, 1982 and
Briggs, 2005. In short, there is evidence of a moderate correlation between the duration of coaching,
and the size of the estimated coaching effect.)
3) Are commercial forms of coaching better than free/cheap forms of coaching or student-driven test
preparation? This would ideally involve comparing the admission test performance of students like Mat-
ilda, Seppy and John to the performance of students like Eric, Lucinda, Naomi, and Jane. (There are no
examples of studies that have adequately addressed this issue.)
Figure 6. The Costs of Different Forms of Test Preparation
Large (30–40 hrs) Eric
40 hours of prep using
online practice items
and tests. ($0)
Naomi
35 hours of prep using
two practice books that
include “tips and tricks.”
($30)
Matilda
40 hours of prep from
Kaplan Classroom
Course ($1,050) or The
Princeton Review Class-
room Course. ($1,100)
Small to Medium
(10–20 hrs)
Lucinda
12 hours of prep using
online practice items
at official test Web site.
($0)
Jane
12 hours of prep using
online practice items
and tests at The College
Board’s “Official SAT
Online Course” ($70)
or “ACT Online Prep.”
($20)
Seppy
12 hours of prep using
Kaplan’s “SAT Online.”
($400)
John
20 hours of prep using
a Kaplan personal tutor.
($130 per hr)
None Denny
Does no specific prepa-
ration for tests.
NA NA
None Small (< $100) Large (≥$400)
Monetary Cost ($)
Oppo
rtun
ity C
ost (
Tim
e)

Preparation for College Admission Exams • National Association for College Admission Counseling23
Caveat EmptorCommercial test preparation services for standardized exams represent a multibillion dollar industry. While
it is difficult to find exact numbers, the market-based research firm Eduventures Inc. (cited in report by
Buckleitner (2006)), puts the annual revenues at more than $4 billion. Two of the most well-known coach-
ing companies, The Princeton Review and Kaplan, offer students “guarantees” that they will improve their
test scores. For example, according to the Kaplan Web site:
“College admission officers agree: your SAT score is considered the 2nd most important factor in the
college application process behind grades in college prep courses (According to the State of College
Admission report 2007). Kaplan will ensure you score higher on the SAT—guaranteed, or your money
back” (Retrieved from www.kaptest.com/sat on December 7, 2008).
Likewise at The Princeton Review Web site:
“90 percent of our SAT students get into one of their top-choice schools… Taking the SAT in the winter
or spring of 2009? Our SAT Comprehensive Classroom Course will give you the skills you need to get
the score you need, guaranteed” (Retrieved from www.princetonreview.com on December 7, 2008).
These guarantees can be misleading unless consumers read the fine print, which can be extensive. Con-
sider, for example, the fine print for the Kaplan guarantee:
You must be enrolled in a Kaplan full classroom, tutoring or online course that began on or after Au-
gust 11, 2003, and attend all required classes or make-up sessions, complete all required tests and
complete all of your required homework as outlined on your student home page. If you feel that you
are not ready to take the exam or are not satisfied with your score on the actual exam, you may repeat
the full course for free for classroom and online students, and complete the full classroom course for
free plus purchase additional tutoring hours at $75/hour for tutoring students. Your free repeat course
must prepare you for a test date within the next three months or the next available test date. If your total
score is not higher on the actual exam than your earlier, official test score or your Kaplan diagnostic (if
you did not take the actual test before), you may repeat the full program for free or get a full refund. To
invoke the Higher Score Guarantee, you must notify Kaplan within 90 days after the date your course
access ends. To be eligible for the refund, you must present a copy of your official score report, your
diagnostic score results and your course materials at the time you invoke the guarantee (Retrieved
from www.kaptest.com/sat on December 7, 2008).
Preparation for College Admission Exams • National Association for College Admission Counseling24
Similarly involved fine print is provided by The Princeton Review with regard to its guarantees. One aspect of
this fine print that merits additional attention is the noted use of “diagnostic” pretests for coached students
who had not previously taken the SAT or ACT. In an investigation of SAT coaching programs in the late 1980s,
Smyth (1990) suggested that one way companies can point to apparent score gains among their clients is to
administer them an unofficial pretest that is in fact harder than an official exam. Relative to this artificially low
baseline score, even highly ineffective coaching might appear successful. The exposé by Smyth also revealed
that virtually all instances of extravagant claims of “typical” SAT score gains of 100 points or greater were
either undocumented or based upon highly self-selected and/or small samples of students.
The fastest growing market for commercial test preparation is in the online environment. In a study conducted
for Consumer Reports WebWatch, Buckleitner (2006) recruited 20 high school juniors to evaluate 10 online
SAT test preparation services over a four week period. Students were randomly assigned to evaluate two
Internet-based services each, and their progress and experiences were monitored by adult researchers. The
key findings reported by Buckleitner were as follows:
• Online services come with aggressive advertising. Students may be inundated with messages from college
and military recruiters or offers for financial aid.
• In six out of 10 services, errors were found in practice tests (e.g., grammatical problems, questions with no
answers, missing sections of text, etc.).
• Higher price and reputation do not necessarily make for better products. The only free service that was
tested (Number2.com) performed “exceptionally well” relative to more expensive competitors (The Princ-
eton Review, Kaplan).
• Technical issues abound. Older Web browsers may not work, and some services require the use of “cook-
ies” which can be intrusive.
• Students’ privacy protection is often unclear. Some sites were very vague about what student information
would be shared and with whom.
In summary, note that there is no incentive for coaching companies to formally evaluate the effectiveness of
their products as part of a controlled experiment. The actual effect of coaching that would be found when
the test performance of a “treatment” group of coached students is compared to that of a “control” group of
uncoached students will inevitably be smaller when contrasted with the gains of a single group of students
before and after they have been coached. Given that the public appears to believe that coaching will improve
scores substantially rather than marginally (despite decades of empirical evidence to the contrary), coaching
companies have avoided taking any action that might dispel such misconceptions. Hence when it comes to
commercial coaching programs, the message is “buyer beware.”

Preparation for College Admission Exams • National Association for College Admission Counseling25
ConclusionThere are three principal conclusions to be drawn from this report:
1) All students should be encouraged to prepare before taking admission tests, but the potential benefits
of test preparation must be balanced against both financial cost and opportunity cost.
2) Because empirical evidence suggests that the average effects of commercial coaching programs are
small, students should be counseled to consider less costly forms of test preparation available by using
books or the Internet. High school students and their families should be counseled to be wary of coach-
ing rip-offs.
3) As it has been found that even small test score increases may increase a student’s chances of admission
at selective institutions, if money and time are no object, commercial coaching or private tutoring may
well be worth the cost. However, this will primarily be true for students with above average admission
test scores in the first place.
The last of the conclusions above is one that reflects the current reality of test use for college admission. Se-
lective postsecondary institutions should be careful about the use of SAT or ACT scores to make fine-grained
distinctions between applicants. This is important because a 20 point SAT-M difference between two college
applicants could be explained by measurement error, differential access to coaching or both. It is strongly
recommended that admission counselors receive training that emphasizes this point.
Preparation for College Admission Exams • National Association for College Admission Counseling26
ReferencesAnastasi, A. (1981). Coaching, test sophistication, and developed abilities. American Psychologist 36(10):
1086-1093. Chance 14(1): 10-18.
Briggs, D. C. (2002). SAT coaching, bias and causal inference. Dissertation Abstracts International. DAI-A
64/12, p. 4433. (UMI No. 3115515).
Briggs, D. C. (2004). Evaluating SAT coaching: gains, effects and self-selection. In Rethinking the SAT: The
Future of Standardized Testing in University Admissions, edited by R. Zwick, 217-34. RoutledgeFalmer.
Briggs, D. C. (2005) Meta-analysis: a case study. Evaluation Review. Vol 29(2), 87-127.
Briggs, D. C. and Domingue, B.W. (2009) The effect of admissions test preparation: new evidence from
ELS:02. Unpublished Working Paper. www.colorado.edu/education/faculty/derekbriggs/publications.html.
Buckleitner, W. (2006). College test prep takes a test: A review of ten online SAT test preparation services.
Retrieved October 1, 2008 from www.consumerwebwatch.org/view-article.cfm?id=10778andat=5104030.
Hardison, C. M. and Sackett, P. R. (2008) Use of writing samples on standardized tests: susceptibility to rule-
based coaching and the resulting effects on score improvement. Applied Measurement in Education 21(3),
227-252.
Kaplan, J. (2005). The effectiveness of SAT coaching on math SAT scores. Chance, 18(2), 25-34.
Lawrence, I., G. Rigol, T. Van Essen and C. Jackson. (2004). A historical perspective on the content of the
SAT. In Rethinking the SAT: Perspectives Based on the November 2001 Conference at the University of
California, Santa Barbara, edited by R. Zwick, 57-74. RoutledgeFalmer.
Messick, S. (1980). The Effectiveness of coaching for the SAT: review and reanalysis of research from the
Fifties to the FTC. Princeton, Educational Testing Service: 135.
Messick, S. and A. Jungeblut (1981). Time and method in coaching for the SAT. Psychological Bulletin 89:
191-216.
Powers, D.E., and Camara, W.J. (1999). Coaching and the SAT I® (College Board Research Note RN-06). New
York: The College Board.
Powers, D. E. and D. A. Rock. (1999). Effects of coaching on SAT I: reasoning test scores. Journal of
Educational Measurement 36(2): 93-118.
Smyth, F. L. (1990). SAT Coaching: What really happens and how we are led to expect more. The Journal of
College Admission 129: 7-17.

Preparation for College Admission Exams • National Association for College Admission Counseling27
Appendix A: Summaries of SAT Coaching StudiesTable A-1. SAT Coaching Study Sample Characteristics
Study Sample Size1 (Coached/Total) Grade Level School Type Location Year(s) Tested
SES of Sample2
SAT-V SAT-M
UNCONTROLLED STUDIES
School-based Coaching
Pallone (1960) 100 NA Pre-college 1 private (all male) Washington, DC 1959 High
Marron (1965) 714 715 11th, 12th 10 private (all male) Washington, DC 1962 High
Johnson [Atlanta and NY sites] (1984) 117 116 11th multiple public (all Black, urban) New York, Georgia 1983–94 Low
Commercial Coaching
Kaplan (2001) NA 18 12th multiple public and private Connecticut 1999–2000 High
Computer-based Coaching
Coffin (1987) 18 18 11th, 12th 1 public (urban) Massachusetts 1986–87 Low
OBSERVATIONAL STUDIES
School-based coaching
Dyer (1953) 225/418 225/418 12th 2 private (all male) NR 1951–52 High
French (1955) 161/319 161/319 12th 3 public Michigan, Massachusetts 1954 High
Dear (1958) 60/586 60/586 12th multiple public and private New Jersey, New York, Pennsylvania 1956–57 High
Kintisch (1978) 38/76 NA 12th 1 public (suburban) Pennsylvania 1976–78 NR
Burke (1986) 50/100 50/100 11th, 12th 1 public (suburban) Georgia 1984–85 Mixed
Schroeder (1988) NA 21/54 11th 2 public (urban) Georgia 1987 Mixed
Schroeder (1992) NA 59/95 NR 1 public (urban) New York 1991–92 High
Wrinkle (1996) 18/36 NA 9th, 10th, 11th 1 public (suburban) Texas NR High
Commercial Coaching
Frankel (1960) 45/90 45/90 12th 1 public (urban) New York 1958 High
Whitla (1962) 52/104 50/100 11th multiple public and private Massachusetts 1959 High
FTC: BRO/BCP (1978) 556/2,122 556/2,122 11th, 12th multiple public and private (urban) New York 1974–77 Mixed
Whitla (1988) 341/1,558 341/1,558 12th multiple public and private USA 1986–87 High
Zuman [high-SES sample] (1988) 21/55 21/55 11th multiple public (urban) New York 1985–86 High
Smyth (1989) 200/438 200/438 12th 8 private (suburban) Baltimore, Washington, DC 1987–88 High
Snedecor (1989) 264/535 264/535 12th 10 public and private Pennsylvania 1988–89 High
Smyth (1990) 631/1,132 631/1,132 12th 14 private (suburban) Maryland, New Jersey 1989 High
Powers and Rock (1999) 427/2,086 427/2,086 11th, 12th multiple public and private USA 1995–96 Mixed
Briggs (2001) 379/2,554 379/2,554 11th, 12th multiple public and private USA 1991–92 Mixed
Kaplan (2005) NA 34/90 12th multiple public and private Connecticut 1999–2004 High
Briggs and Domingue (2009) 450/2,311 450/2,311 11th, 12th multiple public and private USA 2002–2004 Mixed
RANDOMIZED STUDIES
School-based Coaching
Roberts and Oppenheim (1966) 154/265 188/310 12th 18 public (all Black, urban and rural) Tennessee 1965 Low
Evans and Pike (1972) NA 288/417 11th 12 public (urban and suburban) New Jersey, Ohio, Pennsylvania 1970–71 Mixed
Alderman and Powers (1980) 239/559 NA 11th 8 public and private 7 northeastern states 1977–78 Mixed
Johnson [San Francisco site] (1984) 23/35 23/35 11th multiple public (all Black, urban) California 1983–94 Low
Shaw (1992) 61/122 61/122 12th 3 public (suburban) California 1988 Mixed
Commercial Coaching
Zuman [low-SES sample] (1988) 16/33 16/33 11th multiple public (urban) New York 1985–86 Low
Computer-based Coaching
Hopmeier (1982) 42/71 61/93 9th, 10th, 11th 1 public (suburban) Florida NR Mixed
Laschewer (1985) 13/27 13/27 11th 1 private (suburban Catholic) New York NR Mixed
Curran (1988) 204/408 204/408 11th 4 private (Catholic) Massachusetts 1986–87 Mixed
Holmes and Keffer (1995) 28/58 NA 12th 1 public (rural) Georgia 1990 Mixed
McClain (1999) 40/60 40/60 12th public (suburban) Maryland 1998 Low
NOTES: 1 Samples presented here are summed across all coached and uncoached subsamples considered in given study unless otherwise noted. 2 Approximate socioeconomic status (parental income, education, occupation) of sample on average according to author. NA = not applicable; NR = not reported

Preparation for College Admission Exams • National Association for College Admission Counseling28
Table A-2. SAT Coaching Study Effect Estimates
Study Design Intent Coaching Type Statistical Approach Pre-test Post-test SAT-V SAT-M
Effect Stat Sig
Effect Stat Sig
Dyer (1953) Observational School-based Regression Retired SAT Official SAT 5 <.05 13 <.01
French (1955) Observational School-based Regression Retired SAT Official SAT 18 <.01 6 <.01
Dear (1958) Observational School-based Regression Retired SAT Official SAT -2 NS 21 <.01
Kintisch (1972) Observational w/ matching
School-based NR Official SAT Official SAT 14 NR No coaching
Burke (1986) Observational w/ matching
School-based ANOVA Official PSAT Official SAT 45 <.01 No coaching
Schroeder (1988) Observational School-based Regression Retired SAT Retired SAT No coaching 21 NS
Schroeder (1992) Observational School-based Regression Official PSAT Official SAT No coaching 46 <.05
Wrinkle (1996) Observational w/ matching
School-based Regression Official PSAT or SAT I
Official SATI 31 <.01 No coaching
Frankel (1960) Observational w/ matching
Commercial t-test Official SAT Official SAT 8 NS 9 NS
Whitla (1962) Observational w/ matching
Commercial ANOVA Official SAT Official SAT 11 NS -5 NS
FTC: BRO/BCP (1978) [Company A] Observational Commercial Regression Official PSAT or SAT
Official SAT 28 <.01 24 <.01
FTC: BRO/BCP (1978) [Company B] Observational Commercial Regression Official PSAT or SAT
Official SAT 2 NS 4 NS
Whitla (1988) Observational Commercial NR Self-reported, official PSAT or SAT
Self-reported, official SAT
11 NR 16 NR
Zuman [high-SES] (1988) Observational Commercial Regression Official PSAT Official SAT for treatment/ retired SAT for control
52 <.001 58 <.001
Smyth (1989) Observational Commercial ANOVA Official PSAT or SAT
Official SAT 6 NS 32 <.01
Snedecor (1989) Observational Commercial NR Self-reported, official PSAT or SAT
Self-reported, official SAT
0 NS 15 NC
Smyth (1990) Observational Commercial Regression Official PSAT or SAT
Official SAT 9 <.01 18 <.01
Powers and Rock (1999) Observational Commercial Regression, PSM, IV, HM, Belson
Official PSAT or SAT I
Official SAT I 6 NS 18 <.01
Briggs (2001) Observational Commercial Regression, HM Official PSAT Official SAT 6 <.05 15 <.05
Kaplan (2005) Observational Commercial ANOVA Official SAT Official SAT No coaching 63 <.01
Briggs and Domingue (2009) Observational Commercial Regression, PSM Official PSAT Official SAT 4 NS 12 <.05
Roberts and Oppenheim (1966) Randomized School-based t-test Retired PSAT Retired PSAT 14 NS 8 NS
Evans and Pike (1972) Randomized School-based MANOVA Retired SAT Retired SAT No coaching 17a <.05
Alderman and Powers (1980) Randomized School-based Regression Official PSAT Retired SAT 8b <.05 No coaching
Johnson (1984) Randomized School-based t-test Shortened, retired SAT
Shortened, retired SAT
121c <.05 57c <.05
Shaw (1992) Randomized School-based ANOVA None Official SAT 21 NS 6 NS
Zuman [low-SES] (1988) Randomized Commercial Regression Official PSAT Official SAT for treatment/ retired SAT for control
-1 NS 57 <.001
Hopmeier (1982) Randomized Computer-based
ANOVA None Retired SAT (over two days)
57 <.05 37 <.05
Laschewer (1985) Randomized Solomon 4 Group
Computer-based
MANOVA, Regression Retired SAT Retired SAT -1 NS 12 NS
Holmes and Keffer (1995) Randomized Solomon Four Group
Computer-based
F-test Retired SAT-V Retired SAT-V 39 <.03 No coaching
McClain (1999) Randomized Computer-based
Regression Official SAT I Official SAT I d d
Effects only reported for studies involving control groups.NR = Not Reported NS = Not Significanta Average effect across three item format treatments; these are hypothetical effects if all items on the SAT-M were the same format.b Average effect across eight schools; evidence of poor student motivation among control groups.c Interpretation of effects threatened by severe sample attrition; no attempt made to control for group differences statistically.d Effect not reported for each test section, only for combined sections.
Preparation for College Admission Exams • National Association for College Admission Counseling29
Bibliography of Coaching StudiesAlderman, D. L. and D. E. Powers (1980). The effects
of special preparation on SAT-verbal scores. Ameri-
can Educational Research Journal 17: 239-253.
Briggs, D. C. (2001). The effect of admissions test
preparation: evidence from NELS:88. Chance 14(1):
10-18.
Briggs, D. C. (2002). SAT coaching, bias and caus-
al inference. Ph.D. diss., University of California,
Berkeley.
Briggs, D. C. (2004). Evaluating SAT coaching: gains,
effects and self-selection. In Rethinking the SAT:
Perspectives Based on the November 2001 Confer-
ence at the University of California, Santa Barbara,
edited by R. Zwick, 217-34. RoutledgeFalmer.
Briggs, D. C. (2005) Meta-analysis: a case study.
Evaluation Review. Vol 29(2), 87-127.
Burke, K. B. (1986). A model reading course and its
effect on the verbal scores of eleventh and twelfth
grade students on the Nelson Denny Test, the Pre-
liminary Scholastic Aptitude Test, and the Scholastic
Aptitude Test. Ph.D. diss., Georgia State University.
Coffin, G. C. (1987). Computer as a tool in SAT prep-
aration. Paper presented at the Florida Instructional
Computing Conference, Orlando, FL.
Curran, R. G. (1988). The effectiveness of com-
puterized coaching for the Preliminary Scholastic
Aptitude Test (PSAT/NMSQT) and the Scholastic
Aptitude Test (SAT). Ph.D. diss., Boston University.
Davis, W. D. (1985). An empirical assessment of
selected computer software purported to raise SAT
scores significantly when utilized with short-term
computer-assisted instruction on the microcomput-
er. Ph.D. diss., Florida State University.
Dear, R. E. (1958). The effect of intensive coaching
on SAT scores. Princeton, NJ, Educational Testing
Service.
Dyer, H. S. (1953). Does coaching help? The Col-
lege Board Review 19: 331-335.
Evans, F. and L. Pike (1973). The effects of instruc-
tion for three mathematics item formats. Journal of
Educational Measurement 10(4): 257-272.
Federal Trade Commission, Boston Regional Office.
(1978). Staff memorandum of the Boston Regional
Office of the Federal Trade Commission: the effects
of coaching on standardized admission examina-
tions. Boston, Federal Trade Commission, Boston
Regional Office.
Federal Trade Commission, Bureau of Consumer
Protection. (1979). Effects of coaching standardized
admission examinations: revised statistical analyses
of data gathered by the Boston Regional Office of
the Federal Trade Commission. Washington, DC,
Federal Trade Commission, Bureau of Consumer
Protection.
Fraker, G. A. (1987). The Princeton Review re-
viewed. The Newsletter. Deerfield, MA: Deerfield
Academy.
Frankel, E. (1960). Effects of growth, practice, and
coaching on Scholastic Aptitude Test scores. Per-
sonnel and Guidance Journal 38: 713-719.
French, J. W. (1955). The coach ability of the SAT in pub-
lic schools. Princeton, NJ, Educational Testing Service.
Harvey, K. S. (1988). Videotaped versus live instruc-
tion as a coaching method for the mathematics
portion of the scholastic aptitude test. Ph.D. diss.,
University of Georgia.
Holmes, C. T. and R. Keffer. (1995). A computer-
ized method to teach Latin and Greek root words:

Preparation for College Admission Exams • National Association for College Admission Counseling30
effect on verbal SAT scores. Journal of Educational
Research 89(1): 47-50.
Hopmeier, G. H. (1984). The effectiveness of com-
puterized coaching for Scholastic Aptitude Test in
individual and group modes. Ph.D. diss., Florida
State University.
Johnson, S. T. (1984). Preparing black students for
the SAT—Does it make a difference? (An evaluation
report of the NAACP Test Preparation Project). New
York, National Association for the Advancement for
Colored People.
Kaplan, J. (2001). A new study of SAT coaching.
Chance 14(4): 1-6.
Kaplan, J. (2005). The effectiveness of SAT coach-
ing on math SAT scores. Chance, 18(2), 25-34.
Keefauver, L. W. (1976). The effects of a program of
coaching on Scholastic Aptitude Test scores of high
school seniors tested as juniors. Ph.D. diss., Univer-
sity of Tennessee at Knoxville.
Kintisch, L. S. (1979). Classroom techniques for im-
proving Scholastic Aptitude Test scores. Journal of
Reading 22: 416-419.
Laschewer, A. (1986). The effect of computer as-
sisted instruction as a coaching technique for
the scholastic aptitude test preparation of high
school juniors. Ph.D. diss., Hofstra University.
Marron, J. E. (1965). Preparatory school test prepa-
ration: Special test preparation, its effect on College
Board scores and the relationship of affected scores
to subsequent college performance. West Point, N.Y.,
Research Division, Office of the Director of Admis-
sions and Registrar, United States Military Academy.
McClain, B. (1999). The impact of computer-assisted
coaching on the elevation of twelfth-grade students’
SAT scores. Ph.D. diss., Morgan State University.
Pallone, N. J. (1961). Effects of short- and long-term
developmental reading courses upon the S.A.T. verbal
scores. Personnel and Guidance Journal 39: 654-57.
Powers, D. E. and D. A. Rock. (1999). Effects of
coaching on SAT I: reasoning test scores. Journal of
Educational Measurement 36(2): 93-118.
Roberts, S. O. and D. B. Openheim. (1966). The ef-
fect of special instruction upon test performance of
high school students in Tennessee. Princeton, NJ,
Educational Testing Service.
Rock, D. (1980). Disentangling coaching effects and
differential growth in the FTC commercial coaching
study. Princeton, NJ, Educational Testing Service.
Schroeder, B. (1992). Problem-solving strategies
and the mathematics SAT: A study of enhanced per-
formance. Ph.D. diss., Teacher’s College, Columbia
University.
Sesnowitz, M., K. Bernhardt, and M. D. Knain.
(1982). An analysis of the impact of commer-
cial test preparation on SAT scores. American
Educational Research Journal 19(3): 429-441.
Shaw, E. (1992). The effects of short-term coaching
on the Scholastic Aptitude Test. Ph.D. diss., Univer-
sity of La Verne.
Smyth, F. L. (1989). Commercial coaching and SAT
scores. The Journal of College Admission 123: 2-9.
Smyth, F. L. (1990). SAT Coaching: What really hap-
pens and how we are led to expect more. The Jour-
nal of College Admission 129: 7-17.
Snedecor, P. J. (1989). Coaching: does it pay--revisit-
ed. The Journal of College Admission 125: 15-18.
Stroud, T. W. F. (1980). Reanalysis of the Federal
Trade Commission study of commercial coaching for
the SAT. Princeton, NJ, Educational Testing Service.

Preparation for College Admission Exams • National Association for College Admission Counseling31
Whitla, D. K. (1962). Effect of tutoring on Scholastic
Aptitude Test scores. Personnel and Guidance Jour-
nal 41: 32-37.
Whitla, D. K. (1988). Coaching: does it pay? Not
for Harvard students. The College Board Review
148(Summer 1998): 32-35.
Wing, C. W., R. A. Childs, and S. E. Maxwell. (1987).
Some field observations of the impact of test preparatory
programs on high school students’ Scholastic Aptitude
Test scores. A report to the Awards Committee for Edu-
cation and Wake Forest University, Winston-Salem, NC.
Wrinkle, G. W. (1996). A Scholastic Assessment Test
preparation class and its effect on Scholastic Assess-
ment Test scores. Ph.D. diss., University of Houston.
Zuman, J. P. (1988). The effectiveness of special
preparation for the SAT: an evaluation of a commer-
cial coaching school. Paper presented at the annual
meeting of the American Educational Research As-
sociation, New Orleans, April.
Bibliography of Coaching ReviewsAnastasi, A. (1981). Coaching, test sophistication,
and developed abilities. American Psychologist
36(10): 1086-1093.
Becker, B. J. (1990). Coaching for the Scholastic
Aptitude Test: further synthesis and appraisal. Re-
view of Educational Research 60(3): 373-417.
Bond, L. (1989). The effects of special preparation
on measures of scholastic ability. In Educational
Measurement, edited by R. L. Linn, 429-44. New
York: American Council on Education and Mac-
millan Publishing Company.
Briggs, D. C. (2002). SAT coaching, bias and causal in-
ference. Ph.D. diss., University of California, Berkeley.
Cole, N. (1982). The implications of coaching for
ability testing. Ability testing: uses, consequences,
and controversies. Part II: documentation section.
A. K. Wigdor and W. R. Gardner. Washington, D.C.,
National Academy Press.
DerSimonian, R. and N. M. Laird. (1983). Evaluat-
ing the effect of coaching on SAT scores: A meta-
analysis. Harvard Educational Review 53: 1-15.
Evans, F. and L. Pike. (1973). The effects of instruc-
tion for three mathematics item formats. Journal of
Educational Measurement 10(4): 257-272.
Kulik, J. A., R. L. Bangert-Drowns and C.-L. Kulik.
(1984). Effectiveness of coaching for aptitude tests.
Psychological Bulletin 95: 179-188.
Messick, S. (1980). The Effectiveness of coaching
for the SAT: review and reanalysis of research from
the Fifties to the FTC. Princeton, Educational Testing
Service: 135.
Messick, S. (1982). Issues of effectiveness and eq-
uity in the coaching controversy: implications for
educational and testing practice. Educational Psy-
chologist 17(2): 67-91.
Messick, S. and A. Jungeblut. (1981). Time and
method in coaching for the SAT. Psychological Bul-
letin 89: 191-216.
Pike, L. W. (1978). Short-term instruction, testwise-
ness, and the Scholastic Aptitude Test: a literature
review with research recommendations. Princeton,
NJ, Educational Testing Service.
Powers, D. E. (1993). Coaching for the SAT: A sum-
mary of the summaries and an update. Educational
Measurement: Issues and Practice Summer: 24-39.
Slack, W. V. and D. Porter. (1980). The Scholastic
Aptitude Test: a critical appraisal. Harvard Educa-
tion Review 50: 154-175.