preparation, characterisation and testing of...
TRANSCRIPT

Accepted Manuscript
Title: Preparation, characterisation and testing ofCuO/Ce0.8Zr0.2O2 catalysts for NO oxidation to NO2 and mildtemperature diesel soot combustion.
Author: Javier Gimenez-Manogil Agustın Bueno-LopezAvelina Garcıa-Garcıa
PII: S0926-3373(14)00024-1DOI: http://dx.doi.org/doi:10.1016/j.apcatb.2014.01.018Reference: APCATB 13120
To appear in: Applied Catalysis B: Environmental
Received date: 12-11-2013Revised date: 30-12-2013Accepted date: 10-1-2014
Please cite this article as: J. Gimenez-Manogil, A. Bueno-Lopez, A. Garcia-Garcia,Preparation, characterisation and testing of CuO/Ce0.8Zr0.2O2 catalysts for NOoxidation to NO2 and mild temperature diesel soot combustion., Applied CatalysisB, Environmental (2014), http://dx.doi.org/10.1016/j.apcatb.2014.01.018
This is a PDF file of an unedited manuscript that has been accepted for publication.As a service to our customers we are providing this early version of the manuscript.The manuscript will undergo copyediting, typesetting, and review of the resulting proofbefore it is published in its final form. Please note that during the production processerrors may be discovered which could affect the content, and all legal disclaimers thatapply to the journal pertain.

Page 1 of 38
Accep
ted
Man
uscr
ipt
Preparation, characterisation and testing of CuO/Ce0.8Zr0.2O2
catalysts for NO oxidation to NO2 and mild temperature diesel soot combustion.
Javier Giménez-Mañogil, Agustín Bueno-López and Avelina García-García*
MCMA Group, Department of Inorganic Chemistry. Faculty of Sciences.
University of Alicante. Ap.99-E-03080 Alicante. SPAIN. ([email protected]).
Highlights
Very low copper content increases ceria-zirconia’s activity for NO oxidation
2% CuO/Ce0.8Zr0.2O2 is the optimum formulation found for mild soot combustion
Copper/ceria-zirconia can be competitive versus platinum for DPFs regeneration
Abstract
CuO/ceria-zirconia catalysts have been prepared, deeply characterised (N2
adsorption-desorption isotherms at -196°C, XRD, Raman spectroscopy, XPS, TEM and H2-TPR) and tested for NO oxidation to NO2 in TPR conditions, and for soot combustion at mild temperature (400ºC) in a NOx/O2 stream. The behaviour has been compared to that of a reference Pt/alumina commercial catalyst. The ceria-zirconia support was prepared by the co-precipitation method, and different amounts of copper (0.5, 1, 2, 4 and 6 wt%) were loaded by incipient wetness impregnation.
The results revealed that copper is well-dispersed onto the ceria-zirconia support for the catalysts with low copper loading and CuO particles were only identified by XRD in samples with 4 and 6% of copper. A very low loading of copper increases significantly the activity for the NO oxidation to NO2 with regard to the ceria-zirconia support and an optimum was found for a 4%CuO/ceria-zirconia composition, showing a very high activity (54% at 348ºC). The soot combustion rate at 400ºC obtained with the 2%CuO/ceria-zirconia catalyst is slightly lower to that of 1%Pt/alumina in terms of mass of catalyst but higher in terms of price of catalyst.
Keywords: Copper content; NOx+O2; Ce0.8Zr0.2O2; NO oxidation to NO2; diesel soot combustion.
Page 2 of 38
Accep
ted
Man
uscr
ipt
*Corresponding author. Tel.: +34 965909419; e-mail: [email protected]: +34 96590 3454
1. Introduction
Cerium-based oxides have been studied in the framework of heterogeneous catalysis
in recent years, and they have been used to control emissions of pollutants from the
exhaust gases of gasoline engines in the three-way catalysts (TWCs). The key to
understand the operation of these materials on TWC is based on their ability to release
and store oxygen due to the redox couple Ce3+/Ce4+. The facility with which these
catalysts improve oxygen mobility in the lattice is enhanced by the inclusion of other
cations forming substitutional solid solutions, which can lead to non-stoichiometric
mixed oxides. The final properties of these compounds depend on the conditions of
temperature and gas atmosphere in which they are located. One of the most commonly
used mixed oxides is ceria-zirconia (CexZr1-xO2). Zirconium replaces cerium in their
crystal lattice positions. This distorts the characteristic cubic fluorite structure of ceria
and promotes the creation of oxygen vacancies, thereby facilitating the cerium oxide
redox properties and the oxygen mobility in the lattice. Zirconium doping confers
thermal stability to ceria as well. The importance of these mixed oxides as catalysts has
raised several studies for application to different oxidation reactions [1-7].
Catalysts based on noble metals, such as platinum, have been developed to promote
the oxidation of NO to NO2, which is more oxidant than O2, and decrease the
combustion onset temperature of soot. However, their high cost has led to the study of
other lower-priced materials that can be competitive in terms of catalytic activity. These
include, besides cerium-based catalysts, those using transition metals. The use of
supported or exchanged copper into a cerium-based oxide improves the catalytic
properties, as several studies indicate [8-13].

Page 3 of 38
Accep
ted
Man
uscr
ipt
Copper-doped ceria (ceria-zirconia) mixed oxides have managed to overcome
activity and selectivity of undoped oxides in reactions such as soot combustion [14, 15].
As reported in the literature, copper-based catalysts have been investigated for the NO
oxidation to NO2 as well, using different supports, such as: zeolites [16-18], alumina,
titania, perovskites [19-21], and also ceria [9, 14, 22]. In general terms, these studies
point out that the copper-based catalysts enhance the activity towards the NO oxidation
to NO2, even at low temperatures, with regard to the bare supports. Therefore, active
catalysts with formulation CuO/CexZr1-xO2 are promising candidates to replace noble
metals catalysts, but with lower cost. The ceria-zirconia supports are able to disperse
and stabilise copper particles on its surface improving the activity and preventing
sintering. The Cu-ceria interface interactions confer a synergistic effect, which enhances
the redox properties of the catalyst due to the stabilisation of highly reactive copper
species [8-13, 21, 23-25]. These types of catalysts have already been studied in other
reactions with technological interest, such as CO oxidation, CO preferential oxidation in
H2-rich streams (CO-PROX) or methanol synthesis from CO and H2 [8, 12, 13, 26-30].
The overall aim of this research is the preparation and detailed characterisation of
mixed oxides with CuO/Ce0.8Zr0.2O2 formulation, prepared with several copper
contents, and its application to the catalytic NO oxidation to NO2 and soot combustion
in a NOx/O2 gas mixture. The choice of the particular formulation Ce0.8Zr0.2O2 for the
support has been done according to our previous optimisation studies [2].
2. Experimental
Catalyst preparation
The Ce0.8Zr0.2O2 mixed oxide (denoted as CZ) has been synthesised by the co-
precipitation method in alkaline medium, by using the cerium and zirconium precursors
(NH4)2Ce(NO3)6 (supplied by Panreac with 99.0% purity) and ZrO(NO3)2·xH2O
(supplied by Sigma-Aldrich, with x≈6, technical grade), respectively. The appropriate
amounts of these precursors were dissolved in distilled water. The corresponding
Page 4 of 38
Accep
ted
Man
uscr
ipt
hydroxides of cerium and zirconium were co-precipitated by dropwise addition of a
10% ammonia solution in water until pH=9, under constant stirring. The solid obtained
was then filtered under vacuum and the yellowish precipitate was washed with distilled
water until neutral pH. Finally it was dried overnight at 110°C and calcined in air in a
muffle at 500°C for 1 h, with a heating rate of 10°C/min.
Ce0.8Zr0.2O2-supported copper catalysts with Cu wt% of 0.5, 1, 2, 4 and 6
(denoted as Cu 0.5%, Cu 1%, Cu 2%, Cu 4% and Cu 6%, respectively) were prepared
by incipient wetness impregnation with Cu(NO3)2·3H2O (supplied by Panreac with
99.0% purity) solutions of different concentration. After impregnation, the samples
were dried overnight in an oven at 110°C and thereafter calcined under air at 500°C for
1 h, with a heating rate of 10°C/min. Due to the limitations of the Cu(NO3)2·3H2O
solubility in water, the Cu 0.5%, Cu 1% and Cu 2% catalysts were impregnated in a
single step, while Cu 4% and Cu 6% were prepared by successive impregnations with
the solution used to prepare Cu 2%.
In order to verify the reproducibility of the copper impregnation method, the
synthesis was repeated in a new batch for Cu 2%. This sample was denoted as Cu 2%-
re.
The actual copper content on the catalysts were close to the nominal values, as
verified by ICP-OES (Perkin Elmer, Optima 3000). The copper was extracted from the
catalysts using a mixture of concentrated HCl/HNO3 (3/1 ratio).
Characterisation techniques
The specific surface areas of the samples were determined by the BET method.
N2 adsorption-desorption isotherms were obtained at -196ºC in an automatic volumetric
system (Autosorb-6B from Quantachrome) after degassing the samples at 250ºC for 4 h.
The specific pore volume was calculated from the desorption branches of the isotherms
at P/P0 = 0.98 following the criteria used by Moretti et al. [31]. The pore size
distribution of the materials was analysed using the Barrett-Joyner-Halenda (BJH)
method.
Page 5 of 38
Accep
ted
Man
uscr
ipt
Powder XRD patterns were recorded in a Bruker D8 advance diffractometer,
using the CuKα radiation (λ = 0.15418 nm). Diffractograms were recorded between 10º
and 60º (2θ) with a step size of 0.05º and measuring for 3s at each step. Indexation and
calculation of unit cell parameters were performed by using the positions of line (111)
and Bragg’s law, considering cubic system for ceria fluorite structure. The estimation of
crystal size was carried out using the Scherrer’s equation and, due to possible effects of
strain in the crystallites, the Williamson–Hall’s method was applied as well [32-34]. In
order to improve accuracy, crystal sizes were estimated as an average value from those
obtained from three representative fluorite reflections ((111), (220) y (311)), since the
corresponding individual measurements showed small deviation among each other.
Raman spectra were performed in a Bruker RFS 100/S Fourier Transform
Raman Spectrometer with a variable power Nd:YAG laser source (1064 nm). 64 scans
at 85 mW laser power (70 mW on the sample) were recorded and no heating of the
sample was observed under these conditions.
The TEM analysis was conducted using a JEM-2010 Transmission Electron
Microscope (JEOL). The microscope is equipped with an imaging camera SC600
ORIUS (GATAN) which is integrated within the program of acquisition and image
processing.
XPS spectra were obtained using a K-Alpha spectrophotometer (Thermo-
Scientific), with a high resolution monochromator. It comprises a source of electrons
and ions for automated load compensation. The X-ray radiation source comprises an Al
anode (1486.6 eV). The pressure of the analysis chamber was kept at 5·10-9 mbar and
was kept working with the detector in constant energy mode with a pass energy of 200
eV for the survey spectrum and 50 eV for the sweep in each individual region. The
binding energy was adjusted using the C 1s transition, appearing at 284.6 eV. Binding
energy values measured are accurate to ±0.2 eV. The values of binding energy and
kinetic energy were adjusted with the Peak-Fit software of the spectrophotometer.
The Zr 3d, Ce 3d, Ce 4d, Cu 2p and Cu-L3VV regions were used in order to
determine the surface composition of the studied catalysts. The proportion of Ce3+
Page 6 of 38
Accep
ted
Man
uscr
ipt
cations with regard to the total cerium on surface was calculated as described by Laachir
et al. [35].
The analysis of the Cu-2p3/2 and Cu-L3VV Auger spectra was used to obtain
information about the nature of the copper species present on the surface of the samples.
The photoreduction of highly dispersed copper species on catalysts due to the
irradiation of X-rays in the analysis chamber is possible according to literature [10, 36].
In order to compare the results, a sample of CuO has also been analysed. This sample
was obtained by calcination of Cu(NO3)2·3H2O in the same conditions than those used
for the catalysts preparation.
The reducibility of the fresh samples was examined by H2-temperature
programmed reduction (H2-TPR) in a Micromeritics Pulse ChemiSorb 2705 device
consisting of a tubular quartz reactor coupled to a TCD detector in order to monitor H2
consumption. 20 mg of sample were placed in the reactor for each experiment. The
reducing gas used was 5% H2 in Ar, with a flow rate of 35 ml/min. The temperature
range explored was from room temperature to 1000ºC with a heating rate of 10ºC/min.
An in situ pre-treatment was carried out under 5% O2 in He. The sample was heated at
10ºC/min from room temperature up to 500ºC, maintaining the maximum temperature
for 60 min.
Catalytic measurements
The catalytic tests were performed in a tubular quartz reactor coupled to specific
NDIR–UV gas analysers (Fisher–Rosemount, models BINOS 100, 1004 and 1001) for
CO, CO2, NO, NO2 and O2 monitoring. For the NO oxidation tests, 80 mg of catalyst
were diluted with 320 mg of SiC to avoid pressure drop. The gas mixture used
comprised 500ppm NOx, 5% O2 and balance N2; the gas flow was fixed at 500 ml/min
(GHSV = 30000 h−1). The experimental set-up has been designed in order to ensure that
the proportion of NO2 in the NO+O2 mixture fed to the reactor is negligible. The
catalytic tests consisted of temperature programmed reactions, where the temperature
was increased from room temperature up to 700ºC at 10ºC/min under the reactive
atmosphere, with the purpose of quantifying the NO to NO2 oxidation capacity of the
catalysts.

Page 7 of 38
Accep
ted
Man
uscr
ipt
The NO2 production profiles were determined in relation to the total amount of
NOx as a temperature function using the following equation (1):
NO2 (%) = 100·(NO2 output)/(NOoutput + NO2 output) (1)
where NOoutput and NO2output are the NO and NO2 concentrations, respectively, measured
at the reactor exit.
Soot combustion tests were performed with selected catalysts in isothermal
conditions (400ºC) and with the same gas mixture used for the NO oxidation
measurements. 80 mg of catalyst were mixed with 20 mg of soot under loose contact
conditions, and diluted with 300 mg of SiC. Temperature Programmed Reactions, under
identical experimental conditions than those used for NO oxidation tests (but with soot)
were previously carried out for the selection of the catalysts.
For the sake of comparison, a commercial 1%Pt/Al2O3 catalyst, supplied by
Sigma-Aldrich with a BET surface area of 160 m2/g, was also tested in identical
conditions than the ceria-zirconia catalysts.
3. Results and discussion
Textural and structural characterisation
Original first paragraph compiled on Supplementary Information.
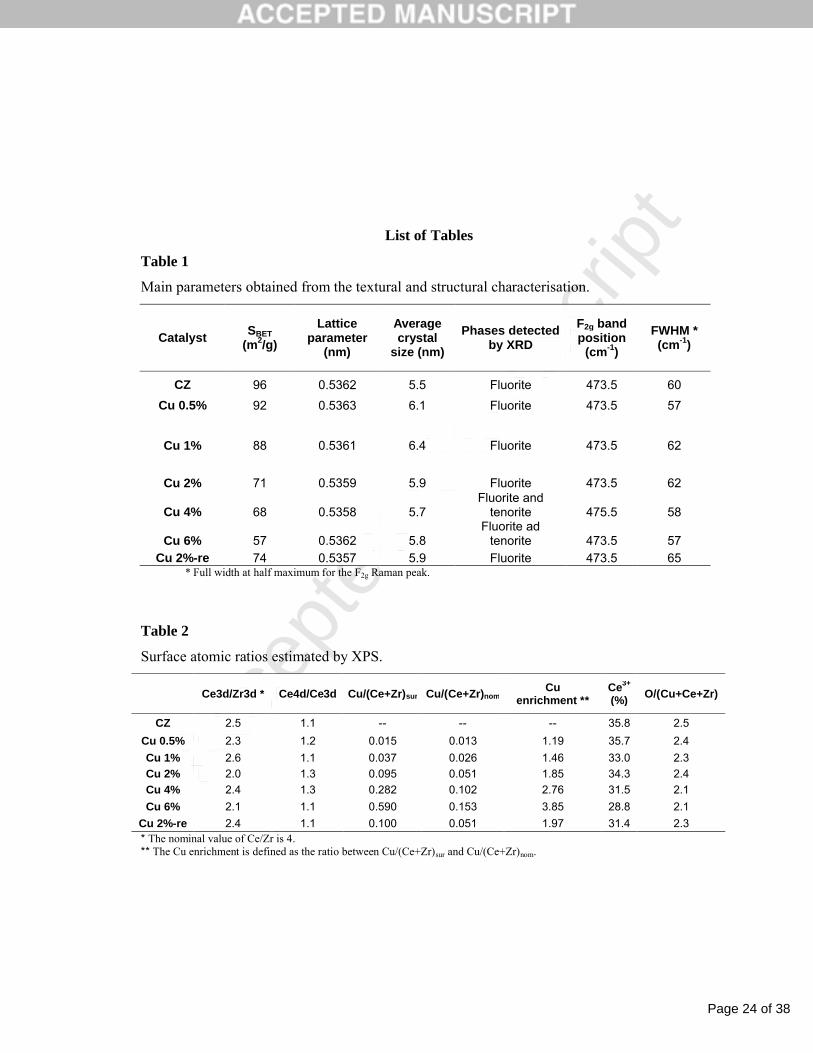
Surface area values (SBET) are shown in Figure 1 and Table 1. The areas of the
copper containing catalysts are lower than that of the parent Ce0.8Zr0.2O2 support (96
m2/g), and decrease with the copper loading. This trend is in accordance with previous
works related to samples prepared by this same procedure [27]. The presence of
mesoporosity was assessed from the N2 physisorption isotherms and the BJH pore size
distributions (see Fig. S1a and S1b from the Supplementary Information).

Page 8 of 38
Accep
ted
Man
uscr
ipt
The specific pore volume (Vs), calculated from the isotherms as described for
this kind of materials [31], concurrently diminishes for catalysts with more than 1%
copper loading (Figure 1). These results indicate a certain Ce0.8Zr0.2O2’s pores blocking
upon copper incorporation on its surface.
Figure 2 displays the X-ray diffractograms of the catalysts. Diffraction peaks
attributable to cubic fluorite phase of ceria are observed in all cases. Two very weak
peaks, characteristic of a CuO phase (tenorite), were also detected at 35.5º and 38.8º for
the samples with the highest copper amounts (4% and 6%), indicating that bulk CuO
crystallites are formed on these catalysts.
The symmetrical peaks of Ce0.8Zr0.2O2 suggested formation of single ceria-
zirconia solid solution (peak splitting would be expected if two phases were
segregated). Table 1 lists lattice constants and average crystal sizes. The lattice
parameter obtained for pure ceria prepared under identical conditions yielded a value of
0.5406 nm [3], and the lattice constant of Ce0.8Zr0.2O2 (0.5362 nm) is quite congruent
with lattice contraction due to zirconium incorporation into the ceria lattice (rCe4+ =
0.097 nm versus rZr4+ = 0.084 nm). Accordingly, the lattice constant obtained for
Ce0.8Zr0.2O2 (0.5362 nm) is very close to that determined theoretically by Vegard’s law
(0.5357 nm) and similar to other literature values reported for a mixed oxide prepared
under very similar experimental conditions (0.5370 nm) [5].
As collected in Table 1, lattice parameters estimated for the copper-containing
catalysts are close to that of the support. This suggests that copper remains essentially
on the surface, and it is not significantly incorporated into the fluorite structure, as could
be promoted by other synthesis routes (e.g. microemulsion-precipitation) [13, 27, 31].
The XRD patterns also showed very broad main peaks, suggesting, a priori,
small crystal sizes. The determination of the crystal sizes can be approached by means
of Scherrer’s equation in agreement with Zhang et al. [34]. This is accounted for in the
supporting information (see Figure S2 and comments appended).
The mentioned average crystal sizes are also listed in Table 1, revealing that the
values obtained for the copper-containing catalysts (in the 5.7-6.4 nm range) remain
close to that of the parent ceria-zirconia support (5.5 nm).

Page 9 of 38
Accep
ted
Man
uscr
ipt
The XRD results are well complemented by the Raman study. Figure 3 shows
the Raman spectra of the samples, all with a main band at 473.5 cm-1 ascribed to the F2g
vibration mode of the fluorite structure of ceria. The intensity of this band decreases by
increasing the copper loading, which could be related to the optical absorption of
copper. Shan et al. [37] reported very reduced Raman modes for a CuO-CeO2 physical
mixture, compared with pure CeO2, due to the strong absorption of CuO in the studied
region (400-1200 cm-1). However, it must be taken into account that the presence of
copper neither affects the position of the F2g band at 473.5 cm-1 nor the band broadening
(Table 1). Results reveal that copper is not loaded into the ceria-zirconia lattice or there
is a small incorporation of copper at surface or subsurface positions of the lattice; which
might not be detected by Raman spectroscopy for these catalysts. Copper incorporation
into the lattice would have been detected by the red shift and the broadening of the main
F2g mode, as published by Gamarra et al. [27].
Finally, very low intensity Raman bands have been found at ≈120 cm-1 and 292
cm-1 for the ceria-zirconia support spectrum, which can be associated to Zr
incorporation into the ceria lattice with the consequent distortion of the framework
symmetry. Additionally, the weak and broad band extending between 560 and 650 cm-1
can be associated to the presence of oxygen vacancies [26, 27, 38].
As a conclusion of data obtained by XRD and Raman spectroscopy, it can be
predicted the possible existence of the pseudocubic t” metastable phase on the ceria-
zirconia support [1, 3]. This t” phase differed from the symmetric cubic c phase only in
that some oxygen ions are displaced from their ideal octahedral positions of the fluorite
structure to new tetragonal positions, while all cations remain in their face cubic centred
positions [1, 3, 29]. This also applies to 0.5%Cu/ceria-zirconia, but is not so obvious for
catalysts with higher copper loadings. The progressive loss in Raman intensity with the
copper content makes it difficult to distinguish between the t’’ and c phases. Finally, the
presence of a very weak band detected at 294 cm-1 (not apparent due to the scale) for the
highest copper-containing sample (Cu 6%) is compatible with the presence of
crystalline CuO on this sample, as observed by XRD. This also agrees with previous
results from Gamarra et al. [27] where the same minor detectable signal was seen for a
5%Cu/CeO2 sample.

Page 10 of 38
Accep
ted
Man
uscr
ipt
TEM has been used in order to analyse the morphology of the samples. Figure
S3, from Supplementary Information, illustrates the images of some representative
samples: the ceria-zirconia support and the catalysts with 0.5%, 4% and 6% of copper
loading. The presence of aggregates of multiple nanoparticles can be generally
observed. The interplanar distances of the lattice fringes observed are compatible with
the fluorite structure in all cases. Evidences of copper were not found in any of the
multiple pictures taken from these samples, in spite of the relatively high copper loading
in some of the samples studied [27].
XPS Characterisation
The catalysts were analysed by XPS to verify, semi-quantitatively, the surface
composition and the oxidation states of copper [39] and cerium. Table 2 lists the several
atomic surface ratios and the Ce3+ percentage (with regard to total cerium) on surface.
To begin with, the Ce/Zr surface atomic ratios for these samples indicate zirconium
enrichment on the periphery of the particles, in accordance with the values of the
solubility constants (4·10-51 for the cerium (IV) hydroxide, and 2·10-48 for the zirconium
hydroxide), as explained in a previous article [3]. This ratio is kept more or less constant
for all catalysts (see Table 2). The Ce4d/Ce3d ratios provide information about the
distribution of cerium in terms of the analysis depth. Higher analysis depth is obtained
for Ce4d as a consequence of lower binding energies for this photo-ionisation level. The
Ce4d/Ce3d ratios are always higher than 1, which is consistent with the zirconium
enrichment on the surface, that is, the cerium concentration increases from the periphery
to the subsequent layers of the particles.
The Cu/(Ce+Zr)sur surface ratios were estimated and compared to the bulk
atomic ratios (appearing as Cu/(Ce+Zr)nom in Table 2). The ratio between these two
parameters (Cu/(Ce+Zr)sur divided between Cu/(Ce+Zr)nom) is a measurement of the
copper enrichment on surface. All the samples present a copper-rich surface, as
expected, and this enrichment increases linearly with the copper content from 1.19 to
3.85 (representation illustrated on Figure S4 of the Supporting Information). This means
a very good distribution of copper inside the accessible porosity, mainly for the
catalysts with lower amount of copper, as the copper enrichment is close to 1; even

Page 11 of 38
Accep
ted
Man
uscr
ipt
though some copper substitution on the surface level could not be discarded. While an
excess of copper remains essentially as CuOx entities on the surface, exceeding the
capacity of support dispersion. Accordingly, small CuO segregated crystallites have
been identified by XRD for the Cu 4% and Cu 6% samples.
The identification of the Ce oxidation state on the samples was performed as
reported in the literature [35]. The chemical valence of cerium on surface of the
catalysts was mainly in a +4 oxidation state, as expected. There are no significant
differences in the samples, and all the values range between 29 and 35% of Ce3+. These
high values cannot be ascribed solely to the presence of a cerium reduced state
associated to the existence of oxygen vacancies, but also to the presence of
Ce2CO3∙xH2O, as proved by high carbon contents on the elemental atomic analysis.
This is consistent with O/(Cu+Ce+Zr) values higher than 2 for all the samples analysed.
Moreover, the spontaneous reduction that ceria-zirconia materials could suffer by the
action of the X-ray irradiation combined with Ultra-High-Vacuum environment should
not be discarded. All these issues were well commented in a previous publication [40].
Regarding the analysis of the surface copper, Cu-2p photoelectron and Cu-L3VV
Auger spectra have been rigorously analysed in an attempt to obtain information about
the nature of the copper species. Usually, the characterisation of the oxidation states of
copper is performed by comparing the Cu-2p3/2 peak position and Auger parameter
values (α’) in a Wagner plot [41]. However, an extensive review of the literature data
points out the intrinsic difficulty in the identification of the copper oxidation state on an
XPS-only basis, particularly in cases where the copper phase is highly dispersed onto a
support [10, 42-44]. In this sense, Espinós et al. [39] proved that this procedure may
result in misleading data, because both parameters (Cu-2p3/2 peak position and Auger
parameter) showed to be affected by the degree of copper dispersion in a series of CuO
samples supported on various oxides, such as ZrO2.
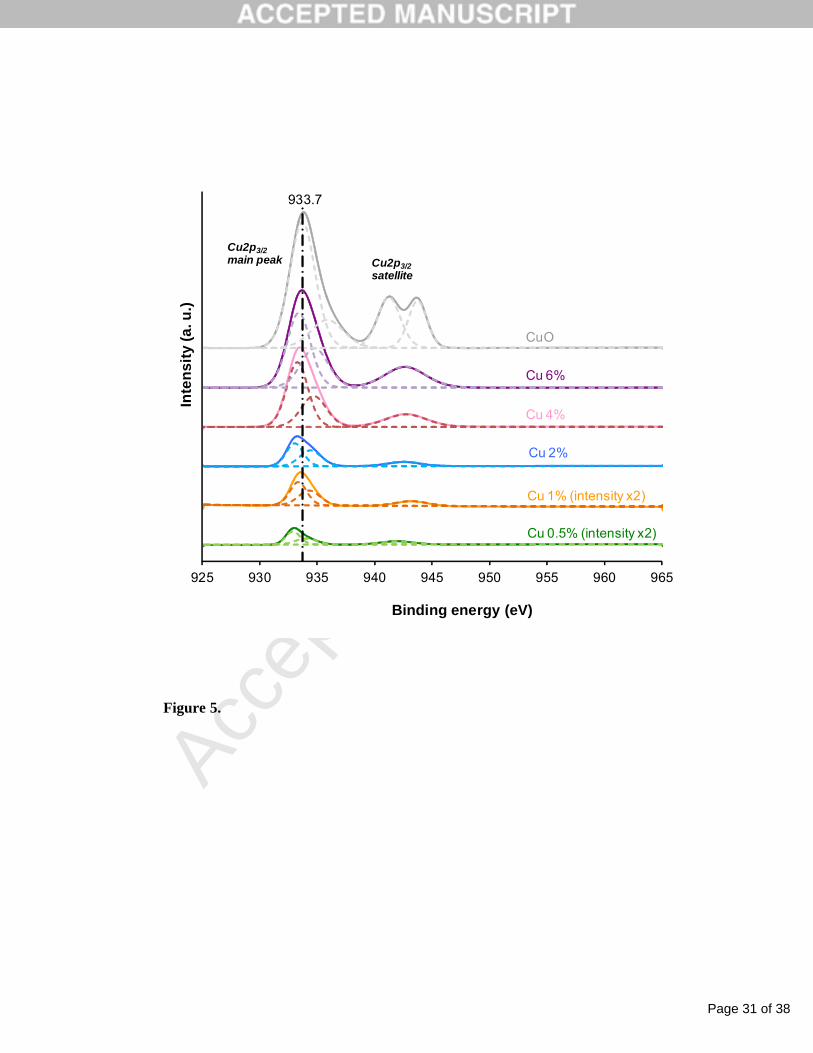
Therefore, the evolution of Auger Cu-L3VV and Cu-2p3/2 spectra for copper
catalysts are shown in Figure 4 and Figure 5, respectively. For comparative purposes,
the profile obtained with a CuO bulk reference sample has been included in the
representations. The position of the main peak shifts to higher kinetic energies with the
copper content in the Auger spectra series (Figure 4) and higher binding energy values

Page 12 of 38
Accep
ted
Man
uscr
ipt
of the Cu-2p3/2 peak position (Figure 5) are found as well. All these data are shown in
Table 3, revealing that they are very sensitive to the copper dispersion degree on the
support, according to Espinós et al. [39]. Additionally, Table 4 shows the representative
values of binding energy and Auger parameter, taken from the literature, for copper
species in well-defined materials. The parameters obtained experimentally for CuO bulk
show an excellent agreement with those reported in the literature [10, 44].
In an attempt to add more information on that subject, the Cu-2p3/2 satellite peak
has been analysed. It is known that for Cu-containing compounds, the existence of the
characteristic satellite peak in the Cu-2p spectra is indicative of Cu2+ presence, since the
d shells of Cu0 and Cu+ are filled and, therefore, cannot give rise to satellite peaks [5,
45, 46]. Thus, the relative proportion of Cu2+ species analysis can be approached by
determining the ratio between the satellite peak area (Asat) to that of main Cu-2p3/2 peak
(Amp), and by further comparison to values obtained with the bulk CuO reference
sample (Asat/Amp = 0.50) [36, 46].
The corresponding ratios for the copper-containing samples are listed on Table
3. It is observed that the results are far from 0.50 for the low copper content samples,
and closer to 0.50 for Cu 4% and Cu 6%, which also present similar values of main
peak position and Auger parameter with regard to CuO. It is important to bear in mind
that for those two samples, evidences of CuO phase were identified by XRD. Therefore,
based on the whole experimental results, it should be underlined that copper is present
mainly as a CuO-like phase for these two samples, although the presence of some Cu+
species cannot be discarded [8, 11].
Conversely, the experimental evidences point out that the low values of Asat/Amp
found for the rest of the samples suggest the coexistence of Cu2+/Cu+ species during the
XPS analysis. Due to possible photoreduction in the spectrometer, it is difficult to
estimate the accurate degree of reduction of the copper species, but the calculations
provide valuable information for catalysts comparison. Thus, according to the survey of
literature, different hypothesis are compiled and underlined here in an attempt to explain
these experimental results: i) a better dispersion of copper yields to a higher
photoreduction of copper, due to the X-ray irradiation during the XPS measurement
[36] or ii) due to strong support interfacial interaction, the Cu+ ions can be stabilised by

Page 13 of 38
Accep
ted
Man
uscr
ipt
interactions with the ceria-zirconia [10]. It should not be excluded the possible
substitution of some cerium surface positions by some copper ions, although copper
substitution into the fluorite structure was not confirmed by bulk techniques.
Finally, it should be noticed that the comparison of the binding energy (BE) and
the Auger parameter (! ’) of the supported catalysts, obtained by the same synthesis
procedure and the same precursors, provides some indirect and qualitative information
about the dispersion degree of the supported phase, since these parameters are very
sensitive to the dispersion degree of copper oxides. From 0.5 to 2% of copper loading, a
high copper dispersion degree is suggested to take place, whereas for the highest copper
loading, the existence of CuO bulk entities seems to be evident from the different
techniques studied [39].
To conclude the characterisation part, we must also consider that the quantitative
determination of dispersed CuO particles, by employing classical chemisorption
techniques, is precluded in this type of samples due to the large reactivity of the support
itself [27]. However, some qualitative information about the nature of copper species
can be obtained from H2-TPR patterns analysis.
H2-TPR characterisation
H2-TPR experiments have been carried out in order to investigate the
reducibility of the catalysts, whose profiles are shown in Figure 6 (a) and (b). A single
broad peak was found for the ceria-zirconia sample, starting at about 500ºC and centred
at 608ºC. As all the samples were pre-treated in situ under O2 at 500ºC to eliminate
most of the surface contamination, it seems reasonable to deduce that the broad peak
obtained corresponds to the reduction of Ce4+ to Ce3+ (equation (2)), because Zr4+
reduction occurs above 1000ºC [3, 47]. Also, the presence of a single peak for this
sample suggests that surface and bulk Ce4+ cations reduction occur concurrently due to
the good bulk oxygen mobility allowed by the presence of Zr4+ cations in an appropriate
ratio [3].

Page 14 of 38
Accep
ted
Man
uscr
ipt
The reduction profile of pure CuO is characterised by a single peak at 350°C. In
contrast, a two-step reduction profile is observed for all the Cu-containing samples, with
peak temperatures considerably lower than those of pure CuO and ceria-zirconia. This
indicates the existence of a synergistic effect between copper and the mixed oxide
which promotes improved reducibility [13, 30, 31, 48-50].
In Figure 6a, the reduction peaks observed from 160 to 300°C should not be only
attributed to copper reduction. Indeed, quantitative estimations reveal overall H2
consumptions exceeding the amounts required for Cu2+ reduction, because considering
the stoichiometry of equation (3), the H2/CuO molar ratio should be 1. However, these
experimental ratios, (expressed as H2/CuO molar ratio obtained and listed in Table 5),
underline that the H2 consumptions are much higher than those necessary for the
theoretical reduction of copper in the samples, suggesting that concomitant ceria
reduction is also taking place, as agreed by several authors [13, 31]. In addition, the
contribution of hydrogen spillover on the support should not be excluded, according to
Moretti et al., for Cu-Ce based materials [31].
2CeO2 + H2 →Ce2O3 + H2O (2)
CuO + H2 →Cu + H2O (3)
The difference between the experimental and theoretical H2 consumption is an
estimation of the H2 amount or “extra H2” due to ceria reduction (and potential spillover
contributions). A quite linear relationship between the amount of H2 due to ceria
reduction and the copper content on samples has been found, (results represented on
Figure S5 of the Supporting Information), with the exception of Cu 0.5% whose
estimation is similar to that of Cu 1%. This suggests that copper catalyses the reduction
of cerium by H2. Even though it is not easy to construct a direct correlation between the
reduction characteristics of CuO-CeO2 catalysts and their activity in oxidation reactions
[51], this observation should be connected to the very similar NO to NO2 oxidation
curves shown by both samples, in spite of having different copper loadings, as we
comment below. In fact, some qualitative relationships between H2-TPR results and
activity data can be established by copper-containing catalysts, in accordance with many
authors [52].

Page 15 of 38
Accep
ted
Man
uscr
ipt
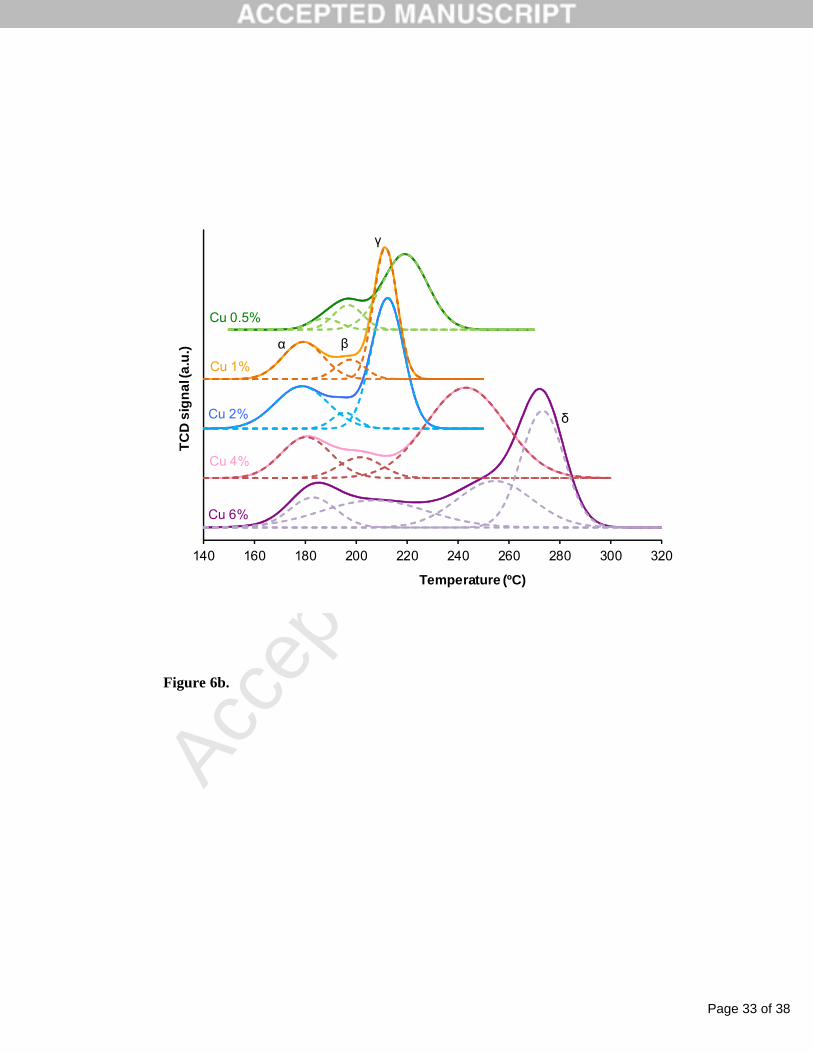
In order to gain an insight into the reducibility behaviour of this series of
samples, the deconvolution of the H2-TPR curves has been performed and represented
in Figure 6b. The profiles of samples with low copper content consist of a combination
of three broad contributions, denoted as α, β and γ. According to literature [53, 54] and
to our analysis, the attribution of the TPR contributions is as follows: the first peak (α)
can be attributed to the reduction of highly dispersed copper oxide species, strongly
interacting with ceria-zirconia [53]. The third peak (γ) is always quite intense and can
be ascribed to the presence of CuO, with less interaction with the support, as well as the
simultaneous Ce4+ reduction and H2 spillover.
The Cu 0.5% profile is clearly different from those of Cu 1% and Cu 2%,
beginning at higher temperature; but in spite of that, the Cu 0.5% catalyst is expected to
present a high copper dispersion, as proven by XPS results and good catalytic activity
results (shown below). In order to reconcile the experimental data obtained, it is
important to pay attention to the second contribution (β). Some authors [55] assign this
second contribution, appearing between the α and γ peaks, to the presence of isolated
Cu2+ ions or highly dispersed clusters. According to Kundakovic et al. [55], when
copper content is sufficiently low, copper is well-dispersed. This species is believed to
be more difficult to reduce, thus appearing at higher temperatures than that of α peak.
Therefore, the TPR profiles shown clearly reveal features related to
structural/morphological differences in the CuOx entities involved. For samples with 4
and 6% of copper, the contributions appear at higher temperatures, proving a lower
reducibility due to a worse copper-support contact. Actually, the sample with the
highest copper content presents a fourth contribution (δ), probably ascribed to bulk-like
CuO particles, in accordance with the XRD analysis which revealed the tenorite CuO
reflexions.
Last paragraph omitted.
Catalytic oxidation of NO to NO2
Figure 7 shows the NO2 percentage profiles obtained in catalytic tests performed
without soot. A very low amount of copper on the catalyst improves the oxidation of
NO to NO2 with regard to the copper-free ceria-zirconia catalyst, decreasing the onset
reaction temperature and shifting the maximum oxidation temperature towards lower
Page 16 of 38
Accep
ted
Man
uscr
ipt
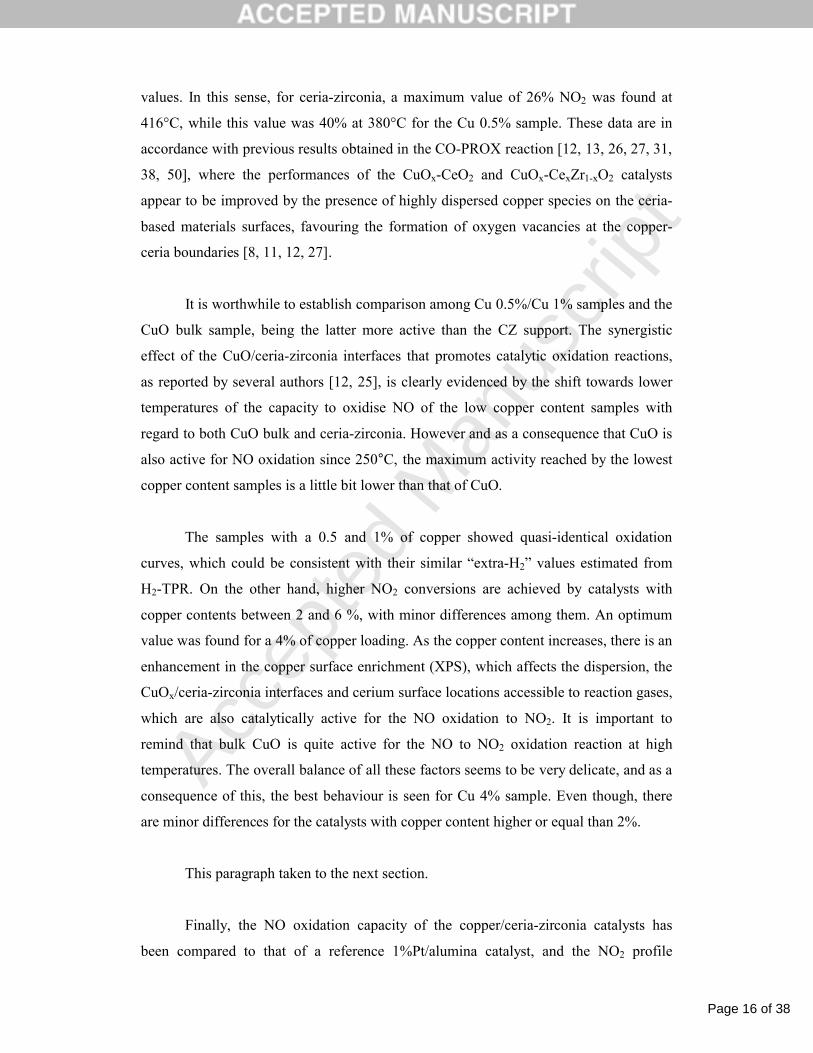
values. In this sense, for ceria-zirconia, a maximum value of 26% NO2 was found at
416°C, while this value was 40% at 380°C for the Cu 0.5% sample. These data are in
accordance with previous results obtained in the CO-PROX reaction [12, 13, 26, 27, 31,
38, 50], where the performances of the CuOx-CeO2 and CuOx-CexZr1-xO2 catalysts
appear to be improved by the presence of highly dispersed copper species on the ceria-
based materials surfaces, favouring the formation of oxygen vacancies at the copper-
ceria boundaries [8, 11, 12, 27].
It is worthwhile to establish comparison among Cu 0.5%/Cu 1% samples and the
CuO bulk sample, being the latter more active than the CZ support. The synergistic
effect of the CuO/ceria-zirconia interfaces that promotes catalytic oxidation reactions,
as reported by several authors [12, 25], is clearly evidenced by the shift towards lower
temperatures of the capacity to oxidise NO of the low copper content samples with
regard to both CuO bulk and ceria-zirconia. However and as a consequence that CuO is
also active for NO oxidation since 250°C, the maximum activity reached by the lowest
copper content samples is a little bit lower than that of CuO.
The samples with a 0.5 and 1% of copper showed quasi-identical oxidation
curves, which could be consistent with their similar “extra-H2” values estimated from
H2-TPR. On the other hand, higher NO2 conversions are achieved by catalysts with
copper contents between 2 and 6 %, with minor differences among them. An optimum
value was found for a 4% of copper loading. As the copper content increases, there is an
enhancement in the copper surface enrichment (XPS), which affects the dispersion, the
CuOx/ceria-zirconia interfaces and cerium surface locations accessible to reaction gases,
which are also catalytically active for the NO oxidation to NO2. It is important to
remind that bulk CuO is quite active for the NO to NO2 oxidation reaction at high
temperatures. The overall balance of all these factors seems to be very delicate, and as a
consequence of this, the best behaviour is seen for Cu 4% sample. Even though, there
are minor differences for the catalysts with copper content higher or equal than 2%.
This paragraph taken to the next section.
Finally, the NO oxidation capacity of the copper/ceria-zirconia catalysts has
been compared to that of a reference 1%Pt/alumina catalyst, and the NO2 profile

Page 17 of 38
Accep
ted
Man
uscr
ipt
obtained with the noble metal catalyst has also been included in Figure 7. As expected,
the noble metal catalyst is much more active as NO oxidation catalyst, and the
differences are more important at low temperatures, where thermodynamic restrictions
do not exist. It has to be taken into account that soot combustion needs a minimum
temperature of 250-300ºC to occur at an appreciable rate, and therefore, the NO2
produced by the platinum catalyst below this threshold will not be really useful.
In order to compare the copper and platinum catalysts behaviour in the soot
combustion reaction, isothermal experiments have been performed with selected
catalysts at 400ºC.
Catalytic soot combustion
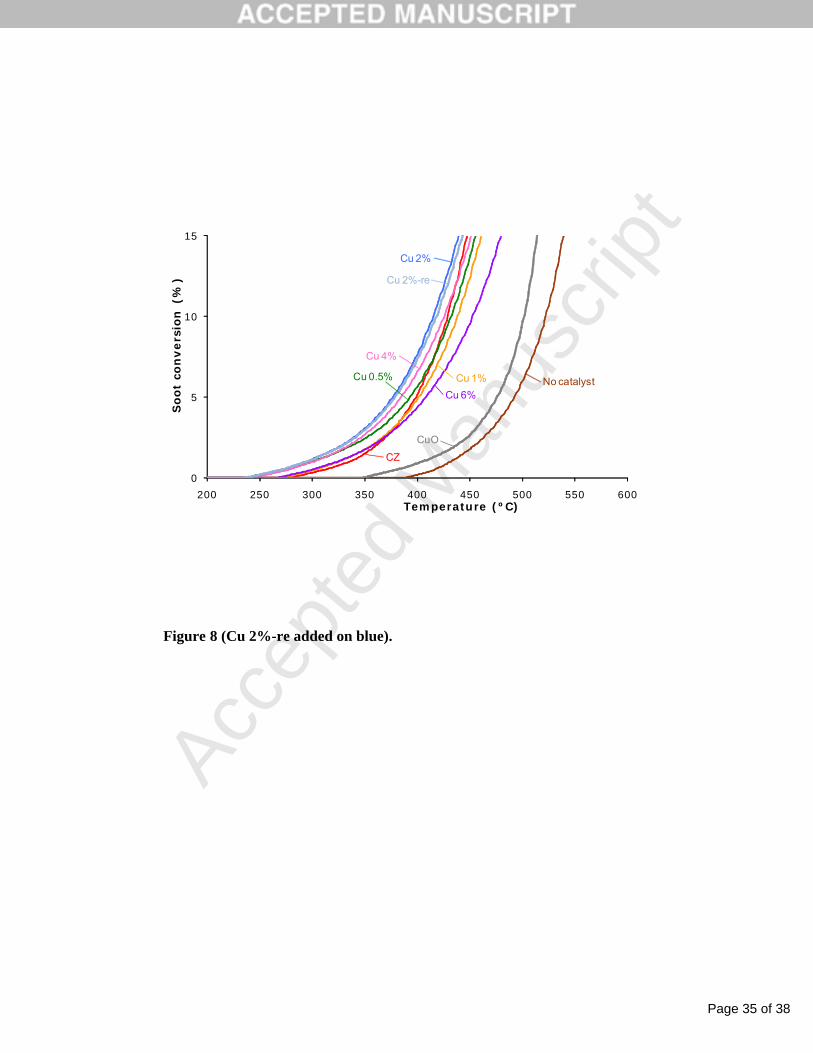
Firstly, soot combustion experiments under TPR conditions were carried out
with the set of samples analysed in the previous section in order to select representative
catalysts to perform the isothermal study. Figure 8 illustrates the detail of the soot
combustion curves (only low/medium temperatures and low values of conversion). It is
interesting to note that the highest activity is shown by Cu 2% sample and the trends in
activity exhibited by the samples are seen changed as the reaction temperature
increases. Thus, for example, ceria-zirconia is the least active sample at the beginning of
the reaction, but its behaviour is progressively improved until becoming the second
sample in the activity order (just after Cu 2%). A reasonable hypothesis to explain these
results is the relevance of the active oxygen assisted-soot combustion (becoming
prevalent at high temperatures) besides the NO2-assisted soot combustion, which is
important to initiate the soot combustion process, as previously reported by the authors
[2, 56]. It is interesting to remind that the BET surface areas decrease progressively as
the copper loading increases on the samples (from 96 to 57 m2/g) and this fact
diminishes the active oxygen transfer to the soot surface as the point of contacts among
the soot surface and the catalyst particles play a key role under the loose contact mode.
Therefore, it seems to be a compromise among a certain copper amount, which
promotes an effective NO oxidation capacity at low temperatures and a minor loss in
BET. The balance among these features yields Cu 2% as the optimum copper content
for soot combustion under NOx/O2 in the range of temperatures considered.
Page 18 of 38
Accep
ted
Man
uscr
ipt
From the results shown on Figures 7 and 8, it is important to point out the
similar catalytic performance between the samples Cu 2% and Cu 2%-re, which can be
easily justified based on the similarity in their textural, structural and redox properties
(see Tables 1, 2, 3 and 5). This confirms the reproducibility of the impregnation method
to incorporate the copper onto the ceria-zirconia support.
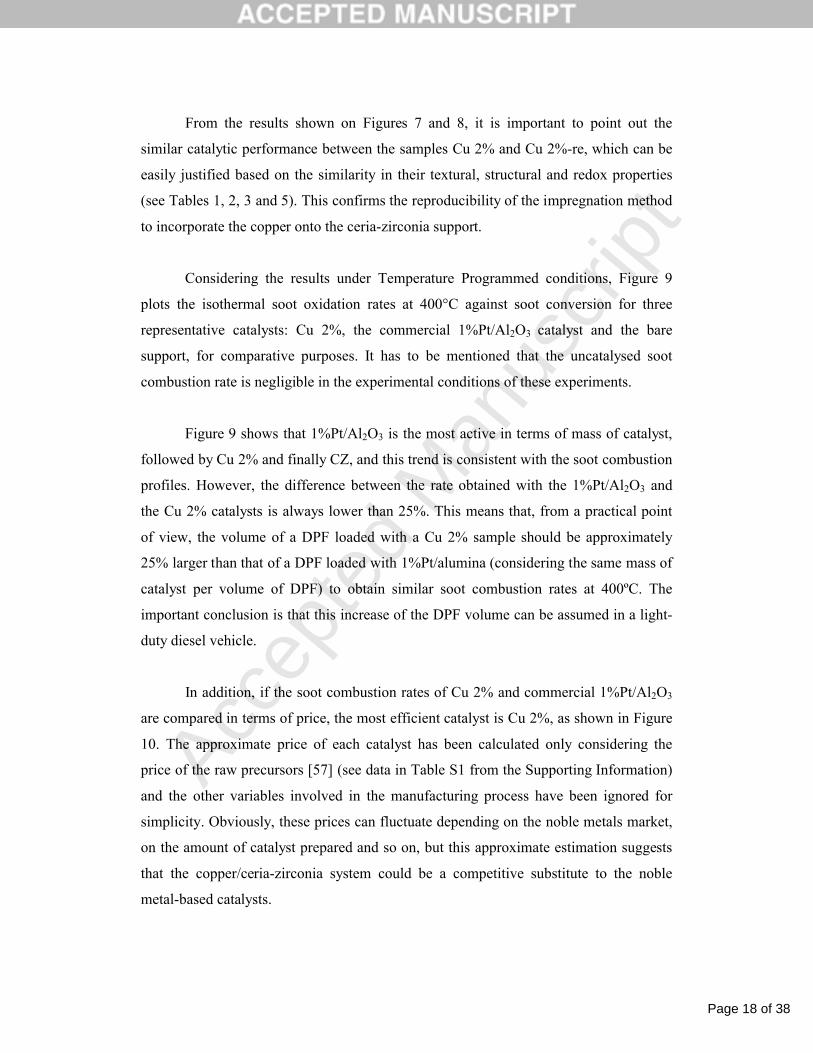
Considering the results under Temperature Programmed conditions, Figure 9
plots the isothermal soot oxidation rates at 400°C against soot conversion for three
representative catalysts: Cu 2%, the commercial 1%Pt/Al2O3 catalyst and the bare
support, for comparative purposes. It has to be mentioned that the uncatalysed soot
combustion rate is negligible in the experimental conditions of these experiments.
Figure 9 shows that 1%Pt/Al2O3 is the most active in terms of mass of catalyst,
followed by Cu 2% and finally CZ, and this trend is consistent with the soot combustion
profiles. However, the difference between the rate obtained with the 1%Pt/Al2O3 and
the Cu 2% catalysts is always lower than 25%. This means that, from a practical point
of view, the volume of a DPF loaded with a Cu 2% sample should be approximately
25% larger than that of a DPF loaded with 1%Pt/alumina (considering the same mass of
catalyst per volume of DPF) to obtain similar soot combustion rates at 400ºC. The
important conclusion is that this increase of the DPF volume can be assumed in a light-
duty diesel vehicle.
In addition, if the soot combustion rates of Cu 2% and commercial 1%Pt/Al2O3
are compared in terms of price, the most efficient catalyst is Cu 2%, as shown in Figure
10. The approximate price of each catalyst has been calculated only considering the
price of the raw precursors [57] (see data in Table S1 from the Supporting Information)
and the other variables involved in the manufacturing process have been ignored for
simplicity. Obviously, these prices can fluctuate depending on the noble metals market,
on the amount of catalyst prepared and so on, but this approximate estimation suggests
that the copper/ceria-zirconia system could be a competitive substitute to the noble
metal-based catalysts.

Page 19 of 38
Accep
ted
Man
uscr
ipt
4. Conclusions
This research has been dedicated to the preparation, characterisation and study of
the catalytic activity of CuO/ceria-zirconia catalysts, and the general conclusions that
have been drawn are the following:
! ! BET surface areas and specific pore volumes of the catalysts decrease by
increasing the copper content, due to the blocking of porosity.
! ! Experimental evidences about copper insertion into the structure of the ceria-
zirconia support have not been found either by XRD or by Raman spectroscopy.
According to XPS and H2-TPR results, copper species are very well-dispersed
onto ceria-zirconia, mainly at low copper loadings. Crystalline CuO entities
have been identified only in samples with 4 and 6% of copper.
! ! The employed method (incipient wetness impregnation) yields reproducible
samples, allowing the preparation of catalysts with very similar textural,
structural and surface properties.
! ! Catalysts with copper drastically decrease the reduction temperature of
CuO/ceria-zirconia samples, in H2-TPR conditions, due to the synergistic effect
conferred by the copper-ceria interfacial interactions.
! ! The addition of a low copper content to the ceria-zirconia support dramatically
accelerates the catalytic oxidation reaction of NO to NO2, in relation to the
support. An optimum value for the catalyst with 4% copper has been found.
! ! The soot combustion rate at 400ºC obtained with a copper/ceria-zirconia catalyst
is somewhat lower than that of 1%Pt/Al2O3, but the difference is low enough to
consider the use of copper/ceria-zirconia catalysts for DPFs regeneration in
light-duty diesel vehicles, with the benefit of the lower price of a catalyst
without noble metals.
Acknowledgements

Page 20 of 38
Accep
ted
Man
uscr
ipt
The authors gratefully acknowledge the financial support of Generalitat Valenciana
(Prometeo/2009/047 project), the Spanish Ministry of Economy and Competitiveness
(CTQ2012-30703 project) and the UE (FEDER funding).
References
[1] A. Trovarelli, Catalysis by Ceria and Related Materials (2002).
[2] N. Guillén-Hurtado, A. Bueno-López, A. García-García, Appl. Catal. A: Gen.437-438 (2012) 166-172.
[3] N. Guillén-Hurtado, A. Bueno-López, A. García-García, J. Mater. Sci. 47 (2012) 3204-3213.
[4] E. Aneggi, C. de Leitenburg, A. Trovarelli, Catal. Today 181 (2012) 108-115.
[5] L. Liu, Z. Yao, B. Liu, L. Dong, J. Catal. 275 (2010) 45-60.
[6] A.E. Nelson, K.H. Schulz, Appl. Surf. Sci. 210 (2003) 206-221.
[7] N. Guillén-Hurtado, I. Atribak, A. Bueno-López, A. García-García, J. Mol. Catal. A: Chem. 323 (2010) 52-58.
[8] A.P. Jia, G.S. Hu, L. Meng, Y.L. Xie, J.Q. Lu, M.F. Luo, J. Catal. 289 (2012)199-209.
[9] F. Lin, X. Wu, D. Weng, Catal. Today 175 (2011) 124-132.
[10] A. Martínez-Arias, M. Fernández-García, J. Soria, J.C. Conesa, J. Catal. 182 (1999) 367-377.
[11] A. Martínez-Arias, A.B. Hungría, M. Fernández-García, J.C. Conesa, G. Munuera, J. Phys. Chem. B 108 (2004) 17983-17991.
[12] A. Martínez-Arias, D. Gamarra, M. Fernández-García, X.Q. Wang, J.C. Hanson, J.A. Rodriguez, J. Catal. 240 (2006) 1-7.
[13] A. Martínez-Arias, D. Gamarra, M. Fernández-García, A. Hornés, P. Bera, Z. Koppany, Z. Schay, Catal. Today 143 (2009) 211-217.
[14] X. Wu, Q. Liang, D. Weng, Z. Lu, Catal. Comm. 8 (2007) 2110-2114.
[15] Q. Liang, X. Wu, D. Weng, Z. Lu, Catal. Comm. 9 (2008) 202-206.
[16] P.S. Metkar, V. Balakotaiah, M.P. Harold, Catal. Today 184 (2012) 115-128.
[17] L. Olsson, H. Sjövall, R.J. Blint, Appl. Catal. B: Environ. 87 (2009) 200–210.
Page 21 of 38
Accep
ted
Man
uscr
ipt
[18] L. Ĉapek, L. Vradman, P. Sazama, M. Herskowitz, B. Wichterlová, R. Zukerman, R. Brosius, J.A. Martens, Appl. Catal. B: Environ. 70 (2007) 53–57.
[19] F.E. López-Suárez, A. Bueno-López, M.J. Illán-Gómez, Appl. Catal. B: Environ. 84 (2008) 651–658.
[20] S. Suárez, S.M. Jung, P. Avila, P. Grange, J. Blanco, Catal. Today 75 (2002)331-338.
[21] F.E. López-Suárez, A. Bueno-López, M.J. Illán-Gómez, A. Adamski, B. Ura, J. Trawczynski, Environ. Sci. Technol. 42 (2008) 7670-7675.
[22] S. Guerrero, G. Águila, P. Araya, Catal. Comm. 28 (2012) 183-190.
[23] A.P. Jia, S.Y. Jiang, J.Q. Lu, M.F. Luo, J. Phys. Chem. C 114 (2010) 21605-21610.
[24] Z.Y. Pu, X.S. Liu, A.P. Jia, Y.L. Xie, J.Q. Lu, M.F. Luo, J. Phys. Chem. C 112 (2008) 15045-15051.
[25] A. Martínez-Arias, M. Fernández-García, O. Gálvez, J.M. Coronado, J.A. Anderson, J.C. Conesa, J. Soria, G. Munuera, J. Catal. 195 (2000) 207-216.
[26] J.L. Ayastuy, A. Gurbani, M.P. González-Marcos, M.A. Gutiérrez-Ortiz, Int. J. Hydrogen Energy 37 (2012) 1993-2006.
[27] D. Gamarra, G. Munuera, A.B. Hungría, M. Fernández-García, J.C. Conesa, P.A. Midgley, X.Q. Wang, J.C. Hanson, J.A. Rodriguez, A. Martínez-Arias, J. Phys. Chem. C 111 (2007) 11026-11038.
[28] A. Hornés, A.B. Hungría, P. Bera, A.L. Cámara, M. Fernández-García, A. Martínez-Arias, L. Barrio, M. Estrella, G. Zhou, J.J. Fonseca, J.C. Hanson, J.A. Rodriguez, J. Am. Chem. Soc. 132 (2009) 34-35.
[29] K.A. Pokrovski, A.T. Bell, J. Catal. 241 (2006) 276-286.
[30] S.P. Wang, T.Y. Zhang, Y. Su, S.R. Wang, S.M. Zhang, B.L. Zhu, S.H. Wu, Catal. Lett. 121 (2008) 70-76.
[31] E. Moretti, L. Storaro, A. Talon, M. Lenarda, P. Riello, R. Frattini, M.d.V. Martínez de Yuso, A. Jiménez-López, E. Rodríguez-Castellón, F. Ternero, A. Caballero, J.P. Holgado, Appl. Catal. B: Environ. 102 (2011) 627-637.
[32] A. Bueno-López, I. Such-Basáñez, C. Salinas-Martinez de Lecea, J. Catal. 244 (2006) 102-112.
[33] M.R. Gallego, La difracción de los Rayos X (Alhambra ed.) (1982).
[34] F. Zhang, Q. Jin, S.W. Chan, J. Appl. Phys. 95 (2004) 4319-4326.

Page 22 of 38
Accep
ted
Man
uscr
ipt
[35] A. Laachir, V. Perrichon, A. Badri, J. Lamotte, E. Catherine, J.C. Lavalley, J. El Fallah, L. Hilaire, F. Le Normand, E. Quéméré, G.N. Sauvion, O. Touret, J. Chem. Soc., Faraday Trans. 87 (1991) 1601-1609.
[36] U. Menon, H. Poelman, V. Bliznuk, V.V. Galvita, D. Poelman, G.B. Marin, J. Catal. 295 (2012) 91-103.
[37] W.J. Shan, W.J. Shen, C. Li, Chem. Mater. 15 (2003) 4761-4767.
[38] J.L. Ayastuy, A. Gurbani, M.P. González-Marcos, M.A. Gutiérrez-Ortiz, Int. J. Hydrogen Energy 35 (2010) 1232-1244.
[39] J.P. Espinós, J. Morales, A. Barranco, A. Caballero, J.P. Holgado, A.R. González-Elipe, J. Phys. Chem. 106 (2002) 6921-6929.
[40] I. Atribak, A. Bueno-Lopez, A. Garcia-Garcia, B. Azambre, Phys. Chem. Chem. Phys. 12 (2010) 13770-13779.
[41] G. Moretti, J. Electron Spectrosc. Relat. Phenom. 95 (1998) 95-144.
[42] A.F. Carley, M.K. Rajumon, M.W. Roberts, J. Solid State Chem. 106 (1993)156-163.
[43] W. Grünert, N.W. Hayes, R.W. Joyner, E.S. Shpiro, M.R.H. Siddiqui, G.N. Baena, J. Phys. Chem. 98 (1994) 10832-10846.
[44] Perkin-Elmer, Handbook of X-ray Photoelectron Spectroscopy (1978).
[45] B. Skårman, T. Nakayama, D. Grandjean, R.E. Benfield, E. Olsson, K. Niihara, L.R. Wallenberg, Chem. Mater. 14 (2002) 3686-3699.
[46] B. Skårman, D. Grandjean, R.E. Benfield, A. Hinz, A. Andersson, L.R. Wallenberg, J. Catal. 211 (2002) 119-133.
[47] A. Łamacz, A. Krztoń, G. Djéga-Mariadassou, Catal. Today 176 (2011) 126-130.
[48] M.F. Luo, J.M. Ma, J.Q. Lu, Y.P. Song, Y.J. Wang, J. Catal. 246 (2007) 52-59.
[49] L. Ma, M.F. Luo, S.Y. Chen, Appl. Catal. A: Gen. 242 (2003) 151-159.
[50] P. Ratnasamy, D. Srinivas, C.V.V. Satyanarayana, P. Manikandan, R.S.S. Kumaran, M. Sachin, V.N. Shetti, J. Catal. 221 (2004) 455-465.
[51] G. Avgouropoulos, T. Ioannides, Appl. Catal. B: Environ. 67 (2006) 1-11.
[52] M.F. Luo, Y.J. Zhong, X.X. Yuan, X.M. Zheng, Appl. Catal. A: Gen. 162 (1997) 121-131.
[53] E. Moretti, L. Storaro, A. Talon, P. Riello, R. Frattini, M. Lenarda, Micropor. Mesopor. Mat. 116 (2008) 575-580.

Page 23 of 38
Accep
ted
Man
uscr
ipt
[54] H.B. Zou, X.F. Dong, W.M. Lin, Appl. Surf. Sci. 253 (2006) 2893-2898.
[55] L. Kundakovic, M. Flytzani-Stephanopoulos, Appl. Catal. A: Gen. 171 (1998)13-29.
[56] I. Atribak, F.E. López-Suárez, A. Bueno-López, A. García-García, Catal. Today 176 (2011) 404-408.
[57] http://www.sigmaaldrich.com/spain.html (accessed on October, 2013)
Page 24 of 38
Accep
ted
Man
uscr
iptList of Tables
Table 1
Main parameters obtained from the textural and structural characterisation.
CatalystSBET
(m2/g)
Lattice parameter
(nm)
Average crystal
size (nm)
Phases detected by XRD
F2g band position
(cm-1)
FWHM * (cm-1)
CZ 96 0.5362 5.5 Fluorite 473.5 60
Cu 0.5% 92 0.5363 6.1 Fluorite 473.5 57
Cu 1% 88 0.5361 6.4 Fluorite 473.5 62
Cu 2% 71 0.5359 5.9 Fluorite 473.5 62
Cu 4% 68 0.5358 5.7Fluorite and
tenorite 475.5 58
Cu 6% 57 0.5362 5.8Fluorite ad
tenorite 473.5 57Cu 2%-re 74 0.5357 5.9 Fluorite 473.5 65
* Full width at half maximum for the F2g Raman peak.
Table 2
Surface atomic ratios estimated by XPS.
Ce3d/Zr3d * Ce4d/Ce3d Cu/(Ce+Zr)sur Cu/(Ce+Zr)nomCu
enrichment **Ce3+
(%)O/(Cu+Ce+Zr)
CZ 2.5 1.1 -- -- -- 35.8 2.5
Cu 0.5% 2.3 1.2 0.015 0.013 1.19 35.7 2.4
Cu 1% 2.6 1.1 0.037 0.026 1.46 33.0 2.3
Cu 2% 2.0 1.3 0.095 0.051 1.85 34.3 2.4
Cu 4% 2.4 1.3 0.282 0.102 2.76 31.5 2.1
Cu 6% 2.1 1.1 0.590 0.153 3.85 28.8 2.1
Cu 2%-re 2.4 1.1 0.100 0.051 1.97 31.4 2.3* The nominal value of Ce/Zr is 4.** The Cu enrichment is defined as the ratio between Cu/(Ce+Zr)sur and Cu/(Ce+Zr)nom.

Page 25 of 38
Accep
ted
Man
uscr
iptTable 3
XPS parameters obtained from de Cu-2p3/2 and Cu-L3VV spectra.
Cu2p3/2 peak position (eV)
Auger parameter
! ' (eV)Asat/Amp
CuO 933.7 1851.5 0.50
Cu 0.5% 932.9 1847.9 *
Cu 1% 933.4 1848.8 0.22
Cu 2% 933.1 1848.1 0.18
Cu 4% 933.3 1850.6 0.48
Cu 6% 933.4 1850.6 0.30
Cu 2%-re 933.2 1847.0 0.15
* Not determined due to the very low signal intensity.
Table 4
Representative values of Cu-2p3/2 binding energy (eV) and Cu-L3VV Auger parameter (eV) reported in the literature for copper species in some well-defined materials [42, 46].
Cu-2p3/2
binding energy (eV)
Auger parameter ! '
(eV)
Cu2+ (CuO) 933.8 1851.0
Cu+ (Cu2O) 932.5 1849.6
Cu2+ ions (exchanged in zeolites)
935.2 1849.5
Cu+ ions (exchanged in zeolites)
933.8 1847.2
Table 5
Quantitative analysis of H2-TPR data for CuO/Ce0.8Zr0.2O2 samples.
CatalystTheoretical H2
consumption*(µmol/g)
Experimental H2
consumption(µmol/g)
H2/CuO molar ratioobtained
Cu 0.5% 79 851 10.8

Page 26 of 38
Accep
ted
Man
uscr
ipt
Cu 1% 157 930 5.9
Cu 2% 315 1225 3.9
Cu 4% 630 1738 2.8
Cu 6% 944 2208 2.3
Cu 2%-re 315 1070 3.4
* Theoretical hydrogen consumption required to reduce the nominal amount of CuO, Reaction (3).
List of Figures (new numeration, some Figures taken to Supplementary
Information)
Fig. 1. BET surface areas (in circles) and specific pore volumes (in squares) of the
samples versus copper contents.
Fig. 2. XRD patterns for the samples (fluorite phase reflections are shown in
parentheses, and tenorite phase peaks are marked with *).
Fig. 3. Raman spectra of the catalysts.
Fig. 4. Cu-L3VV spectra of the samples (including CuO reference).
Fig. 5. Cu-2p3/2 deconvoluted spectra for the samples, (fitted envelope and
deconvoluted peaks).
Fig. 6. (a) H2-TPR profiles of the catalysts and the CuO reference sample and (b)
deconvolution of the H2-TPR profiles for the CuO/ceria-zirconia catalysts.
Fig. 7. NO2 production profiles in TPR conditions for the catalysts.
Fig. 8. Detail (only low and medium temperatures) of the soot combustion curves
versus temperature for the ceria-containing catalysts studied. CuO sample and
uncatalysed reaction are included for comparison purposes. (Caught from
Supplementary Information).
Fig. 9. Soot combustion rates versus soot conversion in isothermal conditions (400ºC)
for representative catalysts.

Page 27 of 38
Accep
ted
Man
uscr
ipt
Fig. 10. Soot combustion rates, expressed per euro of catalyst cost, versus soot
conversion in isothermal conditions (400ºC) for representative catalysts.
0.050
0.055
0.060
0.065
0.070
0.075
0.080
0.085
0.090
0.095
55
60
65
70
75
80
85
90
95
100
0 1 2 3 4 5 6
Vs(c
m3 /
g)
SB
ET
(m2 /
g)
% Cu
BET surface area
Specific pore volume
Figure 1.

Page 28 of 38
Accep
ted
Man
uscr
ipt
Figure 2.

Page 29 of 38
Accep
ted
Man
uscr
ipt
100 200 300 400 500 600 700 800 900 1000
Inte
ns
ity
(a.u
.)
Raman Shift (cm-1)
F2g
100 300 500 700 900
Inte
ns
ity
(a
.u.)
Raman shift (cm-1)
F2g
CZ
Cu 0.5%
Cu 1%
Cu 2%
Cu 6%Cu 4%
Figure 3.

Page 30 of 38
Accep
ted
Man
uscr
ipt
910 915 920 925 930
Inte
ns
ity
(a. u
.)
Kinetic energy (eV)
(Intensity x2)
917.8
CuO
Cu 6%
Cu 4%
Cu 2%Cu 1%Cu 0.5%
Figure 4.
Page 31 of 38
Accep
ted
Man
uscr
ipt
925 930 935 940 945 950 955 960 965
Inte
ns
ity
(a. u
.)
Binding energy (eV)
Cu 6%
Cu 4%
Cu 2%
Cu 1% (intensity x2)
Cu 0.5% (intensity x2)
CuO
933.7
Cu2p3/2main peak Cu2p3/2
satellite
Figure 5.

Page 32 of 38
Accep
ted
Man
uscr
ipt
0 100 200 300 400 500 600 700 800 900 1000Temperature (ºC)
TC
D s
ign
al (
a.u
.)
Cu 6%
Cu 4%
Cu 2%
Cu 1%
Cu 0.5%
CZ
CuO (intensity/3)
Figure 6a.
Page 33 of 38
Accep
ted
Man
uscr
ipt
140 160 180 200 220 240 260 280 300 320
TC
D s
ign
al (
a.u
.)
Temperature (ºC)
Cu 6%
Cu 4%
Cu 2%
Cu 1%
Cu 0.5%
βα
γ
δ
Figure 6b.

Page 34 of 38
Accep
ted
Man
uscr
ipt
0
10
20
30
40
50
60
70
80
0 100 200 300 400 500 600 700
NO
2 (
%)
Temperature (ºC)
Thermodynamic equilibrium2NO + O2 ↔ 2NO2
CZ
Cu 0.5%
Cu 1%
Cu 2%
No catalyst
Cu 4%
Cu 6%
1%Pt/Alumina
Cu 2%-re
CuO
Figure 7 (CuO added on grey).
Page 35 of 38
Accep
ted
Man
uscr
ipt
0
5
10
15
200 250 300 350 400 450 500 550 600
Soot
con
vers
ion
(%
)
Temperature (ºC)
CZ
Cu 0.5% Cu 1%
Cu 2%
No catalyst
Cu 4%
Cu 6%
CuO
Cu 2%-re
Figure 8 (Cu 2%-re added on blue).

Page 36 of 38
Accep
ted
Man
uscr
ipt
0.00
0.05
0.10
0.15
0.20
0.25
0.30
0.35
0.40
0 10 20 30 40 50 60 70 80
Rate
(m
gso
ot·s-
1·g
soo
t re
main
ing
-1)
Soot conversion (%)
Cu 2%
CZ
1%Pt/Alumina
Figure 9.

Page 37 of 38
Accep
ted
Man
uscr
ipt
0.0
0.2
0.4
0.6
0.8
1.0
1.2
1.4
1.6
1.8
2.0
0 10 20 30 40 50 60 70 80
Rate
(m
gso
ot·s-
1·g
soo
t re
main
ing
-1·e
uro
-1)
Soot conversion (%)
Cu 2%
CZ
1%Pt/Alumina
Figure 10.

Page 38 of 38
Accep
ted
Man
uscr
iptGraphical Abstract
0.0
0.2
0.4
0.6
0.8
1.0
1.2
1.4
1.6
1.8
2.0
0 10 20 30 40 50 60 70 80
Rate
(m
gsoot·s-
1·g
soo
t re
main
ing-1
·eu
ro-1
)
Soot conversion (%)
Cu 2%
CZ
1%Pt/Alumina