preliminary study of a wing-tip - nasa · pdf filenasa avscom technical memorandum 88343...
TRANSCRIPT
NASA Technical Memorandum 88343
AVSCOM Technical Memorandum 86-A-2
Preliminary Study of a Wing-Tip Vortex Using Laser Velocimetry
R. K. Takahashi and K. W. McAlister
JANUARY 1987
https://ntrs.nasa.gov/search.jsp?R=19870005752 2018-05-09T19:46:23+00:00Z
NASA AVSCOM Technical Memorandum 88343 Technical Memorandum 86-A-2
Preliminary Study of a Wing-Tip Vortex Using Laser Velocimetry
R. K. Takahashi and K. W. McAlister Aeroflghtdynamics Directorate
Ames Research Center Moffett Field, CaZifornia
USAA R TA-A VSCOM
National Aeronautics and Space Administration
Scientific and Technical Information Branch
1987
1 SUMMARY
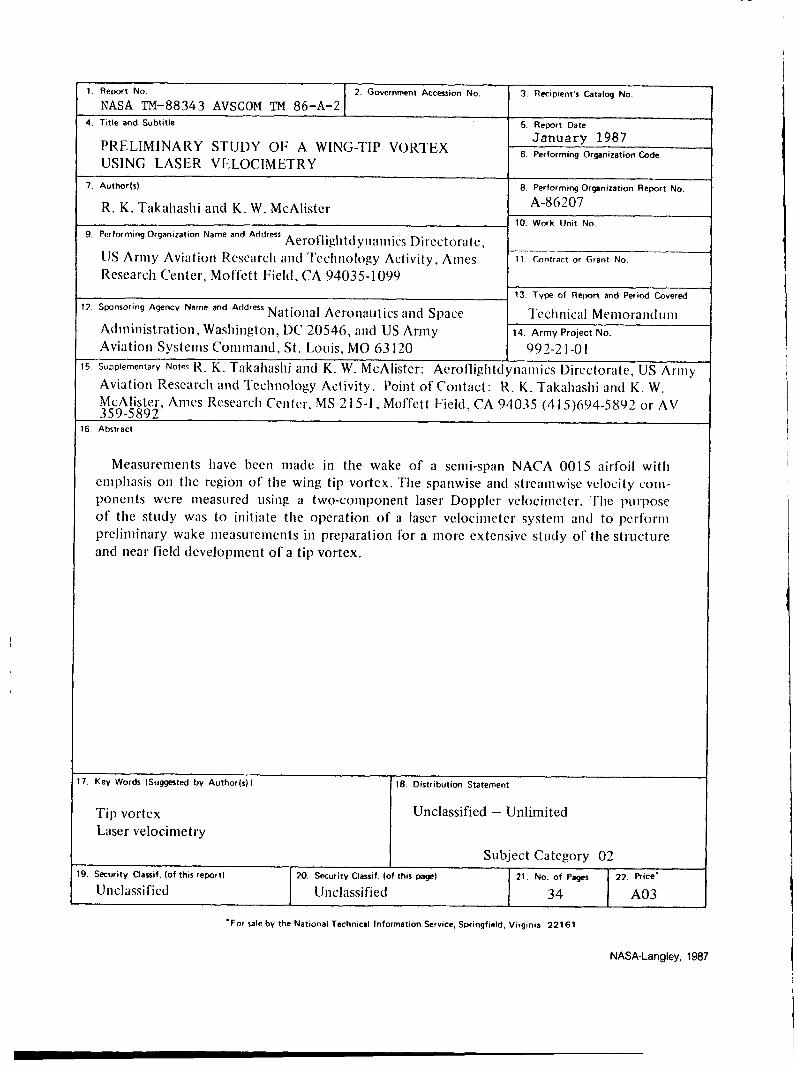
Measurements have been made in the wake of a semispan NACA 0015 airfoil with emphasis on the region of the wing tip vortex. The spanwise and streamwise velocity components were measured using a two-component laser Doppler velocimeter. The purpose of the study was to initiate the operation of a laser velocimeter system and to perform preliminary wake measurements in preparation for a more extensive study of the structure and near-field development of a tip vortex.
j NOMENCLATURE
I a0 vortex core radius I
I I b full span length I
CN normal force coefficient
c airfoil chord length I
Re, Reynolds number, c c / v
i r axisymmetric vortex radial coordinate
I t time I I V, streamwise velocity component i I V, spanwise velocity component
I Ve vortex tangential velocity
1 - V time averaged velocity
V, flow velocity in wind tunnel test section 1 -
TI$ spanwise Reynolds stress component
x streamwise coordinate , I y spanwise coordinate I
z normal coordinate
I z' normal coordinate with origin at the vortex center
1 a! angle of attack
I 6 fringe spacing
I'o large radius vortex circulation
I'" vortex circulation, ZTrVe
I',,, bound circulation on wing
Q standard deviation
B vortex tangential coordinate
INTRODUCTION
Velocity measurements in the wake of a semispan wing using laser velocimetry are presented.
1. To evaluate a laser Doppler velocimeter (LDV), featuring a traversing lens for beam focusing and backscatter collection, as a viable means of velocity measurement in the U.S. Army Aerufiigiiidyiiaruics Direcioraie 7- by IO-Foot Wind Tunnel, and to determine any equipment modifications required for better LDV performance in this facility.
2. To make early measurements of the vortex generated from an available semispan wing to determine the experimental procedures necessary to yield the most accurate and useful data on the tip vortex of a future model.
The study of the tip vortex is of interest to the helicopter industry in connection with rotor-blade vortex interactions, which are suspected of causing unwanted noise and vibrations. A proper study of the rotor-blade vortex interaction problem requires an understanding of the vortex characteristics. Since rotor-blade vortex interaction studies are commonly performed in ground facilities (wind tunnels and water tunnels) using scaled models, extrapolation of these test results to the full-scale rotor requires the proper scaling analyses. Unfortunately, these scaling laws are not obvious because the vortex formation process is not thoroughly understood. The purpose of this study and future studies is to clarify the tip vortex formation process and to determine the proper scaling laws for better rotor-flow predictions.
The tip vortex has been shown by Tung et al. (ref. 1) to consist of four flow regions in a plane normal to the vortex axis (fig. l(a)). Proceeding outward from the center, these regions are described as: (1) the viscous core, where the flow exhibits a laminar behavior (refs. 1 and 2) and rotates as a solid body; (2) the turbulent mixing region, where the flow obtains its maximum rotational velocity and circulation is a logarithmic function of radius; (3) the transition region, which lies between the turbulent mixing region and the inviscid, irrotational region; and (4) the inviscid, irrotational region, where the circulation is constant. These four regions remain distinct as the vortex ages, although the physical size and characteristics may vary.
The aging of the vortex can be divided into three distinct regions along the vortex axis, as observed by Ciffone and Orloff (ref. 3) (fig. l(b)): (1) the development region, which extends from the wingtip to typically a few span lengths downstream where essentially all of the vorticity generated by the semispan wing has fully rolled up into a single vortex; (2) the plateau region, which extends for some distance (typically more than 20 span lengths) downstream, and in which the fully rolled-up vortex decays slowly; and (3) the decay region, which begins at the point where the vortex decays as the square root of downstream distance (ref. 4).
The present study will address the vortex structure in the development region and compare the results with previous experimental studies. Analogies will be made with the fully rolled-up vortex for which extensive analytical studies are available.
As a precursor to a more thorough tip-vortex investigation, the purpose of the study was:
2
DESCRIPTION OF THE EXPERIMENT
Test Facility
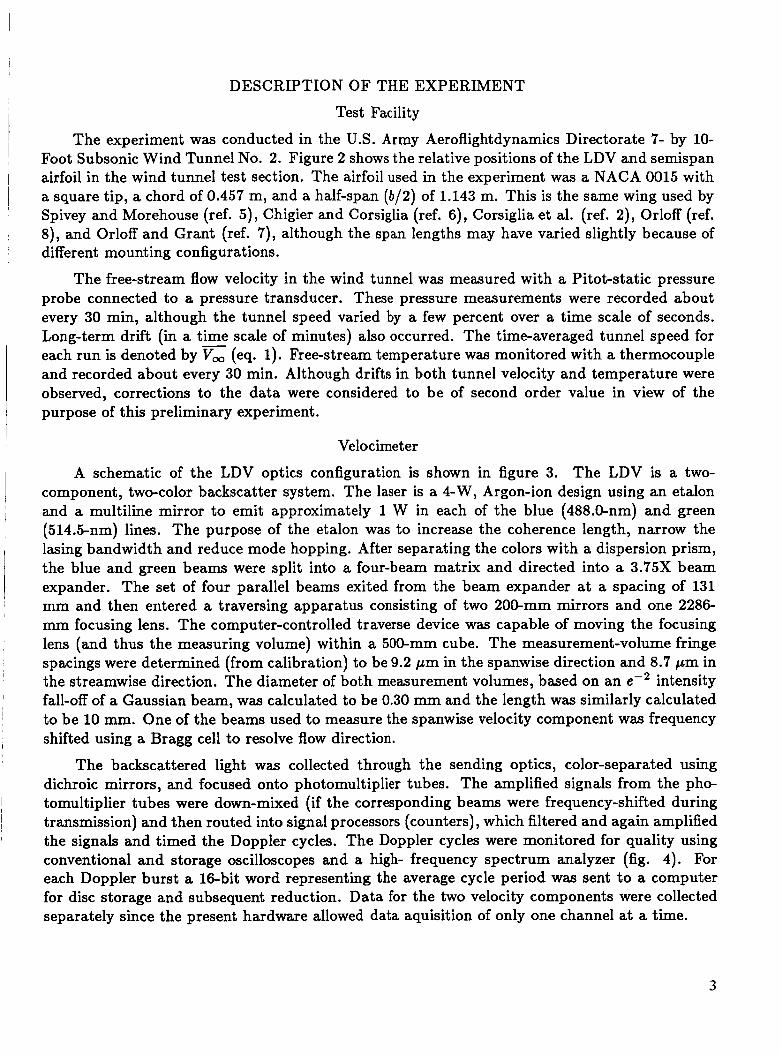
The experiment was conducted in the US. Army Aeroflightdynamics Directorate 7- by 10- Foot Subsonic Wind Tunnel No. 2. Figure 2 shows the relative positions of the LDV and semispan airfoil in the wind tunnel test section. The airfoil used in the experiment was a NACA 0015 with a square tip, a chord of 0.457 m, and a half-span (6/2) of 1.143 m. This is the same wing used by Spivey and Morehouse (ref. 5), Chigier and Corsiglia (ref. 6), Corsiglia et al. (ref. 2), Orloff (ref. 8), and Orloff and Grant (ref. 7), although the span lengths may have varied slightly because of different mounting configurations.
The free-stream flow velocity in the wind tunnel was measured with a Pitot-static pressure probe connected to a pressure transducer. These pressure measurements were recorded about every 30 min, although the tunnel speed varied by a few percent over a time scale of seconds. Long-term drift (in a time scale of minutes) also occurred. The time-averaged tunnel speed for each run is denoted by (eq. 1). Free-stream temperature was monitored with a thermocouple and recorded about every 30 min. Although drifts in both tunnel velocity and temperature were observed, corrections to the data were considered to be of second order value in view of the purpose of this preliminary experiment.
Velocimeter
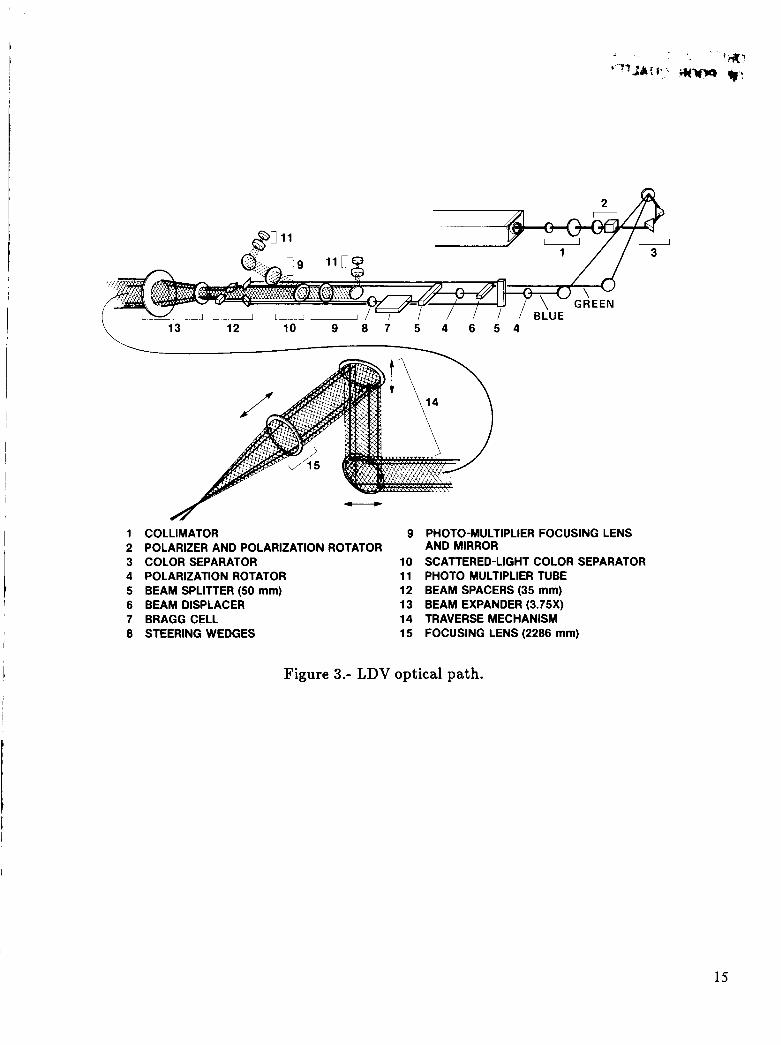
A schematic of the LDV optics configuration is shown in figure 3. The LDV is a two- component, two-color backscatter system. The laser is a 4-W, Argon-ion design using an etalon and a multiline mirror to emit approximately 1 W in each of the blue (488.0-nm) and green (514.5-nm) lines. The purpose of the etalon was to increase the coherence length, narrow the lasing bandwidth and reduce mode hopping. After separating the colors with a dispersion prism, the blue and green beams were split into a four-beam matrix and directed into a 3.75X beam expander. The set of four parallel beams exited from the beam expander at a spacing of 131 mm and then entered a traversing apparatus consisting of two 200-mm mirrors and one 2286 mm focusing lens. The computer-controlled traverse device was capable of moving the focusing lens (and thus the measuring volume) within a 500-mm cube. The measurement-volume fringe spacings were determined (from calibration) to be 9.2 pm in the spanwise direction and 8.7 pm in the streamwise direction. The diameter of both measurement volumes, based on an e-’ intensity fall-off of a Gaussian beam, was calculated to be 0.30 mm and the length was similarly calculated to be 10 mm. One of the beams used to measure the spanwise velocity component was frequency shifted using a Bragg cell to resolve flow direction.
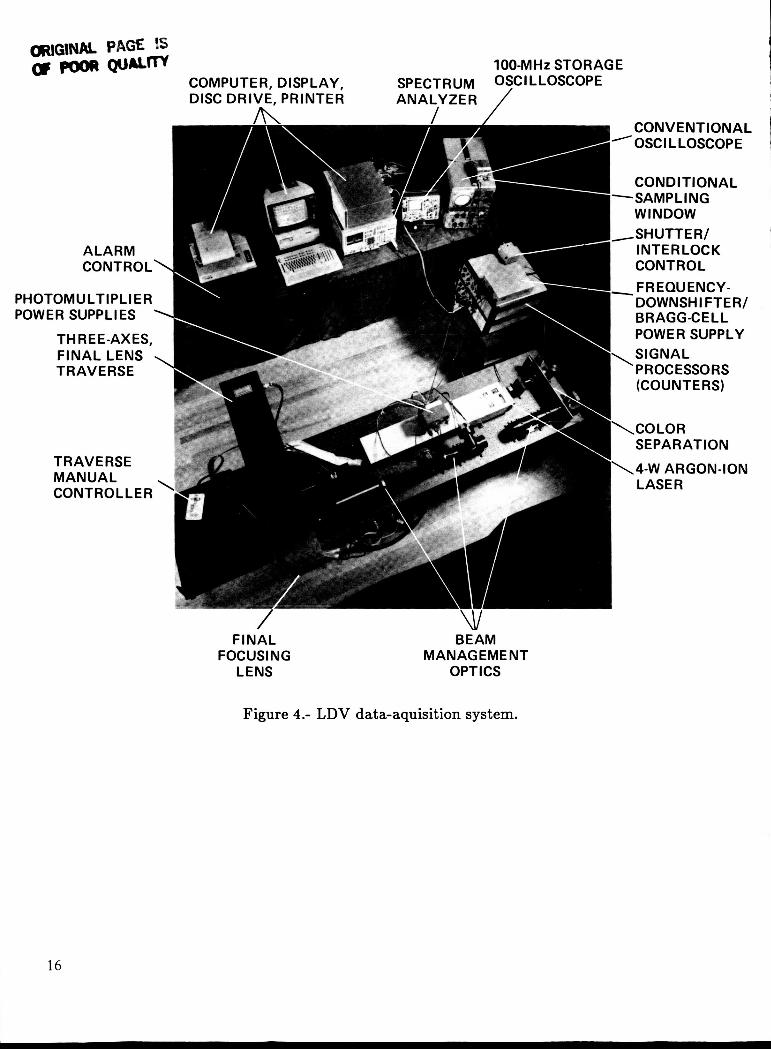
The backscattered light was collected through the sending optics, color-separated using dichroic mirrors, and focused onto photomultiplier tubes. The amplified signals from the pho- tomultiplier tubes were down-mixed (if the corresponding beams were frequency-shifted during transmission) and then routed into signal processors (counters), which filtered and again amplified the signals and timed the Doppler cycles. The Doppler cycles were monitored for quality using conventional and storage oscilloscopes and a high- frequency spectrum analyzer (fig. 4). For each Doppler burst a 16bit word representing the average cycle period was sent to a computer for disc storage and subsequent reduction. Data for the two velocity components were collected separately since the present hardware allowed data aquisition of only one channel at a time.
3
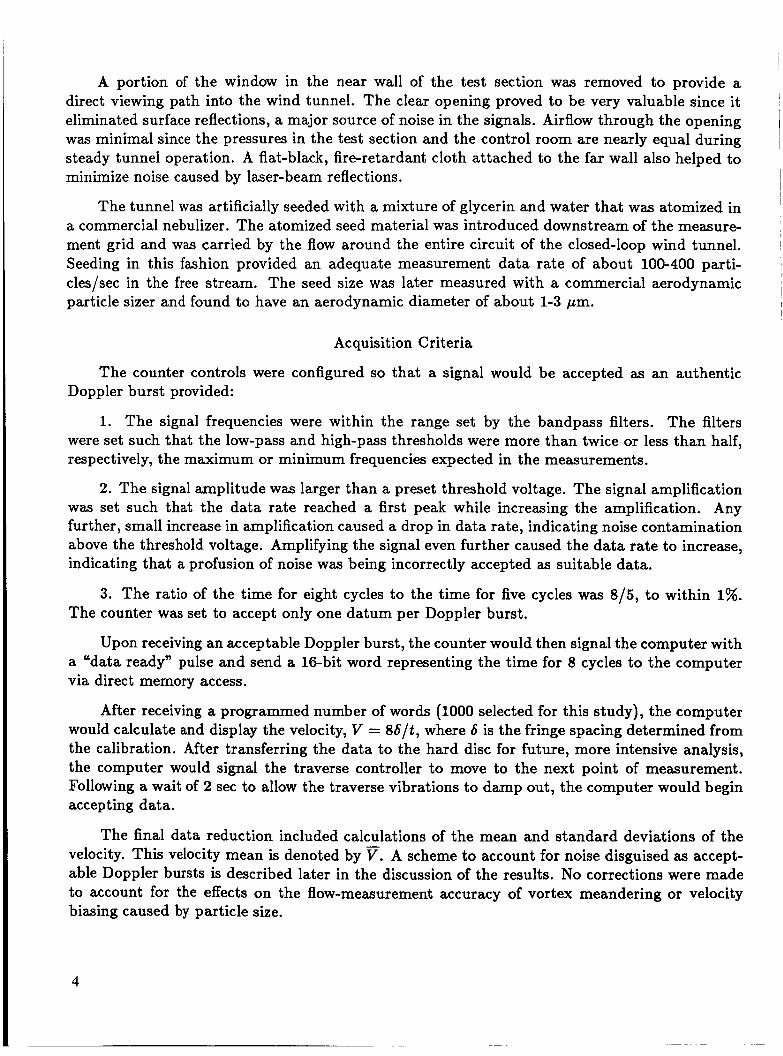
A portion of the window in the near wall of the test section was removed to provide a direct viewing path into the wind tunnel. The clear opening proved to be very valuable since it eliminated surface reflections, a major source of noise in the signals. Airflow through the opening was minimal since the pressures in the test section and the control room are nearly equal during steady tunnel operation. A flat-black, fire-retardant cloth attached to the far wall also helped to minimize noise caused by laser-beam reflections.
The tunnel was artificially seeded with a mixture of glycerin and water that was atomized in a commercial nebulizer. The atomized seed material was introduced downstream of the measure- ment grid and was carried by the flow around the entire circuit of the closed-loop wind tunnel. Seeding in this fashion provided an adequate measurement data rate of about 100-400 parti- cles/sec in the free stream. The seed size was later measured with a commercial aerodynamic particle sizer and found to have an aerodynamic diameter of about 1-3 pm.
Acquisition Criteria
The counter controls were configured so that a signal would be accepted as an authentic Doppler burst provided:
1. The signal frequencies were within the range set by the bandpass filters. The filters were set such that the low-pass and high-pass thresholds were more than twice or less than half, respectively, the maximum or minimum frequencies expected in the measurements.
2. The signal amplitude was larger than a preset threshold voltage. The signal amplification was set such that the data rate reached a first peak while increasing the amplification. Any further, small increase in amplification caused a drop in data rate, indicating noise contamination above the threshold voltage. Amplifying the signal even further caused the data rate to increase, indicating that a profusion of noise was being incorrectly accepted as suitable data.
3. The ratio of the time for eight cycles to the time for five cycles was 8 / 5 , to within 1%.
Upon receiving an acceptable Doppler burst, the counter would then signal the computer with a “data ready” pulse and send a 16-bit word representing the time for 8 cycles to the computer via direct memory access.
The counter was set to accept only one datum per Doppler burst.
After receiving a programmed number of words (1000 selected for this study), the computer would calculate and display the velocity, V = 8 6 / t , where 6 is the fringe spacing determined from the calibration. After transferring the data to the hard disc for future, more intensive analysis, the computer would signal the traverse controller to move to the next point of measurement. Following a wait of 2 sec to allow the traverse vibrations to damp out, the computer would begin accepting data.
The final data reduction included calculations of the mean and standard deviations of the velocity. This velocity mean is denoted by v. A scheme to account for noise disguised as accept- able Doppler bursts is described later in the discussion of the results. No corrections were made to account for the effects on the flow-measurement accuracy of vortex meandering or velocity biasing caused by particle size.
4

Calibration
The LDV requires calibration because actual values for the beam spacings and the focal length of the lens may be different from the nominal values supplied by the manufacturers. Also, hardware limitations may prevent optimum alignment of the beams, resulting in a fringe spacing that differs from the calculated value.
A spinning disc was used for the LDV calibration. Several 5-pm wires were mounted across slots in the disk. The disc was driven by an AC hysteresis-synchronous motor and was rotated at a constant speed with an accuracy comparable to that of the 60-Hz frequency power source. The LDV measuring volume was traversed a known distance from the center of the disc to a radius at which the wires were located (typically 50 mm f 0.1 mm.). From the known velocity at this point on the disc, the fringe spacing was inferred. Measurements of 1000 samples gave a standard deviation of less than 0.6% about the mean.
Measurements
All measurements were made with the airfoil set at an angle of attack of ll", and at two tunnel speeds: 35.2 m/sec and 55.6 m/sec (Re, = 1.02 x lo6 and Re, = 1.61 x lo6). The measurement grids were located 1.6 chords behind the trailing edge of the wing. At each point on the measurement grids, 1000 particles were sampled and the corresponding velocities were saved on a disc. The typical 550 mm by 400 mm measurement grid is shown in figure 5. The grid consists of both 25 mm or 50 mm segments, providing a total of 299 measurement points. The velocities measured were the streamwise (z) and spanwise (y) components. For this study the grid was located at a fixed distance of 1.6 chords behind the wing trailing edge.
RESULTS AND DISCUSSION
Vortex Structure
Figure 6 shows lines of constant spanwise velocity (constant V y / E ) plotted over the mea- surement grid for Re, = 1.02 x lo6. For an ideal, axisymmetric vortex, the vortex center would be identified as the point of intersection of the vertical contour (Vy = 0) and the horizontal line connecting the point contours for maximum \V,\, For the present, nonideal vortex, the V, = 0 contour deviates from the ideal, straight, vertical line, but is still distinct in figure 6. The points for maximum IVY\ are more difficult to identify because of the finite size of the grid spacing, and unless, by chance, the grid lines cross at the location of true maximum lVyl, an interpolation scheme must be used. Nevertheless, the location of the vortex center can be readily located in the figure with the resolution dependent on the grid spacing. The core size, defined here as the distance between the velocity peaks, can be similarly estimated. The outline of the projection of the wing (shaded area) onto the grid shows the vortex core to lie well inboard of the tip and about midway between the downstream projections of the leading and trailing edges.
The vortex is clearly asymmetric. This asymmetry is likely due to the effects of the vortex sheet originating from along the wingspan, and is most apparent in the lower-left portion of the plot. Outside the core, the gradients of velocity are generally higher on the sheet (or wake) side. A
5
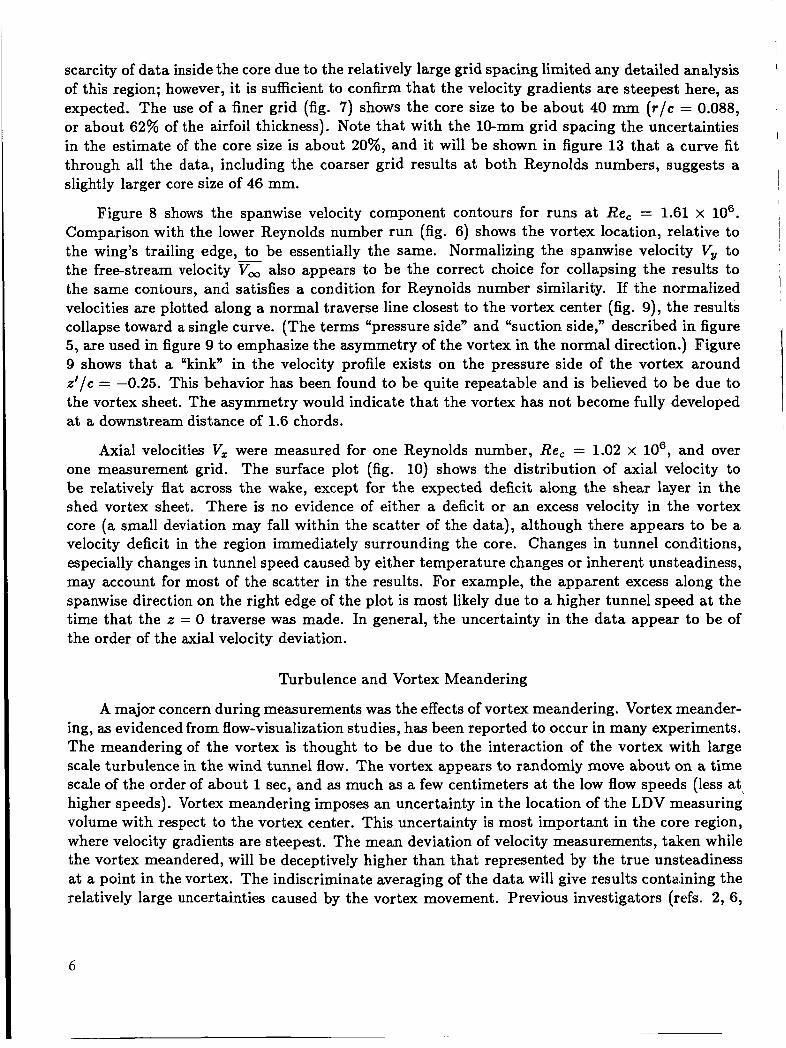
scarcity of data inside the core due to the relatively large grid spacing limited any detailed analysis of this region; however, it is sufficient to confirm that the velocity gradients are steepest here, as expected. The use of a finer grid (fig. 7) shows the core size to be about 40 mm ( r / c = 0.088, or about 62% of the airfoil thickness). Note that with the 10-mm grid spacing the uncertainties in the estimate of the core size is about 20%, and it will be shown in figure 13 that a curve fit through all the data, including the coarser grid results at both Reynolds numbers, suggests a slightly larger core size of 46 mm.
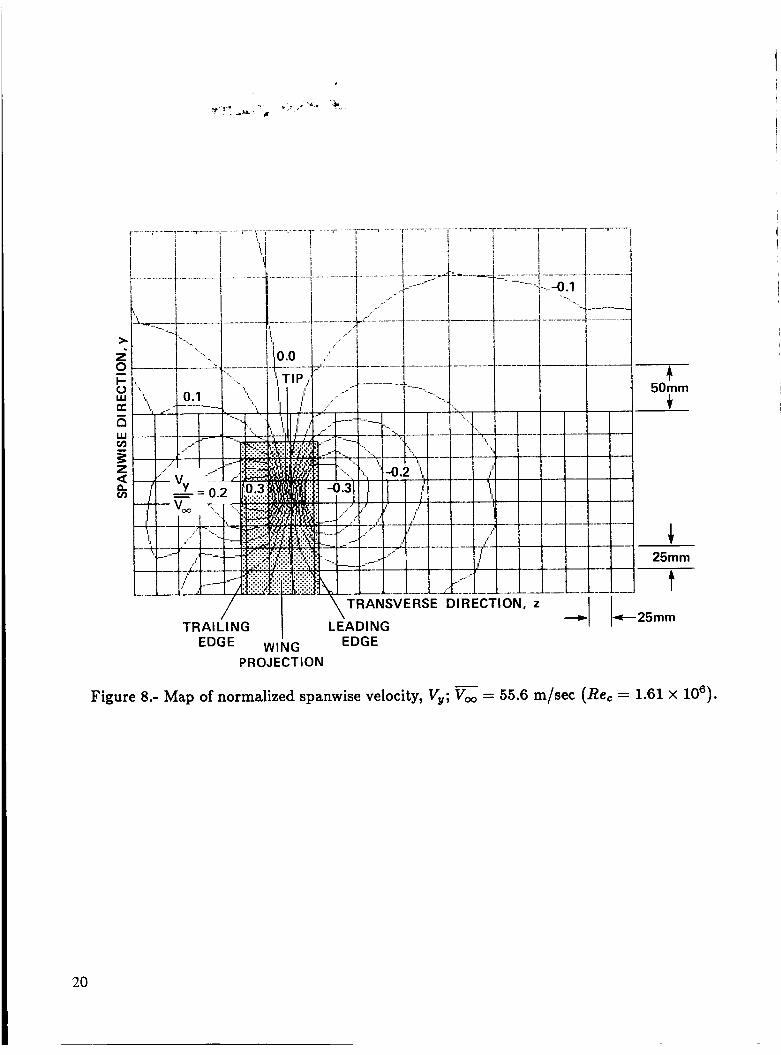
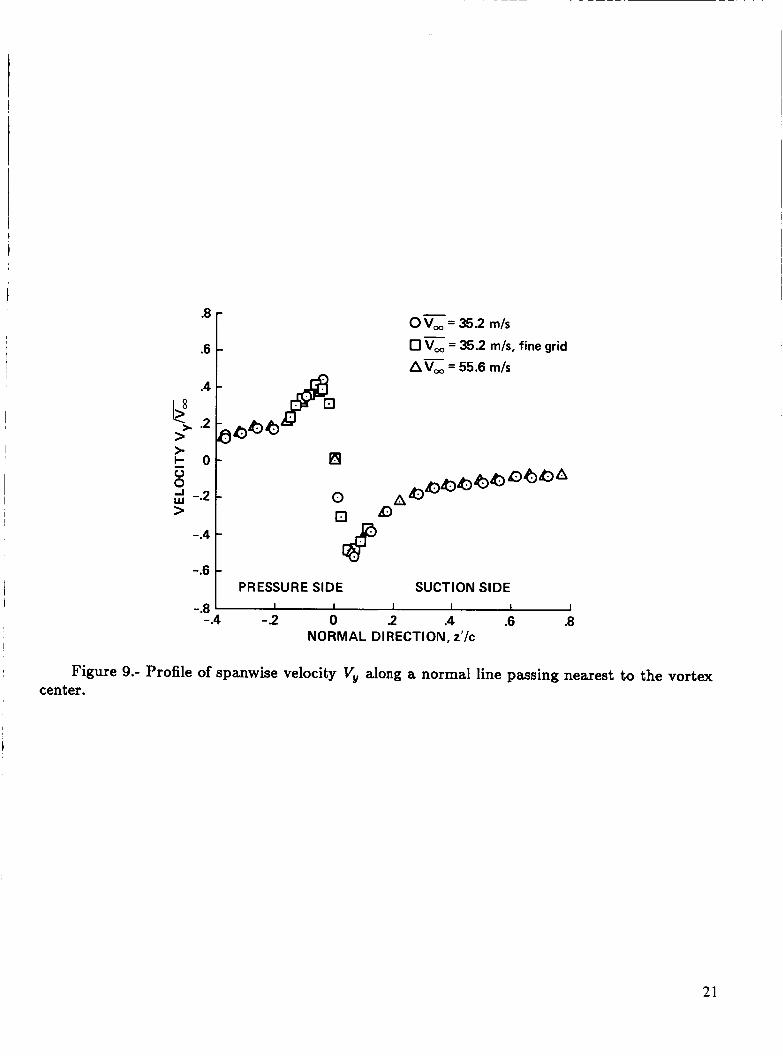
Figure 8 shows the spanwise velocity component contours for runs at Re, = 1.61 x lo6. Comparison with the lower Reynolds number run (fig. 6) shows the vortex location, relative to the wing’s trailing edge, to be essentially the same. Normalizing the spanwise velocity V, to the free-stream velocity also appears to be the correct choice for collapsing the results to the same contours, and satisfies a condition for Reynolds number similarity. If the normalized velocities are plotted along a normal traverse line closest to the vortex center (fig. 9), the results collapse toward a single curve. (The terms “pressure side” and “suction side,” described in figure 5 , are used in figure 9 to emphasize the asymmetry of the vortex in the normal direction.) Figure 9 shows that a “kink” in the velocity profile exists on the pressure side of the vortex around z’/c = -0.25. This behavior has been found to be quite repeatable and is believed to be due to the vortex sheet. The asymmetry would indicate that the vortex has not become fully developed at a downstream distance of 1.6 chords.
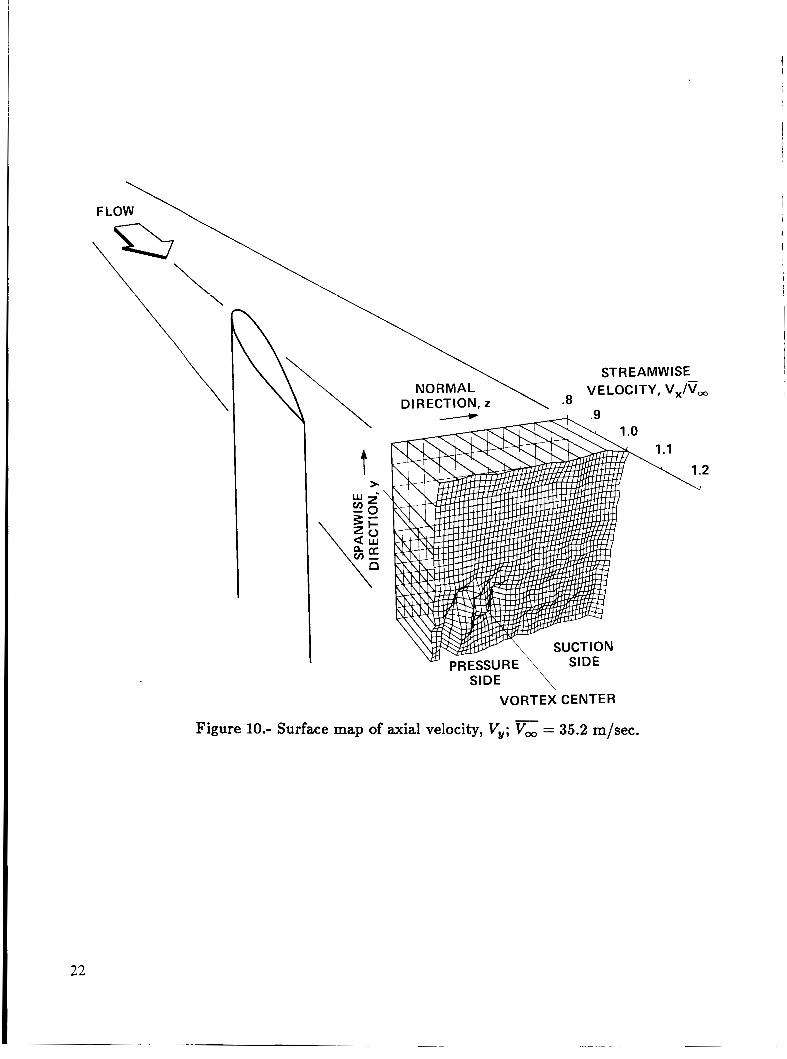
Axial velocities V, were measured for one Reynolds number, Re, = 1.02 x lo6, and over one measurement grid. The surface plot (fig. 10) shows the distribution of axial velocity to be relatively flat across the wake, except for the expected deficit along the shear layer in the shed vortex sheet. There is no evidence of either a deficit or an excess velocity in the vortex core (a small deviation may fall within the scatter of the data), although there appears to be a velocity deficit in the region immediately surrounding the core. Changes in tunnel conditions, especially changes in tunnel speed caused by either temperature changes or inherent unsteadiness, may account for most of the scatter in the results. For example, the apparent excess along the spanwise direction on the right edge of the plot is most likely due to a higher tunnel speed at the time that the z = 0 traverse was made. In general, the uncertainty in the data appear to be of the order of the axial velocity deviation.
Turbulence and Vortex Meandering
A major concern during measurements was the effects of vortex meandering. Vortex meander- ing, as evidenced from flow-visualization studies, has been reported to occur in many experiments. The meandering of the vortex is thought to be due to the interaction of the vortex with large scale turbulence in the wind tunnel flow. The vortex appears to randomly move about on a time scale of the order of about 1 sec, and as much as a few centimeters at the low flow speeds (less at, higher speeds). Vortex meandering imposes an uncertainty in the location of the LDV measuring volume with respect to the vortex center. This uncertainty is most important in the core region, where velocity gradients are steepest. The mean deviation of velocity measurements, taken while the vortex meandered, will be deceptively higher than that represented by the true unsteadiness at a point in the vortex. The indiscriminate averaging of the data will give results contahing the relatively large uncertainties caused by the vortex movement. Previous investigators (refs. 2, 6,
6
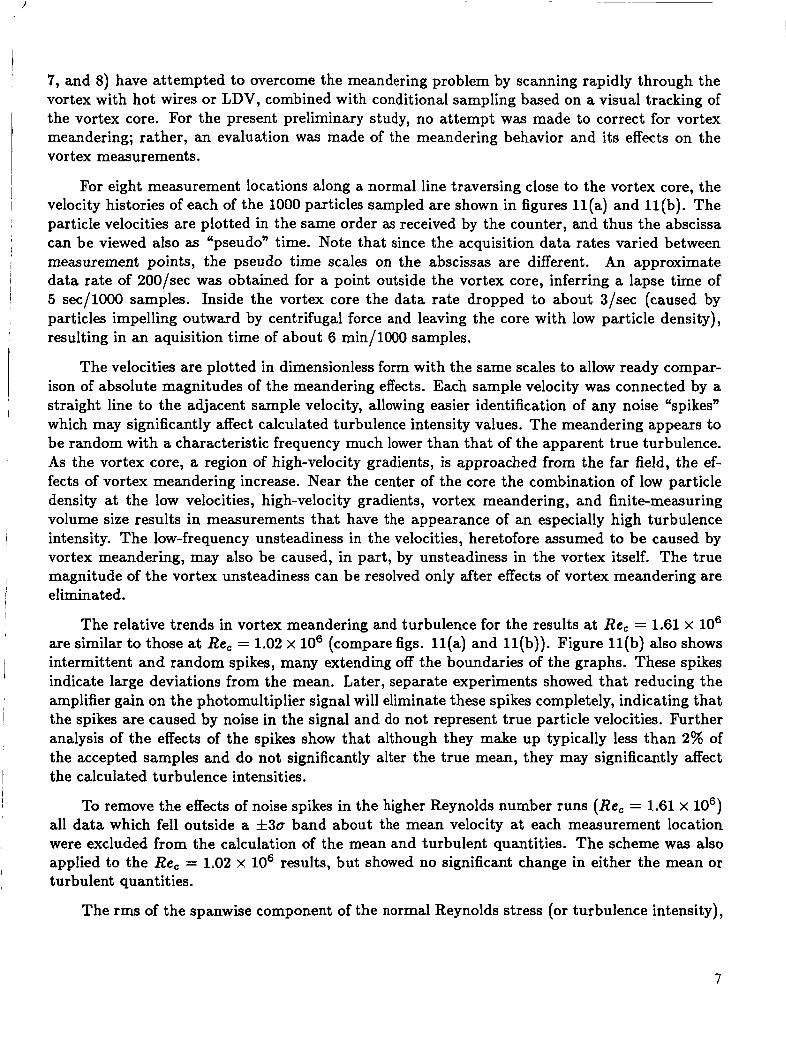
7, and 8) have attempted to overcome the meandering problem by scanning rapidly through the vortex with hot wires or LDV, combined with conditional sampling based on a visual tracking of the vortex core. For the present preliminary study, no attempt was made to correct for vortex meandering; rather, an evaluation was made of the meandering behavior and its effects on the vortex measurements.
I
I
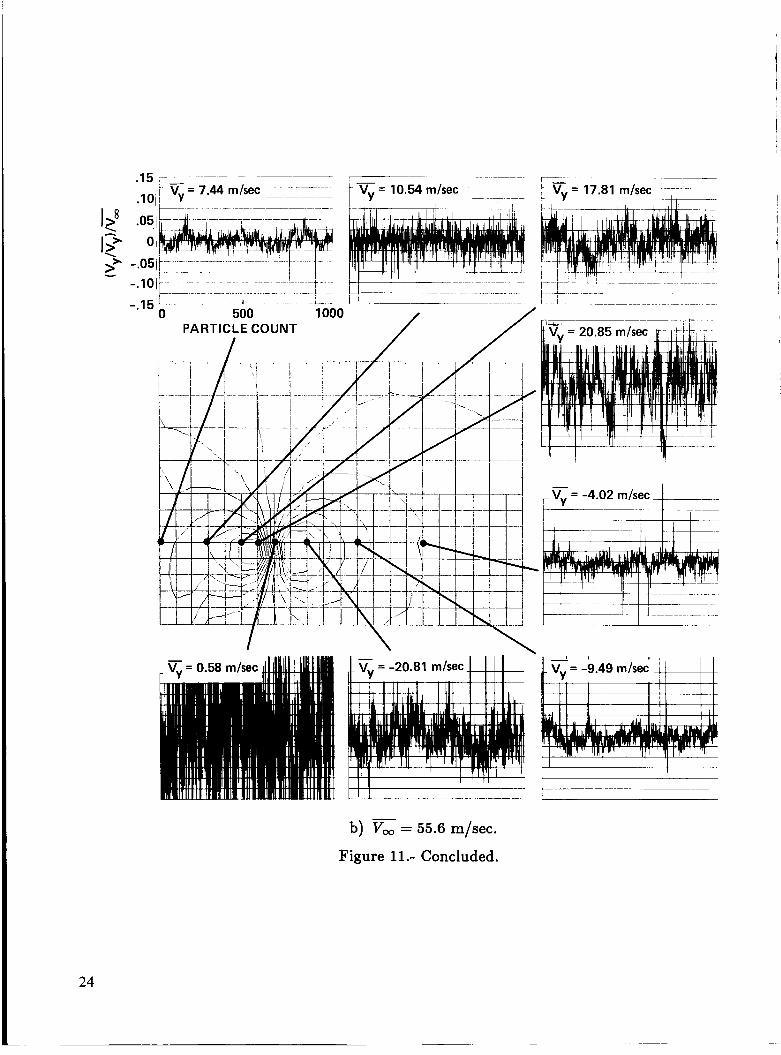
For eight measurement locations along a normal line traversing close to the vortex core, the velocity histories of each of the 1000 particles sampled are shown in figures l l (a ) and l l(b). The particle velocities are plotted in the same order as received by the counter, and thus the abscissa can be viewed also as “pseudo” time. Note that since the acquisition data rates varied between measurement points, the pseudo time scales on the abscissas are different. An approximate data rate of 2OO/sec was obtained for a point outside the vortex core, inferring a lapse time of 5 sec/1000 samples. Inside the vortex core the data rate dropped to about 3/sec (caused by particles impelling outward by centrifugal force and leaving the core with low particle density), resulting in an aquisition time of about 6 min/1000 samples.
The velocities are plotted in dimensionless form with the same scales to allow ready compar- ison of absolute magnitudes of the meandering effects. Each sample velocity was connected by a straight line to the adjacent sample velocity, allowing easier identification of any noise “spikes” which may significantly affect calculated turbulence intensity values. The meandering appears to be random with a characteristic frequency much lower than that of the apparent true turbulence. As the vortex core, a region of high-velocity gradients, is approached from the far field, the ef- fects of vortex meandering increase. Near the center of the core the combination of low particle density at the low velocities, high-velocity gradients, vortex meandering, and finite-measuring volume size results in measurements that have the appearance of an especially high turbulence intensity. The low-frequency unsteadiness in the velocities, heretofore assumed to be caused by vortex meandering, may also be caused, in part, by unsteadiness in the vortex itself. The true magnitude of the vortex unsteadiness can be resolved only after effects of vortex meandering are eliminated.
The relative trends in vortex meandering and turbulence for the results at Re, = 1.61 x lo6 are similar to those at Re, = 1.02 x lo6 (compare figs. l l (a ) and l l(b)). Figure l l (b) also shows intermittent and random spikes, many extending off the boundaries of the graphs. These spikes indicate large deviations from the mean. Later, separate experiments showed that reducing the amplifier gain on the photomultiplier signal will eliminate these spikes completely, indicating that the spikes are caused by noise in the signal and do not represent true particle velocities. Further analysis of the effects of the spikes show that although they make up typically less than 2% of the accepted samples and do not significantly alter the true mean, they may significantly affect the calculated turbulence intensities.
To remove the effects of noise spikes in the higher Reynolds number runs (Re, = 1.61 x lo6) all data which fell outside a f 3 o band about the mean velocity at each measurement location were excluded from the calculation of the mean and turbulent quantities. The scheme was also applied to the Re, = 1-02 x lo6 results, but showed no significant change in either the mean or turbulent quantities.
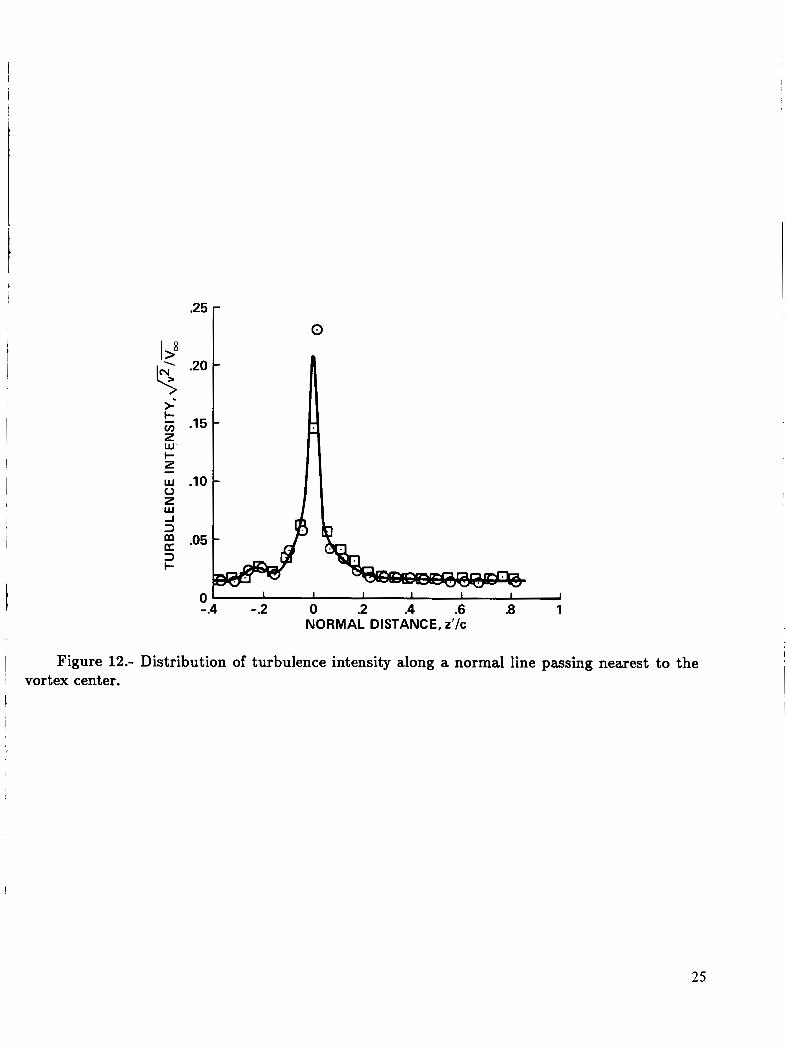
The rms of the spanwise component of the normal Reynolds stress (or turbulence intensity),
7
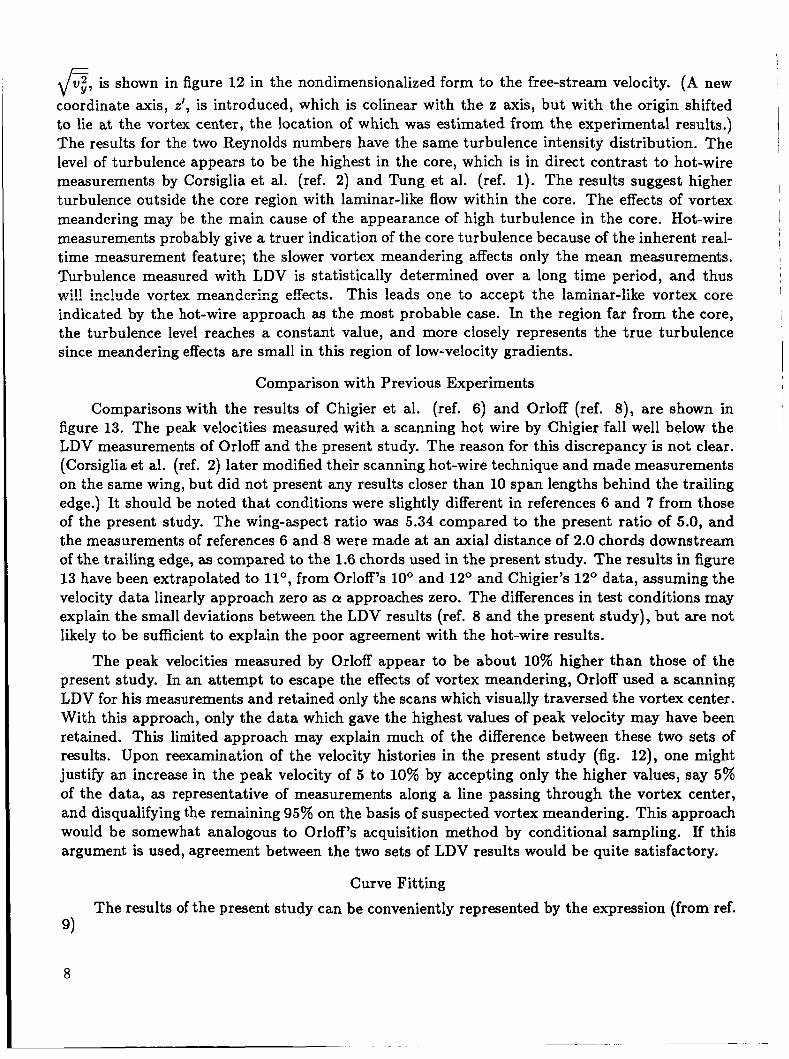
fi, is shown in figure 12 in the nondimensionalized form to the free-stream velocity. (A new coordinate axis, z’, is introduced, which is colinear with the z axis, but with the origin shifted to lie at the vortex center, the location of which was estimated from the experimental results.) The results for the two Reynolds numbers have the same turbulence intensity distribution. The level of turbulence appears to be the highest in the core, which is in direct contrast to hot-wire measurements by Corsiglia et al. (ref. 2) and Tung et al. (ref. 1). The results suggest higher turbulence outside the core region with laminar-like flow within the core. The effects of vortex meandering may be the main cause of the appearance of high turbulence in the core. Hot-wire measurements probably give a truer indication of the core turbulence because of the inherent real- time measurement feature; the slower vortex meandering affects only the mean measurements. Turbulence measured with LDV is statistically determined over a long time period, and thus wi!! inc!ude vcrtex meandering effects. This leads one to accept the laminar-like vortex core indicated by the hot-wire approach as the most probable case. In the region far from the core, the turbulence level reaches a constant value, and more closely represents the true turbulence since meandering effects are small in this region of low-velocity gradients.
Comparison with Previous Experiments
Comparisons with the results of Chigier et al. (ref. 6 ) and Orloff (ref. 8 ) , are shown in figure 13. The peak velocities measured with a scanning hot wire by Chigier fall well below the LDV measurements of Orloff and the present study. The reason for this discrepancy is not clear. (Corsiglia et al. (ref. 2) later modified their scanning hot-wire technique and made measurements on the same wing, but did not present any results closer than 10 span lengths behind the trailing edge.) It should be noted that conditions were slightly different in references 6 and 7 from those of the present study. The wing-aspect ratio was 5.34 compared to the present ratio of 5.0, and the measurements of references 6 and 8 were made at an axial distance of 2.0 chords downstream of the trailing edge, as compared to the 1.6 chords used in the present study. The results in figure 13 have been extrapolated to 1l0, from Orloff’s loo and 1 2 O and Chigier’s 1 2 O data, assuming the velocity data linearly approach zero as cy: approaches zero. The differences in test conditions may explain the small deviations between the LDV results (ref. 8 and the present study), but are not likely to be sufficient to explain the poor agreement with the hot-wire results.
The peak velocities measured by Orloff appear to be about 10% higher than those of the present study. In an attempt to escape the effects of vortex meandering, Orloff used a scanning LDV for his measurements and retained only the scans which visually traversed the vortex center. With this approach, only the data which gave the highest values of peak velocity may have been retained. This limited approach may explain much of the difference between these two sets of results. Upon reexamination of the velocity histories in the present study (fig. 12), one might justify an increase in the peak velocity of 5 to 10% by accepting only the higher values, say 5% of the data, as representative of measurements along a line passing through the vortex center, and disqualifying the remaining 95% on the basis of suspected vortex meandering. This approach would be somewhat analogous to Orloff’s acquisition method by conditional sampling. If this argument is used, agreement between the two sets of LDV results would be quite satisfactory.
Curve Fitting The results of the present study can be conveniently represented by the expression (from ref.
9)
8
i
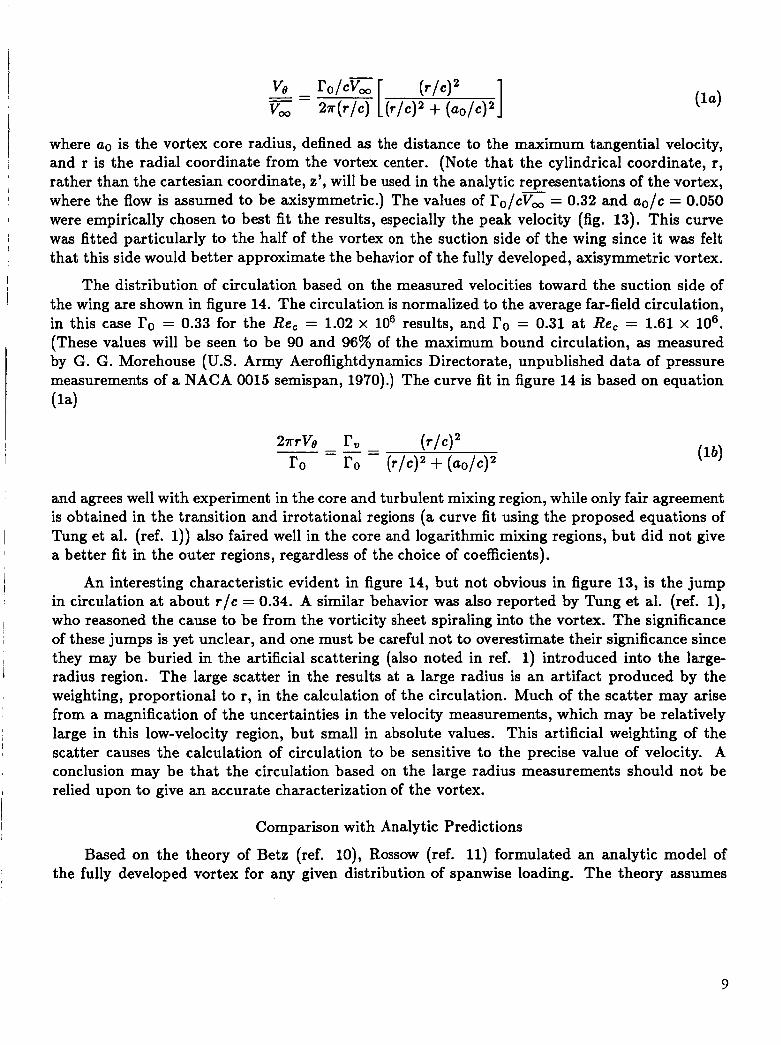
1 -- - Ve - r o / c G [ v, 2r(r/c) + (ao/C)2
(r/cl2
where a. is the vortex core radius, defined as the distance to the
( 1 4
maximum tangential velocity, and r is the radial coordinate from the vortex center. (Note that the cylindrical coordinate, r, rather than the Cartesian coordinate, z', will be used in the analytic representations of the vortex, where the flow is assumed to be axisymmetric.) The values of r o / c G = 0.32 and ao/c = 0.050 were empirically chosen to best fit the results, especially the peak velocity (fig. 13). Th' is curve was fitted particularly to the half of the vortex on the suction side of the wing since it was felt that this side would better approximate the behavior of the fully developed, axisymmetric vortex.
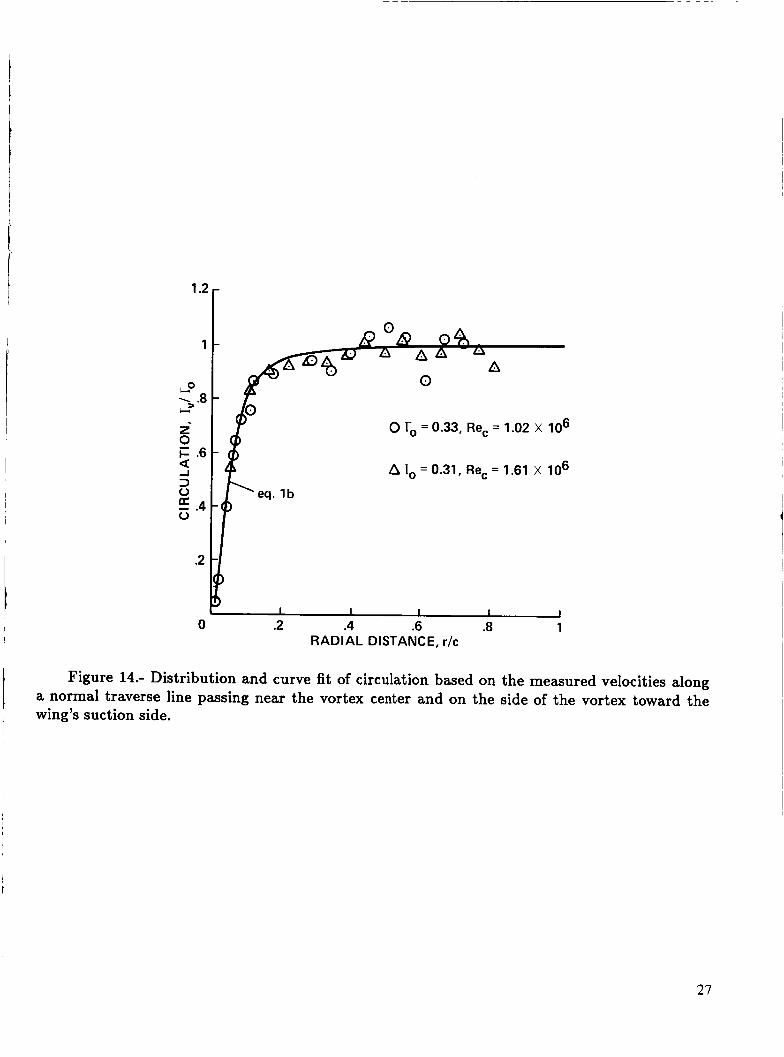
The distribution of circulation based on the measured velocities toward the suction side of the wing are shown in figure 14. The circulation is normalized to the average far-field circulation, in this case I'o = 0.33 for the Re, = 1.02 x lo6 results, and ro = 0.31 at Re, = 1.61 x lo6. (These values will be seen to be 90 and 96% of the maximum bound circulation, as measured by G. G. Morehouse (U.S. Army Aeroflightdynamics Directorate, unpublished data of pressure measurements of a NACA 0015 semispan, 1970).) The curve fit in figure 14 is based on equation ( 1 4
and agrees well with experiment in the core and turbulent mixing region, while only fair agreement is obtained in the transition and irrotational regions (a curve fit using the proposed equations of Tung et al. (ref. 1)) also faired well in the core and logarithmic mixing regions, but did not give a better fit in the outer regions, regardless of the choice of coefficients).
An interesting characteristic evident in figure 14, but not obvious in figure 13, is the jump in circulation at about t /c = 0.34. A similar behavior was also reported by Tung et al. (ref. l), who reasoned the cause to be from the vorticity sheet spiraling into the vortex. The significance of these jumps is yet unclear, and one must be careful not to overestimate their significance since they may be buried in the artificial scattering (also noted in ref. 1) introduced into the large- radius region. The large scatter in the results at a large radius is an artifact produced by the weighting, proportional to r, in the calculation of the circulation. Much of the scatter may arise from a magnification of the uncertainties in the velocity measurements, which may be relatively large in this low-velocity region, but small in absolute values. This artificial weighting of the scatter causes the calculation of circulation to be sensitive to the precise value of velocity. A conclusion may be that the circulation based on the large radius measurements should not be relied upon to give an accurate characterization of the vortex.
Comparison with Analytic Predictions
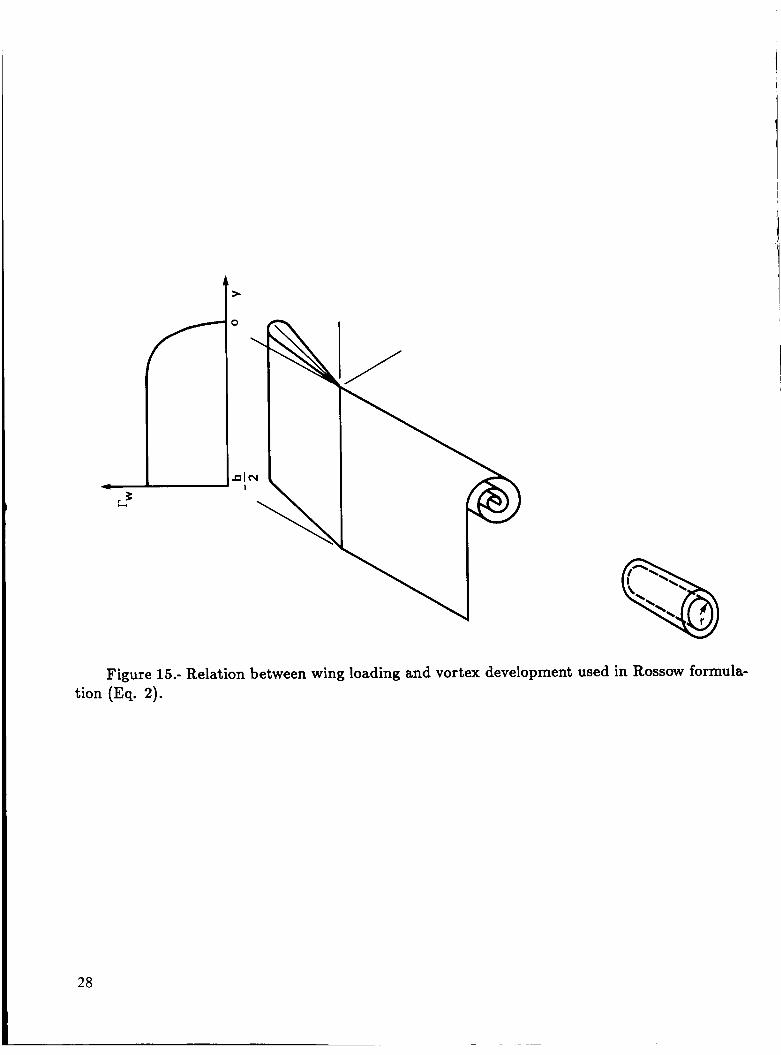
Based on the theory of Betz (ref. lo), Rossow (ref. 11) formulated an analytic model of the fully developed vortex for any given distribution of spanwise loading. The theory assumes
9
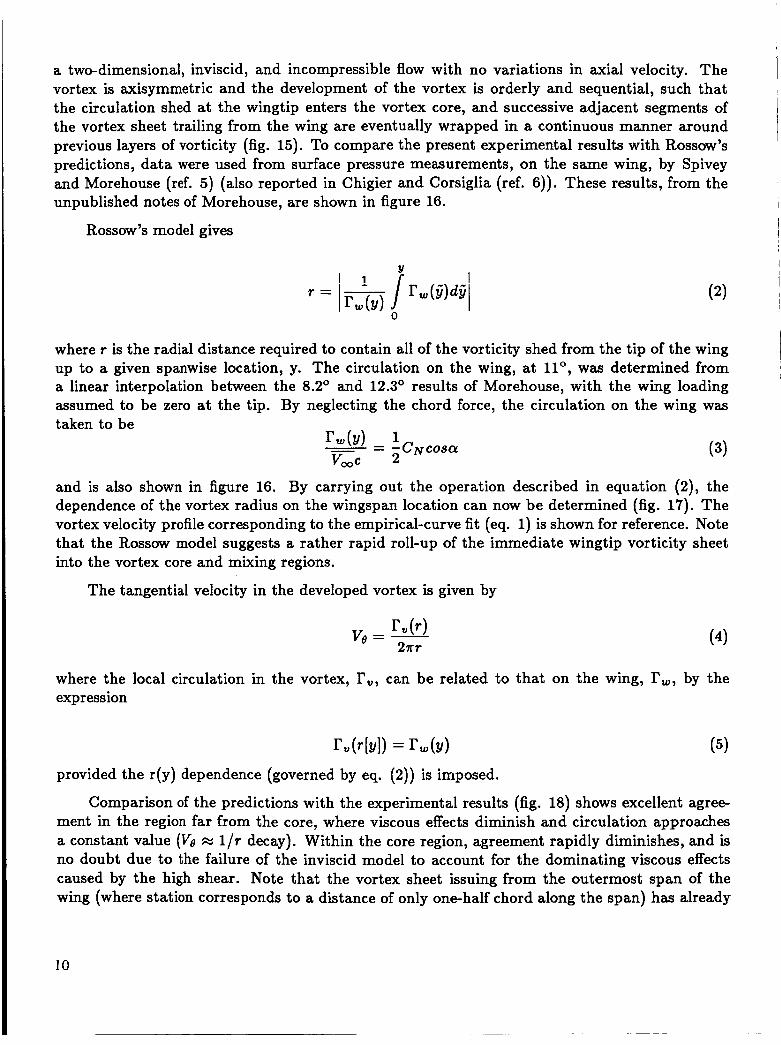
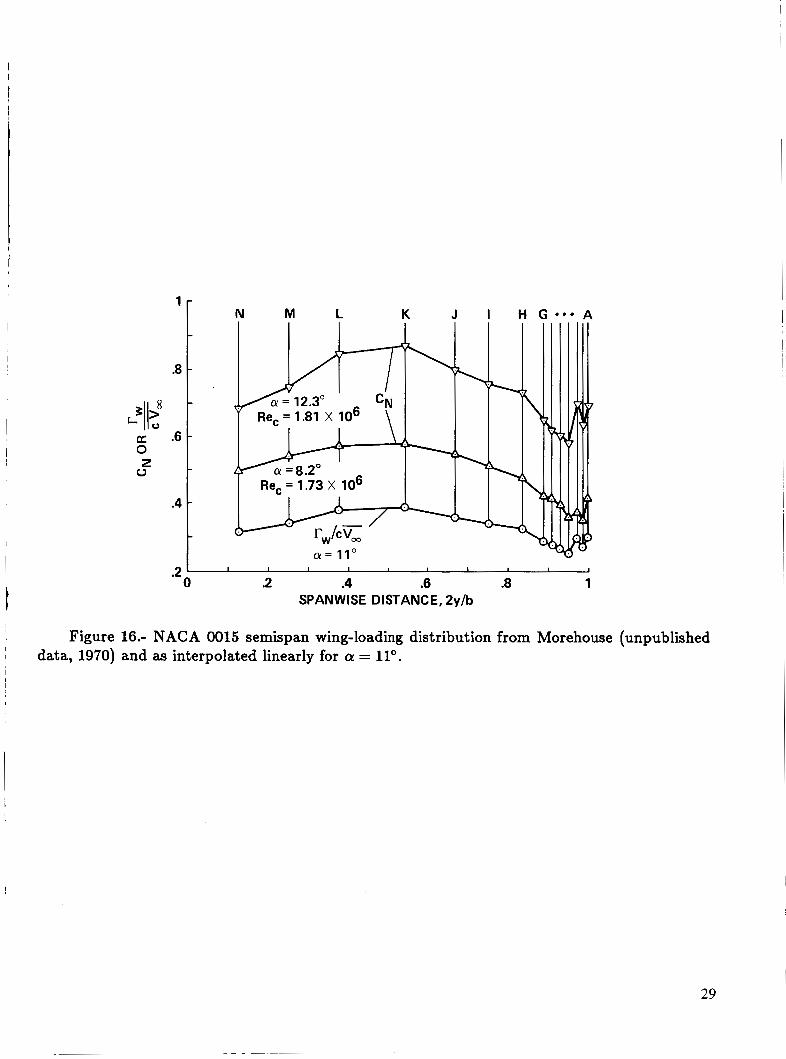
a two-dimensional, inviscid, and incompressible flow with no variations in axial velocity. The vortex is axisymmetric and the development of the vortex is orderly and sequential, such that the circulation shed at the wingtip enters the vortex core, and successive adjacent segments of the vortex sheet trailing from the wing are eventually wrapped in a continuous manner around previous layers of vorticity (fig. 15). To compare the present experimental results with ROSSOW’S predictions, data were used from surface pressure measurements, on the same wing, by Spivey and Morehouse (ref. 5 ) (also reported in Chigier and Corsiglia (ref. 6)). These results, from the unpublished notes of Morehouse, are shown in figure 16.
ROSSOW’S model gives
where r is the radial distance required to contain all of the vorticity shed from the tip of the wing up to a given spanwise location, y. The circulation on the wing, at 1l0, was determined from a linear interpolation between the 8.2O and 12.3O results of Morehouse, with the wing loading assumed to be zero at the tip. By neglecting the chord force, the circulation on the wing was taken to be
(3) 1 -- rAy) - -cNcosar
v,c 2
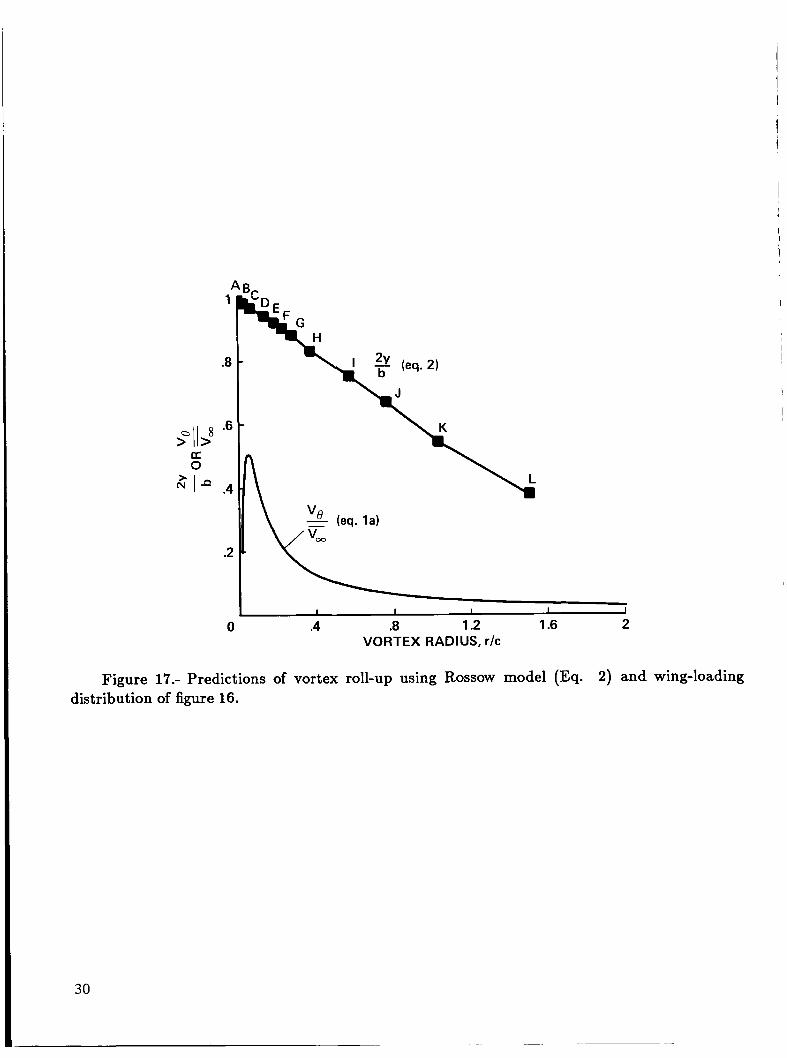
and is also shown in figure 16. By carrying out the operation described in equation (2), the dependence of the vortex radius on the wingspan location can now be determined (fig. 17). The vortex velocity profile corresponding to the empirical-curve fit (eq. 1) is shown for reference. Note that the Rossow model suggests a rather rapid roll-up of the immediate wingtip vorticity sheet into the vortex core and mixing regions.
The tangential velocity in the developed vortex is given by
where the local circulation in the vortex, rv, can be related to that on the wing, Fur, by the expression
ru(r [Y I ) = r w ( Y ) ( 5 )
provided the r(y) dependence (governed by eq. (2)) is imposed.
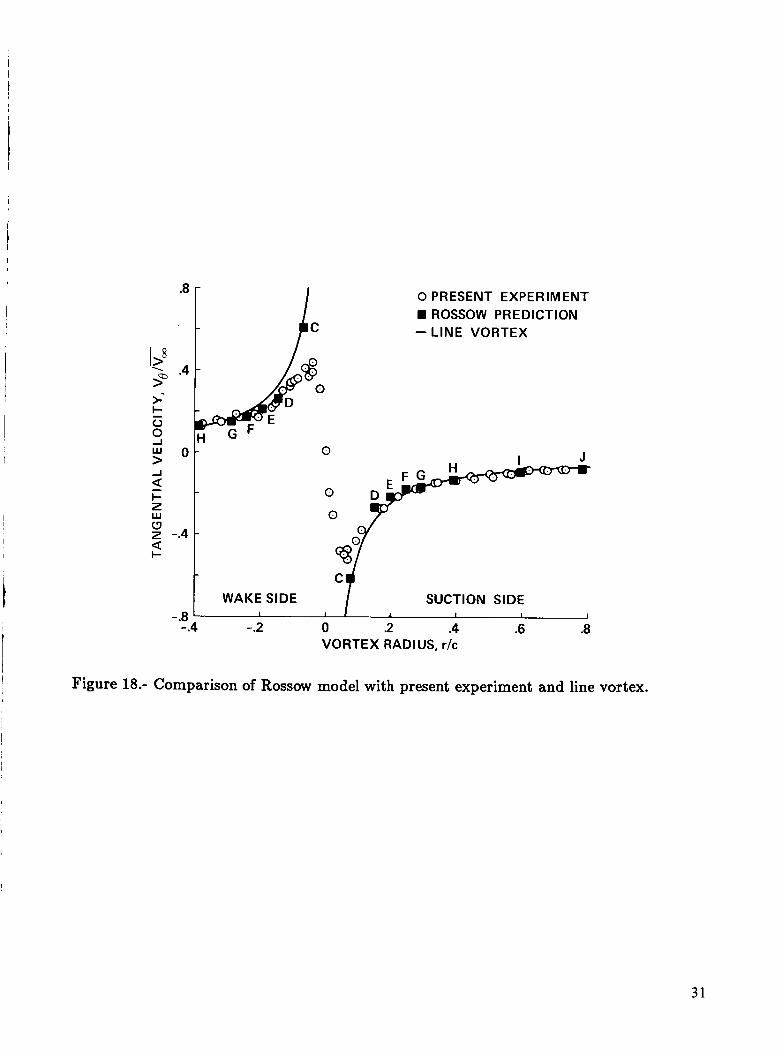
Comparison of the predictions with the experimental results (fig. 18) shows excellent agree- ment in the region far from the core, where viscous effects diminish and circulation approaches a constant value (Ve = 1/r decay). Within the core region, agreement rapidly diminishes, and is no doubt due to the failure of the inviscid model to account for the dominating viscous effects caused by the high shear. Note that the vortex sheet issuing from the outermost span of the wing (where station corresponds to a distance of only one-half chord along the span) has already
10
rolled up inside the l / r decay region to compose a majority of the vortex structure. This effect indicates that the inner regions of the vortex depends strongly on the wingtip conditions.
CONCLUSIONS
Laser Doppler velocimetry measurements have been successfully made of the tip vortex, induced by the flow over a semispan wing in the U.S. Army Aeroflightdynamics Directorate 7- by 10-Foot Wind Tunnel. The results demonstrate that a backscatter LDV can be operated at a distance of 2200 mm using a traversing focusing lens. Velocity measurements were found to agree reasonably well with those of previous studies.
Vortex meandering was found to be a significant problem which must be circumvented through conditional sampling to reduce the introduction of artificial turbulence into the mea- surements.
The analytic inviscid predictions of Rossow agree well with the experiments outside the vortex core, but do not accurately model the viscous core region. The model, as applied to the experimental conditions, indicates a strong dependence of the core region on the immediate wingtip region.
11
REFERENCES
1. Tung, C.; Pucci, S. L.; Caradonna, F. X.; and Morse, H. A.: The Structure of Trailing Vortices Generated by Model Rotor Blades. Vertica, vol. 7, no. 1, 1983, pp. 33-43.
2. Corsiglia, V. R.; Schwind, R. G.; and Chigier, N. A.: Rapid Scanning, Three-Dimensional Hot-wire Anemometer Surveys of Wing-Tip Vortices. J. Aircraft, vol. 10, no. 12, De. 1973, pp. 752-757.
3. Ciffone, D. L.; and Orloff, K. L.: Far-Field Wake-Vortex Characteristics of Wings. J. Aircraft, vol. 12, no. 5, May 1975, pp. 464-470.
4. Iversen? J. D.: Correlation of Turbulent Trailing Vortex Decay Data. J. Aircraft, vol. 13, no. 5, May 1976, pp. 338-342.
5. Morehouse, G. G.; and Spivey, W. A.: New Insights into the Design of Swept-Tip Rotor Blades. AHS Paper 420, June 1970.
6. Chigier, N. A.; and Corsiglia, V. R.: Tip Vortices-Velocity Distributions. NASA TM X- 62087, 1971.
7. Orloff, K. L.; and Grant, G. R.: The Application of Laser-Doppler Velocimetry to Trailing Vortex Definition and Alleviation. NASA TM X-62243, 1973.
8. Orloff, K. L.: Trailing Vortex Wind-Tunnel Diagnostics with a Laser Velocimeter. J. Aircraft, vol. 11, no. 8, Aug. 1974, pp. 477-482.
9. Scully, M. P.: Computation of Helicopter Rotor Wake Geometry and Its Influence on Rotor Harmonic Airloads. ASRL TR-178-1, Ph.D. thesis, M.I.T. (Aeronautical Engineering), vol. X1975, 1975.
10. Betz, A.: Behavior of Vortex Systems. NACA TM 713, 1933.
11. ROSSOW, V. J.: On the Inviscid Rolled-up Structure of Lift-Generated Vortices. NASA TM X-62224, 1973.
12

TRANSITION
DEVELOPMENT PLATEAU 4 w*
I RROTATION AL REG ION
1
DECAY ** >
0
a)
10 VORTEX RADIUS, r / r l
20
Figure 1.- Cross-sectional and longitudinal characterization of a wing-tip vortex. a) Regions of the tip vortex as described by Tung et al. (ref. 1). b) Regions of the aging tip vortex.
13
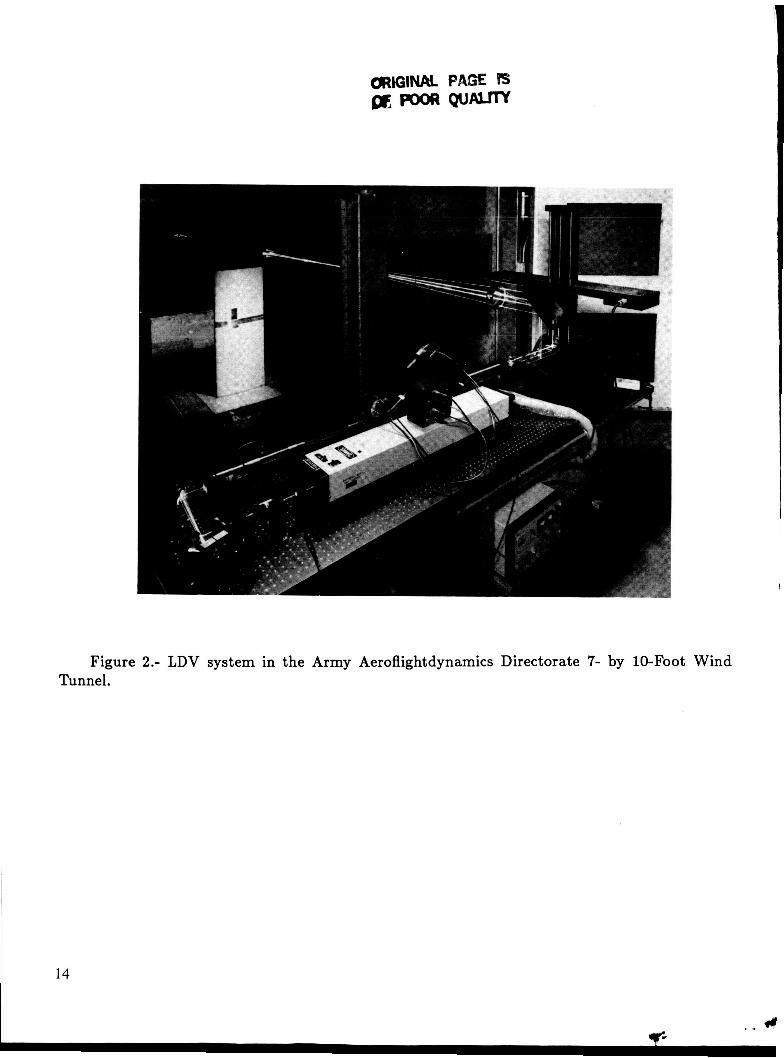
Figure 2.- LDV system in the Army Aeroflightdynamics Directorate 7- by 10-Foot Wind Tunnel.
14
I
13 12 10 9 8 7 5 4 6 5 4
COLLIMATOR 9 POLARIZER AND POLARIZATION ROTATOR COLOR SEPARATOR 10 POLARIZATION ROTATOR 11 BEAM SPLITTER (50 mm) 12 BEAM DISPLACER 13 BRAGG CELL 14 STEERING WEDGES 15
PHOTO-MULTIPLIER FOCUSING LENS AND MIRROR SCATTERED-LIGHT COLOR SEPARATOR PHOTO MULTIPLIER TUBE BEAM SPACERS (35 mm) BEAM EXPANDER (3.75X) TRAVERSE MECHANISM FOCUSING LENS (2286 mm)
Figure 3.- LDV optical path.
15
WGINRL P A M S 100-MHz STORAGE
COMPUTER, DISPLAY, SPECTRUM oscl LLOSCOPE (Jf m Quam
DISC DRIVE, PRINTER ANALYZER /
ALARM CONTROL\
PHOTOMU LTl PLl ER POWER SUPPLIES
TH RE E-AXES, FINALLENS \ TRAVERSE
TRAVERSE MANUAL CONTROLLER '
CONVENTIONAL /OSCILLOSCOPE
CONDITIONAL -SAMPLING
WINDOW ,SHUTTER/ I
INTER LOCK CONTROL
DOWNSH I FTER/
POWER SUPPLY SIGNAL
(COUNTERS)
I
- FREQUENCY-
B R AGG-C E L L
' P ROC ESSO RS
\COLOR SEPARATION
LASER \4-W ARGON-ION
-- V BEAM
/ FINAL
FOCUS1 NG MANAGEMENT LENS OPTICS
Figure 4.- LDV data-aquisition system.
16

FLOW
\
/
\
Y
Figure 5.- A typical measurement grid located 1.6 chords downstream of the wing trailing edge.
17

41 $.
50mm
$- 25mm
\ NORMAL DIRECTION, z LEADING -1 1-25mm
TRAILING I EDGE EDGE WING
PROJECTION
-- Figure 6.- Contours of constant spanwise velocity, Vy/V,; V, = 35.2 m/sec (Re, = 1.02 x
lo6). The shaded region represents the projection of the wing onto the measurement grid, viewing upstream.
18
1

TR ,DING I G E
NORMAL DIRECTION, z
WING PROJECTION
1 1 Omm
Figure 7.- Fine-grid map of normalized spanwise velocity component; E = 35.2 m/sec (Re, = 1.02 x lo6).
19
/ TRAILING I L EAD I N G
EDGE I EDGE WING
PROJECTION
4 t
50mm
1c
t 25mm
I I )IRECTION, z
Figure 8.- Map of normalized spanwise velocity, V,; = 55.6 m/sec (Re, = 1.61 x 10').
20
.6 *8 F
-.6
OK= 35.2 m/s
0 A C = 55.6 mls
= 35.2 m/s, fine grid
- PRESSURE SIDE SUCTION SIDE
1 I I I I 1
-*4 t
Figure 9.- Profile of spanwise velocity Vv along a normal line passing nearest to the vortex center.
21
I
\ \
\ -\
\ >
t
\
STREAM W I SE NORMAL .8 VELOCITY, V,/v,
DIRECTION, z
SIDE \ VORTEX CENTER
Figure 10.- Surface map of axial velocity, V,; = 35.2 m/sec.
1.2 \
22

/ I
IC= 15.6 m/sec 1 .
a) = 35.2 m/sec
Figure 11.- Spanwise velocity histories showing magnitudes of turbulence and vortex me- andering. The abscissa represents a pseudo time with a time scale which depends on the data rate.
23
-.I5 L- ~ - -~ I-. I ' -- 0 500 I000
PARTICLE COUNT /
b) E = 55.6 m/sec.
Figure 11.- Concluded.
1
24
>- $ .15 2 W ' I- 2 - w .10 0 z w 4 3 K 3 I-
.05
O ' 1 I I I 1 I I -.4 -.2 0 .2 .4 .6 .8 1
NORMAL DISTANCE, z'/c
Figure 12.- Distribution of turbulence intensity along a normal line passing nearest to the I 1 vortex center.
25
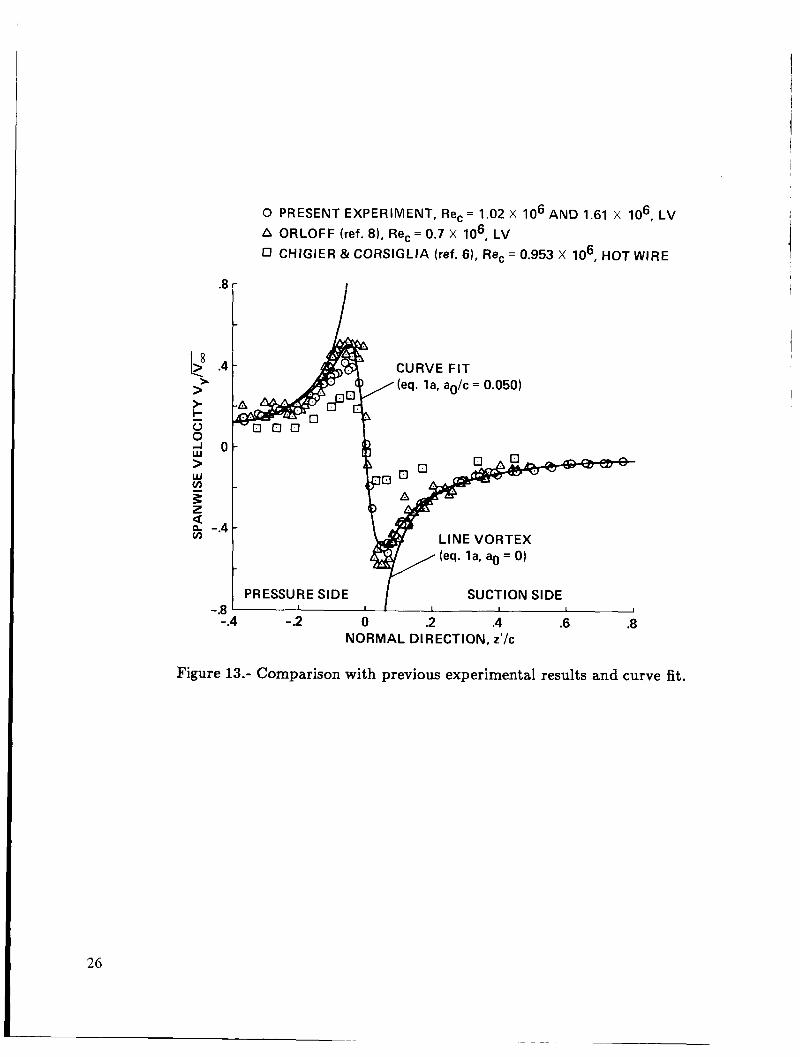
0 PRESENT EXPERIMENT, Re, = 1.02 X lo6 AND 1.61 X lo6, LV A ORLOFF (ref. 81, Re, = 0.7 X lo6, LV 0 CHlGlER & CORSlGLlA (ref. 61, Re, = 0.953 X lo6, HOT WIRE
CURVE F IT
LINE VORTEX
PRESSURE SIDE SUCTION SIDE -.8 I 1 I 1 I I I
-.4 - .2 0 .2 .4 .6 .8 NORMAL DIRECTION, z'/c
Figure 13.- Comparison with previous experimental results and curve fit.
l t
Figure 14.- Distribution and curve fit of circulation based on the measured velocities along a normal traverse line passing near the vortex center and on the side of the vortex toward the
1
\ .8 k>
z- 0 F .6 a J 3 0 K - .4 0
o ro = 0.33, Rec = 1.02 x 10⁶
A To = 0.31, Re, = 1.61 x IO6
.2
0 .2 .4 .6 .8 1 1 RADIAL DISTANCE, r/c
27
I- /
Figure 15.- Relation between wing loading and vortex development used in Rossow formula- tion (Eq. 2).
28
N M L K J I H G
a = 11" .2 I I 1 I 1 1 I I I
0 .2 .4 .6 .8 1 SPANWISE DISTANCE, 2y/b
Figure 16.- NACA 0015 semispan wing-loading distribution from Morehouse (unpublished data, 1970) and as interpolated linearly for cr = 11'.
29
0 .4 .8 1.2 1.6 2 VORTEX RADIUS, r/c
Figure 17.- Predictions of vortex roll-up using Rossow model (Eq. 2) and wing-loading distribution of figure 16.
30
.8
I>* ' .4 >"
a - !- z W W
I-
z -.4 a
- .8
-
- WAKE SIDE SUCTION SIDE
1
0 PRESENT EXPERIMENT H ROSSOW PREDICTION - L I N E VORTEX
Figure 18.- Comparison of Rossow model with present experiment and line vortex.
31
NASA TM-88343 AVSCOM TM 86-A-2 5 Report Date
PRELIMINARY STUDY OF A WING-TIP VORTEX USING LASER VELOCIMETRY
1 Report No
4 Title and Subtitle
Research Center, Moffctt Field, CA 94035-1099
National Aeronautics and Space 2 Sponsoring Agency Name and Address
Administration, Washington, DC 20546, aiid US Army Aviation Systeiiis Comtnand, St . Louis, MO 63 120
13 Type of Report and Period Covered
Te cli ii i c ;i 1 Me ni o ra lid t I 11 1
14 Army Project No.
992-2 1-0 1
A-86 207 R. K. Takahashi and K. W . McAlister 10. Work Unit No.
7. Key Words (Suggested by Author(s))
Tip vortex Laser velocinietry
9. Performing Organization Name and Address
1JS Army Aviation Itescarcli and Technology Activity, Atnes Aerofligli tti yiia t i1 ics Dircctora tc,
1 1 Cnntract or Grant No
18. Distribution Statement
Unclassified - Unlimited
Subject Category 02 9. Security Classif. (of this report1
Unclassified
McAlister, h i e s Rcsearch Centcr, MS 21 5-1, Moffett Field, CA 94035 (41 5)694-5892 o r AV 3 5 9-5 892
6 Abstract
20. Security Classif. (of this paw) 21. NO. o f pages 22. Price'
Unclassified 34 A03
Measiirenients have been made in the wake of a senii-span NACA 0015 airfoil with empliasis on the region of the wing tip vortex. The spanwise and streamwise velocity com- ponents were measured using a two-component laser Doppler velocinictcr. The purpose of tlie study was t o initiate tlie operation o f a laser velociiiieter systetn ant1 to perforiii preliminary wake tiieasiireiiieiits i n preparation for a tilore extensive sttidy of tlie structure and near field dcvelopment of a tip vortex.
'For sale by the National Technical Information Service, Springfield, Virginia 221 61
NASA-Langley, 1987