preliminary calibration report of an ......preliminary calibration report of an apparatus to measure...
TRANSCRIPT

PRELIMINARY CALIBRATION REPORT OF AN APPARATUS
TO MEASURE VIBRATION CHARACTERISTICS OF LOW
FREQUENCY DISTURBANCE SOURCE DEVICES
James W. Russell', Robert A. Marshall*, Tom D. FinleyA and George F. LawrenceA
*Lockheed Engineering & Sciences Company, Hampton, Virginia WASA Langley Research Center, Hampton, Virginia
ABSTRACT
This report presents a description of the test apparatus and the method of testing the low
frequency distuhance source characferistics of small pumps, fans, camera motors, and recorders that
are typical of those used in microgravity science facilities. The test apparatus will allow both force and
acceleration specfra of these distuhance devices to be obtained from acceleration measurements over
the frequency range from 2 to 300 Hz. Some preliminary calibration results are presented.
INTRODUCTION
The microgravity science facilities being developed employ devices which generate low
frequency disturbances that could effect the science activities. Furthermore, the disturbance levels
generated by these devices may exceed the payload vibroacoustic allocation as specified in Space
Station Control Board Directive BB003262A to the Space Station Systems Requirements Document,
SSP30000. Although it is thought that the vibroacoustic levels of these disturbance sources are low, the
actual values need to be ascertained. Current analysis methods for determining the values of these
devices are predicated on considerably larger, heavier equipment and may not be applicable to such
devices as small camera motors, small water pumps, computer fan motors, data recorders, etc.
Microgravity science experiments like fluid mixing and combustion flameballs are very sensitive to low
frequency disturbances. Currently, there is very little data on the low frequency characteristics Of Small
disturbance source devices such as those used in microgravity science facilities.
The NASA Langley Experiment Utilization Branch (EUB) has undertaken a task to measure the amount of disturbance of various source noise devices at low frequency. By measuring both the
acceleration spectra and the forcing function for a particular device, the power spectra can be defined.
Similarly, for each device, the impedance spectra can be calculated at any location for the particular
Joint '%+I " Science Review for USMLl and USMP-1 with the Microgmoity Measurement Group, September 22-24, 1993, Huntsville, Alabama, USA. 921
https://ntrs.nasa.gov/search.jsp?R=20030075801 2020-04-17T22:07:35+00:00Z

I
mounting system. The power spectra and impedance spectra can then be used to define both the force
and acceleration at the specified location.
The purpose of this report is to show the test apparatus design and present the methodology for
obtaining both forcing function and acceleration characteristics of the various disturbance source
devices. The calibration methods for obtaining forcing functions from accelerometer measurements on
three orthogonal axes are discussed. Preliminary calibration data are presented of force to acceleration
ratios for the test apparatus on the Y and 2 axes over the frequency range from 2 Hz to 300 Hz.
1. TEST APPARATUS DESIGN
To measure the acceleration spectra of a disturbance source device, a triaxial accelerometer
package is hard mounted to the device. To measure the force spectra of the disturbance source device,
it was initially planned to mount force transducers between the device and a hard surface. However, the
preload source of several pounds on the transducer could significantly affect the dynamic
measurements. Also each device would require a separate mounting system.
Therefore it was decided to employ a soft spring system with a large plate mass of high
impedance which would vibrate as the dynamic force was applied. With a soft spring and a heavy plate,
most of the force goes into the plate vibration, because the spring force is low relative to the plate
vibration force. The force can then be determined from the acceleration spectra of the mass if the mass
has a high impedance.
Figure 1 shows the test apparatus and the associated electronics equipment. The test
apparatus consists of a 66 pound, 20 inch diameter aluminum plate supported by three zinc rods with
turnbuckles, which in turn are suspended from a soft stainless steel spring which has a spring constant
of 5 pounds per inch. The triaxial accelerometer package is mounted underneath the plate. The spring in
turn is suspended from a 7 foot long 3/16 inch twisted steel cable which is mounted to an eyehook from
the ceiling. The eyehook is welded to two steel bars which are mounted between the concrete
crossbeams of the ceiling. Also shown is a 10 inch diameter, 7/8 inch thick steel plate, which is mounted
to the test apparatus. The steel plate has a weight of 25.4 pounds. This allows the force to acceleration
ratio calibration of the test apparatus to be performed at two different masses. The test apparatus is
oriented such that the X and Y axes are parallel to the surface of the plate and the Z axis is
perpendicular to the plate surface. The center of the three axes planes are at the center of gravity of the
aluminum plate. Figure 2 shows the aluminum plate with a peristaltic pump mounted so that it is aligned
with the X axis. The acceleration measurements will provide both acceleration and force characteristics
of the pump on all three axes.
922

The test apparatus is designed to measure acceleration responses to force inputs over the
frequency range from 2 to 300 Hz in the XI Y, and Z directions. For the suspended aluminum plate
shown in Figure 1, the natural frequency in the X and Y directions is only dependent on the length of
swing and is defined by:
fx = (g/L)’~2/(2n)
For our system where the suspended length is approximately 8.6 feet, the natural frequency on
the X and Y axes is 0.307 Hz. In the vertical or 2 direction, the natural frequency is dependent on the
mass of the test apparatus, m, and the spring constant, Ks, in pounds per foot. Part of the force in the Z
direction, F,, goes into the deflection of the spring, and part goes into the vibration of the mass. The
equation for the spring assuming that there is negligible damping is as follows:
F, = -47?mf2xz(f) + Ksxz(f)
The natural frequency on the Z axis, f,, is that frequency associated with the mass and the spring
constant when the force, F,, is zero, and is defined by:
f, = (Ks/m)1/2/(2~)
For the test apparatus shown in Figure 1, the weight, W, is 93.4 pounds with the steel plate and
68.0 pounds without the steel plate. The spring constant, Ks, is 5 pounds per inch or 60 pounds per foot.
The natural frequency corresponding to these two calibration masses is 0.724 Hz and 0.848 Hz respectively.
II. CALIBRATION SETUP
Figure 3 shows a sinusoidal shaker and a force transducer hard mounted to the top of the
aluminum plate and an accelerometer package hard mounted to the bottom of the aluminum plate. The
shaker and force transducer are used to obtain the forcing function of force to acceleration ratio for both
Of the test apparatus masses on all three axes. Figure 3 shows the shaker mounted on the Z axis for
calibration without the steel plate. The calibration is also performed on all three axes with the steel plate
attached to provide a means of interpolation for determining the forces associated with the mass Of the
disturbance Source device attached to the aluminum plate. Figure 3 also shows pieces Of Styrofoam
mounted in the eyehook plate supports. The purpose of the Styrofoam is to reduce or eliminate chatter in
923

the support rod mountings and make sure that the whole mounting system vibrates and not just the
support plate.
For the X and Y axes, the shaker was aligned so that it was level and the force transducer was
aligned between the shaker and the plate as shown in Figure 4. The steel mounting rod used to support
the shaker was installed such that it was supported by a stand and butted against a 7 ton block, so that it
would not move and cause forces other than the drive motor force to be input into the plate in the X or Y
direction.
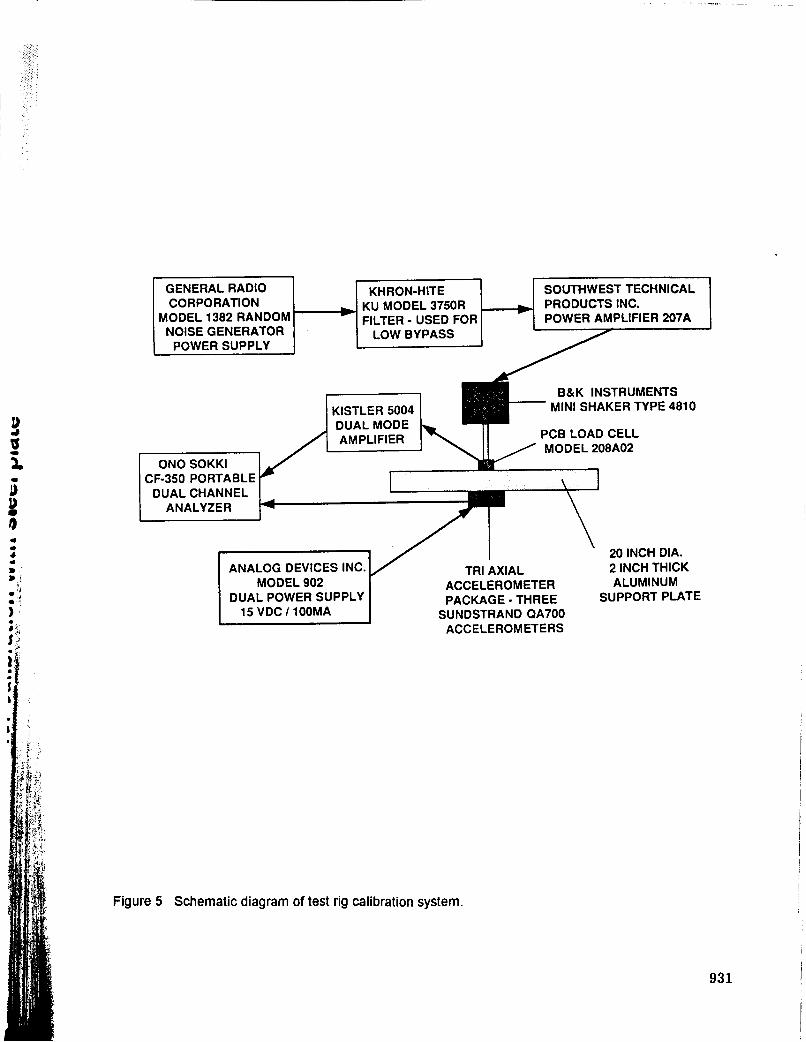
The electronics setup shown in Figure 1 consists of a General Radio Random-Noise Generator
which creates random broadband white noise over the frequency range from 10 Hz to 50 KHz to drive
the B&K Minishaker Type 410. The white noise output signal was passed through a Khron-Hite Model
3750R low bypass filter which provided for a 24 db per octave falloff in energy at frequencies above the
selected bypass frequency. The signal was then passed through a Southwest Technical Products Power
Amplifier 207A into the shaker. At low frequencies a Hewlett Packard 33258 Synthesizer/Function
Analyzer was used in place of the random noise generator and low bypass filter. The synthesizer was
used to generate signals from 2 to 10 Hz in 1 Hz increments. The shaker output was threaded to a PCB
model 208A02 force transducer that in turn was threaded to the large support plate. The threaded
connections insured that all the force transmitted to the plate from the shaker would be measured by the
force transducer. The force transducer output was passed through a Kistler 5004 Dual Mode Amplifier,
which amplifies the signal into an Ono Sokki CF-350 Portable Dual Channel Analyzer. Figure 5 shows a
schematic of the force calibration system.
The triaxial orthogonal accelerometer package consists of three Sundstrand QA-700
accelerometers that have resolutions of g's (1 micro-g). The accelerometers are powered by an
Analog Devices Inc. Model 902 Dual Power Supply and the output signal goes directly into the Ono Sokki CF-350 Portable Dual Channel Analyzer. Figure 5 also shows the schematic of the accelerometer
measurement system.
111. SYSTEM CALIBRATION
The force transducer and each of the three accelerometers were calibrated in the laboratory over
the frequency range from 2 to 500 Hz. The force transducer was found to have a nominal value of 1000
millivolts per pound and the accelerometers were found to have a nominal value of 1 volt per g.
Associated with each calibration is a frequency variation from the nominal value. The transducer
calibration response was flat and varied from -2.9 to +0.5 percent over the frequency range from 2 to
300 Hz. Similarly the accelerometer calibration responses were also flat and varied from -0.0 to +5.0
percent over the same frequency range. The accelerometer calibrations are different for each
924
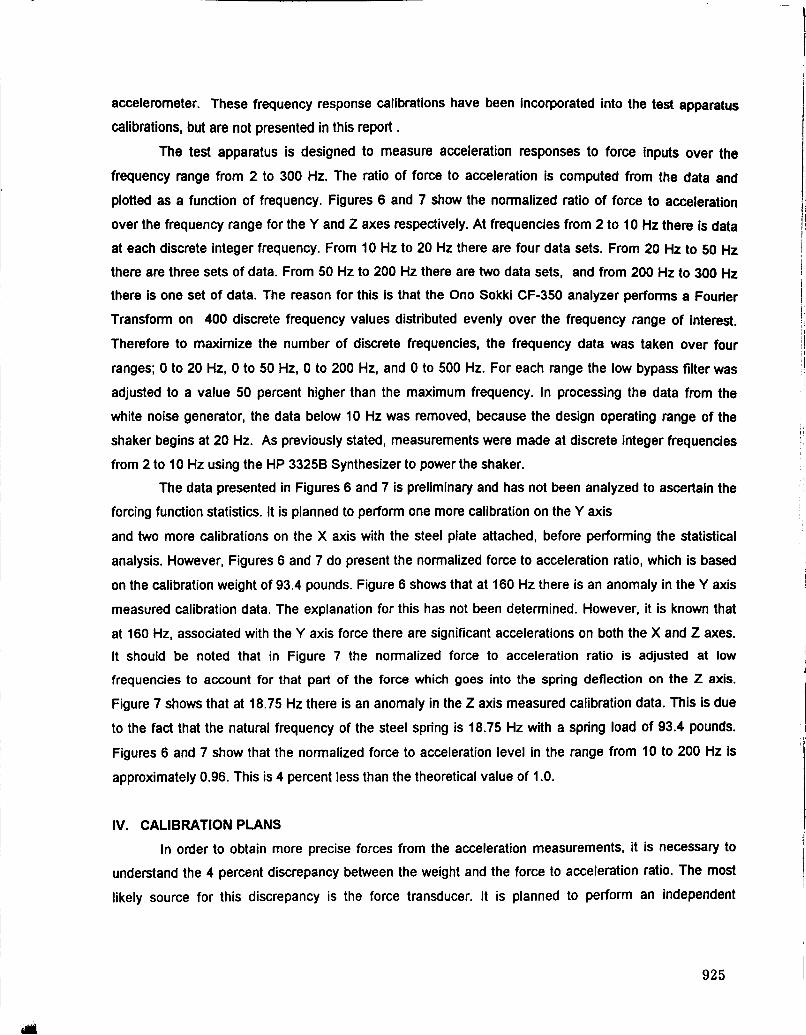
accelerometer. These frequency response calibrations have been incorporated into the test apparatus
calibrations, but are not presented in this report . The test apparatus is designed to measure acceleration responses to force inputs over the
frequency range from 2 to 300 Hz. The ratio of force to acceleration is computed from the data and
plotted as a function of frequency. Figures 6 and 7 show the normalized ratio of force to acceleration
over the frequency range for the Y and Z axes respectively. At frequencies from 2 to 10 Hz there is data
at each discrete integer frequency. From 10 Hz to 20 Hz there are four data sets. From 20 Hz to 50 HZ
there are three sets of data. From 50 Hz to 200 Hz there are two data sets, and from 200 Hz to 300 HZ
there is one set of data. The reason for this is that the Ono Sokki CF-350 analyzer performs a Fouher
Transform on 400 discrete frequency values distributed evenly over the frequency range of interest.
Therefore to maximize the number of discrete frequencies, the frequency data was taken over four
ranges; 0 to 20 Hz, 0 to 50 Hz, 0 to 200 Hz, and 0 to 500 Hz. For each range the low bypass filter was
adjusted to a value 50 percent higher than the maximum frequency. In processing the data from the
white noise generator, the data below 10 Hz was removed, because the design operating range of the
shaker begins at 20 Hz. As previously stated, measurements were made at discrete integer frequencies
from 2 to 10 Hz using the HP 33258 Synthesizer to power the shaker.
The data presented in Figures 6 and 7 is preliminary and has not been analyzed to ascertain the
forcing function statistics. It is planned to perform one more calibration on the Y axis
and two more calibrations on the X axis with the steel plate attached, before performing the statistical
analysis. However, Figures 6 and 7 do present the normalized force to acceleration ratio, which is based
on the calibration weight of 93.4 pounds. Figure 6 shows that at 160 Hz there is an anomaly in the Y axis
measured calibration data. The explanation for this has not been determined. However, it is known that
at 160 Hz, associated with the Y axis force there are significant accelerations on both the X and Z axes.
It should be noted that in Figure 7 the normalized force to acceleration ratio is adjusted at low
frequencies to account for that part of the force which goes into the spring deflection on the 2 axis.
Figure 7 shows that at 18.75 Hz there is an anomaly in the Z axis measured calibration data. This is due
to the fact that the natural frequency of the steel spring is 18.75 Hz with a spring load of 93.4 pounds.
Figures 6 and 7 show that the normalized force to acceleration level in the range from 10 to 200 Hz is
approximately 0.96. This is 4 percent less than the theoretical value of 1 .O.
IV. CALIBRATION PLANS
In order to obtain more precise forces from the acceleration measurements, it is necessary to
understand the 4 percent discrepancy between the weight and the force to acceleration ratio. The most
likely source for this discrepancy is the force transducer. It is planned to perform an independent
925

calibration of the force transducer, prior to continuing with the test apparatus calibrations. The transducer
calibration will involve attaching the force transducer and two different masses of about 0.5 pounds and
1.0 pound to the shaker, with an accelerometer attached to the masses. All the force from the shaker
should be transmitted through the force transducer to the mass and the accelerometer. By using two
different masses, the force transducer tare weight and force spectra can be calibrated over the frequency
range of interest. Once the force transducer is calibrated, the calibration of the test apparatus will
continue with the two system masses of 68.0 and 90.4 pounds as previously stated. After the force to
acceleration ratio calibrations are completed for both masses, the data can be applied to the acceleration
measurements of the test apparatus with the various disturbance source devices installed to obtain both
force and acceleration spectra. It is planned to test each source device three times, so that it is oriented
on each of the three axes.
926

92 7

928

929

1) la a
MODEL 902
15 VDC I 1OOMA DUAL POWER SUPPLY
. !!
I >[
20 INCH DIA. 2 INCH THICK ALUMINUM
SUPPORT PLATE
TRI AXIAL ACCELEROMETER
SUNDSTRAND QA700 PACKAGE - THREE
Figure 5 Schematic diagram of test rig calibration system.
931.

Y A X I S FORCE TO A C C E L E R A T I O N C A L I B R A T I O N F I R S T Y A X I S C A L I B R A T I O N - 8/18/93 0
01.3-
I- Q aL
0
H
z
I- < 1 . 1 -
H
CY w -1 W 0 1 . 0 - 0 Q
b 0 . 9 1 0
L L Os.?
W W CY
0.7.
- - - - - - - - - - - - - - - _ _ - _ I I I I I I I I I 0 I I I I I I I I l l 1 I I
1 . 2 ~ - ~ - ~ - ~ ~ n ~ - - ~ - ~ - ~ ~ - ~ ~ ~ ~ ~ - ~ - ~ - ~
I I I I I I I I I I I I I I I I -
- I I I I I I I I I I I , I I I I I I -1-1-11 u
- 4 I 1 1 1 1 -1 --I--'P--r
- I I I I I I - 1 - 1 - 1 1 u
- I I I I I I I
-
0 r
I I I Y I P
-I - 1 - 1 -r n -
I I I I I I I I
I FORCE TO1 bUClELERATIQN R A T I O S ~\JWMALI[EED 8 P YND WEIGHT O F T ST qPPA A US
- I I I I
Figure 6 Preliminary results of measured force to acceleration levels with steel plate - first y calibration.
932

< w Z 0
la2:
t- e 1 . 1 -
H
w w _I W 0 1 . 0 - C ) Q
h 0 . 9 1 0 W 0 CY 0 0 . 8 - LL
0 .7
Figure 7 Preliminary results of measured force to acceleration levels with steel plate - second Z axis Cali brat ion.
L
- I I I I I I I I O 1 I I I I I I l l 1 4 -1-1-17 nri - -,r - I - ~ I - I T I T I - - -r - J
I I I A I I I I I I I I I I I I I 1 3 - L - l - L l - l L l L l - - 1 - * I
-
- 1 - 1 - 1 1 u u
I I v 1 , 4 1 1 I - 1 - 1 -r n r
- I 0 I I I P t J - I - 1 1 u
- - I I I I I I I I ; 81 -
-
I I I I I I I I I I I I I I I I 4 I I I I I I I
- <L I I
- 7 - 1 I I I
- 1 - AN 7 POtJNq PER INCH SPRINY COYSTAPT
-I Fok2 forAL&LERAT%L RATIcL L<LMTkLT&G I SUI 93.88lFPaUND WEIGHT OFT T B S I APrPARATUS
0 1 0
933