preliminary audit analysis
TRANSCRIPT

City of Easthampton PRELIMINARY AUDIT ANALYSIS
Energy Performance Project
February 19, 2021

City of Easthampton SECTION A
Preliminary Audit Analysis
1
Table of Contents Table of Contents .......................................................................................................................... 1
Section A: Overview ..................................................................................................................... 2
IGA Contract Steps and Milestone Goals .................................................................................. 2
Summary of Preliminary Audit Analysis – Our Findings ........................................................ 3
Key Benefits to the City ......................................................................................................... 3
IGA Facilities ............................................................................................................................. 4
PAA Development Approach ..................................................................................................... 4
Conclusion ............................................................................................................................... 14
Recommendation .................................................................................................................... 15
Appendices ................................................................................................................................. 16
1. IGA Agreement – Facility List ........................................................................................... 16
2. Annual Energy and Water, Cost and Consumption, by Facility ....................................... 17
3. Benchmark Savings Analysis by Building ........................................................................ 24
4. Complete List of ECMs Considered ................................................................................. 31

City of Easthampton SECTION A
Preliminary Audit Analysis
2
Section A: Overview Honeywell is excited to partner with the City of Easthampton (City) as your Energy Services Company (ESCO) to develop a comprehensive energy savings and infrastructure renewal program through performance-based contracting. The Investment Grade Audit (IGA) agreement between the City and Honeywell outlines the scope of work, process steps and timeline required to complete and present the final IGA. This Preliminary Audit Analysis (PAA) was developed for the City according to the requirements of the Investment Grade Audit Services Agreement (Agreement) between the City and the Honeywell Energy Services Group (Honeywell). The IGA Agreement defines the deliverables of the PAA as follows: Complete list of all potential energy and water conservation opportunities;
Identify energy and water conservation measures that seem likely to be cost effective and therefore warrant detailed analysis;
For each energy and water conservation measure, prepare a preliminary estimate of energy or water cost savings by identifying the typical simple payback range.
The PAA is the first of three major deliverables required by the Agreement. The goal of the PAA is to provide a list of potential Energy Conservation Measures (ECMs), identify the most cost-effective ECMs for further analysis, and present a preliminary estimate of typical simple payback ranges for the ECMs. The ECM types are organized in Technical Categories related by technology or function, promoting a common reference by building and general definition. With this PAA in hand, the City and Honeywell will work together to agree on a subset of ECMs which will be the basis for the Draft Technical Energy Audit Report (DTEAR), the next major deliverable. Upon completion of the DTEAR, the City and Honeywell will review and select the final list of ECMs to be included in the final major deliverable, the Optimize IGA phase. At the completion of the Optimize IGA phase Honeywell will present a final IGA report to the City. The final IGA represents the optimized project, which is the basis for the Energy Management Services Agreement (EMSA) contract for the implementation of the final ECMs.
IGA Contract Steps and Milestone Goals Key steps and target milestone goals to achieve major deliverables as reviewed and discussed with the City include: Weekly joint progress meetings;
Monthly reporting to joint executive leadership teams;
Honeywell submits Preliminary Audit Analysis (PAA) – Feb 19, 2021;
Honeywell submits Draft Technical Energy Audit Report (DTEAR) – Mar 12, 2021;
City and Honeywell develop final IGA Scope of Work (SOW) – Mar 18, 2021;
Honeywell submits Optimized IGA – Mar 26, 2021; and
City and Honeywell execute EMSA contract – May 21, 2021.

City of Easthampton SECTION A
Preliminary Audit Analysis
3
Summary of Preliminary Audit Analysis – Our Findings
Honeywell has identified the potential to reduce annual energy and water costs by approximately 11.2% per year, or an estimated $50,420 in annual energy and water savings based on the list of facilities included in the IGA Agreement. Honeywell estimates that the energy and water savings, coupled with potential solar energy generation opportunities, projected utility rebates, and CARES funding contribution will support a 20-year self-funded performance-based contracting project of $4,611,022 to be used for upgrades to City facilities. Assumptions used in this estimate along with the general calculation are as follows:
Total Annual Energy & Water Savings $50,420
Total Annual Solar Generation Value1 $160,337
Total Utility Incentives2 $95,889
Total CARES Funding Contribution3 $300,000
Project Term 20 Years
Potential Performance-Based Contracting Project Size $4,611,022 1Generation value based on approximate unblended rate on a facility-by-facility basis (~ $0.12/kWh on average) 2Incentives are subject to change based on funding availability and will need in-depth analysis and review to finalize, estimate based on current custom program offerings provided by the utility ($0.325/kWh and $2.00/Therm) 3Approximate amount available based on initial discussions with the City
Potential Performance-Based Contracting Project Size = (Total Annual Energy & Water Savings + Total Annual Solar Generation Value) × Project Term + Total Utility Incentives + Total CARES Funding Contribution
Further, our experience reflects that the proposed ECMs will improve employee, student and visitor comfort, and increase the reliability of the mechanical and electrical systems within the IGA facilities. The upgrades will also augment the City’s existing programs by enhancing innovation, promoting community engagement and learning, and by providing technical and financial programs to reduce energy consumption (or use) and Greenhouse Gas (GHG) emissions ahead of Climate Action Plan goals. Key Benefits to the City
Provides $4,611,022 in capital infrastructure investment, without any upfront payments or additional capital cost;
Reduces municipal carbon emissions in IGA facilities by 268 Tons per year or 14.2% of the proposed baseline period emissions;
Takes advantage of 3rd party utility incentives and rebates, excluding the potential for grants and renewable or alternative energy credits;
Frees-up City capital for other critical priorities, avoiding or offsetting future capital cost requirements for equipment and infrastructure nearing the end of its useful life;
Supports a long-term cultural focus on energy efficiency by employees, students and visitors;
Improves mission reliability of critical City facilities such the Public Safety Complex, Water Department, and Wastewater Plant through the installation of new equipment and infrastructure;
Minimizes long-term exposure to volatile energy costs by reducing energy consumption;
Reduces energy use and greenhouse gas (GHG) emissions ahead of the City’s Climate Action Plan goals;
Enhances current Operations & Maintenance (O&M) programs and procedures; and
Offsets project costs with Honeywell’s first-party annual energy savings guarantee.

City of Easthampton SECTION A
Preliminary Audit Analysis
4
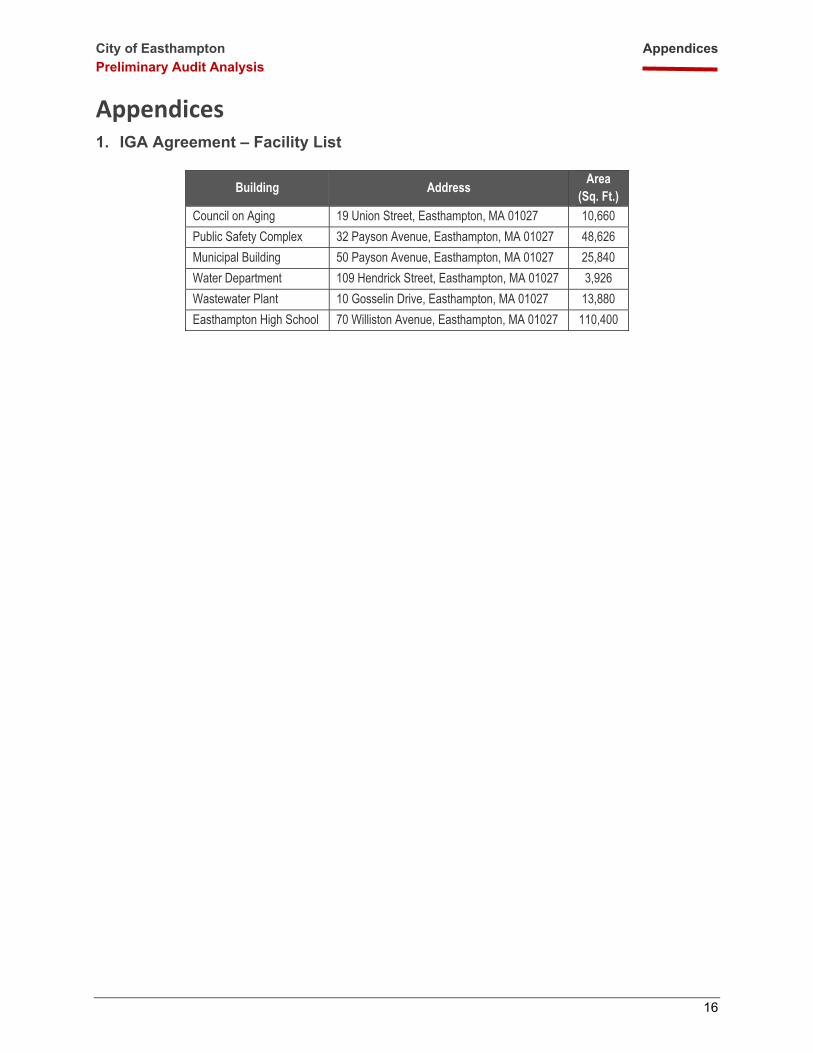
IGA Facilities As noted in Appendix 1, the IGA Agreement includes six (6) facilities totaling 213,332 square feet of building space. A summary of the facilities included is provided in the table below:
Building Address Area
(Sq. Ft.)
Council on Aging 19 Union Street, Easthampton, MA 01027 10,660
Public Safety Complex 32 Payson Avenue, Easthampton, MA 01027 48,626
Municipal Building 50 Payson Avenue, Easthampton, MA 01027 25,840
Water Department 109 Hendrick Street, Easthampton, MA 01027 3,926
Wastewater Plant 10 Gosselin Drive, Easthampton, MA 01027 13,880
Easthampton High School 70 Williston Avenue, Easthampton, MA 01027 110,400
PAA Development Approach
As noted, the intent of the PAA is to:
List all potential ECM opportunities;
Identify ECMs that seem likely to be cost effective and warrant a detailed analysis; and
Prepare a preliminary estimate of energy and water cost savings to include a simple payback range. PAA development included the following steps:
Identification of all potential ECM opportunities based on Honeywell’s experience and the findings of the preliminary surveys of the selected IGA facilities;
Review the past thirty-six (36) months of utility data for the IGA facilities to establish a baseline;
Perform a detailed benchmarking analysis to determine potential cost savings;
Identify simple payback ranges by ECM using the benchmarking analysis and Honeywell’s history of implementing these ECMs.
Identification of all potential ECM opportunities based on Honeywell’s experience and the findings of the preliminary surveys of select IGA facilities
Honeywell Solution Development Engineers (SDE) performed preliminary facility surveys at each of the selected locations. The surveys included interviews with City personnel that had specific knowledge of the facilities, energy systems, operations and maintenance practices. Based on observed field conditions and problem areas identified, a list of potential ECMs to be considered was developed for each facility. In the next report iteration, a detailed Existing Conditions Report (ECR) will be presented for each facility to fully describe the existing conditions of all major systems.
Preliminary Survey Facilities
Building Area
(Sq. Ft.) Utility Cost (Baseline)
Council on Aging 10,660 $10,494
Public Safety Complex 48,626 $76,045
Municipal Building 25,840 $58,811
Water Department 3,926 $71,366
Wastewater Plant 13,880 $87,819
Easthampton High School 110,400 $146,811
TOTAL 213,332 $451,347

City of Easthampton SECTION A
Preliminary Audit Analysis
5
Review of the most recent thirty-six (36) months of utility data for the IGA facilities to establish a baseline:
The IGA Agreement requires the ESCO to establish base year consumption for electricity, natural gas, fuel oil, and water by examining utility data over the past thirty-six (36) months. Honeywell performed a detailed analysis of the utility data provided by the City for Calendar Years (CY) 2017, 2018, 2019 for electric, natural gas and fuel oil, and 2018, 2019 and 2020 for water. This analysis is based on annual total energy and water use and cost by utility source for each facility included in the IGA Agreement. The data was extracted from utility summary data provided by the City for each account. Reasonable estimations were included where required to ensure a complete baseline dataset. During the DTEAR and Optimized IGA phases, a monthly utility bill analysis, including commodity, demand, and transportation charges will be performed for each included facility. For detailed information on annual energy, water, cost and consumption by facility please see Appendix 2. The following trends were noted when comparing the summary utility data provided for the six (6) included facilities during the period of CY2017 to CY2020: The consumption and costs for electric and natural gas have held relatively stable over the time period
included in this analysis;
o Electric consumption increased 9.9% between CY2017 and CY2018, and subsequently decreased 0.9% in CY2019;
o Natural gas consumption increased 6.2% between CY2017 and CY2018, and subsequently decreased 7.9% in CY2019;
The consumption and costs for fuel oil experienced more dramatic swings year over year however, the impact is relatively insignificant as this is by far the least cost intensive utility and can be influenced by storage capabilities;
o Fuel oil consumption decreased 72.2% between CY2017 and CY2018, and subsequently increased 221.9% in CY2019;
Water consumption is the most volatile utility with consumption decreasing sharply over the time period included in this analysis; o Water consumption decreased 56.2% between CY2018 and CY2019; o Water consumption for CY2020 was not included in the analysis as it appears to be heavily
impacted by occupancy changes due to COVID-19; o This large swing in water consumption will be evaluated further during the next phase of project
development Energy and water usage, and costs for this period are summarized in the tables and figures below.
Total Annual Energy Costs
Utility CY2017 CY2018 CY2019
Cost Cost Cost
Electricity $288,439 $313,822 $284,707
Natural Gas $45,151 $56,370 $70,113
#2 Fuel Oil $11,322 $3,691 $13,677
TOTALS $344,913 $373,883 $368,497

City of Easthampton SECTION A
Preliminary Audit Analysis
6
Total Annual Water Costs
Utility CY2018 CY2019 CY20202
Cost1 Cost1 Cost1
Water $123,664 $54,168 $25,718
TOTALS $123,664 $54,168 $25,718 1The City is not billed for water, assumes a water rate of $3.07/CCF and sewer rate of $4.96/CCF as projected for FY21 in the City of Easthampton Water, Sewer and Stormwater Rate Evaluation report 2This year is excluded due to changes in building occupancy

City of Easthampton SECTION A
Preliminary Audit Analysis
7
Total Annual Energy Consumption
Utility Billed Units
CY2017 CY2018 CY2019
Use MMBTU Use MMBTU Use MMBTU
Electricity kWh 1,569,539 5,357 1,724,186 5,885 1,708,877 5,832
Natural Gas Therm 69,804 6,980 74,139 7,414 68,261 6,826
#2 Fuel Oil Gal 7,203 998 2,005 278 6,453 894
TOTALS 13,335 13,576 13,552
Total Annual Water Consumption
Utility Units CY2018 CY2019 CY20201
Use Use Use
Water CCF 15,400 6,746 3,203
TOTALS 15,400 6,746 3,203 1This year is excluded due to changes in building occupancy

City of Easthampton SECTION A
Preliminary Audit Analysis
8
Total Annual Energy Consumption and Cost
Utility Units CY2017 CY2018 CY2019
Use Cost Use Cost Use Cost
Electricity kWh 1,569,539 $288,439 1,724,186 $313,822 1,708,877 $284,707
Natural Gas Therm 69,804 $45,151 74,139 $56,370 68,261 $70,113
#2 Fuel Oil Gal 7,203 $11,322 2,005 $3,691 6,453 $13,677
TOTALS $344,913 $373,883 $368,497
Total Annual Water Consumption and Cost
Utility Units CY2018 CY2019 CY20202
Use Cost1 Use Cost1 Use Cost1
Water CCF 15,400 $123,664 6,746 $54,168 3,203 $25,718
TOTALS $123,664 $54,168 $25,718 1The City is not billed for water, assumes a water rate of $3.07/CCF and sewer rate of $4.96/CCF as projected for FY21 in the City of Easthampton Water, Sewer and Stormwater Rate Evaluation report 2This year is excluded due to changes in building occupancy
The table below provides a summary of energy units, abbreviations, and conversions used throughout the PAA.
Energy Units, Abbreviations and Conversions Utility Type
Billing Units Equivalent
MMBTU Electricity Kilowatt-hour (kWh) 0.003413
Natural Gas Therm 0.1000
#2 Fuel Oil Gallon (Gal) 0.1385
Water Hundred Cubic Feet (CCF) NA
As shown above, energy and water consumption and cost vary year-to-year. This variation can be attributed to many factors including changes in occupancy, weather, usage, building area, mechanical, and electrical system. Baseline consumption, or base use, is used to identify the amount of energy and water a facility would use if the ECMs were not implemented. Baseline consumption and baseline energy rates are used to calculate the baseline costs for energy or water use. In general, energy and water cost savings associated with an ECM are calculated as follows:
Baseline Cost = Baseline Consumption × Baseline Energy or Water Rate
Post ECM Installation Cost = Post-Installation Consumption × Contract Energy or Water Rate
ECM Energy Savings = Baseline Cost – Post ECM Installation Energy Cost
As noted previously, the IGA Agreement requires that the ESCO establish baseline consumption by examining utility bills (electricity, gas, oil, steam, water, etc.) for the previous 36 months. Consistent with this requirement, Honeywell performed an analysis of the utility data provided by the City for CYs 2017 through 2020. Based on this analysis, Honeywell recommends that an average of the usage and cost for the three-calendar years (CY2017 – CY2019) for electric, natural gas, and fuel oil be used as the baseline to account for variations in energy consumption and costs. For water it is believed the last year of data provided was heavily impacted by COVID-19 related changes in building population, thus a two-calendar year average (CY2018-CY2019) of water cost and consumption is recommended. The total annual energy

City of Easthampton SECTION A
Preliminary Audit Analysis
9
and water use and recommended baseline use and rates for the IGA facilities along with the baseline energy cost and use by utility by building are detailed in the tables below.
Recommended Total Baseline Energy Use
Utility Billed Units CY2017 CY2018 CY2019 Baseline1
Electricity kWh 1,569,539 1,724,186 1,708,877 1,667,534
Natural Gas Therm 69,804 74,139 68,261 70,735
#2 Fuel Oil Gal 7,203 2,005 6,453 5,220 1Baseline energy use has been calculated as the average consumption on a facility by facility basis for CY2017-CY2019
Recommended Total Baseline Water Use
Utility Billed Units CY2018 CY2019 CY2020 Baseline1
Water CCF 15,400 6,746 3,203 11,073 1Baseline water use has been calculated as the average consumption on a facility by facility basis for CY2018-CY2019
Recommended Baseline Energy Rate
Utility Billed Units CY2017 CY2018 CY2019 Baseline1
Electricity kWh $0.1838 $0.1820 $0.1666 $0.1773
Natural Gas Therm $0.65 $0.76 $1.03 $0.81
#2 Fuel Oil Gal $1.57 $1.84 $2.12 $1.83 1Baseline Energy Rates have been calculated as the total three-year cost for all facilities divided by the total three-year consumption for all facilities, by utility for CY2017-CY2019
Recommended Baseline Water Rate1
Utility Billed Units CY2018 CY2019 CY2020 Baseline
Water CCF $8.03 $8.03 $8.03 $8.03 1The City is not billed for water, however usage is metered, assumes a water rate of $3.07/CCF and sewer rate of $4.96/CCF as projected for FY21 in the City of Easthampton Water, Sewer and Stormwater Rate Evaluation report
Recommended Baseline Energy Use and Cost by Building
Building Baseline
Cost Electric (kWh)
Natural Gas (Therms)
#2 Fuel Oil (Gal)
Water (CCF)
Council on Aging $10,494 35,243 3,086 - 59
Public Safety Complex $76,045 344,626 23,291 - 610
Municipal Building $58,811 243,818 15,669 - 597
Water Department $71,366 362,954 2,052 199 451
Wastewater Plant $87,819 103,691 - 5,021 8,169
Easthampton High School $146,811 577,202 26,636 - 1,187
Total $451,347 1,667,534 70,735 5,220 11,073 Perform a detailed benchmarking analysis to determine potential cost savings:
Honeywell completed a conservative benchmark analysis of the facilities included in the IGA Agreement and identified potential energy and water savings of approximately $50,420/year or 11.2% of the baseline costs. The table below provides a summary of potential energy and water savings by building.

City of Easthampton SECTION A
Preliminary Audit Analysis
10
Summary of Estimated Savings by Building and Utility Type
Building Electric Savings
Fuel Savings
Water Savings
Total Savings
Total Utility Cost
Savings %
Council on Aging $1,501 $1,006 $47 $2,554 $10,494 24.3%
Public Safety Complex $15,066 $3,376 $735 $19,177 $76,045 25.2%
Municipal Building $12,231 $3,771 $960 $16,961 $58,811 28.8%
Water Department $1,963 $293 $181 $2,437 $71,366 3.4%
Wastewater Plant $391 $1,379 $656 $2,426 $87,819 2.8%
Easthampton High School $5,529 $1,335 $ - $6,864 $146,811 4.7%
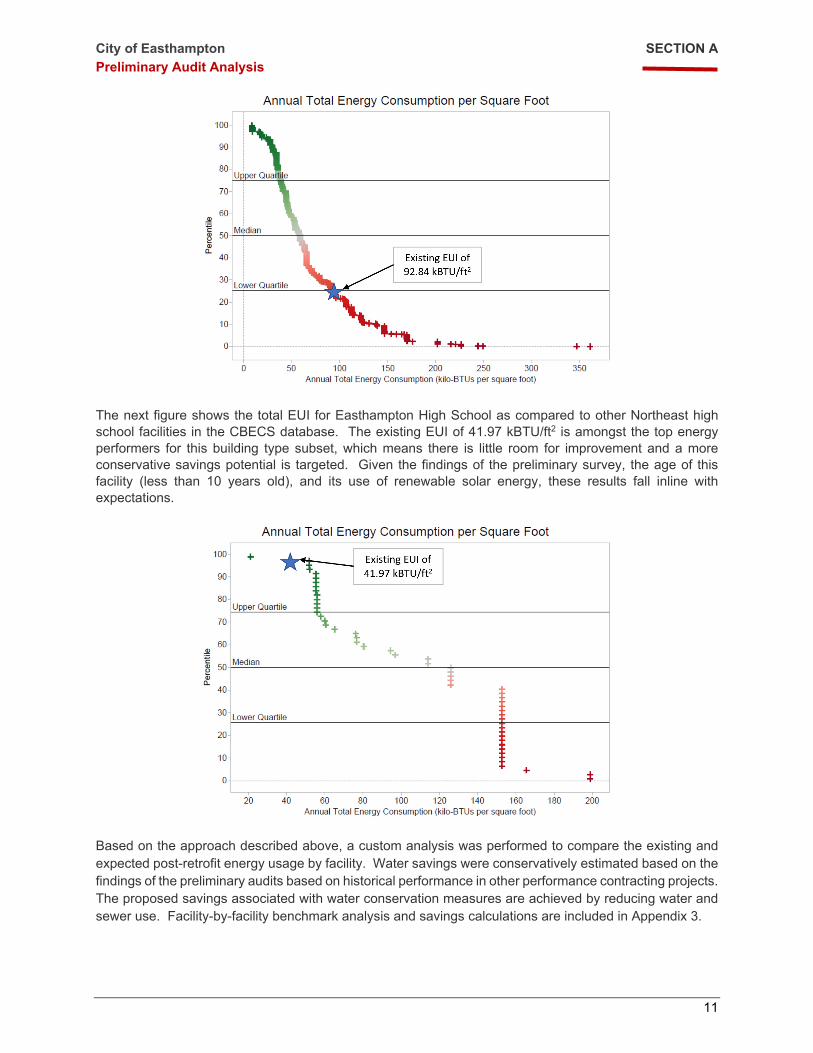
Total $36,681 $11,160 $2,579 $50,420 $451,347 11.2% In order to estimate preliminary energy and water cost savings, Honeywell determined the Energy Use Intensity (EUI) for our preliminary analysis. EUI is a benchmark that expresses a building’s energy use as a function of building size. A low EUI is considered more energy efficient, and conversely, a high EUI is considered less energy efficient. EUI is calculated by aggregating all building energy sources consumed in one year, divided by the total gross floor area. Values for electric and fuel energy consumption for all buildings are expressed in British Thermal Units per square foot (kBTU/ft2) When performing an analysis based on building EUI, a common benchmark comparison is the Commercial Buildings Energy Consumption Survey (CBECS). The CBECS, developed by the U.S. Energy Information Administration (EIA), is a “national sample survey that collects information on the stock of U.S. commercial buildings, including energy-related building characteristics and energy usage data (consumption and expenditures).” CBECS data is grouped regionally (New England States for example), and averages EUI data from buildings that have and have not been optimized through the implementation of ECMs. To identify and quantify opportunities for improvement, Honeywell has compared the City’s facilities with other similar facilities in the CBECS database. As described above, our analysis used an average of utility data provided by the City for CYs 2017 through 2019 for electric, natural gas and fuel oil. Facilities were classified according to principal activity (school, office, public order and safety, public assembly, etc.). Facility EUIs for electricity and fuel were analyzed, and a reduction goal assigned for each. Reduction goals were based on a comparison of current performance and the performance of similar facilities in the CBECS database. The reduction goal for each facility is based on its current EUI as compared to the CBECS database. Using this approach, a facility with an EUI in the median or lower quartile will have more potential for improvement than a facility that is in the upper quartile. Process based facilities, such as the Water Department and Wastewater Plant, have EUIs that vary greatly depending on the specific service offered. Because of this a reliable benchmark for facilities of this nature is not available in the CBECS database. Honeywell has conservatively estimated the potential savings for these facilities based on past project experience. The figure below shows the total EUI for the Municipal Building as compared to other Northeast office facilities in the CBECS database. The existing EUI of 92.84 kBTU/ft2 is right around the lower quartile of performance for this building type subset, which means there is significant room for improvement and a more aggressive savings potential is targeted. The conditions observed during the preliminary survey and the age of this facility support this savings potential.
City of Easthampton SECTION A
Preliminary Audit Analysis
11
The next figure shows the total EUI for Easthampton High School as compared to other Northeast high school facilities in the CBECS database. The existing EUI of 41.97 kBTU/ft2 is amongst the top energy performers for this building type subset, which means there is little room for improvement and a more conservative savings potential is targeted. Given the findings of the preliminary survey, the age of this facility (less than 10 years old), and its use of renewable solar energy, these results fall inline with expectations.
Based on the approach described above, a custom analysis was performed to compare the existing and expected post-retrofit energy usage by facility. Water savings were conservatively estimated based on the findings of the preliminary audits based on historical performance in other performance contracting projects. The proposed savings associated with water conservation measures are achieved by reducing water and sewer use. Facility-by-facility benchmark analysis and savings calculations are included in Appendix 3.

City of Easthampton SECTION A
Preliminary Audit Analysis
12
Identify simple payback ranges by ECM using the benchmarking analysis and Honeywell’s history of implementing these ECMs
The first table below represents a list of recommended Energy Conservation Measures (ECMs) that may be economically feasible based on our analysis and the criteria of this PAA. The ECMs are grouped into Technical Categories (TC) based on commonality of the specific ECM description. The second table illustrates typical simple payback ranges and equipment service life expectancy. This list will be refined, and the details expanded based on discussions with the City and the information gathered during the DTEAR and Optimized IGA phases. Please refer to Appendix 4 for a complete list of both cost effective and non-cost effective ECMs considered.
Recommended ECM Matrix
ECM Cou
ncil
on A
ging
Publ
ic S
afet
y C
ompl
ex
Mun
icip
al B
uild
ing
Wat
er D
epar
tmen
t
Was
tew
ater
Pla
nt
East
ham
pton
Hig
h Sc
hool
ECM 1.1 – Boiler Replacement X X
ECM 1.2 – Domestic Hot Water Upgrades X
ECM 2.1 – Chiller Replacement X
ECM 3.1 – Building Management System Upgrades (Healthy Buildings Dashboard) X X X X X X
ECM 3.2 – Needle Point Bipolar Ionization X X X X X X
ECM 3.3 – Demand Control Ventilation X X
ECM 4.1 – AHU Replacement & VAV Conversion X
ECM 4.2 – Install Kitchen Hood Controls X
ECM 4.3 – De-Stratification Fans with UV Lighting X
ECM 5.1 – Lighting & Lighting Control Upgrades X X X X X
ECM 6.1 – Building Envelope Improvements X X X X X X
ECM 6.2 – Window Replacement X X X X
ECM 7.1 – Pipe Insulation X X X X X X
ECM 8.1 – High Efficiency Motors & Variable Frequency Drives X X X
ECM 9.1 – Walk-In Freezer/Cooler Controls X
ECM 11.1 – Solar Photovoltaic Systems X X X X
ECM 13.1 – Water Conservation X X X X X
ECM 15.1 – Fuel Conversion X
ECM 17.1 – Retro-Commissioning X
ECM 19.1 – Desktop Computer Power Management X X
City of Easthampton SECTION A
Preliminary Audit Analysis
13
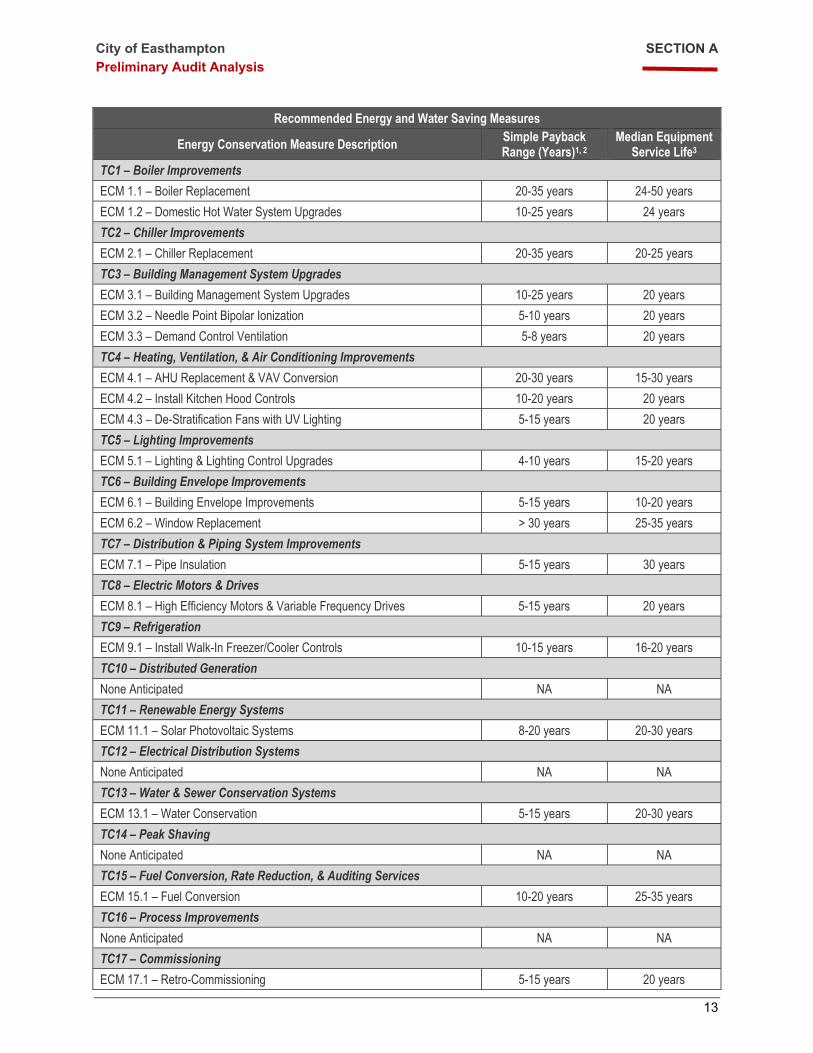
Recommended Energy and Water Saving Measures
Energy Conservation Measure Description Simple Payback Range (Years)1, 2
Median Equipment Service Life3
TC1 – Boiler Improvements
ECM 1.1 – Boiler Replacement 20-35 years 24-50 years
ECM 1.2 – Domestic Hot Water System Upgrades 10-25 years 24 years
TC2 – Chiller Improvements
ECM 2.1 – Chiller Replacement 20-35 years 20-25 years
TC3 – Building Management System Upgrades
ECM 3.1 – Building Management System Upgrades 10-25 years 20 years
ECM 3.2 – Needle Point Bipolar Ionization 5-10 years 20 years
ECM 3.3 – Demand Control Ventilation 5-8 years 20 years
TC4 – Heating, Ventilation, & Air Conditioning Improvements
ECM 4.1 – AHU Replacement & VAV Conversion 20-30 years 15-30 years
ECM 4.2 – Install Kitchen Hood Controls 10-20 years 20 years
ECM 4.3 – De-Stratification Fans with UV Lighting 5-15 years 20 years
TC5 – Lighting Improvements
ECM 5.1 – Lighting & Lighting Control Upgrades 4-10 years 15-20 years
TC6 – Building Envelope Improvements
ECM 6.1 – Building Envelope Improvements 5-15 years 10-20 years
ECM 6.2 – Window Replacement > 30 years 25-35 years
TC7 – Distribution & Piping System Improvements
ECM 7.1 – Pipe Insulation 5-15 years 30 years
TC8 – Electric Motors & Drives
ECM 8.1 – High Efficiency Motors & Variable Frequency Drives 5-15 years 20 years
TC9 – Refrigeration
ECM 9.1 – Install Walk-In Freezer/Cooler Controls 10-15 years 16-20 years
TC10 – Distributed Generation
None Anticipated NA NA
TC11 – Renewable Energy Systems
ECM 11.1 – Solar Photovoltaic Systems 8-20 years 20-30 years
TC12 – Electrical Distribution Systems
None Anticipated NA NA
TC13 – Water & Sewer Conservation Systems
ECM 13.1 – Water Conservation 5-15 years 20-30 years
TC14 – Peak Shaving
None Anticipated NA NA
TC15 – Fuel Conversion, Rate Reduction, & Auditing Services
ECM 15.1 – Fuel Conversion 10-20 years 25-35 years
TC16 – Process Improvements
None Anticipated NA NA
TC17 – Commissioning
ECM 17.1 – Retro-Commissioning 5-15 years 20 years

City of Easthampton SECTION A
Preliminary Audit Analysis
14
Recommended Energy and Water Saving Measures
Energy Conservation Measure Description Simple Payback Range (Years)1, 2
Median Equipment Service Life3
TC18 – Advanced Metering
None Anticipated NA NA
TC19 – Appliance/Plug Load Reduction
ECM 19.1 – Desktop Computer Power Management 2-8 years 10-15 years 1The simple payback calculations utilized in the table above do not account for other allowable IGA cost and savings factors including operational savings, annual utility escalation rates and capital contributions for longer payback and planned infrastructure renewal ECMs. During the DTEAR phase we will further evaluate the merits of these opportunities and associated payback benefits to the City for the facilities selected for inclusion. 2Simple payback ranges are based upon energy and water cost savings and rebates only, utilizing historical performance data from Honeywell projects implemented in the northeast United States. Payback ranges will vary based upon utility rates, operating and maintenance conditions, use of negotiable payment streams, and the availability of rebates and incentives. 3Equipment service life expectancy shown are average values; actual equipment service life will vary depending on the installed technology and regular maintenance activities performed (Source - 2011 ASHRAE Applications Handbook, Table 4 – Comparison of Service Life Estimates).
Conclusion This preliminary analysis conducted by Honeywell has identified that there is an opportunity for the City to leverage energy savings to support a self-funded, comprehensive, infrastructure renewal program through performance-based contracting. The benefits to the City associated with moving forward with this program include the potential to:
Decrease energy consumption and cost by repairing, upgrading, or replacing old and inefficient facility systems;
Increase occupant comfort and safety by increasing lighting levels, upgrading temperature control systems and equipment, and addressing ventilation deficiencies;
Reduce operational and maintenance costs by replacing old and failing systems with new systems;
Reduce the need for capital investment in building systems by replacing failed and ageing electrical and mechanical systems.
Based on a bundled (or combined) ECM approach, we are confident, due to this PAA, that the City has an opportunity to reduce energy and water costs, lower carbon emissions and self-fund critical deferred maintenance needs. As highlighted, the PAA has identified an opportunity to reduce baseline energy and water use by 11.2%, saving the City $50,420 annually in energy and water costs. Assuming a 20-year project term, the $50,420 in annual savings, with potential solar generation, projected utility rebates and CARES funding contribution, will self-fund $4,611,022 in capital upgrades to the IGA facilities. In addition to the $50,420 in annual demand side savings opportunities, Honeywell believes there is also an opportunity to secure lower energy supply costs by implementing renewable energy solutions, such as solar PV at select City facilities and locations. With these factors considered, the financial benefits of this program could improve significantly beyond the 11.2% in annual cost savings when combined with energy supply side savings, associated 3rd party grants, and available renewable or alternative energy credits.

City of Easthampton SECTION A
Preliminary Audit Analysis
15
A detailed discussion with the City is required to determine potential solar PV installation locations, the status of current agreements with local solar farms, and any plans to renew these agreements or purchase equipment after contract terms expire.
Recommendation Honeywell advises that all ECMs identified in the Recommended ECM Matrix table above, be further developed as part of the DTEAR phase for the selected IGA facilities. During the DTEAR phase the following will be performed for each facility: Perform detailed inspections;
Document existing conditions;
Develop current facility requirements;
Perform occupant interviews, conduct surveys, and install data logging equipment as necessary to confirm building system and occupancy schedules;
Perform a detailed utility analysis including 36 months of utility billing data for each utility and meter;
Establish baseline utility consumption and cost;
Develop a preliminary list of energy and water savings ECMs by facility;
Develop preliminary pricing, annual saving, O&M and M&V requirement, and third-party funding for ECMs by facility; and
Provide a DTEAR as required by the IGA Agreement. Honeywell anticipates completing the IGA following the milestone dates outlined previously. These dates include the delivery of the DTEAR by March 12th, 2021 and an executed EMSA by May 21st, 2021. We look forward to working with the City to review this report and discuss next steps in project development.
City of Easthampton Appendices
Preliminary Audit Analysis
16
Appendices 1. IGA Agreement – Facility List
Building Address Area
(Sq. Ft.)
Council on Aging 19 Union Street, Easthampton, MA 01027 10,660
Public Safety Complex 32 Payson Avenue, Easthampton, MA 01027 48,626
Municipal Building 50 Payson Avenue, Easthampton, MA 01027 25,840
Water Department 109 Hendrick Street, Easthampton, MA 01027 3,926
Wastewater Plant 10 Gosselin Drive, Easthampton, MA 01027 13,880
Easthampton High School 70 Williston Avenue, Easthampton, MA 01027 110,400

City of Easthampton Appendices
Preliminary Audit Analysis
17
2. Annual Energy and Water, Cost and Consumption, by Facility
The following is a summary of the utility data provided by the City for each facility. The data for electric, natural gas, and fuel oil consumption and cost were provided for CY2017, CY2018, CY2019, and CY2020. The information for CY2020 appears to be incomplete, thus it is excluded from this analysis. A 3-year average baseline of cost and consumption is recommended for these utilities. The data for water consumption was provided for CY2018, CY2019, and CY2020. It is expected that significant changes in building occupancy in CY2020 due to COVID-19 has impacted the water consumption for this period. Therefore, a 2-year average baseline of water consumption is recommended to better capture normal operations. The City does meter the water consumption of their facilities; however, they are not billed for their water consumption. A water rate of $3.07/CCF and sewer rate of $4.96/CCF as
projected for FY21 in the City of Easthampton Water, Sewer and Stormwater Rate Evaluation report were used to quantify the associated water cost and value of water savings if they were billed for their water consumption. For the next iteration of this report a detailed, 3-year utility bill analysis will be performed on all relevant accounts to breakout the various cost components, such as consumption, demand, and fixed costs. The results of this analysis are then used to quantify the projected energy savings that are included in the performance guarantee.

City of Easthampton Appendices
Preliminary Audit Analysis
18
1) Council on Aging
Council on Aging
Annual Energy and Water Consumption, Costs and Recommended Baseline
Utility Units CY2017 CY2018 CY2019 Baseline
Use Cost Use Cost Use Cost Use Cost
Electricity kWh 32,247 $6,640 37,820 $7,671 35,662 $7,138 35,243 $7,150
Natural Gas Therm 2,812 $1,812 3,362 $2,914 3,084 $3,896 3,086 $2,874
#2 Fuel Oil Gal - $ - - $ - - $ - - $ -
Utility Units CY2018 CY2019 CY20202 Baseline
Use Cost1 Use Cost1 Use Cost1 Use Cost
Water CCF 51 $410 66 $530 54 $430 59 $470 1The City is not billed for water, assumes a water rate of $3.07/CCF and sewer rate of $4.96/CCF as projected for FY21 in the City of Easthampton Water, Sewer and Stormwater Rate Evaluation report 2This year is excluded due to changes in building occupancy

City of Easthampton Appendices
Preliminary Audit Analysis
19
2) Public Safety Complex
Public Safety Complex
Annual Energy and Water Consumption, Costs and Recommended Baseline
Utility Units CY2017 CY2018 CY2019 Baseline
Use Cost Use Cost Use Cost Use Cost
Electricity kWh 366,963 $58,361 328,628 $57,146 338,288 $51,893 344,626 $55,800
Natural Gas Therm 21,291 $7,916 25,389 $14,697 23,194 $23,423 23,291 $15,345
#2 Fuel Oil Gal - $ - - $ - - $ - - $ -
Utility Units CY2018 CY2019 CY20202 Baseline
Use Cost1 Use Cost1 Use Cost1 Use Cost
Water CCF 615 $4,938 605 $4,862 148 $1,192 610 $4,900 1The City is not billed for water, assumes a water rate of $3.07/CCF and sewer rate of $4.96/CCF as projected for FY21 in the City of Easthampton Water, Sewer and Stormwater Rate Evaluation report 2This year is excluded due to changes in building occupancy

City of Easthampton Appendices
Preliminary Audit Analysis
20
3) Municipal Building
Municipal Building
Annual Energy and Water Consumption, Costs and Recommended Baseline
Utility Units CY2017 CY2018 CY2019 Baseline
Use Cost Use Cost Use Cost Use Cost
Electricity kWh 237,573 $42,214 261,620 $47,491 232,260 $41,344 243,818 $43,683
Natural Gas Therm 15,610 $6,099 16,495 $9,505 14,903 $15,388 15,669 $10,331
#2 Fuel Oil Gal - $ - - $ - - $ - - $ -
Utility Units CY2018 CY2019 CY20202 Baseline
Use Cost1 Use Cost1 Use Cost1 Use Cost
Water CCF 534 $4,290 661 $5,305 557 $4,470 597 $4,798 1The City is not billed for water, assumes a water rate of $3.07/CCF and sewer rate of $4.96/CCF as projected for FY21 in the City of Easthampton Water, Sewer and Stormwater Rate Evaluation report 2This year is excluded due to changes in building occupancy

City of Easthampton Appendices
Preliminary Audit Analysis
21
4) Water Department .
Water Department
Annual Energy and Water Consumption, Costs and Recommended Baseline
Utility Units CY2017 CY2018 CY2019 Baseline
Use Cost Use Cost Use Cost Use Cost
Electricity kWh 356,789 $65,615 346,037 $63,047 386,036 $67,596 362,954 $65,420
Natural Gas Therm 1,947 $1,327 2,197 $1,929 2,011 $2,610 2,052 $1,955
#2 Fuel Oil Gal 202.6 $315 126.4 $232 269.4 $560 199 $369
Utility Units CY2018 CY2019 CY20202 Baseline
Use Cost1 Use Cost1 Use Cost1 Use Cost
Water CCF 482 $3,866 421 $3,377 737 $5,918 451 $3,622 1The City is not billed for water, assumes a water rate of $3.07/CCF and sewer rate of $4.96/CCF as projected for FY21 in the City of Easthampton Water, Sewer and Stormwater Rate Evaluation report 2This year is excluded due to changes in building occupancy

City of Easthampton Appendices
Preliminary Audit Analysis
22
5) Wastewater Plant
Wastewater Plant
Annual Energy and Water Consumption, Costs and Recommended Baseline
Utility Units CY2017 CY2018 CY2019 Baseline
Use Cost Use Cost Use Cost Use Cost
Electricity kWh 56,520 $8,909 86,561 $14,001 167,991 $16,175 103,691 $13,028
Natural Gas Therm - $ - - $ - - $ - - $ -
#2 Fuel Oil Gal 7,000 $11,007 1,878.3 $3,459 6,184 $13,116 5,021 $9,194
Utility Units CY2018 CY2019 CY20202 Baseline
Use Cost1 Use Cost1 Use Cost1 Use Cost
Water CCF 11,940 $95,874 4,399 $35,320 1,415 $11,358 8,169 $65,597 1The City is not billed for water, assumes a water rate of $3.07/CCF and sewer rate of $4.96/CCF as projected for FY21 in the City of Easthampton Water, Sewer and Stormwater Rate Evaluation report 2This year is excluded due to changes in building occupancy

City of Easthampton Appendices
Preliminary Audit Analysis
23
6) Easthampton High School
Easthampton High School
Annual Energy and Water Consumption, Costs and Recommended Baseline
Utility Units CY2017 CY2018 CY2019 Baseline
Use Cost Use Cost Use Cost Use Cost
Electricity kWh 519,446 $106,700 663,519 $124,466 548,640 $100,562 577,202 $110,576
Natural Gas Therm 28,144 $27,998 26,696 $27,324 25,069 $24,796 26,636 $26,706
#2 Fuel Oil Gal - $ - - $ - - $ - - $ -
Utility Units CY2018 CY2019 CY20202 Baseline
Use Cost1 Use Cost1 Use Cost1 Use Cost
Water CCF 1,779 $14,285 595 $4,774 293 $2,350 1,187 $9,530 1The City is not billed for water, assumes a water rate of $3.07/CCF and sewer rate of $4.96/CCF as projected for FY21 in the City of Easthampton Water, Sewer and Stormwater Rate Evaluation report 2This year is excluded due to changes in building occupancy

City of Easthampton Appendices
Preliminary Audit Analysis
24
3. Benchmark Savings Analysis by Building 1) Council on Aging The Council on Aging was benchmarked against other public assembly facilities in the Northeast United States using the Commercial Building Energy Consumption Survey (CBECS) database. The charts below show the existing Energy Utilization Index (EUI) and potential improvement targets for total energy, electrical energy, and non-electrical energy. For water a conservative estimate of 10% was carried based on the preliminary walkthrough findings. These improvement targets are then monetized using the baseline consumption and applicable utility rates.
Building Electric Savings
($)
Fuel Savings
($)
Water Savings
($)1
Total Savings
($)
Baseline Utility
Spend ($)
% Savings
Council on Aging $1,501 $1,006 $47 $2,554 $10,494 24.3% 1Assumes a water rate of $3.07/CCF and sewer rate of $4.96/CCF as projected for FY21 in the City of Easthampton Water, Sewer and Stormwater Rate Evaluation report

City of Easthampton Appendices
Preliminary Audit Analysis
25
2) Public Safety Complex The Public Safety Complex was benchmarked against other public safety facilities in the Northeast United States using the Commercial Building Energy Consumption Survey (CBECS) database. The charts below show the existing Energy Utilization Index (EUI) and potential improvement targets for total energy, electrical energy, and non-electrical energy. For water a conservative estimate of 15% was carried based on the preliminary walkthrough findings. These improvement targets are then monetized using the baseline consumption and applicable utility rates.
Building Electric Savings
($)
Fuel Savings
($)
Water Savings
($)1
Total Savings
($)
Baseline Utility
Spend ($)
% Savings
Public Safety Complex $15,066 $3,376 $735 $19,177 $76,045 25.2% 1Assumes a water rate of $3.07/CCF and sewer rate of $4.96/CCF as projected for FY21 in the City of Easthampton Water, Sewer and Stormwater Rate Evaluation report

City of Easthampton Appendices
Preliminary Audit Analysis
26
3) Municipal Building The Municipal Building was benchmarked against other office facilities in the Northeast United States using the Commercial Building Energy Consumption Survey (CBECS) database. The charts below show the existing Energy Utilization Index (EUI) and potential improvement targets for total energy, electrical energy, and non-electrical energy. For water a conservative estimate of 20% was carried based on the preliminary walkthrough findings. These improvement targets are then monetized using the baseline consumption and applicable utility rates.
Building Electric Savings
($)
Fuel Savings
($)
Water Savings
($)1
Total Savings
($)
Baseline Utility
Spend ($)
% Savings
Municipal Building $12,231 $3,771 $960 $16,961 $58,811 28.8% 1Assumes a water rate of $3.07/CCF and sewer rate of $4.96/CCF as projected for FY21 in the City of Easthampton Water, Sewer and Stormwater Rate Evaluation report

City of Easthampton Appendices
Preliminary Audit Analysis
27

City of Easthampton Appendices
Preliminary Audit Analysis
28
4) Water Department Facilities that include energy intensive processes, such as the Water Department, are very difficult to benchmark given the large variations within the population. Facilities that perform the same process in the same climate can vary significantly in their energy consumption based on their methodology and capacity, thus making traditional benchmarking somewhat unreliable. Honeywell has estimated savings for this facility based on past project experience and findings from the preliminary walkthroughs. Given the high process electrical consumption the electric savings are conservatively estimated at 3%, with fuel savings estimated at 15% and water savings estimated at 5%.
Building Electric Savings
($)
Fuel Savings
($)
Water Savings
($)1
Total Savings
($)
Baseline Utility
Spend ($)
% Savings
Water Department $1,963 $293 $181 $2,437 $71,366 3.4% 1Assumes a water rate of $3.07/CCF and sewer rate of $4.96/CCF as projected for FY21 in the City of Easthampton Water, Sewer and Stormwater Rate Evaluation report
5) Wastewater Plant Facilities that include energy intensive processes, such as the Wastewater Plant, are very difficult to benchmark given the large variations within the population. Facilities that perform the same process in the same climate can vary significantly in their energy consumption based on their methodology and capacity, thus making traditional benchmarking somewhat unreliable. Honeywell has estimated savings for this facility based on past project experience and findings from the preliminary walkthroughs. Given the high process electrical consumption the electric savings are conservatively estimated at 3%, with fuel savings estimated at 15% and water savings estimated at 1%.
Building Electric Savings
($)
Fuel Savings
($)
Water Savings
($)1
Total Savings
($)
Baseline Utility
Spend ($)
% Savings
Wastewater Plant $391 $1,379 $656 $2,426 $87,819 2.8% 1Assumes a water rate of $3.07/CCF and sewer rate of $4.96/CCF as projected for FY21 in the City of Easthampton Water, Sewer and Stormwater Rate Evaluation report

City of Easthampton Appendices
Preliminary Audit Analysis
29
6) Easthampton High School Easthampton High School was benchmarked against other high school facilities in the Northeast United States using the Commercial Building Energy Consumption Survey (CBECS) database. The charts below show the existing Energy Utilization Index (EUI) and potential improvement targets for total energy, electrical energy, and non-electrical energy. For water no savings are projected as the preliminary walkthrough already indicated low flow fixtures throughout. These improvement targets are then monetized using the baseline consumption and applicable utility rates.
Building Electric Savings
($)
Fuel Savings
($)
Water Savings
($)1
Total Savings
($)
Baseline Utility
Spend ($)
% Savings
Easthampton High School $5,529 $1,335 $ - $6,864 $146,811 4.7% 1Assumes a water rate of $3.07/CCF and sewer rate of $4.96/CCF as projected for FY21 in the City of Easthampton Water, Sewer and Stormwater Rate Evaluation report

City of Easthampton Appendices
Preliminary Audit Analysis
30

City of Easthampton Appendices
Preliminary Audit Analysis
31
4. Complete List of ECMs Considered
ECM DESCRIPTION
Technical Category 1 – Boiler Improvements
Boiler Replacement
Burner Controls
Domestic Hot Water System Upgrades
Steam to Hot Water Conversion
Boiler Isolation Valves
Install Stack Heat Recovery System
Combustion Air Upgrades
District Heating System
Install Instantaneous / Tankless Domestic Hot Water Heater
Install Vent Draft Dampers on Domestic Hot Water Heaters
Hot Water Temperature / Steam Pressure Reset Strategy
Reduce Steam Pressure to meet Unique Loads (Heating, Autoclaves, etc.)
Reduce Hot Water Temperature
Hot Water / Reheat / Radiation Temperature Reset
Install Boiler Optimization Controls (for Multiple Boilers)
Oxygen Trim Controls on Large Boilers
Install Gas Line Turbulators in Boilers to Improve Efficiency
Replace Burner Only in Existing Boilers with New High Turndown Burner
Install Deaerators
Boiler Blow Down Heat Recovery on Large Boilers
Install Soft Water System for Steam System Feed Water
Reduce Boiler Feed Pump Motor Horsepower
Preheat #2 Fuel Oil to Improve Burner Efficiency
Install Secondary Fuel Source – Oil Tank or Propane Tank
Waste Oil Furnace System
Boiler Tune-Up, Operation & Maintenance Control Calibration
Consider Installing Modular Boilers
Replace Electric Boilers with Natural Gas Equipment
Install Small Separate Boilers for Domestic Hot Water, Pools, etc.
Thermal Fluid Heating Plant
Install Heat Exchangers for Small Loads
Chemical Treatment
De-Centralize (Individual Boilers in Each Building)
Technical Category 2 – Chiller Improvements
Chiller Replacement
Cooling Tower Replacement
Chiller Optimization Controls (Multiple Chillers)
Cooling Tower Optimization Controls (Multiple Towers)

City of Easthampton Appendices
Preliminary Audit Analysis
32
ECM DESCRIPTION
Technical Category 2 – Chiller Improvements Continued
Install Chilled Water Reset Control
Install Condenser Water Reset Control
Sensors for Alarm / Monitoring of Refrigerant in Chiller Rooms
Tune-Up / Maintain Existing Chillers
Install High Efficiency Chiller with VFD as Partial Load Chiller
Install Modular Chillers
Install Dedicated Chiller for Unique Loads (OR Suites, Computer Rooms, etc.)
Consider Installing Steam Absorption Chillers
Consider Installing Gas Fired / Gas Engine Driven Centrifugal Chillers
CFC Containment for Existing Chillers
CFC Conversion for Existing Chillers
Refrigerant Bank / Storage – Supply
Liquid Refrigerant Pumps
Install Dry Coolers
Primary-Secondary Pumping System
Tower Free Cooling via Plate & Frame Heat Exchangers
Variable Primary Flow System
Thermal Energy Storage (Chilled Water or Ice)
Technical Category 3 – Building Management System Upgrades
Building Management System Upgrades
Demand Control Ventilation
Hot Water Temperature / Steam Pressure Reset Strategy
Install Programmable Thermostats
Existing Building Management System Integration
Modify Setpoints
Runtime Scheduling & Control
Optimum Start / Stop
Night Setback (Winter) / Night Setup (Summer)
Recirculation Control During Warm-Up or Cool-Down Mode
Night Purge
Economizer Control
Discriminator Control
Terminal Regulated Air Volume Control
Hot Deck / Cold Deck Reset
Condenser Water Reset
Chilled Water Reset
VFD Control
Boiler Optimization (for Multiple Boilers)
Chiller Optimization (for Multiple Chillers)

City of Easthampton Appendices
Preliminary Audit Analysis
33
ECM DESCRIPTION
Technical Category 3 – Building Management System Upgrades Continued
Cooling Tower Optimization
Demand Limiting
Occupancy Sensor Control of HVAC Equipment
Upgrade Existing Central Computer Systems
Install New Central Computer Systems
Duty Logs & Trending
Alarming, Monitoring & Reporting
Real-Time Pricing
Remote HVAC Monitoring & Control
Covert from Pneumatic to Direct Digital Control (DDC)
Add Additional Zones for Control
Replace Manual Radiator Valve with Automatic Control Valve
Install Solenoid Valves on all Water-Cooled Equipment Water Lines
Dishwasher Exhaust Fan Interlock
Garage Exhaust Based on CO Senor Application
Install Occupancy Sensors on Urinal Water Flow Controls
Laboratory Controls / Fume Hood Controls
Isolation Room Controls
Lab Control & Pressurization Monitor
Room Pressure Control
DDC Controls for Ice Arenas
Lighting Controls System Integration with Building Management System
Vending Machine Controls
RTU Optimization
Electrical Monitoring
Install Advanced Metering System
Technical Category 4 – Heating, Ventilation & Air Conditioning Improvements
AHU / RTU / Unit Ventilator Replacement or Refurbishment
Multi-Zone Unit to VAV Conversion
Infrared Heaters
Install Pool Dehumidification Unit
Install Kitchen Hood Controls
De-Stratification Fans
Pool Cover
End of Life Equipment Replacements
Replace Electric Heating with Natural Gas Equipment
Replace Packaged Equipment with Heat Pumps
Replace Computer Room & Clean-Room A/C Units
Install Units with 2-Stage DX Cooling

City of Easthampton Appendices
Preliminary Audit Analysis
34
ECM DESCRIPTION
Technical Category 4 – Heating, Ventilation & Air Conditioning Improvements Continued
Install Heat Recovery Units
Install Air-to-Air Heat Exchangers
Replace Window A/C Units
Install Geothermal Heat Pumps
Replace Fans
Repair / Replace Cooling Towers
Repair / Replace Cooling Tower Slats
Tower Free Cooling via Plate & Frame Heat Exchangers
Install Separate Chiller for Process Cooling Load
Thermal Energy Storage – Ice
Thermal Energy Storage – Water
Clean Coils / Repair Existing Air Handling Units
New Coils (Heating / Cooling / Preheat)
Waste Heat Recovery from Incinerators
Heat Reclaim on Boiler Stack
Utilize Condensate Return to Preheat Domestic Cold Water
Install Economizers
Install Thermal Siphons
Retrofit Fan Belts
Trim Pump Impellers
Install Variable Frequency Drives on Cooling Tower Fan Motors
Install Variable Frequency Drives on Fan Motors
Install Variable Frequency Drives on Pump Motors
Install Low Leakage Fresh Air Dampers
Add Supplemental Filtration Media
HVAC Control Upgrades
Convert 100% Outdoor Air Type Unit to Return Air Type
Air Balance of HVAC Systems
Water Balance of HVAC Systems
Add Balancing Dampers
Desiccant Dehumidification
Install Humidifiers
Valve Conversions (2-Way, 3-Way)
Replace Manual Radiator Valves with Automatic Valves
Install Solenoid Valves on Water Cooled Equipment Lines
Clean Ductwork
Ozone Treatment of Cooling Towers
Ozone Pool Water Treatment System
Install Separate Boilers to Accommodate End Uses (Comfort, Domestic Hot Water, Pool, etc.)

City of Easthampton Appendices
Preliminary Audit Analysis
35
ECM DESCRIPTION
Technical Category 4 – Heating, Ventilation & Air Conditioning Improvements Continued
Elevator Modernization
Cooling Chamber Alternate Refrigerant
Dust Particle Exhaust, Welding Exhaust, etc.
Compressed Air Management
Compressor Equipment Replacement
Compressed Air Tools & Equipment
Airless Spray Instead of Air Spray Paint Applications
Automated Compressor Control System
Install Electric Motors on Paint Drums Instead of Air Operated
Ice Arena Ceiling Reflectors
Technical Category 5 – Lighting Improvements
Lighting & Lighting Controls Upgrades (Interior & Exterior)
Delamp Fixtures / Reduce Illumination Levels
Delamp Soda Machines
Retrofit Lamps to LED
Retrofit Ballasts (Magnetic to Electronic)
Install Reflectors
Replace Fixtures
Replace Lenses
Convert Incandescent to LED
Replace Exit Fixtures with LED Equivalents
Install Occupancy Sensors for Common Area Lighting
Install Lighting Controls on Outdoor Lighting / Parking Lot
Retrofit Emergency Lighting
Daylight Harvesting Using Natural Lighting
LED Street Lights, Traffic Lights & Walk-Way Lights
LED Street Lighting Control System
Parking Garage Lighting Upgrades & Occupancy Controls
Recycle Fluorescent & HID Lamps & PCB / Non-PCB Ballasts
Vending Machine Controls
Install Occupancy Base Lighting Control Systems
Technical Category 6 – Building Envelope Improvements
Building Envelope Improvements
Roof Replacement
Window Replacement
Install Window Film
Exterior Door Replacement
Gravity Vent Motorized Dampers
Cap Abandoned Exhaust Opening & Ventilation Shafts

City of Easthampton Appendices
Preliminary Audit Analysis
36
ECM DESCRIPTION
Technical Category 6 – Building Envelope Improvements Continued
Insulate Unit Ventilator Interior
Green Roof Installation
Weather-Strip / Caulk Windows to Reduce Infiltration
Weather-Strip / Caulk Doors to Reduce Infiltration
Weather-Strip / Caulk Building Penetrations to Reduce Infiltration
Install or Modify Entrance Vestibules
Insulate Exterior Walls
Insulate Crawl Space Walls
Insulate Knee Walls
Insulate Curtain Walls
Install Exterior Insulation & Finish System
Insulate Above Ceiling
Insulate Roof
Retrofit Single Pane Windows with Double Pane Windows
Install Overglazing System
Plant Trees to Reduce Solar Gain
Install Overhangs to Reduce Solar Gain
Paint Exterior Surfaces to Reduce Solar Gain
Plastic Curtain for Dock Area
Install High Speed Doors to Freezer Areas
Technical Category 7 – Distribution & Piping System Improvements
Install Pipe Insulation
Steam Trap Retrofits
Reduce Domestic Hot Water Temperature to 120°F
Install Insulating Blanket on Domestic Hot Water Tanks
Install Variable Frequency Drives on Domestic Hot Water Pump Motors
Reduce Heating Hot Water Temperature to Accommodate Load
Reduce Steam Pressure to Accommodate Load
Repair Steak Leaks
Install Concentric Piping System Inserts to Repair Leaks
Steam Trap Inserts
Replace Manual Radiator Valves with Automatic Control Valves
Install Deaerators
Install a Soft Water System for Steam System Feed Water
Convert Open Steam System to Closed System
Utilize Condensate Return to Preheat Domestic Cold Water
Balance Water Systems
Install Primary / Secondary / Tertiary Pumping System
Install Variable Frequency Drives on Pump Motors

City of Easthampton Appendices
Preliminary Audit Analysis
37
ECM DESCRIPTION
Technical Category 7 – Distribution & Piping System Improvements Continued
Install Control Valves to Save Pumping Energy
Modify Piping Network to Improve Distribution
Valve Conversion (2-Way, 3-Way)
Install Solenoid Valves on Water-Cooled Equipment Lines
Chemical Treatment of Distribution Systems
Chemical Treatment of Cooling Towers
Ozone Treatment of Cooling Towers
Replace Water-Based Distribution System with Air-Based System
Technical Category 8 – Electric Motors & Drives
Install High-Efficiency Electric Motors on Fans
Install High-Efficiency Electric Motors on Pumps
Install High-Efficiency Electric Motors on Compressors
Install High-Efficiency Electric Motors on Miscellaneous Equipment
Install Variable Frequency Drives on Fan Motors (via Pressure)
Install Variable Frequency Drives on Fan Motors (via Temperature)
Install Variable Frequency Drives on Fan Motors (via CO2)
Install Variable Frequency Drives on Pool AHU Motors (via RH)
Install Variable Frequency Drives on Pump Motors (via ∆T)
Install Variable Frequency Drives on Pump Motors (via Pressure)
Install Variable Frequency Drives on Domestic Hot Water Pumps
Install Variable Frequency Drive on Pool Circulation Pump
Install Variable Frequency Drives on Cooling Tower Fan Motors
Install Variable Frequency Drives on Central Vacuum System
Install Variable Frequency Drives on Wood Shop Dust Collector
Install Variable Frequency Drives on City Water Storage Tank Pumps
Install Magnetic Drives on Pumps
Install Cogged V-Belts
Install Synchronous Belts
Reduce Motor Horsepower to Accommodate Load
Electric Motor Preventative Maintenance & Motor Testing Program
Technical Category 9 – Refrigeration
Install Walk-In Freezer / Cooler Controls
Replace One-Pass Water Cooled Condensing Units
Replace Ice Equipment with High Efficiency Units
Replace Refrigeration Equipment with High Efficiency Units
Install Heat Reclaim on Refrigeration Units
Refrigerant Bank / Storage – Supply
Liquid Refrigerant Pumps
Cooling Chamber Alternate Refrigerant

City of Easthampton Appendices
Preliminary Audit Analysis
38
ECM DESCRIPTION
Technical Category 9 – Refrigeration Continued
Lower Head Pressure
Install Sub-Cooling Capabilities
Convert Refrigerant to Eliminate CFC Mitigation Costs
Install Variable Refrigerant Flow (VRF) System
Technical Category 10 – Distributed Generation
Cogeneration with Process Load
Cogeneration with Absorption Chillers
Install Fuel Cells
Install Secondary Fuel Source – Oil Tank or Propane Tank
Propane Air System for Alternate Heating Fuel
Microturbine Installation
Micro-Grids
Energy Resiliency
Technical Category 11 – Renewable Energy Systems
Install Solar Photovoltaic Systems
Wind Generation
Install Solar Thermal Systems
Solar Photovoltaic Electric Car Charging Station
Solar Photovoltaic Outdoor Lighting
Daylighting via Solar Photovoltaic Overhead Glazing System
Solar Photovoltaic Roof Tiles
Solar Photovoltaic Generators for Telecommunications
Solar Domestic Hot Water System via Line Focusing Parabolic Troughs
Passive Solar Heating System via Skylights
Passive Solar Heating System via Thermal Wall
Biomass / Bioenergy in Boilers or Absorption Chillers
Geothermal Heat Pumps
Biomass – Methane Gas from Landfill / Sewer Treatment
Solar Wall – Transpired Solar Collector
Technical Category 12 – Electrical Distribution Systems
Install High Efficiency Transformers
Power Factor Correction
Install Capacitors to Isolate Areas & Reduce Conductor Loads
Load Management via Time Clock or Control System
Load Management via Real-Time Pricing Software
Reduce Voltage for Improved Efficiency
Replace Oversized Motors
Uninterruptible Power Source (UPS System)
Electric Switchgear Upgrades

City of Easthampton Appendices
Preliminary Audit Analysis
39
ECM DESCRIPTION
Technical Category 12 – Electrical Distribution Systems Continued
Electrical Monitoring
Technical Category 13 – Water & Sewer Conservation Systems
Water Fixture Retrofits / Replacements
Rainwater Harvesting
Retrofit Flush Valves in Toilets & Urinals
Replace Existing Toilet / Urinal Fixture with New Water Reduction Type
Install Reduced Flow Shower Heads
Install Reduced Flow Faucet Aerators
Reduce Exterior Water Usage
Install Separate Meter on Cooling Tower Make-Up Water Line
Install Separate Meter on Landscape Irrigation Water Line
Install Separate Meter on Swimming Pool Make-Up Water Line
Use Grey Water for Irrigation
Use Grey Water for Water Closets
Xeriscape Landscaping
Potable Water Treatment
On-Site Sewage Treatment
Technical Category 14 – Peak Shaving
Demand Response using Existing Generation Equipment
Thermal Energy Storage – Water
Thermal Energy Storage – Ice
Cogeneration with Process Loads
Cogeneration with Absorption Chillers
Emergency Generator Peak Shaving
Install Real-Time Pricing Software
Duty-Cycle Equipment via Building Management System
Technical Category 15 – Fuel Conversion, Rate Reduction & Auditing Services
Fuel Conversion
Kitchen Equipment Upgrades
Local Utility Rebate Programs
Demand Side Management Rebates
Utility Billing & Meter Auditing Services for Billing Errors
Rate Structure Evaluation for Best Electrical Rates Available
Negotiate Special Rates with Utility Company, if Possible
Installing Sub-Meters for Account Purpose
Evaluate Power Factor Correction Requirement to Avoid Penalty
Evaluate Benefit of Curtailable Rate Structure
Electricity Retail Wheeling (Brokering)
Real-Time Pricing Software

City of Easthampton Appendices
Preliminary Audit Analysis
40
ECM DESCRIPTION
Technical Category 15 – Fuel Conversion, Rate Reduction & Auditing Services Continued
Transportation Gas Purchase through Brokerage House
Transportation Gas Purchase through Local Regional Supplier
Propane Air System for Alternate Heating Fuel
Energy Use Modeler
Technical Category 16 – Process Improvements
Improvements Heavily Dependent on Process Specifics
Technical Category 17 – Commissioning
Retro-Commissioning
Continuous Commissioning
Technical Category 18 – Advanced Metering
Install Energy Metering & Energy Dashboard Kiosk
Equipment Sub-Metering
Technical Category 19 – Appliance / Plug Load Reduction
Computer Power Management
Plug Load Power Management
Printer Management
Server Room Upgrades
Replace Appliances with Energy Star Equivalents