preference and acceptability of alternative delivery ... · preference and acceptability of...
TRANSCRIPT

PREFERENCE AND ACCEPTABILITY OF ALTERNATIVE
DELIVERY VEHICLES FOR PRENATAL CALCIUM
SUPPLEMENTATION AMONG PREGNANT WOMEN IN
BANGLADESH
by
Jo-Anna Bernadette Baxter
A thesis submitted in conformity with the requirements
for the degree of Master of Science
Graduate Department of Nutritional Sciences
University of Toronto
© Copyright by Jo-Anna Bernadette Baxter (2013)
ii
Preference and acceptability of alternative
delivery vehicles for prenatal calcium supplementation
among pregnant women in Bangladesh
Jo-Anna Baxter
Master of Science
Department of Nutritional Sciences – University of Toronto
2013
ABSTRACT
In populations with low dietary calcium intake, prenatal calcium supplementation is
recommended by the WHO to decrease the risk of hypertensive diseases of pregnancy. This
study evaluated preference and acceptability for four different calcium delivery vehicles
(conventional tablets, chewable tablets, unflavoured powder, and flavoured powder) among
pregnant women in urban Bangladesh. Participants (n=132) completed a 4-day run-in period in
which each vehicle was sampled once, followed by a 21-day selection period during which
participants were free to select a vehicle of their choice on each day. The probability that
participants selected the conventional tablets was greatest (62%), followed by chewable tablets
(19%), flavoured powder (12%), unflavoured powder (5%), and no delivery vehicle (2%). The
present assessment of participants’ actual supplement use and expressed perceptions of
acceptability suggested that a tablet formulation is likely to be the most appropriate calcium
delivery vehicle for future use in field studies and scale-up planning.

iii
ACKNOWLEDGEMENTS
I am so grateful to have had the opportunity to work with Dr. Stanley Zlotkin and Dr. Daniel
Roth. Your continual encouragement, contextual guidance, and thoughtful critiques were greatly
appreciated - hopefully I have come to think a little more like a scientist! My general Masters
experience, project development process, and thesis would not have been what they were
without your input and mentorship.
Much gratitude also goes to my committee members, Dr. Daniel Sellen, Dr. Jonathon Maguire,
Dr. Mary L'Abbé, and Dr. Pauline Darling. Your insight surrounding the conceptualization of
this project, experimental design, and interpretation of the results was helpful and I appreciated
our discussions.
To our dedicated collaborators at icddr,b and Shimantik, thank you for helping make this work
possible – my experience and time in Bangladesh were very full. I am grateful our co-
investigators: Mr. Abdullah Al-Mahmud for his assistance with project coordination, as well as
advice provided during project design by Dr. Munirul Islam and Dr. Tahmeed Ahmed and
database development by Qazi Sadeq-ur Rahman. To the Acceptability Study personnel (Taib,
Rubama, Nasima, Shikha, Saera, and Sherin), it was a pleasure working closely with you in the
field. I was so fortunate to have been paired with such a hardworking and sincere group of
people, and greatly appreciated your continual reminders that you supported my educational
aspirations.
To our participants, thank you so much for welcoming us into your homes on a weekly basis.
Without your active participation this work would not have been possible. Your willingness to
aid us in informing the present understanding surrounding calcium supplementation was very
meaningful.
To the team at SickKids, your support over the past two years has been humbly appreciated. I
must particularly recognize the Saving Lives at Birth group, including Ashley Aimone Phillips,
Brendon Pezzack, Diego Bassani, Elaine Gergolas, and Nandita Perumal. I have thoroughly

iv
enjoyed our Thursday meetings and am thankful to have been a member of the SLAB team.
Eddy De Oliveira, thank you for your administrative support; Sohana Shafique, thank you
sincerely for all of your research, contextual, and moral support, Bangladesh-related and
otherwise.
I would not be where I am without the continual support of my parents, Joe and Dores. Through
ups and downs, I always know that you are walking with me in my adventures no matter the
miles between us.
Many people have contributed in various aspects to this project that I have not mentioned. These
individuals span cities, countries, and continents – your friendship, support, and assistance along
the way have meant so much.
The past two years have been quite the journey. It was truly an honour to have worked on this
project, all the while learning valuable research-related and life lessons. Thank you all!
This research was funded by the Sprinkles Global Health Initiative and the Department of
Paediatrics at the Hospital for Sick Children. Personal support was provided by the Ontario
Ministry of Training, Colleges, and Universities Ontario Graduate Scholarship (OGS) and a
studentship through the Research Training Competition (Restracomp) from the Hospital for Sick
Children Foundation Student Scholarship Program.

v
TABLE OF CONTENTS
ABSTRACT ........................................................................................................................ ii
ACKNOWLEDGEMENTS .................................................................................................. iii
TABLE OF CONTENTS ....................................................................................................... v
LIST OF TABLES ................................................................................................................. ix
LIST OF FIGURES .............................................................................................................. xii
LIST OF ABBREVIATIONS ............................................................................................. xiv
LIST OF DEFINITIONS ..................................................................................................... xv
LIST OF APPENDICES ..................................................................................................... xvi
CHAPTER 1 INTRODUCTION ......................................................................................... 1
CHAPTER 2 LITERATURE REVIEW ............................................................................. 3
2.1. Micronutrient requirements during pregnancy ............................................................ 3
2.1.1. Importance of micronutrients during pregnancy ................................................ 3
2.1.2. Micronutrient deficiency and populations at risk ............................................... 3
2.1.3. Global burden of micronutrient deficiencies during pregnancy ......................... 4
2.1.4. Strategies for reducing micronutrient deficiencies ............................................. 4
2.2. Targeted micronutrient supplementation strategies during pregnancy ........................ 5
2.2.1. Iron-folic acid supplementation .......................................................................... 5
2.2.2. UNIMMAP ......................................................................................................... 5
2.2.3. Calcium supplementation ................................................................................... 6
2.3. Preference and acceptability within supplementation regimens .................................. 7
2.3.1. The role of preference and acceptability ............................................................ 7
vi
2.3.2. Adherence within micronutrient supplementation regimens .............................. 7
2.3.3. Evaluation of supplement acceptability .............................................................. 9
2.3.4. Acceptability of supplement use among pregnant women in developing
countries ............................................................................................................ 10
2.4. Hypertensive diseases of pregnancy .......................................................................... 11
2.4.1. Classifications of hypertensive diseases of pregnancy and risk factors ........... 11
2.4.2. Health complications stemming from hypertensive diseases of pregnancy ..... 11
2.4.3. Etiology of HDP ............................................................................................... 12
2.4.4. Prevalence of hypertensive diseases of pregnancy in Bangladesh ................... 12
2.5. Calcium ...................................................................................................................... 12
2.5.1. Sources of calcium ............................................................................................ 12
2.5.2. Calcium absorption ........................................................................................... 14
2.5.3. Role and maintenance of calcium during pregnancy ........................................ 14
2.5.4. Nutritional recommendations for calcium intake during pregnancy ................ 15
2.5.5. Calcium status of women in Bangladesh .......................................................... 15
2.6. Hypertensive diseases of pregnancy and calcium supplementation .......................... 16
2.6.1. Early observational evidence for the role of calcium in the prevention of
hypertensive diseases of pregnancy .................................................................. 16
2.6.2. Randomized control trials of the HDP-calcium association ............................. 17
2.6.3. Support for calcium supplementation from systematic review and
meta-analysis .................................................................................................... 19
2.6.4. Potential benefit of calcium supplementation for the prevention of
hypertensive diseases of pregnancy in Bangladesh .......................................... 20
2.6.5. Mechanism of calcium supplementation in the prevention of
pre-eclampsia .................................................................................................... 20
2.7. Calcium and iron interactions .................................................................................... 20

vii
2.7.1. Studies examining calcium-iron interactions.................................................... 20
2.7.2. Mechanism of calcium-iron interactions .......................................................... 23
2.8. Concomitant administration of calcium-iron supplementation during pregnancy .... 24
2.8.1. Challenges associated with the WHO calcium and iron supplementation
regimens ............................................................................................................ 24
2.8.2. An innovative microencapsulated prenatal supplement containing calcium
and iron ............................................................................................................. 25
CHAPTER 3 PREFERENCE AND ACCEPTABILITY OF ALTERNATIVE
DELIVERY VEHICLES FOR PRENATAL CALCIUM
SUPPLEMENTATION AMONG PREGNANT WOMEN IN
BANGLADESH .......................................................................................... 26
3.1. Introduction ................................................................................................................ 26
3.1.1. Rationale ........................................................................................................... 26
3.1.2. Hypothesis and objectives ................................................................................ 27
3.2. Methodology .............................................................................................................. 28
3.2.1. Study design ..................................................................................................... 28
3.2.2. Study setting ..................................................................................................... 28
3.2.3. Study collaborative partner ............................................................................... 29
3.2.4. Study subjects ................................................................................................... 29
3.2.5. Ethical approval ................................................................................................ 30
3.2.6. Prenatal calcium supplementation formulations ............................................... 30
3.2.7. Sample size calculation..................................................................................... 32
3.2.8. Study personnel training and quality control .................................................... 33
3.2.9. Study procedures .............................................................................................. 34
3.2.10. Data collection methods ................................................................................... 37
3.2.11. Statistical analyses ............................................................................................ 39
viii
3.3. Results ........................................................................................................................ 44
3.3.1. Enrolment and follow-up .................................................................................. 44
3.3.2. Baseline participant characteristics................................................................... 45
3.3.3. Delivery vehicle preference .............................................................................. 45
3.3.4. Delivery vehicle acceptability .......................................................................... 48
3.3.5. Foods and drinks used in combination with the powdered delivery
vehicles ............................................................................................................. 50
3.3.6. Willingness to use and purchase the delivery vehicles ..................................... 50
3.3.7. Exploration of participant characteristics associated with selection
probability ......................................................................................................... 51
3.3.8. Adherence and health-related events ................................................................ 53
3.4. Discussion .................................................................................................................. 80
3.4.1. Changes in delivery vehicle selection over time .............................................. 80
3.4.2. Interpretation of delivery vehicle perceptions and use ..................................... 82
3.4.3. Willingness to use delivery vehicles in the future ............................................ 88
3.4.4. Predictors of delivery vehicle selection ............................................................ 89
3.4.5. Health-related events ........................................................................................ 89
3.4.6. Duration of the selection period ....................................................................... 90
3.4.7. Study limitations ............................................................................................... 91
3.4.8. Knowledge gained and implications for programmes and public health ......... 92
3.5. Conclusions ................................................................................................................ 93
3.6. Future directions ........................................................................................................ 95
CHAPTER 4 REFERENCES ............................................................................................ 96
CHAPTER 5 APPENDICES ........................................................................................... 105

ix
LIST OF TABLES
Table 1. Summary of reasons for low adherence within prenatal iron-folic acid
supplementation regimens in different low-income country settings.................... 9
Table 2. Calcium content of various foods available in Bangladesh................................. 13
Table 3. Relative risk for developing HDP-related outcomes given routine calcium
supplementation from RCTs in various countries with either low or adequate
baseline calcium intake........................................................................................ 18
Table 4. Effect of calcium on the absorption of haem and non-haem iron in the
presence of a meal from various studies.............................................................. 22
Table 5. Effect of calcium on the absorption of supplementary iron................................. 23
Table 6. Effect of calcium on haem and non-haem iron absorption in the
absence of a meal................................................................................................. 23
Table 7. Composition of one dose of each delivery vehicle.............................................. 31
Table 8. Schedule of data collection activities.................................................................. 38
Table 9. Personal and household socio-demographic characteristics of
participants who contributed data to the selection period.................................... 55
Table 10. Residence characteristics of participants who contributed data to the
selection period.................................................................................................... 56
Table 11. Obstetric history and past supplement or medication use from
participants who contributed data to the selection period.................................... 56

x
Table 12. Probability of delivery vehicle selection by study week and overall................... 57
Table 13. Characteristics of delivery vehicle selection from selection period data............ 57
Table 14. Selection of tablets on the day before and after each CHW home-visit
day during the selection period, among participants who did and did
not selected conventional tablets on each CHW home-visit day......................... 62
Table 15. Unadjusted associations between times and study design-related
explanatory variables and delivery vehicle selection in multinomial
logistic regression analyses, using conventional tablets as the reference
group.................................................................................................................... 64
Table 16. Delivery vehicle selection combinations made by all participants and
those who exhibited the ‘non-commitment’ selection pattern............................. 65
Table 17. Delivery vehicle selection patterns observed during the selection period
among participants............................................................................................... 66
Table 18. Likert scale responses for palatability characteristics reported by
participants from interim and post-study questionnaires..................................... 68
Table 19. Likert scale responses for the tablet-based product and ease of use
characteristics as reported by participants in interim and post-study
questionnaires. Comparisons were made between responses for the
conventional and chewable tablets for each survey............................................. 70

xi
Table 20. Likert scale responses for the powder-based product and ease of use
characteristics as reported by participant in interim and post-study
questionnaires. Comparisons were made between responses for the
flavoured and unflavoured tablets for each survey.............................................. 72
Table 21. Supplement characteristics that were reported to be responsible for
stopping supplement use...................................................................................... 73
Table 22. Summary of food and drinks most frequently reported by participants
that were mixed with the unflavoured powder during the run-in period............. 74
Table 23. Unadjusted associations between potential personal and socioeconomic
status-related explanatory variables and delivery vehicle selection in
multinomial logistic regression analyses, using conventional tablets as
the reference group.............................................................................................. 76
Table 24. Unadjusted associations between potential past supplement or medicinal
exposure-related explanatory variables and delivery vehicle selection in
multinomial logistic regression analyses, using conventional tablets as
the reference group.............................................................................................. 77
Table 25. Adjusted associations between explanatory variables and delivery vehicle
selection in multivariate multinomial logistic regression analysis, using
conventional tablets as the reference group, generated to identify
characteristics associated with delivery vehicle preference................................ 78
Table 26. Summary of the number of times health-related events were reported by
participants during weekly home-visits conducted throughout the
selection period.................................................................................................... 79
xii
LIST OF FIGURES
Figure 1. Estimated sample size to detect a given absolute detectable difference
between the proportion of days on which the least and most preferred
delivery options are selected.......................................................................... 33
Figure 2. Overview of the progression of study events for each individual
participant from enrolment to completion...................................................... 34
Figure 3. Participant screening, exclusion, and withdrawals during the study
period.............................................................................................................. 54
Figure 4. Daily frequency of delivery vehicle selections made by all participants
over the 21 day selection period..................................................................... 58
Figure 5. Weekly frequency of delivery vehicle selections made by all participants
over the selection period................................................................................. 59
Figure 6. Proportion of delivery vehicle selections made on select days by study
week................................................................................................................ 60
Figure 7. Mean proportion of delivery vehicle selections made on CHW versus
non-CHW home-visit days............................................................................. 61
Figure 8. Cumulative proportion of delivery vehicle selections made over the
selection period............................................................................................... 63
Figure 9. The three delivery vehicle selection patterns exhibited during the
selection period: early commitment; delayed commitment; and
non-commitment............................................................................................. 67

xiii
Figure 10. Likert scale responses for taste, mouth feel, aftertaste, and smell
from interim and post-study questionnaires................................................... 69
Figure 11. Participant responses for willingness to use the delivery vehicles
for free, at a cost, and the amount they would spend..................................... 75

xiv
LIST OF ABBREVIATIONS
1,25(OH)2D Vitamin D
CHW Community Health Worker
CI Confidence Interval
DRI Dietary Reference Intake
EAR Estimated Average Requirement
GRADE Grading of Recommendations Assessment, Development, and Evaluation
FAO Food and Agricultural Organization
Hb Hemoglobin
HDP Hypertensive Diseases of Pregnancy
icddr,b International Centre for Diarrheal Disease Research, Bangladesh
IOM Institute of Medicine
LiST Lives Saved Tool
LMP Last Menstrual Period
ORS Oral Rehydration Salts
PTH Parathyroid Hormone
RCT Randomized Control Trial
RDA Recommended Dietary Allowance
RRR Relative Risk Ratio
SD Standard Deviation
SickKids The Hospital for Sick Children
SMC Shimantik Maternity Centre
UNICEF United Nations Children’s Fund
UNIMMAP UNICEF/WHO/UNU International Multiple Micronutrient Preparation
UNU United Nations University
WHO World Health Organization
xv
LIST OF DEFINITIONS
Delivery vehicle: The ingestible form in which a supplement is provided to the user (e.g.,
conventional tablets).
Discrete choice: Selection of a single delivery vehicle on a single day during the selection
period.
Hypertensive diseases of pregnancy: The development of new-onset hypertension in a
pregnant woman after 20 weeks gestation, including gestational hypertension,
pre-eclampsia, and eclampsia.
Pre-eclampsia: A medical condition in pregnant women characterized by high blood pressure
and the presence of protein in the urine.
Preference: Defined operationally as the proportion of days on which each delivery vehicle was
selected during the selection period in the context of this study.
Run-in period: The 4-day period leading up to the selection period during which participants
were instructed to consume the four different delivery vehicles in a pre-determined,
randomized order.
Selection period: The 21-day period following the run-in period during which participants were
instructed to select one delivery vehicle per day of their choice.
Sprinkles: A single-dose sachet containing multiple micronutrients in a powder form. The
contents of one sachet are sprinkled onto a semi-liquid food in a process referred to
as 'home fortification.'

xvi
LIST OF APPENDICES
Appendix A Eligibility Screening Script.......................................................................... 106
Appendix B Participant Eligibility Screening Form......................................................... 109
Appendix C Eligible Participant Contact Form................................................................ 114
Appendix D Research Consent Form................................................................................ 116
Appendix E Participant Enrolment Form......................................................................... 122
Appendix F Baseline Questionnaire................................................................................. 124
Appendix G Supplement Rules Handout.......................................................................... 132
Appendix H Instructions for Supplement Use.................................................................. 134
Appendix I End of Run-in Questionnaire........................................................................ 139
Appendix J Graphics provided with Likert scale............................................................. 155
Appendix K CHW Tracking Sheet for Supplement Use – Week 1.................................. 157
Appendix L Participant Tracking Sheet for Supplement Use – Week 1.......................... 162
Appendix M CHW Tracking Sheet for Supplement Use – Week 2.................................. 164
Appendix N Participant Tracking Sheet for Supplement Use – Week 2.......................... 169
Appendix O CHW Tracking Sheet for Supplement Use – Week 3.................................. 163
xvii
Appendix P Participant Tracking Sheet for Supplement Use – Week 3.......................... 171
Appendix Q End of Study Questionnaire.......................................................................... 178
Appendix R End of Study Participation Form.................................................................. 204
Appendix S. Comparison of Enrolled and Withdrawn Participants.................................. 206

xviii
STUDENT CONTRIBUTIONS
In collaboration with my supervisors, Dr. Stanley Zlotkin and Dr. Daniel Roth, I conceptualized
and designed this study. I developed the research protocol, questionnaires, and all supporting
materials provided to participants. Ethics approval was obtained in both Toronto, Canada
(Hospital for Sick Children) and Dhaka, Bangladesh (icddr,b). Additionally, I compiled the
manual of operations (including SOPs and quality control measures) for use by study personnel
and was involved all aspects of the study in Bangladesh. This included training and supervision
of our field staff; regular site visits and involvement in all field activities; supervision of data
collection; and providing input with regards to data management and database development. I
completed all of the statistical analyses appearing here within this thesis. And, finally, wrote this
thesis in its entirety.

1
CHAPTER 1 INTRODUCTION
In 2011, the World Health Organization (WHO) released a recommendation that in areas where
dietary calcium intake is low, routine prenatal calcium supplementation with 1.5 to 2.0 grams of
elemental calcium per day is recommended for the prevention of pre-eclampsia (WHO 2011).
Although prenatal calcium supplementation is considered to be a simple, low-cost intervention,
the implementation of this recommendation is met by multiple unresolved challenges: (1) the
amount of calcium included in the recommended dose; (2) the size of conventional calcium
tablets and the number of units required; and (3) the timing complications associated with the
necessity for dose separation when supplementing with calcium and iron. To resolve these
challenges, an acceptable calcium delivery vehicle must be identified, as well as a way to take
calcium and iron concomitantly given the intra-intestinal interactions. This study focused on
finding an acceptable format for the delivery of calcium at the WHO recommended dose among
pregnant women in Bangladesh.
An important determining factor in implementing a recommendation is the selection of a
product that will be accepted by targeted users (Young et al. 2010). This can be significantly
influenced by end-user preference (the expression of appeal for a product) and acceptability (the
extent to which a product is perceived to be suitable for its intended use). A major component of
both preference and acceptability is palatability, which refers to the overall perception of a
product’s gustatory properties, such as taste, mouth feel, aftertaste, and smell. Other product
characteristics that influence acceptability within supplementation regimens include appearance,
bulk of the required dose, size, shape, formulation, and dosing frequency (Galloway 2002). It is
important to consider the contributions of all of these components as the overall effectiveness of
a micronutrient program is highly dependent on the regular consumption of supplements over a
prolonged period of time by the targeted users.
In evaluating supplement preference and acceptability within micronutrient interventions, there
is neither a consistently used methodological approach, nor a commonly recognized set of
characteristics of interest that should be assessed (Young et al. 2010). Presently, there tends to
2
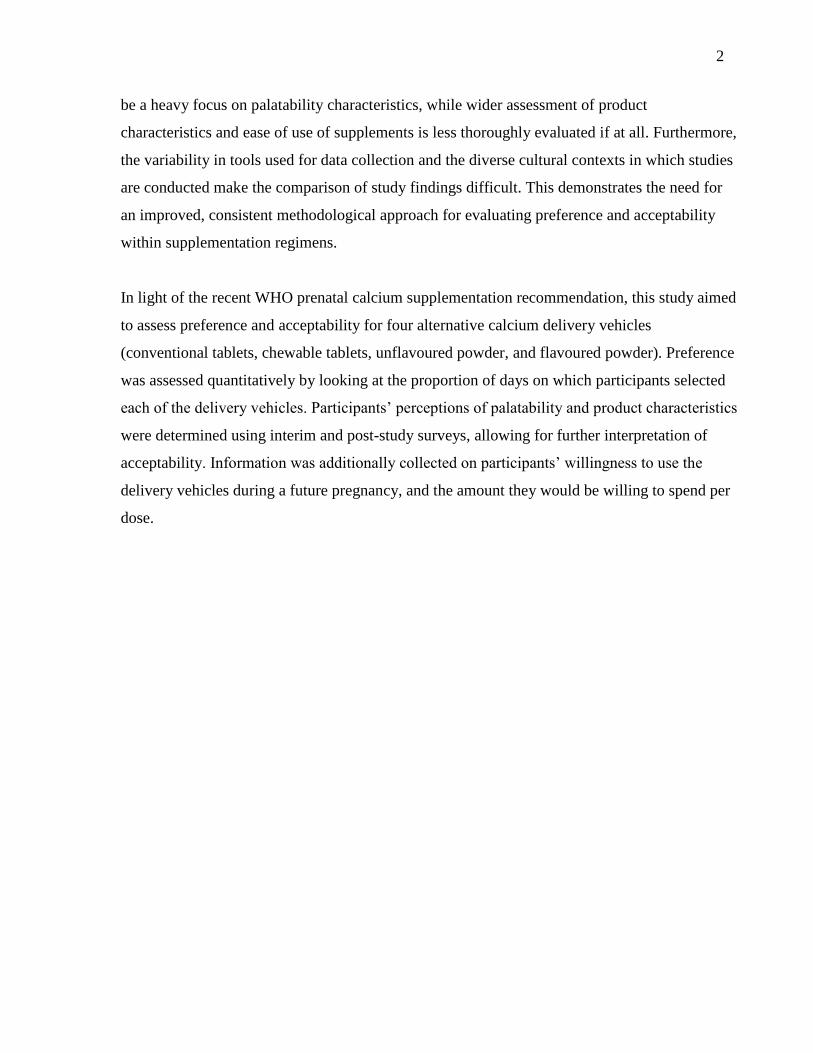
be a heavy focus on palatability characteristics, while wider assessment of product
characteristics and ease of use of supplements is less thoroughly evaluated if at all. Furthermore,
the variability in tools used for data collection and the diverse cultural contexts in which studies
are conducted make the comparison of study findings difficult. This demonstrates the need for
an improved, consistent methodological approach for evaluating preference and acceptability
within supplementation regimens.
In light of the recent WHO prenatal calcium supplementation recommendation, this study aimed
to assess preference and acceptability for four alternative calcium delivery vehicles
(conventional tablets, chewable tablets, unflavoured powder, and flavoured powder). Preference
was assessed quantitatively by looking at the proportion of days on which participants selected
each of the delivery vehicles. Participants’ perceptions of palatability and product characteristics
were determined using interim and post-study surveys, allowing for further interpretation of
acceptability. Information was additionally collected on participants’ willingness to use the
delivery vehicles during a future pregnancy, and the amount they would be willing to spend per
dose.

3
CHAPTER 2 LITERATURE REVIEW
2.1. Micronutrient requirements during pregnancy
2.1.1. Importance of micronutrients during pregnancy
Pregnancy is a dynamic period of increased metabolic demands given the associated physiologic
changes and fetal developmental requirements (King 2000). Micronutrients, which include both
vitamins and minerals, play an important role in regulating these processes (Black 2001). There
is evidence to support that inadequate maternal micronutrient status is linked to adverse events
during pregnancy (e.g., anaemia, hypertension, preterm delivery, labour complications, and
death); adverse prenatal and perinatal outcomes (e.g., intrauterine growth retardation, congenital
malformations, abnormal organ development, reduced immune function and stillbirth); poor
infant survival; and risk of chronic disease and impaired mental development later in life
(Barker 1997; Gluckman and Hanson 2004; Victora et al. 2008; Black et al. 2008; Abu-Saad
and Fraser 2010). Sufficient micronutrient intake is therefore important to both maternal and
fetal health outcomes.
2.1.2. Micronutrient deficiency and populations at risk
Micronutrient deficiency is a condition characterized by insufficient micronutrient intake,
subsequent to poor diet quality (inadequate intake) or infection (altered ability to metabolize
certain micronutrients) (Allen 2005). In low and middle-income countries, where widespread
deficiency is found, underlying micronutrient deficiencies can be exacerbated due to increased
metabolic gestational demands, making deficiencies in various micronutrients highly prevalent
among pregnant women. Key risk factors include poverty, lack of access to a variety of foods,
lack of knowledge of appropriate dietary practices, and high incidence of infectious diseases
(Black et al. 2008).
4
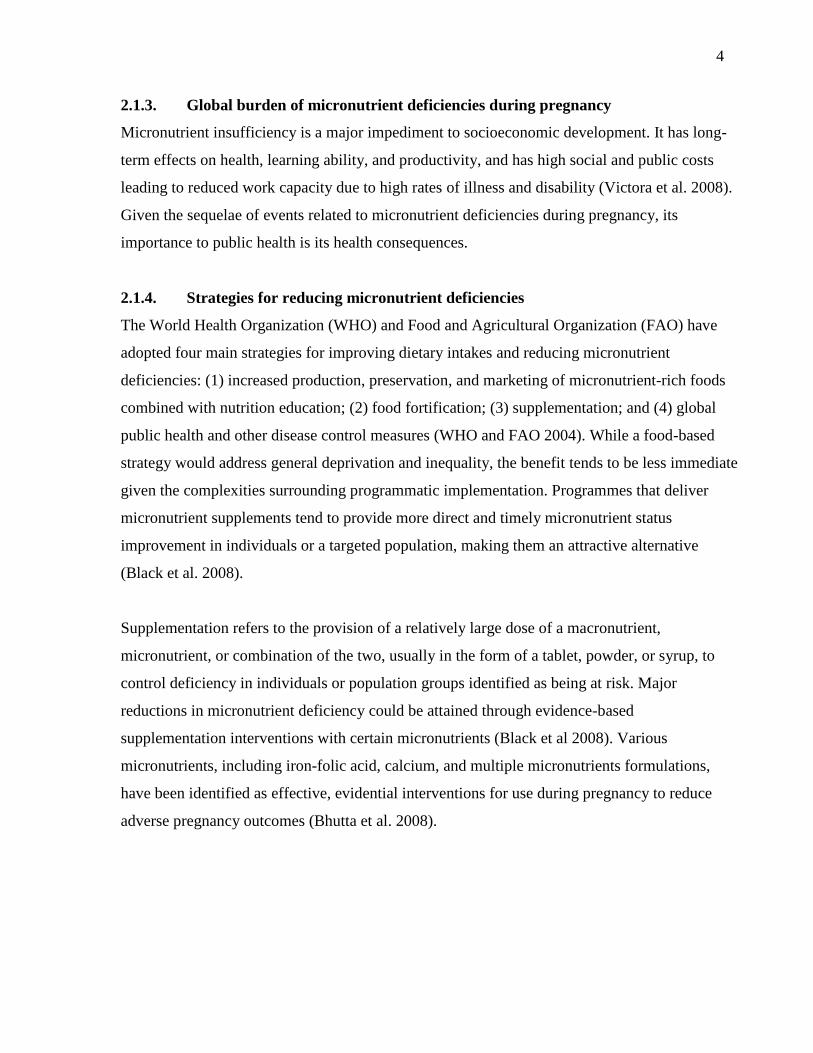
2.1.3. Global burden of micronutrient deficiencies during pregnancy
Micronutrient insufficiency is a major impediment to socioeconomic development. It has long-
term effects on health, learning ability, and productivity, and has high social and public costs
leading to reduced work capacity due to high rates of illness and disability (Victora et al. 2008).
Given the sequelae of events related to micronutrient deficiencies during pregnancy, its
importance to public health is its health consequences.
2.1.4. Strategies for reducing micronutrient deficiencies
The World Health Organization (WHO) and Food and Agricultural Organization (FAO) have
adopted four main strategies for improving dietary intakes and reducing micronutrient
deficiencies: (1) increased production, preservation, and marketing of micronutrient-rich foods
combined with nutrition education; (2) food fortification; (3) supplementation; and (4) global
public health and other disease control measures (WHO and FAO 2004). While a food-based
strategy would address general deprivation and inequality, the benefit tends to be less immediate
given the complexities surrounding programmatic implementation. Programmes that deliver
micronutrient supplements tend to provide more direct and timely micronutrient status
improvement in individuals or a targeted population, making them an attractive alternative
(Black et al. 2008).
Supplementation refers to the provision of a relatively large dose of a macronutrient,
micronutrient, or combination of the two, usually in the form of a tablet, powder, or syrup, to
control deficiency in individuals or population groups identified as being at risk. Major
reductions in micronutrient deficiency could be attained through evidence-based
supplementation interventions with certain micronutrients (Black et al 2008). Various
micronutrients, including iron-folic acid, calcium, and multiple micronutrients formulations,
have been identified as effective, evidential interventions for use during pregnancy to reduce
adverse pregnancy outcomes (Bhutta et al. 2008).

5
2.2. Targeted micronutrient supplementation strategies during pregnancy
2.2.1. Iron-folic acid supplementation
Iron deficiency is of the most widespread nutritional deficiencies in the world (Miret et al.
2003). Iron-deficiency anaemia is associated with a reduction in oxygen carrying capacity of the
blood, due to fewer circulating erythrocytes or a decrease in the concentration of haemoglobin
caused by insufficient dietary iron intake; it is known to be prevalent in developing countries,
and particularly so among pregnant women (WHO 2001). During pregnancy, iron demands
increase given the growth requirements of the fetus and placenta and maternal metabolism; this
includes tissue accretion, red blood cell mass, and expanded plasma volume (Scholl 2005).
Increased iron requirements, low pre-pregnancy iron stores, and continued inadequate dietary
intakes of iron exacerbate anaemia during pregnancy (WHO 2001). Therefore, the WHO
recommends supplementation with iron and folic acid during pregnancy. Iron supplementation
occurs in the presence of folic acid because supplementation with folic acid around the time of
conception significantly reduces the incidence of neural tube defects (Stoltzfus and Dreyfuss
1998). Much of what is known about the success and failures of adherence within
supplementation regimens comes from studies on iron-folic acid supplementation.
2.2.2. UNIMMAP
In 1998, the United Nations Children’s Fund (UNICEF), the WHO, and the United Nations
University (UNU) designed a new multiple micronutrient supplement for pregnant and lactating
women in developing countries called UNICEF/WHO/UNU international multiple
micronutrient preparation (UNIMMAP). It was developed on the basis that pregnant women in
resource-limited populations are often deficient in multiple micronutrients, and that it would be
more programmatically feasible to provide a single multiple micronutrient supplement to
women in targeted groups than to provide selected micronutrients through parallel
supplementation programmes or strategies. Intended to replace iron-folic acid supplementation
as the standard for supplementation during pregnancy, UNIMMAP contains the recommended
dietary allowance of 15 vitamins and minerals in addition to iron and folic acid; calcium,
however, was excluded because of the quantity that would need to be included and the potential
for interactions with other nutrients. Given the target size of the UNIMMAP tablet, it was felt

6
that adding calcium would increase the size too much and inevitably affect adherence (UNICEF
et al. 1999).
2.2.3. Calcium supplementation
In assessing efficacy trials of prenatal calcium supplementation on the reduction of hypertensive
diseases of pregnancy (HDP) and HDP-associated outcomes, the WHO has recently
recommended supplementation with 1.5-2.0 g elemental calcium/day when dietary calcium
intake is low to prevent pre-eclampsia (WHO 2011). To avoid potential interaction with
supplementary iron, it is suggested that the two supplements be administered several hours
apart. The recommended calcium dose derives from the amount of calcium provided to
participants within randomized control trials (RCTs), although there is not universal agreement
on the minimum dose of calcium required to see a benefit (Hofmeyr et al. 2010). This
recommended dose is greater than both the general WHO recommended calcium dose for
supplementation during pregnancy (for women worldwide; 1000 to 1200 mg/day) and the
Institute of Medicine (IOM) recommended dietary allowance (1000 mg/day).
The strength of the WHO calcium recommendation was designated as ‘strong,’ the highest level
possible, using the Grading of Recommendations Assessment, Development, and Evaluation
(GRADE) methodology, a tool for grading evidence when submitting a clinical guideline.
Prenatal calcium supplementation is a simple, low-cost intervention, yet it has not been
transitioned to scale because of at least two unresolved challenges affecting adherence within a
supplementation regimen: (1) the size of conventional calcium tablets and the number of units
required in delivering the recommend calcium dose; and (2) timing complications associated
with dose separation from iron. To resolve these challenges, it will be necessary to determine an
acceptable calcium delivery vehicle, as well as a way to take calcium and iron concomitantly
given the inhibitory nutrient-nutrient intra-intestinal interactions.
7
2.3. Preference and acceptability within supplementation regimens
2.3.1. The role of preference and acceptability
The success of a micronutrient supplementation regimen is determined in part by regular
consumption of a supplement over a prolonged period of time. This can be significantly
influenced by user preference (Cohen et al. 2011). Preference, in the context of product
evaluation, is defined as an expression of the appeal for one product versus another (Stone and
Sidel 2004). Acceptability is the extent to which a product is perceived as suitable for its
intended use. Within micronutrient supplementation regimens, palatability is a critical factor
affecting preference and acceptability. Palatability refers to a product’s gustatory properties
(taste, mouth feel, and aftertaste) and smell (Stone and Sidel 2004). Other variables that
collectively influence preference and acceptability include product characteristics (shape, size,
and formulation) and ease of use (Young et al. 2010). As micronutrient supplementation
programmes depend on sustained supplement use, it is important to consider the contributions of
all of these aforementioned components in product development assessment.
2.3.2. Adherence within micronutrient supplementation regimens
In a medical context, adherence is defined as the extent to which a patient takes a medication as
prescribed (Osterberg and Blaschke 2005). Within micronutrient supplementation regimens,
adherence may depend on the required dose, volume or number of tablets recommended, and
dosing frequency (Rees and Howe 2000; Aguayo et al. 2005; Nasrin et al. 2005; Kulkarni et al.
2010; den Uyl et al. 2010). It is important to consider factors contributing to adherence when
evaluating supplement acceptability, given its potential to influence preference.
Much of what is known about adherence within targeted micronutrient supplementation
interventions comes from studies on iron-folic acid supplementation. While it has been
previously hypothesized that low adherence is caused by failure or unwillingness to take a
treatment, factors affecting adherence are often outside of the recipient’s control. Galloway et al.
(2002) qualitatively assessed the major barriers of iron-folic acid supplementation programmes
for pregnant women in eight developing countries using a variety of techniques, including focus
group discussions, in-depth interviews, semi-structured and structured interviews, structured

8
questionnaires, and/or direct observations. The most frequent reason for non-adherence to iron-
folic acid supplementation was inadequate product availability, such as lack of supplies or
insufficient supply distribution. Other factors affecting non-adherence in the context of
pregnancy included inadequate programme support at both the governmental and community
level; insufficient service provision, including access to health centres, training of health
providers, and motivation among health care workers; and patient factors, such as
misunderstanding instructions, side effects, frustration about the frequency and number of pills
taken, and the nausea that accompanies pregnancy (Galloway and McGuire 1994) (Table 1).
Adherence can be improved by ensuring that supplements are widely available and easily
accessible; warning about possible side effects; and providing reminders, such as posters and
calendars (Galloway and McGuire 1994). For instance, a study of pregnant and lactating Malian
women found that adherence to the provided multiple micronutrient and iron-folic acid
supplements was good (95.4% and 92.2%, respectively), so long as access to supplements was
guaranteed and at a minimum, consistent and easily understandable information, and
counselling was provided (Aguayo et al. 2005).
9
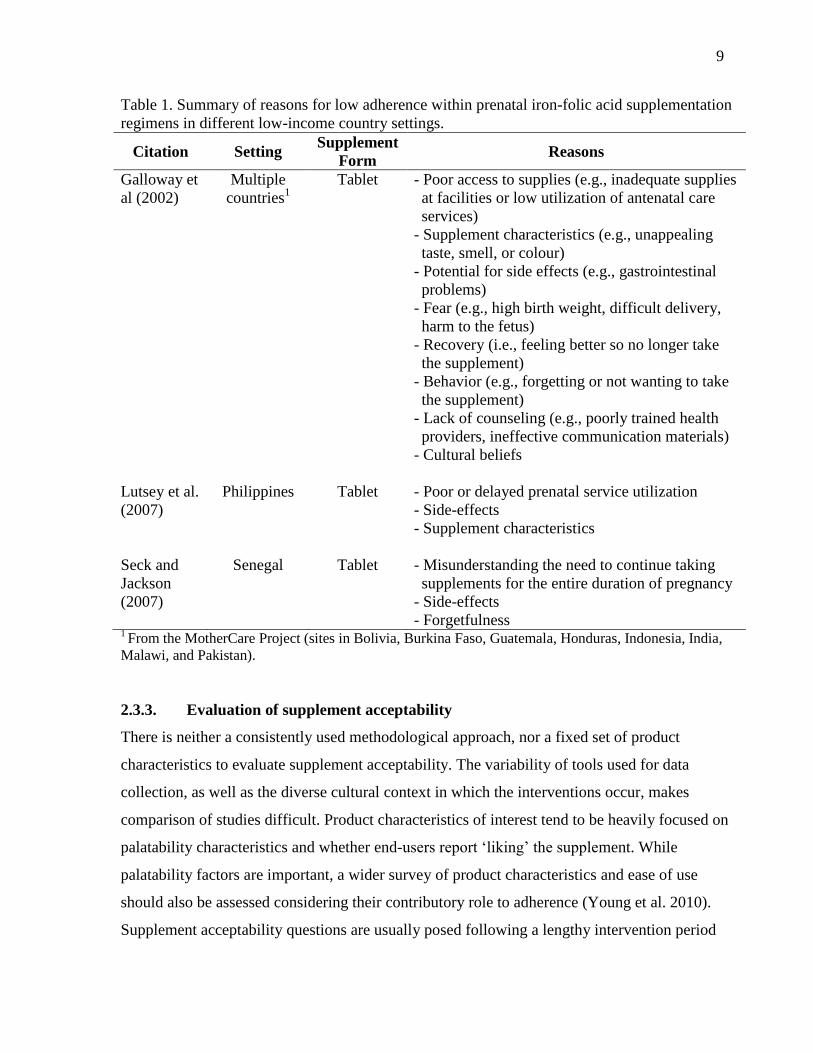
Table 1. Summary of reasons for low adherence within prenatal iron-folic acid supplementation
regimens in different low-income country settings.
Citation Setting Supplement
Form Reasons
Galloway et
al (2002)
Multiple
countries1
Tablet - Poor access to supplies (e.g., inadequate supplies
at facilities or low utilization of antenatal care
services)
- Supplement characteristics (e.g., unappealing
taste, smell, or colour)
- Potential for side effects (e.g., gastrointestinal
problems)
- Fear (e.g., high birth weight, difficult delivery,
harm to the fetus)
- Recovery (i.e., feeling better so no longer take
the supplement)
- Behavior (e.g., forgetting or not wanting to take
the supplement)
- Lack of counseling (e.g., poorly trained health
providers, ineffective communication materials)
- Cultural beliefs
Lutsey et al.
(2007)
Philippines Tablet - Poor or delayed prenatal service utilization
- Side-effects
- Supplement characteristics
Seck and
Jackson
(2007)
Senegal Tablet - Misunderstanding the need to continue taking
supplements for the entire duration of pregnancy
- Side-effects
- Forgetfulness 1 From the MotherCare Project (sites in Bolivia, Burkina Faso, Guatemala, Honduras, Indonesia, India,
Malawi, and Pakistan).
2.3.3. Evaluation of supplement acceptability
There is neither a consistently used methodological approach, nor a fixed set of product
characteristics to evaluate supplement acceptability. The variability of tools used for data
collection, as well as the diverse cultural context in which the interventions occur, makes
comparison of studies difficult. Product characteristics of interest tend to be heavily focused on
palatability characteristics and whether end-users report ‘liking’ the supplement. While
palatability factors are important, a wider survey of product characteristics and ease of use
should also be assessed considering their contributory role to adherence (Young et al. 2010).
Supplement acceptability questions are usually posed following a lengthy intervention period
10
during which participants had regular contact with study personnel, and could be subject to bias.
Given the lack of rigorous, standardized methodologies, there is a need for an improved,
consistent methodological approach for evaluating supplement acceptability in the context of
supplementation regimens.
2.3.4. Acceptability of supplement use among pregnant women in developing countries
Of the limited number of studies assessing the acceptability of supplement vehicles among
pregnant women are reports on tablets, lipid-based nutrient supplements, micronutrient powder,
and fortified food. Tablets have been employed among pregnant and lactating women in Nepal
and Mali. In Nepal, four formulations of tablets containing iron and folic acid were provided to
women in a randomized controlled supplementation trial. The general perception of the
supplements was favourable, regardless of adherence observed within the trial. Eighty-seven
percent of women indicated that they liked taking the supplement and would take it in the future
if it were offered (Kulkarni et al. 2009). In Mali, multiple micronutrient and iron-folic acid
tablets provided in a daily supplementation scheme were reported to be ‘acceptable’ in size
(94% of participants), taste (88% of participants), and colour (91% of participants; Aguayo et al.
2005). Lipid-based nutrient supplements were offered to pregnant or lactating women in Ghana.
The investigators concluded that the product was acceptable overall, as sensory qualities were
generally favourable, with the exception of some women who found the product too oily (Adu-
Afarwuah et al. 2010). Tablets, micronutrient powder (Sprinkles), and fortified food (Nutrivida)
were compared in a cluster randomized supplementation trial in Mexico (Young et al. 2010).
While participants were identified as liking all three supplements when a Likert scale was used
to assess acceptability, open-ended survey questions revealed that Sprinkles and tablets were
strongly preferred over Nutrivida. Participants disliked Nutrivida’s sensory properties and
preparatory requirements. Sprinkles were found to be easily consumed, although there were
some complaints about finding appropriate foods to mix it with and an unpleasant taste or
texture; the latter is likely explained by incorrect preparation. Comparing the tablets and
micronutrient powder, tablets were preferred because of the simplicity of use and absence of
taste or smell. Overall, the four different micronutrient supplements mentioned have the
potential to be accepted by pregnant women.

11
2.4. Hypertensive diseases of pregnancy
2.4.1. Classifications of hypertensive diseases of pregnancy and risk factors
Hypertensive diseases of pregnancy (HDP) are among the most important causes of maternal
and perinatal morbidity and mortality worldwide (Duley 2009). Included in the spectrum of
HDP are gestational hypertension, pre-eclampsia, and eclampsia. Gestational hypertension is
defined as a systolic blood pressure of at least 140 mm Hg and/or a diastolic blood pressure of at
least 90 mm Hg occurring after the 20th week of gestation in women known to be normotensive
before pregnancy. Pre-eclampsia is primarily defined as gestational hypertension in the presence
of proteinuria (the excretion of 300 mg of protein or more in the urine over a 24 hour period).
Eclampsia is characterized by one or more convulsions and/or unexplained coma in association
with the syndrome of pre-eclampsia (Sibai 2003). Clinical risk factors for HDP include chronic
hypertension; renal or cardiac disease; elevated body mass index; maternal age greater than 40
years; multiple gestation; nulliparity; previous pregnancy history of pre-eclampsia; and pre-
gestational diabetes mellitus (Leeman and Fontaine 2008). Non-medical factors include poor
prenatal care, limited access to medical facilities, and poor nutrition (Villar et al. 1983).
2.4.2. Health complications stemming from hypertensive diseases of pregnancy
Potential maternal health complications from HDP include increased risk of hypertension,
ischemic heart disease, stroke, and venous thromboembolism (Bellamy et al. 2007). Pregnancies
complicated by HDP are associated with increased risk of adverse fetal and neonatal outcomes,
such as intrauterine growth retardation, stillbirth, preterm birth, low birth weight, and cerebral
palsy (Parazzini et al. 1993; Collins 1998; Habli et al. 2007; Ananth and Basso 2010). Preterm
birth, a frequent consequence of HDP, is a leading direct cause of neonatal death, accounting for
27% (Lawn et al. 2005); it is associated with many complications including respiratory distress,
jaundice, hypoglycemia, seizures, and prolonged hospitalization (Saigal and Doyle 2008).
Secondary outcomes affecting childhood and adolescent health include increased risk of high
blood pressure, ischemic heart failure, diabetes, impaired glucose tolerance, and seizures
(Robinson 2001; Vatten et al. 2003; Tenhola et al. 2006).

12
2.4.3. Etiology of HDP
The biological mechanism responsible for the increased blood pressure observed in women with
HDP is unknown. For pre-eclampsia, the current understanding is that it involves overlapping
defects in endothelial cell function, placental angiogenesis, and immune dysfunction. Studies
have found that those affected by pre-eclampsia have increased intracellular calcium levels
within their erythrocytes, lymphocytes, and platelets (Haller et al. 1989; Hojo et al. 1999; Ray et
al. 1999). It is hypothesized that in combination with low dietary calcium intake, this may cause
the observed high blood pressure since low serum calcium levels favour parathyroid hormone
(PTH) and/or renin release. Renin is associated with the renin-angiotensin system, which plays a
role in salt balance (Resnick et al. 1986). Both PTH and renin are linked to elevated blood
pressure as their production leads to increased intracellular calcium in the vascular smooth
muscle and vasoconstriction (Belizan 1988).
2.4.4. Prevalence of hypertensive diseases of pregnancy in Bangladesh
Within Bangladesh, the risk of maternal mortality is 1 in 500. Eclampsia, one of the dominant
direct causes of obstetric death in Bangladesh, is responsible for 8.4% of deaths among all
women and 20% of obstetric deaths (Yusuf et al. 2007; Streatfield et al. 2011). The incidence of
pre-eclampsia and eclampsia is also suggested to be high, though the exact number is not known
(Hoque et al. 2008).
2.5. Calcium
2.5.1. Sources of calcium
Humans ingest calcium from food sources or supplements. Adequate intake of calcium is
necessary to replace calcium losses from the extracellular fluid and maintain biological
processes (IOM 2011).
2.5.1.1. Natural sources and fortification
Calcium is classically associated with dairy products like milk, yogurt, and cheese, as they are
calcium rich and have high bioavailability. Alternative dietary sources include green leafy

13
vegetables, fish, grains, legumes, fruit, meat, poultry, and eggs (IOM 2011) (Table 2). The
calcium bioavailability within some of these sources, however, is variable as they can contain
calcium absorption inhibitors which disturb calcium bioavailability, like phytates (e.g. grains
and legumes) and oxalates (e.g. green leafy vegetables) (Gibson et al. 2006). In some high-
income countries, fortification of certain foods that do not naturally contain calcium, like orange
juice and ready-to eat cereals, has become more common (IOM 2011).
Table 2. Calcium content of various foods available in Bangladesh.
Food Group Food Item Calcium content
1
(mg per 100 g edible portion)
Fruits and vegetables Spinach
Cabbage
Orange
Mango
Cucumber
Banana
Potato
96
31
31
16
14
13
11
Grain products Bread
Rice
18
10
Dairy products Cheese
Yogurt
Milk
790
149
120
Meat and alternatives Fish (dried)
Fish
Peanuts
Lentils
Beans
Egg
Chicken
Beef
1572
351
77
69
60
60
25
10 1 Adapted from the Helen Keller International and World Food Programme (1988) Food Composition
Tables for Bangladesh.
2.5.1.2. Supplementation
For individuals who do not consume adequate amounts of calcium from dietary sources, the use
of calcium supplements is often recommended. The bioavailability of calcium varies between
supplements depending on the calcium salt used, and whether it is taken in the presence or
absence of a meal (Heaney et al. 1990). The most common forms of supplemental calcium are
14
calcium carbonate and calcium citrate. Most supplements tend to contain calcium carbonate
since calcium carbonate provides about 40 percent elemental calcium, compared to 21 percent in
calcium citrate (IOM 2011). Thus fewer tablets are required to achieve a given dose of
elemental calcium. Calcium supplements are typically provided at 300 to 600 mg per dosing
unit.
2.5.2. Calcium absorption
Calcium absorption occurs through two independent processes in the small intestine. The first
process involves active transport of the calcium, as it is dependent on vitamin D levels; this
process occurs within the duodenum and is transcellular, meaning it must pass through cells to
reach the extracellular fluid. The second process involves passive transport of the calcium in the
ileum and jejunum via a paracellular process, meaning it passes between cells. It is suggested
that calcium absorption is most efficient in the duodenum, though this method is saturable.
Since the time spent in the duodenum is limited, the majority of the calcium load may be
absorbed from the ileum and jejunum via a non-saturable method (Behar and Kernstein 1976;
Bronner 2003). The exact site of calcium absorption is not well understood at this time, possibly
because the underlying research is based on rat models (Wasserman 2004). Though rats and
humans exhibit basic gastrointestinal structural similarities, gross morphology does differ
(Kararli 1995).
2.5.3. Role and maintenance of calcium during pregnancy
During pregnancy, calcium is in demand due to the rapid mineralization of the fetal skeleton
(Heaney 1971). There is an increase in calcium absorption during late pregnancy which is the
time of greatest fetal growth. The mechanism responsible for increased calcium absorption
during pregnancy is not well understood. Under normal conditions, when serum calcium levels
fall, they are returned to normal by PTH secretion. Alternatively, elevated levels of serum
calcium inhibit the secretion of PTH and the production of 1,25-dihydroxyvitamin D
(1,25(OH)2D), the active form of vitamin D. PTH and 1,25(OH)2D function together to maintain
maternal serum calcium concentrations via three mechanisms: (1) increased fractional calcium
absorption in the intestine; (2) mobilization of calcium from maternal bone stores; and (3) renal
re-absorption (Black et al. 2000; Naylor et al. 2000). While it is reported that the serum
15
concentration of PTH either decreases or does not change during normal pregnancy, there is a
marked increase in 1,25(OH)2D (Cross et al. 1995; Ritchie et al. 1998). It remains unclear as to
how 1,25(OH) 2D increases in the absence of elevated PTH given that the two function together.
However, the increase in 1,25(OH)2D might explain the increase in calcium absorption in the
intestine, since one of the calcium absorption pathways is vitamin D dependent. The
1,25(OH)2D increase is most notable during the third trimester, corresponding with the time of
greatest fetal growth (Gallacher et al. 1994).
2.5.4. Nutritional recommendations for calcium intake during pregnancy
In their guidelines for maintaining general dietary wellness, the WHO recommends a total
dietary calcium intake of 1000 mg/day during the first two trimesters of pregnancy, and 1200
mg/day during the third trimester (WHO and FAO 2004). This is based on North American and
western European data, as reference values for low and middle-income settings do not exist.
In the Dietary Reference Intakes (DRI) generated by the IOM at the request of the United States
and Canadian governments, two measures are used as guidelines for dietary calcium intake
during pregnancy: (1) an average daily requirement for the nutrient, known as the Estimated
Average Requirement (EAR); and (2) the level of intake that would be likely to meet the needs
of about 97.5 percent of the population, known as the Recommended Dietary Allowance (RDA).
For women 14 to 18 years of age, the EAR and RDA during pregnancy are 1,100 and 1,300 mg,
respectively. The EAR and RDA for pregnant women ages 19-50 years are 800 and 1,000 mg,
respectively. Both nutrient reference values are greater for those in the 14 to 18 years of age
group given one's increased calcium needs during adolescence for bone accretion.
Recommendations made by the IOM were generated assuming a healthy population (IOM
2011).
2.5.5. Calcium status of women in Bangladesh
In South Asia, there is a high prevalence of low dietary calcium intake. Few calcium-rich foods
are consumed, as dietary staples consist of rice, lentils, and green leafy vegetables containing
high levels of phytates and oxalates which are known to inhibit calcium absorption (Harinarayan

16
et al. 2004). Cadmium, a mineral found in the soil in many Bangladeshi districts due to its use in
cheap fertilizers and pesticides, has an inverse relationship with calcium absorption and can
inhibit the transport of calcium into the bloodstream (Kippler et al. 2009).
Recent estimates of dietary calcium intake in Bangladesh are not available. A study of
households in two sub-districts, Manikganj and Mymensingh, found that dietary calcium intake
was around 360 mg/day using food weighing (Hels et al. 2003), although these data are from
nearly 20 years ago. In a study of premenopausal women in Bangladesh conducted nearly a
decade ago, it was observed that 95% of women of low-socioeconomic status and 47% of
women of high-socioeconomic status consumed less than 400 mg/day of calcium on average
(Islam et al. 2003). A reference value of 400 mg/day of calcium was used in this analysis as this
was the lower limit for the RDA for calcium set by the WHO at the time (FAO and WHO 1962).
The difference between the socioeconomic groups was due to consumption of different dietary
components, primarily dairy products. The WHO’s recommended calcium allowance has since
been updated to 1000 mg/day during the first two trimesters and 1200 mg/day during the third
trimester (WHO and FAO 2004), thus both studies would point towards widespread calcium
insufficiency. Bangladeshi women are clearly likely to have low dietary calcium intake during
pregnancy and could benefit from supplementation.
2.6. Hypertensive diseases of pregnancy and calcium supplementation
2.6.1. Early observational evidence for the role of calcium in the prevention of
hypertensive diseases of pregnancy
One potential intervention strategy for reducing the risk of HDP, and particularly pre-eclampsia,
is calcium supplementation, given the inverse correlation that has been described between
calcium intake and the incidence of HDP.
The association between calcium intake and HDP was first demonstrated in an early ecologic
study of Mayan Indians in Guatemala. Using dietary surveys, Belizan and Villar (1980) found
that pregnant, lower-socioeconomic status women in this population had a daily calcium intake
17
ranging from 787 mg/day in urban areas to 1320 mg/day in rural populations. This relatively
high calcium intake has been attributed to the practice of soaking corn, a dietary staple, in lime
(calcium hydroxide) prior to consumption. The incidence of eclampsia and pre-eclampsia
among these women was very low, despite the presence of non-medical risk factors that would
have been expected to favour the disease such as poor prenatal care, limited access to medical
facilities, and poor nutrition. In an earlier study, Hamlin (1962) similarly noted a very low
incidence (0.75%) of toxaemia, a term used at that time to refer to both pre-eclampsia and
eclampsia, among pregnant women in Ethiopia in spite of non-medical risk factors favouring the
disease. High dietary calcium intake was one of many possible factors suggested to be
responsible at the time; dietary surveys have since been used to determine that the median
dietary calcium intake of Ethiopians adults is 1075 mg/day (Belizan and Villar 1980).
These findings led to the hypothesis that an increase in calcium intake during pregnancy might
reduce the incidence of high blood pressure and pre-eclampsia among women with low dietary
calcium intake (Villar et al. 1983). It has also been hypothesized that low dietary calcium intake
may be a cause of pre-eclampsia (Patterson 1984). One study found that low milk intake during
pregnancy was associated with an increased risk of pre-eclampsia (Richardson and Baird 1995).
The WHO (2005) estimates the incidence of pre-eclampsia to be seven times higher in
developing countries than developed countries (2.8% versus 0.4% of live births), with a high
prevalence of low dietary calcium intake observed in many of these developing countries. It is
hard, however, to elucidate whether the increased incidence of pre-eclampsia in developing
countries is because of low dietary calcium intake, since there is an increase in the non-medical
risk factors that also favour the disease (Duley 2009).
2.6.2. Randomized control trials of the HDP-calcium association
Randomized control trials (RCT) testing whether the association between calcium intake and the
incidence of HDP was causal began in the late 1980s. The data suggest that calcium
supplementation is associated with reduced HDP; the extent to which this effect is observed is
dependent on calcium status and pre-existing risk factors (Ritchie and King 2000). A significant
decrease in the relative risk of high blood pressure and pre-eclampsia with calcium
supplementation has been noted in RCTs conducted in countries with known low dietary

18
calcium intake, such as Argentina, Ecuador, and India (Lopez-Jaramillo et al. 1989; Lopez-
Jaramillo et al. 1990; Belizan et al. 1991; Purwar 1996; Lopez-Jaramillo et al. 1997; Kumar et
al. 2009); however, in countries where calcium intakes are high (United States and Australia), a
significant decrease was not observed (Villar and Reptke 1990; Levine et al. 1997; Crowther et
al. 1999) (Table 3).
Table 3. Relative risk for developing HDP-related outcomes (high blood pressure, pre-
eclampsia, and preterm birth) given routine calcium supplementation from RCTs in various
countries with either low or adequate baseline calcium intake. (Adapted from Hofmeyr et al.
2010)
Author Year Location Baseline
Ca
intake1
Outcomes2
High blood
pressure Pre-
eclampsia Preterm
birth Lopez-
Jaramillo et al. 1989 Ecuador low
0.15 [0.04, 0.66]
0.15 [0.04, 0.66]
not
reported Lopez-
Jaramillo et al. 1990 Ecuador low
0.19 [0.07, 0.57]
0.09 [0.01, 1.48]
0.17 [0.01, 2.99]
Belizan et al. 1991 Argentina low 0.67
[0.49, 0.91] 0.66
[0.35, 1.26] 0.92
[0.58, 1.44] Sanchez-
Ramos et al. 1994 USA low
0.48 [0.26, 0.87]
0.31 [0.12, 0.84]
0.73 [0.27, 1.99]
Purwar et al. 1996 India low 0.28
[0.14, 0.59] 0.17
[0.04, 0.77]
0.32 [0.007,
1.54] Lopez-
Jaramillo et al. 1997 Ecuador low not reported
0.21 [0.07, 0.58]
no cases
observed
Kumar et al. 2009 India low 0.34
[0.17, 0.66] 0.34
[0.17, 0.66] 0.55
[0.32, 0.94]
World Health
Organization
(WHO) 2006
Multiple locations
(Argentina, Egypt,
India, Peru, South
Africa, and
Vietnam)
low 0.95
[0.86, 1.05] 0.92
[0.75, 1.13] 0.90
[0.80, 1.04]
Villar et al. 1987 USA and
Argentina adequate
0.36 [0.04, 3.24]
0.36 [0.04, 3.24]
no cases
observed
Villar et al. 1990 USA adequate 0.37
[0.10, 1.34] 0.14
[0.01, 2.67] 0.35
[0.16, 0.80]
Levine et al. 1997 USA university
centres adequate
0.91 [0.82, 1.00]
0.94 [0.77, 1.16]
1.09 [0.92, 1/29]
Crowther et al. 1999 Australia adequate 0.90
[ 0.59, 1.38] 0.44
[0.21, 0.90] 0.44
[0.21, 0.90] 1 Low calcium defined as <900mg/day; adequate calcium defined as >900mg/day.
2 Outcomes expressed as relative risk [confidence interval (CI)] for developing HDP-related outcomes
given calcium supplementation versus no calcium supplementation.

19
In a double-blind randomized multicentre trial of prenatal calcium supplementation, the WHO
wanted to determine whether calcium supplementation among pregnant women with low
calcium intake would reduce the primary outcomes of pre-eclampsia and preterm delivery
and/or the secondary outcomes of maternal morbidity and neonatal mortality (Villar et al. 2006).
Although calcium supplementation was associated with non-statistically significant decreases
for pre-eclampsia (risk ratio: 0.91; 95% CI: 0.69 to 1.19) and preterm birth (risk ratio: 0.82; 95%
CI: 0.67 to 1.01), there were significant decreases in secondary outcomes, including maternal
morbidity (risk ratio: 0.80; 95% CI: 0.70 to 0.91) and neonatal mortality (risk ratio: 0.70; 95%
CI: 0.56 to 0.88). The researchers suggest that the study was powered insufficiently to detect a
reduction in the incidence of pre-eclampsia given calcium supplementation, and that the
reduction in secondary outcomes was of clinical relevance.
2.6.3. Support for calcium supplementation from systematic review and meta-analysis
In a Cochrane review, Hofmeyr et al. (2010) considered the results of thirteen well designed,
double-blind randomized control trials, involving 15,730 women. Most of these studies assessed
only nulliparous or primiparous women at low risk for hypertensive disorders, and all trials
compared calcium supplementation with placebo or no treatment. It was concluded that calcium
supplementation with at least 1 g of calcium reduced the risk of pre-eclampsia by 55% (95% CI
0.31 to 0.65), gestational hypertension by 35% (95% CI 0.53 to 0.81), maternal HDP-related
mortality or morbidity by 20% (95% CI 0.65 to 0.97), and preterm birth by 24% (95% CI 0.60
to 0.97). Women with low baseline calcium intakes were among those for whom the greatest
reduction in pre-eclampsia was seen.
In a separate meta-analysis focused on low-income settings, Imdad et al. (2011) considered ten
randomized control trials conducted in low and middle income countries: Argentina, Ecuador,
India, Iran, Turkey, and the WHO multicentre trial. It was found that calcium supplementation
during pregnancy reduced all pregnancy-induced hypertensive disorders, with reductions of
59% in pre-eclampsia and 12% in preterm birth. The researchers additionally looked at the
feasibility of providing calcium supplementation to rural communities using the Lives Save
Tool (LiST), an evidence-based decision-making tool for the evaluation of the efficacy of
20
targeted interventions. It was concluded that prenatal calcium supplementation was the only
intervention aimed to prevent HDP that could be feasibly delivered at the community level.
2.6.4. Potential benefit of calcium supplementation for the prevention of hypertensive
diseases of pregnancy in Bangladesh
A study of calcium supplementation during pregnancy to prevent HDP has not been conducted
in Bangladesh. However, the observed low dietary calcium intake and high incidence of HDP
collectively suggest that Bangladeshi women would potentially benefit from dietary calcium
supplementation.
2.6.5. Mechanism of calcium supplementation in the prevention of pre-eclampsia
The manner in which calcium supplementation reduces the risk of HDP is unknown, though
most likely related to an overall improvement in calcium nutriture. A possible mechanism for
calcium supplementation may be that it reduces PTH release, thereby reducing intracellular
calcium and smooth muscle contractility, and promoting vasodilation; PTH is also known to
affect renin production (Resnick et al. 1986). In terms of placental function, calcium
supplementation could also be involved in the reduction of uterine smooth muscle contractility,
thus preventing preterm labour and delivery (Villar 1990). Carroli (2010) found that calcium
supplementation affects uteroplacental blood flow, in that it lowers the resistance index in
uterine and umbilical arteries.
2.7. Calcium and iron interactions
2.7.1. Studies examining calcium-iron interactions
Reports of the extent to which calcium from supplemental and dietary sources inhibit iron
absorption have been inconsistent. Different studies have looked at different doses of various
calcium salts and their effect on the absorption of either haem or non-haem iron in the presence
or absence of a meal. The results of the following studies are summarized in Tables 4-6. Cook et
al. (1991) showed that when taken with food, calcium carbonate, calcium citrate, or calcium

21
phosphate inhibited the absorption of an iron supplement as ferrous sulphate and of dietary non-
haem iron. However, when provided with water, calcium carbonate did not significantly inhibit
iron absorption, yet calcium citrate and calcium phosphate reduced iron absorption by 49% and
62%, respectively. Hallberg et al. (1991) demonstrated that the addition of 40-300 mg of
calcium as calcium chloride to wheat rolls had a dose-dependent inhibitory effect on the
absorption of non-haem iron. Similar inhibitory effects of calcium on iron retention were
reported in post-menopausal women consuming calcium carbonate supplements with meals
(Dawson-Hughes et al. 1986). A recent study looking at supplementation with calcium chloride
suggested that the inhibitory effect of calcium on iron absorption occurs only at doses higher
than approximately 800 mg calcium chloride (Gaitan et al. 2011). The ingestion of calcium
chloride on an empty stomach in this study led to a 49.6% decrease in non-haem iron absorption
when the calcium doses were ≥ 1000 mg and a 37.7% decrease in haem iron absorption at an
800 mg calcium dose. This led the authors to conclude that calcium doses <800 mg do not
impair iron absorption. In a subsequent response to this article, it was suggested that while no
statistical significance was observed for the lower doses, the 30% difference in iron absorption
when comparing no calcium supplementation to 800 mg might reflect a methodological
weakness in that day-to-day variation in iron absorption which was not included as a covariate
(Hoppe and Hulthén 2012). Overall, absorption studies reflect that the interaction between
calcium and iron is complex, and that the extent to which the nutrient-nutrient interaction occurs
appears to be dependent on the calcium salt, dose, and foods consumed with the supplements.

22
Table 4. Effect of calcium on the absorption of haem and non-haem iron in the presence of a
meal from various studies.
Calcium
source Dose
(mg) Meal
Calcium
content of
meal
(mg)
Iron
absorption
ratio1
Reference
Calcium chloride 40-600
2 Wheat rolls 20 0.61-0.23 Hallberg et al. (1991)
40-6003 Wheat rolls 20 1.0-0.41 Hallberg et al. (1991)
165 Hamburger NR4
0.59 Hallberg et al. (1992)
165 Wheat rolls NR4 0.52 Hallberg et al. (1992)
Calcium carbonate
500 Breakfast 227 0.43 Dawson-Hughes et al.
(1986) 600 Hamburger 141 0.68 Cook et al. (1991)
600 Breakfast 597 0.58 Cook et al. (1991) Calcium phosphate 600 Hamburger 141 0.61 Cook et al. (1991)
600 Breakfast 597 0.37 Cook et al. (1991) Calcium citrate 600 Hamburger 141 0.89 Cook et al. (1991)
600 Breakfast 597 0.43 Cook et al. (1991) 1 Absorption with calcium supplement : absorption without calcium supplement.
2 As calcium chloride added before baking dough.
3 As calcium chloride added after baking.
4 NR = not reported.

23
Table 5. Effect of calcium on the absorption of supplementary iron. (Adapted from Cook et al.
1991)
Calcium
source Ca dose
(mg)
Iron
supplement1
dose Meal
Ca content
of meal
(mg)
Iron
absorption
ratio2
Calcium carbonate 300 37 None 0 0.85
300 37 Hamburger 141 0.76
600 18 None 0 0.91
600 18 Hamburger 141 0.84 Calcium phosphate 600 18 None 0 0.38
600 18 Hamburger 141 0.43 Calcium citrate 600 18 None 0 0.51
600 18 Hamburger 141 0.60 1 As ferrous sulphate.
2 Iron absorption with calcium supplement : iron absorption without calcium supplement.
Table 6. Effect of calcium (as calcium chloride) on haem (as 5 mg concentrated red blood cells)
and non-haem (as 5 mg ferrous sulphate) iron absorption in the absence of a meal. (Adapted
from Gaitan et al. 2011)
Calcium dose
Fe supplement dose Iron absorption ratio1
200 non-haem 0.89 200 haem 0.83 400 non-haem 0.85 400 haem 0.83 500 haem 0.81 600 haem 0.86 700 haem 0.91 800 non-haem 0.66 800 haem 0.62 1000 non-haem 0.50 1250 non-haem 0.60 1500 non-haem 0.62
1 Iron absorption with calcium supplement : iron absorption without calcium supplement.
2.7.2. Mechanism of calcium-iron interactions
Calcium is known to interfere with iron absorption from dietary and supplemental sources in a
dose-dependent and dose-saturable manner (Hallberg et al. 1992). The exact manner in which
calcium influences iron absorption has not been elucidated. The two are absorbed by different
mechanisms (Gunshin et al. 1997; Rouault 2005). There are two possible locations of

24
interference: (1) within the lumen; and (2) within the enterocytes of the small intestine. Some
suggest that calcium acts on the luminal surface receptors that mediate iron uptake into the
enterocytes because iron and calcium are absorbed by independent cellular mechanisms and
other dietary factors known to make iron more or less bioavailable for absorption act in this
manner (Lynch 2000). However, since calcium is known to inhibit haem and non-haem iron to
the same extent and these two kinds of iron are absorbed by different receptors on the mucosal
surface, competition for an intercellular mechanism within the enterocyte may be more plausible
(Hallberg et al. 1991; Hallberg et al. 1992). In this case, competitive inhibition is suggested to
occur between calcium and iron in a final transport step common to both dietary sources of iron
within the enterocyte to the circulatory system.
2.8. Concomitant administration of calcium-iron supplementation during
pregnancy
2.8.1. Challenges associated with the WHO calcium and iron supplementation
regimens
Because the WHO recommends iron and folic acid supplementation during pregnancy as part of
routine antenatal care, the interaction between iron and calcium supplements must be considered
before the introduction of widespread calcium supplementation as a public health measure.
Presently, the WHO has recommended that iron and calcium supplements be administered
several hours apart (e.g., a morning and evening dose) in an effort to avoid concomitant
administration (WHO 2011). In the WHO calcium trial, participants were asked to consume the
provided calcium supplements at meal time and greater than three hours after taking any iron
supplements (Villar et al. 2006). At this time, there has been no report of the introduction of a
successful supplementation regimen in which individuals were required to take two different
supplements. Whether dose separation in this manner and taking multiple types of supplements
is reasonable in a real-world setting is questionable, particularly in light of existing factors
concerning adherence.
25
2.8.2. An innovative microencapsulated prenatal supplement powder containing
calcium and iron
To address the issue of nutrient-nutrient interactions between calcium and iron, our SickKids-
led research team has developed a micronutrient powder including microencapsulated calcium
carbonate. Microencapsulation is a process by which tiny clusters of micronutrients are
embedded in digestible coatings. The coating used for microencapsulation can be modified
depending on the desired properties. We have elected to use a pH-sensitive enteric coating,
which will facilitate the delayed release of calcium starting around pH 5.5, which is
characteristic of the mid-duodenum. The iron is also encapsulated, but with a coating that
enables release after a certain time period (targeted as 20 minutes following ingestion). This
dual-encapsulation innovation will potentially facilitate the independent absorption of both iron
and calcium by minimizing their intra-intestinal interactions, as iron is suggested to be optimally
absorbed in the proximal duodenum at an acidic pH (Miret et al. 2003). This innovative
technology can be applied for use in either a tablet or powder based formulation. Once the
microencapsulated prenatal supplement is developed and tested, a vital next step is to determine
the most acceptable vehicle (tablet or powder-based) to deliver the encapsulated calcium and
iron to pregnant women.

26
CHAPTER 3 PREFERENCE AND ACCEPTABILITY OF
ALTERNATIVE DELIVERY VEHICLES FOR PRENATAL
CALCIUM SUPPLEMENTATION AMONG PREGNANT
WOMEN IN BANGLADESH
3.1. Introduction
3.1.1. Rationale
Although not yet widely implemented, the WHO has recently recommended supplementation
with 1.5-2.0 grams of elemental calcium/day when dietary calcium intake is low to prevent pre-
eclampsia (WHO 2011). Challenges associated with the implementation of prenatal calcium
supplementation include the amount of calcium in the recommended dose and the complexity
surrounding simultaneous calcium-iron supplementation. An important factor in implementing
this recommendation will be the selection of a supplement that will be readily accepted by
targeted end-users.
In general, there is a limited understanding of women’s perceptions and preferences for prenatal
supplementation (Young et al. 2010). No studies have been conducted to look at the preference
and acceptability of different calcium delivery vehicles at the WHO recommended dose for use
in populations with low dietary calcium intake. Within Bangladesh, women are known to have
low dietary calcium intake, independent of socioeconomic status, thus they could benefit from
calcium supplementation during pregnancy (Islam et al. 2003). Given the lack of understanding
of factors affecting delivery vehicle acceptability in general and in the context of pregnancy,
specifically, evaluation of the actual use and perceptions of Bangladeshi women for alternative
delivery vehicles for prenatal calcium supplementation will add to the limited knowledge on this
topic and aid in identifying the most appropriate and acceptable delivery vehicle for future use.

27
3.1.2. Hypothesis and objectives
The overall goal of this study was to evaluate the preference and acceptability of four different
delivery vehicles for prenatal calcium supplementation among pregnant women in Bangladesh
(conventional tablets, chewable tablets, and flavoured and unflavoured powder).
We hypothesized that the formulation of the delivery vehicle would impact preference and
acceptability.
3.1.2.1. Primary objective
The primary objectives of this study were:
i. To quantitatively assess preference and acceptability for each of the four prenatal
micronutrient supplement delivery vehicles among pregnant women in Bangladesh by
measuring the average proportion of days on which each delivery vehicle was chosen
by participants during a three week selection period.
3.1.2.2. Secondary objectives
The secondary objectives of this study were:
Among pregnant women in Bangladesh,
i. To assess the palatability and perceived ease of use of each of the four delivery
vehicles based on structured interviews.
ii. To identify personal and household characteristics associated with the selection of each
of the four delivery vehicles.
iii. To evaluate willingness to use and purchase each of the four delivery vehicles and the
amount that one would spend per dose.
iv. To describe the different foods and drinks used in combination with the powdered
delivery vehicles during consumption.

28
3.2. Methodology
3.2.1. Study design
A standard methodological approach for assessing micronutrient supplement preference and
acceptability has not been developed. Food-related preference assessment has traditionally been
evaluated either by conducting paired comparison experiments where participants must choose
between two similar products at a set point in time, or using a rating scale. Both of these
methods have associated limitations. Paired comparison experiments occur at a fixed point in
time and do not account for choice sustainability (Stone and Sidel 2004), while rating scales can
be ineffective if respondents do not differentiate between perceived 'good' attributes and rate all
options as attractive (Young et al. 2010).
The design implemented in this study was a novel methodological approach modelled after a
discrete choice experimental design. In a discrete choice experimental design, participants are
provided with a ‘choice set’ containing two or more alternative products that vary by
characteristics of interest, and asked to make a discrete choice that is presumably utility-
maximizing (Ryan et al. 2005). According to our design, participants were provided with four
alternative delivery vehicles and asked to choose which delivery vehicle they consumed on any
given day during the selection period, following a run-in period. We believed that observation of
participants' unconstrained selection from the four alternative calcium delivery vehicles over the
prolonged period of time and in a real-world setting (their homes) would reflect actual
preference, and increase the interpretability of the participants’ choices. Interim and post-study
surveys additionally allowed us to assess subjective acceptability.
3.2.2. Study setting
This study was conducted at the Shimantik Maternity Centre (SMC) in Khilgaon, a thana (sub-
district) located in Dhaka, the capital of Bangladesh, from November 2012 to March 2013.
Khilgaon is a fair representation of urban Bangladesh, given the health and poverty
characteristics of its inhabitants (NIPORT et al. 2009).

29
3.2.3. Study collaborative partner
This study was conducted as a collaborative project involving the Hospital for Sick Children
(SickKids), the International Centre for Diarrheal Disease Research, Bangladesh (icddr,b), and
Shimantik. icddr,b is an international health research institution located in Dhaka, Bangladesh.
In collaboration with various international academic and research institutions, icddr,b conducts a
wide variety of research, training, and programme-based activities throughout Bangladesh.
Shimantik is a non-governmental health and development organization with a maternity centre
(SMC) located in Khilgaon, Dhaka South City Corporation. It provides a wide range of health-
related activities to its catchment area, including primary health care, reproductive health
services, family planning, and antenatal care (Shimantik 2012). The population of its catchment
area is approximately 251,800 (Shimantik 2011). Most inhabitants of this area have migrated
from outlying rural areas and villages, and some live in non-permanent housing.
3.2.4. Study subjects
The subjects recruited to this study were pregnant women living in the Khilgaon neighbourhood
surrounding the SMC who reported to the centre to use their services or were identified by
community health workers (CHWs) within the neighbourhood. Approximately 269 pregnant
women were screened, of whom 149 were recruited to the study as they were found to meet the
following inclusion and exclusion criteria.
3.2.4.1. Inclusion criteria
Age 18 to <40 years.
Gestational age of 13-30 completed weeks, as estimated based on the recalled first
day of the last menstrual period (LMP).
Current residence in Dhaka at a fixed address. This criterion was required as
participants had to describe a location at which they could be located for home
visits.
Self-reported plan to remain in Dhaka for the duration of the study (approximately 1
month).

30
3.2.4.2. Exclusion criteria
Reported complications within the current pregnancy (excessive bleeding,
threatened abortion, high blood pressure, pre-eclampsia, preterm labour pains, mal-
presentation, multiple gestation, hospitalization), based on self-report.
Complicated medical or obstetric history (pre-eclampsia/toxemia, antenatal
hemorrhage, very preterm birth, completed or threatened abortion) that may increase
the risk of preterm birth or prenatal complications, based on self-report.
Moderate or severe anaemia (hemoglobin (Hb) concentration <90 g/L, assessed by
Hemocue).
3.2.5. Ethical approval
The study protocol and all associated documents were reviewed and approved by the Research
Ethics Board at the Hospital for Sick Children (Toronto, Canada), and by the Ethical Review
Committee and Research Review Committee at icddr,b (Dhaka, Bangladesh). All participants
provided signed informed consent prior to participating in the study. This study was registered
as a clinical trial on the clinicaltrials.gov protocol registration website (NCT01676636).
3.2.6. Prenatal calcium supplementation formulations
Oral supplementation is a common approach to improving calcium status of populations where
dietary intake is insufficient to meet the RDA (IOM 2011). Study subjects were provided with 4
alternative prenatal calcium supplementation options (delivery vehicles): conventional tablets,
chewable tablets, unflavoured powder, and flavoured powder.
3.2.6.1. Delivery vehicle composition
The composition of each delivery vehicle was consistent with the WHO recommendations for
calcium supplementation during pregnancy (WHO 2001; WHO 2011). Each delivery vehicle
contained the equivalent of 1500 mg of elemental calcium, provided in the form of calcium
carbonate. Calcium carbonate is the most commonly used calcium salt for calcium
supplementation, as it is inexpensive and contains a greater amount of elemental calcium per
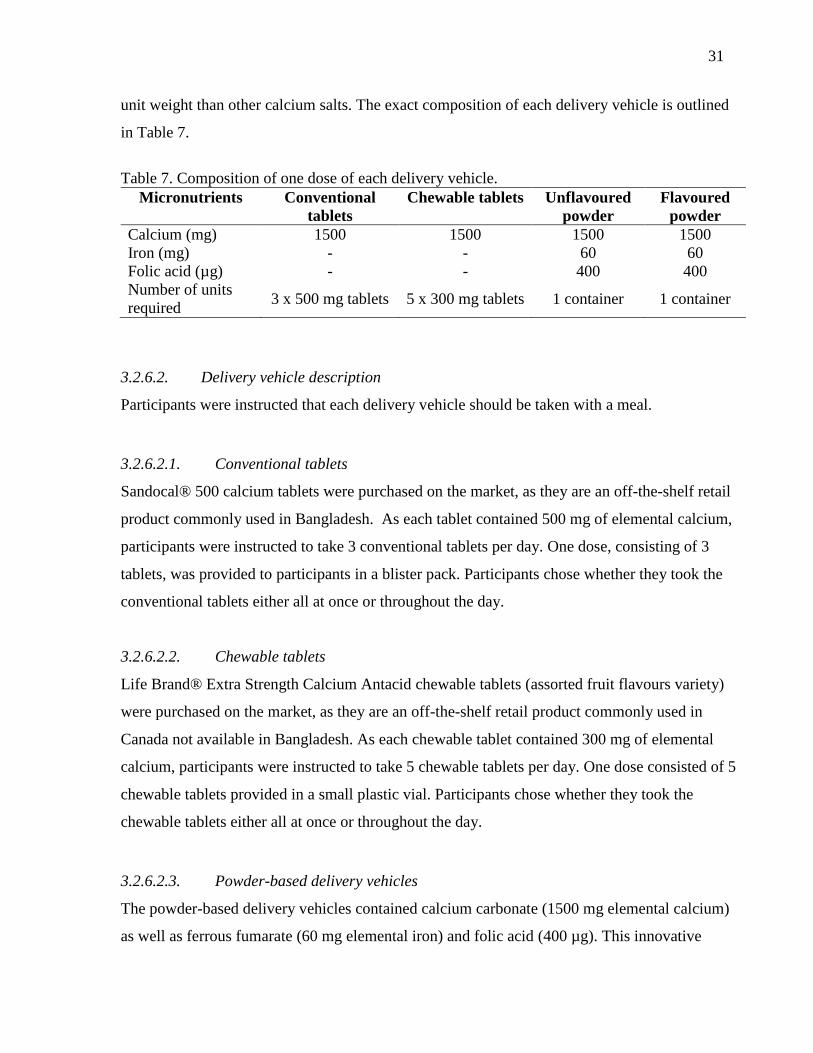
31
unit weight than other calcium salts. The exact composition of each delivery vehicle is outlined
in Table 7.
Table 7. Composition of one dose of each delivery vehicle.
Micronutrients Conventional
tablets
Chewable tablets Unflavoured
powder
Flavoured
powder
Calcium (mg) 1500 1500 1500 1500
Iron (mg) - - 60 60
Folic acid (µg) - - 400 400
Number of units
required 3 x 500 mg tablets 5 x 300 mg tablets 1 container 1 container
3.2.6.2. Delivery vehicle description
Participants were instructed that each delivery vehicle should be taken with a meal.
3.2.6.2.1. Conventional tablets
Sandocal® 500 calcium tablets were purchased on the market, as they are an off-the-shelf retail
product commonly used in Bangladesh. As each tablet contained 500 mg of elemental calcium,
participants were instructed to take 3 conventional tablets per day. One dose, consisting of 3
tablets, was provided to participants in a blister pack. Participants chose whether they took the
conventional tablets either all at once or throughout the day.
3.2.6.2.2. Chewable tablets
Life Brand® Extra Strength Calcium Antacid chewable tablets (assorted fruit flavours variety)
were purchased on the market, as they are an off-the-shelf retail product commonly used in
Canada not available in Bangladesh. As each chewable tablet contained 300 mg of elemental
calcium, participants were instructed to take 5 chewable tablets per day. One dose consisted of 5
chewable tablets provided in a small plastic vial. Participants chose whether they took the
chewable tablets either all at once or throughout the day.
3.2.6.2.3. Powder-based delivery vehicles
The powder-based delivery vehicles contained calcium carbonate (1500 mg elemental calcium)
as well as ferrous fumarate (60 mg elemental iron) and folic acid (400 µg). This innovative
32
product was designed for a parallel research study being conducted by SickKids and icddr,b, and
intended to provide simultaneous calcium and iron supplementation (Encapsulated Calcium
Absorption during Pregnancy; clinicaltrials.gov NCT01678079). Ferrous fumarate is a
commonly used iron supplement, since contains a greater amount of elemental iron per unit
weight in comparison with other iron salts and is more bioavailable than other forms of iron
(Davidsson et al. 2000).
The powders were produced by the Toronto Institute for Pharmaceutical Technology (TIPT).
3.2.6.2.3.1. Unflavoured powder
The unflavoured powder was contained in a plastic vial with a desiccant-filled cap. As one
vial contained a complete dose, participants were instructed to add the contents of one vial to
either a semi-liquid food or drink.
3.2.6.2.3.2. Flavoured powder
The composition of the flavoured powder was the same as the unflavoured powder, with the
addition of an orange flavouring powder (‘N-C juicy orange flavour’; FONA International
Inc.). The flavoured powder was contained in a plastic vial with a desiccant-filled cap. As
one vial contained a complete dose, participants were instructed to add the contents of one
vial to one cup of clean water.
3.2.7. Sample size calculation
The sample size calculation was based on estimating the minimum detectable difference in the
proportion of days selected for each of the delivery vehicles (i.e., preference), comparing the
least and most preferred delivery vehicles. To detect a 20% minimum difference between the
proportion of days on which the least and most preferred delivery vehicles were selected, with a
risk of a type I error rate (alpha) of 0.05 and 80% power, 120 participants were required (Figure
1). To account for approximately 20% loss, enrolment of 140 participants was targeted.
The calculation was based on the H0 hypothesis that the probability of selection (i.e., preference)
for each of the delivery vehicles would be equal, and the alternative hypothesis that the

33
proportion of participants that preferred the most preferred delivery vehicle would be at least
20% greater than the proportion of participants that preferred the least preferred delivery
vehicle. The sample size as indicated is conservative given that it takes into account only a
single data point for each participant. Analysis of the primary outcome will incorporate repeated
outcomes (up to 21 data points) from each participant on each of the selection days. This will
greatly increase the effective sample size, and thereby reduce the minimal detectable difference.
Because of the novel experimental design, the measurement of a multinomial outcome, and the
absence of previous similar studies, we chose to rely on a conservative, readily-interpreted
sample size calculation.
Figure 1. Estimated sample size (number of individuals required) to detect a given absolute
detectable difference between the proportion of days on which the least and most preferred
delivery options are selected, assuming 80% power and alpha = 0.05.
3.2.8. Study personnel training and quality control
Six study personnel were hired. The supervisory staff (research fellow and field research
assistant) underwent two weeks of training regarding all study activities and assisted with the
training of the CHWs. The CHWs (the principal field data collectors) underwent a 5-day
training session detailing general study procedures and data collection methods. Training
included discussion, role play, and practice of activities in the field setting. To ensure quality
0
400
800
1200
1600
2000
5 7 9 11 13 15 17 19 21
Sam
ple
siz
e (i
ndiv
idual
s)
Minimum detectable difference (%)

34
data collection, the research fellow spot-checked interviews, especially among the principal
field data collectors; randomly re-interviewed respondents; and daily checked data sheets from
completed questionnaires for consistency and completeness. The student investigator
continuously visited the field site and worked closely with all study personnel in all field
activities to monitor the quality of field activities.
3.2.9. Study procedures
Study subjects participated in the study for a total of 26 days, which included a four day run-in
period, a 21 day selection period, and a final day on which a post-study questionnaire was
conducted. The sequence of study-related events is depicted in Figure 2.
Figure 2. Overview of the progression of study events for each individual participant from
enrolment to completion.
3.2.9.1. Recruitment and enrolment
Prospective participants were identified when they presented to SMC to use the services
available, or were identified by research personnel within the SMC catchment area during field
visits and referred to SMC. All recruitment activities took place at SMC where research
personnel initially approached the women to determine if they were provisionally eligible based
on the set inclusion criteria using a pre-established script (Appendix A). Women who had not
yet completed 13 weeks of gestation, but were otherwise found to be provisionally eligible, were
invited to participate in the study at a later date. Provisionally eligible women were referred to
the field research assistant who completed a more detailed screening and consent process
26 days
Run-in
Period
(4 days)
Selection Period
(21 days)
* * * * Enrolment/
Baseline
End of Run-in
Questionnaire Weekly
monitoring
Weekly
monitoring End of Study
Questionnaire
*

35
(Appendix B). During the screening process, the field research assistant confirmed that
provisionally eligible women met the inclusion and exclusion criteria, and obtained verbal
consent from the participant to conduct Hb assessment from a finger-prick capillary blood
sample, measured by a handheld hemoglobinometer (Hb 201, Hemocue AB, Sweden). If
eligibility was confirmed, the field research assistant proceeded with the complete disclosure of
information and obtained written consent from those women who agreed to participate
(Appendix C-E). In the case that a participant was unable to write her name, a thumbprint was
taken. All women were offered the option of consulting with family members (e.g., her husband
or mother-in-law) before deciding to participate in the study. Women who were ineligible
following Hb assessment were referred for counselling at SMC and provided with iron-folic
acid supplements free of charge for use during the remaining duration of their pregnancy.
3.2.9.2. Baseline
A questionnaire (‘Baseline Questionnaire’; see Appendix F) was administered at baseline to
determine relevant participant demographic information. As baseline data were collected by
study personnel on the same day that informed consent was provided, this questionnaire was
conducted at SMC.
3.2.9.3. Run-in period
A mandatory four-day run-in period preceded the start of the study. The purpose of the run-in
period was to ensure that all participants had exposure to each of the delivery vehicles prior to
starting the study. The run-in period started on the day on which informed consent was obtained
and lasted for four days. Participants were required to try a different delivery vehicle per day.
Prior to starting the run-in period, study personnel reviewed the ‘Supplement Rules Sheet’
(Appendix G) and the ‘Instructions for Supplement Use’ (Appendix H) with the participant.
These documents were created to aid the participants in using the supplements appropriately and
are further described in Section 3.2.9.5.
Participants were required to try the delivery vehicles in an assigned sequence. The sequence
was generated using a pseudo-random number generator (Stata/IC 12.0; Stata Corporation,
College Station, Texas) to ensure that the ordering of possible sampling scenarios was balanced.

36
To accommodate those participants who were illiterate, the assigned delivery vehicle
consumption sequence was depicted using a colour-coding scheme (conventional tablets: blue;
chewable tablets: green; unflavoured powder: yellow; flavoured powder: red); this system was
used throughout the study and is further explained in Section 3.2.9.6. Participants could not
continue to the selection period until the run-in period was completed. At the end of the run-in
period, CHWs conducted home visits and the participants completed a questionnaire (‘End of
Run-in Questionnaire; Appendix I) assessing characteristics relating to the delivery vehicles.
3.2.9.4. Selection period
Within the selection period, the participants choose which delivery vehicle they consumed on
any given day. The selection period consisted of a total of 21 delivery vehicle selection days,
which was split into three one-week periods. Different activities associated with monitoring
delivery vehicle consumption were conducted at the beginning and end of each week. At the
start of the first week, the CHWs provided the participants with a one-week supply (7 doses) of
each delivery vehicle. At the start of subsequent weeks, the CHWs counted the number of
consumed and unconsumed delivery vehicles and monitored any health-related events (e.g.,
nausea or vomiting) and/or adverse events (‘CHW Tracking Sheet for Supplement Use’;
Appendix K, M, and O). All supplements provided to participants were recorded and
participants were given instruction about recording their daily delivery vehicle consumption.
Participants were required to track their daily delivery vehicle selection (‘Participant Tracking
Sheet for Supplement Use’; Appendix L, N, and P) using the colour-coding scheme further
described in Section 3.2.9.6. The day after the final day of the selection period, a final
questionnaire assessing characteristics relating to the delivery vehicles was administered (‘End
of Study Questionnaire’; Appendix Q). Each encounter between CHWs and participants was in
the form of a home visit and the ‘Supplement Rules Sheet’ and the ‘Instructions for Supplement
Use’ were reviewed. In the case that data collection could not be performed on a scheduled visit
date (e.g. the participant could not be located), it was performed at the next available
opportunity assuming the participant had not withdrawn.
3.2.9.5. Additional information sheets provided to participants
At the start of the run-in period, participants were provided with two information sheets in
Bangla. Content within the information sheets was depicted both pictorially and in written

37
format to accommodate those who were illiterate. The ‘Supplement Rules Handout’ (Appendix
G) included three rules: (1) Do not share the supplements with other women; (2) Do not share
the supplements with children; and (3) Only take one type of delivery vehicle per day. The
‘Instructions for Supplement Use’ (Appendix H) instructed how to use each delivery vehicle
appropriately. Both sheets were reviewed at every interaction between participants and study
personnel.
3.2.9.6. Colour-coding scheme
As some participants were illiterate, a colour coding scheme was used to identify the delivery
vehicles. This format was employed during the run-in period to depict the order in which the
participants should consume the delivery vehicles and during the selection period to enable
participants to record their delivery vehicle choices, through the use of coloured stickers, on the
‘Participant Tracking Sheet for Supplement Use.’ Each delivery vehicle was associated with a
colour: conventional tablets – blue; chewable tablets – green; unflavoured powder – yellow;
flavoured powder – red. All delivery vehicles were marked with a coloured circle; all forms and
information sheets had a coloured circle next to the respective picture or written word for the
delivery vehicles.
3.2.10. Data collection methods
The primary method of data collection employed in this study was the use of questionnaires. All
questionnaires were written in English and translated into Bangla (the primary language used
Bangladesh). Selected items were back-translated into English to confirm the precision of the
original translation.
Trained study personnel verbally administered questionnaires to participants at baseline and at
all weekly home visits. A schedule of data collection activities is outlined in Table 8.
Questionnaires used to collect data were manually checked by the research fellow for
completeness before being submitted for entry into an electronic database.

38
Table 8. Schedule of data collection activities.
Data collection activity Frequency Schedule
Baseline questionnaire Once Enrolment
End of Run-in questionnaire Once Week 1
Participant tracking sheet for
supplement use
Three times (at every visit during the
selection period)
Week 1, 2, and 3
CHW tracking sheet for
supplement use
Three times (at every visit during the
selection period)
Week 1, 2, and 3
End of study questionnaire Once Week 3
3.2.10.1. Baseline questionnaire
The ‘Baseline Questionnaire’ (Appendix F) included questions pertaining to personal and
household information; socioeconomic determinants; obstetric history; and past supplement use.
Questions pertaining to household information and socioeconomic determinants were based on
the Bangladesh Demographic Health Survey 2007’s Household and Woman’s Questionnaire
(NIPORT et al. 2009).
3.2.10.2. End of run-in questionnaire
The ‘End of Run-In Questionnaire’ was used to assess the participants’ perceptions of
characteristics related to the acceptability, palatability, and ease of use of each delivery vehicle
(Appendix I). The questionnaire included questions about sensory qualities, portion size, and
preparatory requirements for each delivery vehicle. Questions were either open-ended or using a
5-point Likert scale ranging from ‘I really liked it’ (1) to ‘I really did not like it’ (5), including
two positive scores, one neutral score, and two negative scores. A graphic scale was provided to
participants to assist them in understanding and answering the Likert scale (Appendix J). For the
unflavoured powder, participants were only asked questions about characteristics of interest if
they reported having detected the characteristics-associated change in the medium that the
powder was added to.
3.2.10.3. CHW tracking sheet for supplement use
The ‘CHW Tracking Sheet for Supplement Use’ allowed CHWs to record the number of doses
of each delivery vehicle provided to participants at the beginning of the week; the number of
39
doses remaining at the end of the week; and any health-related events (i.e., difficulty
swallowing, gagging, abdominal upset, abdominal pain, nausea, vomiting, constipation,
diarrhea) and/or adverse events that might have occurred (Appendices K, M, and O for weeks 1-
3, respectively).
3.2.10.4. Participant tracking sheet for supplement use
The ‘Participant Tracking Sheet for Supplement Use’ allowed participants to record their daily
delivery choice by using coloured stickers matched to the delivery vehicle (Appendices L, N,
and P for weeks 1-3, respectively).
3.2.10.5. End of study questionnaire
The ‘End of Study Questionnaire’ was administered to assess acceptability, palatability, and
ease of use of each delivery vehicle following completion of the selection period. Only
participants who reported having taken a delivery vehicle during the selection period answered
corresponding questions. The format and questions employed were consistent with the ‘End of
Run-in Questionnaire,’ with the addition of questions about why participants did not use or
stopped using a delivery vehicle, participants’ willingness to use and purchase the delivery
vehicles, and summary questions about participants’ most and least preferred delivery vehicles.
3.2.11. Statistical analyses
All data were entered into an electronic database (Microsoft SQL Server 2005) using a custom
design interface (ASP.NET with C#). The system included built-in range and consistency
checks to prevent data entry errors. Double data entry was additionally completed to ensure
accurate entry. Statistical analyses were conducted using Stata/IC 12.0 (Stata Corporation,
College Station, Texas). A P-value of <0.05 was considered statistically significant in all
statistical analyses. Graphs were generated using Microsoft Excel 2010 (Microsoft, Redmond,
Washington).
Variables were first explored and summarized using descriptive statistics such as means and
standard deviations (for continuous variables), counts and proportions (for categorical data), and
graphs, as appropriate.

40
3.2.11.1. Analysis of preference
While participants were provided with four different delivery vehicle options (conventional
tablets, chewable tablets, flavoured powder, and unflavoured powder), there were actually five
different possible outcomes (‘selection options’) since participants could also choose not to take
a delivery vehicle on any given day.
3.2.11.1.1. Daily delivery vehicle selections
The primary analytic approach was analysis of participants’ daily delivery vehicle selections
over the study selection period. The unit of analysis was a ‘discrete choice’ (i.e., one
participant’s delivery vehicle selection on one day). In order to be included in the analysis,
participants had to have made a discrete delivery vehicle choice (i.e., selecting only one delivery
vehicle) per study day. This criterion led to the exclusion of data for one participant for selection
days 1-7 as she selected two delivery vehicles. Multinomial logistic regression with cluster
robust standard error estimation was used to determine the probability selecting each selection
option from the intercept-only model (Hosmer and Lemeshow 2000). Cluster robust standard
error estimation was used to account for correlation among an individual participant’s delivery
vehicle selection over time since each participant contributed multiple data points for analysis
(maximum data points = 21) (Rogers 1993).
3.2.11.1.2. Participant-level delivery vehicle selections
Participant delivery vehicle selections were aggregated to determine each participant’s most
frequently chosen selection option during the selection period for participants who completed
the selection period. The unit of analysis was participant. Responses to questions about
participants’ subjectively reported most and least preferred delivery vehicles from the post-study
questionnaires were summarized.
3.2.11.1.3. Delivery vehicle selection over time
The frequency of selections made by day and by week was summarized during the selection
period. The proportions of selections were additionally shown by study week for days of
interest: (1) CHW home-visit days (days 1, 8, and 15); (2) the middle day of the week (days 4,
11, and 18); and (3) the last day of the week (7, 14, and 21). The mean proportion of delivery

41
vehicle selections was determined on CHW and non-CHW home visit days, and the proportions
were compared using the McNemar test. To observe trends in conventional tablet selection on
the day before and after each CHW home-visit, the proportion of participants who selected
conventional tablets on these days given that they had selected conventional tablets on a CHW
home-visit day was summarized. To observe the progressive stabilization of delivery vehicle
choices made by participants over time, the cumulative proportion of delivery vehicle selections
were determined by study day.
3.2.11.1.4. Prediction of delivery vehicle selection from time and study-design related
characteristics
Multinomial regression models were used to determine the unadjusted associations between the
five selection options and time and study-design related variables, including selection of tablets
on day 1 of the selection period, study week, and CHW home-visit days. The reference category
was set post hoc as conventional tablets, and cluster robust standard error estimation was used to
account for within-participant correlation. The conventional tablet delivery vehicle was set as
the reference category because it was a natural comparator given it is the standard form used in
supplementation regimens.
3.2.11.1.5. Delivery vehicle selection patterns
Participants were categorized into three delivery vehicle selection patterns defined post hoc: (1)
early delivery vehicle commitment (selection of the same delivery vehicle on at least 80% of the
days that a delivery vehicle was selected during each week of the selection period); (2) delayed
commitment (selection of the same delivery vehicle on at least 80% of the days on which a
delivery vehicle was selected for weeks two and three of the selection period, but on less than
80% of the days during week one); and (3) non-commitment (selection of delivery vehicles such
that the criteria for any of the previous categories were not met, even though a selection was
made on each day of the selection period). The different delivery vehicle selection combinations
made by all of the participants who completed the selection period and made a discrete choice
on each day, as well as those who exhibited the non-commitment selection pattern, were
summarized.

42
3.2.11.2. Delivery vehicle acceptability
3.2.11.2.1. Palatability
Likert scale responses to questions about the palatability characteristics (taste, mouth feel,
aftertaste, and smell) from the interim and post-study questionnaires were considered ordinal as
there was a natural ordering of responses. Paired comparisons of the distribution of scores
between delivery vehicles were conducted using the non-parametric Wilcoxon signed-rank test
because the data were not normally distributed, there were five Likert scale options, and the
same sample of respondents were questioned (paired sample). The observed counts and
proportions of each Likert scale response score were also summarized.
3.2.11.2.2. Product-related characteristics and ease of use
Because certain Likert scale responses for product-related and ease of use characteristics were
specific to the formulation of the delivery vehicles, comparisons were separated by formulation
(tablet-based and powder-based) for both the interim and post-study questionnaire responses.
Responses were considered ordinal given the natural ordering of the responses, thus paired
comparisons of score distributions were made using the non-parametric Wilcoxon signed-rank
test. Counts and proportions of the Likert scale responses were also summarized.
Reasons why participants did not use or stopped using the delivery vehicles during the selection
period, as determined from open-ended post-study questionnaire questions about why a delivery
vehicle was not taken or structured questions about whether certain delivery vehicle
characteristics led participants to stop using a delivery vehicle, were summarized.
3.2.11.2.3. Foods and drinks used in combination with the powder-based delivery vehicles
Foods and drinks listed by participants as being used with the powder-based delivery vehicles
were summarized.
43
3.2.11.2.4. Willingness to use and spend on the delivery vehicles
Responses to questions pertaining to the willingness of participants to use and spend on the
delivery vehicles were summarized. Five items were provided to determine the amount
participants would be willing to spend if the participants were to have access to the delivery
vehicles in the future (1 lozenge = 1 taka, 1 tamarind pickle = 3 taka, 1 hairband = 5 taka, 1
hairslide = 10 taka, and 1 pair of bangles = 20 taka; 1 taka = 1.25 cents).
3.2.11.2.5. Exploration of participant characteristics associated with delivery vehicle
selection
We sought to identify characteristics associated with a relative preference for the different
delivery vehicles. To do this, we used multinomial regression models, in which the outcome
consisted of the five different selection options and the explanatory variables were intrinsic
participant characteristics hypothesized to be possible factors associated with a woman’s
relative preference. For the following analyses, the reference category was set post hoc as the
conventional tablets, and cluster robust standard error estimation was used to account for within-
participant delivery vehicle selection correlation.
Model generation of a multivariate multinomial logistic model extended to include explanatory
covariates of delivery vehicles selection was conducted following the approach described by
Hosmer and Lemeshow (2000). To be considered for inclusion in the multivariate model,
explanatory variables had to be intrinsic participant characteristics that might have predicted
preference for the delivery vehicles. Time-related variables were not included given the
increased complication of within-participant time variation. A threshold P-value of 0.20 was
used to assess the significance of the unadjusted association, such that variables with a P-value
< 0.20 were considered to be potentially relevant and thereby included in the multivariate
multinomial logistic model.
Using these criteria, the education level of participant’s husbands was determined to be
associated with delivery vehicle selection within the unadjusted analysis, however, three
participants listed their husband’s education level ‘unknown’ (‘unknown’ was treated as missing
data and not included in initial unadjusted analysis). Since this would have led to exclusion of
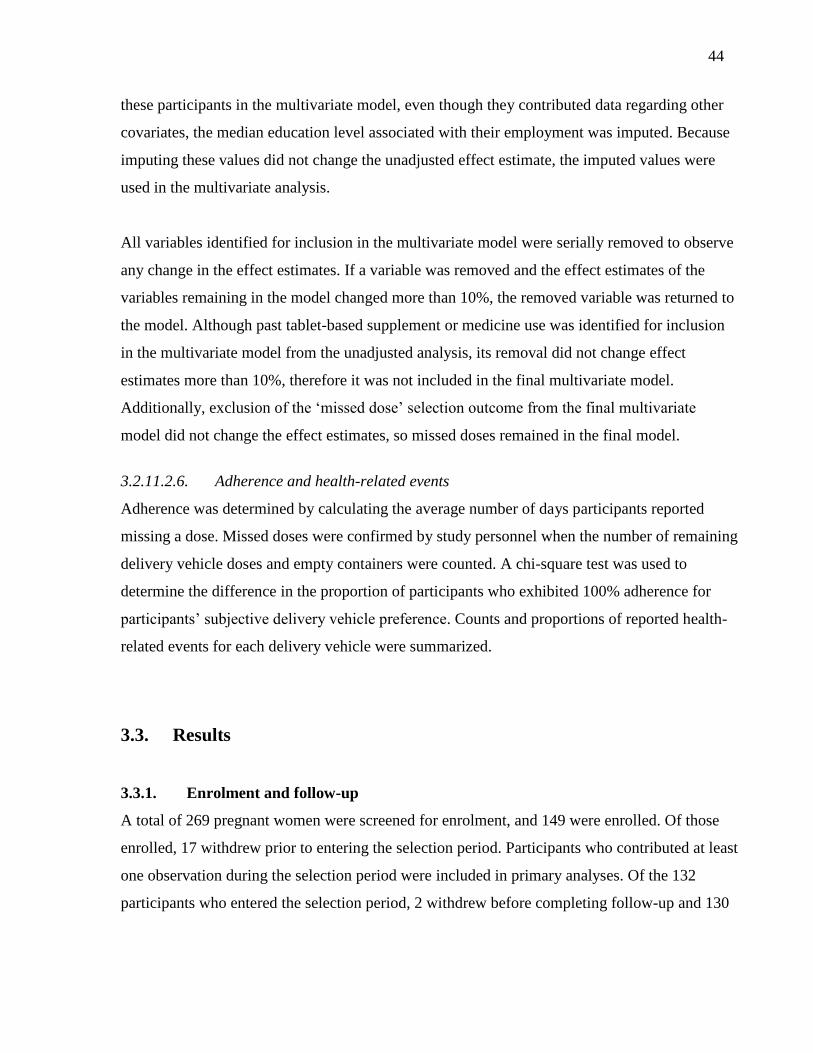
44
these participants in the multivariate model, even though they contributed data regarding other
covariates, the median education level associated with their employment was imputed. Because
imputing these values did not change the unadjusted effect estimate, the imputed values were
used in the multivariate analysis.
All variables identified for inclusion in the multivariate model were serially removed to observe
any change in the effect estimates. If a variable was removed and the effect estimates of the
variables remaining in the model changed more than 10%, the removed variable was returned to
the model. Although past tablet-based supplement or medicine use was identified for inclusion
in the multivariate model from the unadjusted analysis, its removal did not change effect
estimates more than 10%, therefore it was not included in the final multivariate model.
Additionally, exclusion of the ‘missed dose’ selection outcome from the final multivariate
model did not change the effect estimates, so missed doses remained in the final model.
3.2.11.2.6. Adherence and health-related events
Adherence was determined by calculating the average number of days participants reported
missing a dose. Missed doses were confirmed by study personnel when the number of remaining
delivery vehicle doses and empty containers were counted. A chi-square test was used to
determine the difference in the proportion of participants who exhibited 100% adherence for
participants’ subjective delivery vehicle preference. Counts and proportions of reported health-
related events for each delivery vehicle were summarized.
3.3. Results
3.3.1. Enrolment and follow-up
A total of 269 pregnant women were screened for enrolment, and 149 were enrolled. Of those
enrolled, 17 withdrew prior to entering the selection period. Participants who contributed at least
one observation during the selection period were included in primary analyses. Of the 132
participants who entered the selection period, 2 withdrew before completing follow-up and 130

45
completed the entire 21 day-selection period. The study flow and reasons for exclusions and
withdrawal are shown in Figure 3.
3.3.2. Baseline participant characteristics
Personal, socio-demographic, residential, obstetric, and past delivery vehicle use characteristics
of participants eligible for analysis were summarized at baseline (Tables 9-11). At the time of
enrolment, the mean age of study participants was 21.9 ± 3.7 years, and they had completed
21.9 ± 5.2 weeks gestation. Most participants reported having had some education (77%), and
nearly all participants identified themselves as housewives (90%). For 48% of the participants,
this was their first pregnancy.
3.3.3. Delivery vehicle preference
3.3.3.1. Analysis of preference
3.3.3.1.1. Day-wise analysis of preference (primary outcome)
In total, participants contributed 2,737 delivery vehicle selection days for analysis. Preference
was operationally defined as the proportion of days on which each delivery vehicle was selected
during the selection period. The probability of selecting conventional tablets on any given day
during the selection period was greatest (62%), followed by chewable tablets (19%), flavoured
powder (12%), unflavoured powder (5%), and no delivery vehicle (2%) (Table 12). This was
identical to the observed proportions of delivery vehicle selections made during the selection
period (Table 13).
3.3.3.2. Participant-level analysis of preference
For each individual participant, her most preferred delivery vehicle was considered that which
was most frequently selected during the selection period (and thereby her ‘objective
preference’). According to this metric, conventional tablets were most preferred (74% of
participants), followed by chewable tablets (18%), flavoured powder (7%), and unflavoured
powder (1%). Six participants had a tie for their most frequently selected delivery vehicle (4
conventional tablets and chewable tablets; 2 conventional tablets and flavoured powder). When

46
asked which delivery vehicles they preferred most (subjective preference) and least in the post-
study questionnaire, 77% of participants reported that they liked the conventional tablets the
most and 58% reported liking the unflavoured powder the least (Table 13). Comparison of
participants’ objective (most frequently selected) and subjective (reported) delivery vehicle
preference matched for 87% of participants.
3.3.3.3. Characteristics of delivery vehicle selection with time
During the selection period, nearly all participants took the conventional tablets (123/132
participants; 93%) at least one time, about half took the chewable tablets (70/132; 53%) and
flavoured powder (59/132; 45%) at least one time, about a third took the unflavoured powder
(41/132; 31%) at least one time, and about a quarter did not take a delivery vehicle (32/132;
24%). In looking at the daily frequency of selections during the selection period, conventional
tablets were most commonly selected regardless of the day (Figure 4). Comparing the frequency
of selections made between weeks 1 and 3, an increase in the selection of the conventional
tablets and a decrease in flavoured and unflavoured powder selection was observed (Figure 5).
The probabilities generated for delivery vehicle selections by week were nearly identical to the
observed frequency of selections by week (Table 12).
The proportion of participants who selected each delivery vehicle varied when comparing select
days of each study week (first day of the week, middle day of the week, and last day by week)
(Figure 6). On the first day of the week (the day of CHW home-visits), participants consistently
did not miss a dose, and they selected the conventional tablets proportionally more compared to
the middle and last day of the week. Compared to the first and middle day of the week,
chewable tablet and powder use was proportionally greater on the last day of the week, though a
decrease in powder use was observed from weeks 1 to 3. For the middle and last day of the
week, the greatest difference in proportional delivery vehicle selections was from weeks 1 to 2,
while there was little variation between weeks 2 and 3.
The proportion of delivery vehicle selections made on CHW and non-CHW home-visit days
were significantly different (p<0.001). When the mean proportion of delivery vehicle selections
was compared between CHW and non-CHW home-visit days (Figure 7), the proportion of

47
participants selecting the conventional tablets decreased (77% to 59% for CHW day to non-
CHW day). This corresponded most with an increase in selection of the unflavoured powder
(1% to 5%) and chewable tablets (12% to 20%). A large proportion of participants who selected
conventional tablets on one of the CHW home-visits also selected the conventional tablets on a
future or past CHW home-visit day, although the proportion varied depending on which CHW
home-visit day was considered (Table 14). Among participants who selected conventional
tablets on a CHW home-visit day, the proportion who also selected tablets the day before or
after the CHW home-visit increased with each study week.
When cumulative delivery vehicle selections were considered during the selection period,
variation in the cumulative selections made during the first seven days of the study was apparent
(Figure 8). Little variation was observed, however, from 14 to 21 days of observation (21 days
being the entire selection period) as preference stabilized.
3.3.3.4. Predicting delivery vehicle selection using time and study-design related
characteristics
To determine if there was an impact of time or study-design on preference, unadjusted models
including explanatory variables for delivery vehicle selection on the first day of the selection
period, ‘study week,’ and CHW home-visit days were evaluated. Statistically significant results
were observed for each variable (Table 15). If participants selected tablets on the first day of the
selection period, they were significantly less likely to select the chewable tablets (RRR: 0.28;
95% CI: 0.16 to 0.51) and flavoured powder (RRR: 0.20; 95% CI: 0.10 to 0.42). Selection of the
conventional tablets on day 1 appeared to be negatively associated with unflavoured powder
selection, although this only approached significance (RRR: 0.46; 95% CI: 0.18 to 1.15).
Compared to week 1, participants were significantly less likely to have selected the flavoured
and unflavoured powder (versus the conventional tablets) in week 2 (RRR: 0.74; 95% CI: 0.60
to 0.91 and RRR: 0.64; 95% CI: 0.50 to 0.83, respectively) and to a greater degree in week 3
(RRR: 0.66; 95% CI: 0.47 to 0.92 and RRR: 0.43; 95% CI: 0.29 to 0.65, respectively). On days
when a CHW home-visit was conducted, participants exhibited significantly less preference for
the chewable tablets (RRR: 0.45; 95% CI: 0.33 to 0.62), flavoured powder (RRR: 0.54; 95% CI:

48
0.39 to 0.76), and unflavoured powder (RRR: 0.18; 95% CI: 0.08 to 0.42) relative to the
conventional tablets when compared to days without a CHW home-visit.
3.3.3.5. Participant delivery vehicle selection patterns
There were several observed delivery vehicle selection combinations during the selection period
(Table 16). The greatest number of participants exclusively took the conventional tablets overall
(29%). The second and third most commonly observed delivery vehicle selection combinations
were variation among all of the delivery vehicles (22% of participants) and interspersed
selection of conventional and chewable tablets (20%), respectively.
Participants’ delivery vehicle selection patterns were classified into three categories: (1) early
commitment (36% of participants); (2) delayed commitment (14%); (3) non-commitment (50%)
(Figure 9 and Table 17). Among participants classified as exhibiting early commitment for the
conventional tablets, 90% of the conventional tablet early committers took tablets on every day
of the selection period, while 100% of the chewable tablets and flavoured powder early
committers took each respective delivery vehicle every day. Among participants who exhibited
variable commitment, the two most frequently observed delivery vehicle selection combinations
were selection of all four delivery vehicles (42%) and interspersed selection of the conventional
and chewable tablets (31%) (Table 16).
3.3.4. Delivery vehicle acceptability
3.3.4.1. Analysis of palatability
3.3.4.1.1. Analysis of palatability from interim questionnaire responses
Median and interquartile ranges of Likert scores from interim questionnaire data for taste, mouth
feel, aftertaste, and smell were significantly more favourable for the conventional tablets
compared to the other delivery vehicles (Table 18). The distribution of responses tended to be
predominantly positive for the conventional tablets, widely distributed but more positive than
negative for the chewable tablets and flavoured powder, and more negative for the unflavoured
powder (Figure 10).

49
3.3.4.1.2. Analysis of palatability from post-study questionnaire responses
Post-study questionnaire responses about the delivery vehicles were based on reported use of the
associated delivery vehicle by participants. Some participants’ report of never having taken a
particular delivery vehicle were inconsistent with their actual recorded use, for the chewable
tablets (64 reported versus 69 actual), flavoured powder (49 versus 57), and unflavoured powder
(37 versus 41). In all except 1 case, participants who incorrectly reported that they did not use a
particular delivery vehicle had actually taken the corresponding delivery during the first week of
the selection period.
Median and interquartile ranges of Likert scores for taste, mouth feel, aftertaste, and smell were
more positive for all of the delivery vehicles post-study relative to the interim questionnaire
data, with the most notable shift in distribution among the chewable tablets and flavoured
powder (Table 18). There was a notable absence of negative responses for all of the palatability
characteristics for the conventional tablets (Figure 10).
3.3.4.2. Delivery vehicle product-related characteristics and ease of use
3.3.4.2.1. Analysis of product-related characteristics and ease of use form interim
questionnaire responses
3.3.4.2.1.1. Tablet-based delivery vehicles
There was no difference in participants’ perception of the colour of either tablet-based delivery
vehicle, and both were rated predominantly positively. In comparing the distribution of
responses for the ease of taking and swallowing the conventional tablets compared to the
chewable tablets, participants found the conventional tablets significantly easier to take and
swallow. The number of units required for the conventional tablets compared to the chewable
tablets was also reported to be significantly more convenient (3 conventional tablet units versus
5 chewable tablet units) (Table 19).
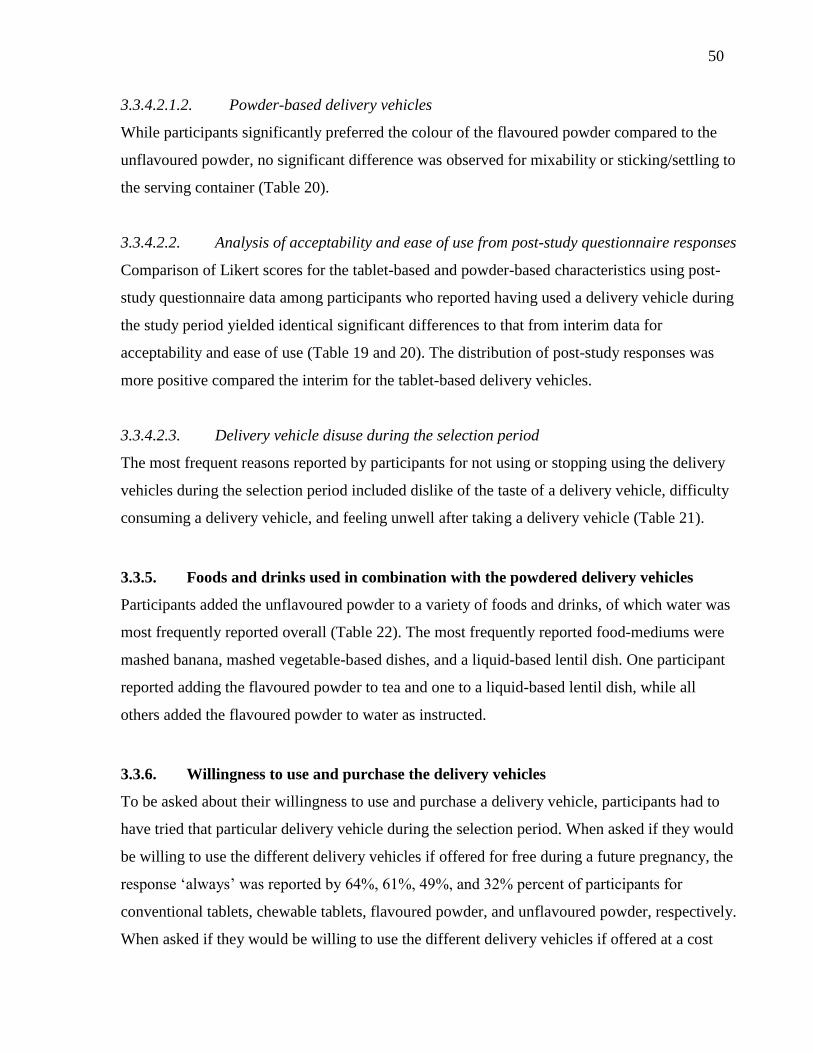
50
3.3.4.2.1.2. Powder-based delivery vehicles
While participants significantly preferred the colour of the flavoured powder compared to the
unflavoured powder, no significant difference was observed for mixability or sticking/settling to
the serving container (Table 20).
3.3.4.2.2. Analysis of acceptability and ease of use from post-study questionnaire responses
Comparison of Likert scores for the tablet-based and powder-based characteristics using post-
study questionnaire data among participants who reported having used a delivery vehicle during
the study period yielded identical significant differences to that from interim data for
acceptability and ease of use (Table 19 and 20). The distribution of post-study responses was
more positive compared the interim for the tablet-based delivery vehicles.
3.3.4.2.3. Delivery vehicle disuse during the selection period
The most frequent reasons reported by participants for not using or stopping using the delivery
vehicles during the selection period included dislike of the taste of a delivery vehicle, difficulty
consuming a delivery vehicle, and feeling unwell after taking a delivery vehicle (Table 21).
3.3.5. Foods and drinks used in combination with the powdered delivery vehicles
Participants added the unflavoured powder to a variety of foods and drinks, of which water was
most frequently reported overall (Table 22). The most frequently reported food-mediums were
mashed banana, mashed vegetable-based dishes, and a liquid-based lentil dish. One participant
reported adding the flavoured powder to tea and one to a liquid-based lentil dish, while all
others added the flavoured powder to water as instructed.
3.3.6. Willingness to use and purchase the delivery vehicles
To be asked about their willingness to use and purchase a delivery vehicle, participants had to
have tried that particular delivery vehicle during the selection period. When asked if they would
be willing to use the different delivery vehicles if offered for free during a future pregnancy, the
response ‘always’ was reported by 64%, 61%, 49%, and 32% percent of participants for
conventional tablets, chewable tablets, flavoured powder, and unflavoured powder, respectively.
When asked if they would be willing to use the different delivery vehicles if offered at a cost

51
during a future pregnancy, the proportion of participants who replied ‘always’ decreased for all
of the delivery vehicles. The most frequently reported amount that participants reported being
willing to spend was the equivalent of 1 lozenge (a locally made candy), which has a value of 1
taka (about 1.25 cents) per dose (Figure 11).
3.3.7. Exploration of participant characteristics associated with selection probability
In the following sections, the term ‘relative preference’ refers to preference relative to
conventional tablets (the reference delivery vehicle). Because there were multiple categorical
outcomes, a reference category for comparison when employing multinomial logistic regression
must be set.
3.3.7.1. Unadjusted models
For the unadjusted models including personal and socioeconomic status-related explanatory
variables, no statistically significant results were observed for participant age, gestational age,
parity, participant education level, or housing material. Significant relative preferences were
observed for crowding index, water treatment, husband’s education level, and husband’s
occupation (Table 23). A unit increase in crowding index was associated with significantly
greater relative preference for the chewable tablets (RRR: 1.20; 95% CI: 1.02 to 1.40) and an
increased likelihood of missing a dose (RRR: 1.27; 95% CI: 1.02 to 1.58). Having a husband
with primary or secondary education was associated with being significantly less likely to miss a
dose compared to having no education (RRR: 0.20; 95% CI: 0.08 to 0.56 and RRR: 0.21; 95%
CI: 0.09 to 0.47).
Among the unadjusted models including explanatory variables for past supplement or medicinal
exposure, such as past conventional tablet use, chewable tablet use, oral rehydration salt (ORS)
use, and other powder use, no statistically significant associations with delivery vehicle
selection were found for past chewable tablet and ORS use. Participants who reported having
used conventional tablets in the past had lesser relative preference for the chewable tablets
(RRR: 0.49; 95% CI: 0.27 to 0.90), and participants who reported having used powders in the
past had significantly lesser relative preference for the flavoured powder (RRR: 0.07; 95% CI:
0.01 to 0.31) (Table 24).
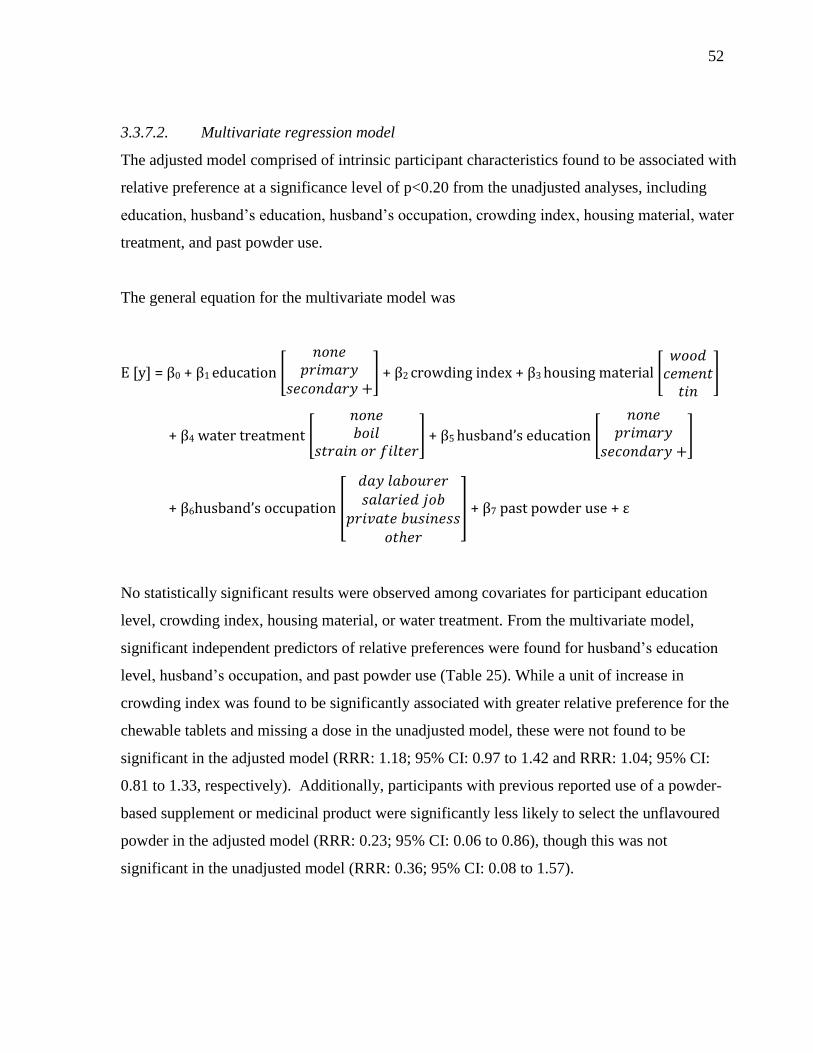
52
3.3.7.2. Multivariate regression model
The adjusted model comprised of intrinsic participant characteristics found to be associated with
relative preference at a significance level of p<0.20 from the unadjusted analyses, including
education, husband’s education, husband’s occupation, crowding index, housing material, water
treatment, and past powder use.
The general equation for the multivariate model was
E [y] = β0 + β1 education [
] + β2 crowding index + β3 housing material [
]
+ β4 water treatment [
] + β5 husband’s education [
]
+ β6husband’s occupation [
] + β7 past powder use + ε
No statistically significant results were observed among covariates for participant education
level, crowding index, housing material, or water treatment. From the multivariate model,
significant independent predictors of relative preferences were found for husband’s education
level, husband’s occupation, and past powder use (Table 25). While a unit of increase in
crowding index was found to be significantly associated with greater relative preference for the
chewable tablets and missing a dose in the unadjusted model, these were not found to be
significant in the adjusted model (RRR: 1.18; 95% CI: 0.97 to 1.42 and RRR: 1.04; 95% CI:
0.81 to 1.33, respectively). Additionally, participants with previous reported use of a powder-
based supplement or medicinal product were significantly less likely to select the unflavoured
powder in the adjusted model (RRR: 0.23; 95% CI: 0.06 to 0.86), though this was not
significant in the unadjusted model (RRR: 0.36; 95% CI: 0.08 to 1.57).

53
3.3.8. Adherence and health-related events
No missed doses were reported by 76% of participants, while for those who missed a dose the
number of missed doses ranged from 1 to 8. The most frequent reasons for missing a dose
among participants were forgetting (reported 73% of the time) or feeling unwell (reported 25%
of the time). There was no difference in the number of participants who had a 100% adherence
rate based on participants’ subjective preference. Eighty-four percent of those demonstrating
early commitment did not miss a dose. Eighty-two percent of participants who exhibited
variable delivery vehicle choice did not miss a dose, although all of the participants who
selected all four delivery vehicles never missed a dose. Only 47% of participants classified as
delayed committers did not miss a dose.
At weekly home-visits, study personnel asked participants whether they had experienced any
health-related events (Table 26). Forty-one percent of participants reported having experienced a
health-related event at some point during the selection period. Of the maximum number of
possible reports, health-related events were only reported 5% of the time. Proportionally more
participants reported experiencing nausea or vomiting after taking the powder-based delivery
vehicles compared to the tablet-based delivery vehicles.

54
Figure 3. Participant screening, exclusion, and withdrawals during the study period.
Exclusions, n=11 (7%)
Medical/obstetric history, n=3 (27%)
Moderate or severe anaemia, n=8 (73%)
Women approached
n=269
Women further screened
n=160
Women enrolled
n=149
Women who contributed
data to the selection
period
n=132
Women who completed
the selection period
n=130
Exclusions, n=109 (41% of potential participants)
Beyond gestational age window, n=86 (79%)
Beyond age window, n=12 (11%)
No fixed address, n=10 (9%)
Plans to leave Dhaka, n=1 (1%)
Withdrawals during run-in period, n=17 (11%)
Experienced pregnancy-associated nausea or
vomiting, n=9 (53%)
Chose to follow at different facility, n=4 (24%)
Went back to village, n=2 (12%)
Family wanted participant to stop participating,
n=1 (6%)
Doctor advised against participation, n=1 (6%)
Gave birth, n=1, (6%)
Withdrawals during selection period, n=2 (2%)
Experienced pregnancy-associated nausea or
vomiting, n=1 (50%)
Family wanted participant to stop participating,
n=1 (50%)

55
Table 9. Personal and household socio-demographic characteristics of participants who
contributed data to the selection period.
Characteristic Participants
(n=132)
Age (years), Mean ± SD 21.9 ± 3.7
Gestational age at enrolment (weeks),
Mean ± SD
21.9 ± 5.2
Married, n (%) 132 (100%)
Educational attainment, n (%)
None
Primary
Secondary or higher
32 (24%)
46 (35%)
54 (41%)
Ability to read, n (%)
Cannot
With difficulty
Easily
30 (23%)
31 (23%)
71 (54%)
Occupation, n (%)
Homemaker
Salaried job
Day labourer
Private business
Unemployed
119 (90%)
6 (5%)
4 (3%)
1 (1%)
2 (1%)
Husband’s educational attainment, n (%)
None
Primary
Secondary or higher
Unknown
32 (24%)
26 (20%)
71 (54%)
3 (2%)
Husband’s occupation, n (%)
Salaried job
Day labourer
Private business
Professional
Expatriate
Unemployed
Agriculture
48 (36%)
45 (34%)
25 (19%)
4 (3%)
6 (4%)
3 (2%)
1 (1%)
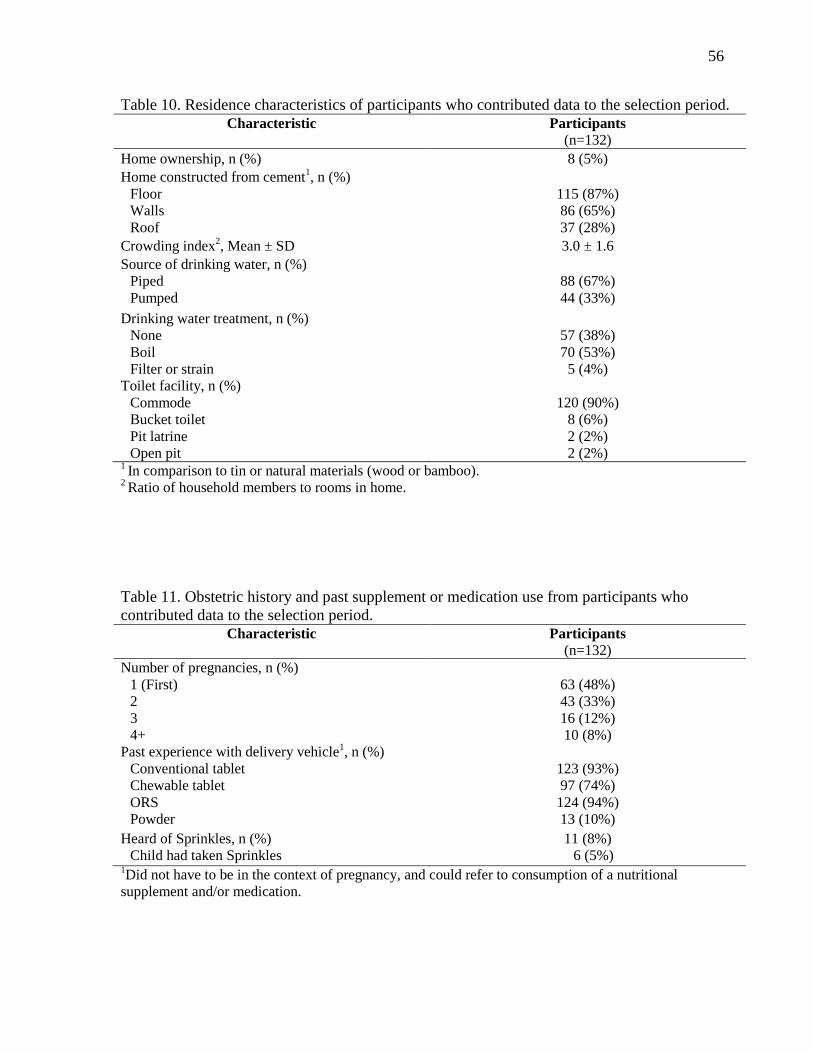
56
Table 10. Residence characteristics of participants who contributed data to the selection period.
Characteristic Participants
(n=132)
Home ownership, n (%) 8 (5%)
Home constructed from cement1, n (%)
Floor
Walls
Roof
115 (87%)
86 (65%)
37 (28%)
Crowding index2, Mean ± SD 3.0 ± 1.6
Source of drinking water, n (%)
Piped
Pumped
88 (67%)
44 (33%)
Drinking water treatment, n (%)
None
Boil
Filter or strain
57 (38%)
70 (53%)
5 (4%)
Toilet facility, n (%)
Commode
Bucket toilet
Pit latrine
Open pit
120 (90%)
8 (6%)
2 (2%)
2 (2%) 1 In comparison to tin or natural materials (wood or bamboo).
2 Ratio of household members to rooms in home.
Table 11. Obstetric history and past supplement or medication use from participants who
contributed data to the selection period.
Characteristic Participants
(n=132)
Number of pregnancies, n (%)
1 (First)
2
3
4+
63 (48%)
43 (33%)
16 (12%)
10 (8%)
Past experience with delivery vehicle1, n (%)
Conventional tablet
Chewable tablet
ORS
Powder
123 (93%)
97 (74%)
124 (94%)
13 (10%)
Heard of Sprinkles, n (%)
Child had taken Sprinkles
11 (8%)
6 (5%) 1Did not have to be in the context of pregnancy, and could refer to consumption of a nutritional
supplement and/or medication.
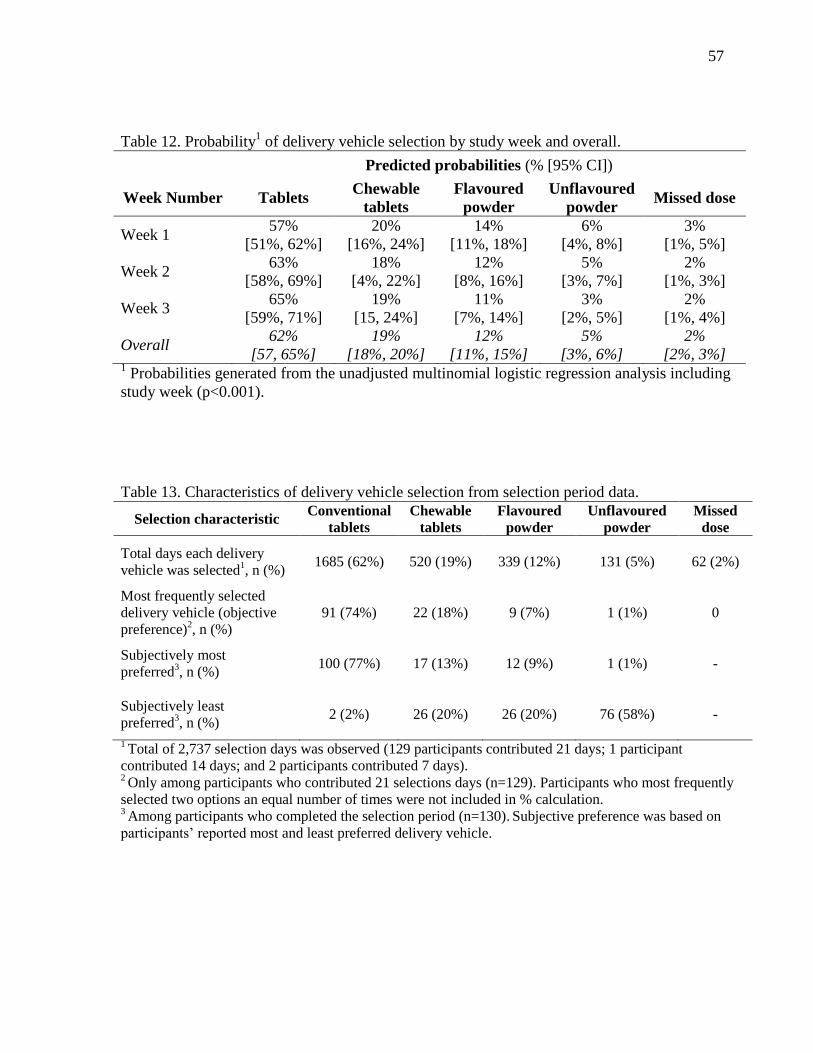
57
Table 12. Probability1 of delivery vehicle selection by study week and overall.
Predicted probabilities (% [95% CI])
Week Number Tablets Chewable
tablets
Flavoured
powder
Unflavoured
powder Missed dose
Week 1 57%
[51%, 62%]
20%
[16%, 24%]
14%
[11%, 18%]
6%
[4%, 8%]
3%
[1%, 5%]
Week 2 63%
[58%, 69%]
18%
[4%, 22%]
12%
[8%, 16%]
5%
[3%, 7%]
2%
[1%, 3%]
Week 3 65%
[59%, 71%]
19%
[15, 24%]
11%
[7%, 14%]
3%
[2%, 5%]
2%
[1%, 4%]
Overall 62%
[57, 65%]
19%
[18%, 20%]
12%
[11%, 15%]
5%
[3%, 6%]
2%
[2%, 3%] 1 Probabilities generated from the unadjusted multinomial logistic regression analysis including
study week (p<0.001).
Table 13. Characteristics of delivery vehicle selection from selection period data.
Selection characteristic Conventional
tablets
Chewable
tablets
Flavoured
powder
Unflavoured
powder
Missed
dose
Total days each delivery
vehicle was selected1, n (%)
1685 (62%) 520 (19%) 339 (12%) 131 (5%) 62 (2%)
Most frequently selected
delivery vehicle (objective
preference)2, n (%)
91 (74%) 22 (18%) 9 (7%) 1 (1%) 0
Subjectively most
preferred3, n (%)
100 (77%) 17 (13%) 12 (9%) 1 (1%) -
Subjectively least
preferred3, n (%)
2 (2%) 26 (20%) 26 (20%) 76 (58%) -
1 Total of 2,737 selection days was observed (129 participants contributed 21 days; 1 participant
contributed 14 days; and 2 participants contributed 7 days). 2 Only among participants who contributed 21 selections days (n=129). Participants who most frequently
selected two options an equal number of times were not included in % calculation. 3 Among participants who completed the selection period (n=130).
Subjective preference was based on
participants’ reported most and least preferred delivery vehicle.
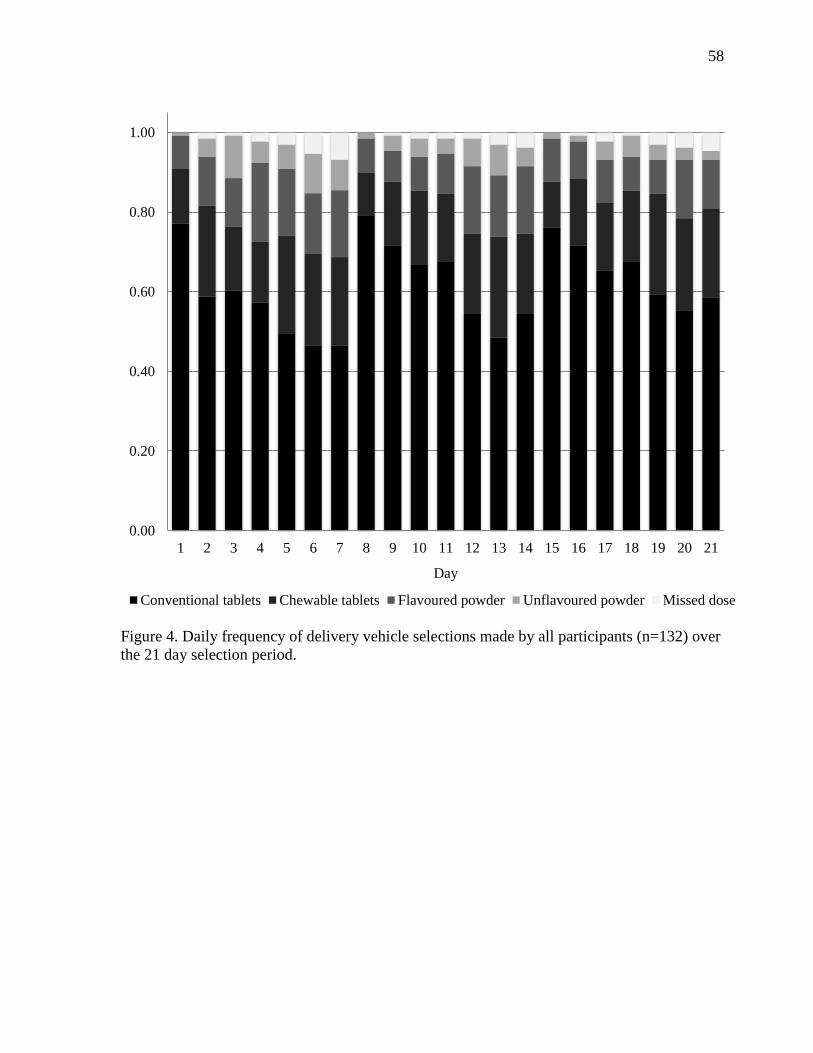
58
Figure 4. Daily frequency of delivery vehicle selections made by all participants (n=132) over
the 21 day selection period.
0.00
0.20
0.40
0.60
0.80
1.00
1 2 3 4 5 6 7 8 9 10 11 12 13 14 15 16 17 18 19 20 21
Day
Conventional tablets Chewable tablets Flavoured powder Unflavoured powder Missed dose

59
Figure 5. Weekly frequency of delivery vehicle selections made by all participants (n=132) over
the selection period.
0.57 0.63 0.65
0.20
0.18 0.19
0.14 0.12
0.11
0.07 0.05 0.03 0.03 0.02 0.02
0
0.2
0.4
0.6
0.8
1
1 2 3
Week
Conventional Tablets Chewable tablets Flavoured powder Unflavoured powder Missed dose

60
CHW home-visit day (first day of week) Middle day of week Last day of week
Conventional tablets Chewable tablets Flavoured powder Unflavoured powder Missed dose
Figure 6. Proportion of delivery vehicle selections made on select days by study week.
0.77 0.79 0.76
0.14 0.11 0.11
0.08 0.08 0.11
0.01 0.02 0.02
0.00
0.20
0.40
0.60
0.80
1.00
Week 1 Week 2 Week 3
0.57
0.67 0.68
0.15
0.17 0.18
0.20
0.10 0.08
0.05 0.04 0.05 0.02 0.02 0.01
0.00
0.20
0.40
0.60
0.80
1.00
Week 1 Week 2 Week 3
0.47
0.55 0.58
0.22
0.20
0.22
0.17
0.17 0.12
0.08
0.05 0.02 0.07 0.04 0.05
0.00
0.20
0.40
0.60
0.80
1.00
Week 1 Week 2 Week 3

61
Figure 7. Mean proportion of delivery vehicle selections made on CHW versus non-CHW
home-visit days (*p<0.05; proportions different from CHW home-visit days for all delivery
vehicles using McNemar’s test).
0.77
0.59
0.12
0.20
0.09
0.13
0.01
0.05 0.03
0
0.2
0.4
0.6
0.8
1
CHW day Non-CHW day
Conventional Tablets Chewable tablets Flavoured powder Unflavoured powder Missed dose
*

62
Table 14. Selection of tablets on the day before and after each CHW home-visit day during the selection period, among participants
who did and did not selected conventional tablets on each CHW home-visit day.1
Selected tablets, n (%)
Day 12
Day 2 Day 7 Day 82 Day 9 Day 14 Day 15
2 Day 16
Participants who
selected tablets on day
1 (n=100)
100
(100%) 67 (67%) 53 (53%) 86 (86%) 76 (76%) 60 (60%) 85 (85%) 80 (80%)
Participants who did
not select tablets on
day 1 (n=29)
0 8 (28%) 8 (28%) 16 (55%) 16 (55%) 10 (34%) 13 (45%) 12 (41%)
Participants who
selected tablets on day
8 (n=102)
86 (84%) 71 (70%)
54 (53%)
102
(100%) 82 (80%) 62 (61%) 89 (88%) 84 (82%)
Participants who did
not select tablets on
day 8 (n=27)
14 (52%) 4 (15%) 7 (26%) 0 10 (37%) 8 (30%) 9 (33%) 8 (30%)
Participants who
selected tablets on day
15 (n=98)
85 (88%) 72 (73%) 55 (56%) 89 (91%) 81 (83%) 66 (67%) 98 (100%) 83 (85%)
Participants who did
not select tablets on
day 15 (n=31)
15 (48%) 3 (10%) 6 (19%) 13 (42%) 11 (35%) 4 (13%) 0 9 (29%)
1 Only participants who completed the entire selection period and made a discrete choice on each day were included (n=129).
2 CHW home-visit day.
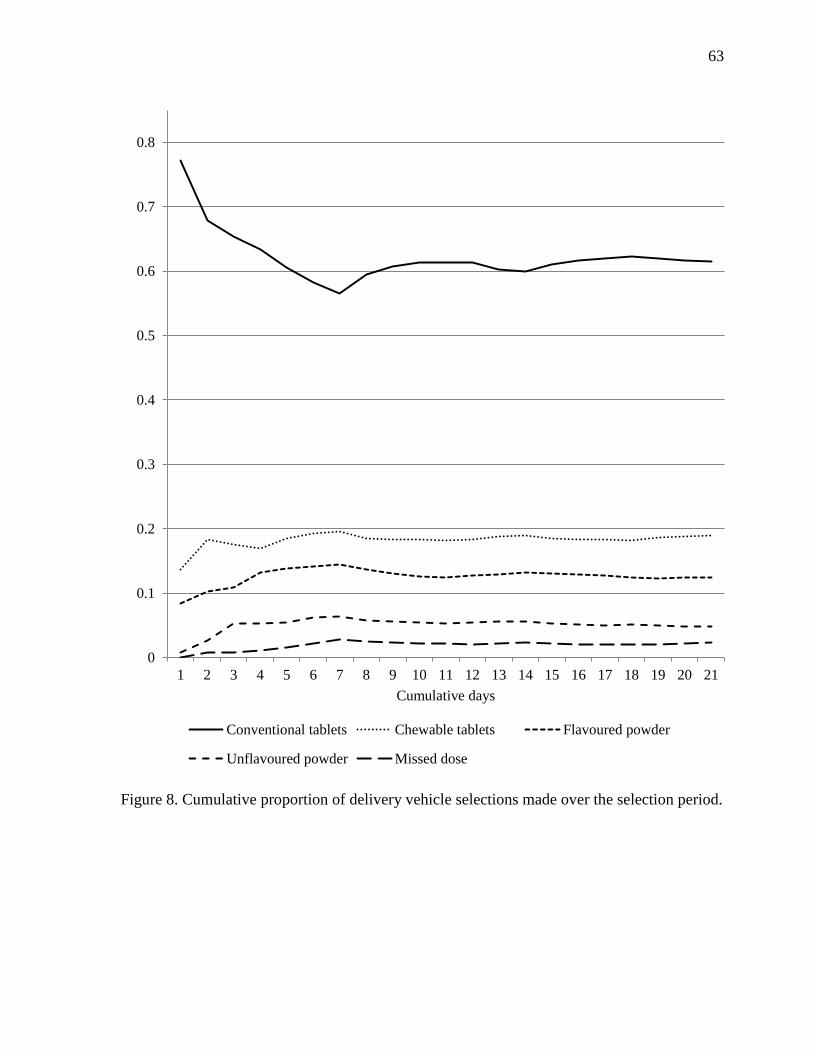
63
Figure 8. Cumulative proportion of delivery vehicle selections made over the selection period.
0
0.1
0.2
0.3
0.4
0.5
0.6
0.7
0.8
1 2 3 4 5 6 7 8 9 10 11 12 13 14 15 16 17 18 19 20 21
Cumulative days
Conventional tablets Chewable tablets Flavoured powder
Unflavoured powder Missed dose
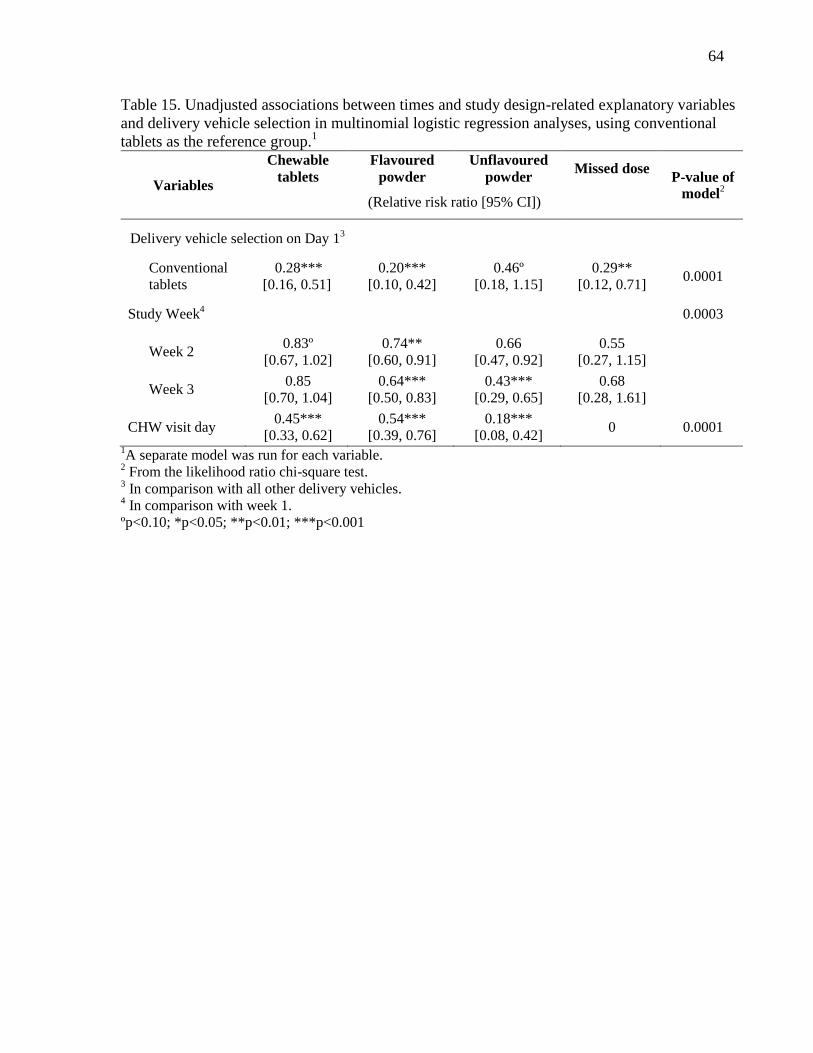
64
Table 15. Unadjusted associations between times and study design-related explanatory variables
and delivery vehicle selection in multinomial logistic regression analyses, using conventional
tablets as the reference group.1
Variables
Chewable
tablets
Flavoured
powder
Unflavoured
powder Missed dose
P-value of
model2
(Relative risk ratio [95% CI])
Delivery vehicle selection on Day 13
Conventional
tablets
0.28***
[0.16, 0.51]
0.20***
[0.10, 0.42]
0.46º
[0.18, 1.15]
0.29**
[0.12, 0.71] 0.0001
Study Week4 0.0003
Week 2 0.83º
[0.67, 1.02]
0.74**
[0.60, 0.91]
0.66
[0.47, 0.92]
0.55
[0.27, 1.15]
Week 3 0.85
[0.70, 1.04]
0.64***
[0.50, 0.83]
0.43***
[0.29, 0.65]
0.68
[0.28, 1.61]
CHW visit day 0.45***
[0.33, 0.62]
0.54***
[0.39, 0.76]
0.18***
[0.08, 0.42] 0 0.0001
1A separate model was run for each variable.
2 From the likelihood ratio chi-square test.
3 In comparison with all other delivery vehicles.
4 In comparison with week 1.
ºp<0.10; *p<0.05; **p<0.01; ***p<0.001

65
Table 16. Delivery vehicle selection combinations made by all participants and those who
exhibited the ‘non-commitment’1 selection pattern
Delivery vehicle selection
combinations
All participants
(n=129)
Non-commitment
selection pattern
(n=65)
n (%)
Conventional tablets
38 (29%) -
All four delivery vehicles 29 (22%) 27 (42%)
Conventional tablets and chewable
tablets 26 (20%) 20 (31%)
Conventional tablets and flavoured
powder 10 (8%) 4 (6%)
Conventional tablets, chewable
tablets, and flavoured powder 6 (5%) 4 (6%)
Conventional tablets, unflavoured
powder, and flavoured powder 5 (4%) 4 (6%)
Chewable tablets 2 (2%) -
Flavoured powder 3 (2%) -
Chewable tablets and flavoured
powder 3 (2%) 2 (3%)
Conventional tablets, chewable
tablets, and unflavoured powder 3 (2%) 3 (5%)
Conventional tablets and unflavoured
powder 3 (2%) 0
Flavoured powder and unflavoured
powder 1 (1%) 1 (2%)
Unflavoured powder 0 -
Chewable tablets and unflavoured
powder 0 0
Chewable tablets, flavoured powder,
and unflavoured powder 0 0
1 ‘Non-commitment’ defined as selection of a single delivery vehicle less than 80% of the time during
weeks 2 and 3 of the selection period (variable delivery vehicle selection).
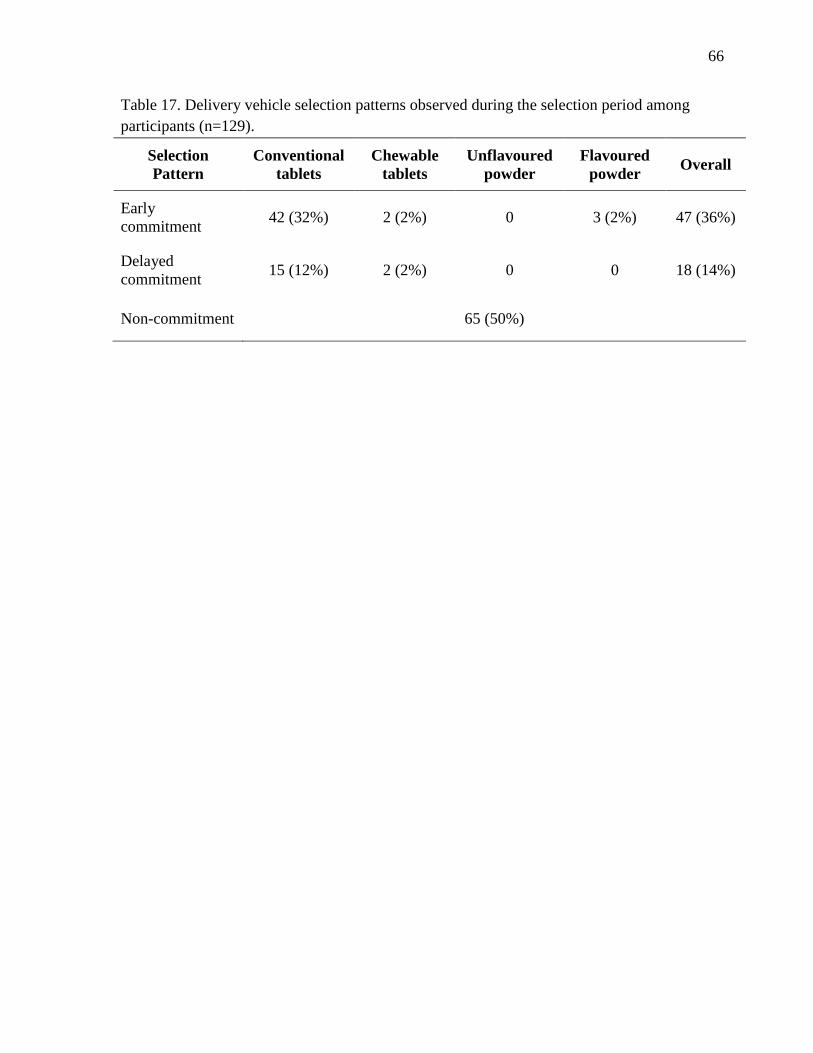
66
Table 17. Delivery vehicle selection patterns observed during the selection period among
participants (n=129).
Selection
Pattern
Conventional
tablets
Chewable
tablets
Unflavoured
powder
Flavoured
powder Overall
Early
commitment 42 (32%) 2 (2%) 0 3 (2%) 47 (36%)
Delayed
commitment 15 (12%) 2 (2%) 0 0 18 (14%)
Non-commitment 65 (50%)

67
a) Early delivery vehicle commitment (Participant ID: 001)
b) Delayed delivery vehicle commitment (Participant ID: 020)
c) Variable delivery vehicle selection (no commitment; Participant ID: 113)
Figure 9. The three delivery vehicle selection patterns exhibited during the selection period: (a)
early commitment; (b) delayed commitment; and (c) non-commitment.
0
1
2
3
4
1 2 3 4 5 6 7 8 9 10 11 12 13 14 15 16 17 18 19 20 21
Del
iver
y v
ehic
le c
ho
cie
Day
Unflavoured
powder
Flavoured
powder
Conventional
tablets
Chewable
tablets
Missed dose
0
1
2
3
4
1 2 3 4 5 6 7 8 9 10 11 12 13 14 15 16 17 18 19 20 21
Del
iver
y v
ehic
le c
hoci
e
Day
Unflavoured
powder
Flavoured
powder
Conventional
tablets
Chewable
tablets
Missed dose
0
1
2
3
4
1 2 3 4 5 6 7 8 9 10 11 12 13 14 15 16 17 18 19 20 21
Del
iver
y v
ehic
le c
ho
cie
Day
Unflavoured
powder
Flavoured
powder
Conventional
tablets
Chewable
tablets
Missed dose

68
Table 18. Likert scale1 responses for palatability characteristics reported by participants
2 from interim and post-study questionnaires.
Interim Post-study
Characteristic Tablets
Chewable
tablets
Flavoured
powder
Unflavoured
powder
Tablets
Chewable
tablets
Flavoured
powder
Unflavoured
powder
(Median [interquartile range]) (Median [interquartile range])
Taste 1 [1] a 2 [4]
b 2 [4]
b,c 4 [3]
d 1 [1]
a 2 [1]
b 2 [1]
b,d 3 [2]
c
Mouth feel 2 [1] a 2 [4]
b 2 [4]
b,c 4 [3]
d 2 [1]
a 2 [1]
b 2 [1]
b,d 4 [2]
c
Aftertaste 2 [1] a 2 [3]
b 2 [3]
b,c 4 [3]
d 2 [1]
a 2 [1]
a,b 2 [1]
a,b,c 3.5 [2]
c
Smell 2 [2] a 3 [3.5]
b 2 [3]
a,c 4 [3]
d 2 [1]
a 2 [1]
a,b 1 [1]
a,b 4 [2]
c
1 5-point Likert scale with responses from 1 (I really liked it) to 5 (I really did not like it). Responses were considered ordinal.
2 Interim questionnaire: n=132; post-study questionnaire: participants were only asked about palatability-associated characteristics of interest if
they self-reported having used the delivery vehicle during the study period (tablets n=121; chewable tablets n=64; flavoured powder n=49;
unflavoured powder: taste n=35, mouth feel n= 36, aftertaste n=30, smell n=34). a-d
Paired comparisons between delivery vehicles for Likert responses from the same questionnaire within rows using the non-parametric Wilcoxon
signed-rank test. Responses with dissimilar subscripts are significantly different (p<0.05).
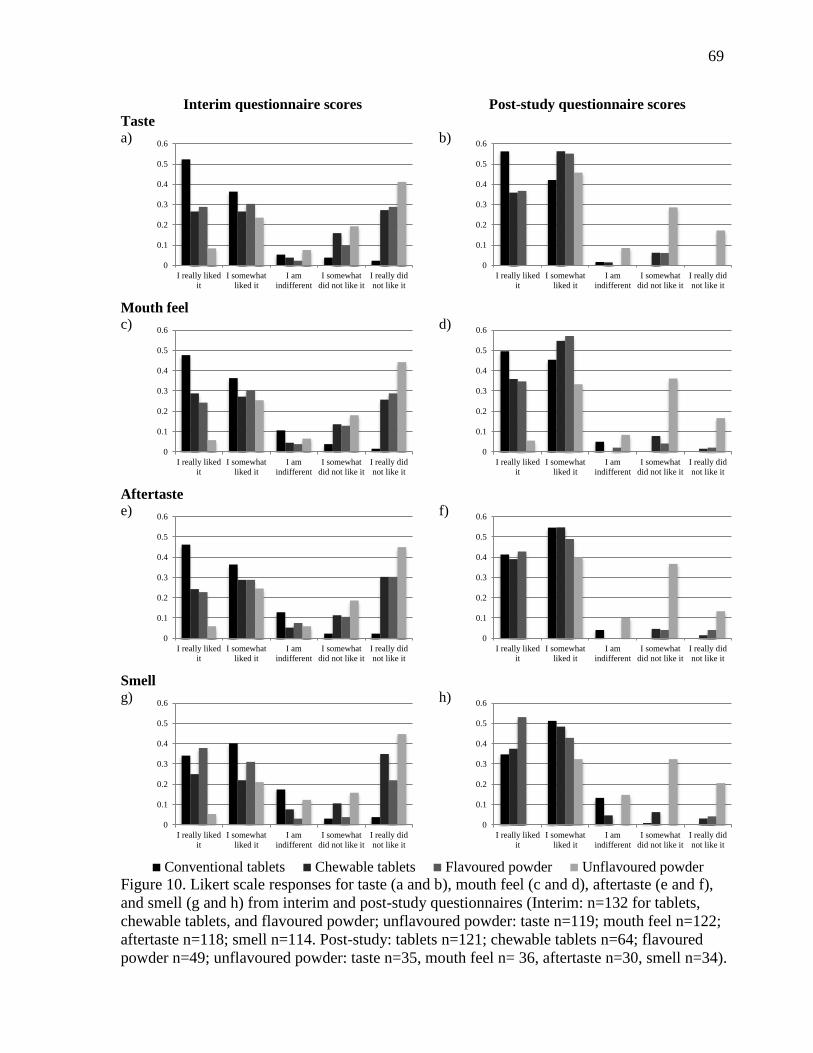
69
Interim questionnaire scores Post-study questionnaire scores
Taste
a)
b)
Mouth feel
c)
d)
Aftertaste
e)
f)
Smell
g)
h)
Conventional tablets Chewable tablets Flavoured powder Unflavoured powder
Figure 10. Likert scale responses for taste (a and b), mouth feel (c and d), aftertaste (e and f),
and smell (g and h) from interim and post-study questionnaires (Interim: n=132 for tablets,
chewable tablets, and flavoured powder; unflavoured powder: taste n=119; mouth feel n=122;
aftertaste n=118; smell n=114. Post-study: tablets n=121; chewable tablets n=64; flavoured
powder n=49; unflavoured powder: taste n=35, mouth feel n= 36, aftertaste n=30, smell n=34).
0
0.1
0.2
0.3
0.4
0.5
0.6
I really liked
it
I somewhat
liked it
I am
indifferent
I somewhat
did not like it
I really did
not like it
0
0.1
0.2
0.3
0.4
0.5
0.6
I really liked
it
I somewhat
liked it
I am
indifferent
I somewhat
did not like it
I really did
not like it
0
0.1
0.2
0.3
0.4
0.5
0.6
I really liked
it
I somewhat
liked it
I am
indifferent
I somewhat
did not like it
I really did
not like it
0
0.1
0.2
0.3
0.4
0.5
0.6
I really liked
it
I somewhat
liked it
I am
indifferent
I somewhat
did not like it
I really did
not like it
0
0.1
0.2
0.3
0.4
0.5
0.6
I really liked
it
I somewhat
liked it
I am
indifferent
I somewhat
did not like it
I really did
not like it
0
0.1
0.2
0.3
0.4
0.5
0.6
I really liked
it
I somewhat
liked it
I am
indifferent
I somewhat
did not like it
I really did
not like it
0
0.1
0.2
0.3
0.4
0.5
0.6
I really liked
it
I somewhat
liked it
I am
indifferent
I somewhat
did not like it
I really did
not like it
0
0.1
0.2
0.3
0.4
0.5
0.6
I really liked
it
I somewhat
liked it
I am
indifferent
I somewhat
did not like it
I really did
not like it

70
Table 19. Likert scale responses for the tablet-based product and ease of use characteristics as reported by participants in interim1 and
post-study questionnaires. Comparisons were made between responses for the conventional and chewable tablets for each survey.
Interim Post-study2
Response
Conventional
tablet
n=132
Chewable
tablet
n=132
P-value3
Conventional
tablet
n=121
Chewable
tablet
n=64
P-value3
Colour, n (%)
I really liked it 82 (62%) 93 (71%) 0.17 76 (62%) 52 (81%) 0.07
I somewhat liked it 45 (34%) 33 (25%) 45 (37%) 12 (19%)
I am indifferent 4 (3%) 0 1 (1%) 0
I somewhat disliked it 1 (1%) 2 (2%) 0 0
I really disliked it 0 4 (3%) 0 0
Ease of taking, n (%)
Easy to take 81 (61%) 26 (20%) 0.0001 73 (60%) 25 (39%) 0.0001
Somewhat easy to take 42 (32%) 33 (25%) 45 (37%) 31 (48%)
Not easy or difficult to take 2 (2%) 11 (8%) 3 (2%) 2 (3%)
Somewhat difficult to take 4 (3%) 31 (23%) 1 (1%) 5 (8%)
Difficult to take 3 (2%) 31 (23%) 0 1 (2%)
Number of units required to take, n (%)
Convenient 64 (48%) 21 (16%) 0.0001 25 (34%) 8 (20%) 0.002
Somewhat convenient 50 (38%) 43 (33%) 40 (54%) 23 (58%)
Neither convenient nor
inconvenient
5 (4%) 7 (5%) 0 0
Somewhat inconvenient 9 (7%) 35 (27%) 9 (12%) 8 (20%)
Inconvenient 4 (3%) 26 (20%) 0 1 (3%)
Ease of swallowing/chewing, n (%)
Easy to do 67 (51%) 21 (16%) 0.0001 65 (53%) 24 (38%) 0.0009
Somewhat easy to do 41 (31%) 39 (30%) 54 (44%) 34 (53%)
Neither easy nor difficult to do 3 (2%) 1 (1%) 1 (1%) 2 (3%)
Somewhat difficult to do 15 (11%) 36 (27%) 2 (2%) 4 (6%)
Difficult to do 6 (5%) 34 (26%) 0 0
I do not know 0 1 (1%)

71
Interim Post-study2
Response
Conventional
tablet
n=132
Chewable
tablet
n=132
P-value3
Conventional
tablet
n=121
Chewable
tablet
n=64
P-value3
Size, n (%)
Too big 8 (6%) 40 (30%) 0.0001 9 (7%) 8 (13%) 0.05
A little big 81 (61%) 62 (47%) 88 (72%) 44 (69%)
Just right 43 (33%) 30 (23%) 25 (21%) 12 (19%)
A little small 0 0 0 0
Too small 0 0 0 0
Shape, n (%)
I really liked it 40 (30%) 33 (25%) 0.001 38 (31%) 18 (28%) 0.06
I somewhat liked it 73 (55%) 59 (45%) 81 (66%) 41 (64%)
I am indifferent 11 (8%) 8 (6%) 3 (2%) 2 (3%)
I somewhat disliked it 6 (5%) 16 (12%) 0 3 (5%)
I really disliked it 2 (2%) 16 (12%) 0 0 1 Interim questionnaire was conducted following the run-in period.
2 Only respondents who reported having used the delivery vehicle responded to questions post-study.
3 Comparison using the non-parametric Wilcoxon signed-rank test as data were considered ordinal.
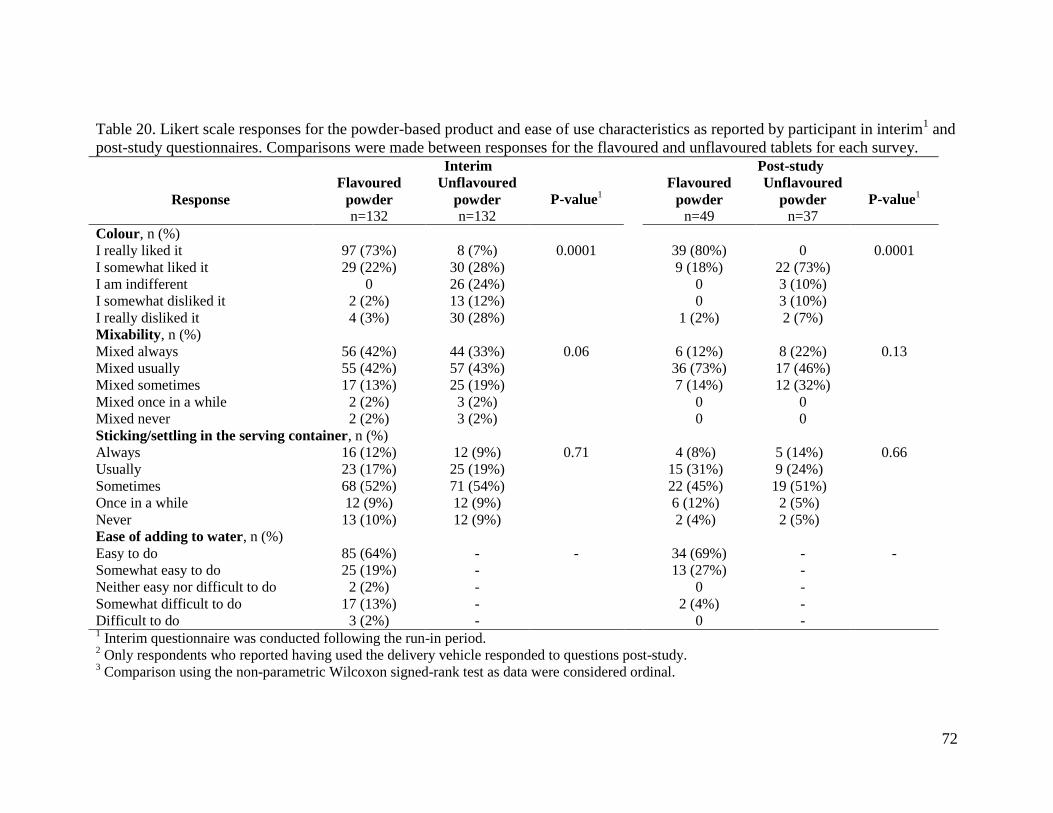
72
Table 20. Likert scale responses for the powder-based product and ease of use characteristics as reported by participant in interim1 and
post-study questionnaires. Comparisons were made between responses for the flavoured and unflavoured tablets for each survey.
Interim Post-study
Response
Flavoured
powder
n=132
Unflavoured
powder
n=132
P-value1
Flavoured
powder
n=49
Unflavoured
powder
n=37
P-value1
Colour, n (%)
I really liked it 97 (73%) 8 (7%) 0.0001 39 (80%) 0 0.0001
I somewhat liked it 29 (22%) 30 (28%) 9 (18%) 22 (73%)
I am indifferent 0 26 (24%) 0 3 (10%)
I somewhat disliked it 2 (2%) 13 (12%) 0 3 (10%)
I really disliked it 4 (3%) 30 (28%) 1 (2%) 2 (7%)
Mixability, n (%)
Mixed always 56 (42%) 44 (33%) 0.06 6 (12%) 8 (22%) 0.13
Mixed usually 55 (42%) 57 (43%) 36 (73%) 17 (46%)
Mixed sometimes 17 (13%) 25 (19%) 7 (14%) 12 (32%)
Mixed once in a while 2 (2%) 3 (2%) 0 0
Mixed never 2 (2%) 3 (2%) 0 0
Sticking/settling in the serving container, n (%)
Always 16 (12%) 12 (9%) 0.71 4 (8%) 5 (14%) 0.66
Usually 23 (17%) 25 (19%) 15 (31%) 9 (24%)
Sometimes 68 (52%) 71 (54%) 22 (45%) 19 (51%)
Once in a while 12 (9%) 12 (9%) 6 (12%) 2 (5%)
Never 13 (10%) 12 (9%) 2 (4%) 2 (5%)
Ease of adding to water, n (%)
Easy to do 85 (64%) - - 34 (69%) - -
Somewhat easy to do 25 (19%) - 13 (27%) -
Neither easy nor difficult to do 2 (2%) - 0 -
Somewhat difficult to do 17 (13%) - 2 (4%) -
Difficult to do 3 (2%) - 0 - 1 Interim questionnaire was conducted following the run-in period.
2 Only respondents who reported having used the delivery vehicle responded to questions post-study.
3 Comparison using the non-parametric Wilcoxon signed-rank test as data were considered ordinal.
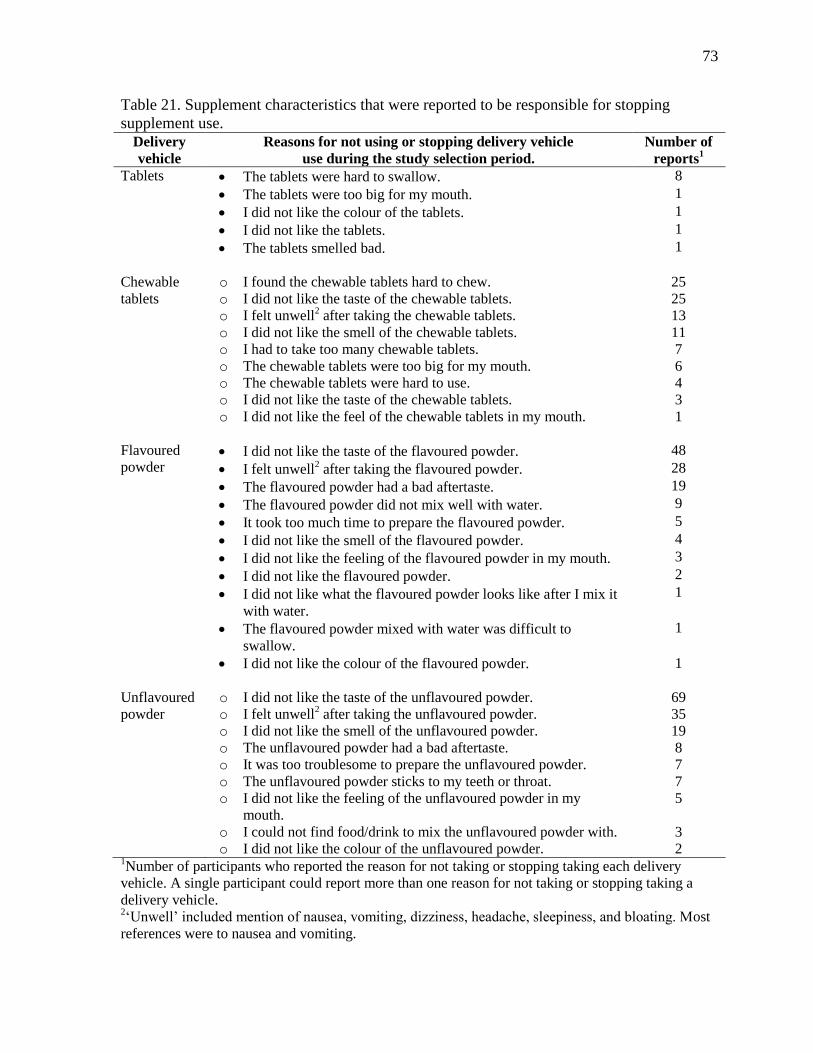
73
Table 21. Supplement characteristics that were reported to be responsible for stopping
supplement use.
Delivery
vehicle
Reasons for not using or stopping delivery vehicle
use during the study selection period.
Number of
reports1
Tablets The tablets were hard to swallow.
The tablets were too big for my mouth.
I did not like the colour of the tablets.
I did not like the tablets.
The tablets smelled bad.
8
1
1
1
1
Chewable
tablets
o I found the chewable tablets hard to chew.
o I did not like the taste of the chewable tablets.
o I felt unwell2 after taking the chewable tablets.
o I did not like the smell of the chewable tablets.
o I had to take too many chewable tablets.
o The chewable tablets were too big for my mouth.
o The chewable tablets were hard to use.
o I did not like the taste of the chewable tablets.
o I did not like the feel of the chewable tablets in my mouth.
25
25
13
11
7
6
4
3
1
Flavoured
powder I did not like the taste of the flavoured powder.
I felt unwell2 after taking the flavoured powder.
The flavoured powder had a bad aftertaste.
The flavoured powder did not mix well with water.
It took too much time to prepare the flavoured powder.
I did not like the smell of the flavoured powder.
I did not like the feeling of the flavoured powder in my mouth.
I did not like the flavoured powder.
I did not like what the flavoured powder looks like after I mix it
with water.
The flavoured powder mixed with water was difficult to
swallow.
I did not like the colour of the flavoured powder.
48
28
19
9
5
4
3
2
1
1
1
Unflavoured
powder
o I did not like the taste of the unflavoured powder.
o I felt unwell2 after taking the unflavoured powder.
o I did not like the smell of the unflavoured powder.
o The unflavoured powder had a bad aftertaste.
o It was too troublesome to prepare the unflavoured powder.
o The unflavoured powder sticks to my teeth or throat.
o I did not like the feeling of the unflavoured powder in my
mouth.
o I could not find food/drink to mix the unflavoured powder with.
o I did not like the colour of the unflavoured powder.
69
35
19
8
7
7
5
3
2 1Number of participants who reported the reason for not taking or stopping taking each delivery
vehicle. A single participant could report more than one reason for not taking or stopping taking a
delivery vehicle. 2‘Unwell’ included mention of nausea, vomiting, dizziness, headache, sleepiness, and bloating. Most
references were to nausea and vomiting.

74
Table 22. Summary of food and drinks most frequently reported by participants (n=132) that
were mixed with the unflavoured powder during the run-in period.
Number of participants
Foods
Banana (mashed) 25
Mashed vegetable-based dish 22
Daal (liquid lentil-based dish) 14
Rice-based dishes 7
Drinks
Water 57
Tea 4

75
a)
b)
c)
Conventional tablets Chewable tablets Flavoured powder Unflavoured powder
Figure 11. Participant responses for willingness to use the delivery vehicles for free (a), at a
cost (b), and the amount they would spend (c). (Tablets n=121; chewable tablets n=64;
flavoured powder n=49; unflavoured powder n=37).
0
0.1
0.2
0.3
0.4
0.5
0.6
0.7
Always Usually Sometimes Once in a while Never I do not know
0
0.1
0.2
0.3
0.4
0.5
0.6
Always Usually Sometimes Once in a while Never I do not know
0
0.1
0.2
0.3
0.4
0.5
1 lozenge 1 tamarind
pickle
1 hairband 1 hairslide 1 pair of
bangles
Would not
buy
I do not
know
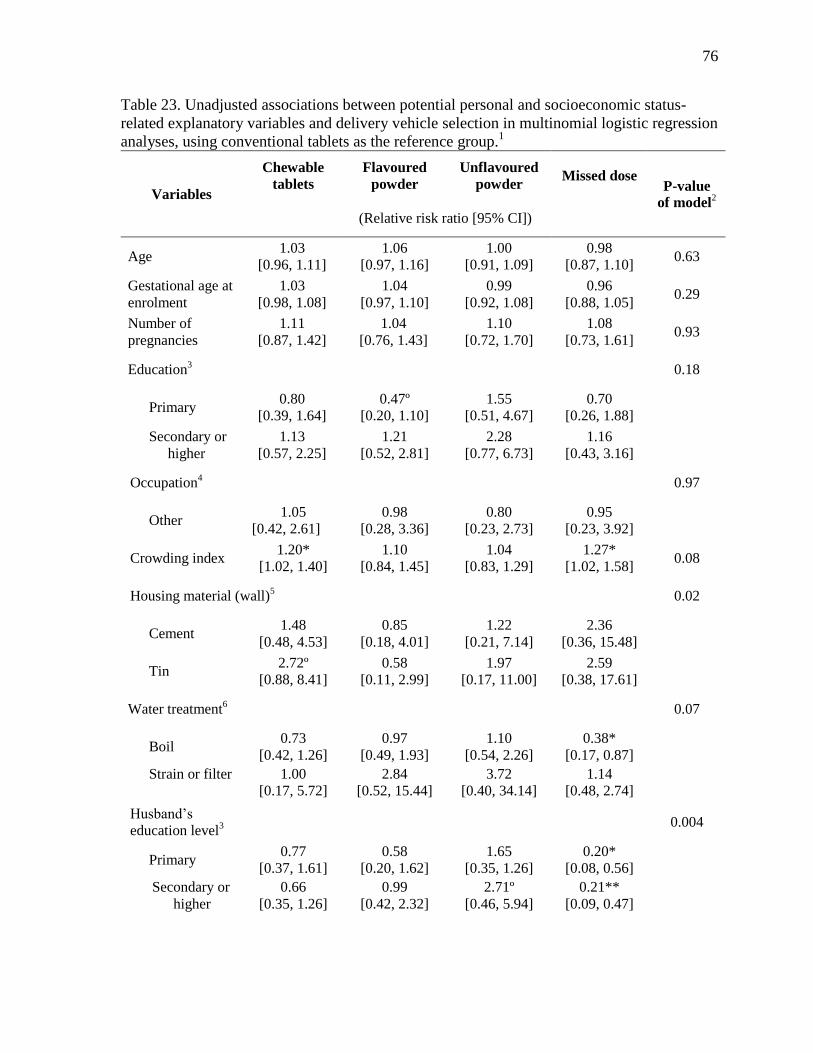
76
Table 23. Unadjusted associations between potential personal and socioeconomic status-
related explanatory variables and delivery vehicle selection in multinomial logistic regression
analyses, using conventional tablets as the reference group.1
Variables
Chewable
tablets
Flavoured
powder
Unflavoured
powder Missed dose
P-value
of model2
(Relative risk ratio [95% CI])
Age 1.03
[0.96, 1.11]
1.06
[0.97, 1.16]
1.00
[0.91, 1.09]
0.98
[0.87, 1.10] 0.63
Gestational age at
enrolment
1.03
[0.98, 1.08]
1.04
[0.97, 1.10]
0.99
[0.92, 1.08]
0.96
[0.88, 1.05] 0.29
Number of
pregnancies
1.11
[0.87, 1.42]
1.04
[0.76, 1.43]
1.10
[0.72, 1.70]
1.08
[0.73, 1.61] 0.93
Education3 0.18
Primary 0.80
[0.39, 1.64]
0.47º
[0.20, 1.10]
1.55
[0.51, 4.67]
0.70
[0.26, 1.88]
Secondary or
higher
1.13
[0.57, 2.25]
1.21
[0.52, 2.81]
2.28
[0.77, 6.73]
1.16
[0.43, 3.16]
Occupation4
0.97
Other 1.05
[0.42, 2.61]
0.98
[0.28, 3.36]
0.80
[0.23, 2.73]
0.95
[0.23, 3.92]
Crowding index 1.20*
[1.02, 1.40]
1.10
[0.84, 1.45]
1.04
[0.83, 1.29]
1.27*
[1.02, 1.58] 0.08
Housing material (wall)5 0.02
Cement 1.48
[0.48, 4.53]
0.85
[0.18, 4.01]
1.22
[0.21, 7.14]
2.36
[0.36, 15.48]
Tin 2.72º
[0.88, 8.41]
0.58
[0.11, 2.99]
1.97
[0.17, 11.00]
2.59
[0.38, 17.61]
Water treatment6 0.07
Boil 0.73
[0.42, 1.26]
0.97
[0.49, 1.93]
1.10
[0.54, 2.26]
0.38*
[0.17, 0.87]
Strain or filter 1.00
[0.17, 5.72]
2.84
[0.52, 15.44]
3.72
[0.40, 34.14]
1.14
[0.48, 2.74]
Husband’s
education level3
0.004
Primary 0.77
[0.37, 1.61]
0.58
[0.20, 1.62]
1.65
[0.35, 1.26]
0.20*
[0.08, 0.56]
Secondary or
higher
0.66
[0.35, 1.26]
0.99
[0.42, 2.32]
2.71º
[0.46, 5.94]
0.21**
[0.09, 0.47]

77
Variables
Chewable
tablets
Flavoured
powder
Unflavoured
powder Missed dose
P-value
of model2
(Relative risk ratio [95% CI])
Husband’s
occupation7
0.002
Salaried job 0.72
[0.38, 1.36]
1.02
[0.48, 2.20]
1.31
[0.61, 2.82]
0.30
[0.12, 0.76]
Private
business
0.66
[0.30, 1.48]
1.19
[0.44, 3.22]
0.60
[0.11, 3.16]
0.30
[0.09, 1.03]
Other 1.09
[0.47, 2.52]
0.32*
[0.11, 0.92]
0.56
[0.16, 2.01]
1.87
[0.63, 5.53]
1A separate model was run for each variable.
2 From the likelihood ratio chi-square test.
3 In comparison with no education.
4 In comparison with housewife.
5 In comparison with wood.
6 In comparison with no water treatment.
7 In comparison with day labourer.
ºp<0.10; *p<0.05; **p<0.01
Table 24. Unadjusted associations between potential past supplement or medicinal exposure-
related explanatory variables and delivery vehicle selection in multinomial logistic regression
analyses, using conventional tablets as the reference group.1
Variables
Chewable
tablets
Flavoured
powder
Unflavoured
powder Missed dose
P-value
of model2
(Relative risk ratio [95% CI])
Past conventional
tablet use
0.49*
[0.27, 0.90]
0.79
[0.31, 2.00]
0.73
[0.26, 2.05]
1.81
[0.32, 10.25] 0.08
Past chewable
tablet use
0.68
[0.39, 1.17]
0.74
[0.36, 1.54]
0.82
[0.37, 1.80]
1.01
[0.44, 2.36] 0.71
Past ORS use 1.00
[0.37, 2.71]
1.05
[0.31, 3.59]
0.89
[0.19, 4.18]
1.29
[0.50, 3.35] 0.92
Past powder use 0.77
[0.25, 2.36]
0.07***
[0.01, 0.31]
0.36
[0.08, 1.57]
0.66
[0.20, 2.18] 0.007
1A separate model was run for each variable.
2 From the likelihood ratio chi-square test.
*p<0.05; **p<0.01; ***p<0.001
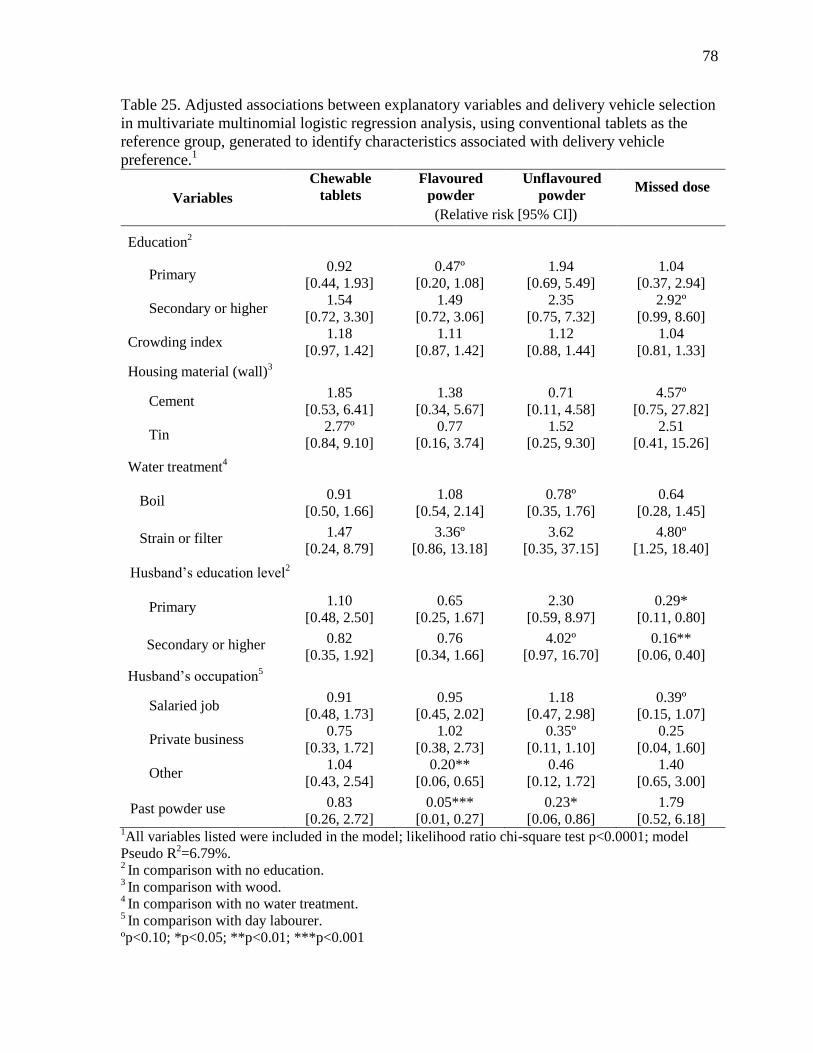
78
Table 25. Adjusted associations between explanatory variables and delivery vehicle selection
in multivariate multinomial logistic regression analysis, using conventional tablets as the
reference group, generated to identify characteristics associated with delivery vehicle
preference.1
Variables
Chewable
tablets
Flavoured
powder
Unflavoured
powder Missed dose
(Relative risk [95% CI])
Education2
Primary 0.92
[0.44, 1.93]
0.47º
[0.20, 1.08]
1.94
[0.69, 5.49]
1.04
[0.37, 2.94]
Secondary or higher 1.54
[0.72, 3.30]
1.49
[0.72, 3.06]
2.35
[0.75, 7.32]
2.92º
[0.99, 8.60]
Crowding index 1.18
[0.97, 1.42]
1.11
[0.87, 1.42]
1.12
[0.88, 1.44]
1.04
[0.81, 1.33]
Housing material (wall)3
Cement 1.85
[0.53, 6.41]
1.38
[0.34, 5.67]
0.71
[0.11, 4.58]
4.57º
[0.75, 27.82]
Tin 2.77º
[0.84, 9.10]
0.77
[0.16, 3.74]
1.52
[0.25, 9.30]
2.51
[0.41, 15.26]
Water treatment4
Boil 0.91
[0.50, 1.66]
1.08
[0.54, 2.14]
0.78º
[0.35, 1.76]
0.64
[0.28, 1.45]
Strain or filter 1.47
[0.24, 8.79]
3.36º
[0.86, 13.18]
3.62
[0.35, 37.15]
4.80º
[1.25, 18.40]
Husband’s education level2
Primary 1.10
[0.48, 2.50]
0.65
[0.25, 1.67]
2.30
[0.59, 8.97]
0.29*
[0.11, 0.80]
Secondary or higher 0.82
[0.35, 1.92]
0.76
[0.34, 1.66]
4.02º
[0.97, 16.70]
0.16**
[0.06, 0.40]
Husband’s occupation5
Salaried job 0.91
[0.48, 1.73]
0.95
[0.45, 2.02]
1.18
[0.47, 2.98]
0.39º
[0.15, 1.07]
Private business 0.75
[0.33, 1.72]
1.02
[0.38, 2.73]
0.35º
[0.11, 1.10]
0.25
[0.04, 1.60]
Other 1.04
[0.43, 2.54]
0.20**
[0.06, 0.65]
0.46
[0.12, 1.72]
1.40
[0.65, 3.00]
Past powder use 0.83
[0.26, 2.72]
0.05***
[0.01, 0.27]
0.23*
[0.06, 0.86]
1.79
[0.52, 6.18] 1All variables listed were included in the model; likelihood ratio chi-square test p<0.0001; model
Pseudo R2=6.79%.
2 In comparison with no education.
3 In comparison with wood.
4 In comparison with no water treatment.
5 In comparison with day labourer.
ºp<0.10; *p<0.05; **p<0.01; ***p<0.001

79
Table 26. Summary of the number of times health-related events were reported by
participants during weekly home-visits conducted throughout the selection period.1
Health-related events Tablets
n=361
Chewable
tablets
n=183
Flavoured
powder
n=144
Unflavoured
powder
n=84
Difficulty swallowing 3 (1%) 3 (2%) 7 (5%) 3 (4%)
Gagging 0 1 (0.5%) 2 (1%) 1 (1%)
Abdominal upset 2 (0.5%) 2 (1%) 1 (0.5%) 0
Abdominal pain 4 (1%) 4 (2%) 2 (1%) 2 (2%)
Nausea 13 (4%) 9 (4%) 20 (14%) 11 (13%)
Vomiting 10 (3%) 4 (2%) 13 (9%) 6 (7%)
Constipation 15 (4%) 13 (7%) 6 (4%) 4 (5%)
Diarrhea 0 0 0 0
Any event 47 (13%) 36 (20%) 51 (35%) 27 (32%) 1 Participants were only asked about health-related events for a delivery vehicle if they had taken that
delivery vehicle during the previous week. Participants could report more than one event.
80
3.4. Discussion
An important component of a successful micronutrient intervention is the selection of a
delivery vehicle that is readily accepted by the target population. This study aimed to
evaluate preference and acceptability of four different options for delivering calcium
(conventional tablets, chewable tablets, unflavoured powder, and flavoured powder) at the
WHO recommended dose among pregnant women in urban Bangladesh. The study design
allowed us to solicit objective and subjective delivery vehicle preferences, which we feel
further increased our understanding of participants’ actual preference.
A definite difference in preference among the delivery vehicles was evident. The most
frequently selected delivery vehicle during the 21-day selection period was the conventional
tablet. Preference for the conventional tablet was supported by participants’ positive
perceptions of palatability (taste, mouth feel, aftertaste, and smell), product characteristics
(colour, tablet size, required number of units), and ease of use (swallowing). Objective
demonstration of the overall preference for conventional tablets was consistent with
participants’ subjective reporting of conventional tablets as the most common ‘most
preferred’ option at the end of the study. The least selected and reported least preferred
delivery vehicle was the unflavoured powder. The use of the unflavoured powder was
associated with less favourable perception of palatability and preparatory characteristics
(ease of mixing and finding appropriate foods for mixing).
3.4.1. Changes in delivery vehicle selection over time
We observed changes over time in participants’ delivery vehicle selection. There were two
prominent trends: (1) the shift in delivery vehicle selections with the progression of each
study week; and (2) the notable increase in conventional tablet selection on the first day of
each study week (CHW home-visit days).
3.4.1.1. Weekly progression and delivery vehicle selection
Within the period of one week, the frequency of conventional tablet selection decreased. This
trend differed within weeks as there was less variation in the frequency of delivery vehicle

81
selections made within-week from week 2 to week 3 compared to week 1. The within-week
decline in conventional tablet selection appeared to be associated with a small increase in
selection of the powder-based supplements, particularly the flavoured powder, whereas
chewable tablet selection remained relatively stable over time. However, during the entire
selection period, conventional tablet preference increased overall, chewable tablet preference
was relatively unchanged, and powder-based supplement preference decreased.
Of the participants who exhibited early commitment to a delivery vehicle choice, most
selected the same delivery vehicle on each day of the selection period. This could be
interpreted as a strong preference, perhaps pre-existing or in response to trying each delivery
vehicle during the run-in period. Convergence over time to a steady delivery vehicle choice
(delayed commitment) was primarily observed for conventional tablet selection. The largest
group of participants (50%), however, elected to vary their daily delivery vehicle selection
throughout the selection period. Among these participants, the most frequently observed
combinations of delivery vehicle selection included selecting all four delivery vehicle (42%)
and the conventional and chewable tablets (31%).This may have been due to some
participants’ desire for variability or uncertainty as to what they preferred, suggesting that
their daily behaviour many not necessarily have been reflective of actual delivery vehicle
preference.
3.4.1.2. Effect of home-visits on delivery vehicle selection
A surprising observation was the noticeable increase in conventional tablet selection on the
first day of each study week (the day on which weekly home-visits were conducted by
CHWs). Between study weeks, there was little variation in the proportion of delivery vehicle
selections on home-visit days. This cyclical pattern complicated the interpretation of
preference among participants. Of those participants who selected conventional tablets on
one home-visit day, the majority selected the conventional tablets on the other CHW home-
visit days, although conventional tablet selection decreased the day after the home-visit.
There are two possible explanations for the trend of increased conventional tablet selection
on CHW home-visit days. First, it could be suggested that study personnel somehow

82
influenced choices made by participants at their weekly interactions, resulting in more
frequent selection of the conventional tablets. It is important to note that on home-visit days
participants did not select a delivery vehicle in front of CHWs, but rather at a time of the
participants own choosing during the day. Further discussion of the limitations associated
with study personnel and participant delivery vehicle selection can be found in section 3.4.7.
Alternatively, during these weekly face-to-face interactions, study workers reinforced to
participants that they were free to choose any delivery vehicle on any given study day.
Because of these reminders, we speculate that the selections made on home-visit days were
more reflective of participants’ actual delivery vehicle preference than selections on
subsequent days of the week. In fact, the proportion of conventional tablet selection on
home-visit days (77%) was more closely aligned with the proportion of participants whose
subjective delivery vehicle preference was conventional tablets (74%), compared to the
observed conventional tablet selection on non-CHW days (59%).
3.4.2. Interpretation of delivery vehicle perceptions and use
3.4.2.1. Conventional Tablets
Conventional tablets have traditionally been a staple formulation within supplementation
regimens given their familiarity, ease of use, and long shelf-life. Their acceptability within
prenatal supplementation regimens has been well documented (Young et al. 2010; Kulkarni
et al. 2009; Aguayo et al. 2005). For example, in Bangladesh iron-folic acid tablets for
prenatal supplementation are widely available. The relative size of iron-folic acid tablets
(generally containing 60 mg of iron and 400 µg of folic acid plus excipients) is much smaller
than calcium tablets (generally containing 500-600 mg of calcium plus excipients). The
challenges in meeting the WHO calcium recommendations for the prevention of HDP, could
compromise adherence to a conventional tablet supplementation strategy given the dosing
requirement (three times daily) and tablet size. In this study, participants were required to
take three conventional calcium tablets (3 x 500 mg of calcium to reach the suggested dose
of 1500 mg of calcium/day).
83
Objective and subjective conventional tablet preference was supported by participants’
expression of increased favourability for the palatability, product, and ease of use
characteristics for the conventional tablet; particularly in comparison with the powdered
delivery vehicles. Interim study results demonstrated very little negative perception of any of
the conventional tablet’s acceptability-related characteristics of interest, while there was a
near absence of any negative perceptions from post-study data. One exception was that 61%
and 72% of participants found the size of the conventional tablets to be ‘a little big’ from
interim and post-study data, respectively. The requirement to take three conventional tablets
per day was not perceived to be a limitation of conventional tablet selection among
participants, as 86% of participants reported that the number of required units was
‘convenient’ or ‘somewhat convenient.’ However, it should be noted that if the size of the
conventional tablets were to be decreased, participants would need to take more units to
consume the WHO recommended dose. Decreasing the size of the tablets should be
considered cautiously as participants found the required number of units for the chewable
tablets (five versus three) to be significantly less convenient. Therefore, increasing the
number of required units could have implications on adherence if scaled-up in the future.
3.4.2.2. Chewable tablets
Since chewable calcium tablets are not widely available in Bangladesh, the chewable tablets
used in this study were imported from Canada. Chewable tablets were used in the WHO
multicentre randomized trial of calcium supplementation among pregnant women with low
calcium intake (Villar et al. 2006). In the present study, participants were required to take 5
chewable tablets per day (5 x 300 mg of calcium to reach the suggested dose of 1500 mg of
calcium/day); conversely, in the WHO study three chewable tablets per day were prescribed
(3 x 500 mg). A 500 mg chewable calcium tablet was not available over the counter in
Canada, so we chose to use the simplest single dose unit that would provide participants a
total of 1500 mg of elemental calcium per day. The palatability and perceived acceptability
of the chewable tablets used in the WHO multicentre trial have not been reported in the
literature.
84
Following the run-in period, the median Likert scale responses for chewable tablets were ‘I
somewhat liked it’ for taste, mouth feel, and aftertaste, and ‘I am indifferent’ for smell.
However, there was a relatively equal distribution between positive (‘I really like it’ and ‘I
somewhat liked it’) and negative responses (‘I somewhat did not like it’ and ‘I really did not
like it’). This same distribution of positive and negative scores was also seen for product
characteristics. In the post-study survey, after chewable tablets were selected at least once by
53% of participants and on 20% of the selection period days, palatability responses became
more positive. The top reasons reported by participants for not or stopping taking the
chewable tablets included that they were too hard to chew and that they did not like the taste.
Interspersed conventional and chewable tablet consumption was one of the top three delivery
vehicle selection combinations. The proportion of participants selecting the chewable tablets
was relatively stable over time, though it decreased on home-visit days conducted by CHWs.
This could lend support to the hypothesis that some participants took chewable tablets to
introduce variety into their supplement selection, even though the chewable tablets were less
preferred than conventional tablets.
3.4.2.3. Powders
A powder-based calcium delivery vehicle was the innovative formulation proposed and
designed by our SickKids-led research team. Based on the low adherence with tablet-based
supplementation regimens (Galloway et al. 2002), the large size of conventional calcium
tablets, and the success of multiple micronutrient powders as a home-fortification approach
for infants and young children, it was hypothesized that a powder to be mixed in a semi-
liquid food or drink could have the potential for success. However, there were two major
characteristics of the powdered-products that likely contributed to their low acceptance
among participants: (1) the total mass of powder required given the WHO recommended
dose, coating of the granules, and necessary additional excipients; and (2) the organoleptic
nature of the granules themselves. The powders contained 1.5 grams of elemental calcium, as
per the WHO recommendation, which equates to nearly 4 grams of calcium carbonate.
Forming the calcium granules and coating the granules with the pH-dependent coating added
considerably more bulk, such that there was an approximate 33% weight gain. The final total

85
weight of one dose of the powder was approximately 11 grams because it was necessary to
add suspension agents to prevent the granules settling or sticking within the serving
container. When compared to a single dose of Sprinkles, weighing about 1 gram, at most, the
powder-based delivery vehicles contained substantially more weight and volume. When
considered in isolation, the coated calcium and iron/folic acid granules were around 0.5 mm
in diameter. At this size, the granules were visible within a food or drink preparation and had
a distinguishable mouth feel, sometimes sticking to one’s teeth. If chewed, a slightly bitter
taste was detectable. The suspension agents also changed the viscosity of the food or drink
medium.
3.4.2.3.1. Flavoured powder
We proposed an orange-flavoured powder given the wide use of other similar products
available in Bangladesh (ORS and orange beverage flavour crystals). ORS, designed to
prevent and treat dehydration, are commonly used in Bangladesh to treat acute diarrheal
diseases. Tang®, a sugar crystal-based orange-flavoured beverage powder that is widely
consumed throughout Bangladesh and commonly advertised in public spaces, inspired our
selection of a synthetic-orange flavouring. An additional consideration in selecting a
flavoured powder was that consuming a drink could be more acceptable given anticipated
difficulty associated with swallowing calcium tablets given their large size.
Participants’ perception of the flavoured powder's palatability characteristics in this study
was generally equally distributed among positive and negative scores from interim
questionnaire responses, and largely positive post-study. However, only 45% of participants
consumed the flavoured powder at least once during the selection period and the taste of the
powder was attributed to why 37% of participants did not use or stopped using the powder.
Although the flavoured powder was reportedly easy to add and mix with water, the granules
often did not mix uniformly and a residual amount adhered to the serving container.
While there have been published accounts of the use of multiple micronutrient-fortified
powdered fruit drink for supplementation among women of varying age and demographics in
different low-income countries, acceptability has not been the focus of most previous

86
research. Hyder et al. (2007) reported that adolescent girls in Bangladesh liked the beverage
and found the taste to be pleasant. In Tanzania, Latham et al. (2003) similarly reported that
pregnant and lactating women liked the beverage and found the taste pleasant. A concurrent
sub-study among a small sample of the Tanzanian participants found that participants
reported preferring the beverage form to tablets or injections when social attitudes were
examined through the use of anthropologic methods of participant observation (Benjamin
and Ash 2003). However, the micronutrient fortified beverages did not contain calcium.
In a study conducted by Young et al. (2010), detailed target-user perceptions surrounding
sensory characteristics, ease of use, and perceived health effects were collected for
‘Nutrivida.’ Nutrivida is a fortified, whole milk-based powder containing multiple
micronutrients, provided to pregnant women from their first prenatal visit within the
Oportunidades poverty alleviation programme in Mexico that started in 1997. Although
designed to be similar to a common culturally-accepted drink, actual consumption of
Nutrivida within the programme’s target population was recorded to be low in recent years.
In evaluating the acceptability of Nutrivida, pregnant and lactating participants expressed
dislike of the smell, taste, and texture, and found it cumbersome to store and prepare. When
provided with tablets and Sprinkles as alternative supplements, a strong preference for the
tablets and Sprinkles was indicated. Although both our flavoured powder and Nutrivida were
developed given their similarities to commonly accepted drinks within the targeted
population, both were less preferred to conventional tablets. This clearly demonstrates the
importance of the evaluation of a product's acceptance and potential for consumption within
the targeted population prior to scaling within a programmatic intervention. Additionally, it
would suggest that perhaps tablets are not the limiting factor within supplementation
regimens, as further discussed in Section 3.4.8.
3.4.2.3.2. Unflavoured powder
As previously mentioned, the unflavoured powder was modelled after Sprinkles. There are
two important distinctions to be made between multiple micronutrient powders and the
unflavoured powder used in the context of the study: the volume of powder required is much
greater in the current study than is the case for multiple micronutrient powders, and finding
87
acceptable foods for mixing can be more challenging. It may be harder for adults to find
appropriate semi-liquid foods to mix the powder with, particularly when a large amount of
powder must be added.
Participants were counselled about appropriate foods and drinks for mixing with the
unflavoured powder and provided with a list of suggested foods and drinks. However, food
and drink items were not provided to participants to ensure that participants’ choices were as
reflective as possible of a real-world setting. Some participants reported using the
recommended foods and drinks, although there were frequent reports of mixing the
unflavoured powder with water, and occasional reports of mixing with solid, rice-based
foods. The unflavoured powder also contained a thickening agent so that the granules would
not settle, which changed the consistency of the medium used for mixing. These factors
likely contributed to the predominantly negative perception of palatability-associated factors
among participants. Of the reasons provided by participants for stopping or not using the
unflavoured powder during the selection period, a few listed difficulty finding appropriate
mixing foods or drinks, although the majority reported dislike of the taste. The associated
food/drink requirements and, consequently, sub-optimal palatability characteristics of the
unflavoured powder likely led to the notable lack of unflavoured powder selection among
participants.
There have been two published accounts of Sprinkles use among pregnant women. In a study
conducted in Bangladesh comparing the effect of multiple micronutrient powder
supplementation with conventional tablets in controlling anaemia among pregnant women,
Choudhury et al. (2012) noted that finding appropriate foods to mix with the powder in a
rural setting was difficult since rice was a dietary staple, and food itself could be scarce.
Lower adherence was also observed within the powder group, postulated to be due to the use
of foods that mixed poorly with the powder, which affected product acceptability and
decreased participants’ desire to adhere to the dosing regimen. These are important
considerations given that the targeted recipients of a prenatal calcium supplementation
intervention are likely to live in rural, potentially food insecure settings, where dietary
calcium intake is low. Participants in the study conducted by Young et al. (2010) strongly

88
preferred Sprinkles over a fortified beverage (Nutrivida), as previously described. Between
tablets and Sprinkles, however, tablets were preferred because of the simplicity and absence
of a perceivable taste or smell.
The cultural context of medicine and food in the study population may have influenced
perceptions of the unflavoured powder acceptability. Tablets may have been more preferable
because they were the traditional supplement form, compared to the powder-based options
which are a relatively novel mechanism for micronutrient delivery. Considering the results of
our study collectively with Young et al. (2010), both studies having assessed participant
perceptions of palatability, product characteristics, and ease of use after exposure to different
alternative delivery vehicles, the importance of broadening the concept of acceptability
beyond palatability characteristics, particularly taste, is evident. A lack of acceptance was
linked to complexities of using certain delivery vehicles, which demonstrates the importance
of identifying appropriate nutritional supplements within a given socio-cultural context.
Although the selection of an acceptable supplement alone is not enough to ensure regular
consumption in a programmatic setting, assessing why supplements are or are not acceptable
and identification of barriers and facilitators of regular use has the potential to improve
adherence.
3.4.3. Willingness to use delivery vehicles in the future
Understanding and recognizing the health-related benefits of supplements have been
identified as important factors in motivating supplement use within supplementation
programmes (Young et al. 2010; Adu-Afarwuah et al. 2008). In our study, most participants
did not have prior knowledge of the benefits of calcium supplementation during pregnancy
and the participants’ exposure to the calcium delivery vehicles was short in duration.
Consequently, it is unlikely that participants would have recognized any health benefits in
taking the supplements, though this was not an outcome of this study. Therefore, any data
collected regarding participants’ willingness to use the supplements in the future is best
interpreted primarily from a product development viewpoint.

89
If a participant did not report having tried a delivery vehicle during the selection period, her
intention surrounding future use was not captured. Of the participants surveyed post-study,
98%, 97%, 94%, and 72% of participants indicated they would be willing to use the
conventional tablets, chewable tablet, flavoured powder, and unflavoured powder,
respectively, in a future pregnancy if offered for free. However, the proportion of participants
willing to use the delivery vehicles on a daily basis differed by delivery vehicle. As well, if
offered at a cost, the proportion of participants reporting they would ‘always’ use the
delivery vehicles further decreased. The most frequently reported amount that participants
were willing to spend was the equivalent of 1 lozenge (a locally made candy), which was the
lowest costing value at 1 taka (about 1.25 cents) per dose. The discrepancy between the
number of participants willing to use the supplements, the number that would use them
regularly, and the number that would regularly buy them for a small amount of money could
suggest that cost may be a barrier to micronutrient supplements in this population (Kulkarni
et al. 2009). In the future, it will be important to ensure that available supplements are
affordable to the target population.
3.4.4. Predictors of delivery vehicle selection
Few participant characteristics were found to be predictive of participants’ delivery vehicle
preference independent of other factors in the model. There was some suggestion that family
characteristics could be predictive of delivery vehicle selection. Elucidating potential
associations will require further study. Additional variables that could be considered include
antenatal care-seeking behaviours, such as compliance with the WHO recommended number
of visits based on completed gestational weeks and gestational age at first visit; health-
related behaviours such as health care-seeking and vaccination status; and more direct
measures of socio-economic status (e.g., household income and expenditures).
3.4.5. Health-related events
Post-study questionnaire data showed that several participants elected not to take or to stop
taking the chewable tablets and, to a greater extent, the powder-based delivery vehicles
because they felt unwell afterwards. In terms of the powder-based delivery vehicles,
Choudhury et al. (2012) found that women in rural Bangladesh were less adherent within the

90
multiple micronutrient powder arm of their study, in part because women expressed concern
that adding a multiple micronutrient powder to their food would worsen nausea associated
with pregnancy. While it is unknown whether reported side-effects were caused by the
supplements, available literature does suggest that during pregnancy side-effects such as
nausea, vomiting, constipation, and abdominal pain are likely to be mistakenly due to
prenatal supplements (Milman et al. 2006).
3.4.6. Duration of the selection period
This study was designed to elicit participant delivery vehicle preference by looking at
choices made over a prolonged period of time. To our knowledge, it was the first study in
which participants were provided with different supplement formulations and had the
freedom to choose which formulation they took on a day to day basis. As previously
discussed, food-based palatability assessment has been traditionally performed at a set point
in time, while in a micronutrient supplementation context assessment of palatability and/or
acceptability generally follows a prolonged intervention period. As such, whether the
extended selection period employed in this study was warranted or increased the
interpretability of participant preference could be questioned.
Comparison of the cumulative proportion of selections made when the selection period was
plotted continuously provides some insight. There is noticeable variability in choices made
during the first week of the selection period, although preference for the conventional tablets
was evident. Considering financial and time-associated limitations, one could argue that the
clear preference for the convention tablets was sufficiently evident in considering just the
first day of the selection period following the run-in period (conventional tablets were
selected 77% of participants). Alternatively, one could also suggest that selections from the
first week was sufficient to draw necessary conclusions (conventional tablets were selected
by >50%). However, the observed shift in delivery vehicle selection with time during the
selection period did demonstrate the benefit of repeated observations. That there was little
variation in delivery vehicle selections between two and three weeks of observation showed
progressive stabilization in delivery vehicle selections made by participants. Overall, a two
week selection period would likely balance the increased interpretability of an extended
91
selection period in accounting for the repeatability of choices with time and money factors
associated with a three week selection period. It is important to note that whether preference
for the delivery vehicles, and particularly the dominance of conventional tablets, as
determined in Dhaka, Bangladesh would be comparable to a rural setting, to a different
country setting, or otherwise is hard to determine given the importance of cultural contexts
without repeating the study.
3.4.7. Study limitations
Within the study design, biases were introduced at the different steps. From inclusion and
exclusion criteria, since participants were required to have a fixed address and remain in
Dhaka those excluded likely had different demographic characteristics from those recruited.
Additionally, those who had a past history of obstetric complications were excluded, even
though they were potentially at increased risk of developing HDP and ideal targets of the
WHO recommendation. Several participants also withdrew during or after completing the
run-in phase, largely as a result of reported nausea and vomiting in the context of pregnancy.
In comparing the baseline demographics of those who withdrew and those who remained
enrolled in the study, significant differences were found for gestational age (withdrawals:
19.1 ± 5.8 versus enrolled: 21.9 ± 5.2; p<0.05) and husband's occupation (proportionally
more withdrawals had husbands with higher earning professions) (Appendix S). This could
suggest that the sample was not representative of the target population.
Study personnel were not blinded to the delivery vehicle choices made by participants. The
possibility of CHW-influence on participant delivery vehicle selection is plausible given the
trend in delivery vehicle selection on home-visit days. Within a few weeks of the study
launch, preference for conventional tablets was apparent in the increased stock depletion
relative to the other delivery vehicles. Additionally, CHWs were aware that several
participants did not like the taste and other attributes of the powders following the interim
questionnaire. Since they conducted the weekly health-related events questionnaires, CHWs
were also aware of the attribution of feeling unwell to taking the powders among some
participants. While CHWs were instructed not to influence choices, comments made to
participants conversationally could have unintentionally biased selection, despite random

92
quality control checks conducted to ensure the consistency of messages provided to
participants.
That this study was conducted in an urban centre, while the majority of the Bangladeshi
population lives rurally, potentially affects the generalizability of the results within
Bangladesh. Furthermore, delivery vehicle preference in this population, as determined by
this study, may not be reflective of other countries; especially given the important role of
cultural practices and beliefs in health-related behaviours and decision making. Of additional
importance is consideration of the function of socio-cultural factors in the perception of food
items and medicines.
Finally, the applicability of conventional tablets as the preferred delivery vehicle for calcium
as determined in this study to other nutrients should be interpreted carefully. It is not possible
to completely separate out the effect of the number of units of the tablet-based supplements
or weight of the powder-based supplements on the overall inferences. To generalize the
finding that conventional tablets were most preferred and state that conventional tablets are
the optimal micronutrient supplement form in all cases would be incorrect. Preference for
conventional tablets was likely attributable in part to the nature of the delivery vehicles used
in this study, the number of units per delivery vehicle, and the bulk of the calcium
supplementation dose given the WHO recommendation. Most micronutrients are required in
lesser amounts, meaning that the preparation and product characteristics would likely differ,
thus a powder or chewable tablet form delivery vehicle may be well accepted by targeted
users.
3.4.8. Knowledge gained and implications for programmes and public health
The results obtained in this study demonstrated a clear preference for conventional tablets
among participants in the context of prenatal calcium supplementation. Although we used a
conventional calcium tablet purchased off the shelf, the technology that was developed in the
production of the powders to allow for concomitant provision of calcium and iron could be
applied to a conventional tablet form, thus addressing challenges associated with the WHO
prenatal calcium recommendation.

93
As conventional tablets are the standard within supplementation programming, it is necessary
to reflect on the implications of conventional tablet preference having come full circle. While
74% of participants demonstrated preference for convention tablets, one could question how
the remaining 26% would fare if conventional tablets were the only supplement offered
within a programmatic setting. Provision of both the conventional and chewable tablets
would mean that more than 90% of participants would have access to their objectively most
preferred delivery vehicle. From a feasibility and cost standpoint, production and provision
of two delivery vehicles for calcium is likely not feasible, therefore it would make the most
sense to offer the most preferred option. However, preference and acceptance do not predict
adherence, which is important in the overall effectiveness of micronutrient interventions.
This study was not designed to assess adherence given its short duration, but a reasonable
next step would be to see if there was any correlation between adherence and preference for
the different supplement forms, or adherence and delivery vehicle selection patterns.
Participants’ widespread acceptance of the conventional calcium tablets suggests that
providing calcium in this form may not be as limiting in relation to adherence as has been
commonly assumed. Rather, perhaps limited supply availability may have a greater
contribution to the reported lack of adherence within convention tablet supplementation
regimens (Galloway et al. 2002). Further investigation to clarify the contributory roles of
different factors in relation to adherence is warranted, although from a policy stance ensuring
available supply would likely be beneficial.
3.5. Conclusions
This study examined preference and acceptability for four different prenatal calcium delivery
vehicles at the WHO recommended dose for the prevention of hypertensive diseases of
pregnancy among pregnant women in Dhaka, Bangladesh. The most preferred delivery
vehicle was determined to be conventional tablets. Preference for the conventional tablets
was demonstrated objectively as participants selected the conventional tablets most
94
frequently during the selection period, as well as subjectively from post-study interviews
(74% and 77% of participants, respectively). Furthermore, on any given study day,
conventional tablets were selected by nearly half of the participants. Preference for the
conventional tablets was supported by the near absence of negative perceptions for
characteristics of interest such as palatability (taste, mouth feel, aftertaste, smell), product
factors (colour and shape), and ease of use (ease of taking and swallowing). Between the
other delivery vehicles (chewable tablets, flavoured powder, and unflavoured powder), the
most frequently reported reasons for not selecting or stopping delivery vehicle use during the
selection period pertained to dislike of palatability characteristics (particularly taste) and
finding the products inconvenient to use. The unflavoured powder was found to be used least
during the selection period (5% of selections among participants) and reportedly least
preferred (58% of participants). Use of both of the powder-based delivery vehicles decreased
overall with study progression; this was largely attributable to amount of powder one was
required to mix with food or drink, and that the granules were visually distinguishable and
had a palpable mouth feel.
Observing participants’ delivery vehicle choices over a prolonged selection period was
considered to be of benefit, as it lent to the repeatability of delivery vehicle selection
observations over time. However, two weeks of observation would likely be a sufficient
amount of time from which to draw appropriate conclusions regarding delivery vehicle
preference given the stabilization of delivery vehicle selections from week 2 to week 3.
Overall, this study demonstrated the importance of assessing participants’ preference and
perceptions of product characteristics and ease of use, in addition to palatability. Given the
identification of conventional tablets as a potentially successful ingestible form for calcium
supplementation at the WHO recommended dose, development of a conventional tablet
employing the innovative microencapsulation technology applied to the powders to
simultaneously provide calcium and iron should be pursued. Although the selection of an
acceptable supplement alone is not enough to ensure the regular consumption of a
supplement within a programmatic setting, assessing factors surrounding supplement
95
acceptability and identification of barriers and facilitators of regular use has the potential to
improve adherence.
3.6. Future directions
Future research for prenatal calcium supplementation at the WHO recommended dose should
include observing delivery vehicle preference in a rural setting, where food availability is
likely to be different and targeted users are more likely to be food insecure, as well as
assessing delivery vehicle perceptions in a different country setting given the role of socio-
cultural factors in health-related behavioural decision making. There could be potential
benefit in modifying the study design such that participant selection choices are constrained,
leading to a better representation of actual preference. Additionally, assessment of delivery
vehicle modality given a smaller calcium dose should be considered since the dose
dependency of calcium on absorption is not well understood, nor has the optimal amount of
prenatal calcium supplementation to prevent HDP been ascertained. This could also add to
the generalizability of delivery vehicle preference given that most micronutrients are
required in smaller, physiological amounts, though the role of cultural perceptions on
delivery vehicle choice should not be forgotten. Finally, efforts should be made to further
understand adherence among participants who exhibited preference for the different delivery
vehicles and different delivery vehicle selection patterns.

96
CHAPTER 4 REFERENCES
Abu-Saad K, Fraser D. Maternal nutrition and birth outcomes. Epidemiol Rev 2010; 32:5–
25.
Adu-Afarwuah S, Lartey A, Zeilani M, Dewey KG. Acceptability of lipid-based nutrient
supplements (LNS) among Ghanaian infants and pregnant or lactating women. Matern
Child Nutr. 2011; 7(4):344-356.
Aguayo VM, Koné D, Bamba SI, Diallo B, Sidibé Y, Traoré D, et al. Acceptability of
multiple micronutrient supplements by pregnant and lactating women in Mali. Public
Health Nutr. 2005; 8(1):33-37.
Allen LH. Multiple micronutrients in pregnancy and lactation: an overview. Am J Clin Nutr.
2005; 81:1206S-12S.
Ananth CV, Basso O. Impact of pregnancy-induced hypertension on stillbirth and neonatal
mortality. Epidemiology. 2010; 21(1):118-123.
Barker DJ. Maternal nutrition, fetal nutrition, and disease in later life. Nutrition 1997;
13:807-813.
Behar J, Kerstein MD. Intestinal calcium absorption: differences in transport between
duodenum and ileum. AJP. 1976; 230(5):1255-1260.
Belizan JM, Villar J. The relationship between calcium intake and edema, proteinuria, and
hypertension-gestasis: an hypotheses. Am J Clin Nutr. 1980; 33:2202-2210.
Belizan JM, Villar J, Repke J. The relationship between calcium intake and pregnancy-
induced hypertension: up-to-date evidence. Am J Obstet Gynecol. 1988; 158(4):898-
902.
Belizan JM, Villar J, Gonzalez L, Campodonico L, Bergel E. Calcium supplementation to
prevent hypertensive disorders of pregnancy. N Engl J Med. 1991; 325(20):1399-1405.
Bellamy L, Casas JP, Hingorani AD, Williams DJ. Pre-eclampsia and risk of cardiovascular
disease and cancer in later life: Systematic review and meta-analysis. BMJ. 2007;
335:974.
Benjamin M, Ash DM. Drinking to their health: social analysis of a micronutrient-fortified
beverage field trial. Food Nutr Bull. 2003; 24(4 Suppl):S141-S145.

97
Bhutta ZA, Ahmed T, Black RE, Cousens S, Dewey K, Giugliani E, et al. What works?
Interventions for maternal and child undernutrition and survival. Lancet 2008; 371:417-
440.
Black RE. Micronutrients in pregnancy. Br J Nutr. 2001; 85 Suppl 2:S193-197.
Black A, Topping J, Durham B, Farquharson R, Fraser W. A detailed assessment of
alterations in bone turnover, calcium homeostasis, and bone density in normal
pregnancy. J Bone Miner Res. 2000; 15:557-564.
Black RE, Allen LH, Bhutta ZA, Caulfield LE, de Onis M, Ezzati M, et al. Maternal and
child undernutrition: global and regional exposures and health consequences. Lancet
2008; 371:243-260.
Bronner F. Mechanisms of intestinal calcium absorption. J Cell Biochem. 2003; 88(2):387–
393.
Carroli G, Merialdi M, Wojdyla D, Abalos E, Campodonico L, Yao SE, et al. Effects of
calcium supplementation on uteroplacental and fetoplacental blood flow in low-calcium-
intake mothers: a randomized controlled trial. Am J Obstet Gynecol. 2010; 202(1):45.e1-
45.e9.
Choudhury N, Aimone A, Hyder SM, Zlotkin SH. Relative efficacy of micronutrient
powders versus iron-folic acid tablets in controlling anemia in women in the second
trimester of pregnancy. Food Nutr Bull. 2012; 33(2):142-149.
Cohen J, Rosen K, Russell KK, Wakefield CE, Goodenough B. Paediatric oncology patient
preference for oral nutritional supplements in a clinical setting. Support Care Cancer.
2011; 19(9):1289-1296.
Collins M. Preeclampsia and cerebral palsy: are they related? Dev Med Child Neurol. 1998;
40:207-211.
Cook JD, Dassenko SA, Whittaker P. Calcium supplementation: effect on iron absorption.
Am J Clin Nutr. 1991; 53(1):106-111.
Cross NA, Hillman LS, Allen SH, Krause GF, Vieira NE. Calcium homeostasis and bone
metabolism during pregnancy, lactation, and postweaning: a longitudinal study. Am J
Clin Nutr. 1995; 61:514-523.
Crowther CA, Hiller JE, Pridmore B, Bryce R, Duggan P, Hague WM, et al. Calcium
supplementation in nulliparous women for the prevention of pregnancy-induced
hypertension, preeclampsia and preterm birth: an Australian randomized trial. Aust N Z
J Obstet Gynaecol. 1999; 39(1):12-18.
98
Davidsson L, Kastenmayer P, Szajewska H, Hurrell RF, Barclay D. Iron bioavailability in
infants from an infant cereal fortified with ferric pyrophosphate or ferrous fumarate. Am
J Clin Nutr. 2000; 71(6):1597-1602.
Dawson-Hughes B, Seligson FH, Hughes VA. Effects of calcium carbonate and
hydroxyapatite on zinc and iron retention in postmenopausal women. Am J Clin Nutr.
1986; 44(1):83-88.
den Uyl D, Geusens PP, van Berkum FN, Houben HH, Jebbink MC, Lems WF. Patient
preference and acceptability of calcium plus vitamin D3 supplementation: a randomised,
open, cross-over trial. Clin Rheumatol. 2010; 29(5):465-472.
Duley L. The global impact of pre-eclampsia and eclampsia. Semin Perinatol. 2009;
33(3):130-137.
Food and Agricultural Organization and World Health Organization. Calcium Requirements.
Report of an FAO/WHO Expert Group. Rome: Food and Agricultural Organization;
1962.
Gaitan D, Flores S, Saavedra P, et al. Calcium does not inhibit the absorption of 5 milligrams
of nonheme or heme iron at doses less than 800 milligrams in nonpregnant women. J
Nutr. 2011; 141(9):1652-1656.
Gallacher SJ, Fraser WD, Owens OJ, et al. Changes in calciotrophic hormones and
biochemical markers of bone turnover in normal human pregnancy. Eur J Endocrinol.
1994; 131:369-374.
Galloway R, McGuire J. Determinants of compliance with iron supplementation: supplies,
side effects, or psychology? Soc Sci Med. 1994; 39(3):381-390.
Galloway R, Dusch E, Elder L, Achadi E, Grajeda R, Hurtado E, et al. Women’s perceptions
of iron deficiency and anemia prevention and control in eight developing countries. Soc
Sci Med. 2002; 55:529-544.
Gibson RS, Perlas LA, Hotz C. Improving the bioavailability of nutrients in plant foods at
the household level. Proc Nutr Soc. 2006; 5:160-168.
Gluckman PD, Hanson MA. Living with the past: evolution, development, and patterns of
disease. Science. 2004; 305:1733-1736.
Gunshin H, Mackenzie B, Berger UV, et al. Cloning and characterization of a mammalian
proton-coupled metal-ion transporter. Nature. 1997; 388:482-488.
Habli M, Levine RJ, Qian C, Sibai B: Neonatal outcomes in pregnancies with preeclampsia
or gestational hypertension and in normotensive pregnancies that delivered at 35, 36, or
37 weeks of gestation. Am J Obstet Gynecol. 2007; 197(4):406.e401-407.

99
Hallberg L, Brune M, Erlandsson M, Sandberg AS, Rossander-Hulten L. Calcium: effect of
different amounts on nonheme- and hemeiron absorption in humans. Am J Clin Nutr.
1991; 53:112-119.
Hallberg L, Rossander-Hulthén L, Brune M, Gleerup A. Inhibition of haem-iron absorption
in man by calcium. Br J Nutr. 1992; 69:533-540.
Haller H, Oeney T, Hauck U, Distler A, Philipp T. Increased intracellular free calcium and
sensitivity to angiotensin II in platelets of preeclamptic women. Am J Hypertens. 1989;
2(4):238-243.
Hamlin RHJ. Prevention of pre-eclampsia. Lancet. 1962; 1:864-865.
Harinarayan CV, Ramalakshmi T, Venkataprasad U. High prevalence of low dietary calcium
and low vitamin D status in healthy south Indians. Asia Pac J Clin Nutr. 2004;
13(4):359-364.
Heaney RP, Skillman TG. Calcium metabolism in normal human pregnancy. J Clin
Endocrinol Metab 1971; 33:661-670.
Heaney RP, Weaver CM, Fitzsimmons ML. Influence of calcium load on absorption fraction.
J Bone Miner Res. 1990; 5(11):1135-1138.
Helen Keller International, World Food Programme. Table of Nutrient Composition of
Bangladeshi Foods: English version with particular emphasis on vitamin A content.
Dhaka, Bangladesh: Helen Keller International; 1988.
Hels O, Hassan B, Tetens I, Haraksingh Thilsted S. Food consumption, energy and nutrient
intake and nutritional status in rural Bangladesh: changes from 1981 – 1982 to 1995 –
96. E J Clin Nutr. 2003; 57: 586-594.
Hofmeyr GJ, Lawrey TA, Atallah AN, Duley L. Calcium supplementation during pregnancy
for preventing hypertensive disorders and related problems (Review). Cochrane
Database Syst Rev. 2010; 8:CD001059.
Hojo M, Suthanthiran M, Helseth G, August P. Lymphocyte intracellular free calcium
concentration is increased in preeclampsia. Am J Obstet Gynecol. 1999; 180(5):1209-
1214.
Hoppe M, Hulthén L. The interaction between calcium and iron: choice of methodology is
crucial for outcome and conclusions. J Nutr. 2012; 142(3):581.
Hoque MM, Bulbul T, Mahal M, Islam NA, Ferdausi M. Serum homocysteine in pre-
eclampsia and eclampsia. Bangladesh Med Res Counc Bull. 2008; 34(1):16-20.

100
Hosmer DW, Lemeshow S. Applied Logistic Regression. 2nd Edition. New York: John
Wiley; 2000.
Hyder SM, Haseen F, Khan M, Schaetzel T, Jalal CS, Rahman M, et al. A multiple-
micronutrient-fortified beverage affects hemoglobin, iron, and vitamin A status and
growth in adolescent girls in rural Bangladesh. J Nutr. 2007; 137(9):2147-2153.
Imdad A, Jabeen A, Bhutta ZA. Role of calcium supplementation during pregnancy in
reducing risk of developing gestational hypertensive disorders: a meta-analysis of
studies from developing countries. BMC Public Health. 2011; 11(Suppl 3):S18.
Institute of Medicine. Dietary Reference Intakes for Calcium and Vitamin D. Washington,
DC: The National Academic Press. 2011.
Islam MZ, Lamberg-Allardt C, Kärkkäinen M, Ali SM. Dietary calcium intake in
premenopausal Bangladeshi women: do socio-economic or physiological factors play a
role? Eur J Clin Nutr. 2003; 57(5):674-680.
Kararli TT. Comparison of the gastrointestinal anatomy, physiology, and biochemistry of
humans and commonly used laboratory animals. Biopharm Drug Dispos. 1995;
16(5):351-380.
Khan KS, Wojdyla D, Say L, Gülmezoglu AM, Van Look PFA. WHO analysis of causes of
maternal death: a systematic review. Lancet. 2006; 367:1066-1074.
King JC. Physiology of pregnancy and nutrient metabolism. Am J Clin Nutr 2000; 71:1218-
1225.
Kippler M, Goessler W, Nermell B, Ekström EC, Lönnerdal B, El Arifeen S, et al. Factors
influencing intestinal cadmium uptake in pregnant Bangladeshi women--a prospective
cohort study. Environ Res. 2009; 109(7):914-921.
Kulkarni B, Christian P, LeClerq SC, Khatry SK. Determinants of compliance to antenatal
micronutrient supplementation and women's perceptions of supplement use in rural
Nepal. Public Health Nutr. 2010; 13(1):82-90.
Kumar A, Devi SG, Batra S, Singh C, Shukla DK. Calcium supplementation for the
prevention of pre-eclampsia. Int J Gynecol Obstet. 2009; 104(1):32-36.
Latham MC, Ash DM, Makola D, Tatala SR, Ndossi GD, Mehansho H. Efficacy trials of a
micronutrient dietary supplement in schoolchildren and pregnant women in Tanzania.
Food Nutr Bull. 2003; 24(4 Suppl):S120-S128.
Lawn JE, Cousens S, Zupan J. 4 million neonatal deaths: When? Where? Why? Lancet.
2005; 365:891-900.

101
Leeman L, Fontaine P. Hypertensive disorders of pregnancy. Am Fam Physician. 2008;
78(1):93-100.
Levine RJ, Hauth JC, Curet LB, Sibai BM, Catalano PM, Morris CD, et al. Trial of calcium
to prevent preeclampsia. N Engl J Med. 1997; 337(2):69-76.
Lopez-Jaramillo P, Narvaez M, Weigel RM, Yepez R. Calcium supplementation reduces the
risk of pregnancy-induced hypertension in an Andes population. BJOG. 1989;
96(6):648-655.
Lopez-Jaramillo P, Narvaez M, Felix C, Lopez A. Dietary calcium supplementation and
prevention of pregnancy hypertension. Lancet. 1990; 335:293.
Lopez-Jaramillo P, Delgado F, Jacome P, Teran E, Ruano C, Rivera J. Calcium
supplementation and the risk of preeclampsia in Ecuadorian pregnant teenagers. Obstet
Gynecol. 1997; 90: 162-167.
Lutsey PL, Dawe D, Villate E, Valencia S, Lopez O. Iron supplementation compliance
among pregnant women in Bicol, Philippines. Public Health Nutr. 2008; 11(1):76-82.
Lynch SR. The effect of calcium on iron absorption. Nutr Res Rev. 2000; 13:141-158.
Milman N, Byg KE, Bergholt T & Eriksen L. Side effects of oral iron prophylaxis in
pregnancy – myth or reality? Acta Haematol. 2006; 115:53-57.
Miret S, Simpson RJ, McKie AT. Physiology and molecular biology of dietary iron
absorption. Annu Rev Nutr. 2003; 23:283-301.
Nasrin D, Larson CP, Sultana S, Khan TU. Acceptability of and Adherence to Dispersible
Zinc Tablet in the Treatment of Acute Childhood Diarrhoea. J Health Popul Nutr. 2005;
23(3):215-221.
National Institute of Population Research and Training (NIPORT), Mitra and Associates,
Macro International. Banagladesh Demographic and Health Survey 2007. Dhaka,
Bangladesh and Calverton, Maryland, USA: National Institute of Population Research
and Training, Mitra and Associated, Macro International. 2009.
Naylor KE, Iqbal P, Fledelius C, Fraser RB, Eastell R. The effect of pregnancy on bone
density and bone turnover. J Bone Miner Res. 2000; 15:129-137.
Osterberg L, Blaschke T. Adherence to Medication. N Engl J Med. 2005; 353:487-349.
Parazzini F, Benedetto C, Frusca T, et al. Italian Study of Aspirin in Pregnancy: Low-dose
aspirin in prevention and treatment of intrauterine growth retardation and pregnancy-
induced hypertension. Lancet. 1993; 341(8842):396-400.
102
Patterson WB. Calcium deficiency as the prime cause of hypertension in pregnancy: a
hypothesis. Asia Oceania J Obstet Gynaecol. 1984; 10(4):485-498.
Purwar M, Kulkarni H, Motghare V, Dhole S. Calcium supplementation and prevention of
pregnancy induced hypertension. J Obstet Gynaecol Res. 1996; 22(5):425-430.
Ray J, Vasishta K, Kaur S, Majumdar S, Sawhney H. Calcium metabolism in pre-eclampsia.
Int J Gynaecol Obstet. 1999; 66(3):245-250.
Rees TP, Howe I. A Randomised, Single-blind, Crossover Comparison of the Acceptability
of the Calcium and Vitamin D3 Supplements Calcichew D3 Forte® and Ad Cal D3® in
Elderly Patients. Current Medical Research and Opinion. 2000; 16(4):245-251.
Resnick LM, Müller FB, Laragh JH. Calcium-regulating hormones in essential hypertension.
Relation to plasma renin activity and sodium metabolism. Ann Intern Med. 1986;
105(5):649-654.
Richardson BE, Baird DD. A Study of Milk and Calcium Supplement Intake and Subsequent
Preeclampsia in a Cohort of Pregnant Women. Am J Epidemiol. 1995; 141(7):667-673.
Ritchie LD, Fung EB, Halloran BP, et al. A longitudinal study of calcium homeostasis during
human pregnancy and lactation and after resumption of menses. Am J Clin Nutr. 1998;
67:693-701.
Ritchie LD, King JC. Dietary calcium and pregnancy-induced hypertension: is there a
relation? Am J Clin Nutr. 2000; 71(5):1371S-1374S.
Robinson R. The fetal origins of adult disease. BMJ. 2001; 322:375-376.
Rogers, WH. Regression standard errors in clustered samples. Stata Technical Bulletin.
1993; 13:19–23.
Rouault TA. The intestinal heme transporter revealed. Cell. 2005; 122:649-651.
Ryan M, Major K, Skatun D. Using discrete choice experiments to go beyond clinical
outcomes when evaluating clinical practice. J Eval Clin Pract. 2005; 11(4):328-338.
Saigal S, Doyle LW. An overview of mortality and sequelae of preterm birth from infancy to
adulthood. Lancet. 2008; 371:261-269.
Sanchez-Ramos L, Briones DK, Kaunitz AM, Delvalle GO, Gaudier FL, Walker CD.
Prevention of pregnancy-induced hypertension by calcium supplementation in
angiotensin II-sensitive patients. Obstet Gynecol. 1994; 84(3):349-353.
Scholl TO. Iron status during pregnancy: setting the stage for mother and infant. Am J Clin
Nutr. 2005; 81(5):1218S-1222S.

103
Seck BC, Jackson RT. Determinants of compliance with iron supplementation among
pregnant women in Senegal. Public Health Nutr. 2008; 11(6):596-605.
Shimantik. Brief on Shimantik. Dhaka, Bangladesh: Shimantik. 2011.
Shimantik. A Few Word on Shimantik. Dhaka, Bangladesh: Shimantik. 2012.
Sibai BM. Diagnosis and management of gestational hypertension and preeclampsia. Obstet
Gynecol. 2003; 102(1):181-192.
Streatfield PK, Arifeen SE, Al-Sabir A, and Jamil K. Bangladesh Maternal Mortality and
Health Care Survey 2010: Summary of key findings and implications. Dhaka,
Bangladesh: NIPORT. 2011.
Stoltzfus RJ, Dreyfuss ML. Guidelines for the Use of Iron Supplements to Prevent and Treat
Iron Deficiency Anemia. Geneva: International Nutritional Anaemia Consultative
Group/UNICEF/WHO; 1998.
Stone H, Sidel JL. Sensory evaluation practices, Third Edition. New York: Academic Press;
2004.
Tenhola S, Rahiala E, Halonen P, et al. Maternal preeclampsia predicts elevated blood
pressure in 12-year-old children: evaluation by ambulatory blood pressure monitoring.
Pediatr Rev. 2006; 59:320-324.
United Nations Children’s Fund, World Health Organization, United Nations University.
Composition of a multi-micronutrient supplement to be used in pilot programmes among
pregnant women in developing countries. New York: UNICEF; 1999.
Vatten LJ, Romundstad PR, Holmen TL, et al. Intrauterine exposure to preeclampsia and
adolescent blood pressure, body size, and age at menarche in female offspring. Obstet
Gynecol. 2003; 101:529-533.
Victora CG, Adair L, Fall C, Hallal PC, Martorell R, Richter L, et al. Maternal and child
undernutrition: consequences for adult health and human capital. Lancet. 2008; 371:340-
357.
Villar J, Belizan J, Fisher P. Epidemiological observation on the relationship between
calcium intake and eclampsia. Int J Gynaecol Obstet. 1983; 21:271.
Villar J, Repke J, Belizan JM, Pareja G. Calcium supplementation reduces blood pressure
during pregnancy: results of a randomized controlled clinical trial. Obstet Gynecol.
1987; 70:317-322.

104
Villar J, Repke JT. Calcium supplementation during pregnancy may reduce preterm delivery
in high-risk populations. Am J Obstet Gynecol. 1990; 163:1124-1131.
Villar J, Abdel-Aleem H, Merialdi M, Mathai M, Ali MM, Zavaleta N, et al. World Health
Organization randomized trial of calcium supplementation among low calcium intake
pregnant women. Am J Obstet Gynecol. 2006; 194(3):639-649.
Wasserman RH. Vitamin D and the dual processes of intestinal calcium absorption. J Nutr.
2004; 134(11):3137-3139.
World Health Organization. Iron deficiency anaemia: assessment, prevention, and control: a
guide for programme managers. Geneva: World Health Organization; 2001.
World Health Organization. The world health report 2005. Geneva, Switzerland: World
Health Organization; 2005.
World Health Organization. WHO recommendations for prevention and treatment of pre-
eclampsia and eclampsia. WHO Press; 2011.
World Health Organization, Food and Agricultural Organization of the United Nations.
Vitamin and mineral requirements in human nutrition, Second edition. Geneva: World
Health Organization; 2004.
Young SL, Blanco I, Hernandez-Cordero S, Pelto GH, Neufeld LM. Organoleptic properties,
ease of use, and perceived health effects are determinants of acceptability of
micronutrient supplements among poor Mexican women. J Nutr. 2010; 140(3):605-611.
Yusuf HR, Akhter HH, Chowdhury ME, Rochat RW. Causes of Death among Women Aged
10–50 Years in Bangladesh, 1996–1997. J Health Popul Nutr. 2007; 25(3):302–311.

105
CHAPTER 5 APPENDICES

106
Appendix A – Eligibility Screening Script

107
Eligibility Screening Script
“I am ______________________________________, a staff member at Shimantik working
on a study conducted by The Hospital for Sick Children and ICDDR,B.
The purpose of this research study is to see which types of nutrition supplements pregnant
women choose to take most often, and to find out why they prefer some supplements instead
of others. If you join this study, you will be asked to participate for about 4 weeks (26 days).
During this time, you will take 4 different daily nutrient supplements:
tablet that is swallowed
tablet that is chewed
plain powder that can be added to cooked food or drink
flavoured powder that can be added to clean water.
Each supplement will contain 1500 mg of calcium (calcium carbonate). The powder
supplements will also contain 60 mg of iron (ferrous fumarate) and 400 µg of folic acid. All
supplements will be provided to you free of charge.
We want to see if you met the criteria for the study. With your permission, we would like to
ask you some basic questions about your age, residence, and past pregnancies. May I ask you
these questions?”
If the potential participant agrees to proceed, please refer to the
‘Participant Eligibility Screening Form’ and record all responses.
IF THE PARTICIPANT IS NOT FOUND TO BE ELIGIBLE:
“I have found that you are not specifically eligible for this study, because you
_______________ and we are seeking participation from women who
are__________________. Thank you very much for taking this time to talk with me.”
IF THE PARTICIPANT IS FOUND TO BE ELIGIBLE:
“I have found that you may be eligible to join this study. I would now like to test for
anaemia. To do this, I will prick your finger to get a drop of blood. You may feel a small
pinch. The drop of blood will then be assessed. May I do this test?”
If the potential participant agrees to proceed, please do the test.
Use the ‘Participant Eligibility Screening Form’ to record the outcome of the test.
108
IF THE PARTICIPANT’s Hb IS <90 g/L:
“I have found that you are not specifically eligible for this study, because your hemoglobin is
_______________ , which indicates that you are anaemic. We are seeking participation from
women who are__________________. Thank you very much for taking this time to talk with
me.” (Participant referred to appropriate staff member for more information and treatment.)
IF THE PARTICIPANT IS FOUND TO BE ELIGIBLE:
“I have found that you are eligible to join this study. As I told you earlier, we are doing a
research study on different delivery vehicles for a prenatal calcium supplement. It is known
that supplementation with at least 1500mg of calcium per day during pregnancy can decrease
the risk of pre-eclampsia in populations with low dietary calcium intake, like Bangladesh.
Pre-eclampsia is a disorder that occurs during pregnancy that is blood pressure related. The
information that is collected in this study will be used to find ways to deliver an acceptable
supplement to pregnant mothers in future. I would like to give you more detailed information
about the study procedures, so that you can make your own choice about whether or not you
would like to join the study.”
Please review the ‘Informed Consent Form.’
If the potential participant is interested, but needs time to consult family, please record her
contact information on the ‘Eligible Participant Contact Form’ and arrange a time for follow
up.
If the participant consents at this visit, record this outcome on the ‘Participant Eligibility
Screening Form’ and follow the prompts.

109
Appendix B – Participant Eligibility Screening Form

110
Participant Eligibility Screening Form
1. Screening ID (4 digit code)
2. Research Assistant Number (2 digit code)
3. Date of Interview (DD/MM/YY)
ALL of the following 5 criteria must be PRESENT for eligibility Mark if
‘yes’ ( )
4. Are you pregnant?
No ........................... 1
Yes ........................... 2
5. What is your age? (years)
6. Is the age between ≥18 and <40 years?
No ........................... 1
Yes ........................... 2
7. Do you live in Dhaka at fixed address?
No ........................... 1
Yes ........................... 2
8. Do you plan to stay in Dhaka for the
next month?
No ........................... 1
Yes ........................... 2
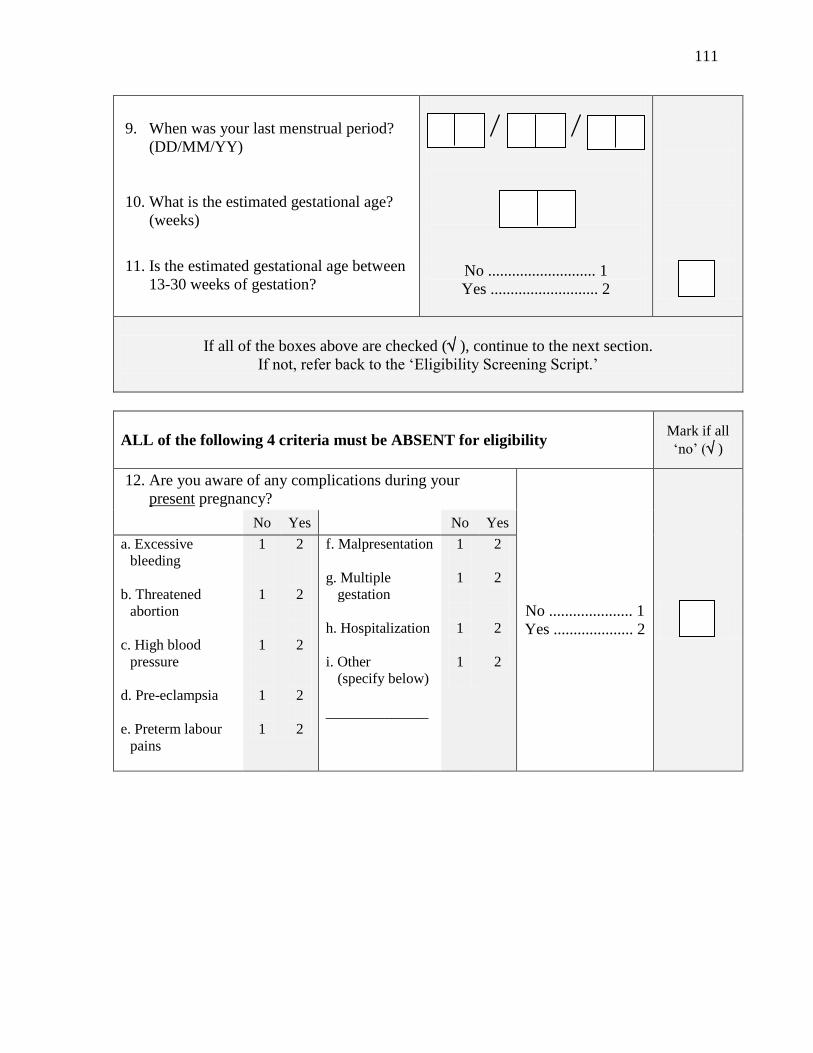
111
9. When was your last menstrual period?
(DD/MM/YY)
10. What is the estimated gestational age?
(weeks)
11. Is the estimated gestational age between
13-30 weeks of gestation?
No ........................... 1
Yes ........................... 2
If all of the boxes above are checked ( ), continue to the next section.
If not, refer back to the ‘Eligibility Screening Script.’
ALL of the following 4 criteria must be ABSENT for eligibility
Mark if all
‘no’ ( )
12. Are you aware of any complications during your
present pregnancy?
No ..................... 1
Yes .................... 2
No Yes No Yes
a. Excessive
bleeding
b. Threatened
abortion
c. High blood
pressure
d. Pre-eclampsia
e. Preterm labour
pains
1
1
1
1
1
2
2
2
2
2
f. Malpresentation
g. Multiple
gestation
h. Hospitalization
i. Other
(specify below)
______________
1
1
1
1
2
2
2
2

112
13. Do you have a complicated past medical or obstetric
history that may increase the risk of preterm birth or
labour/delivery complications?
No ..................... 1
Yes .................... 2
No Yes No Yes
a. Pre-eclampsia/
toxemia
b. Antenatal
hemorrhage
c. Very preterm
(< 32 wks)
1
1
1
2
2
2
d. Completed or
threatened
abortion
e. Other
______________
1
1
2
2
If both boxes above are checked ( ), subject may be eligible for the study.
Refer back to the ‘Eligibility Screening Script.’
Hemoglobin Assessment Mark if
‘no’ ( )
14. Hemoglobin level
15. Less than 90 g/L?
No ........................... 1
Yes ........................... 2
If the above box is checked ( ), subject is eligible for the study.
Refer back to the ‘Eligibility Screening Script.’
Consent process Outcome Mark if ‘yes’( )
16. Signed consent obtained today No ........................... 1
Yes ........................... 2
17. Agreeable, but needs more time to
decide
No ........................... 1
Yes ........................... 2
18. Refused participation No ........................... 1
Yes ........................... 2

113
If consent is obtained, proceed to the ‘Eligible Participant Contact Form.’
If the participant is agreeable to participation but needs time to consult with family, proceed
to the ‘Eligible Participant Contact Form.’ Ensure that arrangements for follow-up are made.
If the respondent does not wish to be included in the study, please thank her for her time.
End of interview. Please thank the respondent.
114
Appendix C – Eligible Participant Contact Form

115
Eligible Participant Contact Form
1. Screening ID (4 digit code)
2. Research Assistant Number (2 digit code)
3. Date of Interview (DD/MM/YY)
Name
Husband’s Name
Telephone Primary: Secondary:
Address
Directions to
participant’s house.
(draw map, including
landmarks)
Follow up
Arrangement
Notes
End of form. Please thank the respondent.
Once consent is obtained, please proceed to the ‘Participant Enrolment Form.’

116
Appendix D – Research Consent Form

117
Research Consent Form
Protocol Number: 12071 Version: 1.1 Date: 14-08-2012
Title of Research Project:
Preference, acceptability, and palatability of alternative delivery vehicles for prenatal
calcium supplementation among pregnant women in Bangladesh
Principal Investigators: Mr. Abdullah Al Mahmud (ICDDR,B; +8801730059357)
Dr. Stanley Zlotkin (Hospital for Sick Children)
Dr. Daniel Roth (Hospital for Sick Children)
Co-Investigators: Dr. Tahmeed Ahmed (ICDDR,B)
Dr. Munirul Islam (ICDDR,B)
Ms. Jo-Anna Baxter (Student, University of Toronto)
Purpose of the Research: Calcium is a nutrient that is important during pregnancy. In countries like Bangladesh, taking
extra calcium during pregnancy may lower the chance that a woman will have health
problems related to high blood pressure. Calcium is found in many foods, including animal
milk and fish bones. People can take extra calcium as supplements, which may also contain
other nutrients such as iron and folic acid. We have developed some new types of
supplements. These supplements are in the form of tablets that are swallowed or chewed, or
powders that are added to food or liquid. The purpose of this research study is to see which
types of supplements pregnant women choose to take most often, to find out why they prefer
some supplements instead of others, and to determine how much they might be willing to
spend on one dose. The information that is collected in this study will be used to find the best
ways to offer supplements to pregnant women in the future.
Description of the Research:
You are being invited to take part in this study because:
You are 13-30 weeks pregnant and in good general health
You are 18 to 40 years old
You plan to stay in Dhaka for the whole study (at least 4 weeks after joining)
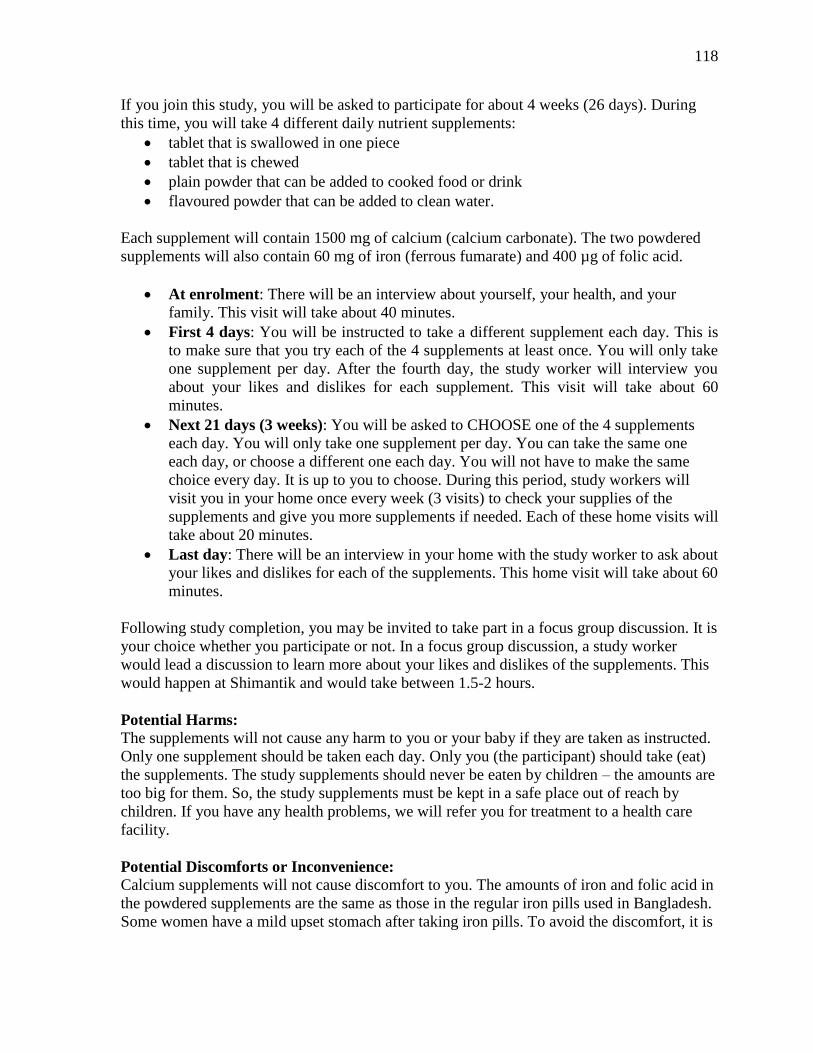
118
If you join this study, you will be asked to participate for about 4 weeks (26 days). During
this time, you will take 4 different daily nutrient supplements:
tablet that is swallowed in one piece
tablet that is chewed
plain powder that can be added to cooked food or drink
flavoured powder that can be added to clean water.
Each supplement will contain 1500 mg of calcium (calcium carbonate). The two powdered
supplements will also contain 60 mg of iron (ferrous fumarate) and 400 µg of folic acid.
At enrolment: There will be an interview about yourself, your health, and your
family. This visit will take about 40 minutes.
First 4 days: You will be instructed to take a different supplement each day. This is
to make sure that you try each of the 4 supplements at least once. You will only take
one supplement per day. After the fourth day, the study worker will interview you
about your likes and dislikes for each supplement. This visit will take about 60
minutes.
Next 21 days (3 weeks): You will be asked to CHOOSE one of the 4 supplements
each day. You will only take one supplement per day. You can take the same one
each day, or choose a different one each day. You will not have to make the same
choice every day. It is up to you to choose. During this period, study workers will
visit you in your home once every week (3 visits) to check your supplies of the
supplements and give you more supplements if needed. Each of these home visits will
take about 20 minutes.
Last day: There will be an interview in your home with the study worker to ask about
your likes and dislikes for each of the supplements. This home visit will take about 60
minutes.
Following study completion, you may be invited to take part in a focus group discussion. It is
your choice whether you participate or not. In a focus group discussion, a study worker
would lead a discussion to learn more about your likes and dislikes of the supplements. This
would happen at Shimantik and would take between 1.5-2 hours.
Potential Harms:
The supplements will not cause any harm to you or your baby if they are taken as instructed.
Only one supplement should be taken each day. Only you (the participant) should take (eat)
the supplements. The study supplements should never be eaten by children – the amounts are
too big for them. So, the study supplements must be kept in a safe place out of reach by
children. If you have any health problems, we will refer you for treatment to a health care
facility.
Potential Discomforts or Inconvenience: Calcium supplements will not cause discomfort to you. The amounts of iron and folic acid in
the powdered supplements are the same as those in the regular iron pills used in Bangladesh.
Some women have a mild upset stomach after taking iron pills. To avoid the discomfort, it is

119
best to take the supplements with food. Usually, the upset stomach goes away after the first
few days.
All visits will occur at your home, so you will not have to travel to join this study.
Potential Benefits:
To Individual Subjects:
You will not directly benefit from participating in this study. However, you will be offered
calcium, iron, and folic acid supplements free of charge for the remainder of your pregnancy,
even after the study ends. This may have some health benefits for you and your baby.
To Society:
Your involvement in this study will help health providers understand more about how best to
give nutrient supplements to pregnant women in Bangladesh. This information may help
women in your community to have healthier pregnancies and babies in the future.
Alternatives to Participation:
Participation in this study is voluntary. You can decide not to join this study. You have the
right to withdraw from the study at any time at your own discretion. If you choose to
withdraw from this study, you can still use services offered by any of the associated
organizations.
Confidentiality:
We will respect your privacy. No information about who you are will be given to anyone or
be published without your permission, unless the law requires us to do this. The documents
and information from this study will be stored in a secure, locked location. Only members of
the research team will be allowed to look at your information. The research team may also
give permission to other people from ICDDR,B and The Hospital for Sick Children to look at
the information. After the research study ends, the information will be kept for at least seven
years after the study report is published. Published reports will not show your name or
personal information.
Reimbursement:
There is no payment provided to you for joining this study. All visits will be made at your
house and supplements will be provided free of cost. At the end of the study, we will provide
you with a certificate in recognition of your time and effort.
Participation:
It is your choice to take part in this study. You can stop at any time. Your contact with
Shimantik will not be affected in any way by your choice to join or not to join this study.
After this study, we may create new tests, new medicines, or other things that may be worth
money. Although The Hospital for Sick Children and ICDDR,B may make money from
these inventions, we cannot share this money with you or other participants, now or in the
future.

120
If you become ill or are harmed specifically because of study participation, we will make
sure that you get medical care, free of cost to you. Your signing this consent form does not
interfere with your legal rights in any way. The staff of the study, any people who gave
money to pay for the study, or The Hospital for Sick Children and ICDDR,B are still
responsible, legally and professionally, for what they do.
Sponsorship:
The sponsor of this study is The Hospital for Sick Children. The funder of this research study
is the Sprinkles Global Health Initiative, a not-for-profit Canadian entity.
Conflict of Interest:
The Prinicipal Investigators, Dr. Zlotkin, Dr. Roth, and Mr. Mahmud, and other research
team members have no conflicts of interest to declare.
Consent:
By signing this form, I agree that:
1. You have explained this study to me. You have answered all my questions.
2. You have explained the possible harms and benefits (if any) of this study.
3. I know what I could do instead of taking part in this study. I understand that I have
the right not to take part in the study and the right to stop at any time. My decision
about taking part in the study will not affect my health care at associated
organizations.
4. I am free now, and in the future, to ask questions about the study.
5. I have been told that my study records will be kept private except as described to me.
6. I understand that no information about who I am will be given to anyone or be
published without first asking my permission.
7. I will not give the study supplements to anyone else. Most importantly, I will make
sure that children do not take (eat) any of the study supplements.
8. I have read and understood pages 1 to 5 of this consent form. I agree, or consent, to
take part in this study.
___________________________________ _____________________________________
Printed Name of Subject and Age Subject’s Signature and Date
Ask the participant to mark a “left thumb impression” in this box if
the participant is unable to provide a signature above.
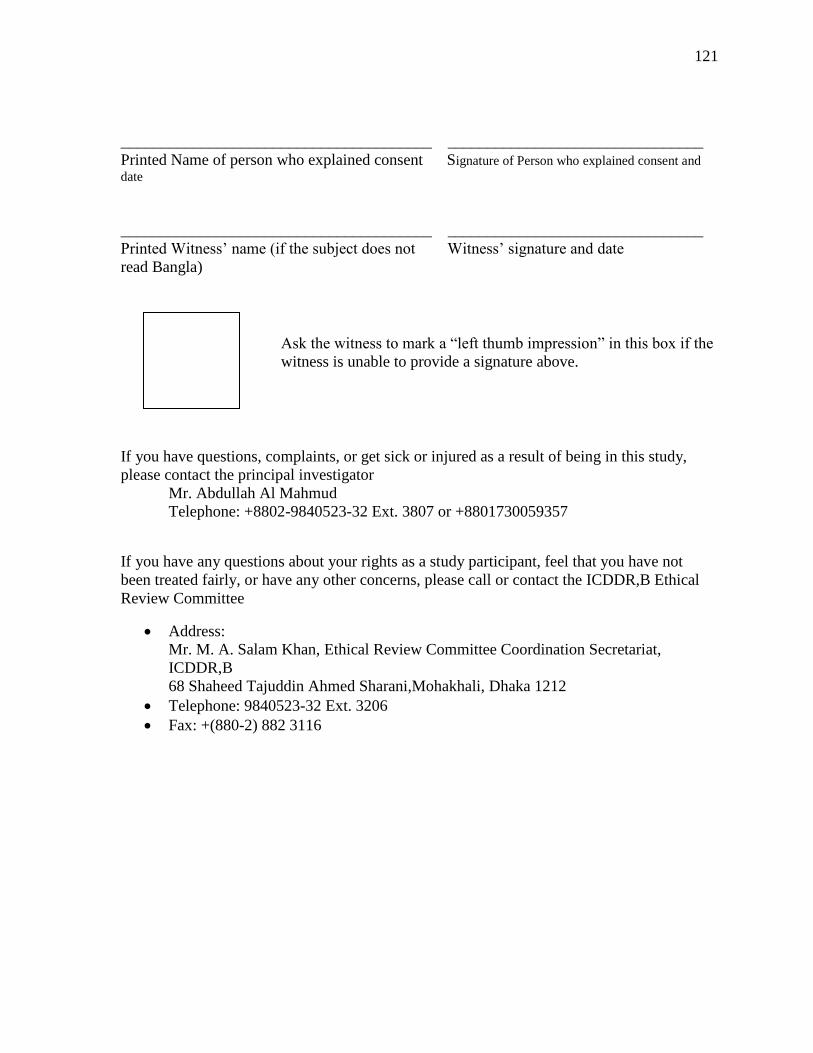
121
_______________________________________ ________________________________
Printed Name of person who explained consent Signature of Person who explained consent and
date
_______________________________________ ________________________________
Printed Witness’ name (if the subject does not Witness’ signature and date
read Bangla)
Ask the witness to mark a “left thumb impression” in this box if the
witness is unable to provide a signature above.
If you have questions, complaints, or get sick or injured as a result of being in this study,
please contact the principal investigator
Mr. Abdullah Al Mahmud
Telephone: +8802-9840523-32 Ext. 3807 or +8801730059357
If you have any questions about your rights as a study participant, feel that you have not
been treated fairly, or have any other concerns, please call or contact the ICDDR,B Ethical
Review Committee
Address:
Mr. M. A. Salam Khan, Ethical Review Committee Coordination Secretariat,
ICDDR,B
68 Shaheed Tajuddin Ahmed Sharani,Mohakhali, Dhaka 1212
Telephone: 9840523-32 Ext. 3206
Fax: +(880-2) 882 3116

122
Appendix E – Participant Enrolment Form

123
Participant Enrolment Form
1. Screening ID (4 digit code)
2. Research Assistant Number (2 digit code)
3. Date of Interview (DD/MM/YY)
4. Is the consent form signed?
No ........................... 1
Yes ........................... 2
Proceed only if the consent form has been signed.
5. Participant ID (3 digit code)
6. Estimated date of LMP (DD/MM/YY)
7. Taking any calcium, iron, and/or folic acid
supplements at this time?
a. calcium
b. iron
c. folic acid
No
1
1
1
Yes
2
2
2
End of form. Please thank respondent.
If the participant is found to be taking any supplements, please provide further instruction.

124
Appendix F – Baseline Questionnaire

125
Baseline Demographic Questionnaire
1. Participant ID (3 digit code)
2. Research Assistant Number (2 digit code)
3. Date of Interview (DD/MM/YY)
A. Demographic information and household socio-economic status
First, I would like to ask you some questions about yourself.
4. What is your date of birth? (MM/YY)
Unknown ...………….. 99
5. Have you ever attended school or madrasha?
No .......................................... 1 Yes, school ........................... 2 Yes, madrasha ...................... 3 Yes, both …………………. .. 4
6. What is the highest level of school education
you have completed?
No school ........................... 1 Primary ............................... 2 Secondary ............................ 3 Higher .................................. 4 Unknown ............................ 9
7. Can you read? No ...................................... 1 With difficulty ................... 2 Easily ................................. 3

126
8. What is your occupation?
Day labourer .................... 1 Agriculture ........................ 2 Salaried job ...................... 3 Private business ............... 4 Professional ..................... 5 Unemployed ..................... 6 Homemaker ....................... 7
Other _________________ 8
9. What is your current marital status?
Married ............................ 1 Separated ......................... 2 Deserted ............................ 3
Divorced .......................... 4 Widowed .......................... 5 Never married .................. 6
Not answered ................... 7
The following questions are about your family and household.
10. What is the highest level of education that
your husband has completed?
No education ...................... 1 Primary ................................ 2 Secondary ............................ 3 Higher ................................. 4 No husband ........................ 8 Unknown ............................ 9
11. What is your husband’s occupation?
Day labourer ....................... 1 Agriculture ......................... 2 Salaried job.......................... 3 Private business ................... 4 Professional ......................... 5 Unemployed ........................ 6
Other _________________ 8
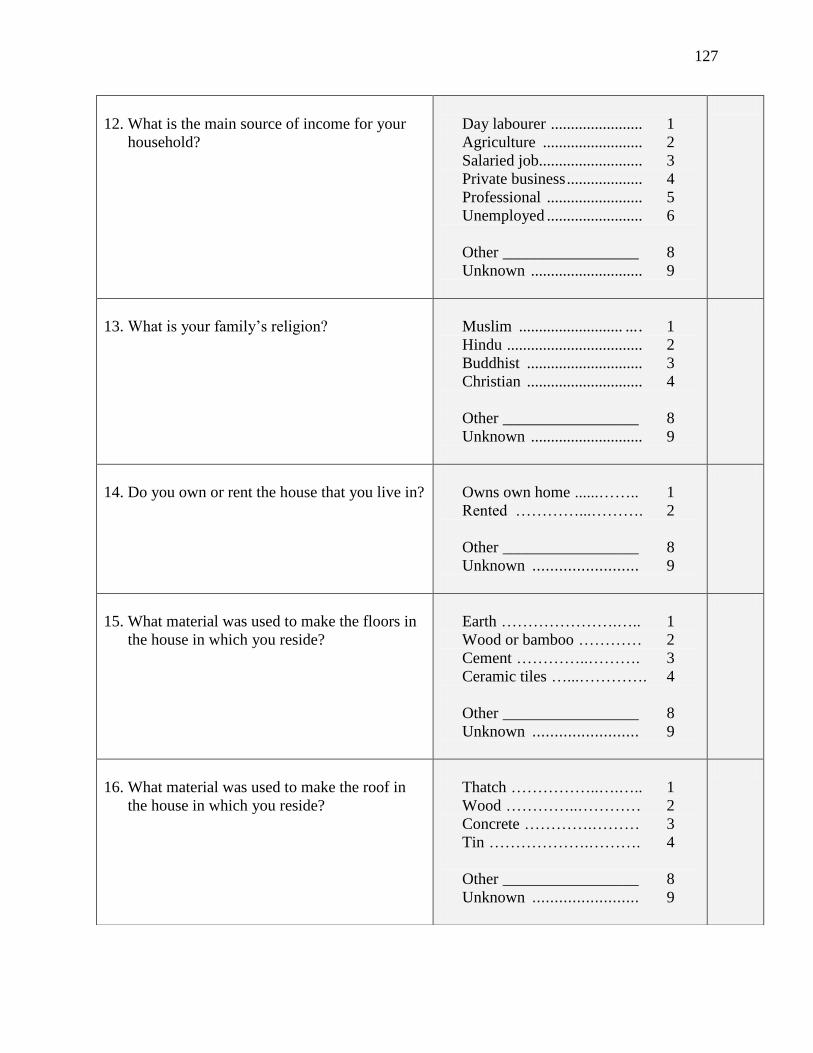
127
12. What is the main source of income for your
household?
Day labourer ....................... 1 Agriculture ......................... 2 Salaried job.......................... 3 Private business ................... 4 Professional ........................ 5 Unemployed ........................ 6
Other _________________ 8 Unknown ............................ 9
13. What is your family’s religion?
Muslim .......................... ... . 1 Hindu .................................. 2 Buddhist ............................. 3 Christian ............................. 4
Other _________________ 8 Unknown ............................ 9
14. Do you own or rent the house that you live in?
Owns own home ......…….. 1 Rented …………...………. 2
Other _________________ 8 Unknown ........................ 9
15. What material was used to make the floors in
the house in which you reside?
Earth ………………….….. 1 Wood or bamboo ………… 2 Cement …………..………. 3 Ceramic tiles …...…………. 4
Other _________________ 8 Unknown ........................ 9
16. What material was used to make the roof in
the house in which you reside?
Thatch ……………..….….. 1 Wood …………..………… 2 Concrete ………….……… 3 Tin ……………….………. 4
Other _________________ 8 Unknown ........................ 9
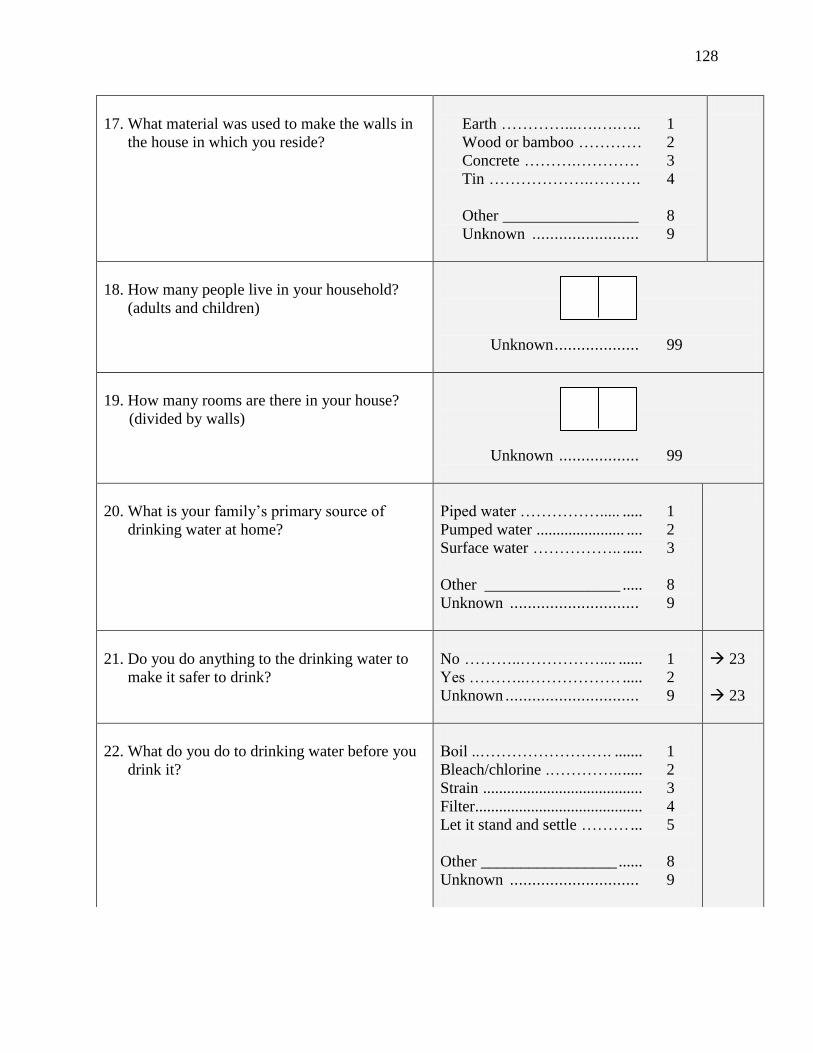
128
17. What material was used to make the walls in
the house in which you reside?
Earth …………...….….….. 1 Wood or bamboo ………… 2 Concrete ……….………… 3 Tin ……………….………. 4
Other _________________ 8 Unknown ........................ 9
18. How many people live in your household?
(adults and children)
Unknown ................... 99
19. How many rooms are there in your house?
(divided by walls)
Unknown .................. 99
20. What is your family’s primary source of
drinking water at home?
Piped water ……………..... ..... 1 Pumped water ...................... .... 2 Surface water …………….. ..... 3
Other _________________ ..... 8 Unknown ............................. 9
21. Do you do anything to the drinking water to
make it safer to drink?
No ………..…………….... ...... 1 Yes ………..……………… ..... 2 Unknown .............................. 9
23
23
22. What do you do to drinking water before you
drink it?
Boil ..……………………. ....... 1 Bleach/chlorine .………….. ..... 2 Strain ........................................ 3 Filter.......................................... 4 Let it stand and settle ……… ... 5
Other _________________ ...... 8 Unknown ............................. 9
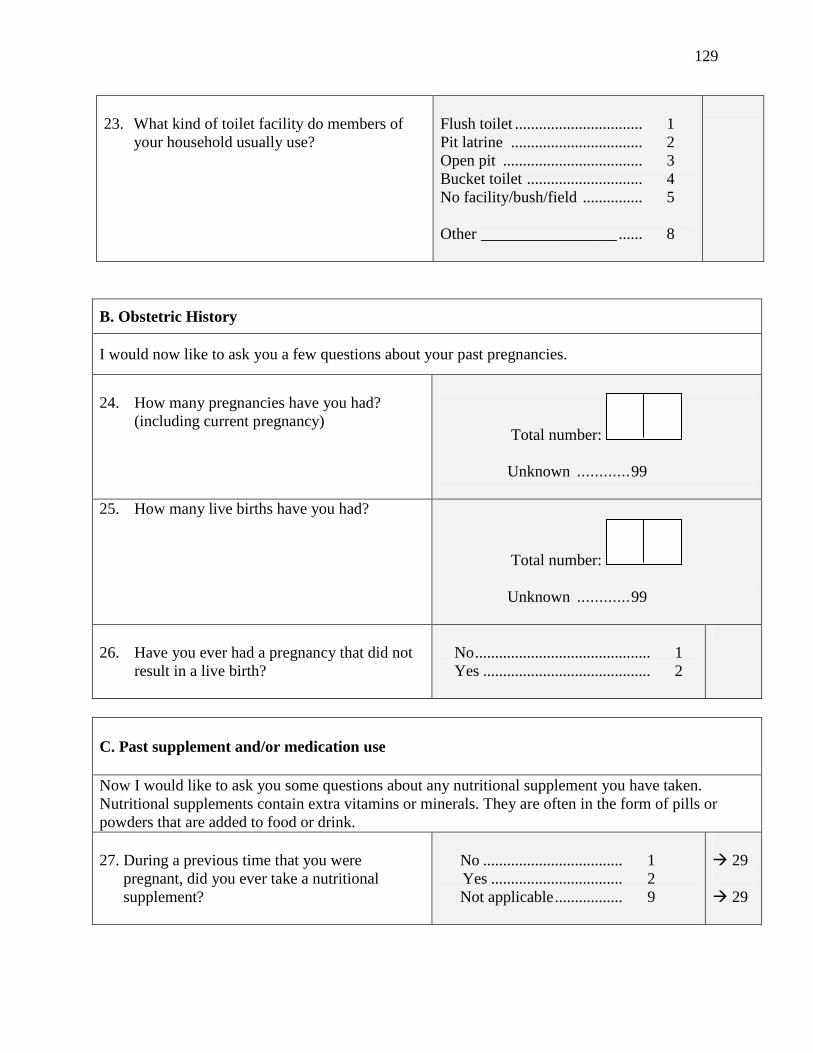
129
B. Obstetric History
I would now like to ask you a few questions about your past pregnancies.
24. How many pregnancies have you had?
(including current pregnancy)
Total number:
Unknown ............ 99
25. How many live births have you had?
Total number:
Unknown ............ 99
26. Have you ever had a pregnancy that did not
result in a live birth?
No ............................................ 1
Yes .......................................... 2
C. Past supplement and/or medication use
Now I would like to ask you some questions about any nutritional supplement you have taken.
Nutritional supplements contain extra vitamins or minerals. They are often in the form of pills or
powders that are added to food or drink.
27. During a previous time that you were
pregnant, did you ever take a nutritional
supplement?
No ................................... 1 Yes ................................. 2 Not applicable ................. 9
29
29
23. What kind of toilet facility do members of
your household usually use?
Flush toilet ................................ 1 Pit latrine ................................. 2 Open pit ................................... 3 Bucket toilet ............................. 4 No facility/bush/field ............... 5
Other _________________ ...... 8

130
28. Please describe any nutrient supplements that
you have taken during a previous pregnancy.
(Include type, formulation, and dose.)
_______________________________________
_______________________________________
_______________________________________
______________________________________
_______________________________________
The next questions are about your general consumption of nutritional supplements and/or
medications. In other words, these questions are about whether you have used relevant nutritional
supplements and/or medications at any point during your entire life, not just during pregnancy.
29. Have you ever taken a tablet before?
(When necessary, describe what a tablet is and
provide examples.)
No ............................................. 1 Yes ........................................... 2 I do not know ........................... 9
30. Have you ever taken a chewable tablet before?
(When necessary, describe what a chewable
tablet is and provide examples.)
No ............................................. 1 Yes ........................................... 2 I do not know ........................... 9
31. Have you ever taken a powdered supplement
before?
(When necessary, describe what a powdered
supplement is and provide examples.)
No ............................................. 1 Yes ........................................... 2 I do not know ........................... 9
32. Have you even taken oral rehydration salts
before?
(When necessary, describe what an oral
rehydration salt is.)
No ............................................. 1 Yes ........................................... 2 I do not know ........................... 9
The next two questions are about a micronutrient powder called Sprinkles. Sprinkles are small packets
that contain a mixture of vitamins and minerals in a powder form. They are for children and they are
added to food and eaten.
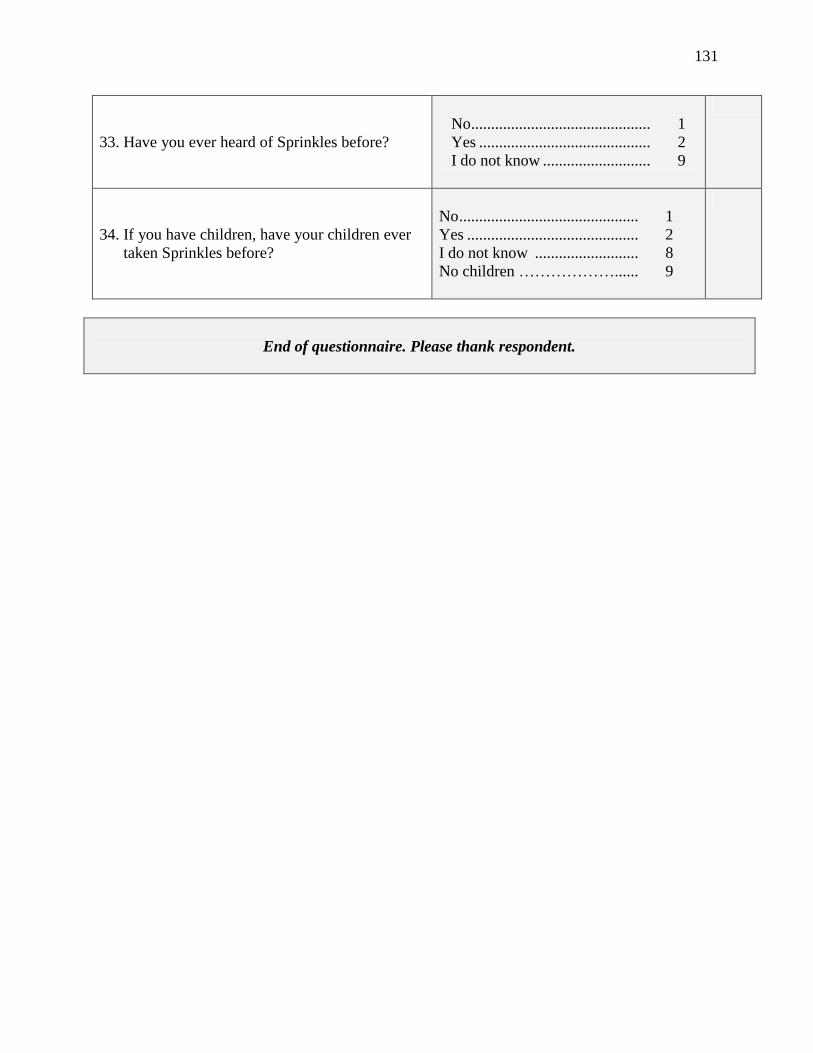
131
33. Have you ever heard of Sprinkles before?
No ............................................. 1 Yes ........................................... 2 I do not know ........................... 9
34. If you have children, have your children ever
taken Sprinkles before?
No ............................................. 1 Yes ........................................... 2 I do not know .......................... 8 No children ………………...... 9
End of questionnaire. Please thank respondent.

132
Appendix G – Supplement Rules Handout

133
Supplement Rules:
1) Never share the supplements.
The supplements are only for you.
Do not share with other women, friends, or
family members.
How much you take will be counted each
week.
2) Never give the supplements to children.
These supplements are not safe for children.
If multiple doses were ingested by a child, it
could be dangerous. The child would feel
sick.
Keep the supplements out of reach of children
(example; on a high shelf that children cannot
see).
3) Take the supplements only as described below:
o For tablets: take 3 per day
OR
o For chewable tablets: take 5 per day
OR
o For unflavoured powder: take the full
contents of one container per day (mixed
in food or drink)
o OR
o For flavoured powder: take the full
contents of one container per day (mixed
in water)
Do not take more than one type of supplement
on the same day.

134
Appendix H – Instructions for Supplement Use

135
Instructions for Using the Tablets
Each tablet contains 500 mg of calcium as calcium carbonate. When you use the tablets, take
3 with food.
1) Take the tablets with a drink at meal time.
2) You may swallow the tablets with one meal, or throughout the day.
3) In total, you must take 3 tablets per day.
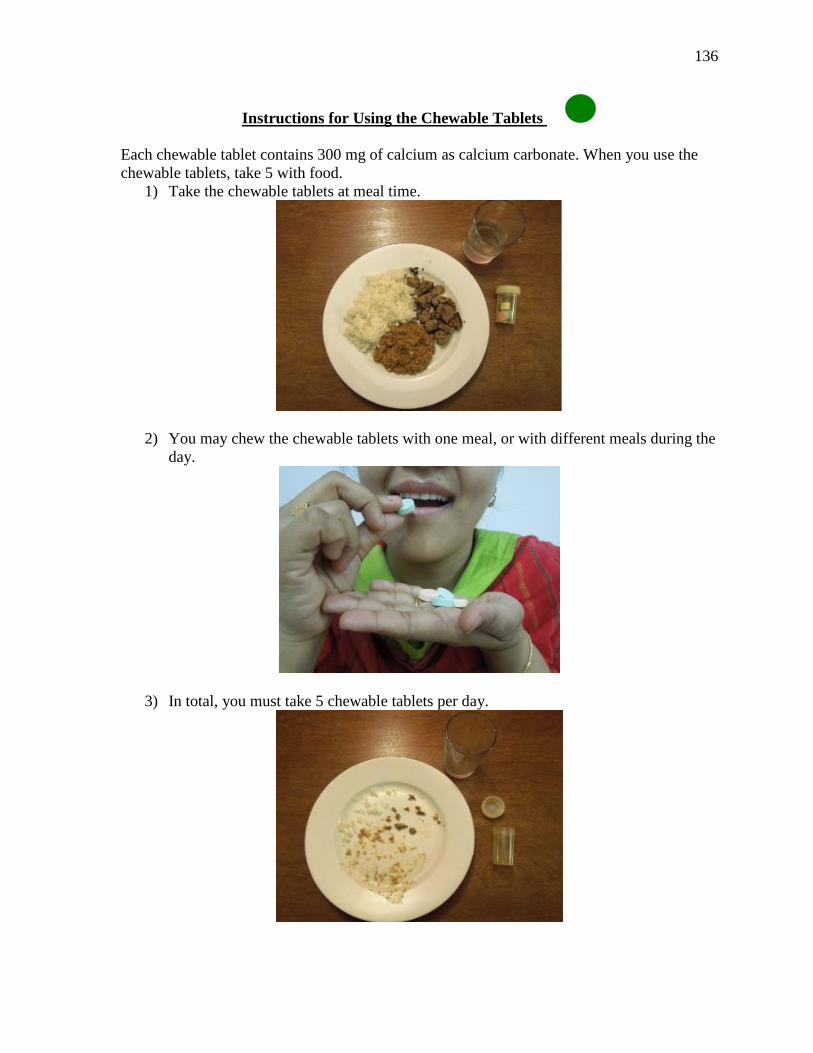
136
Instructions for Using the Chewable Tablets
Each chewable tablet contains 300 mg of calcium as calcium carbonate. When you use the
chewable tablets, take 5 with food.
1) Take the chewable tablets at meal time.
2) You may chew the chewable tablets with one meal, or with different meals during the
day.
3) In total, you must take 5 chewable tablets per day.
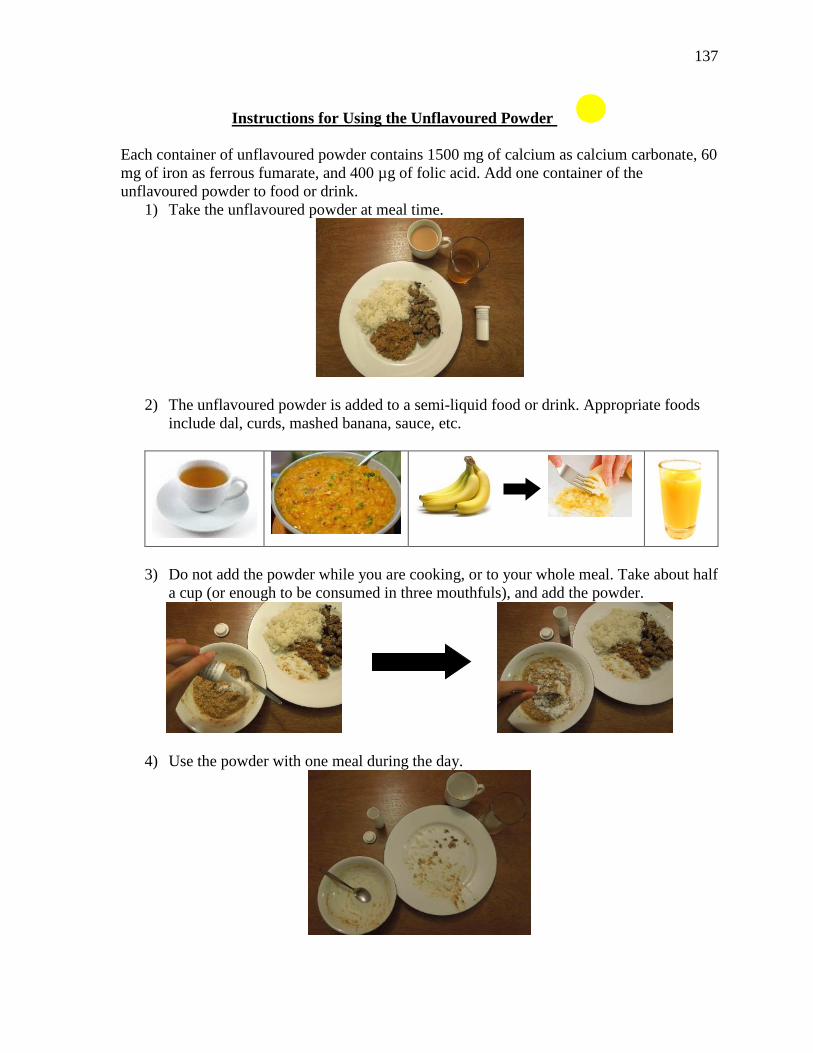
137
Instructions for Using the Unflavoured Powder
Each container of unflavoured powder contains 1500 mg of calcium as calcium carbonate, 60
mg of iron as ferrous fumarate, and 400 µg of folic acid. Add one container of the
unflavoured powder to food or drink.
1) Take the unflavoured powder at meal time.
2) The unflavoured powder is added to a semi-liquid food or drink. Appropriate foods
include dal, curds, mashed banana, sauce, etc.
3) Do not add the powder while you are cooking, or to your whole meal. Take about half
a cup (or enough to be consumed in three mouthfuls), and add the powder.
4) Use the powder with one meal during the day.
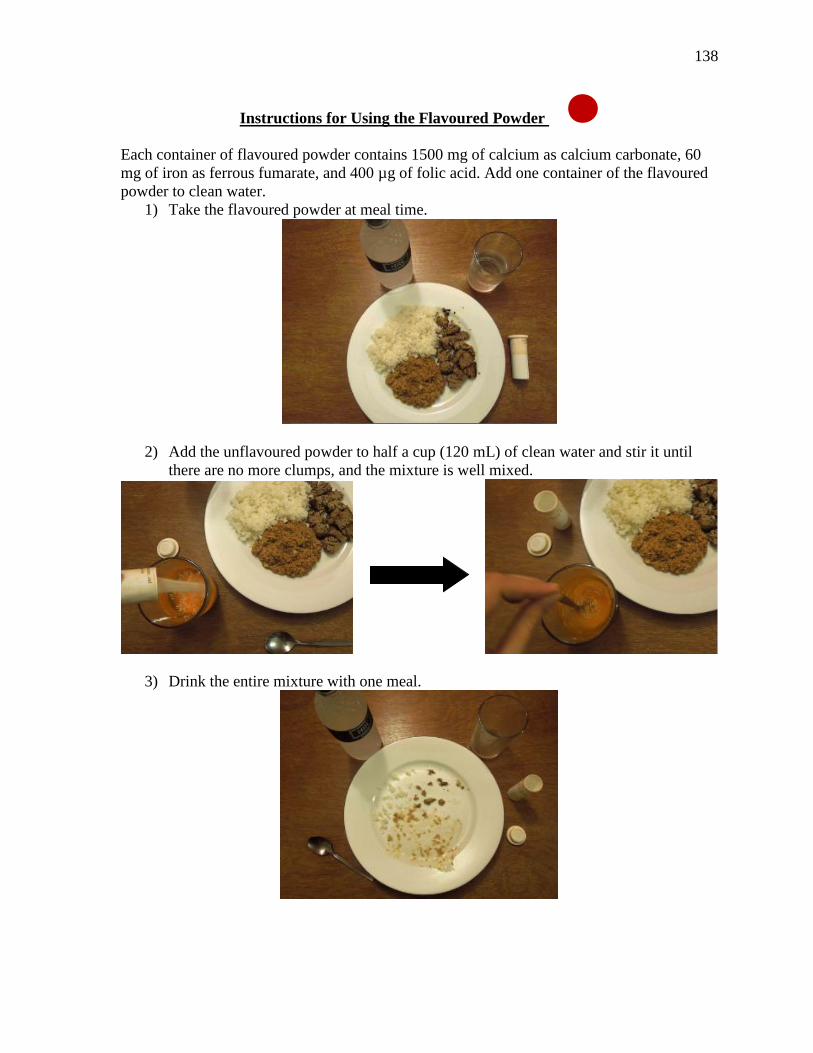
138
Instructions for Using the Flavoured Powder
Each container of flavoured powder contains 1500 mg of calcium as calcium carbonate, 60
mg of iron as ferrous fumarate, and 400 µg of folic acid. Add one container of the flavoured
powder to clean water.
1) Take the flavoured powder at meal time.
2) Add the unflavoured powder to half a cup (120 mL) of clean water and stir it until
there are no more clumps, and the mixture is well mixed.
3) Drink the entire mixture with one meal.

139
Appendix I – End of Run-in Questionnaire
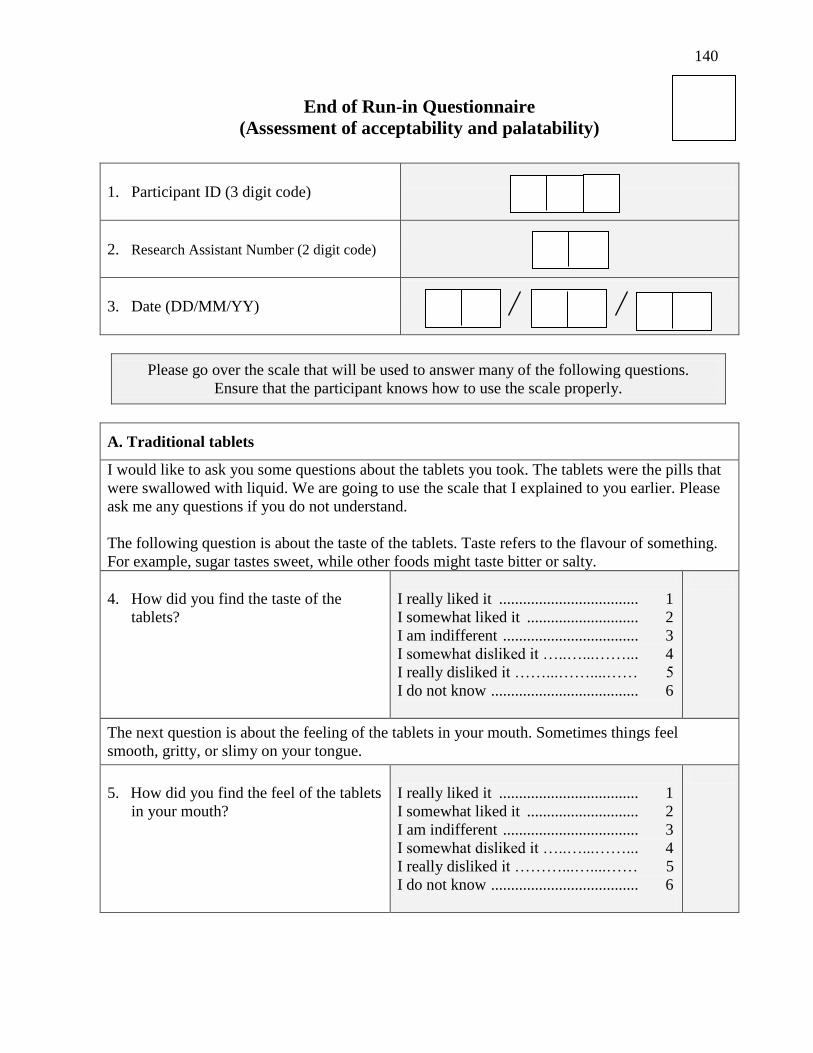
140
End of Run-in Questionnaire
(Assessment of acceptability and palatability)
1. Participant ID (3 digit code)
2. Research Assistant Number (2 digit code)
3. Date (DD/MM/YY)
Please go over the scale that will be used to answer many of the following questions.
Ensure that the participant knows how to use the scale properly.
A. Traditional tablets
I would like to ask you some questions about the tablets you took. The tablets were the pills that
were swallowed with liquid. We are going to use the scale that I explained to you earlier. Please
ask me any questions if you do not understand.
The following question is about the taste of the tablets. Taste refers to the flavour of something.
For example, sugar tastes sweet, while other foods might taste bitter or salty.
4. How did you find the taste of the
tablets?
I really liked it ................................... 1
I somewhat liked it ............................ 2
I am indifferent .................................. 3
I somewhat disliked it …..…...……... 4
I really disliked it ……...……....…… 5
I do not know ..................................... 6
The next question is about the feeling of the tablets in your mouth. Sometimes things feel
smooth, gritty, or slimy on your tongue.
5. How did you find the feel of the tablets
in your mouth?
I really liked it ................................... 1
I somewhat liked it ............................ 2
I am indifferent .................................. 3
I somewhat disliked it …..…...……... 4
I really disliked it ………...…....…… 5
I do not know ..................................... 6

141
The next question is about aftertaste. Aftertaste is the flavour that remains in your mouth after
you eat, drink, or swallow something. Sometimes, after you eat something your mouth still tastes
bitter or sweet, even though the food has been swallowed.
6. How did you find the aftertaste of the
tablets?
I really liked it ................................... 1
I somewhat liked it ............................ 2
I am indifferent .................................. 3
I somewhat disliked it …..…...……... 4
I really disliked it ……...……....……. 5
I do not know ..................................... 6
The next question is about the smell of the tablets. Smell is something’s odour or scent that you
detect with your nose. For example, something might smell pleasant or rotten.
7. How did you find the smell of the
tablets?
I really liked it ................................... 1
I somewhat liked it ............................ 2
I am indifferent .................................. 3
I somewhat disliked it …..…...……... 4
I really disliked it ……...……....……. 5
I do not know ..................................... 6
The next question is about the colour of the tablets.
8. How did you find the colour of the
tablets?
I really liked it ................................... 1
I somewhat liked it ............................ 2
I am indifferent .................................. 3
I somewhat disliked it …..…...……... 4
I really disliked it ……...……....……. 5
I do not know ..................................... 6
The next set of questions is about using the tablets.
9. How did you find taking the tablets?
Easy to take ........................................... 1
Somewhat easy to take ......................... 2
Not easy or difficult to take .................. 3
Somewhat difficult to take .................... 4
Difficult to take .................................... 5
I do not know ........................................ 6
10. Did you take all the tablets at once, or
throughout the day?
Throughout the day ........................... 1
All at once ......................................... 2

142
11. How did you find the number of
tablets that you had to consume?
Convenient.......................................... 1
Somewhat convenient......................... 2
Neither convenient or inconvenient ... 3
Somewhat inconvenient .................... 4
Inconventient ..................................... 5
I do not know ..................................... 6
12. How did you find swallowing the
tablets?
Easy to swallow .................................. 1
Somewhat easy to swallow ................ 2
Not easy or difficult to swallow ........ 3
Somewhat difficult to swallow .......... 4
Difficult to swallow ............................ 5
I do not know ..................................... 6
The next question is about the size of the tablets. The size refers to how big or small something
is. Sometimes people find that tablets can be too big or too small.
13. How did you find the size of the
tablets?
Too big .............................................. 1
A little big .......................................... 2
Just right ............................................ 3
A little small ...................................... 4
Too small ........................................... 5
I do not know ..................................... 6
The next question is about the shape of the tablets. The shape refers to something’s form. For
example, a stone can be round, oval, or square. Some people find that the shape of the tablet
affects swallowing the tablet.
14. How did you find the shape of the
tablets?
I really liked it ................................... 1
I somewhat liked it ............................ 2
I am indifferent .................................. 3
I somewhat disliked it …..…...…….. 4
I really disliked it ……...……....……. 5
I do not know ..................................... 6

143
B. Chewable tablets
Now I would like to ask you some questions about the chewable tablets. The chewable tablets
were the pills that you chewed. We are going to use the scale that I explained to you earlier again.
Please ask me any questions if you do not understand.
The first question is about the taste of the chewable tablets. Taste refers to the flavour of
something. For example, sugar tastes sweet, while other foods might taste bitter or salty.
15. How did you find the taste of the
chewable tablets?
I really liked it ................................... 1
I somewhat liked it ............................ 2
I am indifferent .................................. 3
I somewhat disliked it …..…...…….. 4
I really disliked it ……...……....……. 5
I do not know ..................................... 6
The next question is about the feeling of the chewable tablets in your mouth. Sometimes things
feel smooth, gritty, or slimy on your tongue.
16. How did you find the feel of the
chewable tablets in your mouth?
I really liked it ................................... 1
I somewhat liked it ............................ 2
I am indifferent .................................. 3
I somewhat disliked it …..…...…….. 4
I really disliked it ……...……....……. 5
I do not know ..................................... 6
The next question is about aftertaste. Aftertaste is the flavour that remains in your mouth after
you eat, drink, or swallow something. Sometimes after you eat something your mouth still tastes
bitter or sweet, even though the food has been swallowed.
17. How did you find the aftertaste of
the chewable tablets?
I really liked it ................................... 1
I somewhat liked it ............................ 2
I am indifferent .................................. 3
I somewhat disliked it …..…...…….. 4
I really disliked it ……...……....……. 5
I do not know ..................................... 6
The next question is about the smell of the chewable tablets. Smell is something’s odour or scent
that you detect with your nose. For example, something might smell pleasant or rotten.

144
18. How did you find the smell of the
chewable tablets?
I really liked it ................................... 1
I somewhat liked it ............................ 2
I am indifferent .................................. 3
I somewhat disliked it …..…...…….. 4
I really disliked it ……...…....…… 5
I do not know ..................................... 6
The next question is about the colour of the chewable tablets.
19. How did you find the colour of the
chewable tablets?
I really liked it ................................... 1
I somewhat liked it ............................ 2
I am indifferent .................................. 3
I somewhat disliked it …..…...…….. 4
I really disliked it ……...……....……. 5
I do not know ..................................... 6
The next set of questions is about using the chewable tablets.
20. How did you find taking the
chewable tablets?
Easy to take ....................................... 1
Somewhat easy to take ...................... 2
Not easy or difficult to take ............... 3
Somewhat difficult to take ................ 4
Difficult to take .................................. 5
I do not know ..................................... 6
21. Did you take all the chewable
tablets at once, or throughout the
day?
Throughout the day ........................... 1
All at once .......................................... 2
22. How did you find the number of
chewable tablets that you had to
consume?
Convenient ......................................... 1
Somewhat convenient ....................... 2
Neither convenient or inconvenient .. 3
Somewhat inconventient ................... 4
Inconventient ..................................... 5
I do not know ..................................... 6

145
23. How did you find chewing the
chewable tablets?
Easy to chew ...................................... 1
Somewhat easy to chew ..................... 2
Not easy or difficult to chew .............. 3
Somewhat difficult to chew .............. 4
Difficult to chew ................................ 5
I do not know ..................................... 6
The next question is about the size of the chewable tablets. The size refers to how big or small
something is. Sometimes people find that chewable tablets can be too big or too small.
24. How did you find the size of the
chewable tablets?
Too big .............................................. 1
A little big .......................................... 2
Just right ............................................ 3
A little small ...................................... 4
Too small ........................................... 5
I do not know ..................................... 6
The next question is about the shape of the chewable tablets. The shape refers to something’s
form. For example, a stone can be round, oval, or square. Some people find that the shape of the
chewable tablet affects chewing the tablet.
25. How did you find the shape of the
chewable tablets?
I really liked it ................................... 1
I somewhat liked it ............................ 2
I am indifferent .................................. 3
I somewhat disliked it …..…...…….. 4
I really disliked it ……...……....……. 5
I do not know ..................................... 6
C. Unflavoured powder
Now I would like to ask you some questions about the unflavoured powder. The unflavoured
powder was the powder that you added to a semi-liquid food or drink. We are going to use the
scale that I explained to you earlier. This time some of the options are a little different. (Explain
the options ‘always,’ ‘usually,’ ‘sometimes,’ ‘once in a while,’ and ‘never’ to the participant.)
Please ask me any questions if you do not understand.
26. Did you add the unflavoured
powder to a food or a drink?
Food ................................................... 1
Drink .................................................. 2
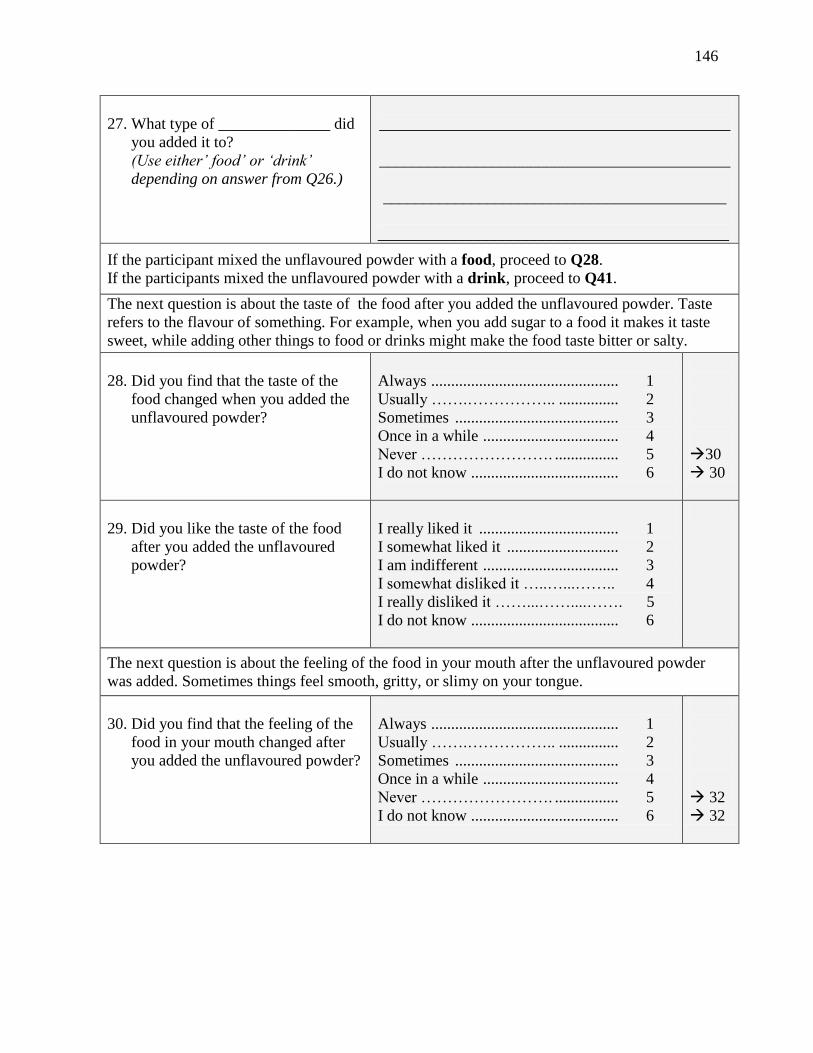
146
27. What type of ______________ did
you added it to?
(Use either’ food’ or ‘drink’
depending on answer from Q26.)
____________________________________________
____________________________________________
___________________________________________
____________________________________________
If the participant mixed the unflavoured powder with a food, proceed to Q28.
If the participants mixed the unflavoured powder with a drink, proceed to Q41.
The next question is about the taste of the food after you added the unflavoured powder. Taste
refers to the flavour of something. For example, when you add sugar to a food it makes it taste
sweet, while adding other things to food or drinks might make the food taste bitter or salty.
28. Did you find that the taste of the
food changed when you added the
unflavoured powder?
Always ............................................... 1
Usually …….…………….. ............... 2
Sometimes ......................................... 3
Once in a while .................................. 4
Never ……………………. ................ 5
I do not know ..................................... 6
30
30
29. Did you like the taste of the food
after you added the unflavoured
powder?
I really liked it ................................... 1
I somewhat liked it ............................ 2
I am indifferent .................................. 3
I somewhat disliked it …..…...…….. 4
I really disliked it ……...……....……. 5
I do not know ..................................... 6
The next question is about the feeling of the food in your mouth after the unflavoured powder
was added. Sometimes things feel smooth, gritty, or slimy on your tongue.
30. Did you find that the feeling of the
food in your mouth changed after
you added the unflavoured powder?
Always ............................................... 1
Usually …….…………….. ............... 2
Sometimes ......................................... 3
Once in a while .................................. 4
Never ……………………. ................ 5
I do not know ..................................... 6
32
32
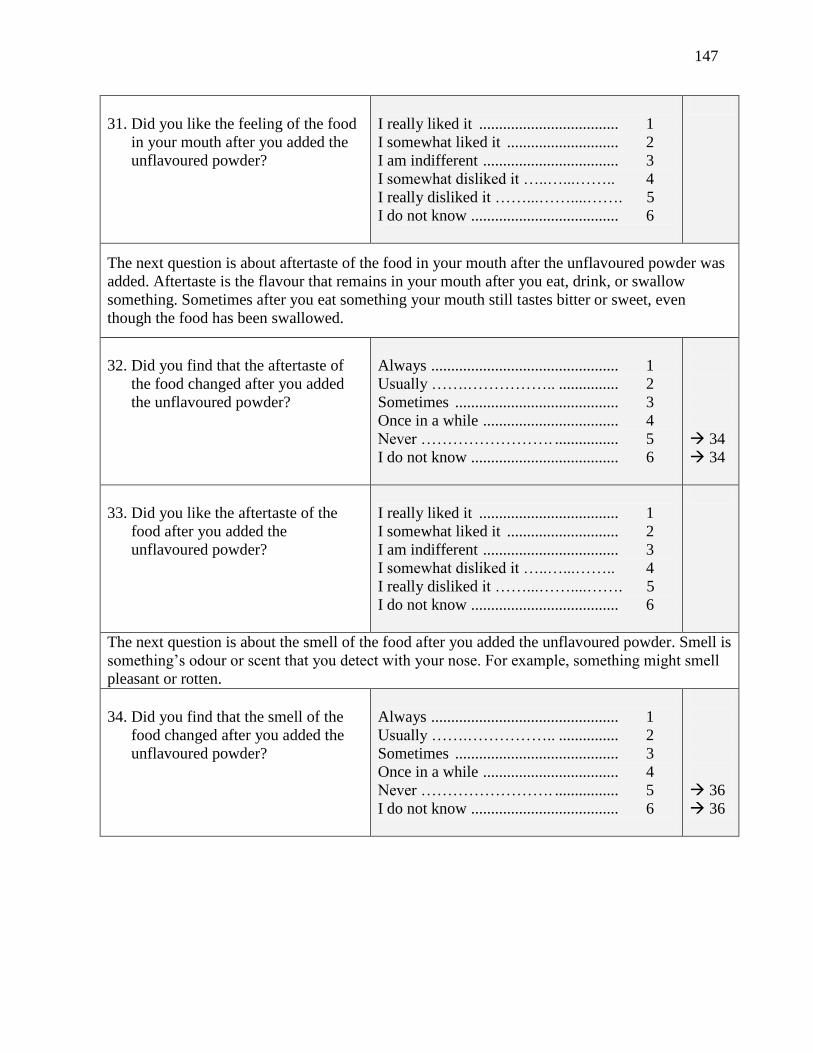
147
31. Did you like the feeling of the food
in your mouth after you added the
unflavoured powder?
I really liked it ................................... 1
I somewhat liked it ............................ 2
I am indifferent .................................. 3
I somewhat disliked it …..…...…….. 4
I really disliked it ……...……....……. 5
I do not know ..................................... 6
The next question is about aftertaste of the food in your mouth after the unflavoured powder was
added. Aftertaste is the flavour that remains in your mouth after you eat, drink, or swallow
something. Sometimes after you eat something your mouth still tastes bitter or sweet, even
though the food has been swallowed.
32. Did you find that the aftertaste of
the food changed after you added
the unflavoured powder?
Always ............................................... 1
Usually …….…………….. ............... 2
Sometimes ......................................... 3
Once in a while .................................. 4
Never ……………………. ................ 5
I do not know ..................................... 6
34
34
33. Did you like the aftertaste of the
food after you added the
unflavoured powder?
I really liked it ................................... 1
I somewhat liked it ............................ 2
I am indifferent .................................. 3
I somewhat disliked it …..…...…….. 4
I really disliked it ……...……....……. 5
I do not know ..................................... 6
The next question is about the smell of the food after you added the unflavoured powder. Smell is
something’s odour or scent that you detect with your nose. For example, something might smell
pleasant or rotten.
34. Did you find that the smell of the
food changed after you added the
unflavoured powder?
Always ............................................... 1
Usually …….…………….. ............... 2
Sometimes ......................................... 3
Once in a while .................................. 4
Never ……………………. ................ 5
I do not know ..................................... 6
36
36

148
35. Did you like the smell of the food
after you added the unflavoured
powder?
I really liked it ................................... 1
I somewhat liked it ............................ 2
I am indifferent .................................. 3
I somewhat disliked it …..…...…….. 4
I really disliked it ……...……....……. 5
I do not know ..................................... 6
The next question is about the colour of the food after you added the unflavoured powder.
36. Did you find that the colour of the
food changed after you added the
unflavoured powder?
Always ............................................... 1
Usually …….…………….. ............... 2
Sometimes ......................................... 3
Once in a while .................................. 4
Never ……………………. ................ 5
I do not know ..................................... 6
38
38
37. Did you like the colour of the food
after you added the unflavoured
powder?
I really liked it ................................... 1
I somewhat liked it ............................ 2
I am indifferent .................................. 3
I somewhat disliked it …..…...…….. 4
I really disliked it ……...……....……. 5
I do not know ..................................... 6
The next set of questions is about using the unflavoured powder.
38. Did the unflavoured powder mix
well with the food?
Completely mixed ............................. 1
Mostly mixed ..................................... 2
Partially mixed .................................. 3
A little mixed ..................................... 4
Did not mix ........................................ 5
I do not know ..................................... 6
39. Did the unflavoured powder stick to
the sides of the bowl?
Always ............................................... 1
Usually …….…………….. ............... 2
Sometimes ......................................... 3
Once in a while .................................. 4
Never ……………………. ................ 5
I do not know ..................................... 6

149
40. How did you find eating the food
mixed with the unflavoured
powder?
I really liked it ................................... 1
I somewhat liked it ............................ 2
I am indifferent .................................. 3
I somewhat disliked it …..…...…….. 4
I really disliked it ……...……....……. 5
I do not know ..................................... 6
54
54
54
54
54
54
The next question is about the taste of the drink after you added the unflavoured powder. Taste
refers to the flavour of something. For example, when you add sugar tea it makes it taste sweet,
while adding other things might make the drink taste bitter or salty.
41. Did you find that the taste of the
drink changed when you added the
unflavoured powder?
Always ............................................... 1
Usually …….…………….. ............... 2
Sometimes ......................................... 3
Once in a while .................................. 4
Never ……………………. ................ 5
I do not know ..................................... 6
43
43
42. Did you like the taste of the drink
after you added the unflavoured
powder?
I really liked it ................................... 1
I somewhat liked it ............................ 2
I am indifferent .................................. 3
I somewhat disliked it …..…...…….. 4
I really disliked it ……...……....……. 5
I do not know ..................................... 6
The next question is about the feeling of the drink in your mouth after the unflavoured powder
was added. Sometimes things feel smooth, gritty, or slimy on your tongue.s
43. Did you find that the feeling of the
drink in your mouth changed after
you added the unflavoured powder?
Always ............................................... 1
Usually …….…………….. ............... 2
Sometimes ......................................... 3
Once in a while .................................. 4
Never ……………………. ................ 5
I do not know ..................................... 6
45
45
44. Did you like the feeling of the drink
in your mouth after you added the
unflavoured powder?
I really liked it ................................... 1
I somewhat liked it ............................ 2
I am indifferent .................................. 3
I somewhat disliked it …..…...…….. 4
I really disliked it ……...……....……. 5
I do not know ..................................... 6
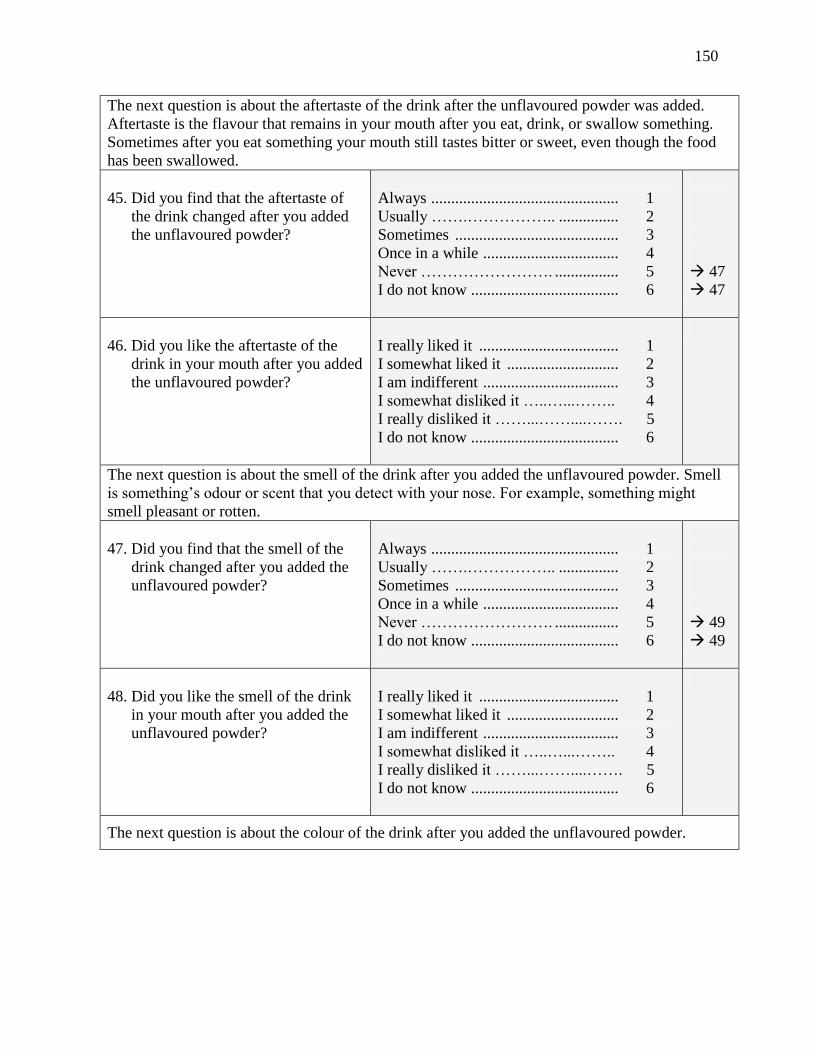
150
The next question is about the aftertaste of the drink after the unflavoured powder was added.
Aftertaste is the flavour that remains in your mouth after you eat, drink, or swallow something.
Sometimes after you eat something your mouth still tastes bitter or sweet, even though the food
has been swallowed.
45. Did you find that the aftertaste of
the drink changed after you added
the unflavoured powder?
Always ............................................... 1
Usually …….…………….. ............... 2
Sometimes ......................................... 3
Once in a while .................................. 4
Never ……………………. ................ 5
I do not know ..................................... 6
47
47
46. Did you like the aftertaste of the
drink in your mouth after you added
the unflavoured powder?
I really liked it ................................... 1
I somewhat liked it ............................ 2
I am indifferent .................................. 3
I somewhat disliked it …..…...…….. 4
I really disliked it ……...……....……. 5
I do not know ..................................... 6
The next question is about the smell of the drink after you added the unflavoured powder. Smell
is something’s odour or scent that you detect with your nose. For example, something might
smell pleasant or rotten.
47. Did you find that the smell of the
drink changed after you added the
unflavoured powder?
Always ............................................... 1
Usually …….…………….. ............... 2
Sometimes ......................................... 3
Once in a while .................................. 4
Never ……………………. ................ 5
I do not know ..................................... 6
49
49
48. Did you like the smell of the drink
in your mouth after you added the
unflavoured powder?
I really liked it ................................... 1
I somewhat liked it ............................ 2
I am indifferent .................................. 3
I somewhat disliked it …..…...…….. 4
I really disliked it ……...……....……. 5
I do not know ..................................... 6
The next question is about the colour of the drink after you added the unflavoured powder.

151
49. Did you find that the colour of the
drink changed after you added the
unflavoured powder?
Always ............................................... 1
Usually …….…………….. ............... 2
Sometimes ......................................... 3
Once in a while .................................. 4
Never ……………………. ................ 5
I do not know ..................................... 6
51
51
50. Did you like the colour of the drink
after you added the unflavoured
powder?
I really liked it ................................... 1
I somewhat liked it ............................ 2
I am indifferent .................................. 3
I somewhat disliked it …..…...…….. 4
I really disliked it ……...……....……. 5
I do not know ..................................... 6
The next set of questions is about using the unflavoured powder.
51. Did the unflavoured powder mix
well with drinks?
Completely mixed ............................. 1
Mostly mixed ..................................... 2
Partially mixed .................................. 3
A little mixed ..................................... 4
Did not mix ........................................ 5
I do not know ..................................... 6
52. Did the unflavoured powder settle
at the bottom of the cup?
Always ............................................... 1
Usually …….…………….. ............... 2
Sometimes ......................................... 3
Once in a while .................................. 4
Never ……………………. ................ 5
I do not know ..................................... 6
53. How did you find drinking the
drink mixed with the unflavoured
powder?
I really liked it ................................... 1
I somewhat liked it ............................ 2
I am indifferent .................................. 3
I somewhat disliked it …..…...…….. 4
I really disliked it ……...……....……. 5
I do not know ..................................... 6

152
D. Flavoured powder
Now I would like to ask you some questions about the flavoured powder. The flavoured powder
was the powder with flavouring that you added to clean water and drank. I am going to call the
flavoured powder that you added to clean water the ‘flavoured powder mixture.’ Are you okay
with this?
We are going to use the scale that I explained to you earlier. Please ask me any questions if you
do not understand.
First is a question about the taste of the flavoured powder mixture. Taste refers to the flavour of
something. For example, sugar when added to tea makes it taste sweet, while adding other things
to drinks might make them taste bitter or salty.
54. How did you find the taste when
you drank the flavoured powder
mixture?
I really liked it ................................... 1
I somewhat liked it ............................ 2
I am indifferent .................................. 3
I somewhat disliked it …..…...…….. 4
I really disliked it ……...……....……. 5
I do not know ..................................... 6
The next question is about the feeling in your mouth when you drank the flavoured powder
mixture. Sometimes drinks feel smooth, gritty, or slimy on your tongue.
55. How did you find feeling in your
mouth when you drank the
flavoured powder mixture?
I really liked it ................................... 1
I somewhat liked it ............................ 2
I am indifferent .................................. 3
I somewhat disliked it …..…...…….. 4
I really disliked it ……...……....……. 5
I do not know ..................................... 6
The next question is about the aftertaste of the flavoured powder mixture. Aftertaste is the
flavour that remains in your mouth after you eat, drink, or swallow something. Sometimes after
you drink something your mouth still tastes bitter or sweet, even though the drink has been
swallowed.
56. How did you find the aftertaste
after you drank the flavoured
powder mixture?
I really liked it ................................... 1
I somewhat liked it ............................ 2
I am indifferent .................................. 3
I somewhat disliked it …..…...…….. 4
I really disliked it ……...……....……. 5
I do not know ..................................... 6
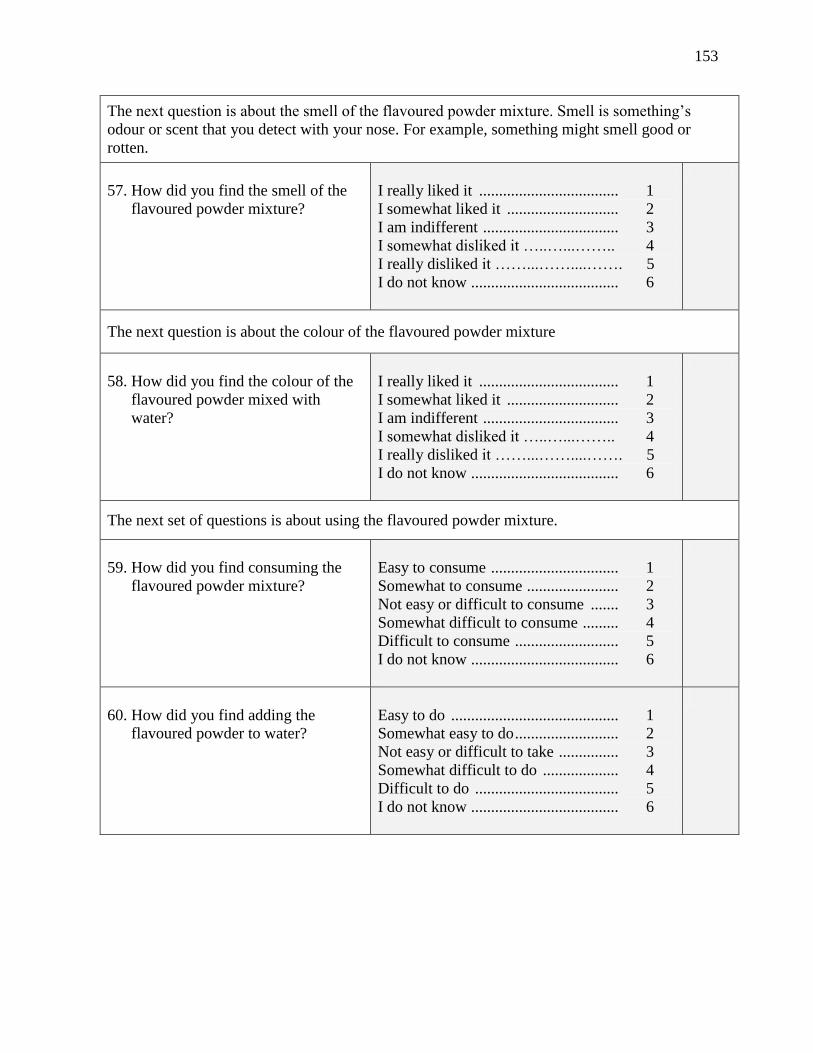
153
The next question is about the smell of the flavoured powder mixture. Smell is something’s
odour or scent that you detect with your nose. For example, something might smell good or
rotten.
57. How did you find the smell of the
flavoured powder mixture?
I really liked it ................................... 1
I somewhat liked it ............................ 2
I am indifferent .................................. 3
I somewhat disliked it …..…...…….. 4
I really disliked it ……...……....……. 5
I do not know ..................................... 6
The next question is about the colour of the flavoured powder mixture
58. How did you find the colour of the
flavoured powder mixed with
water?
I really liked it ................................... 1
I somewhat liked it ............................ 2
I am indifferent .................................. 3
I somewhat disliked it …..…...…….. 4
I really disliked it ……...……....……. 5
I do not know ..................................... 6
The next set of questions is about using the flavoured powder mixture.
59. How did you find consuming the
flavoured powder mixture?
Easy to consume ................................ 1
Somewhat to consume ....................... 2
Not easy or difficult to consume ....... 3
Somewhat difficult to consume ......... 4
Difficult to consume .......................... 5
I do not know ..................................... 6
60. How did you find adding the
flavoured powder to water?
Easy to do .......................................... 1
Somewhat easy to do .......................... 2
Not easy or difficult to take ............... 3
Somewhat difficult to do ................... 4
Difficult to do .................................... 5
I do not know ..................................... 6
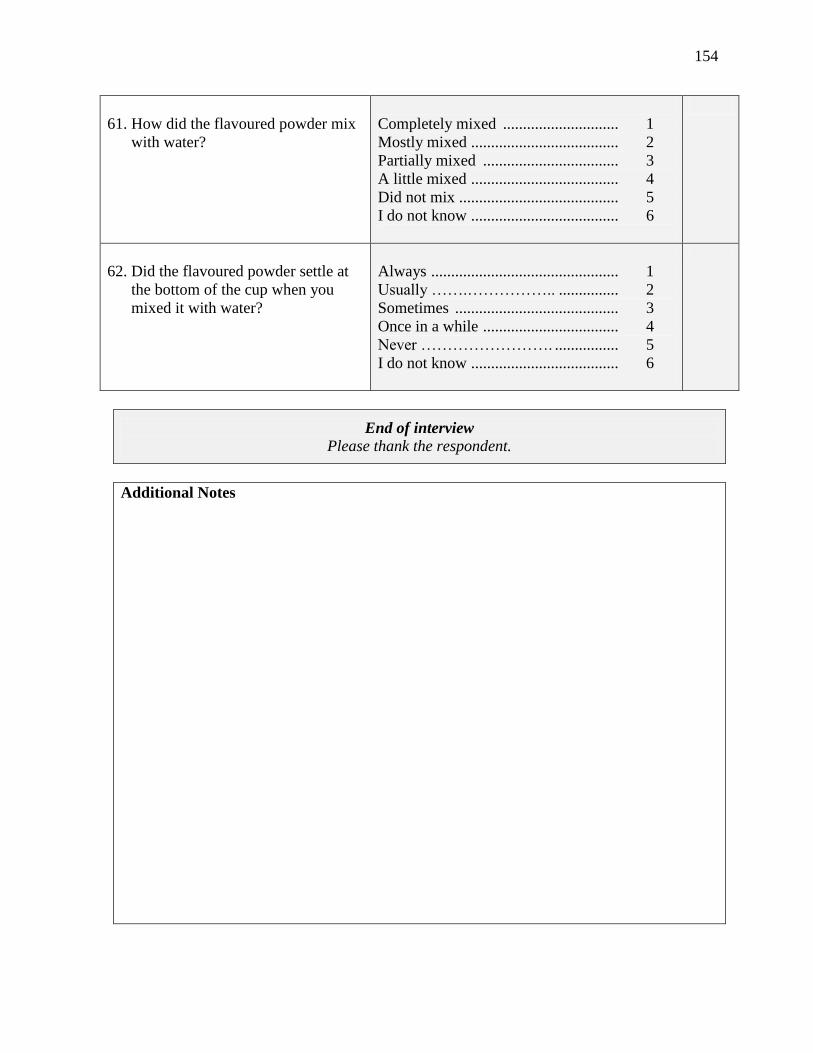
154
61. How did the flavoured powder mix
with water?
Completely mixed ............................. 1
Mostly mixed ..................................... 2
Partially mixed .................................. 3
A little mixed ..................................... 4
Did not mix ........................................ 5
I do not know ..................................... 6
62. Did the flavoured powder settle at
the bottom of the cup when you
mixed it with water?
Always ............................................... 1
Usually …….…………….. ............... 2
Sometimes ......................................... 3
Once in a while .................................. 4
Never ……………………. ................ 5
I do not know ..................................... 6
End of interview
Please thank the respondent.
Additional Notes

155
Appendix J – Graphics provided with Likert scale

156
Graphics provided with Likert Scale
I really liked it. I somewhat
liked it. I am indifferent.
I somewhat
disliked it.
I really disliked
it.

157
Appendix K – CHW Tracking Sheet for Supplement Use – Week 1

158
CHW Tracking Sheet for Supplement Use – Week 1
1. Participant ID (3 digit code)
2. Research Assistant Number (2 digit
code)
3. Date of the visit at the start of the week
(DD/MM/YY)
4. Date of the visit at the end of the week
(DD/MM/YY)
A. Supplement administration record
Tablets Chewable
tablets Unflavoured
powder Flavoured
powder
5. Number given
to participant
B. Count of supplements remaining at end of week
Tablets Chewable
tablets Unflavoured
powder Flavoured
powder
6. Number
remaining
C. Report of missing doses
7. Did the participant report
missing any doses?
No ………..…………….... ..... 1
Yes………..……………… ..... 2
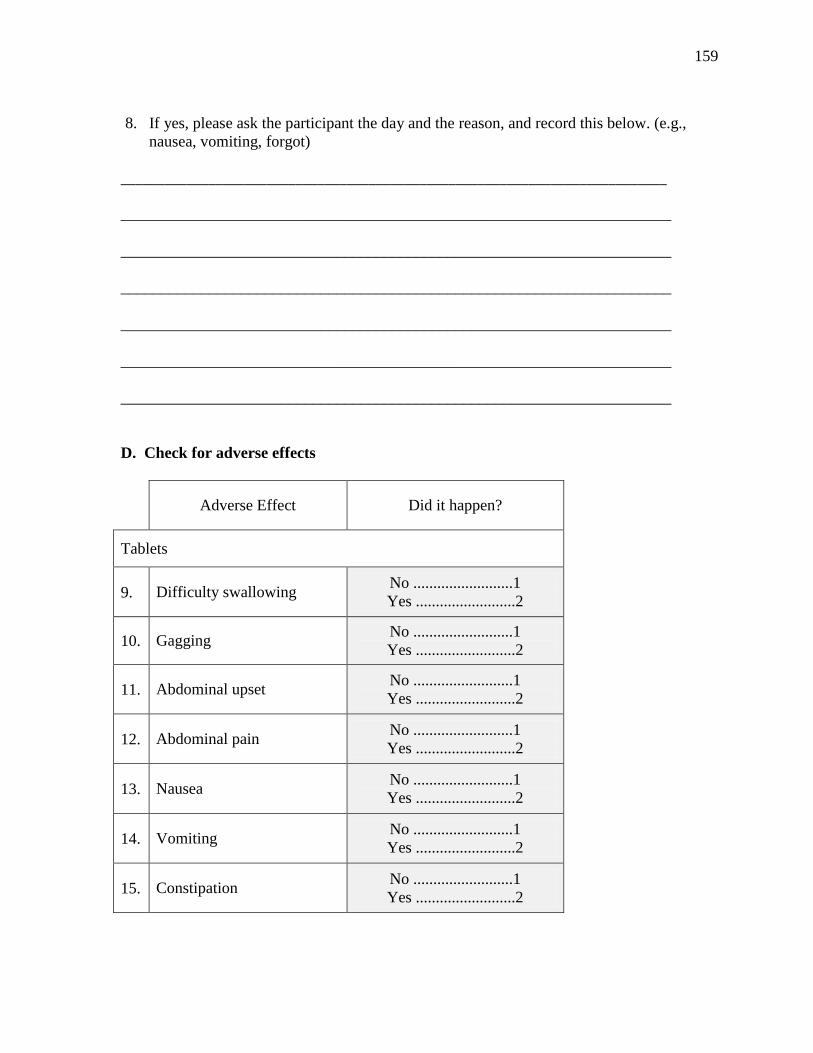
159
8. If yes, please ask the participant the day and the reason, and record this below. (e.g.,
nausea, vomiting, forgot)
___________________________________________________________________________
_____________________________________________________________________
_____________________________________________________________________
_____________________________________________________________________
_____________________________________________________________________
_____________________________________________________________________
_____________________________________________________________________
D. Check for adverse effects
Adverse Effect Did it happen?
Tablets
9. Difficulty swallowing No .........................1
Yes .........................2
10. Gagging No .........................1
Yes .........................2
11. Abdominal upset No .........................1
Yes .........................2
12. Abdominal pain No .........................1
Yes .........................2
13. Nausea No .........................1
Yes .........................2
14. Vomiting No .........................1
Yes .........................2
15. Constipation No .........................1
Yes .........................2

160
16. Diarrhea No .........................1
Yes .........................2
Chewable tablets
17. Difficulty swallowing No .........................1
Yes .........................2
18. Gagging No .........................1
Yes .........................2
19. Abdominal upset No .........................1
Yes .........................2
20. Abdominal pain No .........................1
Yes .........................2
21. Nausea No .........................1
Yes .........................2
22. Vomiting No .........................1
Yes .........................2
23. Constipation No .........................1
Yes .........................2
24. Diarrhea No .........................1
Yes .........................2
Unflavoured powder
25. Difficulty swallowing No .........................1
Yes .........................2
26. Gagging No .........................1
Yes .........................2
27. Abdominal upset No .........................1
Yes .........................2
28. Abdominal pain No .........................1
Yes .........................2
29. Nausea No .........................1
Yes .........................2
30. Vomiting No .........................1
Yes .........................2
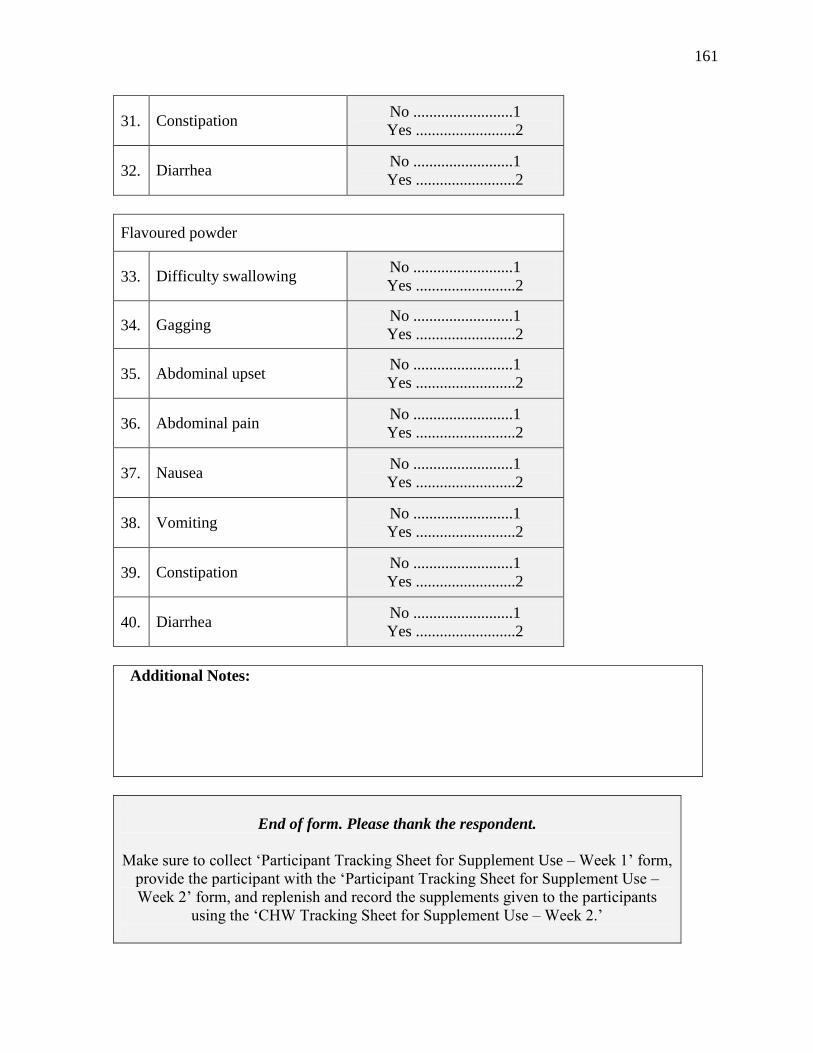
161
31. Constipation No .........................1
Yes .........................2
32. Diarrhea No .........................1
Yes .........................2
Flavoured powder
33. Difficulty swallowing No .........................1
Yes .........................2
34. Gagging No .........................1
Yes .........................2
35. Abdominal upset No .........................1
Yes .........................2
36. Abdominal pain No .........................1
Yes .........................2
37. Nausea No .........................1
Yes .........................2
38. Vomiting No .........................1
Yes .........................2
39. Constipation No .........................1
Yes .........................2
40. Diarrhea No .........................1
Yes .........................2
Additional Notes:
End of form. Please thank the respondent.
Make sure to collect ‘Participant Tracking Sheet for Supplement Use – Week 1’ form,
provide the participant with the ‘Participant Tracking Sheet for Supplement Use –
Week 2’ form, and replenish and record the supplements given to the participants
using the ‘CHW Tracking Sheet for Supplement Use – Week 2.’

162
Appendix L – Participant Tracking Sheet for Supplement Use – Week 1

163
Participant Tracking Sheet for Supplement Use – Week 1
1. Participant ID (3 digit code)
2. Research Assistant Number (2 digit code)
3. Date of the visit at the start of the week
(DD/MM/YY)
4. Date of the visit at the end of the week
(DD/MM/YY)
A. Daily consumption of supplements
Day
Tablets
Chewable
tablets
Unflavoured
powder
Flavoured
powder
Did not take
1
2
3
4
5
6
7

164
Appendix M – CHW Tracking Sheet for Supplement Use – Week 2

165
CHW Tracking Sheet for Supplement Use – Week 2
1. Participant ID (3 digit code)
2. Research Assistant Number (2 digit
code)
3. Date of the visit at the start of the week
(DD/MM/YY)
4. Date of the visit at the end of the week
(DD/MM/YY)
A. Supplement administration record
Tablets Chewable
tablets Unflavoured
powder Flavoured
powder
5. Number given
to participant
B. Count of supplements remaining at end of week
Tablets Chewable
tablets Unflavoured
powder Flavoured
powder
6. Number
remaining
C. Report of missing doses
7. Did the participant report
missing any doses?
No ………..…………….... ..... 1
Yes………..……………… ..... 2

166
8. If yes, please ask the participant the day and the reason, and record this below. (e.g.,
nausea, vomiting, forgot)
___________________________________________________________________________
_____________________________________________________________________
_____________________________________________________________________
_____________________________________________________________________
_____________________________________________________________________
_____________________________________________________________________
_____________________________________________________________________
D. Check for adverse effects
Adverse Effect Did it happen?
Tablets
9. Difficulty swallowing No .........................1
Yes .........................2
10. Gagging No .........................1
Yes .........................2
11. Abdominal upset No .........................1
Yes .........................2
12. Abdominal pain No .........................1
Yes .........................2
13. Nausea No .........................1
Yes .........................2
14. Vomiting No .........................1
Yes .........................2
15. Constipation No .........................1
Yes .........................2

167
16. Diarrhea No .........................1
Yes .........................2
Chewable tablets
17. Difficulty swallowing No .........................1
Yes .........................2
18. Gagging No .........................1
Yes .........................2
19. Abdominal upset No .........................1
Yes .........................2
20. Abdominal pain No .........................1
Yes .........................2
21. Nausea No .........................1
Yes .........................2
22. Vomiting No .........................1
Yes .........................2
23. Constipation No .........................1
Yes .........................2
24. Diarrhea No .........................1
Yes .........................2
Unflavoured powder
25. Difficulty swallowing No .........................1
Yes .........................2
26. Gagging No .........................1
Yes .........................2
27. Abdominal upset No .........................1
Yes .........................2
28. Abdominal pain No .........................1
Yes .........................2
29. Nausea No .........................1
Yes .........................2
30. Vomiting No .........................1
Yes .........................2

168
31. Constipation No .........................1
Yes .........................2
32. Diarrhea No .........................1
Yes .........................2
Flavoured powder
33. Difficulty swallowing No .........................1
Yes .........................2
34. Gagging No .........................1
Yes .........................2
35. Abdominal upset No .........................1
Yes .........................2
36. Abdominal pain No .........................1
Yes .........................2
37. Nausea No .........................1
Yes .........................2
38. Vomiting No .........................1
Yes .........................2
39. Constipation No .........................1
Yes .........................2
40. Diarrhea No .........................1
Yes .........................2
Additional Notes:
End of form. Please thank the respondent.
Make sure to collect ‘Participant Tracking Sheet for Supplement Use – Week 2’ form,
provide the participant with the ‘Participant Tracking Sheet for Supplement Use –
Week 3’ form, and replenish and record the supplements given to the participants
using the ‘CHW Tracking Sheet for Supplement Use – Week 3.’
169
Appendix N – Participant Tracking Sheet for Supplement Use – Week 2

170
Participant Tracking Sheet for Supplement Use – Week 2
1. Participant ID (3 digit code)
2. Research Assistant Number (2 digit code)
3. Date of the visit at the start of the week
(DD/MM/YY)
4. Date of the visit at the end of the week
(DD/MM/YY)
B. Daily consumption of supplements
Day
Tablets
Chewable
tablets
Unflavoured
powder
Flavoured
powder
Did not take
1
2
3
4
5
6
7

171
Appendix O – CHW Tracking Sheet for Supplement Use – Week 3

172
CHW Tracking Sheet for Supplement Use – Week 2
1. Participant ID (3 digit code)
2. Research Assistant Number (2 digit
code)
3. Date of the visit at the start of the week
(DD/MM/YY)
4. Date of the visit at the end of the week
(DD/MM/YY)
A. Supplement administration record
Tablets Chewable
tablets Unflavoured
powder Flavoured
powder
5. Number given to
participant
B. Count of supplements remaining at end of week
Tablets Chewable
tablets Unflavoured
powder Flavoured
powder
6. Number
remaining
C. Report of missing doses
7. Did the participant report
missing any doses?
No ………..…………….... ..... 1
Yes………..……………… ..... 2

173
8. If yes, please ask the participant the day and the reason, and record this below. (e.g.,
nausea, vomiting, forgot)
___________________________________________________________________________
_____________________________________________________________________
_____________________________________________________________________
_____________________________________________________________________
_____________________________________________________________________
_____________________________________________________________________
_____________________________________________________________________
D. Check for adverse effects
Adverse Effect Did it happen?
Tablets
9. Difficulty swallowing No .........................1
Yes .........................2
10. Gagging No .........................1
Yes .........................2
11. Abdominal upset No .........................1
Yes .........................2
12. Abdominal pain No .........................1
Yes .........................2
13. Nausea No .........................1
Yes .........................2
14. Vomiting No .........................1
Yes .........................2
15. Constipation No .........................1
Yes .........................2
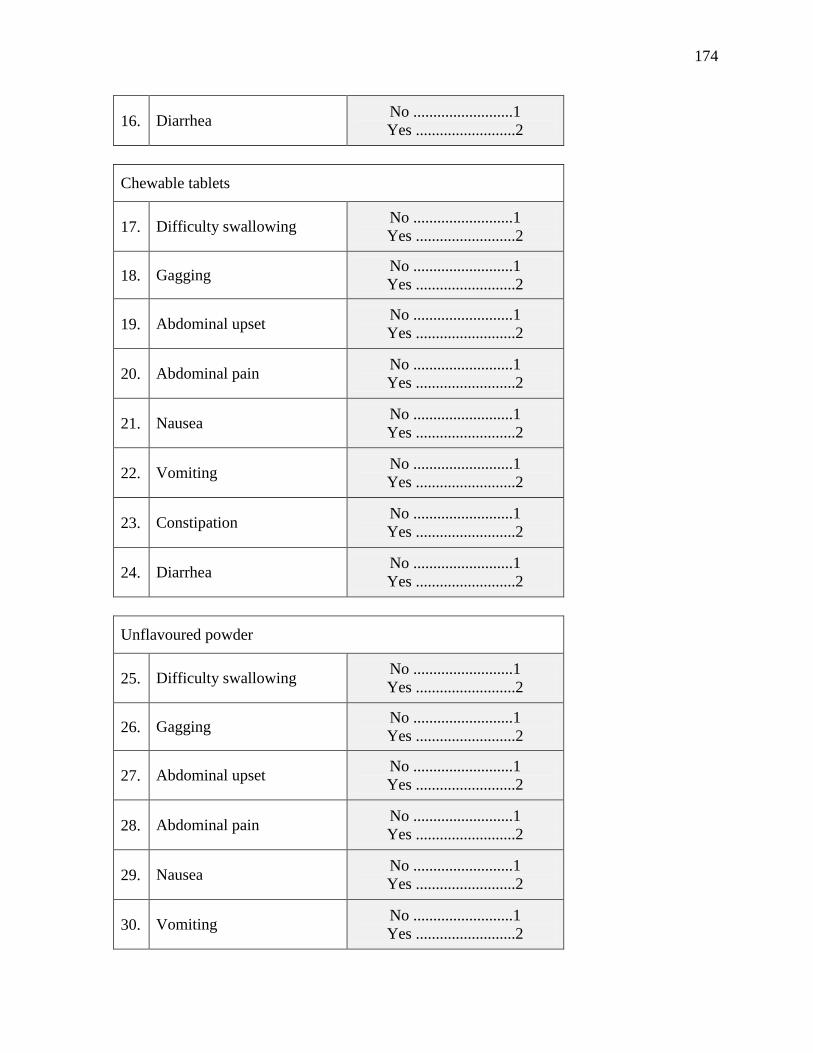
174
16. Diarrhea No .........................1
Yes .........................2
Chewable tablets
17. Difficulty swallowing No .........................1
Yes .........................2
18. Gagging No .........................1
Yes .........................2
19. Abdominal upset No .........................1
Yes .........................2
20. Abdominal pain No .........................1
Yes .........................2
21. Nausea No .........................1
Yes .........................2
22. Vomiting No .........................1
Yes .........................2
23. Constipation No .........................1
Yes .........................2
24. Diarrhea No .........................1
Yes .........................2
Unflavoured powder
25. Difficulty swallowing No .........................1
Yes .........................2
26. Gagging No .........................1
Yes .........................2
27. Abdominal upset No .........................1
Yes .........................2
28. Abdominal pain No .........................1
Yes .........................2
29. Nausea No .........................1
Yes .........................2
30. Vomiting No .........................1
Yes .........................2
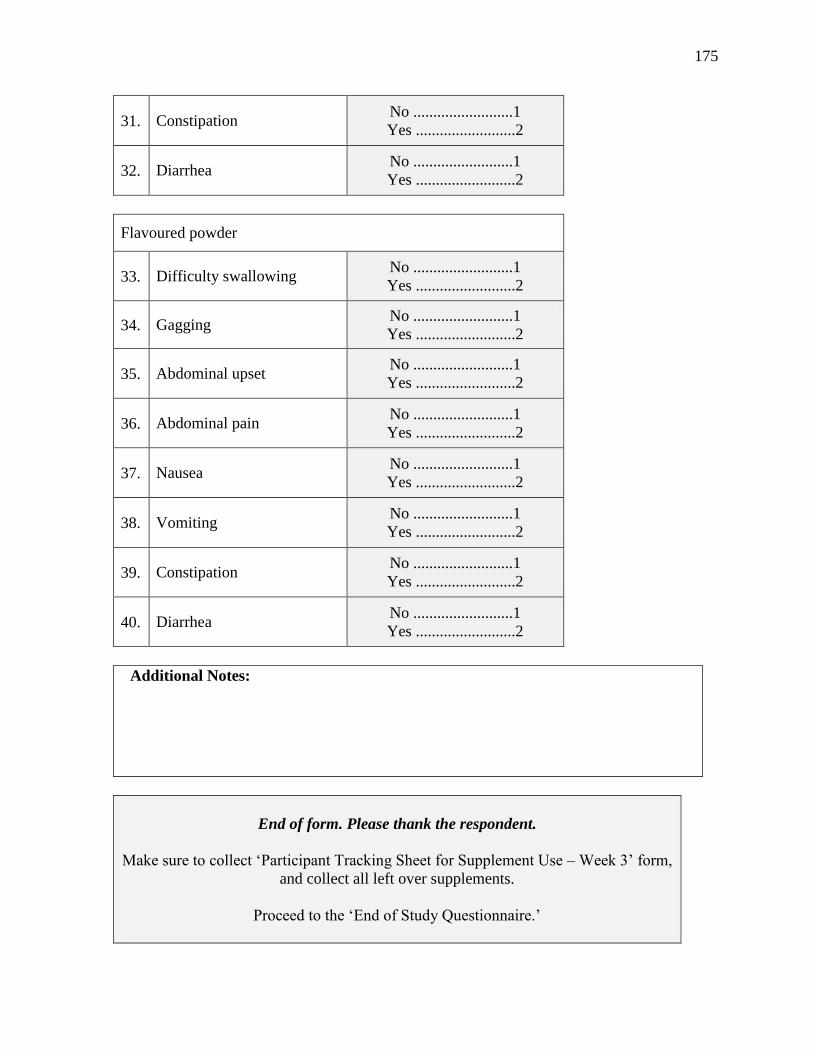
175
31. Constipation No .........................1
Yes .........................2
32. Diarrhea No .........................1
Yes .........................2
Flavoured powder
33. Difficulty swallowing No .........................1
Yes .........................2
34. Gagging No .........................1
Yes .........................2
35. Abdominal upset No .........................1
Yes .........................2
36. Abdominal pain No .........................1
Yes .........................2
37. Nausea No .........................1
Yes .........................2
38. Vomiting No .........................1
Yes .........................2
39. Constipation No .........................1
Yes .........................2
40. Diarrhea No .........................1
Yes .........................2
Additional Notes:
End of form. Please thank the respondent.
Make sure to collect ‘Participant Tracking Sheet for Supplement Use – Week 3’ form,
and collect all left over supplements.
Proceed to the ‘End of Study Questionnaire.’

176
Appendix P – Participant Tracking Sheet for Supplement Use – Week 3

177
Participant Tracking Sheet for Supplement Use – Week 3
1. Participant ID (3 digit code)
2. Research Assistant Number (2 digit code)
3. Date of the visit at the start of the week
(DD/MM/YY)
4. Date of the visit at the end of the week
(DD/MM/YY)
C. Daily consumption of supplements
Day
Tablets
Chewable
tablets
Unflavoured
powder
Flavoured
powder
Did not take
1
2
3
4
5
6
7

178
Appendix Q – End of Study Questionnaire

179
End of Study Questionnaire
(Assessment of acceptability and palatability)
1. Participant ID (3 digit code)
2. Research Assistant Number (2 digit code)
3. Date (DD/MM/YY)
Please go over the scale that will be used to answer many of the following questions.
Ensure that the participant knows how to use the scale properly.
A. Traditional tablets
Now I would like to ask you some questions about the tablets. The tablets were the pills that were
swallowed with liquid.
4. Over the period of 21 days, did you
use the tablets?
No ...................................................... 1
Yes ...................................................... 2
6
5. Why didn’t you use the tablets over
the 21 day period?
(Example: I could not swallow the
tablets; they were too big for my
mouth; etc.)
____________________________________
_____________________________________
_____________________________________
They were too big for my mouth ...... 1 I could not swallow them ................. 2 I had to take too many ...................... 3
B
For the next questions, I am going to ask you about how you found the tablets. We are going to
use the scale that I explained to you earlier. Please ask me any questions if you do not
understand.
The following are questions about the taste of the tablets. Taste refers to the flavour of
something. For example, sugar tastes sweet, while other foods might taste bitter or salty.
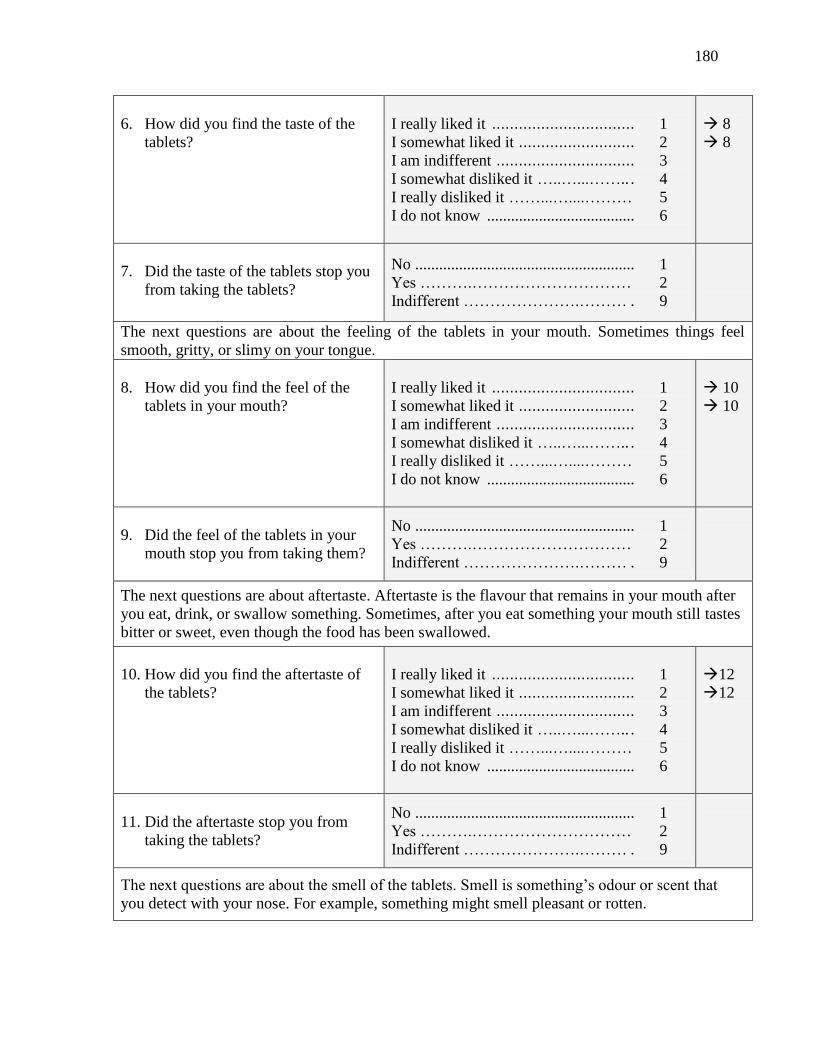
180
6. How did you find the taste of the
tablets?
I really liked it ................................ 1 I somewhat liked it .......................... 2 I am indifferent ............................... 3 I somewhat disliked it …..…...…….. . 4 I really disliked it ……...…....……… 5 I do not know ..................................... 6
8
8
7. Did the taste of the tablets stop you
from taking the tablets?
No ....................................................... 1
Yes ……….………………………… 2
Indifferent ………………….……… . 9
The next questions are about the feeling of the tablets in your mouth. Sometimes things feel
smooth, gritty, or slimy on your tongue.
8. How did you find the feel of the
tablets in your mouth?
I really liked it ................................ 1 I somewhat liked it .......................... 2 I am indifferent ............................... 3 I somewhat disliked it …..…...…….. . 4 I really disliked it ……...…....……… 5 I do not know ..................................... 6
10
10
9. Did the feel of the tablets in your
mouth stop you from taking them?
No ....................................................... 1
Yes ……….………………………… 2
Indifferent ………………….……… . 9
The next questions are about aftertaste. Aftertaste is the flavour that remains in your mouth after
you eat, drink, or swallow something. Sometimes, after you eat something your mouth still tastes
bitter or sweet, even though the food has been swallowed.
10. How did you find the aftertaste of
the tablets?
I really liked it ................................ 1 I somewhat liked it .......................... 2 I am indifferent ............................... 3 I somewhat disliked it …..…...…….. . 4 I really disliked it ……...…....……… 5 I do not know ..................................... 6
12
12
11. Did the aftertaste stop you from
taking the tablets?
No ....................................................... 1
Yes ……….………………………… 2
Indifferent ………………….……… . 9
The next questions are about the smell of the tablets. Smell is something’s odour or scent that
you detect with your nose. For example, something might smell pleasant or rotten.

181
12. How did you find the smell of the
tablets?
I really liked it ................................ 1 I somewhat liked it .......................... 2 I am indifferent ............................... 3 I somewhat disliked it …..…...…….. . 4 I really disliked it ……...…....……… 5 I do not know ..................................... 6
14
14
13. Did the smell stop you from taking
the tablets?
No ....................................................... 1
Yes ……….………………………… 2
Indifferent ………………….……… . 9
The next questions are about the colour of the tablets.
14. How did you find the colour of the
tablets?
I really liked it ................................ 1 I somewhat liked it .......................... 2 I am indifferent ............................... 3 I somewhat disliked it …..…...…….. . 4 I really disliked it ……...…....……… 5 I do not know ..................................... 6
16
16
15. Did the colour stop you from taking
the tablets?
No ....................................................... 1
Yes ……….………………………… 2
Indifferent ………………….……… . 9
The next set of questions is about using the tablets.
16. How did you find taking the
tablets?
Easy to take .................................... 1 A little easy to take ............................ 2 Not easy or difficult to take ............... 3 A little difficult to take ....................... 4 Difficult to take .................................. 5 I do not know ..................................... 6
17. When you took the tablets, did you
take them all at once or throughout
the day?
Throughout the day ............................ 1 All at once …………….…….……… 2 Both ……….……… ........................... 3
20
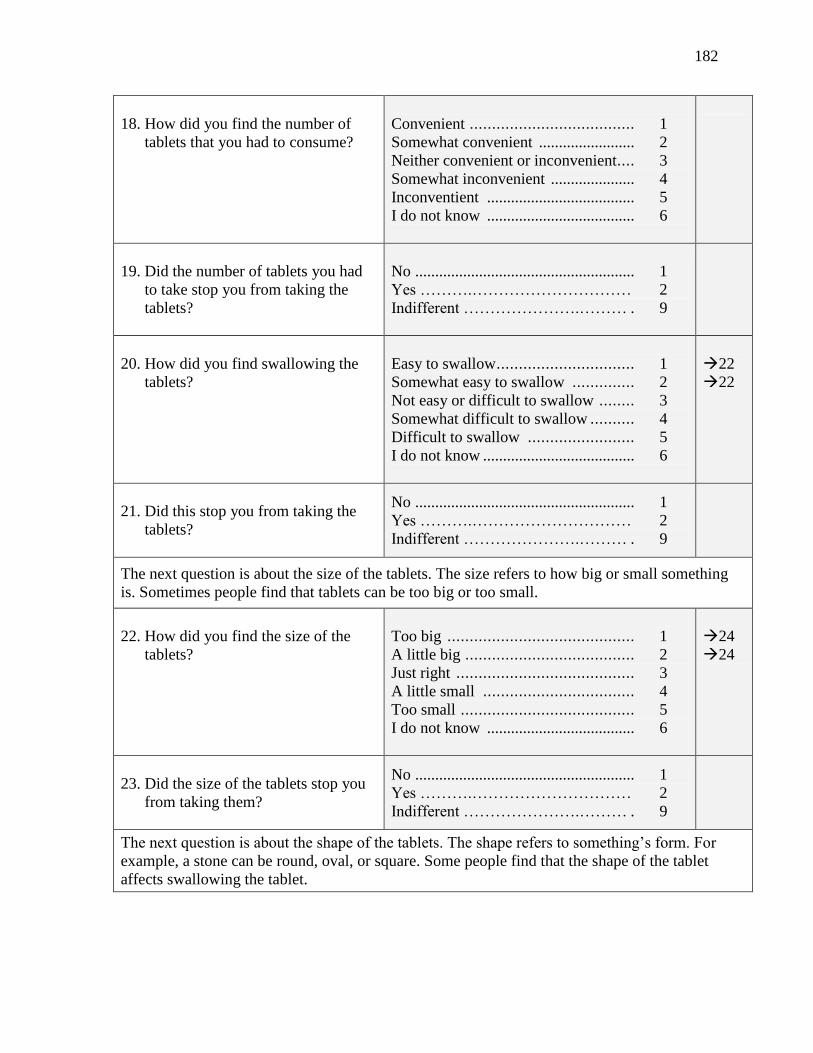
182
18. How did you find the number of
tablets that you had to consume?
Convenient ..................................... 1 Somewhat convenient ........................ 2 Neither convenient or inconvenient.... 3 Somewhat inconvenient ..................... 4 Inconventient ..................................... 5 I do not know ..................................... 6
19. Did the number of tablets you had
to take stop you from taking the
tablets?
No ....................................................... 1
Yes ……….………………………… 2
Indifferent ………………….……… . 9
20. How did you find swallowing the
tablets?
Easy to swallow ............................... 1 Somewhat easy to swallow .............. 2 Not easy or difficult to swallow ........ 3 Somewhat difficult to swallow .......... 4 Difficult to swallow ........................ 5 I do not know ...................................... 6
22
22
21. Did this stop you from taking the
tablets?
No ....................................................... 1
Yes ……….………………………… 2
Indifferent ………………….……… . 9
The next question is about the size of the tablets. The size refers to how big or small something
is. Sometimes people find that tablets can be too big or too small.
22. How did you find the size of the
tablets?
Too big .......................................... 1 A little big ...................................... 2 Just right ........................................ 3 A little small .................................. 4 Too small ....................................... 5 I do not know ..................................... 6
24
24
23. Did the size of the tablets stop you
from taking them?
No ....................................................... 1
Yes ……….………………………… 2
Indifferent ………………….……… . 9
The next question is about the shape of the tablets. The shape refers to something’s form. For
example, a stone can be round, oval, or square. Some people find that the shape of the tablet
affects swallowing the tablet.

183
24. How did you find the shape of the
tablets?
I really liked it ................................ 1 I somewhat liked it .......................... 2 I am indifferent ............................... 3 I somewhat disliked it …..…...…….. . 4 I really disliked it ……...…....……… 5 I do not know ..................................... 6
26
26
25. Did the shape of the tablets stop
you from taking the tablets?
No ....................................................... 1
Yes ……….………………………… 2
Indifferent ………………….……… . 9
The next few questions are about using the tablets in the future, if you were to become pregnant
again.
26. If you were offered the tablets
without cost (for free) to use during
a future pregnancy, would you use
them?
Always .......................................... 1 Usually …….…………….. ................ 2 Sometimes ........................................... 3 Once in a while .................................. 4 Never ……………………. ................. 5 I do not know ..................................... 6
27. If you were offered the tablets for a
cost to use during a future
pregnancy, would you buy them?
Always .......................................... 1 Usually …….…………….. ................ 2 Sometimes ........................................... 3 Once in a while .................................. 4 Never ……………………. ................. 5 I do not know ..................................... 6
28. If you could buy the tablets, how
much would you be willing to
spend for one day’s dose? Please
choose from the price of
1 lozenge ....................................... 1 1 tamarind pickle …….…………….. 2 1 hairband .......................................... 3 1 hairslide ............................................ 4 1 pair of bangles ……………………. 5 Would not buy ……………………… 8
I do not know……………………. ..... 9
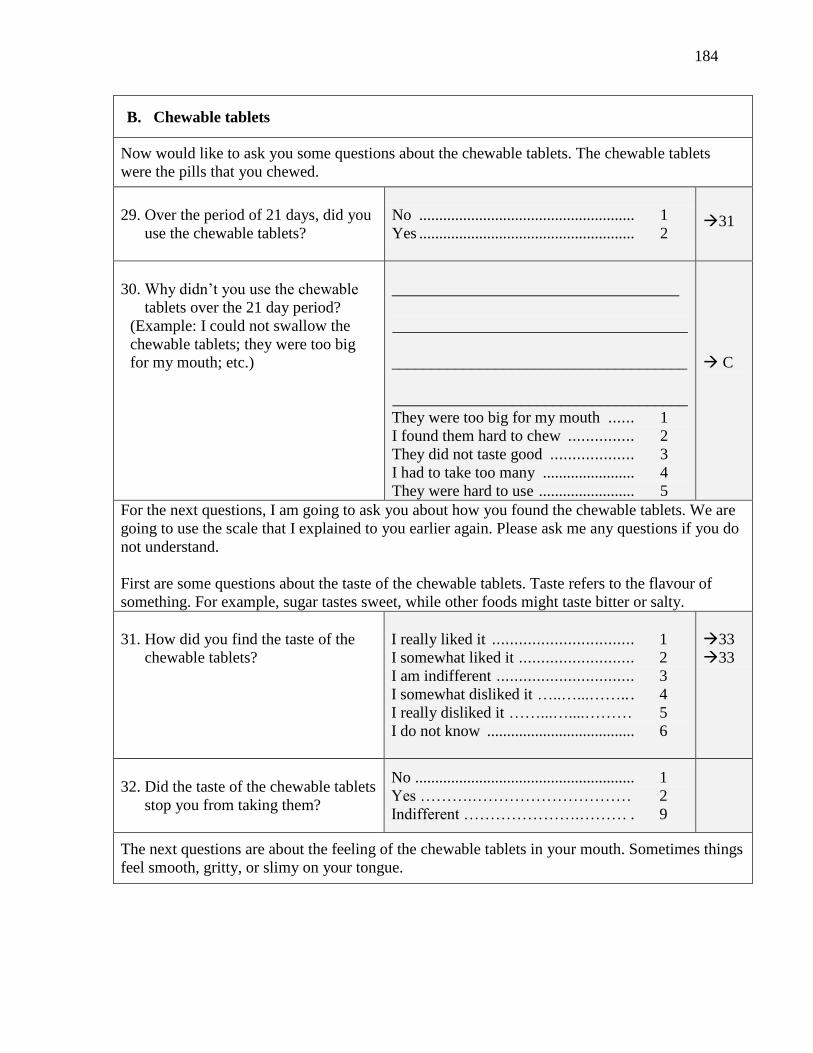
184
B. Chewable tablets
Now would like to ask you some questions about the chewable tablets. The chewable tablets
were the pills that you chewed.
29. Over the period of 21 days, did you
use the chewable tablets?
No ...................................................... 1
Yes ...................................................... 2
31
30. Why didn’t you use the chewable
tablets over the 21 day period?
(Example: I could not swallow the
chewable tablets; they were too big
for my mouth; etc.)
____________________________________
_____________________________________
_____________________________________
_____________________________________
They were too big for my mouth ...... 1 I found them hard to chew ............... 2 They did not taste good ................... 3 I had to take too many ....................... 4 They were hard to use ........................ 5
C
For the next questions, I am going to ask you about how you found the chewable tablets. We are
going to use the scale that I explained to you earlier again. Please ask me any questions if you do
not understand. First are some questions about the taste of the chewable tablets. Taste refers to the flavour of
something. For example, sugar tastes sweet, while other foods might taste bitter or salty.
31. How did you find the taste of the
chewable tablets?
I really liked it ................................ 1 I somewhat liked it .......................... 2 I am indifferent ............................... 3 I somewhat disliked it …..…...…….. . 4 I really disliked it ……...…....……… 5 I do not know ..................................... 6
33
33
32. Did the taste of the chewable tablets
stop you from taking them?
No ....................................................... 1
Yes ……….………………………… 2
Indifferent ………………….……… . 9
The next questions are about the feeling of the chewable tablets in your mouth. Sometimes things
feel smooth, gritty, or slimy on your tongue.
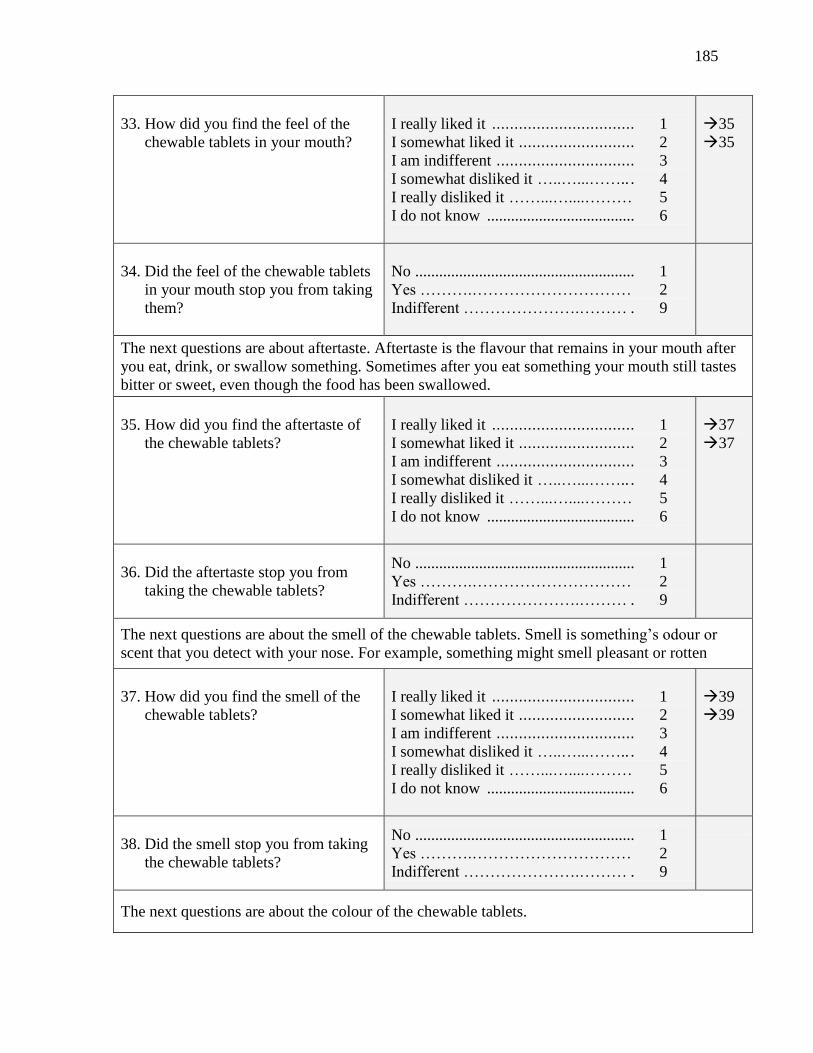
185
33. How did you find the feel of the
chewable tablets in your mouth?
I really liked it ................................ 1 I somewhat liked it .......................... 2 I am indifferent ............................... 3 I somewhat disliked it …..…...…….. . 4 I really disliked it ……...…....……… 5 I do not know ..................................... 6
35
35
34. Did the feel of the chewable tablets
in your mouth stop you from taking
them?
No ....................................................... 1
Yes ……….………………………… 2
Indifferent ………………….……… . 9
The next questions are about aftertaste. Aftertaste is the flavour that remains in your mouth after
you eat, drink, or swallow something. Sometimes after you eat something your mouth still tastes
bitter or sweet, even though the food has been swallowed.
35. How did you find the aftertaste of
the chewable tablets?
I really liked it ................................ 1 I somewhat liked it .......................... 2 I am indifferent ............................... 3 I somewhat disliked it …..…...…….. . 4 I really disliked it ……...…....……… 5 I do not know ..................................... 6
37
37
36. Did the aftertaste stop you from
taking the chewable tablets?
No ....................................................... 1
Yes ……….………………………… 2
Indifferent ………………….……… . 9
The next questions are about the smell of the chewable tablets. Smell is something’s odour or
scent that you detect with your nose. For example, something might smell pleasant or rotten
37. How did you find the smell of the
chewable tablets?
I really liked it ................................ 1 I somewhat liked it .......................... 2 I am indifferent ............................... 3 I somewhat disliked it …..…...…….. . 4 I really disliked it ……...…....……… 5 I do not know ..................................... 6
39
39
38. Did the smell stop you from taking
the chewable tablets?
No ....................................................... 1
Yes ……….………………………… 2
Indifferent ………………….……… . 9
The next questions are about the colour of the chewable tablets.

186
39. How did you find the colour of the
chewable tablets?
I really liked it ................................ 1 I somewhat liked it .......................... 2 I am indifferent ............................... 3 I somewhat disliked it …..…...…….. . 4 I really disliked it ……...…....……… 5 I do not know ..................................... 6
41
41
40. Did the colour stop you from taking
the chewable tablets?
No ....................................................... 1
Yes ……….………………………… 2
Indifferent ………………….……… . 9
The next set of questions is about using the chewable tablets.
41. How did you find taking the
chewable tablets?
Easy to take .................................... 1 A little easy to take ............................ 2 Not easy or difficult to take .............. 3 A little difficult to take ........................ 4 Difficult to take .................................. 5 I do not know ..................................... 6
42. When you took the chewable
tablets, did you take them all at
once or throughout the day?
Throughout the day ............................ 1 All at once ……….……… ................. 2 Both ……….……… ........................... 9
45
43. How did you find the number of
chewable tablets that you had to
consume?
Convenient...................................... 1 Somewhat convenient ........................ 2 Neither convenient or inconvenient.... 3 Somewhat inconvenient ..................... 4 Inconventient .................................... 5 I do not know ..................................... 6
44. Did the number of chewable tablets
you had to take stop you from
taking the chewable tablets?
No ....................................................... 1
Yes ……….………………………… 2
Indifferent ………………….……… . 9
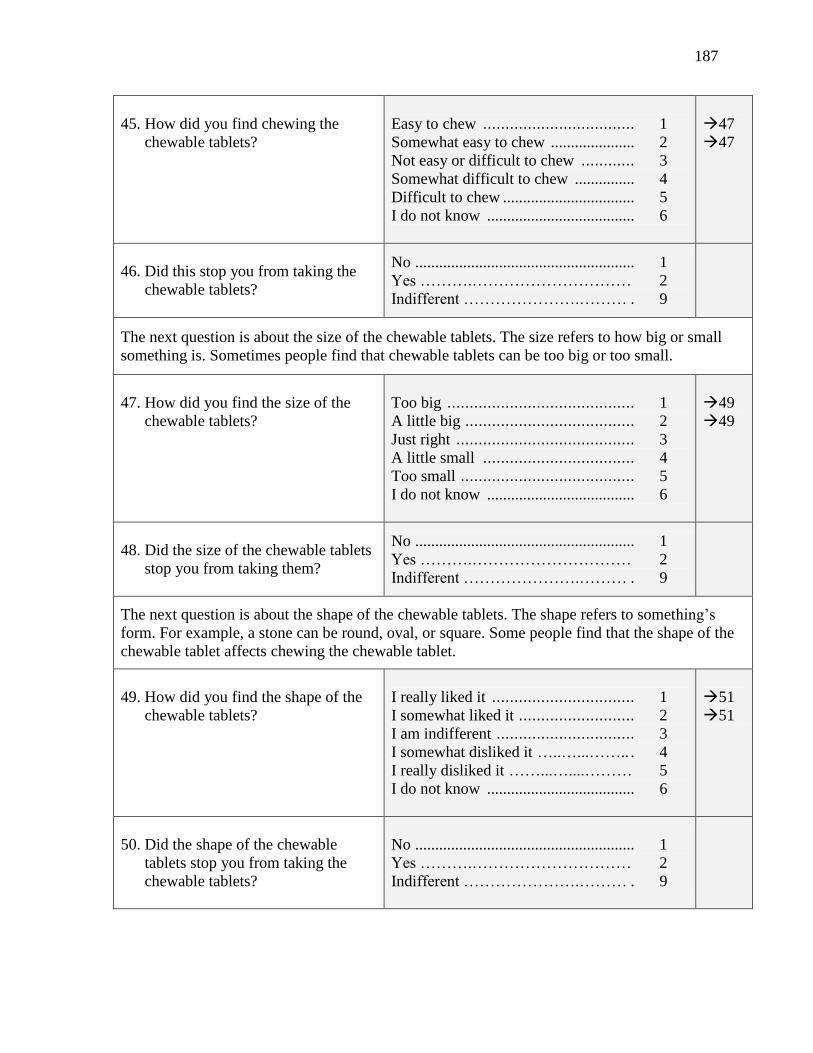
187
45. How did you find chewing the
chewable tablets?
Easy to chew .................................. 1
Somewhat easy to chew ..................... 2 Not easy or difficult to chew ............ 3 Somewhat difficult to chew ............... 4 Difficult to chew ................................. 5 I do not know ..................................... 6
47
47
46. Did this stop you from taking the
chewable tablets?
No ....................................................... 1
Yes ……….………………………… 2
Indifferent ………………….……… . 9
The next question is about the size of the chewable tablets. The size refers to how big or small
something is. Sometimes people find that chewable tablets can be too big or too small.
47. How did you find the size of the
chewable tablets?
Too big .......................................... 1 A little big ...................................... 2 Just right ........................................ 3 A little small .................................. 4 Too small ....................................... 5 I do not know ..................................... 6
49
49
48. Did the size of the chewable tablets
stop you from taking them?
No ....................................................... 1
Yes ……….………………………… 2
Indifferent ………………….……… . 9
The next question is about the shape of the chewable tablets. The shape refers to something’s
form. For example, a stone can be round, oval, or square. Some people find that the shape of the
chewable tablet affects chewing the chewable tablet.
49. How did you find the shape of the
chewable tablets?
I really liked it ................................ 1 I somewhat liked it .......................... 2 I am indifferent ............................... 3 I somewhat disliked it …..…...…….. . 4 I really disliked it ……...…....……… 5 I do not know ..................................... 6
51
51
50. Did the shape of the chewable
tablets stop you from taking the
chewable tablets?
No ....................................................... 1
Yes ……….………………………… 2
Indifferent ………………….……… . 9
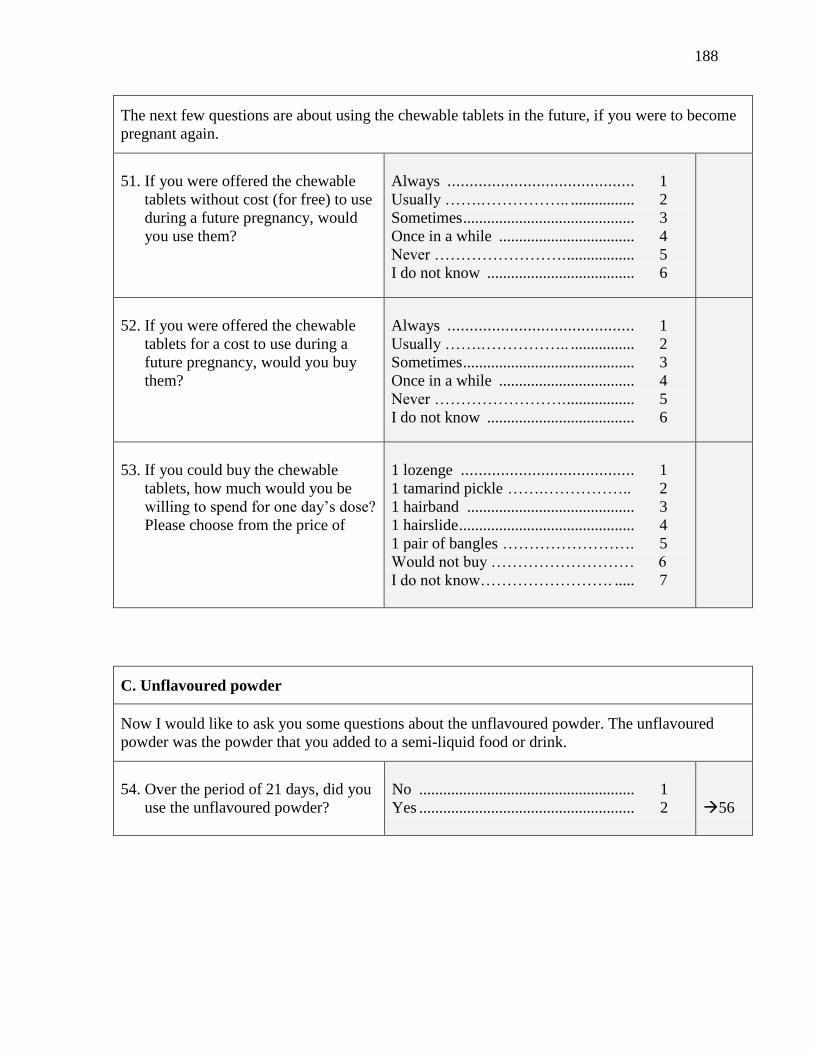
188
The next few questions are about using the chewable tablets in the future, if you were to become
pregnant again.
51. If you were offered the chewable
tablets without cost (for free) to use
during a future pregnancy, would
you use them?
Always .......................................... 1 Usually …….…………….. ................ 2 Sometimes ........................................... 3 Once in a while .................................. 4 Never ……………………. ................. 5 I do not know ..................................... 6
52. If you were offered the chewable
tablets for a cost to use during a
future pregnancy, would you buy
them?
Always .......................................... 1 Usually …….…………….. ................ 2 Sometimes ........................................... 3 Once in a while .................................. 4 Never ……………………. ................. 5 I do not know ..................................... 6
53. If you could buy the chewable
tablets, how much would you be
willing to spend for one day’s dose?
Please choose from the price of
1 lozenge ....................................... 1 1 tamarind pickle …….…………….. 2 1 hairband .......................................... 3 1 hairslide ............................................ 4 1 pair of bangles ……………………. 5 Would not buy ……………………… 6
I do not know……………………. ..... 7
C. Unflavoured powder
Now I would like to ask you some questions about the unflavoured powder. The unflavoured
powder was the powder that you added to a semi-liquid food or drink.
54. Over the period of 21 days, did you
use the unflavoured powder?
No ...................................................... 1
Yes ...................................................... 2
56
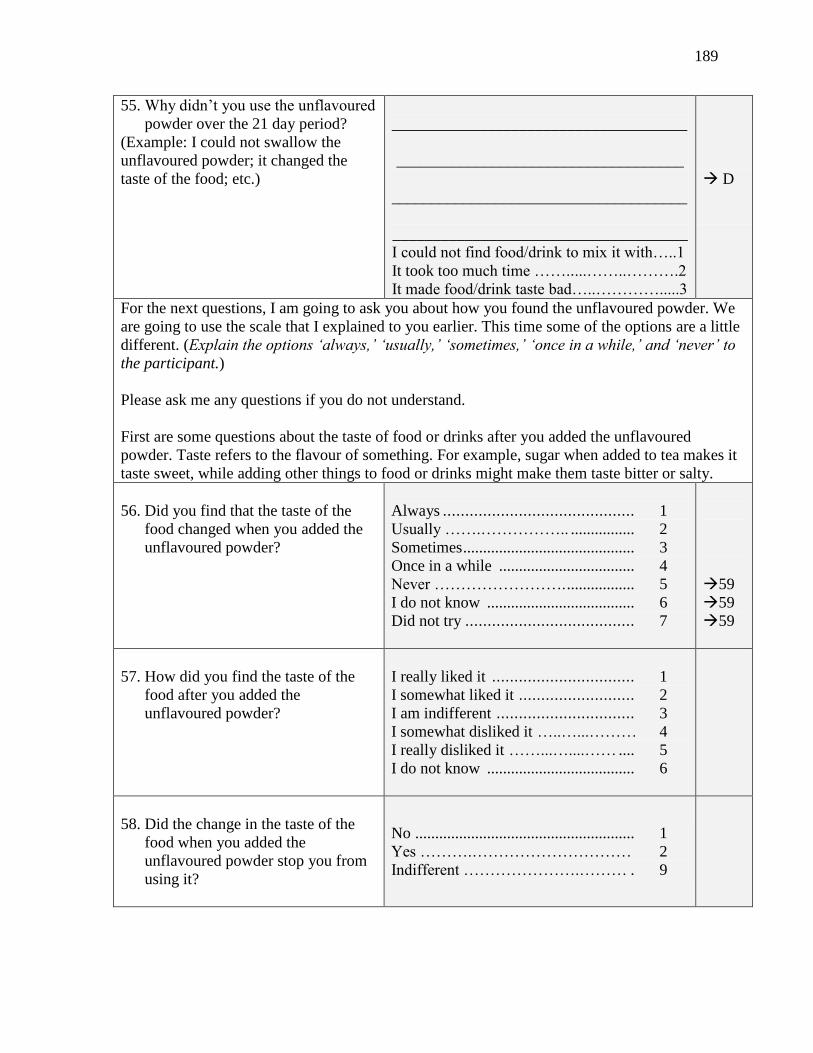
189
55. Why didn’t you use the unflavoured
powder over the 21 day period?
(Example: I could not swallow the
unflavoured powder; it changed the
taste of the food; etc.)
_____________________________________
____________________________________
_____________________________________
_____________________________________
I could not find food/drink to mix it with…..1
It took too much time …….....……..……….2
It made food/drink taste bad…..………….....3
D
For the next questions, I am going to ask you about how you found the unflavoured powder. We
are going to use the scale that I explained to you earlier. This time some of the options are a little
different. (Explain the options ‘always,’ ‘usually,’ ‘sometimes,’ ‘once in a while,’ and ‘never’ to
the participant.)
Please ask me any questions if you do not understand.
First are some questions about the taste of food or drinks after you added the unflavoured
powder. Taste refers to the flavour of something. For example, sugar when added to tea makes it
taste sweet, while adding other things to food or drinks might make them taste bitter or salty.
56. Did you find that the taste of the
food changed when you added the
unflavoured powder?
Always ........................................... 1 Usually …….…………….. ................ 2 Sometimes ........................................... 3 Once in a while .................................. 4 Never ……………………. ................. 5 I do not know ..................................... 6 Did not try ...................................... 7
59
59
59
57. How did you find the taste of the
food after you added the
unflavoured powder?
I really liked it ................................ 1 I somewhat liked it .......................... 2 I am indifferent ............................... 3 I somewhat disliked it …..…...……… 4 I really disliked it ……...…....…… .... 5 I do not know ..................................... 6
58. Did the change in the taste of the
food when you added the
unflavoured powder stop you from
using it?
No ....................................................... 1
Yes ……….………………………… 2
Indifferent ………………….……… . 9
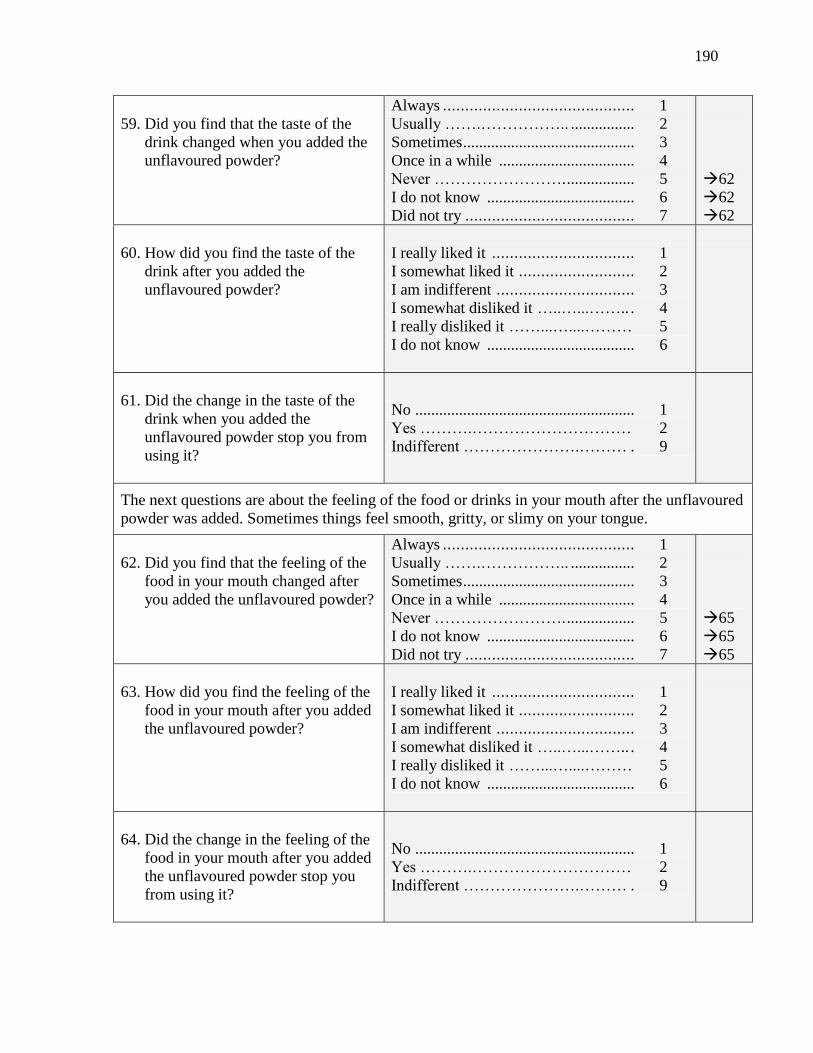
190
59. Did you find that the taste of the
drink changed when you added the
unflavoured powder?
Always ........................................... 1 Usually …….…………….. ................ 2 Sometimes ........................................... 3 Once in a while .................................. 4 Never ……………………. ................. 5 I do not know ..................................... 6 Did not try ...................................... 7
62
62
62
60. How did you find the taste of the
drink after you added the
unflavoured powder?
I really liked it ................................ 1 I somewhat liked it .......................... 2 I am indifferent ............................... 3 I somewhat disliked it …..…...…….. . 4 I really disliked it ……...…....……… 5 I do not know ..................................... 6
61. Did the change in the taste of the
drink when you added the
unflavoured powder stop you from
using it?
No ....................................................... 1
Yes ……….………………………… 2
Indifferent ………………….……… . 9
The next questions are about the feeling of the food or drinks in your mouth after the unflavoured
powder was added. Sometimes things feel smooth, gritty, or slimy on your tongue.
62. Did you find that the feeling of the
food in your mouth changed after
you added the unflavoured powder?
Always ........................................... 1 Usually …….…………….. ................ 2 Sometimes ........................................... 3 Once in a while .................................. 4 Never ……………………. ................. 5 I do not know ..................................... 6 Did not try ...................................... 7
65
65
65
63. How did you find the feeling of the
food in your mouth after you added
the unflavoured powder?
I really liked it ................................ 1 I somewhat liked it .......................... 2 I am indifferent ............................... 3 I somewhat disliked it …..…...…….. . 4 I really disliked it ……...…....……… 5 I do not know ..................................... 6
64. Did the change in the feeling of the
food in your mouth after you added
the unflavoured powder stop you
from using it?
No ....................................................... 1
Yes ……….………………………… 2
Indifferent ………………….……… . 9
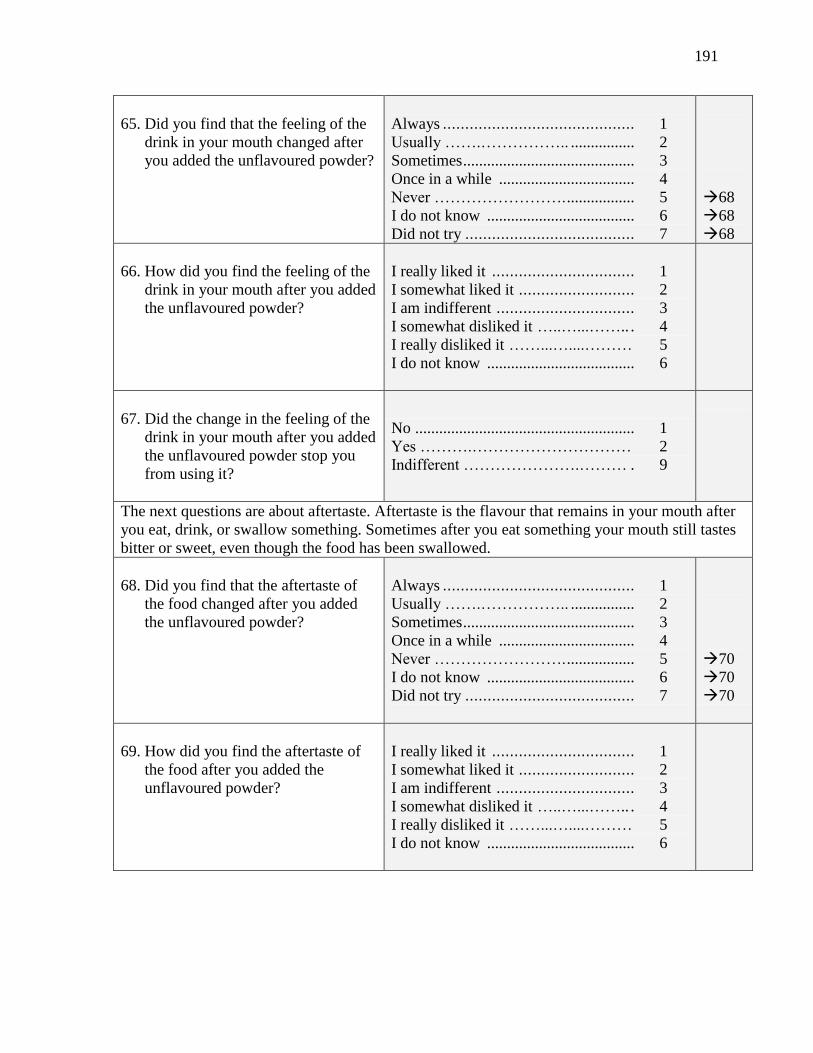
191
65. Did you find that the feeling of the
drink in your mouth changed after
you added the unflavoured powder?
Always ........................................... 1 Usually …….…………….. ................ 2 Sometimes ........................................... 3 Once in a while .................................. 4 Never ……………………. ................. 5 I do not know ..................................... 6 Did not try ...................................... 7
68
68
68
66. How did you find the feeling of the
drink in your mouth after you added
the unflavoured powder?
I really liked it ................................ 1 I somewhat liked it .......................... 2 I am indifferent ............................... 3 I somewhat disliked it …..…...…….. . 4 I really disliked it ……...…....……… 5 I do not know ..................................... 6
67. Did the change in the feeling of the
drink in your mouth after you added
the unflavoured powder stop you
from using it?
No ....................................................... 1
Yes ……….………………………… 2
Indifferent ………………….……… . 9
The next questions are about aftertaste. Aftertaste is the flavour that remains in your mouth after
you eat, drink, or swallow something. Sometimes after you eat something your mouth still tastes
bitter or sweet, even though the food has been swallowed.
68. Did you find that the aftertaste of
the food changed after you added
the unflavoured powder?
Always ........................................... 1 Usually …….…………….. ................ 2 Sometimes ........................................... 3 Once in a while .................................. 4 Never ……………………. ................. 5 I do not know ..................................... 6 Did not try ...................................... 7
70
70
70
69. How did you find the aftertaste of
the food after you added the
unflavoured powder?
I really liked it ................................ 1 I somewhat liked it .......................... 2 I am indifferent ............................... 3 I somewhat disliked it …..…...…….. . 4 I really disliked it ……...…....……… 5 I do not know ..................................... 6

192
70. Did the change in the aftertaste of
the food after you added the
unflavoured powder stop you from
using it?
No ....................................................... 1
Yes ……….………………………… 2
Indifferent ………………….……… . 9
71. Did you find that the aftertaste of
the drink changed after you added
the unflavoured powder?
Always ........................................... 1 Usually …….…………….. ................ 2 Sometimes ........................................... 3 Once in a while .................................. 4 Never ……………………. ................. 5 I do not know ..................................... 6 Did not try ...................................... 7
74
74
74
72. How did you find the after taste of
the drink after you added the
unflavoured powder?
I really liked it ................................ 1 I somewhat liked it .......................... 2 I am indifferent ............................... 3 I somewhat disliked it …..…...…….. . 4 I really disliked it ……...…....……… 5 I do not know ..................................... 6
73. Did the change in the aftertaste of
the drink after you added the
unflavoured powder stop you from
using it?
No ....................................................... 1
Yes ……….………………………… 2
Indifferent ………………….……… . 9
The next questions are about the smell of the food or drink after you added the unflavoured
powder. Smell is something’s odour or scent that you detect with your nose. For example,
something might smell pleasant or rotten.
74. Did you find that the smell of the
food changed after you added the
unflavoured powder?
Always ........................................... 1 Usually …….…………….. ................ 2 Sometimes ........................................... 3 Once in a while .................................. 4 Never ……………………. ................. 5 I do not know ..................................... 6 Did not try ...................................... 7
77
77
77
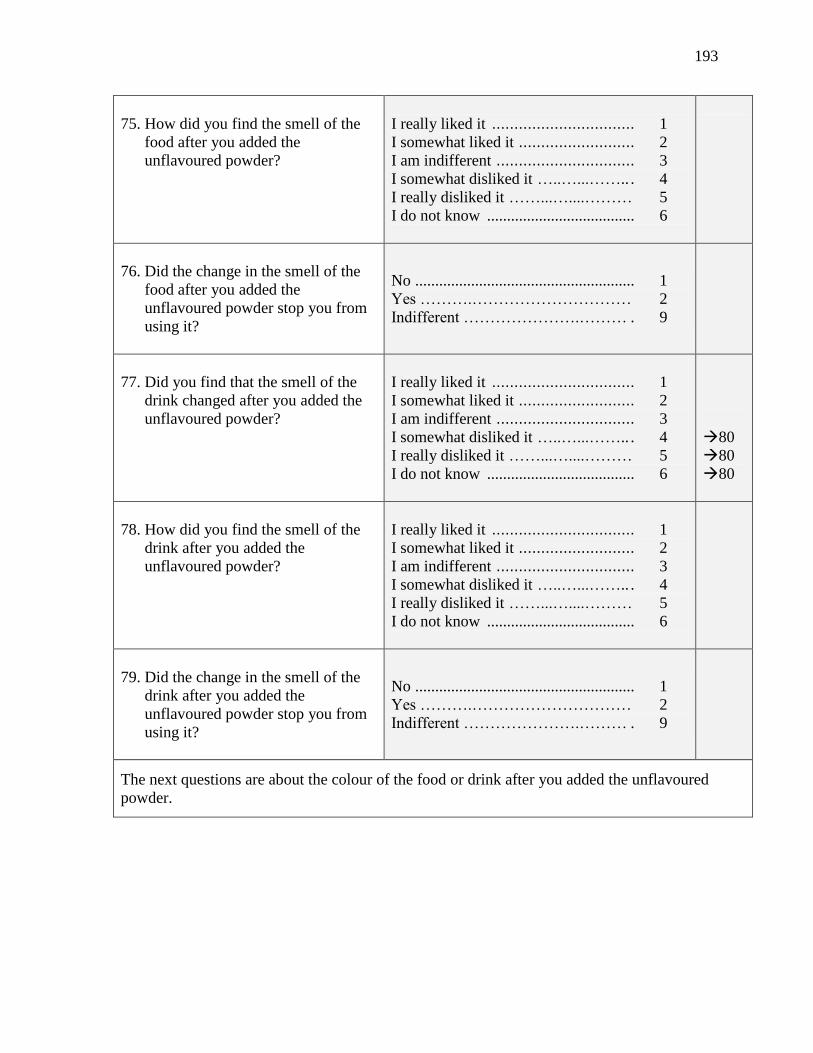
193
75. How did you find the smell of the
food after you added the
unflavoured powder?
I really liked it ................................ 1 I somewhat liked it .......................... 2 I am indifferent ............................... 3 I somewhat disliked it …..…...…….. . 4 I really disliked it ……...…....……… 5 I do not know ..................................... 6
76. Did the change in the smell of the
food after you added the
unflavoured powder stop you from
using it?
No ....................................................... 1
Yes ……….………………………… 2
Indifferent ………………….……… . 9
77. Did you find that the smell of the
drink changed after you added the
unflavoured powder?
I really liked it ................................ 1 I somewhat liked it .......................... 2 I am indifferent ............................... 3 I somewhat disliked it …..…...…….. . 4 I really disliked it ……...…....……… 5 I do not know ..................................... 6
80
80
80
78. How did you find the smell of the
drink after you added the
unflavoured powder?
I really liked it ................................ 1 I somewhat liked it .......................... 2 I am indifferent ............................... 3 I somewhat disliked it …..…...…….. . 4 I really disliked it ……...…....……… 5 I do not know ..................................... 6
79. Did the change in the smell of the
drink after you added the
unflavoured powder stop you from
using it?
No ....................................................... 1
Yes ……….………………………… 2
Indifferent ………………….……… . 9
The next questions are about the colour of the food or drink after you added the unflavoured
powder.

194
80. Did you find that the colour of the
food changed after you added the
unflavoured powder?
Always ........................................... 1 Usually …….…………….. ................ 2 Sometimes ........................................... 3 Once in a while .................................. 4 Never ……………………. ................. 5 I do not know ..................................... 6 Did not try ...................................... 7
83
83
83
81. How did you find the colour of the
food after you added the
unflavoured powder?
I really liked it ................................ 1 I somewhat liked it .......................... 2 I am indifferent ............................... 3 I somewhat disliked it …..…...…….. . 4 I really disliked it ……...…....……… 5 I do not know ..................................... 6
82. Did the change in the colour of the
food after you added the
unflavoured powder stop you from
using it?
No ....................................................... 1
Yes ……….………………………… 2
Indifferent ………………….……… . 9
83. Did you find that the colour of the
drink changed after you added the
unflavoured powder?
Always ........................................... 1 Usually …….…………….. ................ 2 Sometimes ........................................... 3 Once in a while .................................. 4 Never ……………………. ................. 5 I do not know ..................................... 6 Did not try ...................................... 7
86
86
86
84. How did you find the colour of the
drink after you added the
unflavoured powder?
I really liked it ................................ 1 I somewhat liked it .......................... 2 I am indifferent ............................... 3 I somewhat disliked it …..…...…….. . 4 I really disliked it ……...…....……… 5 I do not know ..................................... 6
85. Did the change in the colour of the
drink after you added the
unflavoured powder stop you from
using it?
No ....................................................... 1
Yes ……….………………………… 2
Indifferent ………………….……… . 9
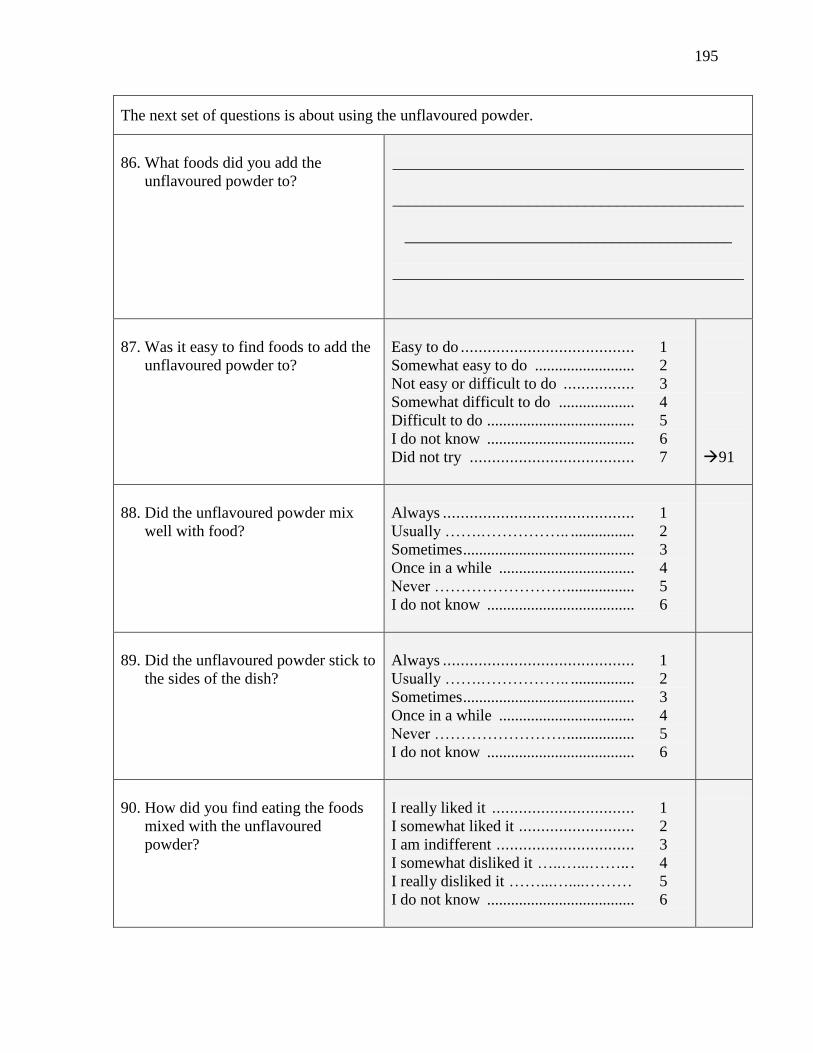
195
The next set of questions is about using the unflavoured powder.
86. What foods did you add the
unflavoured powder to?
____________________________________________
____________________________________________
_________________________________________
____________________________________________
87. Was it easy to find foods to add the
unflavoured powder to?
Easy to do ....................................... 1 Somewhat easy to do ......................... 2 Not easy or difficult to do ................ 3 Somewhat difficult to do ................... 4 Difficult to do ..................................... 5 I do not know ..................................... 6
Did not try ..................................... 7
91
88. Did the unflavoured powder mix
well with food?
Always ........................................... 1 Usually …….…………….. ................ 2 Sometimes ........................................... 3 Once in a while .................................. 4 Never ……………………. ................. 5 I do not know ..................................... 6
89. Did the unflavoured powder stick to
the sides of the dish?
Always ........................................... 1 Usually …….…………….. ................ 2 Sometimes ........................................... 3 Once in a while .................................. 4 Never ……………………. ................. 5 I do not know ..................................... 6
90. How did you find eating the foods
mixed with the unflavoured
powder?
I really liked it ................................ 1 I somewhat liked it .......................... 2 I am indifferent ............................... 3 I somewhat disliked it …..…...…….. . 4 I really disliked it ……...…....……… 5 I do not know ..................................... 6

196
91. What drinks did you add the
unflavoured powder to?
____________________________________________
____________________________________________
____________________________________________
____________________________________________
92. Was it easy to find drinks to add the
unflavoured powder to?
Easy to do ...................................... 1 Somewhat easy to do ......................... 2 Not easy or difficult to do ................ 3 Somewhat difficult to do .................... 4 Difficult to do ..................................... 5 I do not know ..................................... 6
Did not try .......................................... 7
96
93. Did the unflavoured powder mix
well with drinks?
Always ........................................... 1 Usually …….…………….. ................ 2 Sometimes ........................................... 3 Once in a while .................................. 4 Never ……………………. ................. 5 I do not know ..................................... 6
94. Did the unflavoured powder settle
at the bottom of the cup?
Always ........................................... 1 Usually …….…………….. ................ 2 Sometimes ........................................... 3 Once in a while .................................. 4 Never ……………………. ................. 5 I do not know ..................................... 6
95. How did you find drinking the
drinks mixed with the unflavoured
powder?
I really liked it ................................ 1 I somewhat liked it .......................... 2 I am indifferent ............................... 3 I somewhat disliked it …..…...…….. . 4 I really disliked it ……...…....……… 5 I do not know ..................................... 6
The next few questions are about using the unflavoured powder in the future, if you were to
become pregnant again.
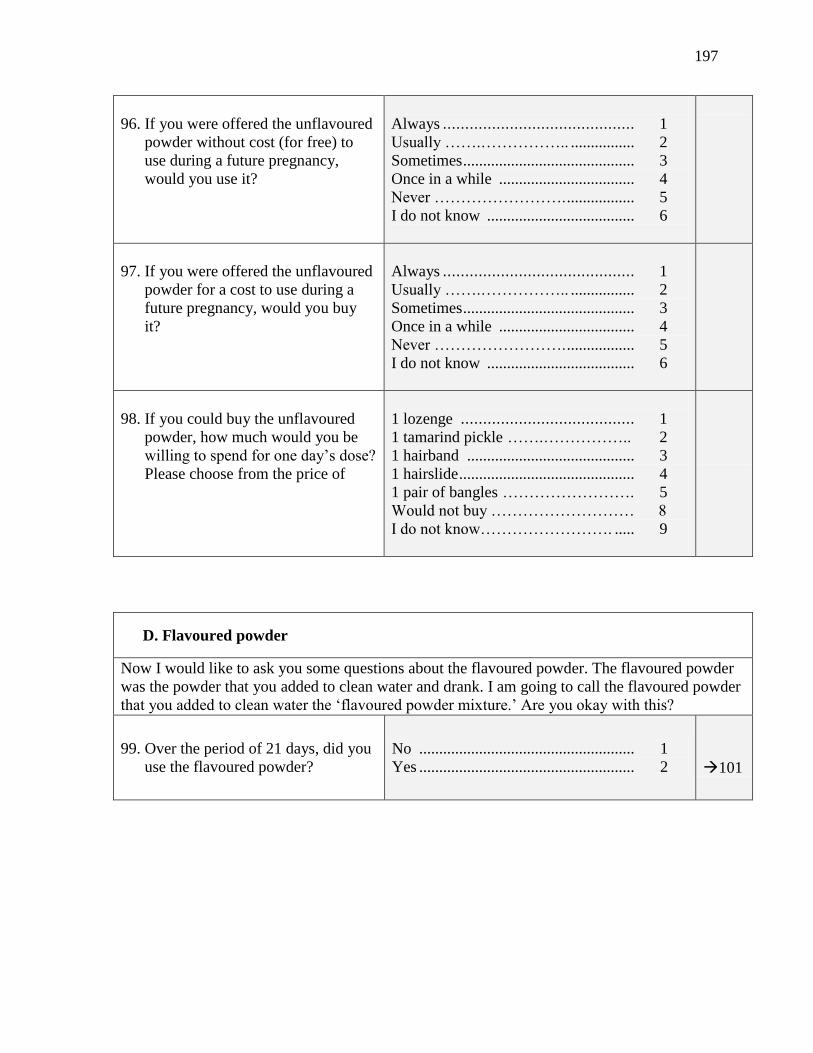
197
96. If you were offered the unflavoured
powder without cost (for free) to
use during a future pregnancy,
would you use it?
Always ........................................... 1 Usually …….…………….. ................ 2 Sometimes ........................................... 3 Once in a while .................................. 4 Never ……………………. ................. 5 I do not know ..................................... 6
97. If you were offered the unflavoured
powder for a cost to use during a
future pregnancy, would you buy
it?
Always ........................................... 1 Usually …….…………….. ................ 2 Sometimes ........................................... 3 Once in a while .................................. 4 Never ……………………. ................. 5 I do not know ..................................... 6
98. If you could buy the unflavoured
powder, how much would you be
willing to spend for one day’s dose?
Please choose from the price of
1 lozenge ....................................... 1 1 tamarind pickle …….…………….. 2 1 hairband .......................................... 3 1 hairslide ............................................ 4 1 pair of bangles ……………………. 5 Would not buy ……………………… 8
I do not know……………………. ..... 9
D. Flavoured powder
Now I would like to ask you some questions about the flavoured powder. The flavoured powder
was the powder that you added to clean water and drank. I am going to call the flavoured powder
that you added to clean water the ‘flavoured powder mixture.’ Are you okay with this?
99. Over the period of 21 days, did you
use the flavoured powder?
No ...................................................... 1
Yes ...................................................... 2
101
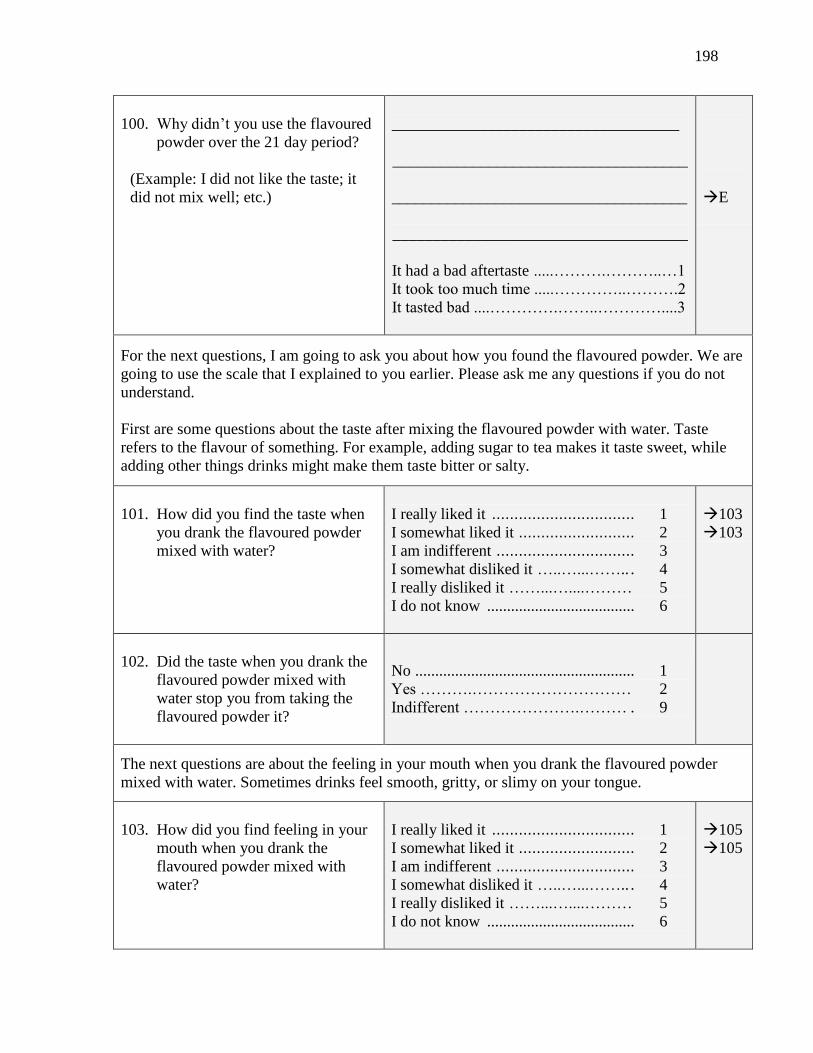
198
100. Why didn’t you use the flavoured
powder over the 21 day period?
(Example: I did not like the taste; it
did not mix well; etc.)
____________________________________
_____________________________________
_____________________________________
_____________________________________
It had a bad aftertaste .....……….………..…1
It took too much time .....…………..……….2
It tasted bad ....………….……..…………....3
E
For the next questions, I am going to ask you about how you found the flavoured powder. We are
going to use the scale that I explained to you earlier. Please ask me any questions if you do not
understand. First are some questions about the taste after mixing the flavoured powder with water. Taste
refers to the flavour of something. For example, adding sugar to tea makes it taste sweet, while
adding other things drinks might make them taste bitter or salty.
101. How did you find the taste when
you drank the flavoured powder
mixed with water?
I really liked it ................................ 1 I somewhat liked it .......................... 2 I am indifferent ............................... 3 I somewhat disliked it …..…...…….. . 4 I really disliked it ……...…....……… 5 I do not know ..................................... 6
103
103
102. Did the taste when you drank the
flavoured powder mixed with
water stop you from taking the
flavoured powder it?
No ....................................................... 1
Yes ……….………………………… 2
Indifferent ………………….……… . 9
The next questions are about the feeling in your mouth when you drank the flavoured powder
mixed with water. Sometimes drinks feel smooth, gritty, or slimy on your tongue.
103. How did you find feeling in your
mouth when you drank the
flavoured powder mixed with
water?
I really liked it ................................ 1 I somewhat liked it .......................... 2 I am indifferent ............................... 3 I somewhat disliked it …..…...…….. . 4 I really disliked it ……...…....……… 5 I do not know ..................................... 6
105
105
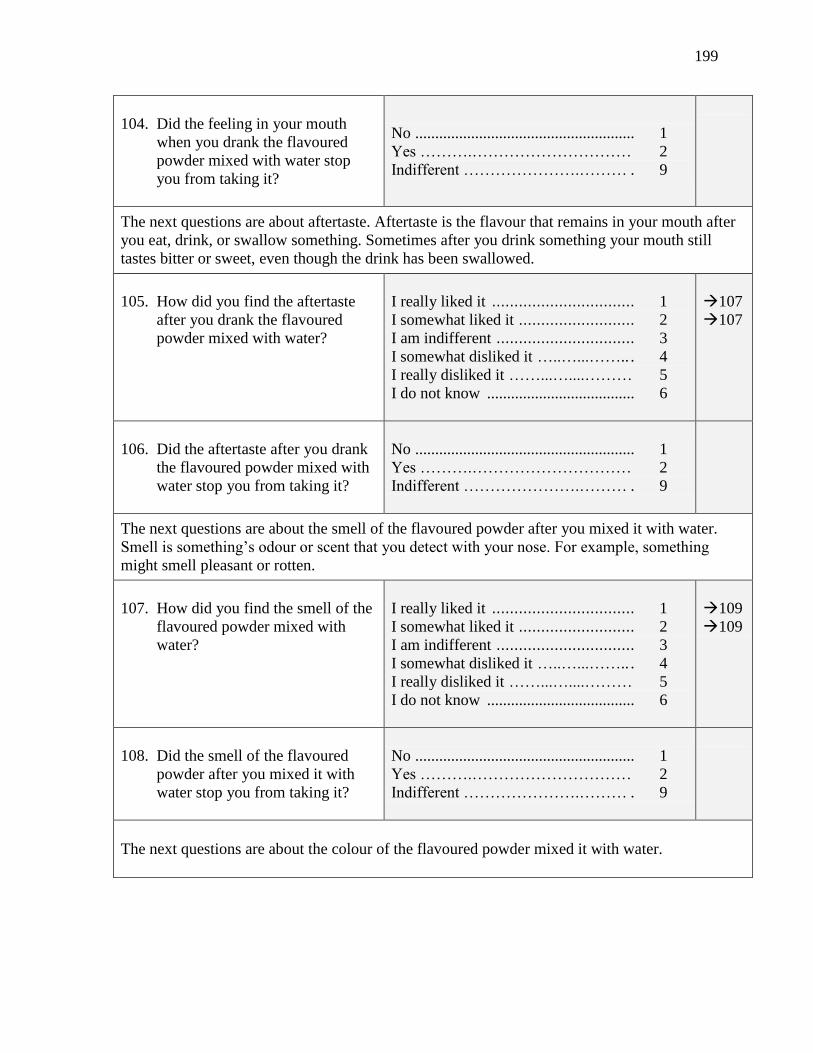
199
104. Did the feeling in your mouth
when you drank the flavoured
powder mixed with water stop
you from taking it?
No ....................................................... 1
Yes ……….………………………… 2
Indifferent ………………….……… . 9
The next questions are about aftertaste. Aftertaste is the flavour that remains in your mouth after
you eat, drink, or swallow something. Sometimes after you drink something your mouth still
tastes bitter or sweet, even though the drink has been swallowed.
105. How did you find the aftertaste
after you drank the flavoured
powder mixed with water?
I really liked it ................................ 1 I somewhat liked it .......................... 2 I am indifferent ............................... 3 I somewhat disliked it …..…...…….. . 4 I really disliked it ……...…....……… 5 I do not know ..................................... 6
107
107
106. Did the aftertaste after you drank
the flavoured powder mixed with
water stop you from taking it?
No ....................................................... 1
Yes ……….………………………… 2
Indifferent ………………….……… . 9
The next questions are about the smell of the flavoured powder after you mixed it with water.
Smell is something’s odour or scent that you detect with your nose. For example, something
might smell pleasant or rotten.
107. How did you find the smell of the
flavoured powder mixed with
water?
I really liked it ................................ 1 I somewhat liked it .......................... 2 I am indifferent ............................... 3 I somewhat disliked it …..…...…….. . 4 I really disliked it ……...…....……… 5 I do not know ..................................... 6
109
109
108. Did the smell of the flavoured
powder after you mixed it with
water stop you from taking it?
No ....................................................... 1
Yes ……….………………………… 2
Indifferent ………………….……… . 9
The next questions are about the colour of the flavoured powder mixed it with water.

200
109. How did you find the colour of
the flavoured powder mixed with
water?
I really liked it ................................ 1 I somewhat liked it .......................... 2 I am indifferent ............................... 3 I somewhat disliked it …..…...…….. . 4 I really disliked it ……...…....……… 5 I do not know ..................................... 6
111
111
110. Did the colour of the flavoured
powder mixed with water stop
you from taking it?
No ....................................................... 1
Yes ……….………………………… 2
Indifferent ………………….……… . 9
The next set of questions is about using the flavoured powder mixed with water.
111. How did you find consuming the
flavoured powder mixed with
water?
Easy to consume ............................. 1 Somewhat easy to consume ................ 2 Not easy or difficult to consume ........ 3 Somewhat difficult to consume ......... 4 Difficult to consume .......................... 5 I do not know ..................................... 6
112. How did you find adding the
flavoured powder to water?
Easy to do ....................................... 1 Somewhat easy to do ......................... 2 Not easy or difficult to do ................ 3 Somewhat difficult to do .................... 4 Difficult to do ..................................... 5 I do not know ..................................... 6
113. How did the flavoured powder
mix with water?
Completely mixe ............................ 1 Mostly mixed ................................. 2 Partially mixed ............................... 3 A little mixed ................................. 4 Did not mix ..................................... 5 I do not know ..................................... 6
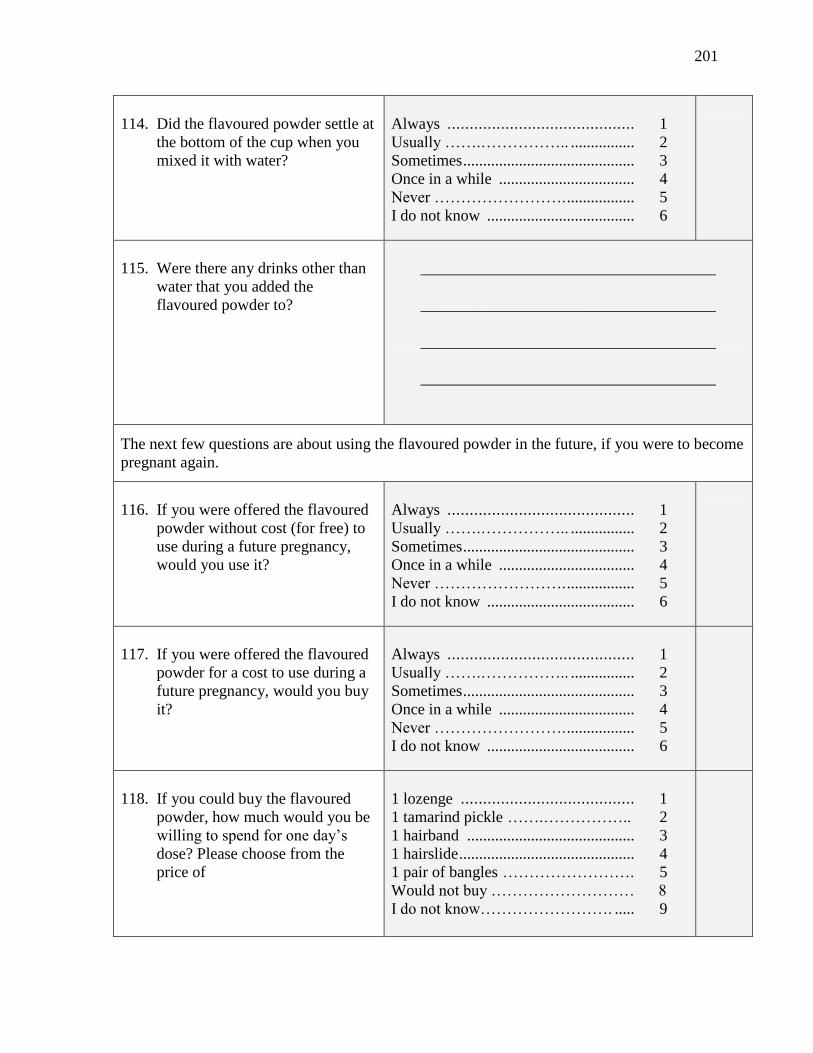
201
114. Did the flavoured powder settle at
the bottom of the cup when you
mixed it with water?
Always .......................................... 1 Usually …….…………….. ................ 2 Sometimes ........................................... 3 Once in a while .................................. 4 Never ……………………. ................. 5 I do not know ..................................... 6
115. Were there any drinks other than
water that you added the
flavoured powder to?
_____________________________________
_____________________________________
_____________________________________
_____________________________________
The next few questions are about using the flavoured powder in the future, if you were to become
pregnant again.
116. If you were offered the flavoured
powder without cost (for free) to
use during a future pregnancy,
would you use it?
Always .......................................... 1 Usually …….…………….. ................ 2 Sometimes ........................................... 3 Once in a while .................................. 4 Never ……………………. ................. 5 I do not know ..................................... 6
117. If you were offered the flavoured
powder for a cost to use during a
future pregnancy, would you buy
it?
Always .......................................... 1 Usually …….…………….. ................ 2 Sometimes ........................................... 3 Once in a while .................................. 4 Never ……………………. ................. 5 I do not know ..................................... 6
118. If you could buy the flavoured
powder, how much would you be
willing to spend for one day’s
dose? Please choose from the
price of
1 lozenge ....................................... 1 1 tamarind pickle …….…………….. 2 1 hairband .......................................... 3 1 hairslide ............................................ 4 1 pair of bangles ……………………. 5 Would not buy ……………………… 8
I do not know……………………. ..... 9
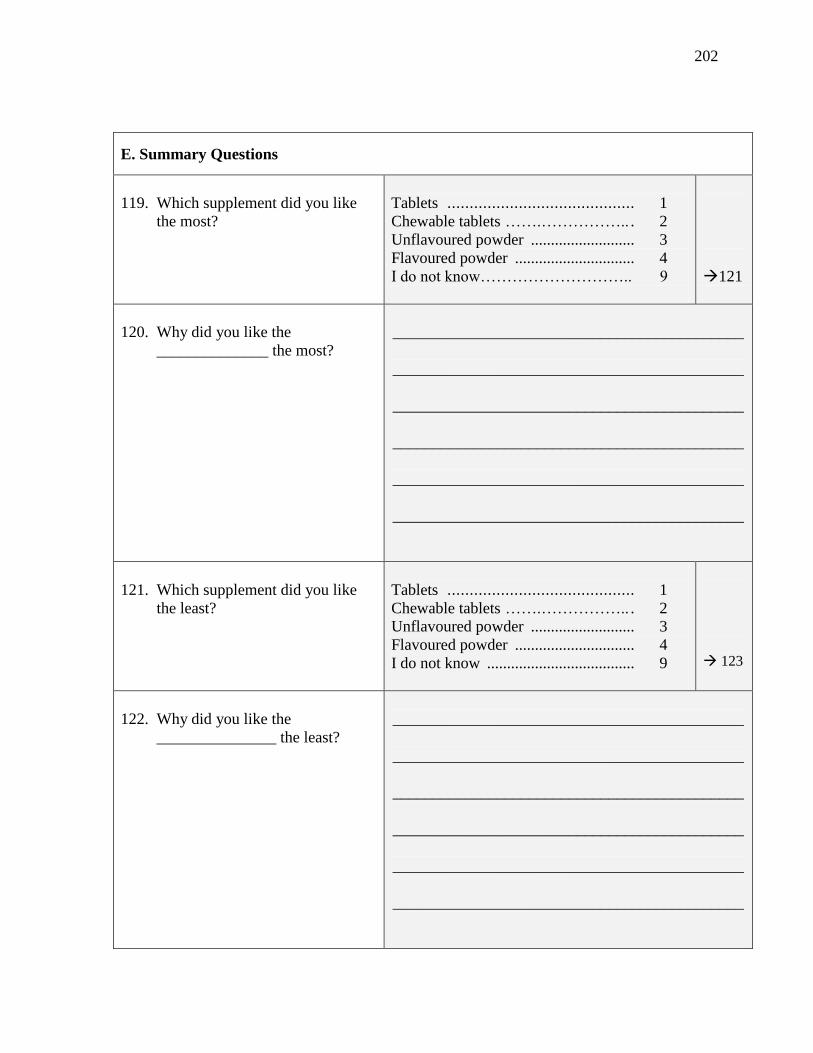
202
E. Summary Questions
119. Which supplement did you like
the most?
Tablets .......................................... 1 Chewable tablets …….…………….. . 2 Unflavoured powder .......................... 3 Flavoured powder .............................. 4 I do not know……………………….. 9
121
120. Why did you like the
______________ the most?
____________________________________________
____________________________________________
____________________________________________
____________________________________________
____________________________________________
____________________________________________
121. Which supplement did you like
the least?
Tablets .......................................... 1 Chewable tablets …….…………….. . 2 Unflavoured powder .......................... 3 Flavoured powder .............................. 4 I do not know ..................................... 9
123
122. Why did you like the
_______________ the least?
____________________________________________
____________________________________________
____________________________________________
____________________________________________
____________________________________________
____________________________________________

203
123. Now that you have completed the
study and have experience with
taking calcium, if you could
design a form of calcium that
would be easiest for you to take
and accept, what would it look
like? Would it be a smaller
amount of powder, a smaller pill
or something totally different?
____________________________________________
____________________________________________
____________________________________________
____________________________________________
____________________________________________
____________________________________________
End of interview.
Please thank the respondent and present her with the study completion certificate.
Additional Notes
204
Appendix R – End of Study Participation Form

205
End of Study Participation Form
1. Participant ID ( 3 digit code)
2. Research Assistant Number (2 digit
code)
3. Date of form completion (DD/MM/YY)
A. Visit details
4. Date of final visit (DD/MM/YY)
5. How many study activities has the
participant completed?
(Select the option that is consistent with the
farthest point within the study that the
participant completed.)
Baseline questionnaire....................1
Run-in Period.................................2
Week 1...........................................3
Week 2...........................................4
Week 3...........................................5
End of study questionnaire............6
6. If options 1, 2, 3, 4, or 5 were selected
in Q5, please select the appropriate
reason for why the participant did not
complete the study.
Voluntary withdrawal...................1
Lost to follow up..........................2
Adverse event...............................3
Concomitant illness.......................4
Accident or death.........................5
Other ______________________6
(specify)
Notes:
___________________________________ ____________________________
Research Fellow’s signature Date

206
Appendix S – Comparison of Enrolled and Withdrawn Participants

207
Comparison of baseline characteristics between participants who withdrew prior to the
selection period and those who remained in the study.
Characteristic Comparison of withdrawals and
enrolled participants
P-value
Age (years), Mean ± SD no difference 0.19
Gestational age at enrolment
(weeks),
Mean ± SD
enrolled: 21.9 ± 5.2
withdrawals: 19.1 ± 5.8
0.04
Educational attainment, n (%)
None
Primary
Secondary or higher
- 0.87
Ability to read, n (%)
Cannot
With difficulty
Easily
- 0.86
Occupation, n (%)
Homemaker
Salaried job
Day labourer
Private business
Unemployed
- 0.91
Husband’s educational attainment,
n (%)
None
Primary
Secondary or higher
Unknown
- 0.09
Husband’s occupation, n (%)
Salaried job
Day labourer
Private business
Professional
Expatriate
Unemployed
Agriculture
enrolled: withdrawals: 0.01
45 (34%) 1 (6%)
1 (1%) 1 (6%)
48 (36%) 9 (53%)
25 (19%) 3 (18%)
4 (3%) 3 (18%)
3 (2%) 0
6 (5%) 0
Home ownership, n (%) - 0.68
Home constructed from cement1, n
(%)
Floor
Walls
Roof
- 0.74
Crowding index2, Mean ± SD - 0.31
Source of drinking water, n (%)
Piped
Pumped
- 0.26
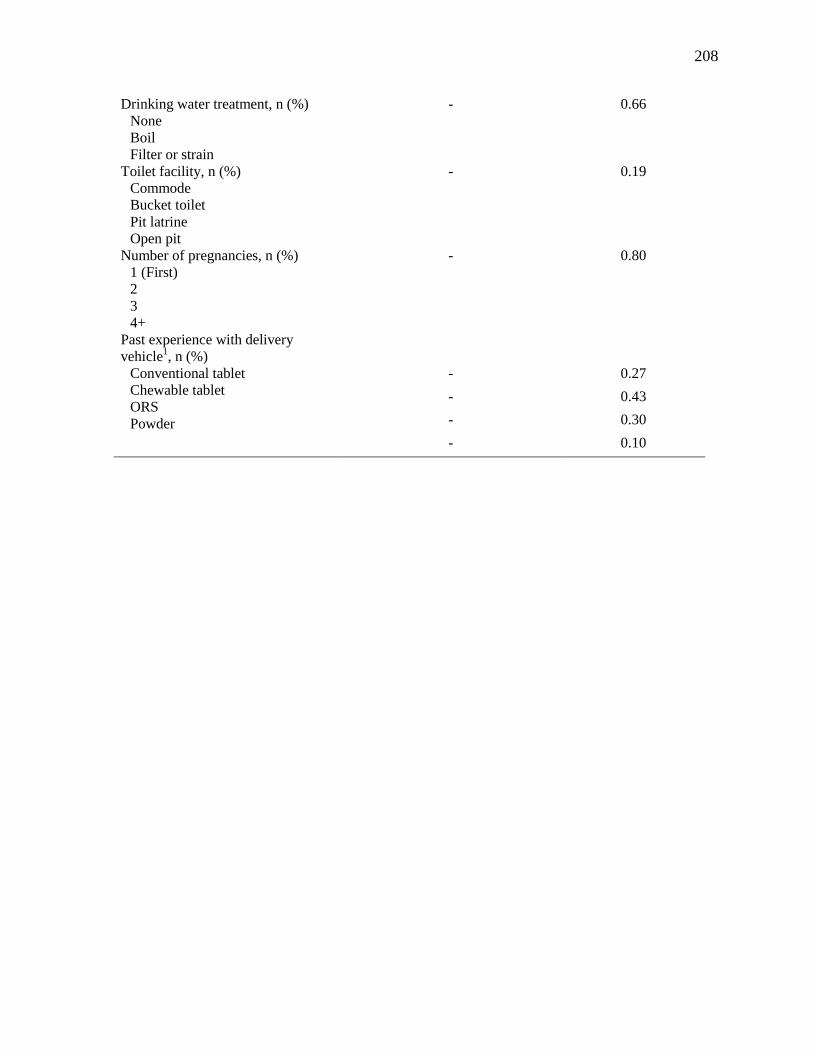
208
Drinking water treatment, n (%)
None
Boil
Filter or strain
- 0.66
Toilet facility, n (%)
Commode
Bucket toilet
Pit latrine
Open pit
- 0.19
Number of pregnancies, n (%)
1 (First)
2
3
4+
- 0.80
Past experience with delivery
vehicle1, n (%)
Conventional tablet
Chewable tablet
ORS
Powder
- 0.27
- 0.43
- 0.30
- 0.10