preface - simulatedvision.co.uk paper.pdf · preface the paper following this preface was...
TRANSCRIPT

PREFACE
The paper following this Preface was originally prepared for publication in early 1973, but was rejectedfor (to me) unjustified reasons. I kept the manuscript, believing that, some day, the information thereinmay possibly become more acceptable.
Some time ago I was prompted to look the manuscript out and see just what it contained which mightstill be relevant. I found that it was still relevant (after over 40 years!) and also that it was a sound &essential background on which to build an understanding of visual function. Significant parts of thisstill seem to be missing in open literature (other than in my second book 'Computer Vision - a unified,biologically-based approach', 1992). Much is also now accessible as part of the website'www.simulatedvision.co.uk', first available in 2004.
Current explorations going on in academic circles are still searching for the mechanism whereby whathas come to be known as hyperacuity is achieved, these explorations being almost entirely based aroundsearches for sophisticated processes in the central cortex. Meanwhile the now well-known electronicencyclopaedia 'Wikipedia' has an entry under the main heading 'Hyperacuity' which starts off with astatement that the mechanisms by which human vision achieves hyperacuity are currently a problemawaiting a solution. The recovered paper showed how this is achieved (mainly at retinal level ratherthan in the central cortex) all those years ago!. What had been already explored at the start of the 1970'swas how a mixture of factors, which seem to be generally overlooked to this day, come together in theinitial sensing of light distribution as imaged on the retinae, to explain the phenomenon of hyperacuity(and many other things). They provide the basis for not only simple sensing of isolated objects in aplain background but also virtually the whole of the structured scene in normal vision.
As a result of this early research, the elements of local sensing of visual information have been built upby the Filton research team (primarily under my leadership) into a more or less complete input structurefor further analysis of virtually every facet of any scene (for both static scenes, moving scenes &stereo). Furthermore, each & every profile segment is sensed effectively as a vector to a small fractionof a receptor spacing and to less than one degree orientation (thereby providing virtually every aspect ofhyperacuity for any viewing situation). Without use of the background summarised in the rejectedpaper, none of this further work would have been possible.
.Ian Overington, March 2017.
EXTENDED PHYSICALLY-BASED MODELLING OF THRESHOLDPERFORMANCE FOR PHOTOPIC VISION.
ByI. Overington, British Aircraft Corporation Ltd, Filton, Bristol, UK.
ABSTRACT.
A new basic model of threshold detection for foveal viewing by human observers using the naked eyewas proposed by Overington and Lavin in 1971 (Ref. 1). This model has subsequently been extended tocover many aspects of detection and certain simple recognition within the luminance range commonlyconsidered as photopic (i.e. where cone vision is employed rather than rod vision). It has been shown thataccurate predictions of threshold performance are possible over a wide range of photopic viewingconditions using what still remains an essentially simple model.
1. INTRODUCTION
In 1971 Overington and Lavin proposed a new model of threshold detection for fovealviewing by human observers using the naked eye (Ref. 1). This model was based onphysically known properties of the human eye and logical assumptions about the averageeffects of processing by the neural networks. The resulting model was shown to produceaccurate predictions of a variety of sets of threshold data simply by selecting the values fortwo constants. It was suggested at the time that such a model, based as it was onilluminance gradients in the retinal image and probabilistic analysis in the neural networkswas, with only minor modifications, capable of handling 'difficult' imaging situations (e.g.degraded images, multi-contrast situations and complex scenes) - the situations which arethe rule rather than the exception in real life.
Also in 1971 Kornfeld and Lawson (Ref. 2) published a comprehensive comparisonbetween the predictive capabilities of empirical vision models based on area and contourdetection. They concluded that models based on contour detection gave by far the bestpredictive capabilities. However, the empirical models studied by them gave poor fits atlarge stimulus sizes and presented some difficulties at low photopic luminance levels.
Since the original publication of our physically based model in 1971 the field ofapplication has been vastly extended and it has been shown possible to predict, usuallywith high accuracy, a very wide variety of photopic detection* thresholds. . In additionthresholds of 'recognition'* for certain simple objects have also been predicted.
The situations covered are not exhaustive - such coverage would require extensive effortand an excessively large amount of print. However, those covered do include thresholds forperipheral viewing out to at least 15 deg from the fovea, certain degraded stimuli, certainsimple multi-contrast stimuli, moving stimuli, the entire range of photopic luminance foreffectively infinite viewing times, the entire range of 'exposure times' from short pulses________________________________________________________________________________ * In this paper 'detection' refers to the ability of an observer to see that an object ispresent, with no ability to define its form or structure. 'Recognition' refers to a progressivestate of learning more about an object and is therefore specifically related to ability to'detect' certain aspects of form and structure.
to infinite viewing times and some search situations. Finally it is shown possible topredict qualitatively the complex threshold trends due to local background structurenormally attributed to complex excitatory and inhibitory neural mechanisms (e.g. Refs. 3, 4& 5).
Throughout this modelling it has been found possible to retain the basic simplicity of thefunctional relationship originally proposed which may be expressed as
f(C) = K1 f(n) + δ (i)
where f(C) is a function of the contrast of the part of an object of interest relevant to thedetection or recognition task,
f(n) is a function of the number of retinal receptors around the retinal image contourof maximum illuminance gradient (or around the part of the contour which is importantfor a recognition decision),
K1 and δ are constants which depend on the state of adaptation of the eye andexperimental conditions, together with briefing, state of motivation, learning and otherpsychological factors.
Of the above, f(C) has been found to be definable in terms of the prevailing spreadfunction of the refraction optics of the eye, involuntary eye movements, any imagedegradation before the eye (including motion) and the mean foveal retinal receptor spacing,together with the effective exposure time.
f(n) has likewise been found to be specifiable in terms of the number of retinal receptorpairs effective in a given acquisition exercise (which includes the mean receptor spacing inother than foveal viewing) together with the most likely number of glimpses of the objectof interest in an extended viewing situation.
K1 and δ can both be described (for a given set of experimental conditions) in terms ofsimple functions of adaptation level of the form [α/√BR + β] where BR is the retinalilluminance appropriate to the prevailing adaptation level.
Thus it is believed that most photopic (or cone) threshold viewing can be adequatelydescribed in terms of four constants and known physical input conditions provided that theprevailing experimental conditions can be related to some classical experiment in order toestablish the appropriate values of the four constants. Even without this ability to relate to aclassical experiment only a minimal number of threshold measurements should be requiredto enable the appropriate values of the four constants to be deduced for a given viewingsituation.
2. EXTENSIONS TO PERIPHERAL VIEWING.
In order to attempt to extend the foveal vision model of Ref. 1 to peripheral viewing atphotopic luminance level a prime requisite was a simple source of reliable andcomprehensive experimental threshold data for near foveal peripheral viewing (i.e. out to10 or 15 degrees from the fovea). Such a body of data was believed to be that of J.H.
Taylor for presentation of circular stimuli at defined angles from the fovea for exposuretimes of 1/3 second and at a field luminance of 75 ft. Lamberts (Ref. 6). The thresholddata covers a large range of sizes (from I minute of arc diameter to 2 degrees diameter) andangles from the fovea of up to approximately 14°. Since 1/3 second is generally acceptedas the median for glimpse duration in effectively empty field search (e.g. Ref. 7), this bodyof data makes a very useful reference set for single glimpse viewing.
In order to attempt modelling of peripheral cone vision it is necessary first to considerthe possible differences in signal reception and processing which might exist betweenfoveal and peripheral viewing. For foveal viewing it had been assumed (Ref. 1) that theeffective received signals could be considered as a set of difference signals between pairsof receptors situated across the region of maximum illuminance gradient in the retinalimage. It was then assumed that each receptor pair difference was individuallytransmitted to deep neural level for processing. Could it be that this condition might alsohold for cone vision outside the fovea? Now it is known from Østerberg (Ref. 8) that theretinal cone receptor density falls off steeply outside the fovea. Lavin has shown(unpublished work) that the average density function (in linear terms) may be expressedadequately out to at least several degrees from the fovea by the simple function
nθ /n0 = (θ + 1) -0.625 (ii)
where θ is the angle from the fovea in degrees and nθ and n0 are the retinal receptordensities at θ degrees and foveally respectively.
Now it had been shown in Ref. 1 that, for foveal single glimpse viewing of largeobjects, f(n) in equation (i) may be represented by
f(n) = 1/[√n(n-1)] ≈ n -1.5 (iii)
Therefore for single glimpse viewing outside the fovea it was suggested that the modifiedform of equation (i) should read
f(C) = K1 n -1.5 (θ + 1) 0.92 + δ (iv)
Using the data set from Taylor appropriate to a 15 minute of arc diameter stimulus, aset of pairs of values were computed for f(C) and [n -1.5 (θ + 1) 0.92 ]. These were thenplotted against one another.
If the modelling was to hold, then the result should be a straight line, the slope being K1and intercept being δ. This was indeed found to be the case.
Armed with the values K1 and δ for the 15 minute of arc diameter stimulus, an attemptwas made to predict the entire body of Taylor's data using these same values, small sizecorrections being applied as described in Ref. 1 for the three smallest targets. The resultshave been published previously (Ref. 9) and were considered a good fit. How far beyondthe 13 to 14 degrees from the fovea covered by Taylor's data it is possible to extrapolatethis same simple modelling remains to be determined from more recent work by Taylor

which is just becoming available or from Sloan's projection perimetry studies (Ref. 10).However, the region beyond 15° away from the fovea is a relatively unimportant region formodelling of photopic thresholds.
3. MODELLING OF THRESHOLDS FOR SMALL STIMULI.
In Ref. 1 the modelling was limited in mathematical terms to 'extended' objects (objectswith dimensions large compared with the spread function of the refraction optics of thehuman eye), small size corrections being determined by a graphical approximation. Toput this on a sounder basis a functional relationship has been derived which can take usfrom the edge slope of the extended object to the maximum slope of the collapsed spreadfunction associated with essentially point objects. At the same time a second functionalrelationship has been determined which can take us from the normal function of n forextended objects to a function of a limiting number of receptors n0 associated with thepoint spread function due to the refraction optics of the eye and estimated involuntary eyemovements (from Ref. 11). This allows us, at least for circular or low aspect ratio objects(aspect ratios less than about 7 : 1 - Ref. 12), to provide a universal formula in terms of thediameter of an equivalent' circle (that is, a circle having equal perimeter to the object inquestion).This work has been reported in Ref. 13 and results in a modified and more general formulafor foveal viewing: -
f(B) = K1 [4.5(d2+4) 0.5] -1.5 + δ (v)
where f(B) = loge[{(K2 + K3)B + 1}/{K3B + 1}], K2 & K3 being as described in Ref. 1., B = 0.36d2C/(0.13d4 + 1)0.5 (vi)
and d is the diameter of the equivalent circle in minutes of arc.
For 'point' sources (d < 0.6minutes of arc) B→ 0.362Cwhilst the right hand sideof equation (v) tends to aconstant value. We thushave Ricco's Law of area xcontrast is constant. Forobject diameters between0.6 and about 2.5 minutesof arc, where Ricco's Lawappears to hold fromBlackwell's Tiffany Data(Ref. 14), the 'straight line'appears to beapproximated by thecombination of the twofunctions f(C) and f(n).
Fig. 1. Predictions of Complete Contrast Threshold Curves ofBlackwell for Infinite Viewing Time.
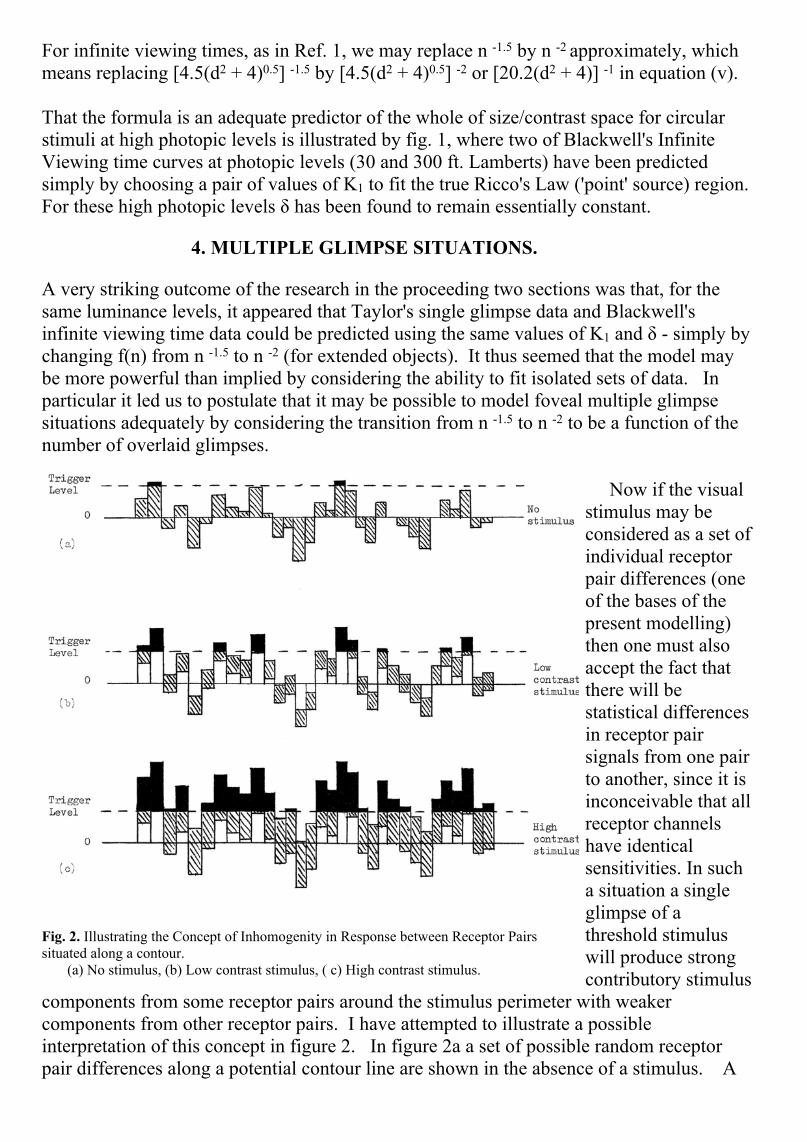
For infinite viewing times, as in Ref. 1, we may replace n -1.5 by n -2 approximately, whichmeans replacing [4.5(d2 + 4)0.5] -1.5 by [4.5(d2 + 4)0.5] -2 or [20.2(d2 + 4)] -1 in equation (v).
That the formula is an adequate predictor of the whole of size/contrast space for circularstimuli at high photopic levels is illustrated by fig. 1, where two of Blackwell's InfiniteViewing time curves at photopic levels (30 and 300 ft. Lamberts) have been predictedsimply by choosing a pair of values of K1 to fit the true Ricco's Law ('point' source) region.For these high photopic levels δ has been found to remain essentially constant.
4. MULTIPLE GLIMPSE SITUATIONS.
A very striking outcome of the research in the proceeding two sections was that, for thesame luminance levels, it appeared that Taylor's single glimpse data and Blackwell'sinfinite viewing time data could be predicted using the same values of K1 and δ - simply bychanging f(n) from n -1.5 to n -2 (for extended objects). It thus seemed that the model maybe more powerful than implied by considering the ability to fit isolated sets of data. Inparticular it led us to postulate that it may be possible to model foveal multiple glimpsesituations adequately by considering the transition from n -1.5 to n -2 to be a function of thenumber of overlaid glimpses.
Now if the visualstimulus may beconsidered as a set ofindividual receptorpair differences (oneof the bases of thepresent modelling)then one must alsoaccept the fact thatthere will bestatistical differencesin receptor pairsignals from one pairto another, since it isinconceivable that allreceptor channelshave identicalsensitivities. In sucha situation a singleglimpse of athreshold stimuluswill produce strongcontributory stimulus
components from some receptor pairs around the stimulus perimeter with weakercomponents from other receptor pairs. I have attempted to illustrate a possibleinterpretation of this concept in figure 2. In figure 2a a set of possible random receptorpair differences along a potential contour line are shown in the absence of a stimulus. A
Fig. 2. Illustrating the Concept of Inhomogenity in Response between Receptor Pairssituated along a contour. (a) No stimulus, (b) Low contrast stimulus, ( c) High contrast stimulus.

'trigger level' is shown as being the strength of local difference signal for which presence ofa possible stimulus component is 'detected'. When a stimulus is presented with itscontour along this line of receptor pairs the result is as in figure 2b.or 2c. Only thosecomponents which bring the local receptor pair difference above the trigger level are'detected'. If now we have another glimpse, then the stimulus contour will normally fallon a different set of receptor pairs, with consequent different random interaction ofindividual noise components with parts of the signal. Thus, if the stimulus is near to, butbelow, its single glimpse threshold level, each glimpse will provide a different partialimage of the stimulus. By summation over several glimpses, with the aid of short termmemory, the complete stimulus may be filled in from the sets of partial data. This conceptis illustrated in figure 3. Here a set of 5 single glimpse partial profiles of a 10 minute of arcsquare target have been computed for a single glimpse probability such that 1 in 5 potentialstimulus components is above the 'trigger level' on any glimpse. It will be seen howincomplete and different the 5 partial images are put together it will be seen that the finalresult is an almost complete stimulus profile. The efficiency and rate of 'filling-in' of datawith multiple overlaid glimpses in this suggested manner is obviously dependant on theprobability level for each glimpse.
Mathematically,since each component setmay be considered to bestatistically independent,the cumulative probabilityafter m glimpses (фm) is∑m (Ref. 15). But theprobability of detectingon the ith glimpse isdependant on thecumulative probability ofdetecting up to andincluding the (i - 1)th
glimpse. Hence
фm = p1 + p2(1 - ф1) + p3(1 - ф2) + ….. + pm(1 - ф(m-1) ),
which can be shown to be equivalent to
фm = 1 - (1 - p1)(1 - p2)(1 - p3 ) …... (1 - pm)
= 1 - ∏m (1 — pi).
Thus Qm = q1.q2.q3……qm (vii)
Where Qm = (1 - m) & qi = (1 - pi).
Fig. 3. Illustrating the Accumulation of Intelligence by Overlaying of RandomNoise Signal Patterns with Multiple Glimpses.
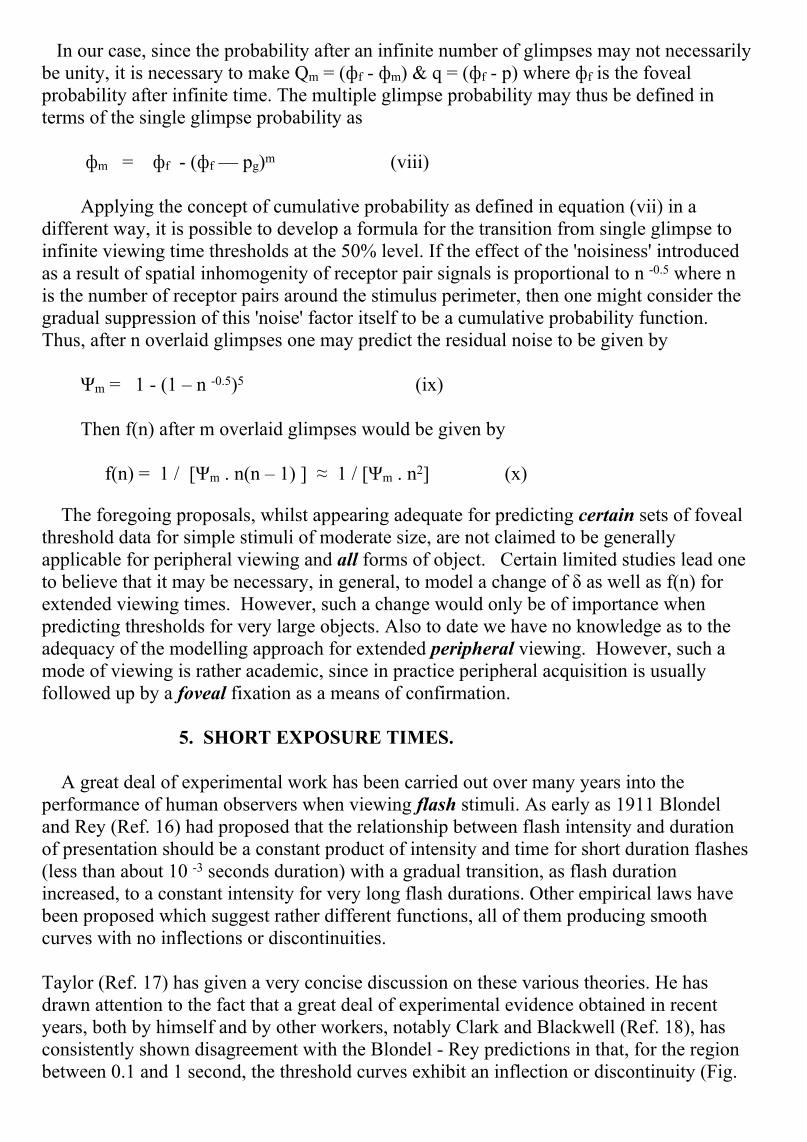
In our case, since the probability after an infinite number of glimpses may not necessarilybe unity, it is necessary to make Qm = (фf - фm) & q = (фf - p) where фf is the fovealprobability after infinite time. The multiple glimpse probability may thus be defined interms of the single glimpse probability as
фm = фf - (фf — pg)m (viii)
Applying the concept of cumulative probability as defined in equation (vii) in adifferent way, it is possible to develop a formula for the transition from single glimpse toinfinite viewing time thresholds at the 50% level. If the effect of the 'noisiness' introducedas a result of spatial inhomogenity of receptor pair signals is proportional to n -0.5 where nis the number of receptor pairs around the stimulus perimeter, then one might consider thegradual suppression of this 'noise' factor itself to be a cumulative probability function.Thus, after n overlaid glimpses one may predict the residual noise to be given by
Ψm = 1 - (1 – n -0.5)5 (ix)
Then f(n) after m overlaid glimpses would be given by
f(n) = 1 / [Ψm . n(n – 1) ] ≈ 1 / [Ψm . n2] (x)
The foregoing proposals, whilst appearing adequate for predicting certain sets of fovealthreshold data for simple stimuli of moderate size, are not claimed to be generallyapplicable for peripheral viewing and all forms of object. Certain limited studies lead oneto believe that it may be necessary, in general, to model a change of δ as well as f(n) forextended viewing times. However, such a change would only be of importance whenpredicting thresholds for very large objects. Also to date we have no knowledge as to theadequacy of the modelling approach for extended peripheral viewing. However, such amode of viewing is rather academic, since in practice peripheral acquisition is usuallyfollowed up by a foveal fixation as a means of confirmation.
5. SHORT EXPOSURE TIMES.
A great deal of experimental work has been carried out over many years into theperformance of human observers when viewing flash stimuli. As early as 1911 Blondeland Rey (Ref. 16) had proposed that the relationship between flash intensity and durationof presentation should be a constant product of intensity and time for short duration flashes(less than about 10 -3 seconds duration) with a gradual transition, as flash durationincreased, to a constant intensity for very long flash durations. Other empirical laws havebeen proposed which suggest rather different functions, all of them producing smoothcurves with no inflections or discontinuities.
Taylor (Ref. 17) has given a very concise discussion on these various theories. He hasdrawn attention to the fact that a great deal of experimental evidence obtained in recentyears, both by himself and by other workers, notably Clark and Blackwell (Ref. 18), hasconsistently shown disagreement with the Blondel - Rey predictions in that, for the regionbetween 0.1 and 1 second, the threshold curves exhibit an inflection or discontinuity (Fig.

4). The visual modelling being discussed in the present paper may be used to predict thisapparently anomalous behaviour and to generate the form of the entire threshold curvesfrom very short pulse durations to effectively infinite viewing times.
In order to do this let us considerthat, under conditions of steadyillumination, the build up of energyon a given receptor chain is acharge equation of the form
ΔBt = ΔB (1 - e-t/τ) (xi)
where ΔB is the difference inillumination of the receptorconsidered to that existingpreviously, ΔBt is the resulting apparent
illuminance difference after time t (measured from the start of the glimpse or exposure), and τ is the 'charge' time constant for the particular receptor network. (Note that τ isnot the physical time constant of a receptor, which may be very short).
In considering difference signals between pairs of receptors, a similar function may beconsidered to exist if now ΔB and ΔBt refer to the true and apparent instantaneousilluminance differences between the pair of receptors considered.
If then the exposure is terminated in less than one glimpse time the effective illuminancedifference recorded will be ΔBt. But for simple backgrounds, foveal viewing & simple,sharp extended objects we have
ΔB/BB = log [((K2 + K3) C + 1)/(K3 C + 1)] ≈ K2 C (xii)
where C is the psychometric contrast, BB is the background brightness, ΔB is the difference in illuminance between the pair of receptors straddling the regionof maximum slope in the retinal image, and K2 is a slope constant as defined in reference 1.
Then, if Ct is the apparent contrast observed after a viewing time t,
Ct/C = (1 – e –t/τ) (xiii)
Now under specific conditions of background luminance and stimulus size the apparentthreshold contrast Ct would be expected to remain constant regardless of pulse length.Therefore we would expect C to be proportional to 1/[1 – e -t/τ]. Work carried out recentlyby Lavin (Ref. 19) has suggested that for absolute fitting of some data obtained byBlackwell and McCready (Ref. 20) a value of τ of the order of 0.05 to 0.2 seconds is
Fig. 4. Typical Threshold Curve for Single Pulses (after Taylor (1972)).

required. This is already broadly in keeping with the value suggested by Schade (Ref. 21)and the experimental work of L. Ronchi (Ref. 22). Using a value of τ of 0.1 seconds andvalues of K1 and δ appropriate to Blackwell's infinite viewing time thresholds, a typicalthreshold curve for log ΔB against log t has been computed for a circular stimulus of 18minutes of arc and a background luminance of 10 ft. Lamberts. This is shown in Fig. 5,where it will be seen that the value of ΔB is tending to constancy for exposures longer thanabout 1 second, having reached a value quite close to the asymptote in 1/3 second.
If we now refer to the last sectionwe must expect that, on average,after 1/3 second a saccade occursand a new accumulation of chargecommences. We are now enteringthe multiple glimpse regime whereequation (x) should be expected tohold. This will result in adiscontinuity in the threshold curveas also shown in Fig. 5, thethreshold gradually falling to a newand lower asymptote which isreached after some 10 or 15 secs.The complete curve should be
compared for general shape with the previous figure and with experimental curvespresented in Refs. 17 & 18, where a very strong similarity will be seen. Three furtherpoints considered worthy of note are:-
(i) That the average glimpse time of 1/3 second very neatly tallies with the approach tobest single glimpse performance. In terms of this modelling an increase of glimpse durationto much greater than this would be uneconomical in terms of data inputting to the visualsystem, (ii) That the threshold curve predicted in Fig. 5 agrees well with the absolute values inthe Blackwell and McCready data, (iii) That the time taken to reach approximately the final multiple glimpse asymptote isin very close agreement with the figure determined by B1ackwell (Ref. 14) as beingnecessary for establishing infinite viewing time thresholds for fixated foveal viewing.
(ii) and (iii) both provide further support for the hypothesis that multiple glimpsesituations should be predictable from single glimpse data by allowing for gradualsuppression of spatial noise due to retinal inhomogeneities.
6. MODELLING OF SCENE LUMINANCE.
To this point all physically based modelling described by us in this and previous papershas been concerned with fixed high scene luminance. Although it has been acknowledgedthat K1 must be dependant on scene luminance and δ may be, no attempt has been made tomodel the effect of scene luminance other than by selection of suitable constants. Let us
Fig. 5. Predictions of Threshold for Temporally Limited Presentationof an 18 minute of arc Disc Stimulus at 10 ft. L.

now consider the form of luminance functions which constants K1 and δ might have. Thefirst point that we must note here is that the significant physical parameter is not the sceneluminance itself but the retinal illuminance produced. In a 'steady' state of adaptation tolight level there will be a relationship between scene luminance and retinal illuminancecontrolled by the prevailing eye pupil diameter. The relationship is itself a function ofscene luminance since the pupil diameter opens progressively as scene luminancedecreases (Ref. 23). In our modelling, for convenience, we have chosen to take the retinalilluminances for various scene luminances to be those quoted by Kornfeld and Lawson(Ref. 2).
Now when the light is good the 'gain' of the visual system may be considered to be at aminimum with the result that, as with analogous electronic systems, the temporal signal tonoise ratio is good and temporal system noise may be considered insignificant (that is, theonly noise present is due to the spatial inhomogeneities in sensitivity discussed in section4). As the light level falls, the 'gain' has to be increased (adaptation) and the temporalnoise in the neural networks will eventually become important. This will cause the totalnoise component, even for very large stimuli, to become important, with a resultantexpectancy of an increase in δ . Similarly at high light levels the quantum noise from agiven part of a stimulus is insignificant, whereas as light level falls this noise becomesmore significant. As the gain of the visual system is increased to compensate for the lowerluminance the quantum noise is also amplified, resulting in a requirement for a highervalue of K1. Now we may consider random noise as a N -0.5 function (as in para. 7 of Ref.1), where N is the rate of transmission of bits of signal information by random processes.If we consider all sources of temporal noise associated with viewing of simple stimuliagainst a plain background to be proportional to retinal illuminance, then we may considerK1 and δ each to consist of two components, one constant term for high luminance and lowgain and one luminance dependant term inversely proportional to the square root of retinalilluminance. Strictly speaking we should also take account of such things as changes in theeye's spread function as a function of pupil diameter (which will affect K2) but it has beenfound, both in theory (Ref. 1) and in practice (Ref. 24), that visual performance issurprisingly insensitive to pupil diameter except with a very fully open pupil. It was thusconsidered permissible, as a first approximation, to assume the quality of the refractionoptics constant. It is then possible to attempt modelling of Blackwell’s Infinite ViewingTime data for cone vision (that is down to about 10 -3 ft. Lamberts) in its entirety usingsimple functions of K1 and δ given as
K1 = KB x BR-0.5 + Ko (xiv) and δ = δB x BR-0.5 + δ0 (xv)
Since, at the smallest stimulus size used by Blackwell (0.592 minutes of arc), the valueof δ is always negligible compared with K1.f(n) (equation (i)), the adequacy of anassumption that K1 may be given by equation (xiv) may be checked by plotting values off(C) obtained from Blackwell’s results against BR-0.5. If equation (xiv) is valid thisshould yield a straight line of slope KB and intercept Ko. Computed values are to befound in Table 1. The fit is found to be a good straight line except for thelowest brightness (10 -3 ft. L.).

That the fithere is poor maybe mainly due totwo factors.Firstly this is theone computedcondition wherethe qualityfunction of therefraction optics issuspected to befar from constant(i.e. very large
pupil diameters). Secondly the contrast involved is so high (150) that the localilluminance difference being studied is at a much higher mean level than the background.This means that the signal/noise situation should strictly be modified from that defined byequation (xiv) and also that there may be distortions of signal due to saturation effects (seesection 12). Ignoring the point associated with 10-3 ft. L., the tabulated data yields valuesof KB = 15.4 and Ko = 0.48. Using these values of KB and Ko it is then possible to studythe largest size used by Blackwell (360 minutes) and derive values of [f(C) - K1.f(n)]. Todo this, for a target of such a size, the function of nθ for peripheral viewing (section 2) mustbe brought in. Values of (f(C) - K1.f(n)] computed from B1ackwell's data are given inTable 2. If these are plotted against BR-0.5 a straight line relationship should exist withslope δB and intercept δo if equation (xv) holds. Once again there is a good straight line fitexcept for the lowest scene luminance (10-3 ft. L.). From this, values of δB = 1.25 x 10⁻³and δ0 = 4.0 x 10⁻⁴ were obtained.
Using the values ofKB, Ko, δB and δ0obtained from Tables1 and 2, with f(n) =n-2 for infiniteviewing and applyingequation (ii) incomputing f(n) for thelarger target sizes, thewhole of the body ofdata presented byBlackwell for Infinite
Viewing Time was predicted - that is, each size and luminance was taken and a 50%probability threshold contrast was computed. The results are plotted in Fig. 6, togetherwith Blackwell's own interpolated results (Fig. 16 in Ref. 14). It is considered that thebody of predicted data on the whole is a good fit to Blackwell's interpolated results. Arigorous study of Blackwell’s own paper - where his Fig. 16 is plotted from interpolationsfrom his Fig. 15 (which itself is an attempt at best curve fitting from available data) -shows that some of the more marked discrepancies between our predictions and
Table 1.
Table 2.

Blackwell's own interpolationsare in regions where noexperimental data exists tocheck exact points. Bearing thisin mind, together with ourassumptions of constancy ofquality of the refraction optics,there seems no reason tosuppose that the simplehypothesis proposed is otherthan adequate as a descriptor.
7. DEGRADED STIMULI.
One of the main reasons for originally proposing the vision model being studied in thispaper was a growing awareness at B.A.C. of the inadequacy of modelling based on areaconcepts for the prediction of thresholds for degraded stimuli. That blurring of stimuli (as,for instance, by defocusing) and softening of edges has the effect of degrading thresholdperformance has been amply demonstrated, as for example by Ogle (Ref. 25) andMiddleton (Ref. 26). That information presented to the eye in real life is often other thanperfect is also amply evident. Photographic and TV. images are rarely viewed from such arange that they may be said to be perfectly sharp. When viewing through optical aids thereare usually aberrations causing a degradation of quality before the image forming lightreaches the eye.
It is also of some significance that some of the image quality measures used currentlyare very specifically related to edge quality. Modulation Transfer Function (M.T.F.) of anoptical system is, by definition, the Fourier Transform of the line spread function, whichitself is the differential of the edge profile of the image of an extended object (Ref. 27)!For most forms of spread function the area under the M.T.F. curve is, if one followsthrough the mathematics, the peak value of the unnormalised spread function, which itselfdefines the maximum slope of the image edge profile (see for instance Ref. 28). Thephotographic quality measure ‘acutance' is also a measure of the region of maximum slopeof the image profile and hence very closely related to the area under the M.T.F. curve.Experimental work has been reported by a number of people which compares thesubjective impressions of quality of scenes with M.T.F. area and acutance. In all casescorrelation was high. In particular Higgins (Ref. 29) took the product of the M.T.F. ofvarious photographs and that of the refraction optics of the eye. He then comparedsubjective quality with the square of the area under the resulting M.T.F. curve (which is a
Fig. 6. Predictions of the Entire Body of B1ackwell's Data forPhotopic Luminance Levels and Infinite Viewing Times.
measure of the unnormalised peak value of the retinal point spread function and hence adirect measure of retinal image quality). He found the correlation to be very high indeed.
With the above in mind it should be immediately apparent that the vision modelpresented in this paper should be admirably suited to modelling of any situation wheredegradation through to the retina can be defined. A discussion of the implications ofretinal image quality on threshold performance is given in Refs. 13 and 28. It isconcluded that all that should be necessary in order to predict thresholds of degradedstimuli is to operate on the slope constant K2 by a factor AT(x)M/Ae(x)M where AT(x)M is ameasure of the maximum illuminance gradient in the retinal image of the unsharp objectpresented to the eye and Ae(x)M is a measure of the maximum illuminance for a 'sharp'object of the same size. The determination of these gradient factors involves convolutionsof object profiles with the point spread function of the refraction optics of the eye.
Until recently, although attempts to check such modelling had been made, they hadbeen largely thwarted by non-availability of suitable controlled experimental results. InRef. 1 the modelling of two spot points of gross defocus in Og1e's data was cited. Whenattempts were made to study the rest of Ogle's data it was realised that the mode ofpresentation used by Ogle - that of presenting a defocused aerial image with an eye pupil ofsome 6 mm diameter - resulted in most conditions being such that the image was formedfrom complex near focus interference patterns where, without knowledge of the wavefrontaberrations of the eye as studied, it was impossible to define adequately the retinal imageprofiles. Thus studies of the predictive capabilities of our model for Og1e's work remainlimited to the cases previously cited.
To further the studies on thresholds of blurred images, experimental work wasundertaken by B.A.C. where controlled amounts of blur were produced in the imaging ofsimple stimuli on a high quality back-projection screen (Ref. 30). It had been hoped torelate the thresholds for sharp images back to Blackwell's results and to predict thedegradations due to controlled blurring. In the event, due to experimental artefacts, thebasic experimental thresholds were grossly degraded from Blackwell's and all that could beshown was that the degradation of thresholds from a moderate blur condition to a moresevere one was, on the whole, as predicted.
Similarly studies on viewing through optical aids with degradation purposely introducedhave produced confusing answers (Ref. 31). This time it was believed that the confusingresults were due to complex wavefront aberration interactions between the optical aid andthe eye.
Middleton's blurred border experiment (Ref. 26) at first sight might appear to offer asource of useful data for modelling, but a detailed inspection showed it also to be doubtfulon two counts. Firstly there are two threshold curves - widely separated - labelled'increasing border width' and 'decreasing border width', making it difficult to decide whatone should be modelling. Secondly, by Middleton's own admission "exception could betaken to some aspects of it (the experiment) from a psychophysical standpoint".
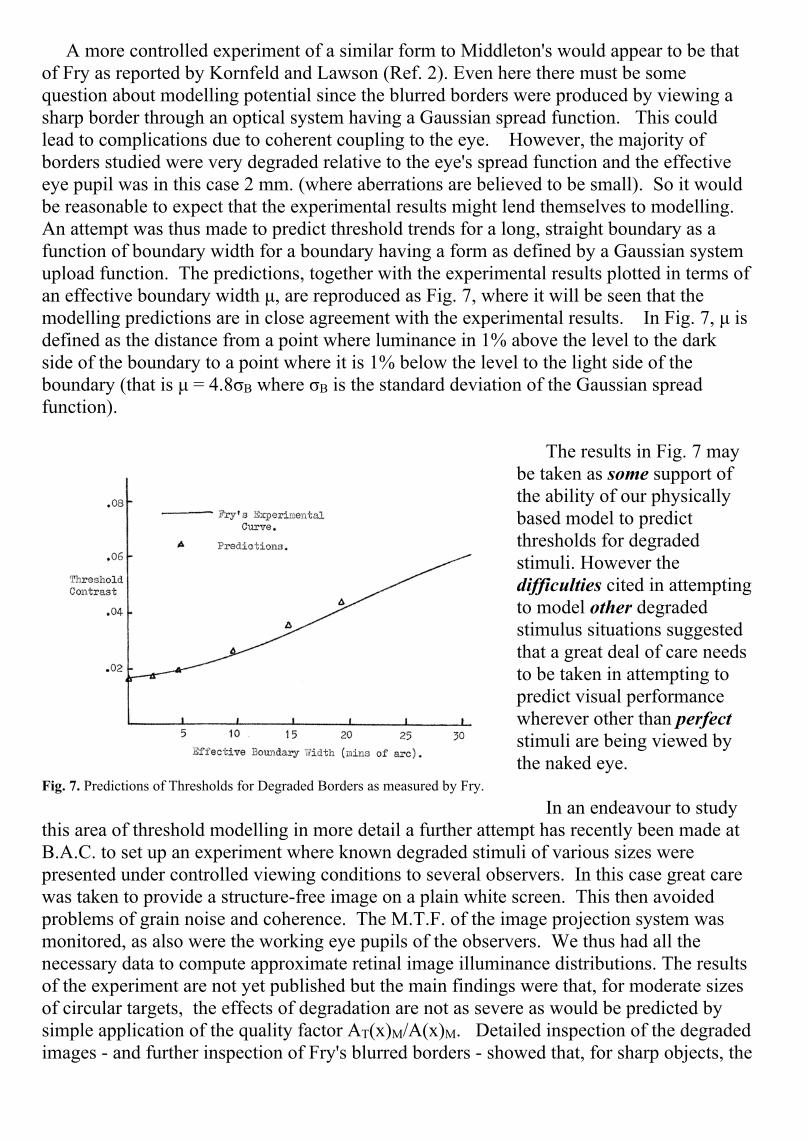
A more controlled experiment of a similar form to Middleton's would appear to be thatof Fry as reported by Kornfeld and Lawson (Ref. 2). Even here there must be somequestion about modelling potential since the blurred borders were produced by viewing asharp border through an optical system having a Gaussian spread function. This couldlead to complications due to coherent coupling to the eye. However, the majority ofborders studied were very degraded relative to the eye's spread function and the effectiveeye pupil was in this case 2 mm. (where aberrations are believed to be small). So it wouldbe reasonable to expect that the experimental results might lend themselves to modelling.An attempt was thus made to predict threshold trends for a long, straight boundary as afunction of boundary width for a boundary having a form as defined by a Gaussian systemupload function. The predictions, together with the experimental results plotted in terms ofan effective boundary width μ, are reproduced as Fig. 7, where it will be seen that themodelling predictions are in close agreement with the experimental results. In Fig. 7, μ isdefined as the distance from a point where luminance in 1% above the level to the darkside of the boundary to a point where it is 1% below the level to the light side of theboundary (that is μ = 4.8σB where σB is the standard deviation of the Gaussian spreadfunction).
The results in Fig. 7 maybe taken as some support ofthe ability of our physicallybased model to predictthresholds for degradedstimuli. However thedifficulties cited in attemptingto model other degradedstimulus situations suggestedthat a great deal of care needsto be taken in attempting topredict visual performancewherever other than perfectstimuli are being viewed bythe naked eye.
In an endeavour to studythis area of threshold modelling in more detail a further attempt has recently been made atB.A.C. to set up an experiment where known degraded stimuli of various sizes werepresented under controlled viewing conditions to several observers. In this case great carewas taken to provide a structure-free image on a plain white screen. This then avoidedproblems of grain noise and coherence. The M.T.F. of the image projection system wasmonitored, as also were the working eye pupils of the observers. We thus had all thenecessary data to compute approximate retinal image illuminance distributions. The resultsof the experiment are not yet published but the main findings were that, for moderate sizesof circular targets, the effects of degradation are not as severe as would be predicted bysimple application of the quality factor AT(x)M/A(x)M. Detailed inspection of the degradedimages - and further inspection of Fry's blurred borders - showed that, for sharp objects, the
Fig. 7. Predictions of Thresholds for Degraded Borders as measured by Fry.

region of maximum illuminance gradient on the retina extends for no more than about 1minute of arc. However, with typical blurred objects this region of maximum illuminancegradient extends for some two or more minutes of arc. This finding has caused us to re-examine our model recently, since it is illogical that, if two or more receptor pairdifferences across a border are equal, only one contributes to the stimulus. Reassessingthe model in this way we are forced to the conclusion that f(n) in equation (i) should, forblurred objects, include the approximate number of rows of receptor pairs receivingapproximately equal stimuli. How then, do we account for the fact that the simple modelpredicts Fry's results? The answer would appear to lie in the fact that, for very largestimuli (such as Fry's long border), n is already so large when considering one row ofreceptor pairs that the foveal threshold is defined almost entirely by δ. Under suchcircumstances any increase in assumed value of n will have no significant effect onthreshold. However, for smaller stimuli, where K1.f(n) is still significant compared to δ,increasing n will have a marked effect.
Looking at the results of the recent experiments in the light of the foregoing, it wouldappear that a modification of f(n), together with accurate calculation of AT(x)M/A0(x)M,provides good predictions of thresholds of a whole range of circular targets and certaindiamond shaped targets under controlled blur conditions.
8. COMPLEX STIMULI.
Whilst modelling of thresholds of detection of objects having simple profiles is anessential starting point in attempting modelling of the complete visual system, it is farremoved from the every day viewing situation. In the real world not only are we oftenpresented with degraded stimuli (as discussed in the last section) but also we are usuallyviewing objects of complex shapes and complex luminance structures. They are also oftenviewed against a background which itself is highly structured. Additionally the task moreoften to be carried out, rather than being one of simple detection of the presence of anindefinable object (our definition of detection), is likely to be one of recognition (that theobject is of a particular type). The next two sections of this paper explore some of theimplications of these complex factors on modelling.
To date we believe we have made considerable progress towards the modelling ofdetection of complex shapes and to the handling of certain of the more simple luminancestructures of objects of interest. We have not, to date, studied modelling implications ofsignificantly structured backgrounds. These studies on complex stimuli are very timeconsuming and hence the evidence presented is acknowledged to be by no meansexhaustive.
8.1. Determination of the Retinal Image.
We consider that an essential facility in studying the visual performance for viewingcomplex stimuli is an ability to visualize and quantify the retinal image. For simpleobjects it has been easy to imagine the form of the retinal image — a disc with a softened

contour for a large disc stimulus, a modified point spread function for a small discstimulus, a modified line spread function for a long, thin rectangular bar, etc.. It is notimmediately obvious, however, just what the retinal image of an object with complexshape or complex luminance distribution looks like at the retina.
In order to further our studies we developed a form of spatial filtering equipmentwhich would allow either direct visualisation or photographic recording of an enlargedreplica of the retinal image. This provided us with two methods of subjective appraisal ofthe appearance of the retinal images of complex stimuli. At the same time we prepared atwo dimensional convolution program so that we could study the retinal imageilluminance profiles objectively. Much of the work described in the rest of sections 8 and9 relies on these two instrumentation methods for interpretation.
8.2. Annular and Disc Stimuli.
In Ref. 9 a comparison between detectionthresholds for certain disc stimuli and annularstimuli of equal external diameter wasreported. The stimuli concerned werepositive contrast discs of diameters 10, 20 & 30min. of arc and positive contrast annuli withthe same outside diameters and a ratio of 3 : 1between outer & inner diameters (see Fig. 8).It was shown (Fig. 9) that the thresholdcontrast for the largest disc stimulus was higherthan that of the largest annulus - subjectively in
keeping with the theory that the length of contour controlled the detection threshold. Butfor progressively smaller stimuli the threshold forthe annulus degraded much more rapidly thanthat of the disc.
In order to try to explain this strong sizeinteraction, the retinal image profiles for the twotypes of stimuli have subsequently beencomputed by 2-dimensional convolution. Theresulting cross sections (Fig. 10) show twothings. Firstly the slope of the inner contour ofthe 20 minute of arc annulus is attenuated bybetween 10 and 15 percent whilst the outercontour is virtually the same slope as that of thedisc. The resulting thresholds were notsignificantly different — suggesting that the innercontour might not be contributing to thethreshold. Secondly the 10 minute of arc annulushad both contours degraded compared to that of the
Fig. 8. Forms of Stimuli used by B.A.C. for Comparisonof Thresholds for Thresholds for Detection of VariousElements of the Multi-contrast Stimuli.
Fig. 9. Thresholds for Annular and Disc Stimuli.

disc, the inner some 25% more than the outer. In this case the outer itself was degraded bysome 20%. This gave rise to roughly the amount of degradation of threshold for the 10minute of are annulus compared to the 10 minute of arc disc which would be expectedfrom the theory, assuming again that the outer (or steeper) contour alone constituted thestimulus.
The important point which seemedto emerge from the foregoing was thatnot only is it permissible to ignore allbut the steepest part of the edgegradient across a contour (as theoriginal hypothesis suggested) butalso that small reductions in steepnessaround the available contour mightmean that there is a need to adjust theactive contour length for detection byignoring the softer regions. This, iftrue, would be a major step towardsgeneral handling of complex objects.
8.3. Asymmetric Blur.
To this point all our discussions onmodelling of the visual process havecentred on a constant probability ofdetection. It should not matter, for
symmetrical stimuli, whether we are considering the contrast for 50% probability ofdetection, 90% probability or any other probability, because it has been claimed byBlackwell (Ref. 14) and several others that the frequency of seeing curve (on a contrastbase) is remarkably independent of size, field luminance, etc..
However, what if the stimuli are asymmetric? In the last section it was shown how itappeared that, for annular targets, the softer parts of a total contour were suppressed.Unfortunately the data obtained from that experiment were not analysed in terms offrequency of seeing curves and in any case any comparisons would have been difficult dueto size and shape differences.
It so happened that another experiment, originally planned to attempt a study of theimportance of the shoulder and toe of the retinal image of the edge of an extended object,provided useful data owing to an artefact. It was discovered after the experiment that thematerial, which had been prepared by optical spatial filtering, had an asymmetric blurringof the contour. Thus instead of having pairs of stimuli with equivalent steepest gradientregions but different shoulder and toe sharpness, as had been intended, the edge gradientswere distorted in some cases (Ref. 32). Although no objective comparisons were made, itproved possible, for all three pairs of stimuli used in the experiment, to predict subjectivelywhich of the two had the lowest contrast threshold for 50% probability of detection and
Fig. 10. Retinal Image Illuminance Profiles for the Annular andDisc Stimuli.
which of the two had the steepest frequency of seeing curve as a function of contrast.These correct subjective predictions were made on the following assumptions:-
1. That the contrast for 50% probability of detection is a simple function of the meanvalue of the steepest part of the edge contour averaged around the stimulus. 2. That, when a stimulus is asymmetric in blur form, the frequency of seeing curve will besoftened owing to parts of the contour 'growing' out of noise progressively rather than all atonce.
The ability to predict successfully the nature of threshold performance againstasymmetrically blurred stimuli was taken as further evidence of the strong dependence ofvisual performance on the steepest part of the gradient of the illuminance profile on theretina and only this.
8.4. Multi-contrast Stimuli.
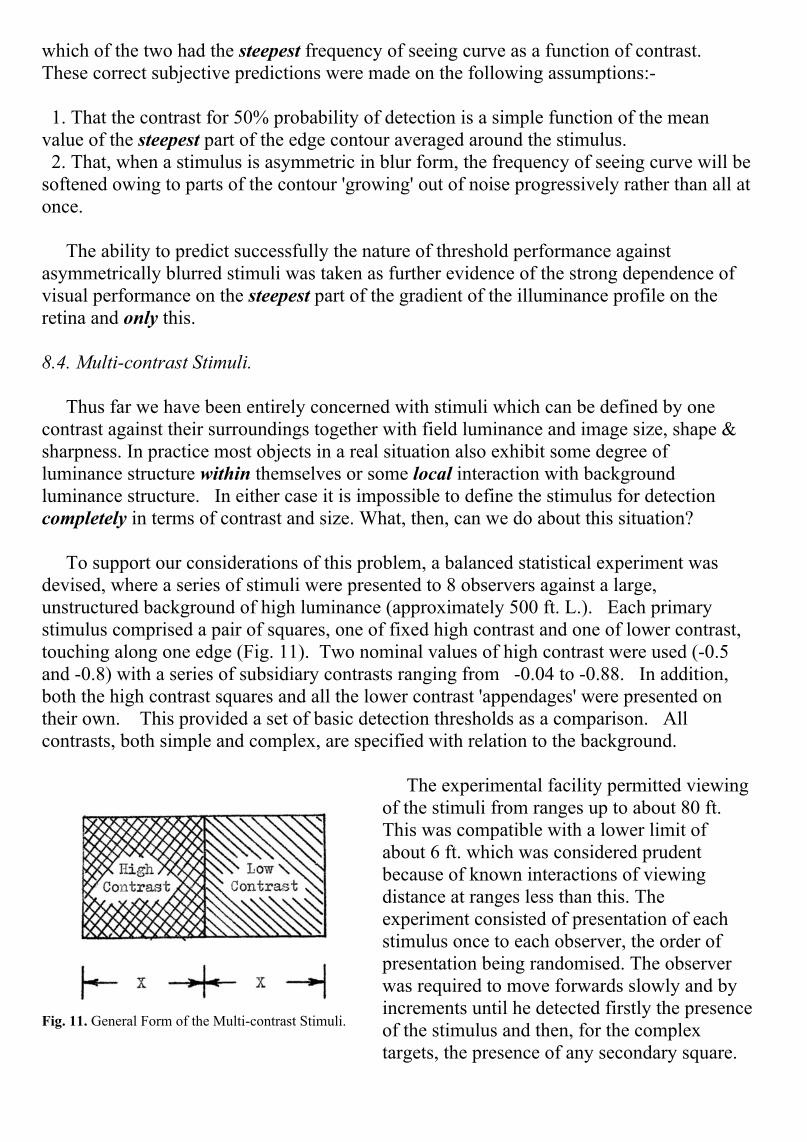
Thus far we have been entirely concerned with stimuli which can be defined by onecontrast against their surroundings together with field luminance and image size, shape &sharpness. In practice most objects in a real situation also exhibit some degree ofluminance structure within themselves or some local interaction with backgroundluminance structure. In either case it is impossible to define the stimulus for detectioncompletely in terms of contrast and size. What, then, can we do about this situation?
To support our considerations of this problem, a balanced statistical experiment wasdevised, where a series of stimuli were presented to 8 observers against a large,unstructured background of high luminance (approximately 500 ft. L.). Each primarystimulus comprised a pair of squares, one of fixed high contrast and one of lower contrast,touching along one edge (Fig. 11). Two nominal values of high contrast were used (-0.5and -0.8) with a series of subsidiary contrasts ranging from -0.04 to -0.88. In addition,both the high contrast squares and all the lower contrast 'appendages' were presented ontheir own. This provided a set of basic detection thresholds as a comparison. Allcontrasts, both simple and complex, are specified with relation to the background.
The experimental facility permitted viewingof the stimuli from ranges up to about 80 ft.This was compatible with a lower limit ofabout 6 ft. which was considered prudentbecause of known interactions of viewingdistance at ranges less than this. Theexperiment consisted of presentation of eachstimulus once to each observer, the order ofpresentation being randomised. The observerwas required to move forwards slowly and byincrements until he detected firstly the presenceof the stimulus and then, for the complextargets, the presence of any secondary square.
Fig. 11. General Form of the Multi-contrast Stimuli.

In all cases the observer knew roughly where the stimulus was, so that his task was one offoveal detection with no search. The complete body of data from the experiment thusprovided a series of comparative threshold points for a high contrast square with a varietyof appendages, a variety of simple squares of various contrasts and a variety of appendagesattached to a primary high contrast fixation object. This latter set of results are, strictly,recognition of a form - or, in other words, detection of detail.
The results of the experiment are to be found in Fig. 12, where it will be seen that theset of results for detection of isolated squares follows very closely a form of threshold asfound by Blackwell in Ref. 14 except for the lowest contrast. It is believed that this isconsistent with a situation where fixated foveal viewing was used, but the decisioncontrolling δ was one of free choice as opposed to Blackwell's forced choice. This wouldlead to a higher value of δ. Looking now at the results for the detection of the presence ofan appendage we see that the thresholds are all degraded very significantly, but follow asimilar trend, at least for the higher contrasts and small sizes. For the lowest contrasts,leading to larger sizes, there appears to be a break away but there are insufficient data in
this region to justify criticalstudy.
It was tentatively suggestedthat, at least for the highcontrast, small sizeappendages, the detection ofthe appendage mightapproximate to the detectionof a semicircle attached to acircle (i.e. a portion of a lowcontrast modified point spreadfunction attached to a highcontrast modified point spreadfunction). This would thenpredict a threshold displacedby a factor of 2 on a size axissince, for equal effectiveperimeters, the 'semicircle'would need to have a diametertwice that of the 'circle' relatedto the collapsed image profileof the square. As can be seenfrom Fig. 12, this is in closeagreement with the results.A two dimensional
convolution was carried out of a double square target with contrasts appropriate to thebasic size of side of square 1.5 minutes of arc (that is an appendage of contrast tobackground of 40% of that of the primary square) with the point spread function of thehuman eye (a form derived from Westheimer and Campbell's Line Spread Function as
Fig. 12. Thresholds for Detection of Various Elements of the Multi–contraststimuli.
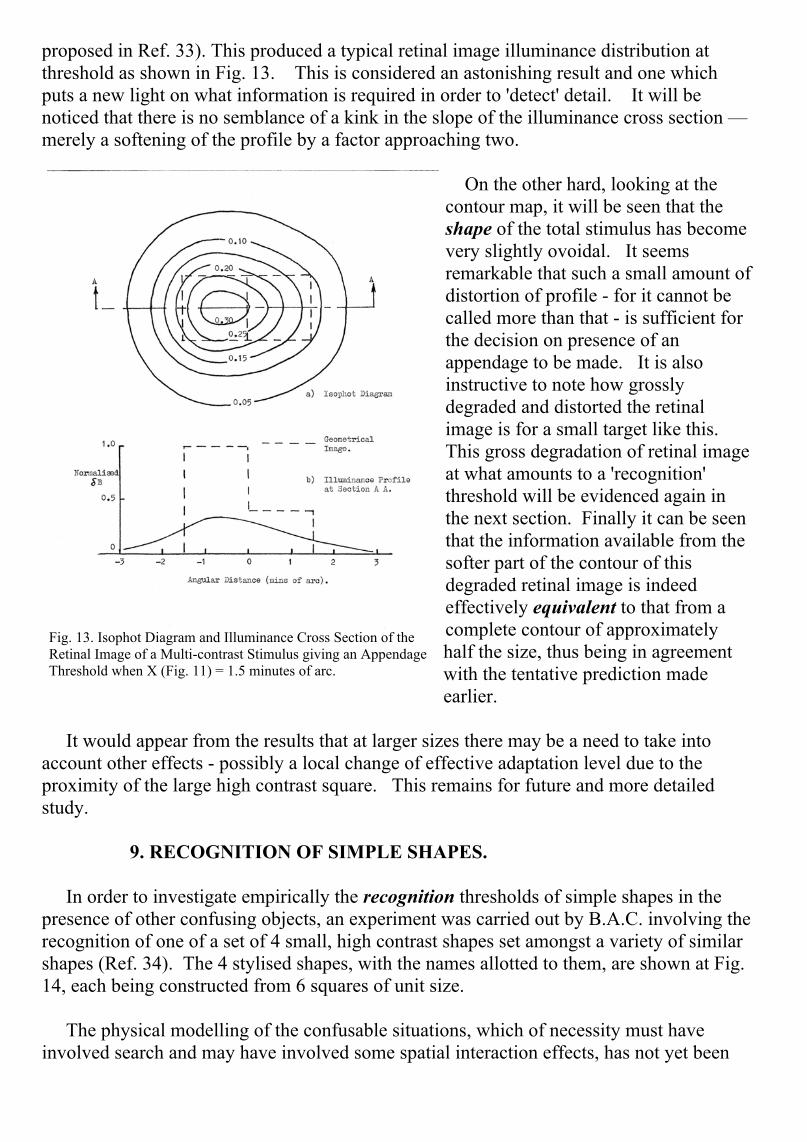
proposed in Ref. 33). This produced a typical retinal image illuminance distribution atthreshold as shown in Fig. 13. This is considered an astonishing result and one whichputs a new light on what information is required in order to 'detect' detail. It will benoticed that there is no semblance of a kink in the slope of the illuminance cross section —merely a softening of the profile by a factor approaching two.
On the other hard, looking at thecontour map, it will be seen that theshape of the total stimulus has becomevery slightly ovoidal. It seemsremarkable that such a small amount ofdistortion of profile - for it cannot becalled more than that - is sufficient forthe decision on presence of anappendage to be made. It is alsoinstructive to note how grosslydegraded and distorted the retinalimage is for a small target like this.This gross degradation of retinal imageat what amounts to a 'recognition'threshold will be evidenced again inthe next section. Finally it can be seenthat the information available from thesofter part of the contour of thisdegraded retinal image is indeedeffectively equivalent to that from acomplete contour of approximatelyhalf the size, thus being in agreementwith the tentative prediction madeearlier.
It would appear from the results that at larger sizes there may be a need to take intoaccount other effects - possibly a local change of effective adaptation level due to theproximity of the large high contrast square. This remains for future and more detailedstudy.
9. RECOGNITION OF SIMPLE SHAPES.
In order to investigate empirically the recognition thresholds of simple shapes in thepresence of other confusing objects, an experiment was carried out by B.A.C. involving therecognition of one of a set of 4 small, high contrast shapes set amongst a variety of similarshapes (Ref. 34). The 4 stylised shapes, with the names allotted to them, are shown at Fig.14, each being constructed from 6 squares of unit size.
The physical modelling of the confusable situations, which of necessity must haveinvolved search and may have involved some spatial interaction effects, has not yet been
Fig. 13. Isophot Diagram and Illuminance Cross Section of theRetinal Image of a Multi-contrast Stimulus giving an AppendageThreshold when X (Fig. 11) = 1.5 minutes of arc.

attempted. The initial experimentation, on the other hand, which involved theestablishment of recognition thresholds for the 4 shapes in isolation, provides a usefulstarting point for attempting to model 'definable' recognition. By definable here wemean a recognition situation where one can make intelligent guesses as to which parts ofthe object needed to be detected in order to make the 'recognition' decision. In otherwords, we believed we had here an opportunity to attempt modelling of recognition notsignificantly contaminated by indefinable 'experience' (i.e. information added to thephysical stimulus from the memory banks). Here were only 4 shapes and it was knownthat each object presented had to be one of the 4, all of which had been thoroughly studiedpreviously.
As a start the 4 objects, at scalesappropriate to their mean recognitionranges, were convolved with the eye'spoint spread function (again derived fromthe form of line spread function proposed
by Westheimer and Campbell). The retinalimages produced, as for the multi-contraststimulus, were again surprisingly modified fromthe input stimuli. The two ‘structured’ targets -the stylised 'church' and 'castle' - were reduced toshapes having barely any structure whilst the'block' became an ellipse. The isophot diagrams ofthe 'Church' and 'Castle' are shown in Fig. 15,where it can be seen how little structure is left.
Now for recognition of one of the 4 possibleshapes it was postulated that it might be necessaryto interrogate the upper portion of the contour forthe block, line and Castle, whilst for the Church itwould be the top left hand corner of the figurewhich must be studied. Thus it should be possibleto measure the mean slope of the contour in theregion of most interest and the 'interrogation'length. This could then be compared with thethreshold contour slope for detection of a simple circular stimulus having a circumference
Fig. 14. Four objects for the recognition experiment.
Fig. 15. Isophots of retinal images at meanrecognition range.
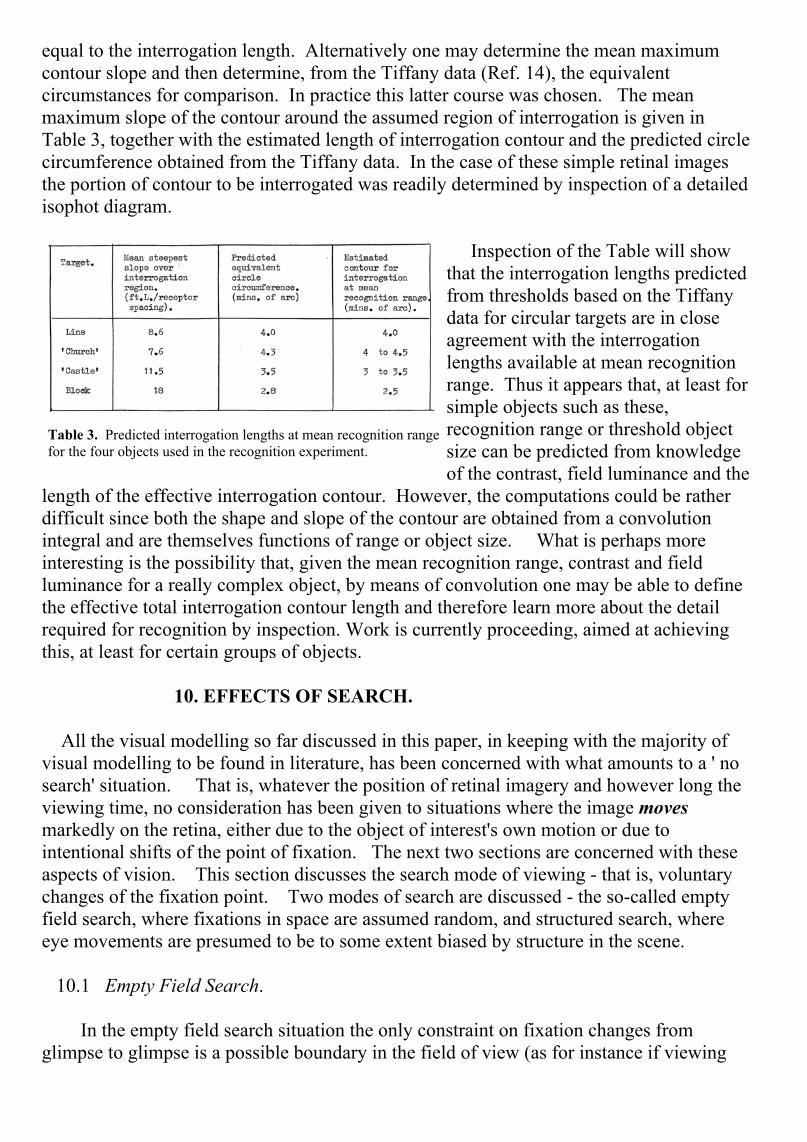
equal to the interrogation length. Alternatively one may determine the mean maximumcontour slope and then determine, from the Tiffany data (Ref. 14), the equivalentcircumstances for comparison. In practice this latter course was chosen. The meanmaximum slope of the contour around the assumed region of interrogation is given inTable 3, together with the estimated length of interrogation contour and the predicted circlecircumference obtained from the Tiffany data. In the case of these simple retinal imagesthe portion of contour to be interrogated was readily determined by inspection of a detailedisophot diagram.
Inspection of the Table will showthat the interrogation lengths predictedfrom thresholds based on the Tiffanydata for circular targets are in closeagreement with the interrogationlengths available at mean recognitionrange. Thus it appears that, at least forsimple objects such as these,recognition range or threshold objectsize can be predicted from knowledgeof the contrast, field luminance and the
length of the effective interrogation contour. However, the computations could be ratherdifficult since both the shape and slope of the contour are obtained from a convolutionintegral and are themselves functions of range or object size. What is perhaps moreinteresting is the possibility that, given the mean recognition range, contrast and fieldluminance for a really complex object, by means of convolution one may be able to definethe effective total interrogation contour length and therefore learn more about the detailrequired for recognition by inspection. Work is currently proceeding, aimed at achievingthis, at least for certain groups of objects.
10. EFFECTS OF SEARCH.
All the visual modelling so far discussed in this paper, in keeping with the majority ofvisual modelling to be found in literature, has been concerned with what amounts to a ' nosearch' situation. That is, whatever the position of retinal imagery and however long theviewing time, no consideration has been given to situations where the image movesmarkedly on the retina, either due to the object of interest's own motion or due tointentional shifts of the point of fixation. The next two sections are concerned with theseaspects of vision. This section discusses the search mode of viewing - that is, voluntarychanges of the fixation point. Two modes of search are discussed - the so-called emptyfield search, where fixations in space are assumed random, and structured search, whereeye movements are presumed to be to some extent biased by structure in the scene.
10.1 Empty Field Search.
In the empty field search situation the only constraint on fixation changes fromglimpse to glimpse is a possible boundary in the field of view (as for instance if viewing
Table 3. Predicted interrogation lengths at mean recognition rangefor the four objects used in the recognition experiment.

through binoculars or when searching a finite illuminated area). Under such conditions itis imperative that each glimpse be considered separately and the total probability ofdetecting an isolated object within the search field in one glimpse in a given directionestablished. This is usually accomplished by making use of the hard shell visual lobeconcept (Ref. 35) which assigns a 100% probability of detection out to a certain angulardistance from the fovea and zero probability beyond. For most purposes such anassumption is adequate, although strictly the visual lobe should be soft shelled (analogousto the retinal image).
Using equation (iv), and if all data except θ are available, it is possible to use the presentvisual modelling to predict θ, which now becomes the radius of a hard shell visual lobe forsearching for a specific object in a plain field. If then the search field is of radius θF it canbe shown (Ref . 13) that the probability of detecting the object in a single glimpse is
pg = [θ/θF - θ2/4θF2]2 ( xvi )
Also, after m glimpses the total probability of detection will be
фm = [1 - m∑(1 - pgr)] ( xvii )
where pgr is the single glimpse probability on the r th glimpse, assuming the glimpsesare independent (as discussed in section 4).
The empty field search situation, including the case where there is target growth (that is,the object of interest is getting closer during the period of search) is discussed in depth inRef. 13. It has been shown there that it is possible to predict the empty field search dataobtained by Krendel and Wodinsky (Ref. 36) using constants Kl and δ appropriate toTaylor's data (Ref. 6) and a mean glimpse time of 1/3 second.
10.2 Structured Search.
If the scene being viewed contains significant structure which can be confused at allwith the Object of Interest, the empty field (random) search is no longer necessarily anadequate predictor of performance. In such a situation there is strong evidence fromWilliams (Ref. 37) that about 99% of all fixations are likely to fall on target-like objects.The cues for probable next fixation are claimed to be associated with degree of similarityof target-like objects in peripheral vision (colour, shape, size, contrast, etc.). The meanglimpse time is also likely to be modified in this structured situation, being dependant oncontrast and image sharpness very markedly (Ref. 38) and also on the degree of similaritybetween targets and pseudo targets - i.e. task difficulty. The present state of modellingdoes not permit adequate handling of such situations except where the number of pseudotargets is very large, in which case the situation approximates to random search.

11. MOTION THRESHOLDS.
During 1970 an experiment was carried out by B.A.C. into the variation of DynamicVisual Acuity with retinal region of presentation of the moving stimulus (Ref. 39). Theexperiment consisted of detecting moving discs of 5 sizes (diameters between 22.5 mins.and 64 mins.) and of a fixed positive contrast of 0.3, the discs being presented at variousmean angles from the fovea. The discs could be presented at a variety of speeds from 10degrees/second up to 400 degrees/second and in all cases the stimulus was in view as ittraversed a fixed 5° arc symmetrically about the chosen mean angle from the fovea (i.e.along a radius from the fovea). As part of the analysis of results of the experiment,modelling of the threshold performance at one retinal position (10° from the fovea) wasattempted in terms of the present Vision hypothesis.
Now in order to use the hypothesis for dynamic stimuli it was necessary to modify ourthinking slightly in that, for the rates of sweep considered, the stimulus must have appearedas a short pulse of duration much less than a glimpse time to any one receptor. Hence theeffective 'size' of the stimulus would not be, as for static viewing, the contour length, butwould be the number of retinal receptors 'swept' by the stimulus during the presentation(i.e. the swept area). Since the arc of presentation was fixed, the number of receptorsswept would then be proportional to the diameter of the presented disc D. Also for a fixedcontrast of stimulus and pulse presentation the 'strength' of the stimulus must have beenproportional to mean exposure time, which in turn was inversely proportional to sweepvelocity VT.
Now in section 5 it was shown how it is possible to model short pulse exposuresin terms of the physically based vision model, and in particular it was confirmed that, forexposures of less than about 10 mS, the hyperbolic relationship between intensity orcontrast and exposure time found by many workers was predicted. Also, for highluminance levels it was shown (equation xii) that f(C) ≈ K2.C for extended objects. Thus,since the experiment being studied was carried out at high luminance (40 ft. L.) and since itwas found that the thresholds were all associated with exposures less than 16 mS (all butone less than 10 mS), it was possible, for initial modelling, to use a formula of the form
1/VT = K1' .f(D) + δ' (xviii)
in place of equation (i),
where K1' and δ' were a pair of constants related to the particular viewing conditionsand included constants of proportionality associated with VT and D.
Since for each elemental length at the strip D there are contributory pulses from each ofa large number of receptor pairs over a 5° arc, it was considered that for modelling of thissituation a noise free function of D should be used (i.e. f(D) ∝ D-2). As with othermodelling, the requirement to be fulfilled was that a graph of f(C) against f(n) would yielda straight line. In this case, then, VT-1 was plotted against D-2. A good straight line fit

was obtained. From this, values of K1' and δ' were determined and a graph of stimulusdiameter against threshold velocity was plotted (Fig. 16).
Rearrangement of the formula for 10°eccentricity to define D in terms of VTgave
[8.57 VT/( 1 - 8x10⁻⁴ VT)]0.5 (xvii)
Using this formula a completeDynamic Visual Acuity curve wasderived (Fig. 17). This confirmedprevious experimental findings byourselves and others (Ref. 40 and 41)that at high velocities, for constant angleof exposure, the threshold curve steepensmarkedly and eventually becomesasymptotic to a 'limiting' velocity.
12. INTERPRETATION OF RECEPTOR FIELDS.
Throughout this paper our reasoninghas been based on the tacit assumption thatall visual information used in detection andsimple recognition effectively comes fromregions of high illuminance gradient in theretinal image. This is in the face of aconsiderable body of published data whichshows major spatial interactions whenthresholds for certain complex targetpresentations are measured. These areexplained as due to summation andinhibition fields associated with each nervefibre transmitting data to the brain (e.g.Refs. 3, 4 & 5). How useful, then, in suchsituations, is a simple contour theory whereit is assumed that, effectively, eachdifference signal between a pair of adjacentcone receptors is associated directly with asingle nerve fibre. It has been
demonstrated in Figs. 10, 13 & 15 how grossly degraded the effective images of smallobjects are on the retina after being degraded by the refraction optics of the eye andinvoluntary eye movements. Now Fiorentini and Maffei (Ref. 4) carried out an Experimentwhere 1.7 minute of arc flash stimuli were presented, superimposed on a series ofconstantly presented sub-threshold annular stimuli having a constant area of 9 sq.mins of
Fig. 16. Predictions of the Result of the B.A.C. DynamicVisual Acuity Experiment for the Retinal Position10° from the Fovea.
Fig. 17. Theoretical Prediction of a Complete DynamicVisual Acuity Curve for a Retinal Position 10° from theFovea.
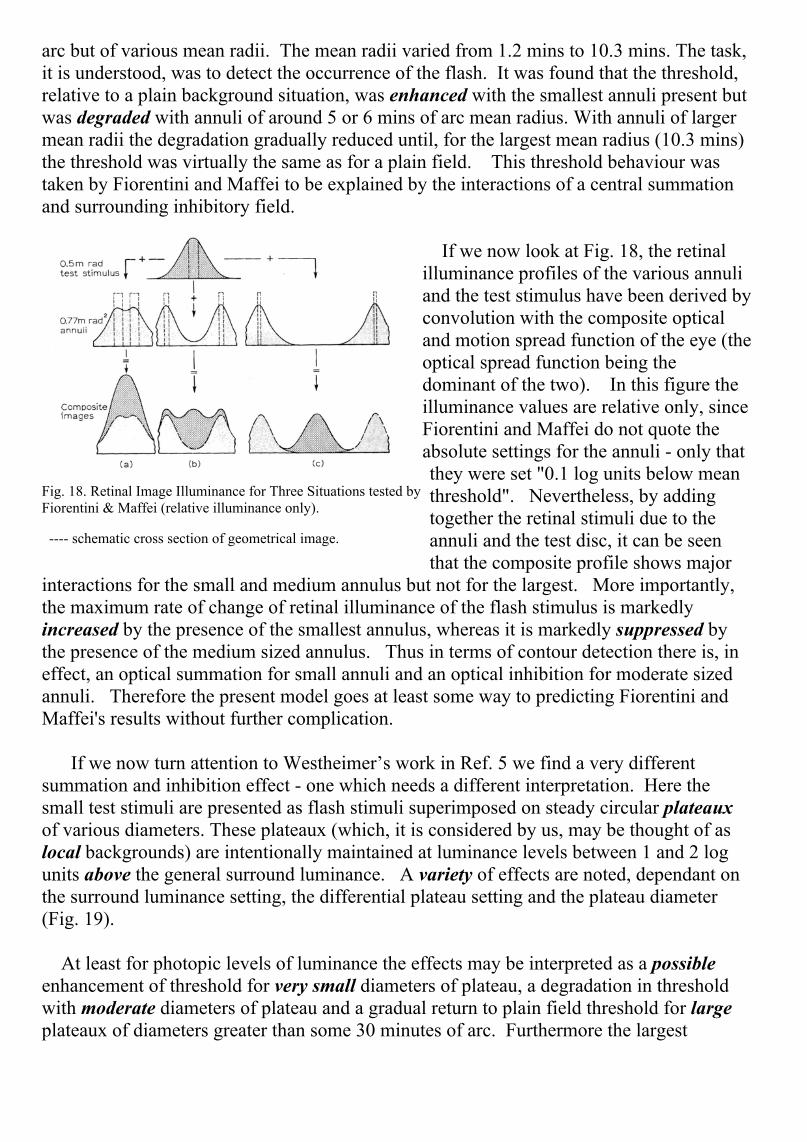
arc but of various mean radii. The mean radii varied from 1.2 mins to 10.3 mins. The task,it is understood, was to detect the occurrence of the flash. It was found that the threshold,relative to a plain background situation, was enhanced with the smallest annuli present butwas degraded with annuli of around 5 or 6 mins of arc mean radius. With annuli of largermean radii the degradation gradually reduced until, for the largest mean radius (10.3 mins)the threshold was virtually the same as for a plain field. This threshold behaviour wastaken by Fiorentini and Maffei to be explained by the interactions of a central summationand surrounding inhibitory field.
If we now look at Fig. 18, the retinalilluminance profiles of the various annuliand the test stimulus have been derived byconvolution with the composite opticaland motion spread function of the eye (theoptical spread function being thedominant of the two). In this figure theilluminance values are relative only, sinceFiorentini and Maffei do not quote theabsolute settings for the annuli - only thatthey were set "0.1 log units below meanthreshold". Nevertheless, by addingtogether the retinal stimuli due to theannuli and the test disc, it can be seenthat the composite profile shows major
interactions for the small and medium annulus but not for the largest. More importantly,the maximum rate of change of retinal illuminance of the flash stimulus is markedlyincreased by the presence of the smallest annulus, whereas it is markedly suppressed bythe presence of the medium sized annulus. Thus in terms of contour detection there is, ineffect, an optical summation for small annuli and an optical inhibition for moderate sizedannuli. Therefore the present model goes at least some way to predicting Fiorentini andMaffei's results without further complication.
If we now turn attention to Westheimer’s work in Ref. 5 we find a very differentsummation and inhibition effect - one which needs a different interpretation. Here thesmall test stimuli are presented as flash stimuli superimposed on steady circular plateauxof various diameters. These plateaux (which, it is considered by us, may be thought of aslocal backgrounds) are intentionally maintained at luminance levels between 1 and 2 logunits above the general surround luminance. A variety of effects are noted, dependant onthe surround luminance setting, the differential plateau setting and the plateau diameter(Fig. 19).
At least for photopic levels of luminance the effects may be interpreted as a possibleenhancement of threshold for very small diameters of plateau, a degradation in thresholdwith moderate diameters of plateau and a gradual return to plain field threshold for largeplateaux of diameters greater than some 30 minutes of arc. Furthermore the largest
Fig. 18. Retinal Image Illuminance for Three Situations tested byFiorentini & Maffei (relative illuminance only).
---- schematic cross section of geometrical image.
degradations are observed with the largest differential luminance between plateau andsurround.
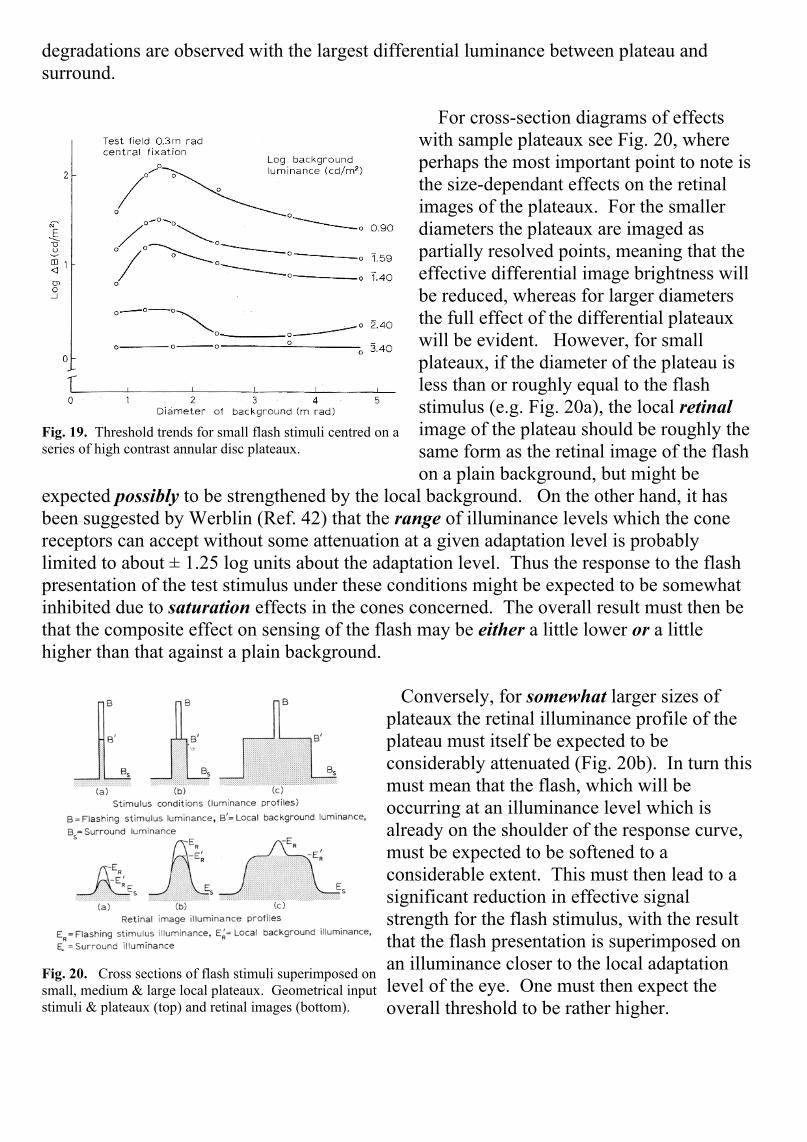
For cross-section diagrams of effectswith sample plateaux see Fig. 20, whereperhaps the most important point to note isthe size-dependant effects on the retinalimages of the plateaux. For the smallerdiameters the plateaux are imaged aspartially resolved points, meaning that theeffective differential image brightness willbe reduced, whereas for larger diametersthe full effect of the differential plateauxwill be evident. However, for smallplateaux, if the diameter of the plateau isless than or roughly equal to the flashstimulus (e.g. Fig. 20a), the local retinalimage of the plateau should be roughly thesame form as the retinal image of the flashon a plain background, but might be
expected possibly to be strengthened by the local background. On the other hand, it hasbeen suggested by Werblin (Ref. 42) that the range of illuminance levels which the conereceptors can accept without some attenuation at a given adaptation level is probablylimited to about ± 1.25 log units about the adaptation level. Thus the response to the flashpresentation of the test stimulus under these conditions might be expected to be somewhatinhibited due to saturation effects in the cones concerned. The overall result must then bethat the composite effect on sensing of the flash may be either a little lower or a littlehigher than that against a plain background.
Conversely, for somewhat larger sizes ofplateaux the retinal illuminance profile of theplateau must itself be expected to beconsiderably attenuated (Fig. 20b). In turn thismust mean that the flash, which will beoccurring at an illuminance level which isalready on the shoulder of the response curve,must be expected to be softened to aconsiderable extent. This must then lead to asignificant reduction in effective signalstrength for the flash stimulus, with the resultthat the flash presentation is superimposed onan illuminance closer to the local adaptationlevel of the eye. One must then expect theoverall threshold to be rather higher.
Fig. 19. Threshold trends for small flash stimuli centred on aseries of high contrast annular disc plateaux.
Fig. 20. Cross sections of flash stimuli superimposed onsmall, medium & large local plateaux. Geometrical inputstimuli & plateaux (top) and retinal images (bottom).

Finally, at large plateau diameters there will eventually be a sufficient area of high retinalilluminance around the test stimulus to permit the local adaptation level to change. Whenthis situation is reached the threshold might be expected to return to that for a plainbackground level, but a level related to an adaptation luminance (BB) defined by theplateau rather than the general surround (Fig. 20c).
It would thus appear that again, in this situation, the present model can be adapted totake due account of the effects of complex surrounds (by using inhibition field data as aninput of local retinal adaptation). However, much more study would be required in thisarea before really reliable predictive modelling could be assured.
13. CONCLUSIONS.
In this paper a large number of extensions of the basic contour vision hypothesis of Ref.1 for modelling of foveal detection have been discussed. Throughout these extensions ithas been possible to retain direct association with physical parameters, at the same time asretaining basic simplicity. For several situations it has been shown that, if field luminanceis held constant, the same values of the two basic constants K1 and δ are totally definitive.Some insight has also been gained on the experimental factors which cause δ, particularly,to change. It has been shown that the predictive capabilities extend at least some waytowards the modelling of 'receptive field' threshold trends and simple recognition.
Having established those facts, we are at this time in a position to begin to study indepth the modelling of the complex situations associated with non-uniform backgrounds,non-uniform targets and recognition. In the case of the latter we are, however, well awarethat there must be other factors than the purely physical coming into play (memory banks,briefing, etc.) which may make general modelling of recognition dubious if not impossible.Even if this proves to be so we are nevertheless in a position to estimate the limitations ofdata input to the brain from the eye, at least for relatively unstructured situations. As suchwe should be able to predict the significance of such factors as degradations in opticalquality, contrast, motion, search, luminance, viewing time, etc., and their interactions ineither detection or simple recognition tasks.
ACKNOWLEDGMENTS.
The author wishes to acknowledge gratefully the permission of the Ministry ofDefence (P.E.) to publish this paper which is largely based on research carried out underContract to them.
REFERENCES.
1. Overington I. and Lavin E.P. Optica Acta, Vol.13, (1971), 341.2. Kornfeld G.H. and Lawson W.R., J.O.S.A., Vol.61, (1971), 811.3. Enoch J.L., Sunga R.N. and Am. J.Ophthal. Vol.70, (1970), 113. Bachmann E.,

4. Fiorentini A. and Maffei L., J. Neurophysiol., Vo1.33, (1970), 285.5. Westheimer G., J. Physiol., Vol.190, (1967), 139.6. Taylor J.H., 'Visual Problems of the Armed Forces', Paper presented to the NAS-NRC Vision Committee, (1961).7. Ford A., White C.T. 'Analysis of Eye Movements', and Lichtenstein M., J.O.S.A. Vol.49, (1959), 287.8. Pirenne M.H., 'Vision and the Eye', Chapman and Hall, London, (1967), 43.9. Lavin E.P. and Overington I., Optica Acta, Vol.19, (1972), 365.10. Sloan L.L. Vision Research, Vol.1, (1961), 121.11. Ditchburn R.W. and Optica Acta, Vol.14, (1967) 113. Foley-Fisher J.A.,12. Lamar E.S. et al, J.O.S.A., Vol.38, (1948), 741.13. Overington I. in 'Air to Ground Target Acquisition',AGARD Conference Proceedings No.100, London, Nov.1972.(ed. Dr. H.F. Huddleston) Pg. B2-1.14. Blackwell H.R. J.O.S.A., Vol.36, (1946), 624.15. Weatherburn C.E. 'A First Course in Mathematical Statistics', Cambridge University Press (1961), 22.16. Blondel A. and Rey J., J. de Physique, 1, 5th Series, (1911) 530,643.17. Taylor J.H., in 'Air to Ground Target Acquisition', AGARD Conference Proceedings No.100, Nov.1972. (ed. Dr. H.F. Huddleston) Pg. B8-118. Clark W.C. and 'Relations between visibility thresholds Blackwell H.R. for single and double pulses', University of Michigan Report No.2144-343-T, (1959), 31.19. Lavin E.P. Private Communication.20. Blackwell H.R. and 'Foveal detection Thresholds for various McCready D.W., durations of Target Presentation', Minutes
and Proceedings of NAS-NRC Vision Committee(1952), ACSIL/53/4405.
21. Schade (Sr.) O., J.O.S.A., Vol.46, (1956), 721.22. Ronchi L. And Atti della Fondazione Giorgio Ronchi, Longobardi G., Anno XXVI, No.2, (1971), 239.23. Flamant F., Revue d'Optique, Vol.27, (1948), 75124. Van Meeteren A., Private Communication.25. Ogle K.N., Am.J.Ophthal., Vol.52, (1961), 755.26. Middleton W.E.K., 'Vision through the Atmosphere', University of Toronto Press, (1958), 92.27. Gullick.S.A., Optics Technology, Vol.2, (1970), 88.23. Overington I., J.O.S.A. Vol.63, (1973), 1043.29. Higgins G.C., Phot. Sci. and Eng., Vol.15, (1971) 10630. Clare J.N. B.A.C. (G.W.) Human Factors Study Note Series 7, No.8, (Jan.1972), (B.A.C.(G.W.)) Ref. L50/211).

31. Overington I. And Optica Acta, Vol.20, (1973), 49. Gullick S.A.,32. Clare J.N. B.A.C. (G.W.) Human Factors Study Note Series 7, No.16. (Jan.1972), (B.A.C.(G.W.) Ref. L50/211).33. Westheimer G. and J.O.S.A., Vol.52, (1962), 1040. Campbell F.W.,54. Brown M.B. in 'Air to Ground Target Acquisition', AGARD Conference Proceedings 100, London, Nov.1972. (Ed. Dr. H.F. Huddleston) Page B5_135. Davies E.B., 'Visual Search Theory with particular reference to Air to Ground Vision', R.A.E. Tech. Report 68055 (1968).36. Krendel E.S. And J.0.S.A., Vol.50, (1960), 562. Wodinsky J.,37. Williams L.G., 'Cartographia - map design and the map user', Nomograph No.2, 1971. Pub. York Univ., Toronto.38. Enoch J.M., Private Communication.39. Lavin E.P. And 'Research into Factors affecting the Spicer P., Detection of Aircraft through Optical Sights', Appendix 3, Section 5, April 1972. (B.A.C. Ref. L50/186/1449).40. Lavin E.P., 'Research into Factors affecting the Detection of Aircraft through Optical Sights', Appendix 3, Section 4, April 1972. (B.A.C. Ref. L50/186/1449).41. Miller J.W. And Survey Opthalmol., Vol.7, (1962), 83. Ludvigh E.,42. Werblin. F.S., Scientific American, Jan.1973, 71.
