prediction total specific pore volume of geopolymers ... · prediction total specific pore volume...
TRANSCRIPT
Prediction Total Specific Pore Volume of Geopolymers Produced from Waste Ashes by Fuzzy Logic
Ali Nazari*, Gholamreza Khalaj
Department of Materials Engineering, Saveh Branch, Islamic Azad University, Saveh, Iran
Received: June 30, 2011; Revised: October 23, 2011
In the present work, total specific pore volume of inorganic polymers (geopolymers) made from seeded fly ash and rice husk bark ash has been predicted by fuzzy logic. Different specimens, made from a mixture of fly ash and rice husk bark ash in fine and coarse form together with alkali activator made of water glass and NaOH solution, were subjected to porosimetry tests at 7 and 28 days of curing. The curing regime was different: one set of the specimens were cured at room temperature until reaching to 7 and 28 days and the other sets were oven cured for 36 hours at the range of 40-90 °C and then cured at room temperature until 7 and 28 days. A model based on fuzzy logic for predicting the total specific pore volume of the specimens has been presented. To build the model, training and testing using experimental results from 120 specimens were conducted. The used data as the inputs of fuzzy logic models are arranged in a format of six parameters that cover the percentage of fine fly ash in the ashes mixture, the percentage of coarse fly ash in the ashes mixture, the percentage of fine rice husk bark ash in the ashes mixture, the percentage of coarse rice husk bark ash in the ashes mixture, the temperature of curing and the time of water curing. According to the input parameters, in the fuzzy logic model, the pore volume of each specimen was predicted. The training and testing results in the fuzzy logic model have shown a strong potential for predicting the total specific pore volume of the geopolymer specimens in the considered range.
Keywords: geopolymer, total specific pore volume, fly ash, rice husk bark ash, fuzzy logic, FT-IR
1. IntroductionAlthough the porous ceramics previously developed by
several researchers, it would be of considerable advantage if such porous ceramics could be prepared by a more environmentally friendly process without the need for firing at high temperatures. Geopolymers are good candidates for this purpose, since they are synthesized and hardened at ambient temperatures by the formation of a framework structure of alkali aluminosilicate gel. The term geopolymer was first proposed by Davidovits1 to describe inorganic aluminosilicate polymers formed from geological materials, and after that many subsequent studies have been reported2-5. The synthesis is generally performed by reaction of an alkali silicate solution with a solid aluminosilicate such as fly ash under alkaline conditions. The microstructure and mechanical properties are found to depend strongly on the chemical compositions of the constituent materials. A review by Duxson et al.3 indicates a trend towards increased mechanical strength at higher SiO
2/Al
2O
3 ratios
and increased porosity at higher H2O/SiO
2 ratios. They
also report that the microstructures of geopolymers change significantly at a SiO
2/Al
2O
3 ratio of about 3. A maximum
compressive strength of 70 MPa was observed at a SiO2/
Al2O
3 ratio of 3.83.
The properties of inorganic polymers depend on both the ratio of Si/Al and the types of the utilized raw material.
Fly ash (FA) is recently used as a source material to produce geopolymer because of its suitable chemical composition along with favorable size and shape. Fly ash is a by-product of coal-fired electric power stations. Literature survey specifies that fly ash is primarily composed of SiO
2, Al
2O
3
and Fe2O
3. Since the quality of fly ash depends on the
type and the quality of coal along with the performance of the power plant, difficulties sometimes remain to control its chemical composition. In order to achieve a suitable chemical composition to produce geopolymers, the preferred method is to blend fly ash with another high silica source6.
Rice husk–bark ash (RHBA) is a solid waste generated by biomass power plants using rice husk and eucalyptus bark as fuel. The power plant company providing RHBA for this research reported that about 450 tons/day of RHBA are produced and discarded. The major chemical constituent of RHBA is SiO
2 (about 75%)7,8. Therefore, blending FA and
RHBA can adjust the ratio of Si/Al as required.Over the last two decades, a different modeling method
based on fuzzy logic (FL) has become popular and has been used by many researchers for a variety of engineering applications. Fuzzy control theory can be applied on linear and nonlinear systems. It does not need to handle the tedious mathematical models of controlled body. It needs only to set a simple controlling method based on engineering experience. Therefore, it is particularly useful in *e-mail: [email protected]
DOI: 10.1590/S1516-14392012005000010Materials Research. 2012; 15(2): 242-252 © 2012
Prediction Total Specific Pore Volume of Geopolymers Produced from Waste Ashes by Fuzzy Logic
complicated structural control system9-11. The percentage of water absorption of geopolymers can be calculated using the models built with FL. It is convenient and easy to use these models for numerical experiments to review the effects of each variable on the percentage of water absorption values.
As authors’ knowledge, there are no works on utilizing a mixture of FA and RHBA with seeded distribution of particles to produce geopolymers. In addition, since the concept of geopolymers is completely new and there are few works on their properties, application of computer programs like fuzzy logic (FL) to predict their properties is rarely reported. The aim of this study is to investigate the total specific pore volume of geopolymers produced form seeded FA and RHBA mixture experimentally and presenting suitable model based on fuzzy logic to predict their total specific pore volume. Both FA and RHBA with two different particle size distributions have been mixed with different amounts to produce four classes of geopolymers. Total specific pore volume of the produced specimens has been investigated after specific times of curing. Totally 120 data of permeability tests in different conditions were collected, trained and tested by means of FL. The obtained results have been compared by experimental ones to evaluate the software power for predicting the total specific pore volume of the geopolymer specimens.
2. Experimental ProcedureThe cementitious materials used in this work were FA
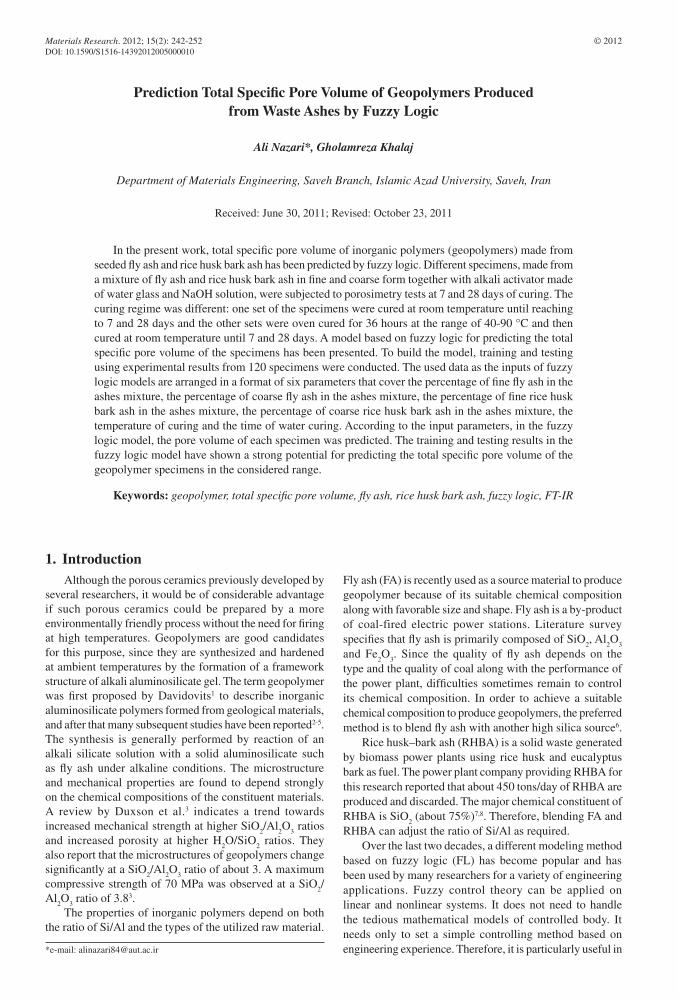
and RHBA. Their chemical composition has been illustrated in Table 1. In addition, Figure 1 shows SEM micrograph of
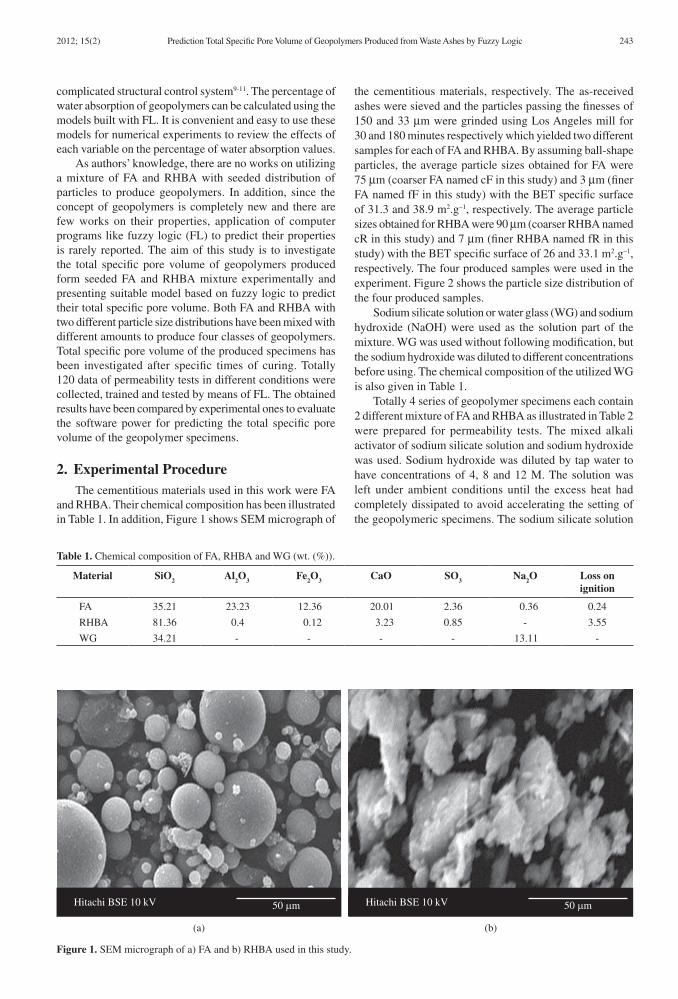
the cementitious materials, respectively. The as-received ashes were sieved and the particles passing the finesses of 150 and 33 µm were grinded using Los Angeles mill for 30 and 180 minutes respectively which yielded two different samples for each of FA and RHBA. By assuming ball-shape particles, the average particle sizes obtained for FA were 75 µm (coarser FA named cF in this study) and 3 µm (finer FA named fF in this study) with the BET specific surface of 31.3 and 38.9 m2.g–1, respectively. The average particle sizes obtained for RHBA were 90 µm (coarser RHBA named cR in this study) and 7 µm (finer RHBA named fR in this study) with the BET specific surface of 26 and 33.1 m2.g–1, respectively. The four produced samples were used in the experiment. Figure 2 shows the particle size distribution of the four produced samples.
Sodium silicate solution or water glass (WG) and sodium hydroxide (NaOH) were used as the solution part of the mixture. WG was used without following modification, but the sodium hydroxide was diluted to different concentrations before using. The chemical composition of the utilized WG is also given in Table 1.
Totally 4 series of geopolymer specimens each contain 2 different mixture of FA and RHBA as illustrated in Table 2 were prepared for permeability tests. The mixed alkali activator of sodium silicate solution and sodium hydroxide was used. Sodium hydroxide was diluted by tap water to have concentrations of 4, 8 and 12 M. The solution was left under ambient conditions until the excess heat had completely dissipated to avoid accelerating the setting of the geopolymeric specimens. The sodium silicate solution
Table 1. Chemical composition of FA, RHBA and WG (wt. (%)).
Material SiO2 Al2O3 Fe2O3 CaO SO3 Na2O Loss on ignition
FA 35.21 23.23 12.36 20.01 2.36 0.36 0.24
RHBA 81.36 0.4 0.12 3.23 0.85 - 3.55
WG 34.21 - - - - 13.11 -
Figure 1. SEM micrograph of a) FA and b) RHBA used in this study.
2012; 15(2) 243
Nazari & Khalaj
without preparation was mixed with the sodium hydroxide solution. The ratio of the sodium silicate solution to sodium hydroxide solution was 2.5 by weight for all mixtures because this ratio demonstrated the best properties for fly ash-based geopolymer12,13. For all samples, the mass ratio of alkali activator to FA-RHA mixture was 0.4. Pastes were mixed by shaking for 5-10 minutes to give complete homogenisation. The mixing was done in an air-conditioned room at approximately 25 °C. The molds were half-filled, vibrated for 45 seconds, filled to the top, again vibrated for 45 seconds, and sealed with the lid. The mixtures were then precured for 24 hours at room temperature. This precuring time has been found to be beneficial to strength development and hence improved properties14. Precuring time before application of heat induces significant dissolution of silica and alumina from fly ash and formation of a continuous matrix phase, increasing, therefore, the homogeneity of the geopolymeric materials14,15. After the precuring process, the samples and molds were placed in a water bath to prevent moisture loss and the carbonation of the surface. One batch of these samples was placed in an air-conditioned room at 25 °C. The other batch was put in the oven at the elevated temperatures of 40-90 °C for 36 hours. To determine the
most effective alkali concentration on reduced pore volume, one set of the specimens cured at 80 °C for 36 hours were subjected to permeability tests. Afterwards, the other sets of samples were tested at 7 and 28 days of curing (for the specimens cured in elevated temperature, the time of oven-curing were also considered).
There are several methods generally used to measure the pore structure, such as optics method, mercury intrusion porosimetry (MIP), helium flow and gas adsorption16. MIP technique is extensively used to characterize the pore structure in porous material as a result of its simplicity, quickness and wide measuring range of pore diameter16,17. MIP provides information about the connectivity of pores16.
In this study, the pore structure of concrete is evaluated by using MIP. To prepare the samples for MIP measurement, the concrete specimens after 28 days of curing were first broken into smaller pieces, and then the cement paste fragments selected from the center of prisms were used to measure pore structure. The samples were immersed in acetone to stop hydration as fast as possible. Before mercury intrusion test, the samples were dried in an oven at about 110 °C until constant weight to remove moisture in the pores. MIP is based on the assumption that the non-wetting liquid mercury (the contact angle between mercury and solid is greater than 90°) will only intrude in the pores of porous material under pressure16,17. Each pore size is quantitatively determined from the relationship between the volume of intruded mercury and the applied pressure17. The relationship between the pore diameter and applied pressure is generally described by Washburn Equation 1 as follows16,17:
4 cosD P= − γ θ (1)
where, D is the pore diameter (nm), γ is the surface tension of mercury (dyne/cm), θ is the contact angle between mercury and solid (°) and P is the applied pressure (MPa).
The test apparatus used for pore structure measurement is Auto Pore III mercury porosimeter. Mercury density is 13.5335 g.mL–1. The surface tension of mercury is taken as 485 dynes.cm-1, and the contact angle selected is 130°.
Figure 2. Particle size distribution pattern of the different ashes used in this study.
Table 2. Mixture proportioning of the utilized FA and RHBA to produce geopolymeric specimens.
Sample designation Weight percent of fine FA
(fF wt. (%))
Weight percent of coarse FA
(cF wt. (%))
Weight percent of fine RHBA
(fR wt. (%))
Weight percent of coarse RHBA(cR wt. (%))
SiO2/Al2O3
ratio
fF-fR-1 60 0 40 0 3.81
fF-fR-2 70 0 30 0 2.99
fF-fR-3 80 0 20 0 2.38
fF-cR-1 60 0 0 40 3.81
fF-cR-2 70 0 0 30 2.99
fF-cR-3 80 0 0 20 2.38
cF-fR-1 0 60 40 0 3.81
cF-fR-2 0 70 30 0 2.99
cF-fR-3 0 80 20 0 2.38
cF-cR-1 0 60 0 40 3.81
cF-cR-2 0 70 0 30 2.99
cF-cR-3 0 80 0 20 2.38
Alkali activator (WG + silicate sodium) to FA-RHBA mixture ratio is 0.4.
244 Materials Research
Prediction Total Specific Pore Volume of Geopolymers Produced from Waste Ashes by Fuzzy Logic
The maximum measuring pressure applied is 200 MPa (30000 psi), which means that the smallest pore diameter that can be measured reaches about 6 nm (on the assumption that all pores have cylindrical shape).
The microstructural characteristic of geopolymeric specimens, which was made at the optimum condition and had a low pore volume, was analyzed using Fourier transform infrared spectroscopy (FT-IR). The powder samples were mixed with KBr at a concentration of 0.2-1.0 wt. (%) to make the KBr disks. Then the disks were evaluated using a Perkin Elmer FT-IR microscope.
3. Experimental Results and Discussion
3.1. Total specific pore volume
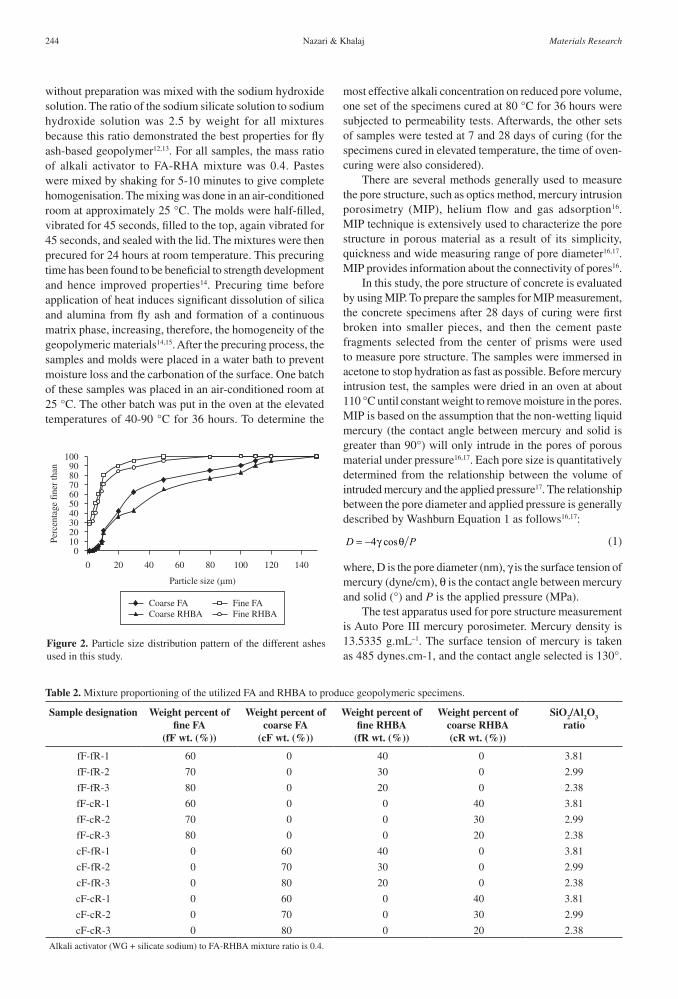
The total specific pore volume of the produced specimens has been illustrated in Table 3 for 7 and 28 days of curing. Table 3 shows that the minimum pore volume has been achieved for fF-fR2 specimen cured at 80 °C for 36 hours in both 7 and 28 days curing regimes. As Table 3 shows, the optimum curing condition for the all mixtures is at 80 °C. Curing temperature has a significant effect on the properties of geopolymers because it affects specimens setting and hardening. Synthesized products are known to be very sensitive to experimental conditions18. However, total specific pore volume begins to increase after curing for a certain period of time at higher temperature. Prolonged curing at higher temperatures can break down the granular structure of geopolymer mixture. This results in dehydration and excessive shrinkage due to contraction of the gel, which does not transform into a more semi-crystalline form19.
On the whole, samples made with the fine RHBA and FA particles (fF-fR series) showed considerably lower pore volume than the other series. This may be due to production of more compacted specimens. Fine particles are capable to fill the vacancies and produce more densified specimens. This has been confirmed in some works done on concrete specimens20, but as authors’ knowledge there is not any reports confirm this matter in geopolymers.
By comparison the total specific pore volume of the specimens at 7 and 28 days of curing, it is observed that fF-fR series have lower pore volume than the corresponding specimens in fF-cR series. As mentioned above, this is due to more condensed structure of the produced specimens by fine particles. On the other hand, fF-cR series specimens have lower pore volume than the corresponding specimens in cF-fR series. Although fR has been used in cF-fR series, the higher content of cF in these series results in increasing pore volume when compared by the corresponding samples in fF-cR series. Once again this confirms that the higher content of fine particles would results in the lower pore volume.
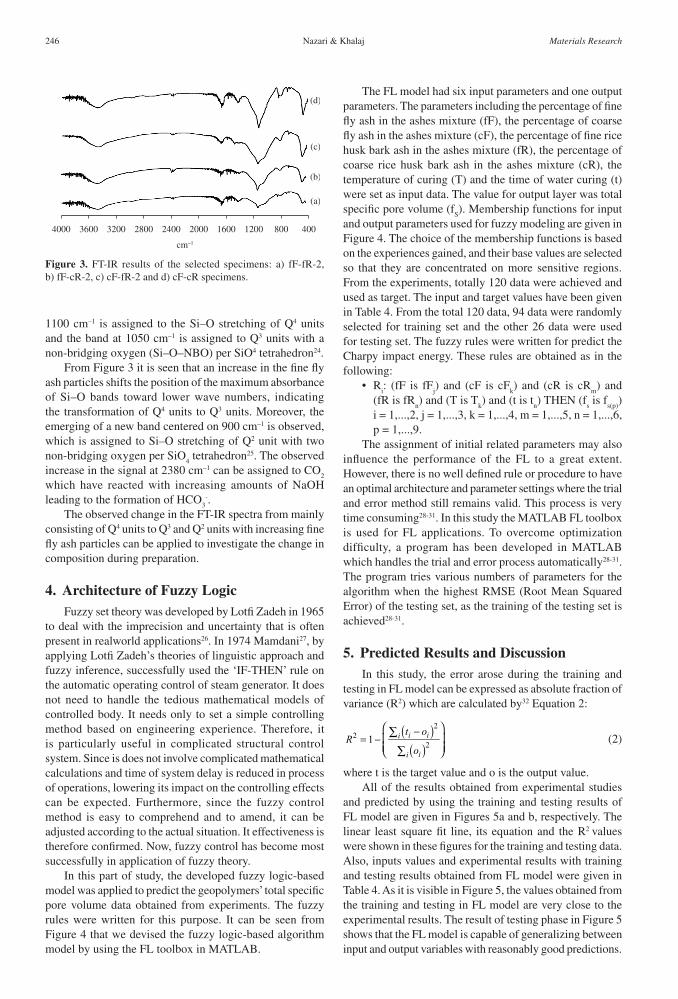
3.2. FT-IR results
FT-IR spectroscopy allows differentiation of various types of bonds in a material on a molecular level. Geopolymers are composed from Si–O tetrahedrons which are connected via corner sharing bridging oxygen. The connectivity of the tetrahedrons is specified by the number of bridging oxygen. Tetrahedrons with n bridging oxygen’s are denoted Qn (n = 0, 1, 2, 3, or 4). Thus, silicon in Q3 configuration is surrounded by three bridging oxygen and a non-bridging oxygen. Amorphous SiO
2 is assumed to consist
of only Q4 species forming a continuous random network21.The position of the main Si–O–X stretching band
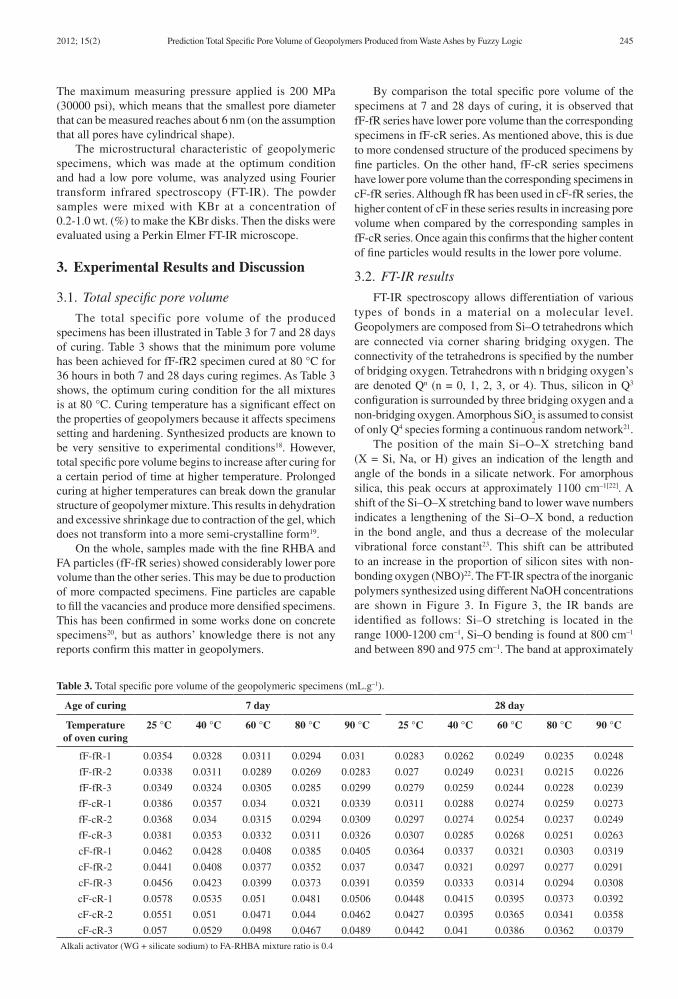
(X = Si, Na, or H) gives an indication of the length and angle of the bonds in a silicate network. For amorphous silica, this peak occurs at approximately 1100 cm–1[22]. A shift of the Si–O–X stretching band to lower wave numbers indicates a lengthening of the Si–O–X bond, a reduction in the bond angle, and thus a decrease of the molecular vibrational force constant23. This shift can be attributed to an increase in the proportion of silicon sites with non-bonding oxygen (NBO)22. The FT-IR spectra of the inorganic polymers synthesized using different NaOH concentrations are shown in Figure 3. In Figure 3, the IR bands are identified as follows: Si–O stretching is located in the range 1000-1200 cm–1, Si–O bending is found at 800 cm–1 and between 890 and 975 cm–1. The band at approximately
Table 3. Total specific pore volume of the geopolymeric specimens (mL.g–1).
Age of curing 7 day 28 day
Temperature of oven curing
25 °C 40 °C 60 °C 80 °C 90 °C 25 °C 40 °C 60 °C 80 °C 90 °C
fF-fR-1 0.0354 0.0328 0.0311 0.0294 0.031 0.0283 0.0262 0.0249 0.0235 0.0248
fF-fR-2 0.0338 0.0311 0.0289 0.0269 0.0283 0.027 0.0249 0.0231 0.0215 0.0226
fF-fR-3 0.0349 0.0324 0.0305 0.0285 0.0299 0.0279 0.0259 0.0244 0.0228 0.0239
fF-cR-1 0.0386 0.0357 0.034 0.0321 0.0339 0.0311 0.0288 0.0274 0.0259 0.0273
fF-cR-2 0.0368 0.034 0.0315 0.0294 0.0309 0.0297 0.0274 0.0254 0.0237 0.0249
fF-cR-3 0.0381 0.0353 0.0332 0.0311 0.0326 0.0307 0.0285 0.0268 0.0251 0.0263
cF-fR-1 0.0462 0.0428 0.0408 0.0385 0.0405 0.0364 0.0337 0.0321 0.0303 0.0319
cF-fR-2 0.0441 0.0408 0.0377 0.0352 0.037 0.0347 0.0321 0.0297 0.0277 0.0291
cF-fR-3 0.0456 0.0423 0.0399 0.0373 0.0391 0.0359 0.0333 0.0314 0.0294 0.0308
cF-cR-1 0.0578 0.0535 0.051 0.0481 0.0506 0.0448 0.0415 0.0395 0.0373 0.0392
cF-cR-2 0.0551 0.051 0.0471 0.044 0.0462 0.0427 0.0395 0.0365 0.0341 0.0358
cF-cR-3 0.057 0.0529 0.0498 0.0467 0.0489 0.0442 0.041 0.0386 0.0362 0.0379
Alkali activator (WG + silicate sodium) to FA-RHBA mixture ratio is 0.4
2012; 15(2) 245
Nazari & Khalaj
1100 cm–1 is assigned to the Si–O stretching of Q4 units and the band at 1050 cm–1 is assigned to Q3 units with a non-bridging oxygen (Si–O–NBO) per SiO4 tetrahedron24.
From Figure 3 it is seen that an increase in the fine fly ash particles shifts the position of the maximum absorbance of Si–O bands toward lower wave numbers, indicating the transformation of Q4 units to Q3 units. Moreover, the emerging of a new band centered on 900 cm–1 is observed, which is assigned to Si–O stretching of Q2 unit with two non-bridging oxygen per SiO
4 tetrahedron25. The observed
increase in the signal at 2380 cm–1 can be assigned to CO2
which have reacted with increasing amounts of NaOH leading to the formation of HCO
3-.
The observed change in the FT-IR spectra from mainly consisting of Q4 units to Q3 and Q2 units with increasing fine fly ash particles can be applied to investigate the change in composition during preparation.
4. Architecture of Fuzzy LogicFuzzy set theory was developed by Lotfi Zadeh in 1965
to deal with the imprecision and uncertainty that is often present in realworld applications26. In 1974 Mamdani27, by applying Lotfi Zadeh’s theories of linguistic approach and fuzzy inference, successfully used the ‘IF-THEN’ rule on the automatic operating control of steam generator. It does not need to handle the tedious mathematical models of controlled body. It needs only to set a simple controlling method based on engineering experience. Therefore, it is particularly useful in complicated structural control system. Since is does not involve complicated mathematical calculations and time of system delay is reduced in process of operations, lowering its impact on the controlling effects can be expected. Furthermore, since the fuzzy control method is easy to comprehend and to amend, it can be adjusted according to the actual situation. It effectiveness is therefore confirmed. Now, fuzzy control has become most successfully in application of fuzzy theory.
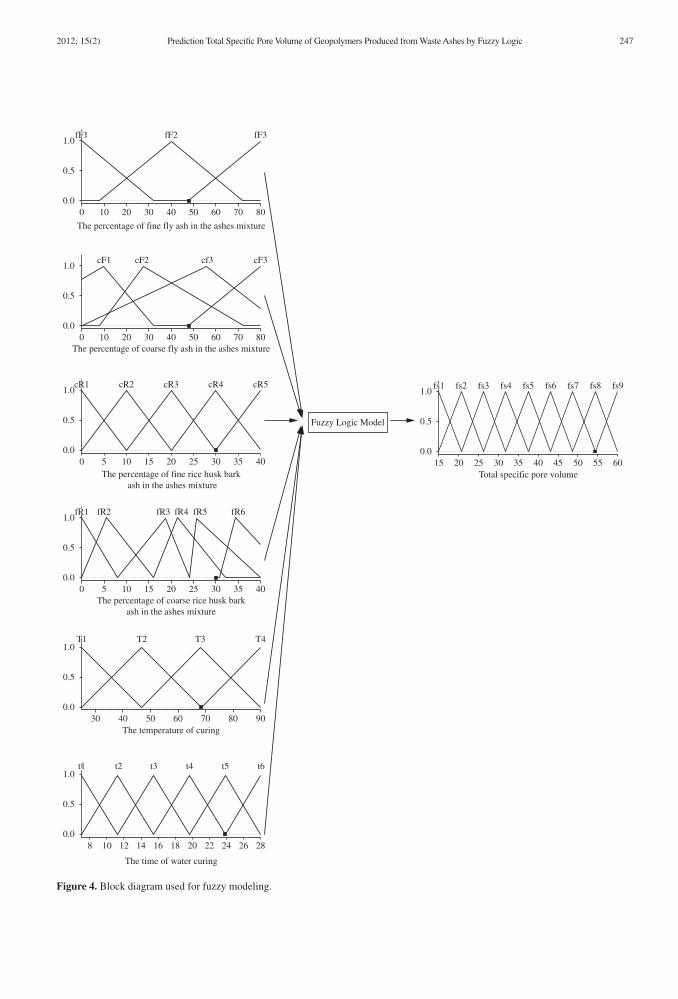
In this part of study, the developed fuzzy logic-based model was applied to predict the geopolymers’ total specific pore volume data obtained from experiments. The fuzzy rules were written for this purpose. It can be seen from Figure 4 that we devised the fuzzy logic-based algorithm model by using the FL toolbox in MATLAB.
The FL model had six input parameters and one output parameters. The parameters including the percentage of fine fly ash in the ashes mixture (fF), the percentage of coarse fly ash in the ashes mixture (cF), the percentage of fine rice husk bark ash in the ashes mixture (fR), the percentage of coarse rice husk bark ash in the ashes mixture (cR), the temperature of curing (T) and the time of water curing (t) were set as input data. The value for output layer was total specific pore volume (f
S). Membership functions for input
and output parameters used for fuzzy modeling are given in Figure 4. The choice of the membership functions is based on the experiences gained, and their base values are selected so that they are concentrated on more sensitive regions. From the experiments, totally 120 data were achieved and used as target. The input and target values have been given in Table 4. From the total 120 data, 94 data were randomly selected for training set and the other 26 data were used for testing set. The fuzzy rules were written for predict the Charpy impact energy. These rules are obtained as in the following:
• Ri: (fF is fF
j) and (cF is cF
k) and (cR is cR
m) and
(fR is fRn) and (T is T
k) and (t is t
n) THEN (f
s is f
s(p))
i = 1,...,2, j = 1,...,3, k = 1,...,4, m = 1,...,5, n = 1,...,6, p = 1,...,9.
The assignment of initial related parameters may also influence the performance of the FL to a great extent. However, there is no well defined rule or procedure to have an optimal architecture and parameter settings where the trial and error method still remains valid. This process is very time consuming28-31. In this study the MATLAB FL toolbox is used for FL applications. To overcome optimization difficulty, a program has been developed in MATLAB which handles the trial and error process automatically28-31. The program tries various numbers of parameters for the algorithm when the highest RMSE (Root Mean Squared Error) of the testing set, as the training of the testing set is achieved28-31.
5. Predicted Results and DiscussionIn this study, the error arose during the training and
testing in FL model can be expressed as absolute fraction of variance (R2) which are calculated by32 Equation 2:
( )( )
− = −
∑∑
22
21 i ii
ii
t oR
o (2)
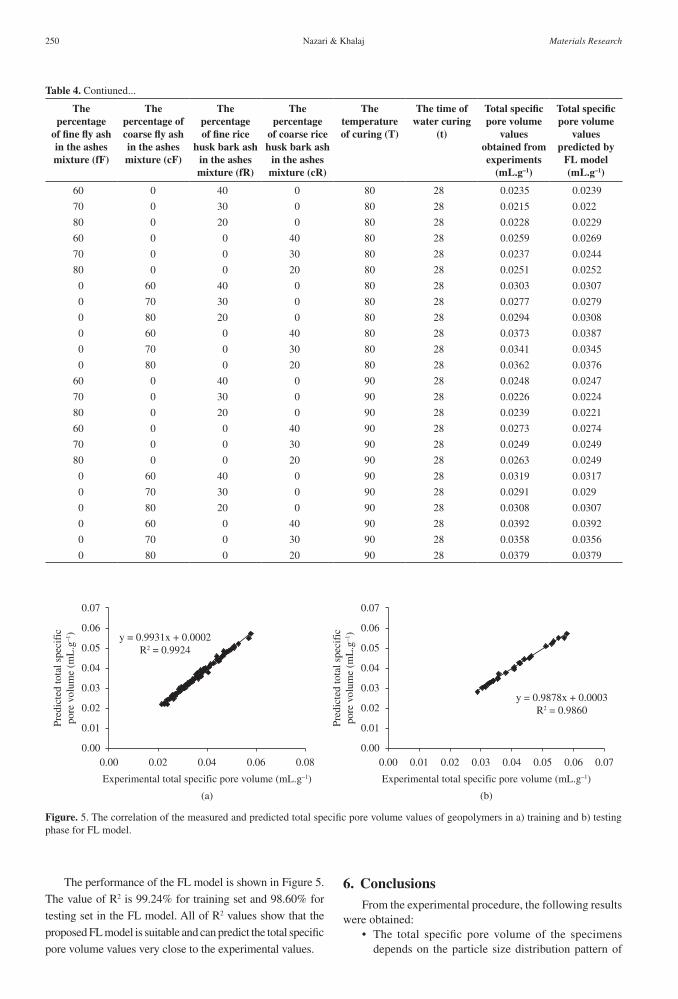
where t is the target value and o is the output value.All of the results obtained from experimental studies
and predicted by using the training and testing results of FL model are given in Figures 5a and b, respectively. The linear least square fit line, its equation and the R2 values were shown in these figures for the training and testing data. Also, inputs values and experimental results with training and testing results obtained from FL model were given in Table 4. As it is visible in Figure 5, the values obtained from the training and testing in FL model are very close to the experimental results. The result of testing phase in Figure 5 shows that the FL model is capable of generalizing between input and output variables with reasonably good predictions.
Figure 3. FT-IR results of the selected specimens: a) fF-fR-2, b) fF-cR-2, c) cF-fR-2 and d) cF-cR specimens.
246 Materials Research
Prediction Total Specific Pore Volume of Geopolymers Produced from Waste Ashes by Fuzzy Logic
Figure 4. Block diagram used for fuzzy modeling.
2012; 15(2) 247

Nazari & Khalaj
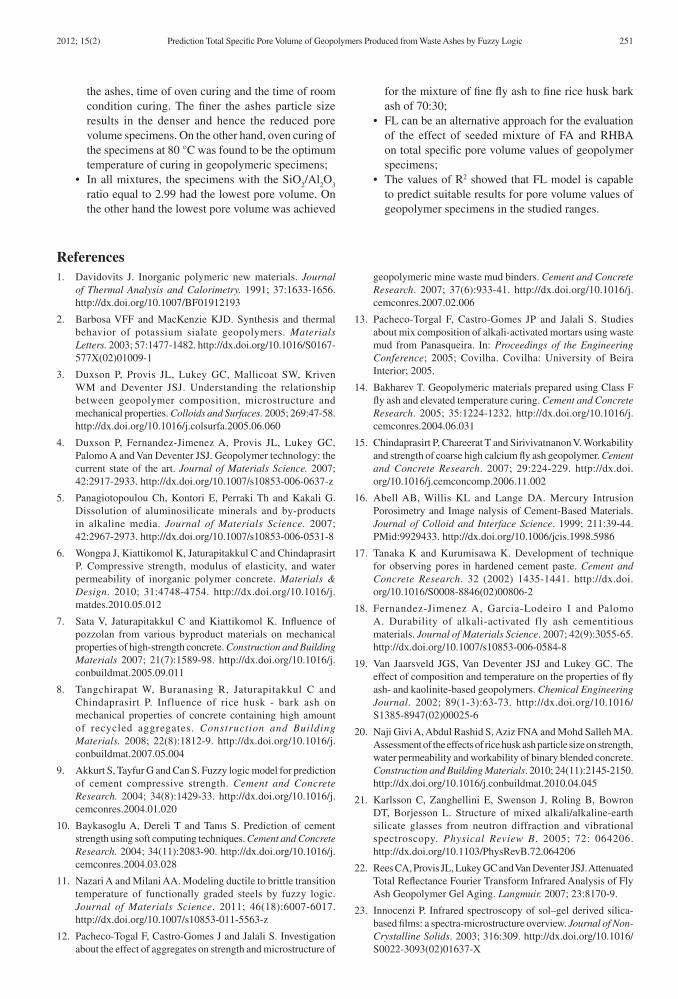
Table 4. Data sets for comparison of experimental results with results predicted from the FL models.
The percentage
of fine fly ash in the ashes mixture (fF)
The percentage of coarse fly ash in the ashes mixture (cF)
The percentage of fine rice
husk bark ash in the ashes mixture (fR)
The percentage
of coarse rice husk bark ash
in the ashes mixture (cR)
The temperature of curing (T)
The time of water curing
(t)
Total specific pore volume
values obtained from experiments
(mL.g–1)
Total specific pore volume
values predicted by
FL model (mL.g–1)
60 0 40 0 25 7 0.0354 0.035
70 0 30 0 25 7 0.0338 0.0337
80 0 20 0 25 7 0.0349 0.0346
60 0 0 40 25 7 0.0386 0.0398
70 0 0 30 25 7 0.0368 0.0368
80 0 0 20 25 7 0.0381 0.0379
0 60 40 0 25 7 0.0462 0.046
0 70 30 0 25 7 0.0441 0.0446
0 80 20 0 25 7 0.0456 0.0453
0 60 0 40 25 7 0.0578 0.0574
0 70 0 30 25 7 0.0551 0.0553
0 80 0 20 25 7 0.057 0.0551
60 0 40 0 40 7 0.0328 0.033
70 0 30 0 40 7 0.0311 0.031
80 0 20 0 40 7 0.0324 0.0324
60 0 0 40 40 7 0.0357 0.0371
70 0 0 30 40 7 0.034 0.034
80 0 0 20 40 7 0.0353 0.0353
0 60 40 0 40 7 0.0428 0.0426
0 70 30 0 40 7 0.0408 0.0406
0 80 20 0 40 7 0.0423 0.0428
0 60 0 40 40 7 0.0535 0.0537
0 70 0 30 40 7 0.051 0.0512
0 80 0 20 40 7 0.0529 0.0524
60 0 40 0 60 7 0.0311 0.031
70 0 30 0 60 7 0.0289 0.0283
80 0 20 0 60 7 0.0305 0.0306
60 0 0 40 60 7 0.034 0.0337
70 0 0 30 60 7 0.0315 0.0308
80 0 0 20 60 7 0.0332 0.0329
0 60 40 0 60 7 0.0408 0.0396
0 70 30 0 60 7 0.0377 0.0362
0 80 20 0 60 7 0.0399 0.0397
0 60 0 40 60 7 0.051 0.0503
0 70 0 30 60 7 0.0471 0.0472
0 80 0 20 60 7 0.0498 0.0495
60 0 40 0 80 7 0.0294 0.0295
70 0 30 0 80 7 0.0269 0.0273
80 0 20 0 80 7 0.0285 0.0298
60 0 0 40 80 7 0.0321 0.0323
70 0 0 30 80 7 0.0294 0.0296
80 0 0 20 80 7 0.0311 0.0319
0 60 40 0 80 7 0.0385 0.0384
0 70 30 0 80 7 0.0352 0.0355
0 80 20 0 80 7 0.0373 0.0389
0 60 0 40 80 7 0.0481 0.0483
0 70 0 30 80 7 0.044 0.046
0 80 0 20 80 7 0.0467 0.0487
248 Materials Research

Prediction Total Specific Pore Volume of Geopolymers Produced from Waste Ashes by Fuzzy Logic
The percentage
of fine fly ash in the ashes mixture (fF)
The percentage of coarse fly ash in the ashes mixture (cF)
The percentage of fine rice
husk bark ash in the ashes mixture (fR)
The percentage
of coarse rice husk bark ash
in the ashes mixture (cR)
The temperature of curing (T)
The time of water curing
(t)
Total specific pore volume
values obtained from experiments
(mL.g–1)
Total specific pore volume
values predicted by
FL model (mL.g–1)
60 0 40 0 90 7 0.031 0.0299
70 0 30 0 90 7 0.0283 0.028
80 0 20 0 90 7 0.0299 0.03
60 0 0 40 90 7 0.0339 0.0331
70 0 0 30 90 7 0.0309 0.0306
80 0 0 20 90 7 0.0326 0.0321
0 60 40 0 90 7 0.0405 0.0381
0 70 30 0 90 7 0.037 0.0387
0 80 20 0 90 7 0.0391 0.0393
0 60 0 40 90 7 0.0506 0.0474
0 70 0 30 90 7 0.0462 0.0463
0 80 0 20 90 7 0.0489 0.0487
60 0 40 0 25 28 0.0283 0.028
70 0 30 0 25 28 0.027 0.0274
80 0 20 0 25 28 0.0279 0.0278
60 0 0 40 25 28 0.0311 0.031
70 0 0 30 25 28 0.0297 0.03
80 0 0 20 25 28 0.0307 0.0308
0 60 40 0 25 28 0.0364 0.0348
0 70 30 0 25 28 0.0347 0.0345
0 80 20 0 25 28 0.0359 0.0353
0 60 0 40 25 28 0.0448 0.0437
0 70 0 30 25 28 0.0427 0.0427
0 80 0 20 25 28 0.0442 0.0441
60 0 40 0 40 28 0.0262 0.0263
70 0 30 0 40 28 0.0249 0.0251
80 0 20 0 40 28 0.0259 0.0257
60 0 0 40 40 28 0.0288 0.0287
70 0 0 30 40 28 0.0274 0.0273
80 0 0 20 40 28 0.0285 0.0282
0 60 40 0 40 28 0.0337 0.0338
0 70 30 0 40 28 0.0321 0.0324
0 80 20 0 40 28 0.0333 0.0332
0 60 0 40 40 28 0.0415 0.0421
0 70 0 30 40 28 0.0395 0.0399
0 80 0 20 40 28 0.041 0.0411
60 0 40 0 60 28 0.0249 0.0246
70 0 30 0 60 28 0.0231 0.023
80 0 20 0 60 28 0.0244 0.0244
60 0 0 40 60 28 0.0274 0.0272
70 0 0 30 60 28 0.0254 0.0249
80 0 0 20 60 28 0.0268 0.0264
0 60 40 0 60 28 0.0321 0.0316
0 70 30 0 60 28 0.0297 0.0294
0 80 20 0 60 28 0.0314 0.0316
0 60 0 40 60 28 0.0395 0.0394
0 70 0 30 60 28 0.0365 0.0361
0 80 0 20 60 28 0.0386 0.0386
Table 4. Contiuned...
2012; 15(2) 249
Nazari & Khalaj
The percentage
of fine fly ash in the ashes mixture (fF)
The percentage of coarse fly ash in the ashes mixture (cF)
The percentage of fine rice
husk bark ash in the ashes mixture (fR)
The percentage
of coarse rice husk bark ash
in the ashes mixture (cR)
The temperature of curing (T)
The time of water curing
(t)
Total specific pore volume
values obtained from experiments
(mL.g–1)
Total specific pore volume
values predicted by
FL model (mL.g–1)
60 0 40 0 80 28 0.0235 0.0239
70 0 30 0 80 28 0.0215 0.022
80 0 20 0 80 28 0.0228 0.0229
60 0 0 40 80 28 0.0259 0.0269
70 0 0 30 80 28 0.0237 0.0244
80 0 0 20 80 28 0.0251 0.0252
0 60 40 0 80 28 0.0303 0.0307
0 70 30 0 80 28 0.0277 0.0279
0 80 20 0 80 28 0.0294 0.0308
0 60 0 40 80 28 0.0373 0.0387
0 70 0 30 80 28 0.0341 0.0345
0 80 0 20 80 28 0.0362 0.0376
60 0 40 0 90 28 0.0248 0.0247
70 0 30 0 90 28 0.0226 0.0224
80 0 20 0 90 28 0.0239 0.0221
60 0 0 40 90 28 0.0273 0.0274
70 0 0 30 90 28 0.0249 0.0249
80 0 0 20 90 28 0.0263 0.0249
0 60 40 0 90 28 0.0319 0.0317
0 70 30 0 90 28 0.0291 0.029
0 80 20 0 90 28 0.0308 0.0307
0 60 0 40 90 28 0.0392 0.0392
0 70 0 30 90 28 0.0358 0.0356
0 80 0 20 90 28 0.0379 0.0379
Figure. 5. The correlation of the measured and predicted total specific pore volume values of geopolymers in a) training and b) testing phase for FL model.
Table 4. Contiuned...
The performance of the FL model is shown in Figure 5. The value of R2 is 99.24% for training set and 98.60% for testing set in the FL model. All of R2 values show that the proposed FL model is suitable and can predict the total specific pore volume values very close to the experimental values.
6. ConclusionsFrom the experimental procedure, the following results
were obtained:• The total specific pore volume of the specimens
depends on the particle size distribution pattern of
250 Materials Research
Prediction Total Specific Pore Volume of Geopolymers Produced from Waste Ashes by Fuzzy Logic
the ashes, time of oven curing and the time of room condition curing. The finer the ashes particle size results in the denser and hence the reduced pore volume specimens. On the other hand, oven curing of the specimens at 80 °C was found to be the optimum temperature of curing in geopolymeric specimens;
• Inallmixtures, thespecimenswiththeSiO2/Al
2O
3
ratio equal to 2.99 had the lowest pore volume. On the other hand the lowest pore volume was achieved
for the mixture of fine fly ash to fine rice husk bark ash of 70:30;
• FLcanbeanalternativeapproachfortheevaluationof the effect of seeded mixture of FA and RHBA on total specific pore volume values of geopolymer specimens;
• ThevaluesofR2 showed that FL model is capable to predict suitable results for pore volume values of geopolymer specimens in the studied ranges.
References1. Davidovits J. Inorganic polymeric new materials. Journal
of Thermal Analysis and Calorimetry. 1991; 37:1633-1656. http://dx.doi.org/10.1007/BF01912193
2. Barbosa VFF and MacKenzie KJD. Synthesis and thermal behavior of potassium sialate geopolymers. Materials Letters. 2003; 57:1477-1482. http://dx.doi.org/10.1016/S0167-577X(02)01009-1
3. Duxson P, Provis JL, Lukey GC, Mallicoat SW, Kriven WM and Deventer JSJ. Understanding the relationship between geopolymer composition, microstructure and mechanical properties. Colloids and Surfaces. 2005; 269:47-58. http://dx.doi.org/10.1016/j.colsurfa.2005.06.060
4. Duxson P, Fernandez-Jimenez A, Provis JL, Lukey GC, Palomo A and Van Deventer JSJ. Geopolymer technology: the current state of the art. Journal of Materials Science. 2007; 42:2917-2933. http://dx.doi.org/10.1007/s10853-006-0637-z
5. Panagiotopoulou Ch, Kontori E, Perraki Th and Kakali G. Dissolution of aluminosilicate minerals and by-products in alkaline media. Journal of Materials Science. 2007; 42:2967-2973. http://dx.doi.org/10.1007/s10853-006-0531-8
6. Wongpa J, Kiattikomol K, Jaturapitakkul C and Chindaprasirt P. Compressive strength, modulus of elasticity, and water permeability of inorganic polymer concrete. Materials & Design. 2010; 31:4748-4754. http://dx.doi.org/10.1016/j.matdes.2010.05.012
7. Sata V, Jaturapitakkul C and Kiattikomol K. Influence of pozzolan from various byproduct materials on mechanical properties of high-strength concrete. Construction and Building Materials 2007; 21(7):1589-98. http://dx.doi.org/10.1016/j.conbuildmat.2005.09.011
8. Tangchirapat W, Buranasing R, Jaturapitakkul C and Chindaprasirt P. Influence of rice husk - bark ash on mechanical properties of concrete containing high amount of recycled aggregates. Construction and Building Materials. 2008; 22(8):1812-9. http://dx.doi.org/10.1016/j.conbuildmat.2007.05.004
9. Akkurt S, Tayfur G and Can S. Fuzzy logic model for prediction of cement compressive strength. Cement and Concrete Research. 2004; 34(8):1429-33. http://dx.doi.org/10.1016/j.cemconres.2004.01.020
10. Baykasoglu A, Dereli T and Tanıs S. Prediction of cement strength using soft computing techniques. Cement and Concrete Research. 2004; 34(11):2083-90. http://dx.doi.org/10.1016/j.cemconres.2004.03.028
11. Nazari A and Milani AA. Modeling ductile to brittle transition temperature of functionally graded steels by fuzzy logic. Journal of Materials Science. 2011; 46(18):6007-6017. http://dx.doi.org/10.1007/s10853-011-5563-z
12. Pacheco-Togal F, Castro-Gomes J and Jalali S. Investigation about the effect of aggregates on strength and microstructure of
geopolymeric mine waste mud binders. Cement and Concrete Research. 2007; 37(6):933-41. http://dx.doi.org/10.1016/j.cemconres.2007.02.006
13. Pacheco-Torgal F, Castro-Gomes JP and Jalali S. Studies about mix composition of alkali-activated mortars using waste mud from Panasqueira. In: Proceedings of the Engineering Conference; 2005; Covilha. Covilha: University of Beira Interior; 2005.
14. Bakharev T. Geopolymeric materials prepared using Class F fly ash and elevated temperature curing. Cement and Concrete Research. 2005; 35:1224-1232. http://dx.doi.org/10.1016/j.cemconres.2004.06.031
15. Chindaprasirt P, Chareerat T and Sirivivatnanon V. Workability and strength of coarse high calcium fly ash geopolymer. Cement and Concrete Research. 2007; 29:224-229. http://dx.doi.org/10.1016/j.cemconcomp.2006.11.002
16. Abell AB, Willis KL and Lange DA. Mercury Intrusion Porosimetry and Image nalysis of Cement-Based Materials. Journal of Colloid and Interface Science. 1999; 211:39-44. PMid:9929433. http://dx.doi.org/10.1006/jcis.1998.5986
17. Tanaka K and Kurumisawa K. Development of technique for observing pores in hardened cement paste. Cement and Concrete Research. 32 (2002) 1435-1441. http://dx.doi.org/10.1016/S0008-8846(02)00806-2
18. Fernandez-Jimenez A, Garcia-Lodeiro I and Palomo A. Durability of alkali-activated fly ash cementitious materials. Journal of Materials Science. 2007; 42(9):3055-65. http://dx.doi.org/10.1007/s10853-006-0584-8
19. Van Jaarsveld JGS, Van Deventer JSJ and Lukey GC. The effect of composition and temperature on the properties of fly ash- and kaolinite-based geopolymers. Chemical Engineering Journal. 2002; 89(1-3):63-73. http://dx.doi.org/10.1016/S1385-8947(02)00025-6
20. Naji Givi A, Abdul Rashid S, Aziz FNA and Mohd Salleh MA. Assessment of the effects of rice husk ash particle size on strength, water permeability and workability of binary blended concrete. Construction and Building Materials. 2010; 24(11):2145-2150. http://dx.doi.org/10.1016/j.conbuildmat.2010.04.045
21. Karlsson C, Zanghellini E, Swenson J, Roling B, Bowron DT, Borjesson L. Structure of mixed alkali/alkaline-earth silicate glasses from neutron diffraction and vibrational spectroscopy. Physical Review B. 2005; 72: 064206. http://dx.doi.org/10.1103/PhysRevB.72.064206
22. Rees CA, Provis JL, Lukey GC and Van Deventer JSJ. Attenuated Total Reflectance Fourier Transform Infrared Analysis of Fly Ash Geopolymer Gel Aging. Langmuir. 2007; 23:8170-9.
23. Innocenzi P. Infrared spectroscopy of sol–gel derived silica-based films: a spectra-microstructure overview. Journal of Non-Crystalline Solids. 2003; 316:309. http://dx.doi.org/10.1016/S0022-3093(02)01637-X
2012; 15(2) 251

Nazari & Khalaj
24. Zholobenko VL, Holmes SM, Cundy CS and Dwyer J. Synthesis of MCM-41 materials: an in situ FTIR study. Microporous Materials. 1997; 11:83. http://dx.doi.org/10.1016/S0927-6513(97)00033-3
25. Serra J, Gonzalez P, Liste S, Chiussi S, Leon B, Perez-Amor M et al. Influence of the non-bridging oxygen groups on the bioactivity of silicate glasses. Journal of Materials Science: Materials in Medicine. 2002; 13:1221. PMid:15348669. http://dx.doi.org/10.1023/A:1021174912802
26. Ramezanianpour AA, Sobhani M and Sobhani J. Application of network based neuro-fuzzy system for prediction of the strength of high strength concrete. Amirkabir Journal of Science and Technology. 2004; 5(59-C):78-93.
27. Lotfi Zadeh A. Fuzzy set. Information and Control. 1965; 8:338-53. http://dx.doi.org/10.1016/S0019-9958(65)90241-X
28. Mamdani EH. Application of fuzzy algorithms for control of simple dynamic plants. Proceedings IEEE. 1976; 121(12):1585-8.
29. Guzelbey IH, Cevik A and Erklig A. Prediction of web crippling strength of cold-formed steel sheetings using neural Networks. Journal of Constructional Steel Research. 2006; 62:962-973. http://dx.doi.org/10.1016/j.jcsr.2006.01.008
30. Cevik A and Guzelbey IH. Neural Network Modeling Of Strength Enhancement For Cfrp Confined Concrete Cylinders. Building & Environment. 2008; 43:751-763. http://dx.doi.org/10.1016/j.buildenv.2007.01.036
31. Cevik A and Guzelbey IH. A Soft Computing Based Approach For The Prediction Of Ultimate Strength Of Metal Plates In Compression. Engineering Structures. 2007; 3(29):383-394. http://dx.doi.org/10.1016/j.engstruct.2006.05.005
32. Topcu IB and Sarıdemir M. Prediction of compressive strength of concrete containing fly ash using artificial neural network and fuzzy logic. Computational Materials Science. 2008; 41(3):305-11. http://dx.doi.org/10.1016/j.commatsci.2007.04.009
252 Materials Research