prediction of relative permeability in simple porous media
TRANSCRIPT

PHYSICAL REVIEW A VOLUME 46, NUMBER 4 15 AUGUST 1992
Prediction of relative permeability in simple porous media
Steven Bryant* and Martin BluntBP Research Centre, Chertsey Road, Sunbury-on- Thames, Middlesex TW16 7I.X, United Kingdom
(Received 12 December 1991)
We present a predictive calculation of two-phase relative permeabilities in granular porous media
formed from a dense random packing of equal spheres. The spatial coordinates of every sphere in the
pack have been measured, enabling the microstructure of the medium to be completely determined.From these data we extract a network model that replicates the pore space. By compacting the packingor swelling individual spheres, we may generate model porous media of different porosities whose mi-
crostructure is also completely determined. We simulate both viscous- and capillary-dominated invasion
of a nonwetting fluid into a wetting fluid contained in these media. During invasion we calculate the
average hydraulic conductance of each phase to obtain the relative permeabilities as a function of fluid
saturation. Because the microstructure is known, the calculations do not involve any adjustable parame-
ters or supplementary measurements of pore structure. The computed relative permeabilities are suc-
cessfully compared with experimental values previously measured on sand packs, bead packs, and a sim-
ple sandstone.
PACS number(s): 47.55.Mh, 64.60.Ak
I. INTRODUCTION
Relative permeability and capillary pressure are meso-scopic transport properties that describe the simultane-ous flow of immiscible fluids in porous media. At thepore scale fluids reside in intergranular spaces whose di-mensions in typical sedimentary rocks are on the order oftens of micrometers. The displacement of one fluid byanother is controlled by surface tension, viscous forces,and the geometry of the pore space. The relative hydro-dynamic conductance of each fluid at a given saturationis the relative permeability, while the pressure differencebetween the phases is the capillary pressure. These twofunctions determine the macroscopic fluid flow behaviorin hydrocarbon reservoirs over the scale of centimeters tokilometers.
Computer models using an idealized pore structure anddisplacement mechanisms have been used to model two-phase flow in porous media, starting with the work ofFatt [1]. The void space of the medium is represented asa network of large spaces (pores) connected by thinner re-strictions (throats). By judicious choices for the distribu-tion of pore and throat sizes and the coordination num-ber of the network it is possible to compute relative per-meabilities that are similar to measured values, althoughthere is no independent assessment of whether the modelstructure actually replicates the real structure. Salter andMohanty [2] and Heiba et al. [3] matched numerical rela-tive permeabilities and capillary pressure to experimentson carefully prepared core samples. More recentlyJerauld and Salter [4] have made predictions for the dis-placement behavior in a variety of different conditions.%'hile the microscopic flow processes may be determinedby considering capillary equilibrium or by viewing fluidmotion in two-dimensional etched glass networks (Lenor-mand and co-workers [5,6], Furuberg et al. [7], Diaz,Chatzis, and Dullien [8], Dias and Payatakes [9]), it has
proved much more difficult to construct a reliable three-dimensional representation of a rock from which predic-tions of transport properties may be made. So far thebest attempts have concentrated on predicting single-phase permeability, and include using simple correlationsinvolving a typical pore radius (Katz and Thompson [10],MacGowan [11])and ambitious projects where an expli-cit computer model of the pore space was built from suc-cessive two-dimensional images of a rock sample (Koplik,Lin, and Vermette [12], Yanuka, Dullien, and Elrick[13]).
A random close packing of monodisperse spheres is asimple yet realistic model of an unconsolidated well-
sorted sandstone. Such a packing can be transformedinto a model of a consolidated sandstone by allowing thespheres to swell without moving their centers. This is areasonable approximation of the process of quartz cemen-tation in the Earth's crust. Such cementation coats thegrains with more material, fusing them together andlowering the porosity.
Finney measured the coordinates of a random closepack of 8000 ball bearings [14]. This data permits con-struction of a precise replica of the void space of a realporous medium without the difficulties of serial section-ing. Using the Finney pack as a starting point, Bryantand co-workers [15,16] have predicted single-phase per-meability and capillary pressure for simple rocks ofdifferent porosities. The predictions are in excellentagreement with measurements on Fontainebleau sand-stones and bead and sand packs.
In this paper we will use the Finney pack to predictfrom first principles the drainage relative permeabilitiesfor rnonodisperse granular porous media as a function ofporosity. This is achieved by having a complete descrip-tion of the pore space and a careful representation of thetwo-phase displacement [17]. The predictions closelymatch experimental data. Two-phase flow properties
1992 The American Physical Society
46 PREDICTION OF RELATIVE PERMEABILITY IN SIMPLE. . .
have been genuinely predicted without the use of adjust-able parameters or additional measurements of porestructure.
Predictions of the amount of oil recovered, or the sen-sitivity of the recovery to the injection of displacing gasor water, are crucially dependent on the relative and ab-solute permeability everywhere in the reservoir. Al-though the rock type and fluid properties are likely tochange drastically through the reservoir, the only sam-ples of rock come from drilling wells, which represent atiny fraction of the total volume in a reservoir. Further-more, relative permeability measurements on these sam-ples are diScult and time consuming. To quantify andcontrol uncertainty in recovery calculations, it is neces-sary to have some theoretical understanding of transportproperties. Such understanding would enable us to pre-dict the sensitivity of relative permeability and capillarypressure to geological factors such as porosity, rock type,the degree of compaction, and the nature of the fluids.This work is a preliminary step in this direction. Thoughwe present comparisons with particular sandstone sam-ples, such predictions are not the primary objective ofthis work. (Indeed, given a sandstone sample it is prob-ably more straightforward to measure its relative permea-bility curves than to predict them using either our ap-proach or previously published models. ) A more impor-tant result is that we are now able to quantify the changein the relative permeability for similar but undergroundand unobtainable samples if, for instance, we can estimatethe degree of compaction of cementation. Such estimatescan be derived from models of the geological history ofthe reservoir. Also for a statistical geological map of therock type or absolute permeability, we may supply esti-mates of the corresponding relative permeabilities.
II. MODEL OF SIMPLE GRANULARPOROUS MEDIA
One way to predict transport properties in porousmedia is to use an exact representation of the pore space.A random close packing of equal spheres is a simple butreasonable idealization of an unconsolidated sediment ofwell-sorted quartz grains. Finney [14] constructed an iso-tropic random sphere pack from 17000 precision ballbearings and then painstakingly measured the positionsof approximately 8000 spheres in the center of the pack.From this data we can construct a complete descriptionof the pore space.
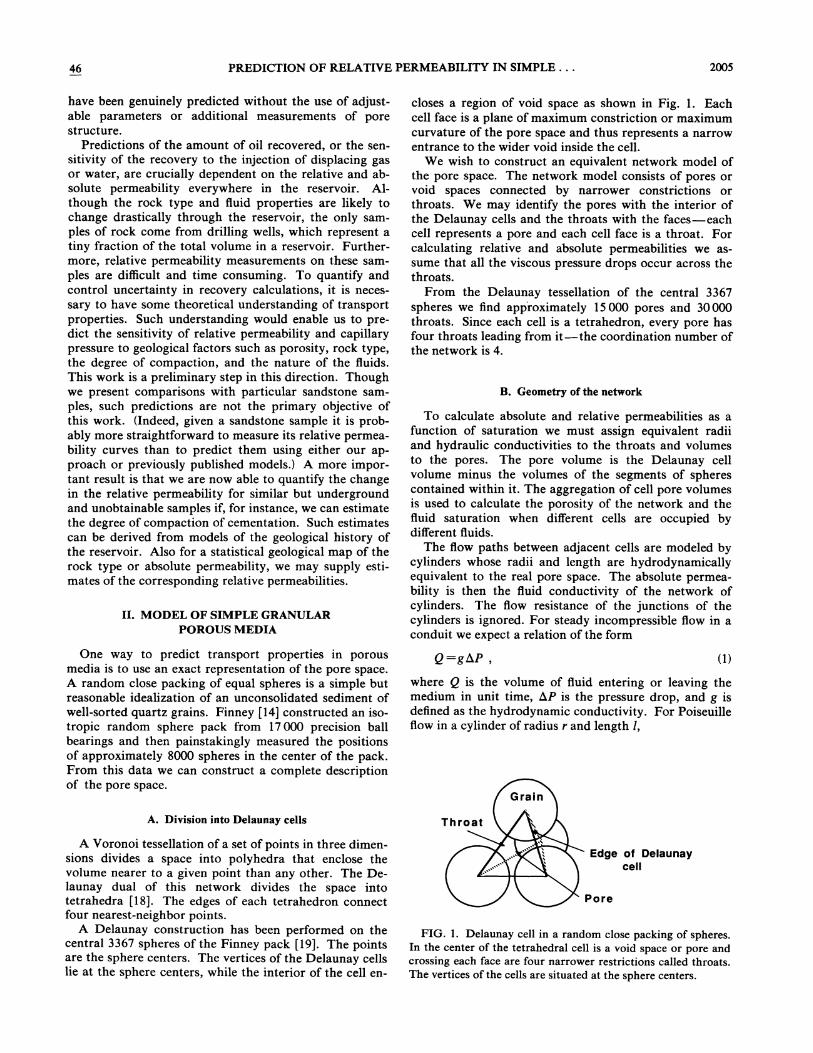
closes a region of void space as shown in Fig. 1. Eachcell face is a plane of maximum constriction or maximumcurvature of the pore space and thus represents a narrowentrance to the wider void inside the cell.
%'e wish to construct an equivalent network model ofthe pore space. The network model consists of pores orvoid spaces connected by narrower constrictions orthroats. We may identify the pores with the interior ofthe Delaunay cells and the throats with the faces —eachcell represents a pore and each cell face is a throat. Forcalculating relative and absolute permeabilities we as-sume that all the viscous pressure drops occur across thethroats.
From the Delaunay tessellation of the central 3367spheres we find approximately 15000 pores and 30000throats. Since each cell is a tetrahedron, every pore hasfour throats leading from it—the coordination number ofthe network is 4.
B. Geometry of the network
To calculate absolute and relative permeabilities as afunction of saturation we must assign equivalent radiiand hydraulic conductivities to the throats and volumesto the pores. The pore volume is the Delaunay cellvolume minus the volumes of the segments of spherescontained within it. The aggregation of cell pore volumesis used to calculate the porosity of the network and thefluid saturation when different cells are occupied bydifferent fluids.
The flow paths between adjacent cells are modeled bycylinders whose radii and length are hydrodynamicallyequivalent to the real pore space. The absolute permea-bility is then the fluid conductivity of the network ofcylinders. The flow resistance of the junctions of thecylinders is ignored. For steady incompressible flow in aconduit we expect a relation of the form
where Q is the volume of fluid entering or leaving themedium in unit time, hP is the pressure drop, and g isdefined as the hydrodynamic conductivity. For Poiseuilleflow in a cylinder of radius r and length I,
A. Division into Delaunay cells
A Voronoi tessellation of a set of points in three dimen-sions divides a space into polyhedra that enclose thevolume nearer to a given point than any other. The De-launay dual of this network divides the space intotetrahedra [18]. The edges of each tetrahedron connectfour nearest-neighbor points.
A Delaunay construction has been performed on thecentral 3367 spheres of the Finney pack [19]. The pointsare the sphere centers. The vertices of the Delaunay cellslie at the sphere centers, while the interior of the cell en-
Edge of Delaunaycell
Pore
FIG. 1. Delaunay cell in a random close packing of spheres.In the center of the tetrahedral cell is a void space or pore andcrossing each face are four narrower restrictions called throats.The vertices of the cells are situated at the sphere centers.

2006 STEVEN BRYANT AND MARTIN BLUNT 46
mr4g=8
(2)
where p, is the fluid viscosity. For each flow path (throat)in our network, we need to find values of r and l that givethe correct conductivity g in Eq. (1).
The throat may be represented by a cylinder of radius
ff which has the same conductivity as the Qow path be-tween adjacent cells. We could solve the Navier-Stokesequation by a finite element technique in the void spaceto find this effective radius. In Ref. [15] an approximatenumerical solution was used to find r, ff in a typical con-duit. The conductivity of the Bow path was found to bedominated by the narrowest constriction along the path,which occurs at the face shared by the cells. As illustrat-ed in Fig. 2, the effective cylinder radius may thus be es-tirnated by r„ the largest circle that can be inscribed inthis cross section. Another estimate is r„ the radius ofthe circle having the same area as the cross section. r,underestimates the conductivity, while r, is an overesti-mate, since for fixed area a circle is the most eScientcross section for Quid fiow. It was found that the averageof r, and r„r,fr= ,'(r, +—r,), gave a good estimate of theeffective radius [15]. This approximation for r,f wasmotivated by a study of the geometry of the porespace —it is not adjusted to fit the experimental measure-ments of permeabi1ity.
The effective fiow path length is defined to be the dis-tance between the centers of the adjoining cells. Thecenter of a cell is taken to be the point equidistant fromthe centers of the four spheres that define the cell. Insome cases the cell center may lie outside the volume en-closed by the cell faces (the pore). For convenience indefining path lengths, such ce11 centers are projected ontothe nearest cell face.
The slow invasion of a nonwetting Quid into a porousmedium is controlled by capillary forces. As we describein more detail in the next section, the invading fiuid isfirst able to enter and fill a pore when the injection pres-sure is sufBcient to overcome the capillary pressure neces-
sary to pass through a throat. This pressure is inverselyproportional to an equivalent capillary radius of thethroat. A good approximation of this radius, due origi-nally to Haines, is the insphere radius of the cell face r,[20].
Thus the network is specified by (i) its topology, that is,which pores are connected by which throats, (ii) theequivalent conductivities g =mr, ff /Spl and insphere radiir, of the throats, and (iii) the volumes of the pores. Allthis information is derived directly from Finney's originalmeasurements of sphere center coordinates in the pack-ing. None of it is adjusted to fit the experimental data.
C. Modeling compaction and cementation
We have shown how to construct the equivalent net-work model for an unconsolidated random sphere pack.We can also construct model rocks of varying porosity bysimulating the effect of processes such as compactionduring burial and cementation [16].
We model a compacted sandstone by moving thecenters of the spheres closer together in one (the vertical)direction. We rescale one of Finney's coordinate axes by
z'=zo+A(z —zo),
where zo is an arbitrary reference value and A, measuresthe degree of compaction. The spheres then inter-penetrate. We assume that in the compaction process thematerial corresponding to the intersecting grains has dis-solved under pressure. This pressure-dissolved materialcan be washed out of the system or reprecipitated, de-pending upon prevailing physical conditions.
At depth within the earth's crust, quartz cement oftenprecipitates on the sand grains of compacted rock toform approximately concentric overgrowths. We modelthis by increasing the radius of the spheres uniformlywithout altering the position of the sphere centers. Thusthe grains will appear to have interpenetrated, though infact a layer of uniform thickness has been deposited onlyupon their exposed surfaces.
The Delaunay tessellation is unchanged for the modelof quartz overgrowth, but a new arrangement of cellsneeds to be constructed for the compacted rocks (becausecompaction moves the sphere centers relative to oneanother). The equivalent hydrodynamic network is con-structed as before. At porosities lower than about 10%some of the cell faces become completely blocked; theirconductivity and effective radius are zero. The unconso-lidated material has a porosity of 36.2%. At a porosityof approximately 3% for both compacted andovergrowth-cemented rock the overall conductivity of therock falls to zero. At this point about half the cell facesare closed and there are no open pathways through thewhole pack [16,21].
FIG. 2. Two definitions of an equivalent throat radius. Oneface of a Delaunay ce11 is shown. r, has the radius of the largestcircle that can fit in the cross section of the void space with thecell edge. r, is the radius of the circle whose area is equal to thevoid area (shaded) ~ A good estimate of the true hydrodynamicradius is r,ff 2 (r +7 ).
III. SINGLE-PHASE FLOW
The calculation of absolute permeability and the com-parison with measured values is described in greater de-tail elsewhere [15,16], but is repeated briefly here forcompleteness.

46 PREDICTION OF RELATIVE PERMEABILITY IN SIMPLE. . . 2007
A. Computing absolute permeability
gQ/ =ok
(4)
where the sum runs over the throats k (k =1 to 4) con-nected to pore i Eq. uation (4) is solved by Gauss-Seideliteration with overrelaxation.
The portion of the Finney pack from which we haveconstructed our network is roughly spherical. It is thusconvenient to impose an approximately spherically sym-metric pressure gradient by fixing the pressure in a spher-ical region at the center of the pack (the inlet) and at theexternal boundary (the outlet). If we define the outletpressure to be zero and the inlet pressure to be unity,then the permeability of the network E is defined by
T
QioiP 1 1
4.
The equivalent network model tells us how to computethe Qow in each cylinder. For the kth cylinderQk=gkbP, ~, where b,P,J. is the pressure difference be-tween the centers of the pores labeled i and j, which areconnected via throat k. Mass conservation at each porerequires
100—OE
tQ 10—LU
KLLICL
0.1—
IR~ 0
Model Prediction
Q„, is the total flow, r;„ is the radius of the inlet, and r,„,is the radius of the outlet boundary.
0.01I
101 ]
15 20
PQROSITY(%)
I
25 30I
35
B. Comparisons with measured values
Permeability has the units of length squared. The cal-culated permeability of the unconsolidated pack is2. 8 X 10 d, where d is the sphere diameter.Refinements to the calculation of r,ff and I give a value of6.8X10 d, which compares well with data collectedfrom random sphere packs composed of beads of differentmaterials and sizes [15]. The refined definitions of r,ff
and f better represent the real flow paths, but their calcu-lation is geometrically somewhat involved. Trials showedthat the refinements do not significantly affect the com-puted relative permeabilities, so for simplicity we will usethe above definitions of r,~ and I for the simulation oftwo-phase flow.
A series of computations described in another paper[16] showed that in well-sorted rocks (i.e., rocks with nar-row grain size distributions) both compaction and over-growth cementation have virtually the same effect on per-meability as a function of porosity. Figure 3 shows thepredicted permeability using the overgrowth model com-pared with a series of 240 measurements on Fontaine-bleau sandstone performed by Bourbie and Zinszner [22].The Fontainebleau sandstone is composed of well-sortedfine sand grains of pure quartz. The only difference be-tween samples is the degree of quartz cementation. Be-cause permeability is a dimensional quantity, a lengthscale must be introduced to compare the predictions withmeasurements. This is taken from an estimate of themean grain size before cementation, which is inferredfrom Sieve analysis and the examination of thin sections.Cathodoluminescence enabled Bryant, King, and Mellor
FIG. 3. Comparison of predicted absolute permeability [inmillidarcy (mD) units] as a function of porosity for mono-disperse consolidated granular rocks with measurements onFontainebleau sandstone [22].
[15] to distinguish the overgrowth from the originalgrains. They found an average grain diameter of approxi-mately 0.4 rnrn.
In Fig. 3 the trend of permeability with porosity, span-ning five orders of magnitude is excellently predicted.This demonstrates that the model of cementation of arandom sphere pack and its network representation ofthe pore space are adequate to predict the average behav-ior in single-phase flow, which implies that the locationand conductivities of the major flow paths have been ac-curately identified.
IV. TWO-PHASE FLOW
We wish to simulate two-phase flow in our modelporous media. We inject a nonwetting Quid into a ma-terial that is originally full of wetting fluid. At low flowrates the fluid motion is controlled by capillary forces.The description of the flow process follows (Ref. [17]).
A. Capillary equilibrium
Consider two immiscible fluids at rest in a porousmedium. If one phase is completely wetting, a thin filmwill coat all the solid surfaces and will coat any small( (1 pm) irregularities on the grains. There will also becurved surfaces between the two fluids with a pressuredrop hP across the interface because of the surface ten-sion

STEVEN BRYANT AND MARTIN BLUNT
1 1EP=y + -—T) fz
(6)
0 is called the contact angle and is the angle at which thefluid interface approaches the solid surface. If 0)90'there is a decrease in pressure across the boundary —thepressure is higher in the nonwetting fluid.
hP is very large for any interface in or across tiny cre-vices in the porous medium, since a radius of curvaturewill be small. Thus, if there are small channels or corru-gations along the pore-grain surface, the wetting phasewill preferentially fill them. The wetting phase is thuslikely to be hydraulically connected throughout the rockalong a network of sub-pore-scale roughness.
Imagine now the rate-controlled injection of a nonwet-ting fluid. The injection pressure is increased slowly.Normally the fluid interfaces in the medium will moveonly a short distance before coming to rest in equilibriumin slightly narrower regions of the pore space than before.Eventually one interface will reach the narrowest part ofa throat before entering a wider pore space. Having filledthe pore, the fluid interface becomes constrained by thenarrow channels leading from this pore, and the injectionpressure rises. The next pore to be filled will be connect-ed to an already filled pore via a restriction with thelowest entry pressure.
At every stage in the displacement the nonwetting fluidadvances through the throat with the lowest entry pres-sure. For our model porous media, this entry pressure iscontrolled by the insphere radius r, of the throat. %e as-sume that the injected fluid is strongly nonwetting andtake I9=180'. Thus
Peritry2y
The lowest entry pressure corresponds to the largest ra-dius r~.
B. Simulating drainage
Initially the network is full of wetting fluid. Nonwet-ting fluid is allowed access to the network through a frac-tion of the faces or throats chosen at random on the outerboundary of the pack. Following Ref. [19], this fractionwas chosen to be about l%%uo in order to minimize finite-size effects. The restricted access applies only to thesimulation of drainage; for calculation of relative per-meabilities no such restrictions are necessary.
The throats and pores are filled one at a time. A throatis considered available if it contains no injected fluid, butis connected to a pore that does. At each stage the avail-able throat with the largest insphere radius r, is filled, to-gether with any empty (filled with wetting fiuid) pore at-tached to it. This is the invasion percolation model of
where y is the surface tension and r, and rz are the prin-cipal radii of curvature of the interface. For a cylindricalthroat of radius r,
2y cosO7
drainage first proposed by Chandler et al. [23] and Wilk-inson and Willemsen [24].
We assume that the wetting fluid is everywhere hy-draulically connected. This means that we ignore trap-ping of the displaced phase —the nonwetting fluid can al-ways enter a throat or pore and the wetting fluid can al-ways escape along a microscopic wetting film. This isalso equivalent to an infinitely compressible displacedphase.
This model has been used to simulate mercury injec-tion [20]. Mercury is nonwetting and is injected into anevacuated rock sample. The entry pressure, Eq. (8) as afunction of the saturation of injected fluid, is called thecapillary pressure. The predicted capillary pressurecurves for rocks of difFerent porosity have been success-fully compared with experimental measurements on Fon-tainebleau sandstone [16]. This paper will concentratesolely on the prediction of relative permeability.
C. Calculating relative permeability
In its most general form a linear relationship betweenflow rate Q and pressure gradient may be written as[25—32]
Q, = —A, „VP,—A, ,2VP2,
Q2 = —A, 22VP2 —
A, 2, VP, . (10)
The mobility tensor A.; may be written as Ek;"J /)M;, where
k; are called the relative permeabilities, which are somefraction of the absolute permeability K. The phase pres-sures P, and Pz differ by the capillary pressure [33]
P„(S)=P~ P, , —
where the labels 1 and 2 refer to the wetting and nonwet-ting fluids, respectively.
In two-phase immiscible flow, the two fluids reside indifferent subsections of the pore space. For flow at aninfinitesimal rate, with no displacement, the fluids movethrough these separate subsections with no interactionbetween the phases. In this case the off-diagonal termsk&z and A, z, are zero and there is simply a hydraulic con-ductance associated with each phase, which is some frac-tion of the single-phase value K. This fraction is calledthe relative permeability k'. k' depends purely on thefluid configuration at a given saturation. For a given typeof displacement k' may be written as a function of one ofthe phase saturations only (normally the wetting phasesaturation S) [25,26]. In general, as demonstrated bymany authors theoretically and experimentally [27—32],this assumption is incorrect and there is a viscous cou-pling between the two phases, which leads to non-negligible off-diagonal terms in the mobility tensor.Viscous coupling is certainly significant in the mobiliza-tion of trapped oil ganglia and for high rate counter-current flows [31],and an assessment of its importance inother situations is a subject of active research. In this pa-per we model quasistatic floods, where the off-diagonalterms in A, ,
" are zero, or (as described later) very high rateflow where &] =Pz and these terms are ill-defined. The

46 PREDICTION OF RELATIVE PERMEABILITY IN SIMPLE. . . 2009
experiments we compare against did not consider them,and assumed implicitly (in common with most of theliterature) that they were zero. Inclusion of viscous cou-pling by postulating off-diagonal terms qualitatively simi-lar to those measured experimentally [31] would havemade our predictions worse in all cases. We considerthat in the systems we analyze here —well-connectedsandstones with no trapping in primary drainage—viscous coupling may be neglected.
To compute the relative permeabilities we need todefine the saturation and hydraulic conductance. Whenthe nonwetting fluid passes through a throat it is assumedto fill completely the pore connected to it except for pen-dular rings of the wetting phase clinging to the narrowcrevice between two spheres, see Fig. 4. We define acapillary pressure drop by P,„„„,Eq. (8), where r, is thelast throat invaded. We then calculate the position ofpendular rings consistent with this capillary pressure, us-ing Eq. (6). The two radii of curvature r, and r2 are theradius from the axis joining the two grains that containthe ring and the radius of curvature of the interface con-necting the two spheres, with a contact angle of 180'.The volume of these rings is used in the calculation ofsaturation. These rings do not intersect and so they donot contribute to the conductivity of the wetting phase.The volume of the nonwetting phase also includes thebulges protruding from each uninvaded face from a porefilled with invading fluid. The radius of curvature of thesurface (assumed to be a segment of a sphere) is foundfrom the capillary pressure.
The computation of the permeability of each phase isidentical to the calculation for single-phase flow exceptthat each phase is considered to occupy a separate sub-network of the pore space. The effective throat radii andlengths are the same. A throat is considered to be openfor flow of the nonwetting phase if it has been invaded.Also, adjacent cells containing nonwetting phase arechecked for faces that have not been invaded accordingto the hemisphere criterion Eq. 8, but would have hadsurfaces protruding from each cell through the plane ofthe face. Such faces were counted open for nonwettingphase flow under the assumption that a saddle surface oflower curvature (and therefore lower free energy) wouldhave spontaneously formed. A throat is open for flow ofthe wetting phase only if it is closed for the nonwetting
Netting phase
FIG. 4. The wetting fluid clings to the grain surfaces in pen-dular rings. The two principal radii of curvature of the ringsare r„as shown, and r2, the radius of curvature out of the planeof the diagram.
phase and connects two pores, neither of which have beeninvaded. Although the wetting phase is assumed to behydraulically connected everywhere along microscalesurface roughness, the contribution to the permeability ofthis flow is negligible —the crevice radii are typically 1
pm, against 10 to 100 pm for the throats, and the con-ductivity is proportional to the channel radius raised tothe fourth power. Special consideration is required forthroats that form the exterior boundary of the network,since these do not terminate in an explicit pore. Todetermine phase conductivities for a boundary throat, wecreate a virtual neighboring pore containing the samephase as the network pore. We then apply the rules givenabove for interior throats.
The relative permeabilities are computed at about tenstages during a displacement. The computation is onlyperformed if the entry pressure has reached a previouslyunattained maximum —thus the simulation records thefluid configuration and conductivities as a function ofstrictly increasing capillary pressure. At extreme satura-tions the subnetwork of the minor phase does not extendto the center of the packing. Hence for relative permea-bility calculations it is convenient to assign a uniformpressure to a central core of the network (typically of ra-dius 2 to 3 sphere diameters) rather than to the centralcell as in single-phase computations. Because the flowGeld is spherical, inhomogeneities in the saturation distri-bution have a disproportionate effect on calculated rela-tive permeabilities. As a result, the global saturation israrely a good indicator of the local phase fraction thatdominates the relative permeabilities. To obtainrepresentative values of saturation at each stage of dis-placement, we average the local saturations over ten con-centric shells of equal thickness.
Performing the simulation in a cuboidal section of theFinney pack, 19X 19X 7 sphere diameters in extent pro-duced almost identical results. The inlet and outlet werethe 19X 19 faces of the cuboid. This linear flow geometryis relatively insensitive to saturation inhomogeneities, andthe result supports the representativeness of the radialaverage saturation described above.
D. Comparison with experiment
Figure 5 shows measured and predicted relative per-meability curves in two unconsolidated well-sorted sys-tems. The data for the first system, obtained at a lowflow rate in a bead pack [34], are typical of similar experi-ments reported by other investigators [35]. The predictedrelative permeabilities were computed as described abovefor the original Finney pack (no compaction or cementa-tion). The predicted nonwetting phase curve is in goodagreement with the experimental data. The wettingphase relative permeability is not such a good match. Itappears that the permeability is overestimated or the wet-ting phase saturation is underestimated. The latter ismore likely. While the wetting phase clinging to smallcrevices in the pore-grain surface may make a tiny contri-bution to the relative permeability, it may add a few per-cent to the saturation. Our calculations ignore thiscorrection, and without some independent knowledge of

2010 STEVEN BRYANT AND MARTIN BLUNT 46
1.0 1.0
0.8
0.6k'
0.6
0 4
0.2 0.2
0.00.0 0.2 0.6 0.8 1.0 0.00.0 0.6 0.8 1.0
FIG 5. Predicted and experimental measurements ofdrainage relative permeability in unconsolidated porous media.The triangles are high flow rate measurements [36], while thecircles and squares are values measured at low flow rates[34,35]. The predicted curves are computed assuming capillarycontrolled displacement (solid line) or a viscous-dominatedflood (dashed line).
FIG. 6. Predicted and experimental measurements of capil-lary controlled drainage relative permeability in sandstone witha porosity of 23.9%. The triangles are measurements on firedBerea sandstone [2,4], which is only 80% quartz and consists ofpolydisperse sand grains. The squares are measurements onMueller sandstone [37], which is 99.9% quartz and more mono-disperse.
the exact structure of the grain surfaces it is impossible toestimate its importance reliably.
The second set of curves comes from an experiment ona sand pack performed at a high rate [36], considerablygreater than normally seen in reservoir displacements.For the fiuid configuration to be controlled by capillaryforces, the capillary number C~, which is the ratio oftypica1 viscous to capillary pressure drops across a throatcontaining a fluid interface, must be much less than 1. Ifwe define
4lpgyr,
(12)
where Q is the volumetric flow rate per unit area of crosssection, then Leverett's experiments [36] were performedat C„=O.1 —1, while the low rate floods [34] hadC„—10 . In a reservoir C~ =10 —10 . As a conse-quence viscous forces were significant in determining thefluid configuration, and the resultant relative permeabili-ties are noticeably different from the values measured atlower rates. (Leverett [36] noted that at lower rates hismeasured relative permeabilities were lower, an observa-tion consistent with our predictions. ) We modeled thephase configurations in this experiment simply by fillingavailable throats at random, with no selection due toeffective radii. This simulates flow at a very high rate(C„~1), where capillary forces are no longer important.The predicted curves are again in good agreement withexperiment, especially the nonwetting phase relative per-meability.
Figure 6 shows low flow rate experimental curves ob-tained from a fired Berea sandstone with a porosity of
23.9% [2,4] and a Mueller sandstone with a porosity of24% [37]. The model porous medium used to sitnulatethese experiments were formed by swelling the spheresuntil a porosity of 24% was reached. The predictedcapillary-controlled relative permeabilities are shown tomatch the Mueller experiment only. The Mueller sand-stone is 99.9% quartz (grains plus cementing material)and is composed of grains of almost equal size; it thusconforms closely to the structure of our model porousmedia. The Berea sandstone, in contrast, is composed ofgrains of various sizes and is only 80% quartz. Theremaining 20% is material that generally does not occuras solid concentric rims on the surfaces of the quartzgrains. Thus the present network model is an inadequaterepresentation of the pore structure of Berea sandstone.However, we expect that the simple model constructionoutlined here can be extended to account for more com-plicated rocks.
V. DISCUSSION
By carefully constructing a network model to representthe pore structure of a class of simple sandstones and bymodeling two-phase flow through the network, we havebeen able to predict relative permeabilities in primarydrainage, which compare well with experimental mea-surernents on monominerallic well-sorted materials. Thiscomparison emphasizes the predictive power of our ap-proach, in contrast to the essentially correlative nature ofmany previous calculations of relative permeability. Thecalculations depend only upon the accurately known mi-crostructure of a real porous medium. Furthermore, the
46 PREDICTION OF RELATIVE PERMEABILITY IN SIMPLE. . . 2011
predictions require no supplementary measurements onsamples, such as capillary pressure as a function of satu-ration or estimates of pore throat size distributions fromthin section images.
The model has already been validated against experi-mental measurements for single-phase flow for rockscomposed of different materials and representing a widerange of porosities, so we know it is able to reproduce themajor flow channels accurately. Also the invasion per-colation model of drainage used to simulate two-phaseflow is well established and has been shown to predict thefluid configuration in experimental network models [38].The nonwetting phase resides in the centers of the poresand the larger throats and we are able to predict its rela-tive permeability reliably. The configuration and flow ofthe wetting fluid is subtly controlled by the exact micro-structure of the pore-grain surface, which we are unableto model precisely. Thus the predictions of the wettingphase relative permeability are less accurate.
It is not just the throat radius and pore volume distri-
butions that influence single- and two-phase flow —thepore-scale correlations in the geometry are alsosignificant. The two biggest throats leading from a poretend to be of the same size, while the smaller throats arerandomly distributed. Using randomized throat radiiand lengths in the calculation of absolute permeability onan unconsolidated sample overestimated the permeabilityby 78% [15]. A similar overestimate in the wetting phaserelative permeability is also seen, although the nonwet-ting phase permeability is unaffected.
This work could be extended to investigate imbibition,the injection of a wetting fluid, and the behavior of morecomplex polydisperse sandstones. More significantly,however, this study is a step toward being able to quanti-fy the sensitivity of relative permeability to rock struc-ture and experimental conditions. For instance, we cannow predict the change in relative permeability withcompaction and cementation and correlate this changewith porosity and absolute permeability, as well as indi-cate the effect of flow rate.
'Present address: BP Chemicals Ltd, P.O. Box 21, Bo'nessRoad, Grangemouth, Stirlingshire FK3 9XH, UnitedKingdom.
[1]I. Fatt, Trans. AIME 207, 144 (1956).[2] S. J. Salter and K. K. Mohanty, in Proceedings of the 57th
Annual Technical Conference of the SPE AIME, New -Or-leans, Publication SPE 11017 (SPE, Richardson, TX,1982).
[3] A. A. Heiba, M. Sahimi, L. E. Scriven, and H. J. Davis,SPE Reservoir Engineering 7, 123 (1992).
[4] G. R. Jerauld and S. J. Salter, Transp. Porous Media 5,103 (1990).
[5] R. Lenormand and C. Zarcone, Transp. Porous Media 4,599 (1989).
[6] R. Lenormand, E. Touboul, and C. Zarcone, J. FluidMech. 189, 165 (1988).
[7] L. Furuberg, J. Feder, A. Aharony, and T. Je(ssang, Phys.Rev. Lett. 61, 2117 (1988).
[8] C. E. Diaz, I. Chatzis, and F. A. L. Dullien, Transp.Porous Media 2, 215 (1987).
[9] M. M. Dias and A. C. Payatakes, J. Fluid Mech. 164, 337(1986).
[10]A. J. Katz and A. H. Thompson, Phys. Rev. B 34, 8179(1986).
[11]D. MacGowan, in Proceedings of the European Conference
of the Mathematics of Oil Production, Cambridge, 1989,edited by P. R. King and S. F. Edwards (Oxford Universi-
ty Press, Cambridge, 1991).[12]J. Koplik, C. Lin, and M. Vermette, J. Appl. Phys. 56,
3127 (1984)~
[13]M. Yanuka, F. Dullien, and D. Elrick, J. Colloid InterfaceSci. 112, 24 (1986).
[14)J. Finney, Ph.D. dissertation, London University, 1968.[15)S. Bryant, P. R. King, and D. Mellor, Transp. Porous
Media (to be published).[16]S. Bryant and C. Cade, in Proceedings of the 3rd European
Conference on the Mathematics of Oil Recovery, edited byM. A. Christie et al. (Delft University Press, Delft, 1992).
[17]M. J.Blunt, M. J. King, and H. Scher (unpublished).
[18]B. Ripley, Spatial Statistics (Wiley, New York, 1981).[19]D. Mellor, Ph. D. dissertation, Open University, 1989.[20] G. Mason and D. Mellor, in Characterization of Porous
Solids II, edited by F. Rodriguez-Reinoso et al. (Elsevier,Amsterdam, 1991).
[21]J. Roberts and L. Schwartz, Phys. Rev. B 31, 5990 (1985).[22] T. Bourbie and B. Zinszner, J. Geophys. Res. 90, 11 524
(1985).[23] R. Chandler, J. Koplik, K. Lerman, and J. F. Willemsen,
J. Fluid Mech. 119,249 (1982).[24] D. Wilkinson and J. F. Willemsen, J. Phys. A 16, 3365
(1983).[25] M. Muskat and M. W. Meres, Physics (N.Y.) 7, 346 (1936).[26] R. D. Wyckoff and H. G. Botset, Physics (N.Y.) 7, 325
(1936).[27] P. G. de Gennes, Physico-Chem. Hydrodyn. 4, 175 (1973).[28] S. Whitaker, Transp. Porous Media 1, 105 (1986).[29) W. Rose, Transp. Porous Media 3, 163 (1988).[30] J. C. Bacri, M. Chaouche, and D. Salin, C. R. Acad. Sci.
311,591 (1990).[31]F. Kalaydjian, Transp. Porous Media 5, 215 (1990).[32] D. Rothman, J. Geophys. Res. 95, 8663 (1990).[33] M. C. Leverett, Trans. AIME 142, 152 (1941).[34] J. Naar, R. Wygal, and J. Henderson, Soc. Pet. Eng. J.
131, 13 (1962).[35] G. C. Topp and E. E. Miller, Soil Sci. Soc. Am. Proc. 30,
156 (1966).[36] M. C. Leverett, Trans. AIME 132, 149 (1939).[37] C. R. Sandberg, L. S. Gournay, and R. F. Sippel, Pet.
Trans. AIME 213, 36 (1958).[38]R. Lenormand and C. Zarcone, Phys. Rev. Lett. 54, 2226
(1985).