predicting valuations of venture capital funded private
TRANSCRIPT

Introduction The accuracy of private, venture capital backed company valuations has been a recent popular topic of discussion. Between Uber’s summer $51B valuation and technology companies like Square falling far short of their previous venture capital valuation during recent IPOs , 1
valuations of private technology companies are quite disputable, even within professional finance circles. Additionally, venture capitalists admit to investing on ‘‘gut feel’’ when presented with a decision to fund a startup , 2
making the practice of valuing startups seem more an art than a science. Further, most valuation data is not publicly available. Although the absolute value of money invested in a given financing round is usually released, it is rarely accompanied by data about the percentage of the company it represents at that time. How then does an external observer who has little to no access to private company financials and business details attempt to value a private company? To estimate valuations of companies, the average technology company enthusiast relies on public indicators to compare companies, hoping that similar companies will yield similar valuations. With large amounts of metadata and computing power, the next obvious step is to employ machine learning methods to predict valuations using data across many private companies drawn from all industries. This allows us to consume and analyze large amounts of data in a short period of time and take into account the larger startup ecosystem. The input to our algorithm is a series of features describing various aspects of the private companies, including funding round data, employee data, location data and date data, described in greater detail in the section on “Feature Extraction and Selection”. We then use a family of linear regressions to relate these features to a company’s most recent valuation, creating a model that is able to estimate the valuation of an input company with reasonable “ballpark” accuracy.
Related Work Most venture capitalists invest manually by analyzing a mixture of quantitative and qualitative features. Recently, however, venture capital firm Correlation Ventures was founded on the basis of statistical analysis of companies. It touts “the world’s most complete database of venture capital financings” and has decided to construct a predictive model model using this data in order to decide what will probably be a winning company. The data includes financing details, investors, board members, executive management, industry, market, business stages, key financing terms and outcomes. However, they do not release what kinds of statistical methods they employ to make predictions. Additionally, as a new firm Correlation Ventures has not yet proved their models yield great returns. A few years earlier prior to the foundation of Correlation Ventures, Gompers, Kovner, Lerner, Scharfstein published a paper in the Journal of Financial Economics studying the link between previously successful entrepreneurs and future success as well as the link between previously unsuccessful entrepreneurs and, well, future failure. They employed logistic regression to predict a company’s success based on features describing its management team, stage and location. This study, however, focuses heavily on one contributing aspect of a company’s success, and chooses to classify success rather than predict a valuation. Bhat and Zaelit also were successful in predicting the success or failure of a company using the random forest algorithm on funding round data. A contributing factor to their successful model was a feature describing the network available to a company. Dixon and Chong later attempted a similar study, but instead decided to rank companies in a particular industry sector. They successfully incorporated a feature describing the prestigiousness of an investor. They used SVMs to classify a company as a future success or failure. There was not much machine learning research about predicting the numerical valuation of venture capital funded company, however, which is the space we decided to fill.
In 2014, about 20% of private technology companies at IPO traded below the value that they last raised money from venture 1
capitalists. (Winkler, R. et al).
Venture capitalists have been shown to be susceptible to “availability bias”, where past successful investments can influence future 2
investment decisions in similar companies. (Zacharakis, A., & Shepherd, D. A.)�1
Predicting Valuations of Venture Capital Funded Private CompaniesStanford University CS229: Machine Learning Fall 2015
Tigran Askaryan and Caroline Frost

Feature Extraction and Selection Gathering valuation data and company metadata was a challenge that a majority of researchers in the discussed related works also faced. We used a mix of quantitative and qualitative data points for a total of 131 features from several databases, including Crunchbase’s Data Hub, DataFox and CBInsights‑ . We were able to 3gather sufficient data on about 400 private, venture capital backed companies for our training examples. Research from Zacharakis and Shepherd shows that leadership experience and experience at previous startups affects investment decisions, so we required data about management/employee backgrounds in addition to typical company and funding rounds data. Since the top quartile venture capital firms experience little turnover‑ , we required data about invested parties 4as well. Our quantitative features were the following: date of valuation, total funding to date, date of first funding, date of last funding, founding year, company headcount, number of Twitter followers, number of funding rounds and estimated monthly web traffic. Being numerical values by default, these were easily incorporated into our statistical methods. Our qualitative features described overall industry, specific market, top investors, top schools attended by management/employees, top previous employers of current management/employees and whether management/employees previously attended a medical, law or business school. These features required processing into quantitative form to be incorporated into our model. Assigning each possible value of a qualitative category a number seemed illogical: for example, in the top schools category, if Stanford is assigned 1 and Harvard is assigned 2, a 1.5 didn’t map to anything in particular. Instead, each value in a qualitative category became its own feature that could take on the value of 0 if the company was not described by that feature and a 1 otherwise. Before running our model, we normalized our feature matrix.
Methods Our first attempt at prediction was linear regression with only our originally quantitative data, using the following well-known hypothesis and cost function:
where x(i) represents the ith training example and y(i) represents the ith accompanying valuation. Minimizing this cost function for the most part resulted in estimates close to the actual valuation for larger companies (approximately unicorn‑ status). For small companies 5with valuations of around $10M and under it performed particularly atrociously. We realized this was because of our cost function: the current function doesn’t treat a deviation of $1M for a $51B company like Uber differently than a deviation of $1M for a $5M company like Plink, even though $1M represents .02% and 20% of each company’s valuation respectively. We decided that we were happy predicting Uber’s valuation at $52B if it meant our algorithm predicted Plink’s valuation at $6M, and that in fact we cared about the deviation between our true and predicted values in percent rather than in absolute terms. This spurred us to change the cost function to minimizing the squared percent difference between the predicted valuation and actual valuation:
Although this cost function solved the previous problem, it introduced a new one: predictions were now, on average, grossly lower than companies’ true valuations. We realized then that this was because the cost function treats an X-times overvaluation of a company and an X-times undervaluation of a company differently. For example: if a company’s given valuation was $1M and it was predicted to be $5M, this would have a cost of 42. If it instead were to be predicted as $.2M, this would have a cost of 0.82. Although these values represent the 5x overvaluation of a $1M company and a 5x undervaluation of a $1M company respectively, the
Web urls of the previously stated sources, respectively: https://data.crunchbase.com, https://app.datafox.co, https://3
stanford.cbinsights.com.
“If your first fund was top quartile, there is a 45% chance your next fund will also be top 25% and a 73% chance it will be top half. A 4
new fund management team has a 16% chance of being in the top quartile…Success in private equity is persistent.” Conor Kehoe, Partner McKinsey & Co. (Hyman et al.)
Unicorn is a term in the venture capital industry which describes a start-up company whose valuation is at least $1B.5
�2

costs are not symmetric. To make the costs associated with a 5x overvaluation and a 5x undervaluation symmetric, we created a new cost function:
According to this cost function, a 5x overestimation and a 5x underestimation both correspond to a cost of:
To correct for negative valuations, we performed a change of variable on theta:
This coerced all predicted valuations to be positive. After minimizing the cost function above, our model achieved an acceptable level of accuracy, as measured by performing k-fold cross validation using k = 10 and computing the empirical residual error on out set of hypothesized valuations. Each hypothesized valuation,
was calculated using a value of 𝛳 determined by regressing on a training set that didn’t include that particular sample or any others in its bucket. The order of the samples was randomized before performing cross validation. We also experimented with values of k besides 10; the resulting residual errors are plotted in figure 1, and demonstrated that k = 10 was a reasonable value to use. Performing 10-fold cross validation using this cost function, we found that 97.9% of resulting valuation estimates were more than 5x larger or smaller than the corresponding true valuations — an improvement over our earlier attempts, for which the corresponding values were 64.4% and 92.5%, respectively, plotted in figure 2.
We believed that the accuracy of our predictions could be improved by weighing companies with similar characteristics more heavily when determining a given company's valuation. This led us to the following weighted version of our previous cost function:
with different weights calculated for each sample according to the formula:
Here, x is the testing example whose valuation is being predicted. The resulting 10-fold cross validated residual error of this method, employed on a training/testing set incorporating all available quantitative and qualitative data, is shown as a function of 𝜏, the bandwidth constant, in figure 3. Using 𝜏 = 3, the value that minimizes residual error, 97.9% of resulting valuation estimates were more than 5x larger or smaller than the corresponding true valuations, and 63.9% of estimates were more than 2x larger or smaller than the corresponding true valuations. These values are identical to the corresponding values prior to implementing a weighted cost function (see figure 2).
�3
Figure 3:
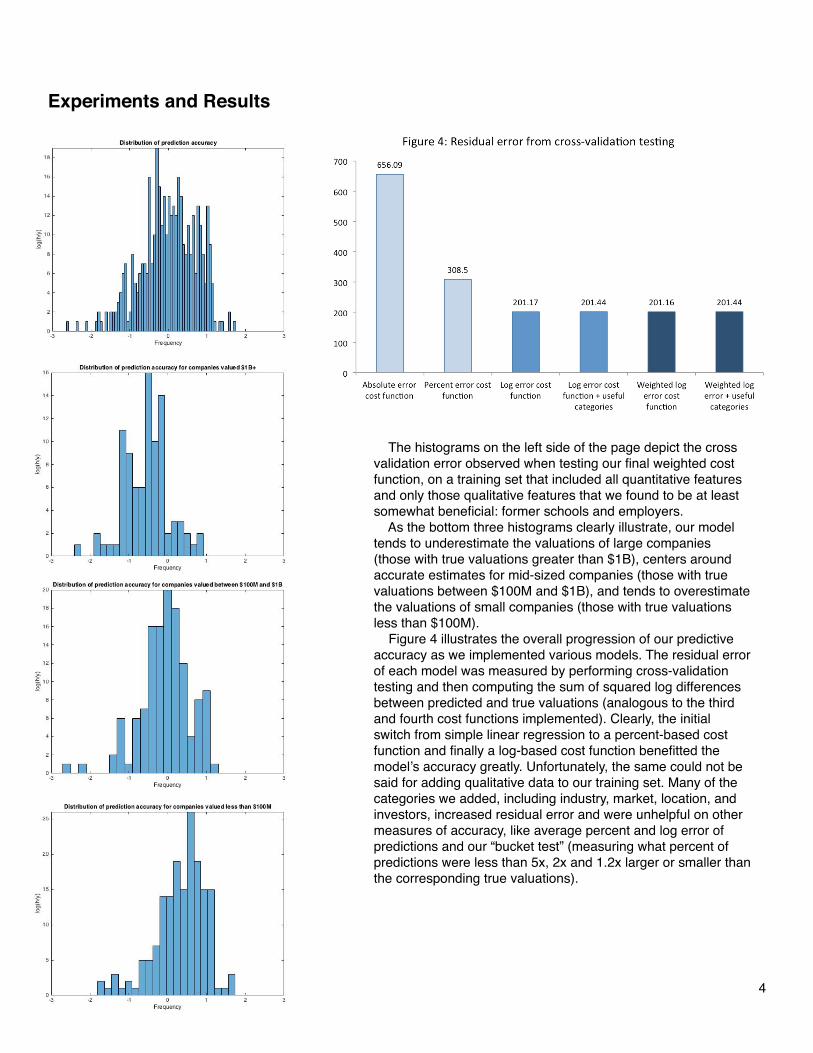
Experiments and Results
�4
The histograms on the left side of the page depict the cross validation error observed when testing our final weighted cost function, on a training set that included all quantitative features and only those qualitative features that we found to be at least somewhat beneficial: former schools and employers. As the bottom three histograms clearly illustrate, our model tends to underestimate the valuations of large companies (those with true valuations greater than $1B), centers around accurate estimates for mid-sized companies (those with true valuations between $100M and $1B), and tends to overestimate the valuations of small companies (those with true valuations less than $100M). Figure 4 illustrates the overall progression of our predictive accuracy as we implemented various models. The residual error of each model was measured by performing cross-validation testing and then computing the sum of squared log differences between predicted and true valuations (analogous to the third and fourth cost functions implemented). Clearly, the initial switch from simple linear regression to a percent-based cost function and finally a log-based cost function benefitted the model’s accuracy greatly. Unfortunately, the same could not be said for adding qualitative data to our training set. Many of the categories we added, including industry, market, location, and investors, increased residual error and were unhelpful on other measures of accuracy, like average percent and log error of predictions and our “bucket test” (measuring what percent of predictions were less than 5x, 2x and 1.2x larger or smaller than the corresponding true valuations).

Conclusion and Future Work
Weighted regression using our cost function was ultimately disappointing and did not substantially reduce the cost compared to an unweighted version of the same cost function. This led us to believe that, using our unweighted cost function, we were already fitting our model as closely to our data as we could. We were also surprised by the effect of including categorical data in our training and testing sets. As we proceeded to add categories like market, alma maters, investors etc., we watched as the addition of certain categories increased the residual error and had little impact on the general accuracy of our predictions. Only three of our categories arguably benefitted the model: alma maters and former employers of a company’s current employees. Adding this data to our most accurate weighted model resulted in the following changes:
More generally, our results indicate that it is difficult to accurately predict company valuations based on publicly available metadeta, but that ballpark predictions can be made. At the very least, using our model to estimate the valuation of a company whose valuation data is not known to you, you can be reasonably confident of being within an order of magnitude of the true valuation. For future work, we'd like to explore gathering more data and performing clustering algorithm. We performed k-means clustering on our current data set, but it categorized Uber as the sole member of a single cluster. More data would make clustering more robust. Post-clustering, it would also be interesting to perform a linear regression on each cluster. Then, for a given testing example, we would find the most similar company and use that cluster's regression to come to a final valuation. We'd like to compare these results with weighted linear regression.
�5
Above: a sample of predicted valuations (red) vs. true valuations (blue) when performing 10-fold cross validation on our final, weighted cost function using a training set in random order, with useful qualitative features included.
Including no categories
Including former schools, employers
Avg. % error 26.6% 27.0%
Avg. (log(h/y))2 0.518 0.519
% of estimates within 2x of true value 63.9% 64.9%
% of estimates within 1.2x of true value 18.3% 19.1%
Bhat, H. S., & Zaelit, D. (2011). Predicting private company exits using qualitative data. In Advances in Knowledge Discovery and Data Mining (pp. 399-410). Springer Berlin Heidelberg.
Chapman, L. (2012, January 13). Correlation Ventures Raises $165M For Data-Focused Investment Approach. Retrieved December 1, 2015, from http://blogs.wsj.com/venturecapital.
Dixon, M., & Chong, J. (2014). A Bayesian approach to ranking private companies based on predictive indicators. AI Communications, 27(2), 173-188.
Gompers, P., Kovner, A., Lerner, J., & Scharfstein, D. (2010). Performance persistence in entrepreneurship. Journal of Financial Economics, 96(1), 18-32.
Hyman, M. H., Fraser-Sampson, G., Rothwell, K., Collins, A., Pardo, R., Shenoy, C., & McCarthy, K. (2005). Beyond the J Curve: Managing a Portfolio of Venture Capital and Private Equity Funds.
Mitsdorffer, R., & Diederich, J. (2008). Prediction of first-day returns of initial public offering in the US stock market using rule extraction from support vector machines. In Rule Extraction from Support Vector Machines (pp. 185-203). Springer Berlin Heidelberg.
Utset, M. A. (2002). Reciprocal Fairness, Strategic Behavior & Venture Survival: A Theory of Venture Capital-Financed Firms. Wisconsin Law Review, 2002(1), 07-29.
Winkler, R. et al. (2015, October 19). Tech Startups Feel an IPO Chill. Retrieved December 1, 2015, from http://www.wsj.com/news/technology.
Zacharakis, A., & Shepherd, D. A. (2005). A non-additive decision-aid for venture capitalists' investment decisions. European Journal of Operational Research, 162(3), 673-689.
�6
References