predicting success in the national football league an in-depth look at the factors that...
TRANSCRIPT

Predicting Success in the National Football League
An in-depth look at the factors that differentiate the winning teams from the
losing teams.
Benjamin RollinsCenter for Quality and Applied StatisticsRochester Institute of [email protected]

NFL background• 32 teams• 2 leagues NFC and AFC• 16 game regular season• 1 bye

Why NFL?• Many theories as to optimal style• The year of the quarterback vs. ground and
pound style• Third-down conversion is always thought to be
important, but is it? Also, is it the most important?

Data• Game by game for seasons 2000 to 2012• 13 variables per team
• Start with analyzing just 2012
Score
Rush Yards Pass Attempts Pass Completions
Pass Yards
Interceptions Fumbles # of Sacks Sack Yards
Penalty Yards First Downs Third Down % Rush Attempts

Third Down Conversion
Percentage for each team.

Pattern?

Game by Game• Summaries of the season data do not fully
capture what we want to show.• Each game is unique• Use difference of variables
http://www.thepigskinreport.com/2013/02/new-york-giants-team-needs-in-the-2013-nfl-draft/

Response of Score• Quantitative• If a team scored more, then it is obvious that they
won.

Is There a Relationship?

Regression• Regression Analysis: A statistical technique for finding the relationship between one or more predictor variables (

Linear ModelCoefficients: Estimate Std. Error t value Pr(>|t|) (Intercept) 0.04956 0.87032 0.057 0.955 ThirdDown% 0.38662 0.04362 8.864 <2e-16 ***---Signif. codes: 0 ‘***’ 0.001 ‘**’ 0.01 ‘*’ 0.05 ‘.’ 0.1 ‘ ’ 1
Residual standard error: 13.88 on 254 degrees of freedomMultiple R-squared: 0.2362, Adjusted R-squared: 0.2332 F-statistic: 78.56 on 1 and 254 DF, p-value: < 2.2e-16
• Multicollinearity?
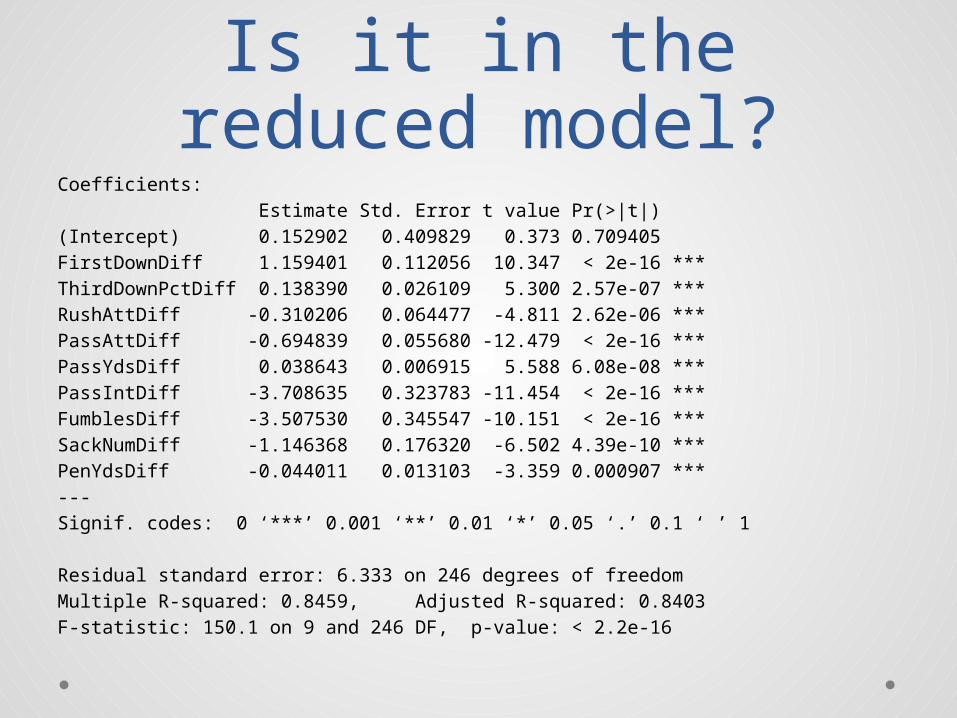
Is it in the reduced model?
Coefficients: Estimate Std. Error t value Pr(>|t|) (Intercept) 0.152902 0.409829 0.373 0.709405 FirstDownDiff 1.159401 0.112056 10.347 < 2e-16 ***ThirdDownPctDiff 0.138390 0.026109 5.300 2.57e-07 ***RushAttDiff -0.310206 0.064477 -4.811 2.62e-06 ***PassAttDiff -0.694839 0.055680 -12.479 < 2e-16 ***PassYdsDiff 0.038643 0.006915 5.588 6.08e-08 ***PassIntDiff -3.708635 0.323783 -11.454 < 2e-16 ***FumblesDiff -3.507530 0.345547 -10.151 < 2e-16 ***SackNumDiff -1.146368 0.176320 -6.502 4.39e-10 ***PenYdsDiff -0.044011 0.013103 -3.359 0.000907 ***---Signif. codes: 0 ‘***’ 0.001 ‘**’ 0.01 ‘*’ 0.05 ‘.’ 0.1 ‘ ’ 1
Residual standard error: 6.333 on 246 degrees of freedomMultiple R-squared: 0.8459, Adjusted R-squared: 0.8403 F-statistic: 150.1 on 9 and 246 DF, p-value: < 2.2e-16

Is there a better response?
• Is score difference our true goal?
http://www.lakehighlandstoday.com/index.php/sports/article2/wildcats_open_district_play_with_big_win/P9/

Response of win• Most games in the NFL are close• The result of the game is much more important• Binary


Logistic RegressionCoefficients: Estimate Std. Error z value Pr(>|z|) (Intercept) -0.237213 0.228341 -1.039 0.298873 FirstDownDiff 0.204891 0.050074 4.092 0.00004280388 ***ThirdDownPctDiff 0.044233 0.014299 3.093 0.001979 ** PassAttDiff -0.199615 0.034758 -5.743 0.00000000931 ***PassYdsDiff 0.016293 0.004253 3.831 0.000127 ***PassIntDiff -0.920326 0.209554 -4.392 0.00001123954 ***FumblesDiff -1.176667 0.280184 -4.200 0.00002673654 ***PenYdsDiff -0.026114 0.007237 -3.609 0.000308 ***---Signif. codes: 0 ‘***’ 0.001 ‘**’ 0.01 ‘*’ 0.05 ‘.’ 0.1 ‘ ’ 1
(Dispersion parameter for binomial family taken to be 1)
Null deviance: 354.88 on 255 degrees of freedomResidual deviance: 129.69 on 248 degrees of freedomAIC: 145.69

Interpretation• For Third down conversion percentage
• Increasing your Third down conversion percentage by 1 results in about a 5% better chance to win the game.

How good is this model?
Full Predicted
Actual Loss Win
Loss 113 16
Win 9 118
Overall error: 0.09766
Test Predicted
Actual Loss Win
Loss 18 4
Win 3 14
Overall error: 0.17949

Tree Analysis

Comparison over the years

Conclusion• Rush attempts is a very important variable in
predicting the result of an NFL game.• Third down conversion percentage is important as
well.• Less mistakes, more carries and a better third
down conversion percentage usually results in a better team.
http://espn.go.com/blog/nflnation/post/_/id/68692/mvp-watch-what-about-adrian-peterson

Questions?
• Data Sourceo http://www.repole.com/sun4cast/data.html
• Benjamin RollinsCenter for Quality and Applied StatisticsRochester Institute of [email protected]