predicting eutrophication status in the north sea ... · predicting eutrophication status in the...

1
Predicting eutrophication status in the North Sea: scenario runs with an ecosystem model Johan van der Molen*, Sonja van Leeuwen and David K. Mills Centre for Environment, Fisheries & Aquaculture Science, Lowestoft www.cefas.co.uk 1. Introduction Recent assessments of the eutrophic status of European shelf-seas have been carried out under the auspices of OSPAR, a Convention for protection of the marine environment of the North-East Atlantic Ocean [1]. OSPAR recommends a substantial reduction (of the order of 50%) in riverine inputs of phosphorus and nitrogen into areas where eutrophication has been diagnosed [2]. To predict the effectiveness of these recommended management measures in alleviating eutrophication, OSPAR initiated a programme of work to be carried out by the Intersessional Correspondence Group on Eutrophication Modelling (ICG-EMO). This international working group aims to advise OSPAR on the potential application of models to diagnose eutrophication, and in particular to model the outcome of its recommended reduction in riverine nutrient inputs (N & P) for adversely affected marine waters [3]. This poster presents results of the General Estuarine Transport Model (GETM) [4] coupled to the Biogeochemical Flux Model (BFM) [5] applied for the second ICG-EMO workshop held in Lowestoft, UK, in September 2007 [3], and for two additional reduction scenarios. *email johan vandermolen@cefas co uk tel +44 (0)1502 527768 © Crown copyr ght 2008 2. Riverine nutrients The annual riverine discharges of fresh water into the North Sea and the English Channel by country (Figure 1A) show the dominance of the Rhine and Meuse that enter the North Sea in The Netherlands (although the respective catchments cover several countries), followed by the German rivers, UK rivers, and French rivers. Substantial inter-annual variability was observed. The corresponding nutrient loads (Figure 1B-D) show noticeable reductions, in particular for ammonium and phosphate for the Netherlands and Germany as a result of measures taken after 1985. t me t me Figure 1 Observed annual river loads discharged into the North Sea and English Channel, by country where the river mouth is located, 1980 to 2002 A fresh water; B ammonium; C phosphate; D total oxidised nitrogen Germany France Ne herlands Un ted K ngdom 1980 1982 1984 1986 19 8 1990 1992 1994 1996 1 98 2000 2002 0 05 1 15 2 25 3 35 4 x 10 4 phospha e annual oads phospha e d C 1980 1982 1 84 1986 1988 1990 1992 1 94 1996 1998 2000 2002 0 1 2 3 4 x 10 5 TOxN annu l loa s TOxN d D 1980 19 2 1984 1986 1988 1 90 1992 1994 1996 998 2000 2002 0 2 4 6 8 10 12 14 x 10 10 di charge annua loads ime d sch rge d A 1980 1 82 1984 1986 1988 1990 1992 1994 1996 1998 2000 2 02 x 10 4 ammonium nnual oads t me ammon um d B Contracting Party TOxN (%) NH4 (%) PO4 (%) (a) Reductions ach eved between 1985 and 2002 Ne her ands 0 70 70 Germany 0 90 50 UK 0 20 0 France 0 10 60 (b) Scenario 1: Reduct ons of 2002 national loads necessary to achieve 50% reduction compared to 1985 Ne her ands 50 0 0 Germany 50 0 0 UK 50 40 50 France 50 40 0 (c) Scenario 2: Reductions of 2002 national loads necessary to achieve 70% reduction compared to 1985 Ne her ands 70 0 0 Germany 70 0 40 UK 70 60 70 France 70 70 20 Table 1 Achieved riverine nutrient reductions into the North Sea and English Channel per country between 1985 and 2002, and definition of reduction scenario's for model runs 5. OSPAR framework The two model reduction scenario's carried out for the ICG-EMO workshop were set up to reduce the nutrient loads in 2002, per country, to 50% and 70% of the 1985 values (Table 1). Two additional reduction scenario's were carried out: i) reducing all riverine nutrients by 100% ('zero loads'), and ii) reducing all UK riverine nutrients by 100% while keeping continental loads at 2002 levels. In these latter scenarios, all nutrients of natural origin were also removed. 4. Model results References [1] OSPAR publications 140/2001 189/2003 (to appear)/2008 see www ospar org [2] PARCOM Recommendation 88/2 see www ospar org/v ospar/strategy asp?v0=8&lang=1 [3] ICG EMO 2007 Workshop Users Guide Data Description and Report see www cefas co uk/eutmod [4] www getm eu [5] www bfm cmcc it The work was funded by Defra under project code E2207 (Modelling the Impact of UK Nutrient Inputs on other Member State Sea Areas) Atmospheric forcing was k ndly provided by ECMWF UK r verine discharge data were obtained from the National River Flow Archive UK riverine nutrient data were obtained from the UK Environment Agency and the Scottish Environmental Protection Agency German and Dutch r verine runoff and nutrient data were kindly suppl ed by Dr H J Lenhart Institut für Meereskunde Hamburg French riverine data was obtained from the Agency de l'eau Artois Picardie and Agence de l'eau Loire Bretagne and Agence de l'eau Seine Normandie (www eau seine normandie fr) through IFREMER Brest Norwegian water quality data was supplied by the Inst tute for Marine Research Bergen Oceanic nutrient boundary conditions were supplied by the Proudman Oceanographic Laboratory (POL) EMEP kindly contributed atmospheric nutrient deposition data wh ch were used by the POL model Acknowledgements 6. Assessment of model results using OSPAR framework The results of applying the OSPAR framework to the model outcome (Figure 4) shows a strong decrease of mean winter nutrient concentrations in coastal areas, and an intermediate decrease in offshore areas. Most of the decrease in winter concentrations was achieved with the 50% reduction scenario: further reductions had a relatively small effect. Mean summer chlorophyll concentrations did not change much in response to the nutrient reductions. Maximum summer chlorophyll concentrations showed an intermediate decrease in coastal areas, and small decreases in offshore areas. Annual near-bottom minimum oxygen concentrations showed only a small increase, with the largest response in summer-stratified areas. For all target areas other than UK-C1, there was a small change in concentrations in response to a unilateral reduction of UK riverine loads. 6 4 2 0 2 4 6 8 10 12 48 50 52 54 56 58 60 UKC1 UKC2 UKC3 UKC4 UKC5 UKC6 UKO UKO2 UKO3 UKO4 UKO5 N NLC2 NLC3 NLO1 NLO2 NLO3 GC1 GO1 GO2 GO3 UKC7 UKC8 UKC9 FC1 FC2 FO1 BC1 BO1 DC1 DC2 DO1 DO2 NO1 NO2 Target areas G O2 G C1 UK C1 NL O2 NL C2 NL C3 B C1 B O1 F C2 F O1 0 5 10 15 20 25 30 C [ mM ] DIN DIP G O2 G C1 UK C1 NL O2 NL C2 NL C3 B C1 B O1 F C2 F O1 0 02 04 06 08 1 12 C [ m M ] G O2 G C1 UK C1 NL O2 NL C2 NL C3 B C1 B O1 F C2 F O1 0 2 4 6 8 10 12 14 16 C [ m g/l ] Chla mean G O2 G C1 UK C1 NL O2 NL C2 NL C3 B C1 B O1 F C2 F O1 0 10 20 30 40 [ - ] N/P G O2 G C1 UK C1 NL O2 NL C2 NL C3 B C1 B O1 F C2 F O1 0 1 2 3 4 5 6 7 C [ mg l ] Oxygen m n Figure 3 Target areas for the OSPAR Common Procedure assessment (blue) Figure 4 Assessment results per OSPAR assessment variable and per target area Black lines are the threshold values Un circled dots represent the reference run Circled dots represent the 50%, 70% and 100% reduction scenarios Black dots represent the UK 'rivers off' scenario Error bars give the standard deviation of the model results within the target area and assessment period Figure 2 Model results for OSPAR assessment variables for 2002 for each of the reduction scenario's (rows) Nutrients (columns 1 3) were taken at 2 m depth, and averaged and over January and February Mean chlorophyll (column 4) was taken at 2 m depth and averaged over March to October Maximum chlorophyll (column 2) was taken at 5 m depth, and taken from the months March to October Minimum oxygen (column 6) was taken at 1 m above the sea bed from the full year N/P [ ] 50% reduction 70% reduction 100% reduction Reference UK rivers off 0 25 5 75 10 12 5 15 Reference 50% reduction 70% reduction 100% reduction UK rivers off 0 4 16 8 32 12 4816 64 20 8 24 96 Reference 50% reduction 70% reduction 100% reduction UK rivers off 0 01 02 03 04 05 06 Reference 50% reduction 70% reduction 100% reduction UK rivers off 0 0 25 1 4 16 0 0 25 1 4 16 0 0 25 1 4 16 0 0 25 1 4 16 0 0 25 1 4 16 0 0 25 1 4 16 Reference 50% reduction 70% reduction 100% reduction UK rivers off 1 3 5 7 9 11 Reference 50% reduction 70% reduction 100% reduction UK rivers off The OSPAR Common Procedure (CP) is used to assess and classify the eutrophication status of marine waters and was applied to the model results for several target areas (Figure 3). The CP uses a framework of indicators (assessment variables) and thresholds to diagnose eutrophication and to classify water bodies. Reference 50% 70% 100% UK off 7. Conclusions 3. Riverine reduction scenario’s DIP [μM] mean Chl [μg l ] 1 maximum Chl [μg l ] 1 minimum O [mg l ] 2 1 G O2 G C1 UK C1 NL O2 NL C2 NL C3 B C1 B O1 F C2 F O1 0 5 10 15 20 Chla max C [ m g/l ] DIN [μM] 1. 50% Reductions in phosphorus and nitrogen loads were mostly sufficient to reduce the levels of the assessment variables beneath the threshold value (above the threshold for oxygen), 2. Reductions of nutrient loads that exceeded 50% had a minor additional effect on the eutrophication assessment variables, 3. Maximum chlorophyll concentration exceeded the threshold value in many target areas, even for zero nutrient loads, 4. The scenario with unilateral reductions in nutrient loads by the UK did not lead to much improvement in the values of assessment variables for most target areas (in comparison to threshold values).

Upload: duongkien

Post on 05-Oct-2018

223 views

Category:

Documents


0 download

TRANSCRIPT

Predicting eutrophication status in the North Sea:

scenario runs with an ecosystem model Johan van der Molen*, Sonja van Leeuwen and David K. Mills

Centre for Environment, Fisheries & Aquaculture Science, Lowestoft

www.cefas.co.uk

1. Introduction

Recent assessments of the eutrophic status of European shelf-seas have been carried out under the auspices of OSPAR, a Convention for protection of the marine environment of the North-East Atlantic Ocean [1]. OSPARrecommends a substantial reduction (of the order of 50%) in riverine inputs of phosphorus and nitrogen into areas where eutrophication has been diagnosed [2].

To predict the effectiveness of these recommended management measures in alleviating eutrophication, OSPAR initiated a programme of work to be carried out by the Intersessional Correspondence Group onEutrophication Modelling (ICG-EMO). This international working group aims to advise OSPAR on the potential application of models to diagnose eutrophication, and in particular to model the outcome of its recommendedreduction in riverine nutrient inputs (N & P) for adversely affected marine waters [3].

This poster presents results of the General Estuarine Transport Model (GETM) [4] coupled to the Biogeochemical Flux Model (BFM) [5] applied for the second ICG-EMO workshop held in Lowestoft, UK, in September 2007[3], and for two additional reduction scenarios.

*email johan vandermolen@cefas co uk tel +44 (0)1502 527768

© Crown copyr ght 2008

2. Riverine nutrients

The annual riverine discharges of fresh water into the North Sea andthe English Channel by country (Figure 1A) show the dominance ofthe Rhine and Meuse that enter the North Sea in The Netherlands(although the respective catchments cover several countries),followed by the German rivers, UK rivers, and French rivers.Substantial inter-annual variability was observed. Thecorresponding nutrient loads (Figure 1B-D) show noticeablereductions, in particular for ammonium and phosphate for theNetherlands and Germany as a result ofmeasures taken after 1985.

t me t me

Figure 1 Observed annual river loads discharged into the North Sea and EnglishChannel, by country where the river mouth is located, 1980 to 2002A fresh water; B ammonium; C phosphate; D total oxidised nitrogen

Germany France Ne herlands Un ted K ngdom

1980 1982 1984 1986 19 8 1990 1992 1994 1996 1 98 2000 20020

0 5

1

1 5

2

2 5

3

3 5

4x 10

4 phospha e annual oads

ph

osp

ha

e

d

C

1980 1982 1 84 1986 1988 1990 1992 1 94 1996 1998 2000 20020

1

2

3

4

x 105 TOxN annu l loa s

TO

xN

d

D

1980 19 2 1984 1986 1988 1 90 1992 1994 1996 998 2000 20020

2

4

6

8

10

12

14x 10

10 di charge annua loads

ime

dsch

rge

d

A

1980 1 82 1984 1986 1988 1990 1992 1994 1996 1998 2000 2 02

x 104 ammonium nnual oads

t me

am

mon

um

d

B

Contracting Party TOxN (%) NH4 (%) PO4 (%)

(a) Reductions ach eved between 1985 and 2002

Ne her ands 0 70 70

Germany 0 90 50

UK 0 20 0

France 0 10 60

(b) Scenario 1: Reduct ons of 2002 national loads necessary to achieve 50% reduction compared to 1985

Ne her ands 50 0 0

Germany 50 0 0

UK 50 40 50

France 50 40 0

(c) Scenario 2: Reductions of 2002 national loads necessary to achieve 70% reduction compared to 1985

Ne her ands 70 0 0

Germany 70 0 40

UK 70 60 70

France 70 70 20

Table 1 Achieved riverine nutrient reductions into the North Sea and English Channel percountry between 1985 and 2002, and definition of reduction scenario's for model runs

5. OSPAR framework

The two model reduction scenario's carried out for the ICG-EMOworkshop were set up to reduce the nutrient loads in 2002, percountry, to 50% and 70% of the 1985 values (Table 1). Twoadditional reduction scenario's were carried out: i) reducing allriverine nutrients by 100% ('zero loads'), and ii) reducing all UKriverine nutrients by 100% while keeping continental loads at2002 levels. In these latter scenarios, all nutrients of natural originwere also removed.
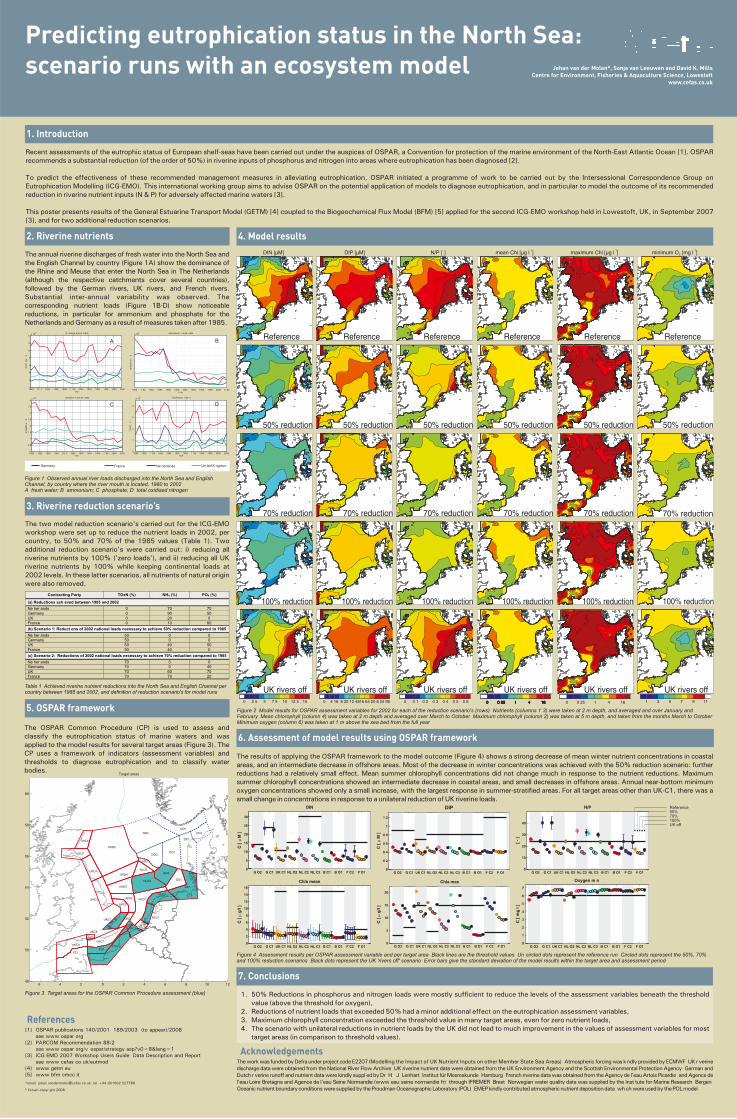
4. Model results

References[1] OSPAR publications 140/2001 189/2003 (to appear)/2008

see www ospar org[2] PARCOM Recommendation 88/2

see www ospar org/v ospar/strategy asp?v0=8&lang=1[3] ICG EMO 2007 Workshop Users Guide Data Description and Report

see www cefas co uk/eutmod[4] www getm eu[5] www bfm cmcc it

Theworkwas fundedbyDefraunderprojectcodeE2207(Modelling the Impact of UK Nutrient Inputs on other Member State Sea Areas) Atmospheric forcingwaskndlyprovidedbyECMWF UKrverinedischarge data were obtained from the National River Flow Archive UK riverine nutrient data were obtained from the UK Environment Agency and the Scottish Environmental Protection Agency German andDutch r verine runoff andnutrient datawerekindly suppl edbyDr H J Lenhart Institut fürMeereskunde Hamburg French riverinedatawasobtained fromtheAgencyde l'eauArtois Picardie andAgencedel'eau Loire Bretagne and Agence de l'eau Seine Normandie (www eau seine normandie fr) through IFREMER Brest Norwegian water quality data was supplied by the Inst tute for Marine Research BergenOceanicnutrientboundaryconditionsweresuppliedbytheProudmanOceanographicLaboratory (POL) EMEPkindlycontributedatmosphericnutrientdepositiondata whchwereusedbythePOLmodel

Acknowledgements

6. Assessment of model results using OSPAR framework

The results of applying the OSPAR framework to the model outcome (Figure 4) shows a strong decrease of mean winter nutrient concentrations in coastalareas, and an intermediate decrease in offshore areas. Most of the decrease in winter concentrations was achieved with the 50% reduction scenario: furtherreductions had a relatively small effect. Mean summer chlorophyll concentrations did not change much in response to the nutrient reductions. Maximumsummer chlorophyll concentrations showed an intermediate decrease in coastal areas, and small decreases in offshore areas. Annual near-bottom minimumoxygen concentrations showed only a small increase, with the largest response in summer-stratified areas. For all target areas other than UK-C1, there was asmall change in concentrations in response to a unilateral reduction ofUK riverine loads.

6 4 2 0 2 4 6 8 10 1248

50

52

54

56

58

60

UKC1

UKC2

UKC3

UKC4

UKC5

UKC6

UKO

UKO2

UKO3

UKO4

UKO5

N

NLC2

NLC3

NLO1

NLO2

NLO3

GC1

GO1

GO2

GO3

UKC7

UKC8

UKC9

FC1

FC2FO1

BC1BO1

DC1

DC2

DO1DO2

NO1

NO2

Target areas

G O2 G C1 UK C1 NL O2 NL C2 NL C3 B C1 B O1 F C2 F O10

5

10

15

20

25

30

C [

�M

]

DIN DIP

G O2 G C1 UK C1 NL O2 NL C2 NL C3 B C1 B O1 F C2 F O10

0 2

0 4

0 6

0 8

1

1 2

C [

�M

]

G O2 G C1 UK C1 NL O2 NL C2 NL C3 B C1 B O1 F C2 F O10

2

4

6

8

10

12

14

16

C [

�g

/l ]

Chla mean

G O2 G C1 UK C1 NL O2 NL C2 NL C3 B C1 B O1 F C2 F O10

10

20

30

40

[ -

]

N/P

G O2 G C1 UK C1 NL O2 NL C2 NL C3 B C1 B O1 F C2 F O10

1

2

3

4

5

6

7

C [

mg

l ]

Oxygen m n

Figure 3 Target areas for the OSPAR Common Procedure assessment (blue)

Figure 4 Assessment results per OSPAR assessment variable and per target area Black lines are the threshold values Un circled dots represent the reference run Circled dots represent the 50%, 70%and 100% reduction scenarios Black dots represent the UK 'rivers off' scenario Error bars give the standard deviation of the model results within the target area and assessment period

Figure 2 Model results for OSPAR assessment variables for 2002 for each of the reduction scenario's (rows) Nutrients (columns 1 3) were taken at 2 m depth, and averaged and over January andFebruary Mean chlorophyll (column 4) was taken at 2 m depth and averaged over March to October Maximum chlorophyll (column 2) was taken at 5 m depth, and taken from the months March to OctoberMinimum oxygen (column 6) was taken at 1 m above the sea bed from the full year

N/P [ ]

50% reduction

70% reduction

100% reduction

Reference

UK rivers off0 2 5 5 7 5 10 12 5 15

Reference

50% reduction

70% reduction

100% reduction

UK rivers off0 4 16 8 32 12 4816 64 20 8 24 96

Reference

50% reduction

70% reduction

100% reduction

UK rivers off0 0 1 0 2 0 3 0 4 0 5 0 6

Reference

50% reduction

70% reduction

100% reduction

UK rivers off0 0 25 1 4 160 0 25 1 4 160 0 25 1 4 160 0 25 1 4 160 0 25 1 4 16 0 0 25 1 4 16

Reference

50% reduction

70% reduction

100% reduction

UK rivers off1 3 5 7 9 11

Reference

50% reduction

70% reduction

100% reduction

UK rivers off

The OSPAR Common Procedure (CP) is used to assess andclassify the eutrophication status of marine waters and wasapplied to the model results for several target areas (Figure 3). TheCP uses a framework of indicators (assessment variables) andthresholds to diagnose eutrophication and to classify waterbodies.

Reference50%70%100%UK off

7. Conclusions

3. Riverine reduction scenario’s

DIP [μM] mean Chl [μg l ]1 maximum Chl [μg l ]1 minimum O [mg l ]21

G O2 G C1 UK C1 NL O2 NL C2 NL C3 B C1 B O1 F C2 F O10

5

10

15

20

Chla max

C [

�g

/l ]

DIN [μM]

1. 50% Reductions in phosphorus and nitrogen loads were mostly sufficient to reduce the levels of the assessment variables beneath the thresholdvalue (above the threshold for oxygen),

2. Reductions of nutrient loads that exceeded 50% had a minor additional effect on the eutrophication assessment variables,3. Maximum chlorophyll concentration exceeded the threshold value in many target areas, even for zero nutrient loads,4. The scenario with unilateral reductions in nutrient loads by the UK did not lead to much improvement in the values of assessment variables for most

target areas (in comparison to threshold values).