integrated report on eutrophication assessment in selected sea areas … · integrated report on...
TRANSCRIPT
NOWPAP CEARACNorthwest Pacific Action PlanSpecial Monitoring and Coastal Environmental Assessment Regional Activity Centre
5-5 Ushijimashin-machi, Toyama City, Toyama 930-0856, JapanTel: +81-76-445-1571, Fax: +81-76-445-1581Email: [email protected]: http://cearac.nowpap.org/
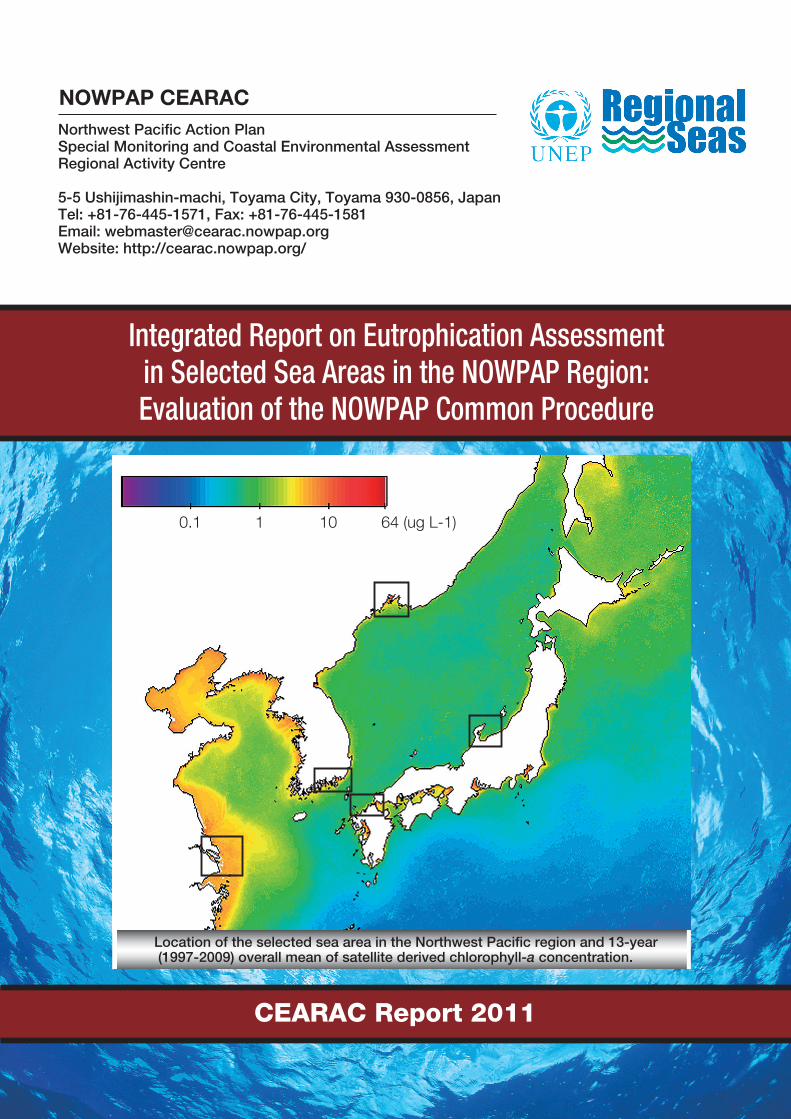
Integrated Report on Eutrophication Assessmentin Selected Sea Areas in the NOWPAP Region:Evaluation of the NOWPAP Common Procedure
CEARAC Report 2011
0.1 1 10 64 (ug L-1)
Location of the selected sea area in the Northwest Pacific region and 13-year (1997-2009) overall mean of satellite derived chlorophyll-a concentration.
published in 2011
by the NOWPAP Special Monitoring and Coastal Environmental Assessment
Regional Activity Centre (NOWPAP CEARAC)
established at the Northwest Pacific Region Environmental Cooperation Center (NPEC)
5-5 Ushijimashin-machi, Toyama City, Toyama 930-0856, Japan
Tel: +81-76-445-1571, Fax: +81-76-445-1581
E-mail: [email protected]
Website: http://cearac.nowpap.org/
Copyright© NOWPAP CEARAC 2011
For bibliographical purposes, this document may be cited as: NOWPAP CEARAC 2011: Integrated Report on Eutrophication Assessment
in Selected Sea Areas in the NOWPAP Region: Evaluation of the NOWPAP Common Procedure
ISBN 978-4-9902809-5-6
CEARAC Focal Points
Ms. Guihua DONG
Senior Engineer
Ecological Environmental Monitoring Department,
China National Environmental Monitoring Center,
China
Mr. Junlong LI
Engineer
Marine Monitoring Department, China National
Environmental Monitoring Center, China
Mr. Koichi MIYAMOTO
Deputy Director
Office of Marine Environment, Water Environment
Division, Environmental Management Bureau,
Ministry of the Environment, Japan
Dr. Yasuwo FUKUYO
Professor
Director of Asian Natural Environmental Science
Center,
The University of Tokyo, Japan
Dr. Joji ISHIZAKA
Professor
Hydrospheric Atomospheric Research Center,
Nagoya University, Japan
Dr. Changkyu LEE
Senior Scientist
Southeast Sea Fisheries Research Institute,
National Fisheries Research and Development
Institute, Korea
Dr. Leonid MITNIK
Head of Department
Satellite Oceanography, V.I. II’ichev Pacific
Oceanological Institute, Far Eastern Branch of the
Russian Academy of Sciences, Russia
Dr. Vladimir SHULKIN
Head of Laboratory
Laboratory of Geochemistry, Pacific Geographical
Institute, Far Eastern Branch of the Russian
Academy of Sciences, Russia
Cover image
Image was created by compositing 13-year (1997-2009) of time series satellite derived chlorophyll-a
concentration observed by three different ocean color sensors, OCTS of JAXA, NASA’s SeaWiFS and MODIS on board Aqua. Annex C of this report explains possible use of this image to preliminarily assess the eutrophication status in each selected sea area.
Experts of Case Studies on Eutrophication
Assessment in Each Selected Sea Area
Dr. Zhiming YU
Professor
Chinese Academy of Science
Institute of Oceanology, China
Dr. Chao CHAI
Associate Professor
Chinese Academy of Science
Institute of Oceanology, China
Mr. Ryo TSUJIMOTO
Senior Researcher
Research & Study Department
Northwest Pacific Region Environmental
Cooperation Center, Japan
Mr. Genki TERAUCHI
Senior Researcher
Research & Study Department
Northwest Pacific Region Environmental
Cooperation Center, Japan
Dr. Youngtae PARK
Scientist
Southeast Sea Fisheries Research Institute,
National Fisheries Research and Development
Institute, Korea
Dr. Pavel TISHCHENKO
Head of Hydrochemistry Loboratory,
Department of the Ocean Geochemistry and
Ecology, V.I. II’ichev Pacific Oceanological Institute,
Far Eastern Branch of the Russian Academy of
Sciences, Russia
Dr. Vladimir ZVALINSKY
Leader Scientist of Hydrochemistry Loboratory,
Department of the Ocean Geochemistry and
Ecology, V.I. II’ichev Pacific Oceanological Institute,
Far Eastern Branch of the Russian Academy of
Sciences, Russia
Special Advisor
Dr. Maria LAAMANEN
Professional Secretary
Helsinki Commission (HELCOM)
Secretariat
Special Monitoring & Coastal Environmental
Assessment Regional Activity Centre (CEARAC)
- 1 -
Preface The Northwest Pacific region includes parts of northeast China, Japan, Korea and southeast Russia. It is one of
the most densely populated areas in the world, and its coastal systems are subject to significant human-induced nutrient modifications. A large number of red tides and hypoxic conditions have been reported in the coastal waters, possibly resulting from anthropogenic activities, such as the use of chemical fertilizers and the discharge of sewage. Eutrophication is an emerging environmental problem in the region. Although there is no international legislation addressing these issues, the Northwest Pacific Action Plan (NOWPAP), under the United Nations Environment Programme (UNEP), was established by China, Japan, Korea and Russia in 1994 with focus on the conservation of the marine and coastal environment in the region. Within the NOWPAP framework, the Special Monitoring and Coastal Environmental Assessment Regional Activity Centre (CEARAC) developed the NOWPAP Common Procedure, a methodology for the assessment of eutrophication status including the evaluation of land-based sources of nutrients in the NOWPAP region (NOWPAP CEARAC, 2009). To apply and evaluate the suitability of the NOWPAP Common Procedure, member states conducted eutrophication case studies in selected sea areas of each member state based on that methodology. These case studies were included in the CEARAC work plan and approved at the 14th NOWPAP Intergovernmental Meeting in Toyama Japan in 2009.
This report compiles the results of these case studies. The studies have indirectly resulted in an interim classification of the eutrophication status in the selected sea areas, but should not be interpreted as a NOWPAP eutrophication assessment authorized by the NOWPAP member states, their governing provinces, prefectures or cities. Nevertheless, we hope that this report will provide a basis for discussions that will lead to the development of a unified approach to eutrophication assessment that can be used to determine the eutrophication status of the entire NOWPAP sea area and contribute to the improvement of water quality in coastal and open sea areas in the region.
The CEARAC Secretariat would like to thank the CEARAC Focal Points and the experts of case studies on
eutrophication assessment in each selected sea area and Dr. Maria LAAMANEN of Helsinki Commission for their great contributions to publication of this report.
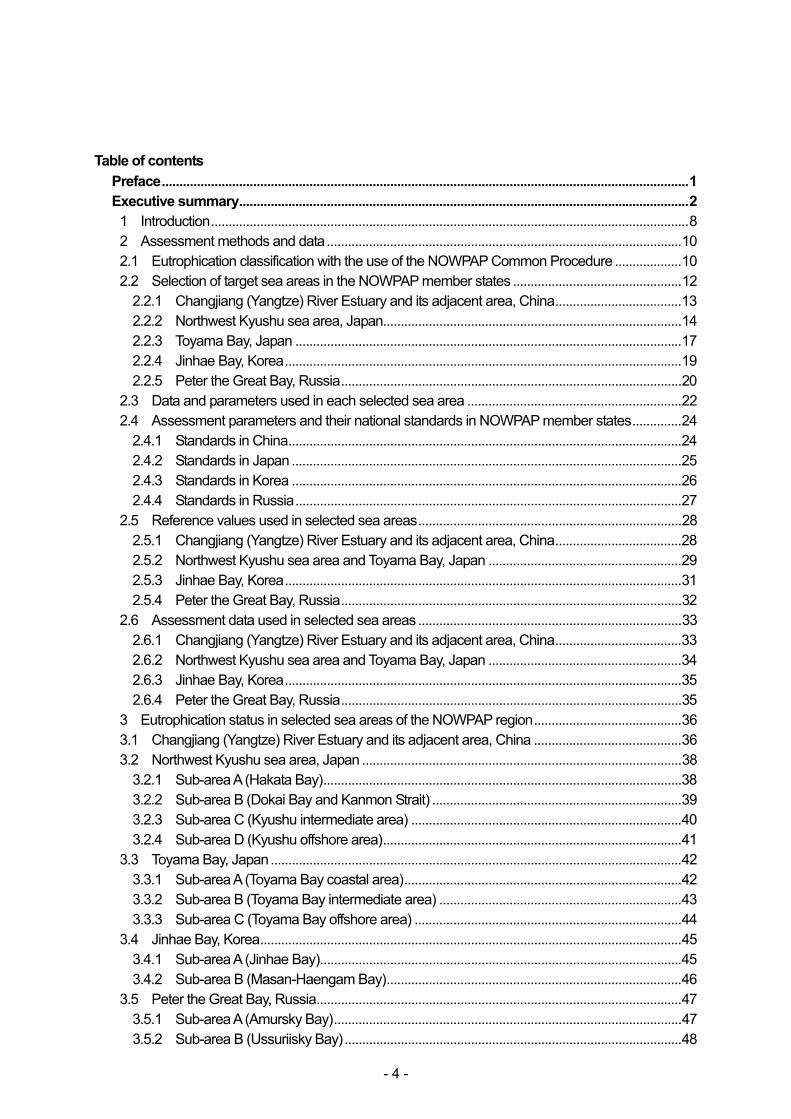
Norihiko Tanaka CEARAC Director
The member states, Regional Coordinating Unit and all the Regional Activity Centres of NOWPAP well recognize
that Changjiang (Yangtze) River Estuary and its adjacent area of China, which is one of the selected areas for this report, is not within the geographic scope of NOWPAP. Only for the purpose of case studies in this report, would China agree that this area was selected to be one of the target areas. The member states agree that it is not appropriate for all the RACs to carry out activities in the areas beyond NOWPAP's geographic scope in the future.
- 2 -
Executive summary Almost half of the world’s population lives within 100 km from a coastline. Anthropogenic activities have led
to nutrient enrichment, particularly by nitrogen and phosphorus that enter sea areas through domestic and industrial wastewaters and agricultural activities. Such nutrient enrichment can affect human health by degrading the marine ecosystem by eutrophication. Eutrophication often negatively impacts the marine environment by increasing red tide occurrences, by the mortality of benthos, fish and shellfish due to hypoxia and anoxia. Eutrophication is becoming a serious problem in some highly populated coastal areas within the Northwest Pacific Action Plan (NOWPAP) region.
Due to these concerns, a decision was made to assess the status of eutrophication using a common procedure throughout the NOWPAP member states. In 2009, procedures for the assessment of eutrophication status for the NOWPAP region (the NOWPAP Common Procedure), including an evaluation of land-based sources of nutrients, was developed by the Special Monitoring and Coastal Environmental Assessment Regional Activity Centre (CEARAC). Case studies on the assessment of the eutrophication status were then conducted in selected sea areas by experts nominated from each NOWPAP member state using the NOWPAP Common Procedure. The present report is compiled from the case study reports in each selected sea area.
In China, a case study was undertaken in the Changjiang (Yangtze) River Estuary and its adjacent area. The Changjiang (Yangtze) River is the biggest river in the Northwest Pacific region. Both nitrogen and phosphorus loadings from the river increased between the 1960s and 1990s. Nutrient concentrations, particularly nitrogen, were above the reference values in the estuary and its adjacent area.
In Japan, a case study was undertaken in the Northwest Kyushu sea area and Toyama Bay. The Northwest Kyushu sea area was divided into four sub-areas: Hakata Bay; Dokai Bay and the Kanmon Strait; the intermediate area; and the offshore area. Overall nutrient loadings from the rivers flowing into Hakata Bay showed a decreasing trend, although the nitrogen loadings from wastewater treatment plants showed an increasing trend. Dokai Bay and Kanmon Strait showed a substantial decrease in the total loadings of nitrogen, phosphorus and chemical oxygen demand between the 1970s and 1990s. In Toyama Bay, assessment area was divided into three sub-areas: coastal; intermediate; and offshore. Although there were no obvious symptoms of eutrophication identified in any of the sub-areas, nitrogen loadings from the biggest river into the bay showed an increasing trend that should be monitored.
In Korea, a case study was undertaken in Jinhae Bay, located in the southern part of the Korean Peninsula. Both total nitrogen and total phosphorus loadings have halved between 2002 and 2008, but concentrations of both were above reference values.
In Russia, a case study was undertaken in Peter the Great Bay. The bay was divided into three sub-areas: Amursky Bay; Ussuriisky Bay; and the southern part of Peter the Great Bay. While Ussuriisky Bay and the southern part did not show any obvious symptoms of eutrophication, Amursky Bay showed high level and increasing trend of nutrient loadings. Eutrophication in this area could be caused primarily by nutrient loadings from the Razdolnaya River and wastewater from Vladivostok City.
Remote sensing techniques were used alongside the NOWPAP Common Procedure methodology to gain a preliminary assessment of eutrophication in case study areas. Although the usefulness of remote sensing was validated in some areas, there was a discrepancy between the NOWPAP Common Procedure results and the preliminary assessment results obtained by satellite data, particularly in areas with turbid waters.
The NOWPAP Common Procedure was used to assess eutrophication status for the first time in selected NOWPAP sea areas. With some technical improvements, such as harmonized parameters and their reference conditions, the expansion of target areas, introduction of ecosystem modeling and consideration of atmospheric deposition, a better assessment of eutrophication status can be carried out.
- 3 -
The results of these eutrophication assessments are expected to facilitate the development of countermeasures against eutrophication in the NOWPAP member states, both nationally and regionally. It is expected that each member state will continue to monitor and collect data in order to gain a better understanding of long-term eutrophication trends. It is also expected that each state will undertake effective countermeasures to address these problems.
- 4 -
Table of contents Preface......................................................................................................................................................1 Executive summary................................................................................................................................2 1 Introduction........................................................................................................................................8 2 Assessment methods and data.....................................................................................................10 2.1 Eutrophication classification with the use of the NOWPAP Common Procedure ...................10 2.2 Selection of target sea areas in the NOWPAP member states ................................................12
2.2.1 Changjiang (Yangtze) River Estuary and its adjacent area, China....................................13 2.2.2 Northwest Kyushu sea area, Japan.....................................................................................14 2.2.3 Toyama Bay, Japan ..............................................................................................................17 2.2.4 Jinhae Bay, Korea.................................................................................................................19 2.2.5 Peter the Great Bay, Russia.................................................................................................20
2.3 Data and parameters used in each selected sea area .............................................................22 2.4 Assessment parameters and their national standards in NOWPAP member states..............24
2.4.1 Standards in China................................................................................................................24 2.4.2 Standards in Japan ...............................................................................................................25 2.4.3 Standards in Korea ...............................................................................................................26 2.4.4 Standards in Russia..............................................................................................................27
2.5 Reference values used in selected sea areas...........................................................................28 2.5.1 Changjiang (Yangtze) River Estuary and its adjacent area, China....................................28 2.5.2 Northwest Kyushu sea area and Toyama Bay, Japan .......................................................29 2.5.3 Jinhae Bay, Korea.................................................................................................................31 2.5.4 Peter the Great Bay, Russia.................................................................................................32
2.6 Assessment data used in selected sea areas ...........................................................................33 2.6.1 Changjiang (Yangtze) River Estuary and its adjacent area, China....................................33 2.6.2 Northwest Kyushu sea area and Toyama Bay, Japan .......................................................34 2.6.3 Jinhae Bay, Korea.................................................................................................................35 2.6.4 Peter the Great Bay, Russia.................................................................................................35
3 Eutrophication status in selected sea areas of the NOWPAP region..........................................36 3.1 Changjiang (Yangtze) River Estuary and its adjacent area, China ..........................................36 3.2 Northwest Kyushu sea area, Japan ...........................................................................................38
3.2.1 Sub-area A (Hakata Bay)......................................................................................................38 3.2.2 Sub-area B (Dokai Bay and Kanmon Strait) .......................................................................39 3.2.3 Sub-area C (Kyushu intermediate area) .............................................................................40 3.2.4 Sub-area D (Kyushu offshore area).....................................................................................41
3.3 Toyama Bay, Japan.....................................................................................................................42 3.3.1 Sub-area A (Toyama Bay coastal area)...............................................................................42 3.3.2 Sub-area B (Toyama Bay intermediate area) .....................................................................43 3.3.3 Sub-area C (Toyama Bay offshore area) ............................................................................44
3.4 Jinhae Bay, Korea........................................................................................................................45 3.4.1 Sub-area A (Jinhae Bay).......................................................................................................45 3.4.2 Sub-area B (Masan-Haengam Bay)....................................................................................46
3.5 Peter the Great Bay, Russia........................................................................................................47 3.5.1 Sub-area A (Amursky Bay)...................................................................................................47 3.5.2 Sub-area B (Ussuriisky Bay)................................................................................................48
- 5 -
3.5.3 Sub-area C (southern part of Peter the Great Bay)............................................................49 3.6 Comparison of eutrophication assessment results in the selected sea areas of the
NOWPAP member states ..........................................................................................................50 3.7 Comparison of classification results of common parameters in the selected sea areas
of the NOWPAP member states................................................................................................51 3.7.1 Comparison of DIN concentrations......................................................................................51 3.7.2 Comparison of DIP concentrations......................................................................................51 3.7.3 Comparison of DIN/DIP ratios..............................................................................................52 3.7.4 Comparison of annual maximum Chl-a...............................................................................52 3.7.5 Comparison of annual mean Chl-a......................................................................................52 3.7.6 Comparison of DO................................................................................................................53 3.7.7 Summary of comparison of common parameters in the selected sea areas...................66
3.8 Nutrient loadings in each selected sea area..............................................................................66 3.8.1 The Changjiang (Yangtze) River Estuary and its adjacent area, China............................66 3.8.2 Northwest Kyushu sea area, Japan.....................................................................................67 3.8.3 Toyama Bay, Japan ..............................................................................................................68 3.8.4 Jinhae Bay, Korea.................................................................................................................68 3.8.5 Peter the Great Bay, Russia.................................................................................................68 3.8.6 Comparison of nutrient loadings in selected sea areas......................................................69 3.8.7 Current state of nutrient loadings and source information..................................................71
4 Evaluation of eutrophication status and the NOWPAP Common Procedure.............................72 4.1 Evaluation of assessment results in the selected sea areas ....................................................72
4.1.1 Changjiang (Yangtze) River Estuary and its adjacent area, China....................................72 4.1.2 Northwest Kyushu sea area, Japan.....................................................................................72 4.1.3 Toyama Bay, Japan ..............................................................................................................73 4.1.4 Jinhae Bay, Korea.................................................................................................................74 4.1.5 Peter the Great Bay, Russia.................................................................................................74
4.2 Nutrient sources and loadings ....................................................................................................74 4.2.1 Land-based sources of nutrients..........................................................................................74 4.2.2 Atmospheric deposition of nutrients.....................................................................................75 4.2.3 Other possible sources of nutrients......................................................................................76
4.3 Evaluation of the NOWPAP Common Procedure.....................................................................76 4.3.1 Achievements with the use of the Common Procedure.....................................................76 4.3.2 Temporal and spatial differences in assessment parameters............................................77 4.3.3 Criteria for classifying assessment category.......................................................................77 4.3.4 Setting reference values.......................................................................................................77 4.3.5 Application of remote sensing techniques for preliminary eutrophication assessment....78
5 Existing policies related to the management of eutrophication in the NOWPAP member states............................................................................................................................................79
5.1 China ............................................................................................................................................79 5.2 Japan............................................................................................................................................79 5.3 Korea............................................................................................................................................80 5.4 Russia...........................................................................................................................................80
- 6 -
6 Conclusions and recommendations..............................................................................................81 6.1 Conclusions..................................................................................................................................81 6.2 Recommendations to combat eutrophication in the NOWPAP region ....................................81
6.2.1 Integrated assessment of eutrophication status of the entire NOWPAP region ...............81 6.2.2 Establishment of database for collaborative regional monitoring program .......................81 6.2.3 Using results of eutrophication assessment for Integrated Coastal and River Basin
Management.......................................................................................................................82 6.2.4 Assessment of negative impacts of eutrophication on the marine environment in the
NOWPAP region.................................................................................................................82 6.2.5 Introducing ecological modeling to set appropriate amount of nutrient as a control
target....................................................................................................................................82 [References] ··············································································································································83 [Glossary] ···················································································································································87
- 7 -
Annex A Case study reports in each selected sea area (attached as CD-ROM)·········································89
1.1 Changjiang (Yangtze) River Estuary and its adjacent area, China 1.2 Northwest Kyushu sea area, Japan 1.3 Toyama Bay, Japan 1.4 Jinhae Bay, Korea 1.5 Peter the Great Bay, Russia
B Procedures for assessment of eutrophication status including evaluation of land-based source of nutrients for the NOWPAP region·····················································································90
C Evaluation of preliminary eutrophication assessment by satellite in each selected sea area ····103
- 8 -
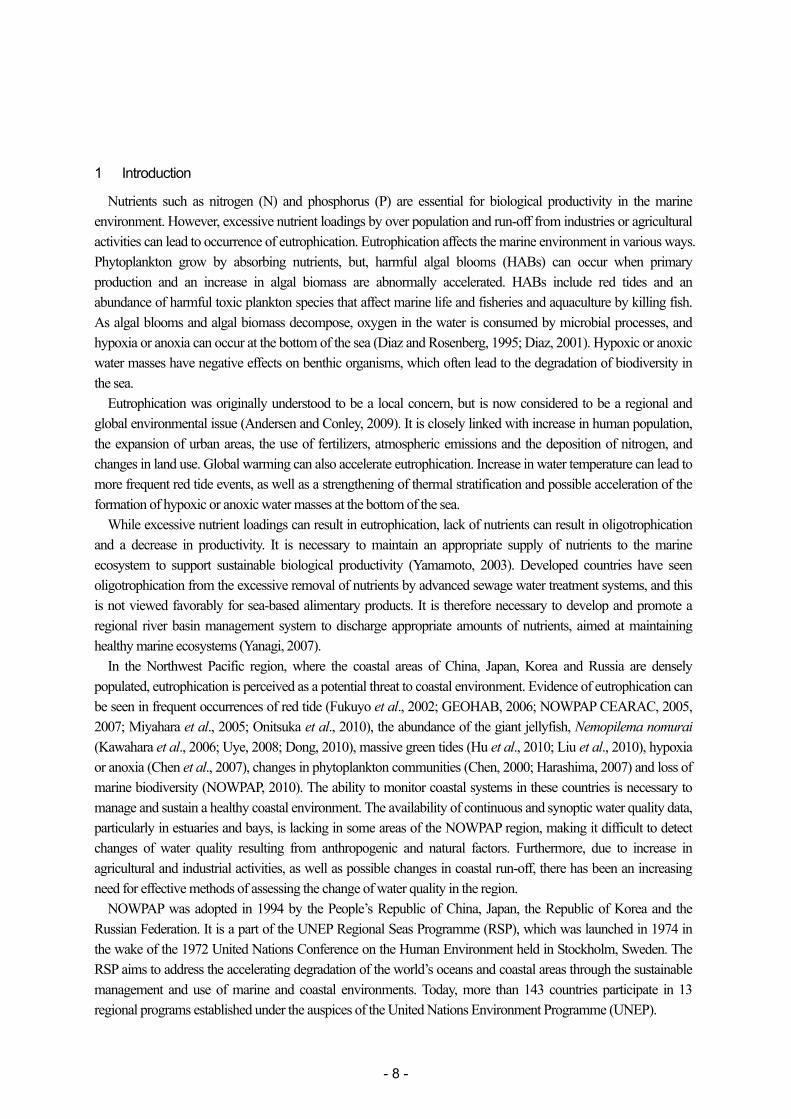
1 Introduction
Nutrients such as nitrogen (N) and phosphorus (P) are essential for biological productivity in the marine environment. However, excessive nutrient loadings by over population and run-off from industries or agricultural activities can lead to occurrence of eutrophication. Eutrophication affects the marine environment in various ways. Phytoplankton grow by absorbing nutrients, but, harmful algal blooms (HABs) can occur when primary production and an increase in algal biomass are abnormally accelerated. HABs include red tides and an abundance of harmful toxic plankton species that affect marine life and fisheries and aquaculture by killing fish. As algal blooms and algal biomass decompose, oxygen in the water is consumed by microbial processes, and hypoxia or anoxia can occur at the bottom of the sea (Diaz and Rosenberg, 1995; Diaz, 2001). Hypoxic or anoxic water masses have negative effects on benthic organisms, which often lead to the degradation of biodiversity in the sea.
Eutrophication was originally understood to be a local concern, but is now considered to be a regional and global environmental issue (Andersen and Conley, 2009). It is closely linked with increase in human population, the expansion of urban areas, the use of fertilizers, atmospheric emissions and the deposition of nitrogen, and changes in land use. Global warming can also accelerate eutrophication. Increase in water temperature can lead to more frequent red tide events, as well as a strengthening of thermal stratification and possible acceleration of the formation of hypoxic or anoxic water masses at the bottom of the sea.
While excessive nutrient loadings can result in eutrophication, lack of nutrients can result in oligotrophication and a decrease in productivity. It is necessary to maintain an appropriate supply of nutrients to the marine ecosystem to support sustainable biological productivity (Yamamoto, 2003). Developed countries have seen oligotrophication from the excessive removal of nutrients by advanced sewage water treatment systems, and this is not viewed favorably for sea-based alimentary products. It is therefore necessary to develop and promote a regional river basin management system to discharge appropriate amounts of nutrients, aimed at maintaining healthy marine ecosystems (Yanagi, 2007).
In the Northwest Pacific region, where the coastal areas of China, Japan, Korea and Russia are densely populated, eutrophication is perceived as a potential threat to coastal environment. Evidence of eutrophication can be seen in frequent occurrences of red tide (Fukuyo et al., 2002; GEOHAB, 2006; NOWPAP CEARAC, 2005, 2007; Miyahara et al., 2005; Onitsuka et al., 2010), the abundance of the giant jellyfish, Nemopilema nomurai (Kawahara et al., 2006; Uye, 2008; Dong, 2010), massive green tides (Hu et al., 2010; Liu et al., 2010), hypoxia or anoxia (Chen et al., 2007), changes in phytoplankton communities (Chen, 2000; Harashima, 2007) and loss of marine biodiversity (NOWPAP, 2010). The ability to monitor coastal systems in these countries is necessary to manage and sustain a healthy coastal environment. The availability of continuous and synoptic water quality data, particularly in estuaries and bays, is lacking in some areas of the NOWPAP region, making it difficult to detect changes of water quality resulting from anthropogenic and natural factors. Furthermore, due to increase in agricultural and industrial activities, as well as possible changes in coastal run-off, there has been an increasing need for effective methods of assessing the change of water quality in the region.
NOWPAP was adopted in 1994 by the People’s Republic of China, Japan, the Republic of Korea and the Russian Federation. It is a part of the UNEP Regional Seas Programme (RSP), which was launched in 1974 in the wake of the 1972 United Nations Conference on the Human Environment held in Stockholm, Sweden. The RSP aims to address the accelerating degradation of the world’s oceans and coastal areas through the sustainable management and use of marine and coastal environments. Today, more than 143 countries participate in 13 regional programs established under the auspices of the United Nations Environment Programme (UNEP).
- 9 -
In order to evaluate eutrophication, many tools and methodologies for its assessment have been developed. Well known examples include the Oslo-Paris Conventions for the Protection of the North Sea Comprehensive Procedures (OSPAR Commission, 2003), the Eutrophication Assessment Tool of Helsinki Commission (HELCOM, 2006), the National Oceanic and Atmospheric Administration’s National Estuarine Eutrophication Assessment (Bricker et al., 1999) and the Assessment of Estuarine Trophic Status (Bricker et al., 2003). Eutrophication assessments have been conducted based on each of these tools or methodologies, and assessment results have been published by their respective bodies (OSPAR Commision, 2008; HELCOM, 2009; Bricker et al., 2007).
Within the NOWPAP framework, CEARAC developed the NOWPAP Common Procedure (NOWPAP CEARAC, 2009). The NOWPAP member states have applied the NOWPAP Common Procedure to the selected sea areas in each country, and evaluated the suitability of the methodology for the assessment of eutrophication status. The selected sea areas are the Changjiang (Yangtze) River Estuary and its adjacent area in China, the Northwest Kyushu sea area and Toyama Bay in Japan, Jinhae Bay in Korea and Peter the Great Bay in Russia. The aim of the assessment was to obtain results that would provide material for discussion in order to limit or, if possible, mitigate anthropogenic eutrophication in the region.
This report presents the assessment results of the eutrophication status in the selected sea areas of each NOWPAP member state based on the NOWPAP Common Procedure. In addition, technical problems in the NOWPAP Common Procedure have been recognized by examining assessment parameters and their reference values.
- 10 -
2 Assessment methods and data
2.1 Eutrophication classification with the use of the NOWPAP Common Procedure
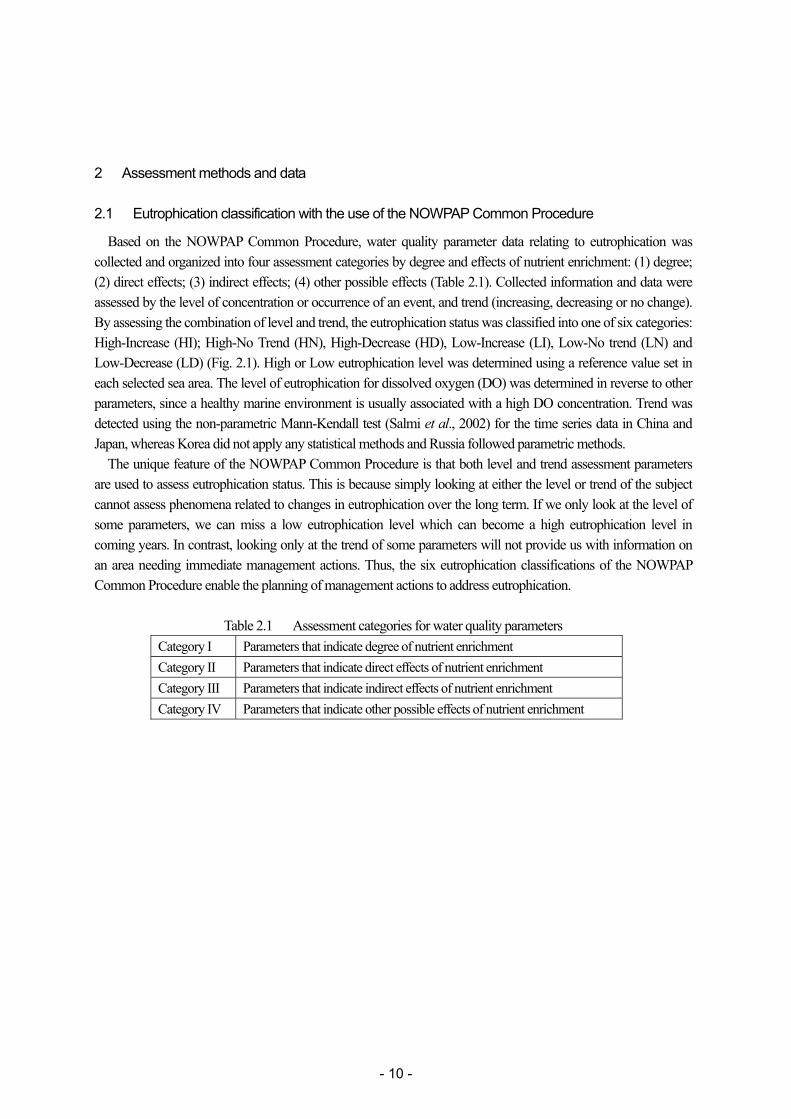
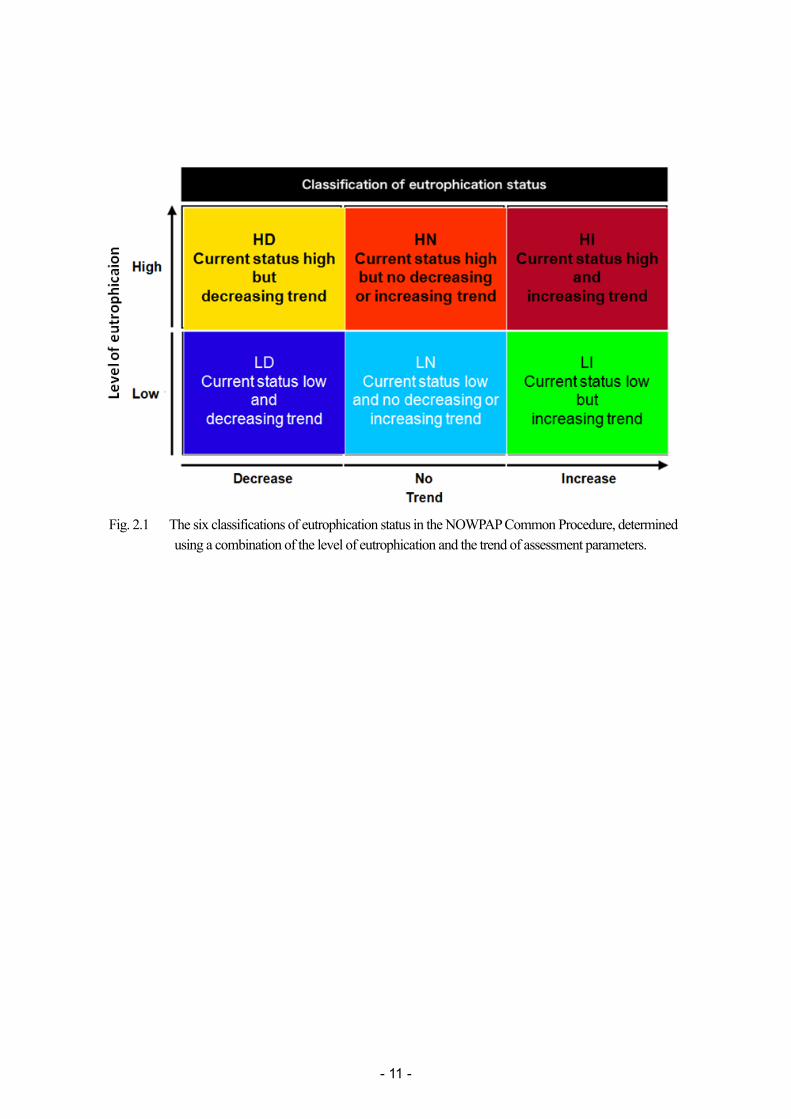
Based on the NOWPAP Common Procedure, water quality parameter data relating to eutrophication was collected and organized into four assessment categories by degree and effects of nutrient enrichment: (1) degree; (2) direct effects; (3) indirect effects; (4) other possible effects (Table 2.1). Collected information and data were assessed by the level of concentration or occurrence of an event, and trend (increasing, decreasing or no change). By assessing the combination of level and trend, the eutrophication status was classified into one of six categories: High-Increase (HI); High-No Trend (HN), High-Decrease (HD), Low-Increase (LI), Low-No trend (LN) and Low-Decrease (LD) (Fig. 2.1). High or Low eutrophication level was determined using a reference value set in each selected sea area. The level of eutrophication for dissolved oxygen (DO) was determined in reverse to other parameters, since a healthy marine environment is usually associated with a high DO concentration. Trend was detected using the non-parametric Mann-Kendall test (Salmi et al., 2002) for the time series data in China and Japan, whereas Korea did not apply any statistical methods and Russia followed parametric methods.
The unique feature of the NOWPAP Common Procedure is that both level and trend assessment parameters are used to assess eutrophication status. This is because simply looking at either the level or trend of the subject cannot assess phenomena related to changes in eutrophication over the long term. If we only look at the level of some parameters, we can miss a low eutrophication level which can become a high eutrophication level in coming years. In contrast, looking only at the trend of some parameters will not provide us with information on an area needing immediate management actions. Thus, the six eutrophication classifications of the NOWPAP Common Procedure enable the planning of management actions to address eutrophication.
Table 2.1 Assessment categories for water quality parameters Category I Parameters that indicate degree of nutrient enrichment Category II Parameters that indicate direct effects of nutrient enrichment Category III Parameters that indicate indirect effects of nutrient enrichment Category IV Parameters that indicate other possible effects of nutrient enrichment
- 11 -
Fig. 2.1 The six classifications of eutrophication status in the NOWPAP Common Procedure, determined
using a combination of the level of eutrophication and the trend of assessment parameters.
- 12 -
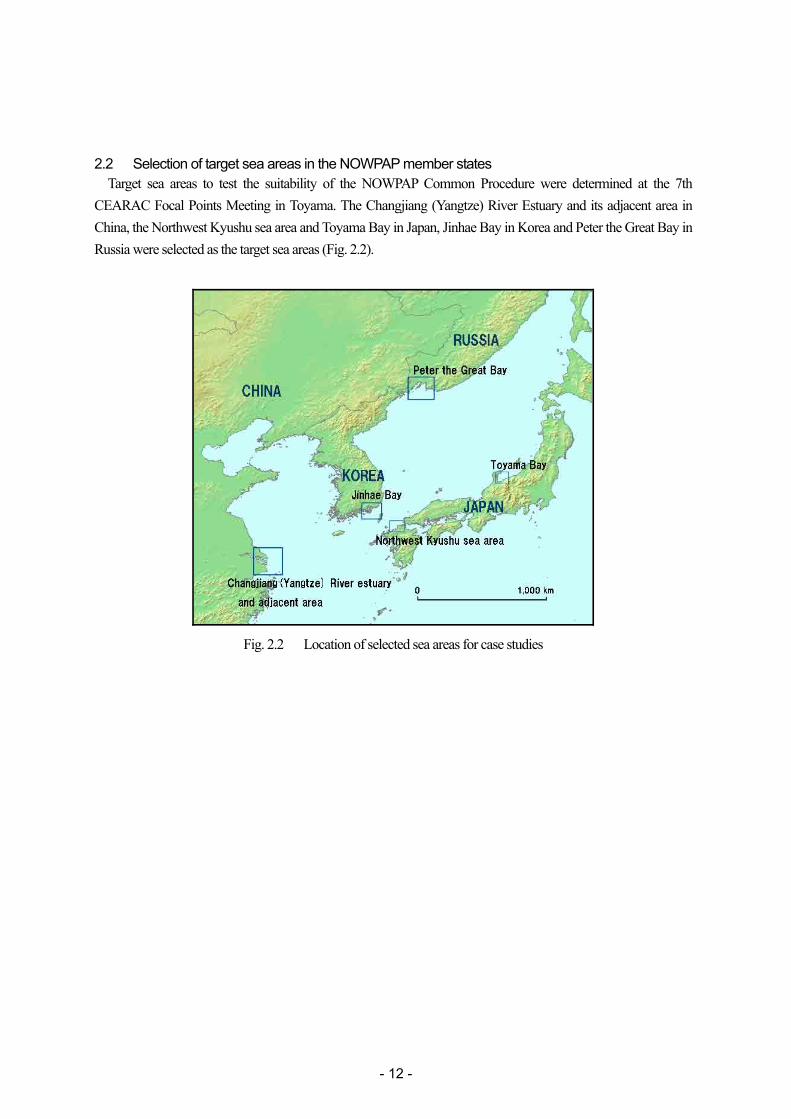
2.2 Selection of target sea areas in the NOWPAP member states Target sea areas to test the suitability of the NOWPAP Common Procedure were determined at the 7th
CEARAC Focal Points Meeting in Toyama. The Changjiang (Yangtze) River Estuary and its adjacent area in China, the Northwest Kyushu sea area and Toyama Bay in Japan, Jinhae Bay in Korea and Peter the Great Bay in Russia were selected as the target sea areas (Fig. 2.2).
Fig. 2.2 Location of selected sea areas for case studies
- 13 -
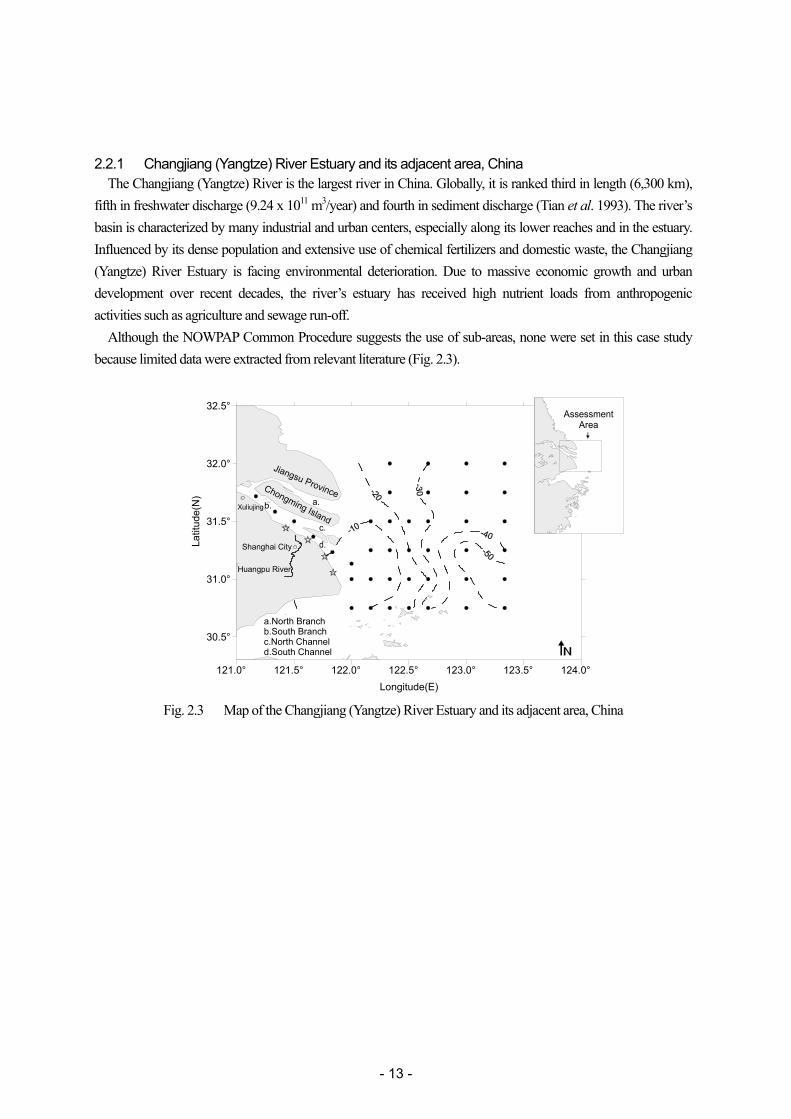
2.2.1 Changjiang (Yangtze) River Estuary and its adjacent area, China The Changjiang (Yangtze) River is the largest river in China. Globally, it is ranked third in length (6,300 km),
fifth in freshwater discharge (9.24 x 10¹¹ m3/year) and fourth in sediment discharge (Tian et al. 1993). The river’s basin is characterized by many industrial and urban centers, especially along its lower reaches and in the estuary. Influenced by its dense population and extensive use of chemical fertilizers and domestic waste, the Changjiang (Yangtze) River Estuary is facing environmental deterioration. Due to massive economic growth and urban development over recent decades, the river’s estuary has received high nutrient loads from anthropogenic activities such as agriculture and sewage run-off.
Although the NOWPAP Common Procedure suggests the use of sub-areas, none were set in this case study because limited data were extracted from relevant literature (Fig. 2.3).
121.0° 121.5° 122.0° 122.5° 123.0° 123.5° 124.0°Longitude(E)
30.5°
31.0°
31.5°
32.0°
32.5°
Latit
ude(
N)
Shanghai City
Xuliujing
Chongming Island
Jiangsu Provincea.b.
c.
d.
a.North Branchb.South Branchc.North Channeld.South Channel
Assessment Area
Huangpu River
Fig. 2.3 Map of the Changjiang (Yangtze) River Estuary and its adjacent area, China
- 14 -
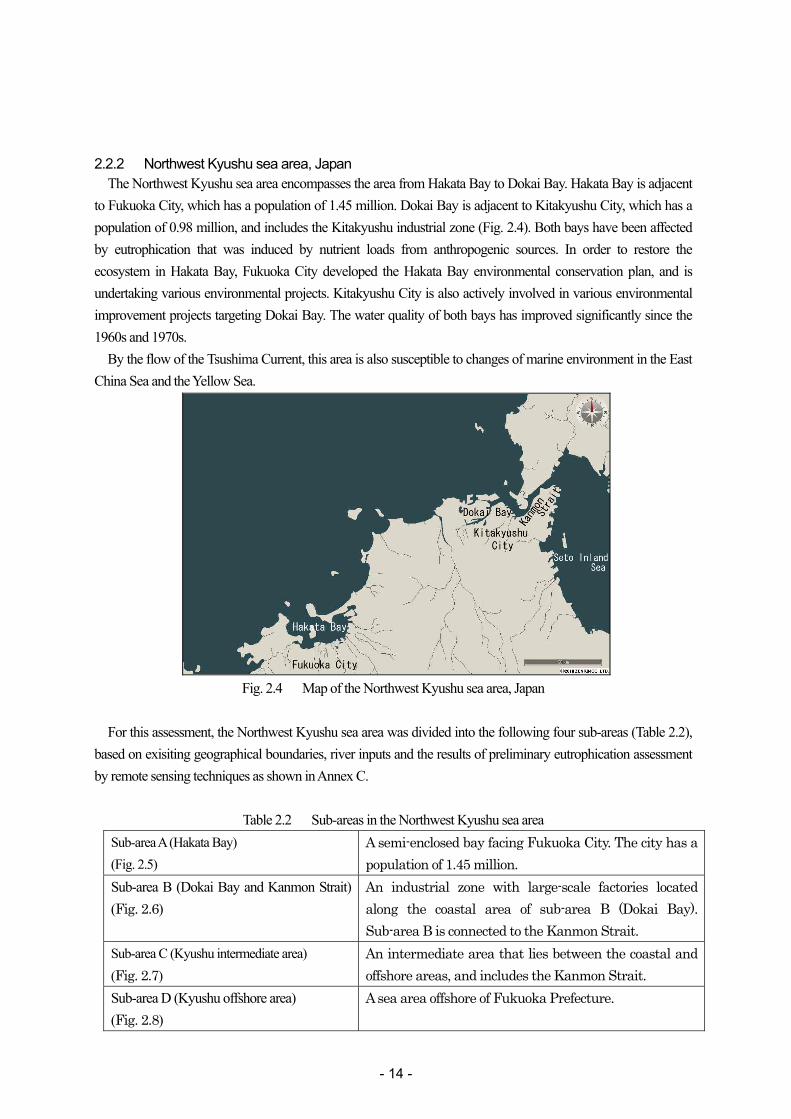
2.2.2 Northwest Kyushu sea area, Japan The Northwest Kyushu sea area encompasses the area from Hakata Bay to Dokai Bay. Hakata Bay is adjacent
to Fukuoka City, which has a population of 1.45 million. Dokai Bay is adjacent to Kitakyushu City, which has a population of 0.98 million, and includes the Kitakyushu industrial zone (Fig. 2.4). Both bays have been affected by eutrophication that was induced by nutrient loads from anthropogenic sources. In order to restore the ecosystem in Hakata Bay, Fukuoka City developed the Hakata Bay environmental conservation plan, and is undertaking various environmental projects. Kitakyushu City is also actively involved in various environmental improvement projects targeting Dokai Bay. The water quality of both bays has improved significantly since the 1960s and 1970s.
By the flow of the Tsushima Current, this area is also susceptible to changes of marine environment in the East China Sea and the Yellow Sea.
Fig. 2.4 Map of the Northwest Kyushu sea area, Japan
For this assessment, the Northwest Kyushu sea area was divided into the following four sub-areas (Table 2.2),
based on exisiting geographical boundaries, river inputs and the results of preliminary eutrophication assessment by remote sensing techniques as shown in Annex C.
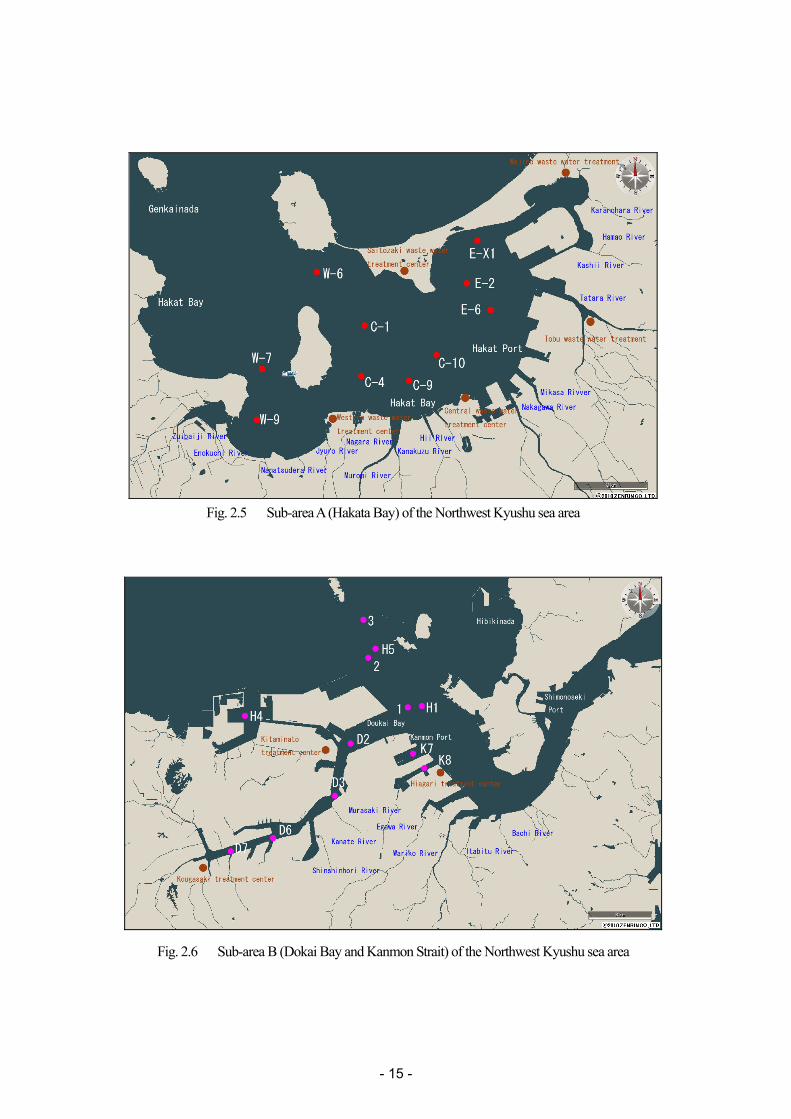
Table 2.2 Sub-areas in the Northwest Kyushu sea area Sub-area A (Hakata Bay) (Fig. 2.5)
A semi-enclosed bay facing Fukuoka City. The city has a population of 1.45 million.
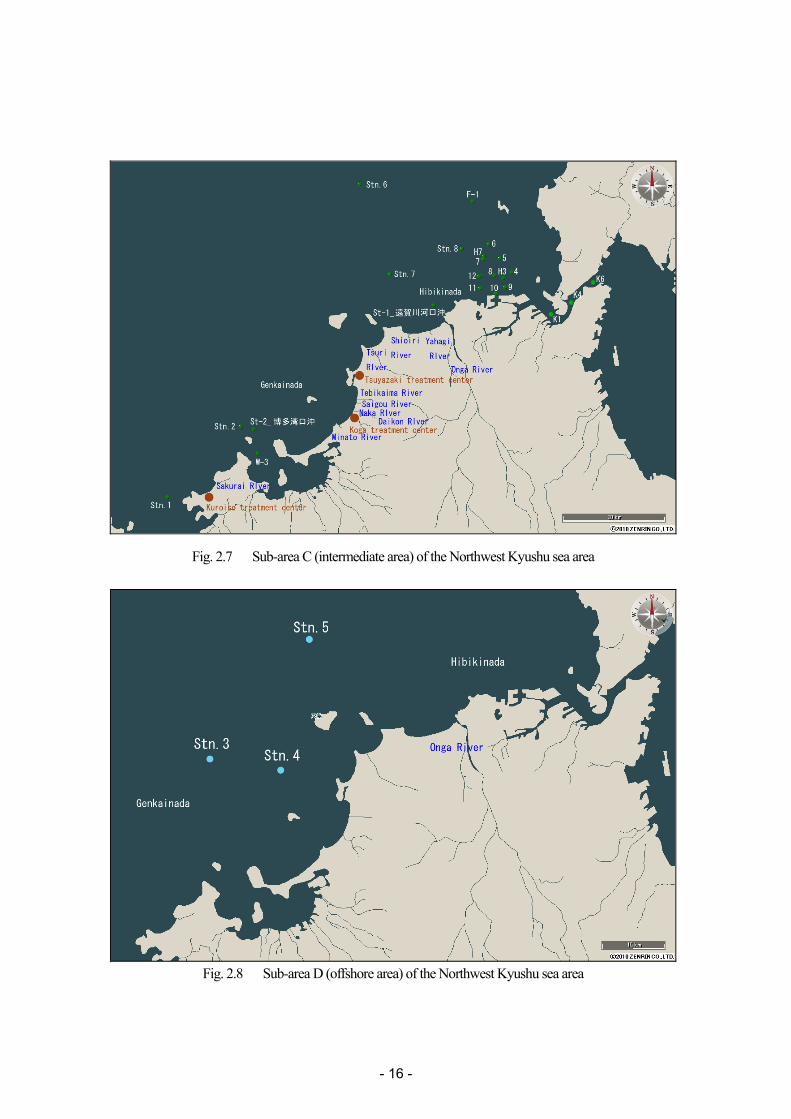
Sub-area B (Dokai Bay and Kanmon Strait) (Fig. 2.6)
An industrial zone with large-scale factories located along the coastal area of sub-area B (Dokai Bay). Sub-area B is connected to the Kanmon Strait.
Sub-area C (Kyushu intermediate area) (Fig. 2.7)
An intermediate area that lies between the coastal and offshore areas, and includes the Kanmon Strait.
Sub-area D (Kyushu offshore area) (Fig. 2.8)
A sea area offshore of Fukuoka Prefecture.
- 15 -
Fig. 2.5 Sub-area A (Hakata Bay) of the Northwest Kyushu sea area
Fig. 2.6 Sub-area B (Dokai Bay and Kanmon Strait) of the Northwest Kyushu sea area
- 16 -
Fig. 2.7 Sub-area C (intermediate area) of the Northwest Kyushu sea area
Fig. 2.8 Sub-area D (offshore area) of the Northwest Kyushu sea area
- 17 -
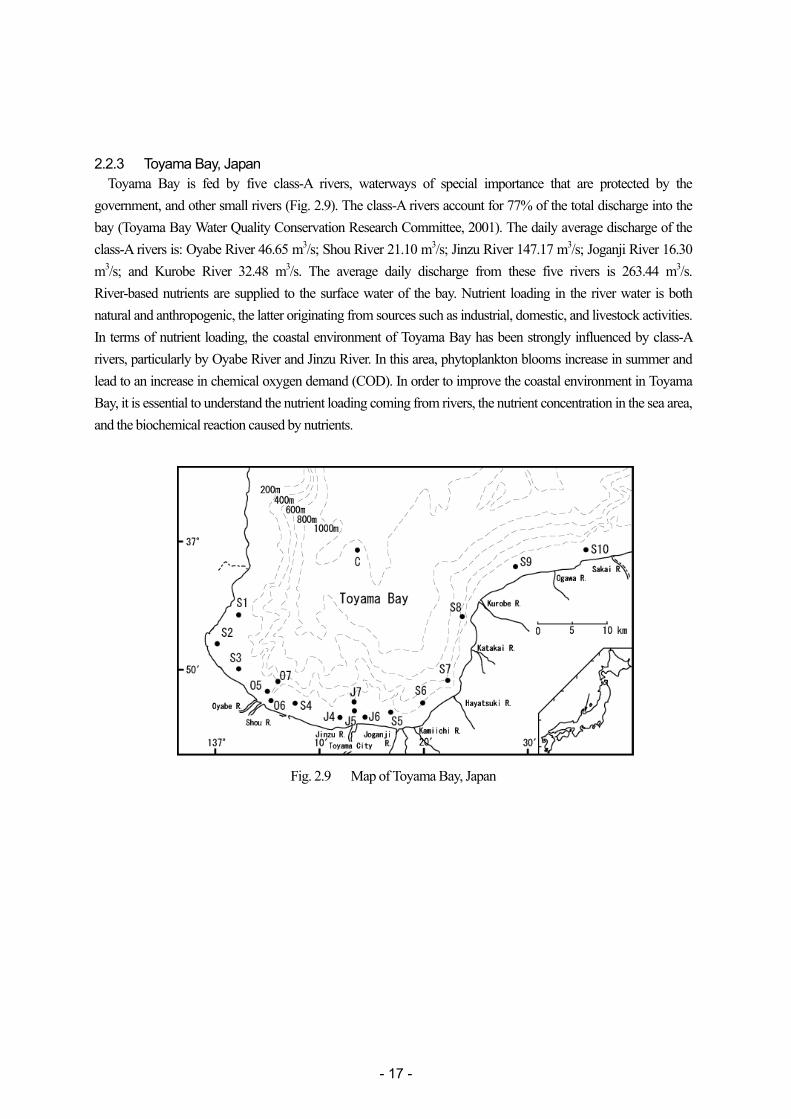
2.2.3 Toyama Bay, Japan Toyama Bay is fed by five class-A rivers, waterways of special importance that are protected by the
government, and other small rivers (Fig. 2.9). The class-A rivers account for 77% of the total discharge into the bay (Toyama Bay Water Quality Conservation Research Committee, 2001). The daily average discharge of the class-A rivers is: Oyabe River 46.65 m3/s; Shou River 21.10 m3/s; Jinzu River 147.17 m3/s; Joganji River 16.30 m3/s; and Kurobe River 32.48 m3/s. The average daily discharge from these five rivers is 263.44 m3/s. River-based nutrients are supplied to the surface water of the bay. Nutrient loading in the river water is both natural and anthropogenic, the latter originating from sources such as industrial, domestic, and livestock activities. In terms of nutrient loading, the coastal environment of Toyama Bay has been strongly influenced by class-A rivers, particularly by Oyabe River and Jinzu River. In this area, phytoplankton blooms increase in summer and lead to an increase in chemical oxygen demand (COD). In order to improve the coastal environment in Toyama Bay, it is essential to understand the nutrient loading coming from rivers, the nutrient concentration in the sea area, and the biochemical reaction caused by nutrients.
Fig. 2.9 Map of Toyama Bay, Japan
- 18 -
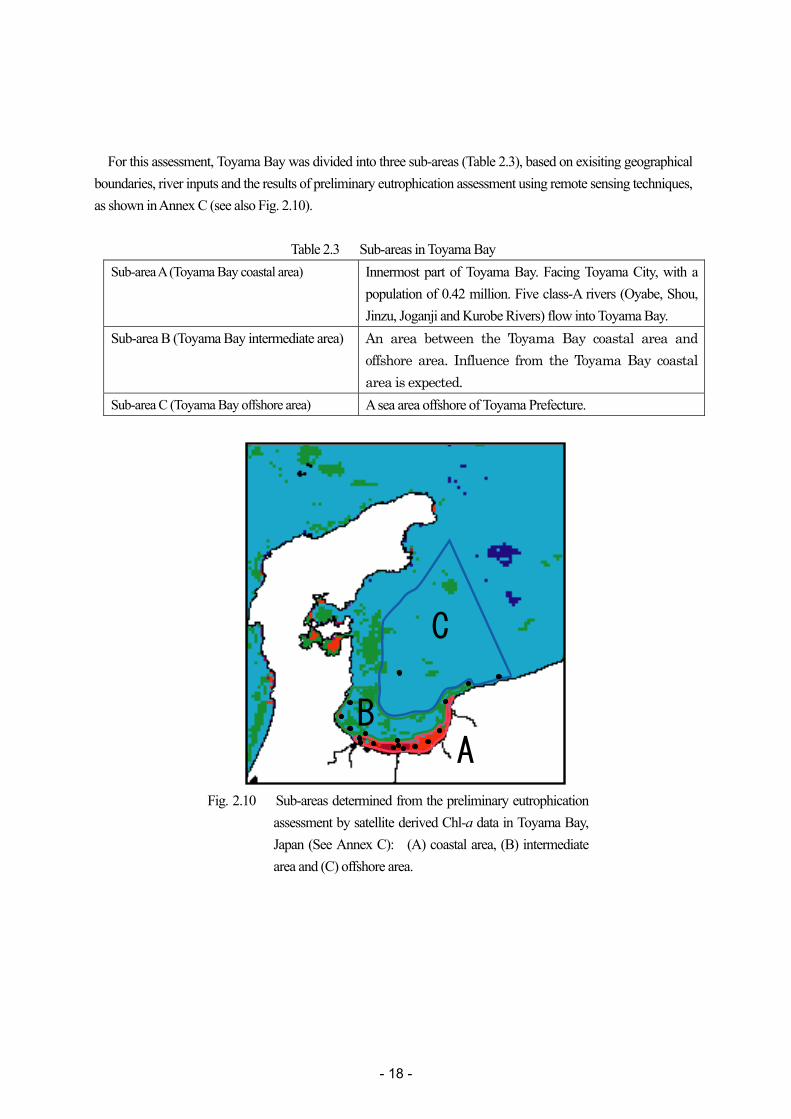
For this assessment, Toyama Bay was divided into three sub-areas (Table 2.3), based on exisiting geographical boundaries, river inputs and the results of preliminary eutrophication assessment using remote sensing techniques, as shown in Annex C (see also Fig. 2.10).
Table 2.3 Sub-areas in Toyama Bay
Sub-area A (Toyama Bay coastal area) Innermost part of Toyama Bay. Facing Toyama City, with a population of 0.42 million. Five class-A rivers (Oyabe, Shou, Jinzu, Joganji and Kurobe Rivers) flow into Toyama Bay.
Sub-area B (Toyama Bay intermediate area) An area between the Toyama Bay coastal area and offshore area. Influence from the Toyama Bay coastal area is expected.
Sub-area C (Toyama Bay offshore area) A sea area offshore of Toyama Prefecture.
BA
C
Fig. 2.10 Sub-areas determined from the preliminary eutrophication
assessment by satellite derived Chl-a data in Toyama Bay, Japan (See Annex C): (A) coastal area, (B) intermediate area and (C) offshore area.
- 19 -
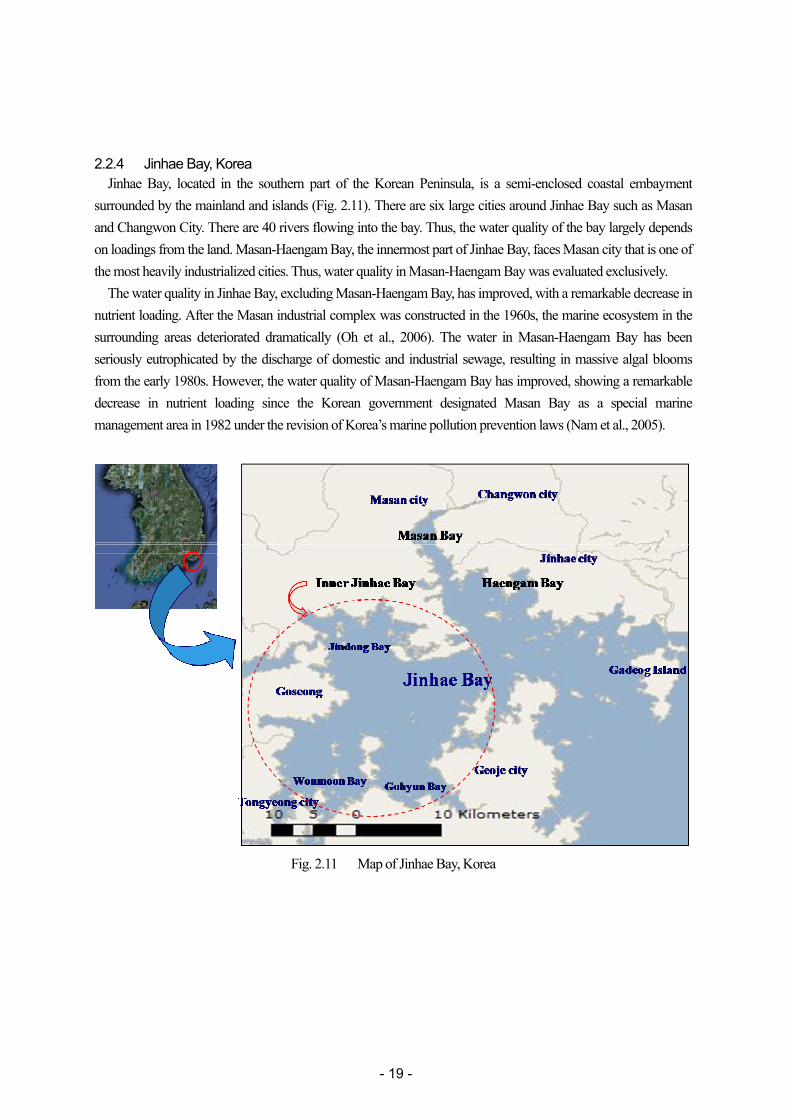
2.2.4 Jinhae Bay, Korea Jinhae Bay, located in the southern part of the Korean Peninsula, is a semi-enclosed coastal embayment
surrounded by the mainland and islands (Fig. 2.11). There are six large cities around Jinhae Bay such as Masan and Changwon City. There are 40 rivers flowing into the bay. Thus, the water quality of the bay largely depends on loadings from the land. Masan-Haengam Bay, the innermost part of Jinhae Bay, faces Masan city that is one of the most heavily industrialized cities. Thus, water quality in Masan-Haengam Bay was evaluated exclusively.
The water quality in Jinhae Bay, excluding Masan-Haengam Bay, has improved, with a remarkable decrease in nutrient loading. After the Masan industrial complex was constructed in the 1960s, the marine ecosystem in the surrounding areas deteriorated dramatically (Oh et al., 2006). The water in Masan-Haengam Bay has been seriously eutrophicated by the discharge of domestic and industrial sewage, resulting in massive algal blooms from the early 1980s. However, the water quality of Masan-Haengam Bay has improved, showing a remarkable decrease in nutrient loading since the Korean government designated Masan Bay as a special marine management area in 1982 under the revision of Korea’s marine pollution prevention laws (Nam et al., 2005).
Fig. 2.11 Map of Jinhae Bay, Korea
- 20 -
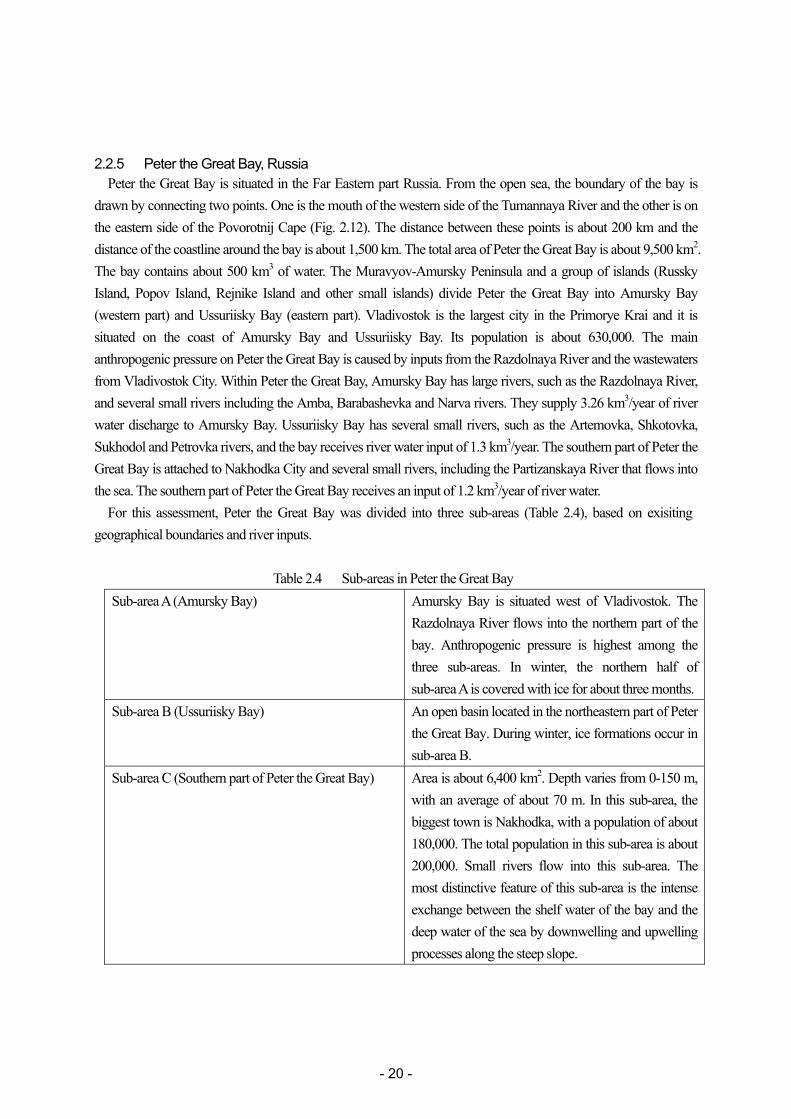
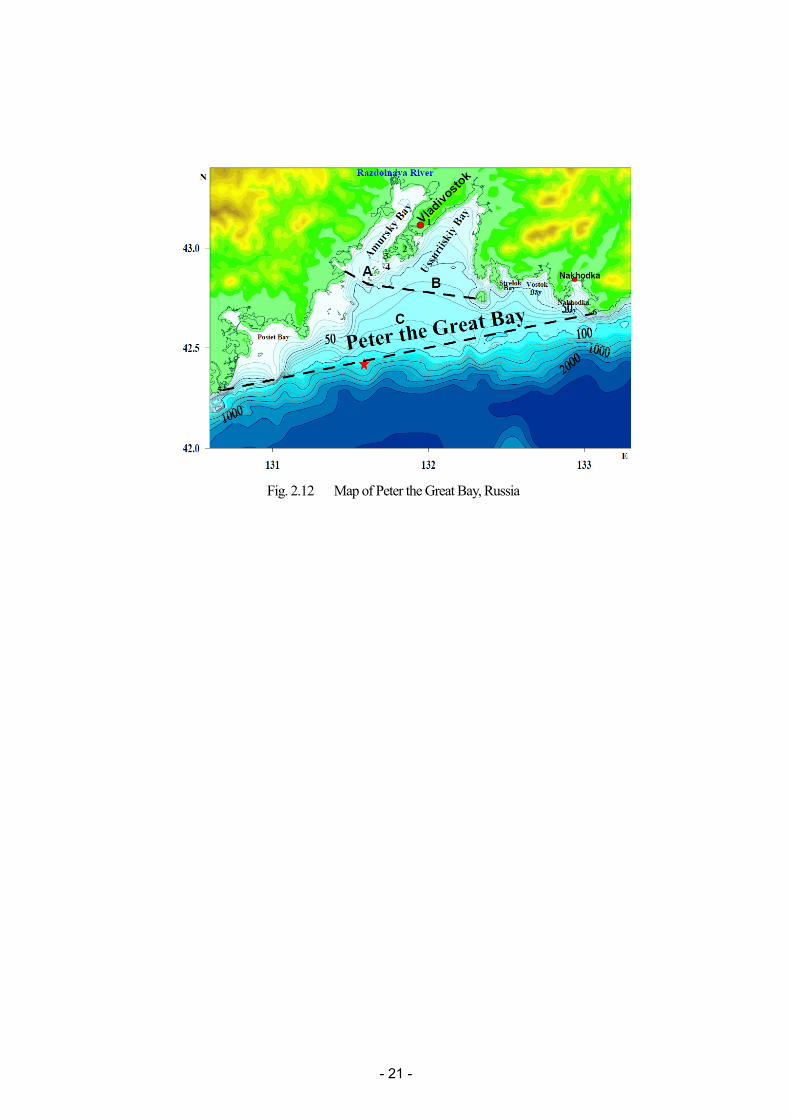
2.2.5 Peter the Great Bay, Russia Peter the Great Bay is situated in the Far Eastern part Russia. From the open sea, the boundary of the bay is
drawn by connecting two points. One is the mouth of the western side of the Tumannaya River and the other is on the eastern side of the Povorotnij Cape (Fig. 2.12). The distance between these points is about 200 km and the distance of the coastline around the bay is about 1,500 km. The total area of Peter the Great Bay is about 9,500 km2. The bay contains about 500 km3 of water. The Muravyov-Amursky Peninsula and a group of islands (Russky Island, Popov Island, Rejnike Island and other small islands) divide Peter the Great Bay into Amursky Bay (western part) and Ussuriisky Bay (eastern part). Vladivostok is the largest city in the Primorye Krai and it is situated on the coast of Amursky Bay and Ussuriisky Bay. Its population is about 630,000. The main anthropogenic pressure on Peter the Great Bay is caused by inputs from the Razdolnaya River and the wastewaters from Vladivostok City. Within Peter the Great Bay, Amursky Bay has large rivers, such as the Razdolnaya River, and several small rivers including the Amba, Barabashevka and Narva rivers. They supply 3.26 km3/year of river water discharge to Amursky Bay. Ussuriisky Bay has several small rivers, such as the Artemovka, Shkotovka, Sukhodol and Petrovka rivers, and the bay receives river water input of 1.3 km3/year. The southern part of Peter the Great Bay is attached to Nakhodka City and several small rivers, including the Partizanskaya River that flows into the sea. The southern part of Peter the Great Bay receives an input of 1.2 km3/year of river water.
For this assessment, Peter the Great Bay was divided into three sub-areas (Table 2.4), based on exisiting geographical boundaries and river inputs.
Table 2.4 Sub-areas in Peter the Great Bay Sub-area A (Amursky Bay) Amursky Bay is situated west of Vladivostok. The
Razdolnaya River flows into the northern part of the bay. Anthropogenic pressure is highest among the three sub-areas. In winter, the northern half of sub-area A is covered with ice for about three months.
Sub-area B (Ussuriisky Bay) An open basin located in the northeastern part of Peter the Great Bay. During winter, ice formations occur in sub-area B.
Sub-area C (Southern part of Peter the Great Bay) Area is about 6,400 km2. Depth varies from 0-150 m, with an average of about 70 m. In this sub-area, the biggest town is Nakhodka, with a population of about 180,000. The total population in this sub-area is about 200,000. Small rivers flow into this sub-area. The most distinctive feature of this sub-area is the intense exchange between the shelf water of the bay and the deep water of the sea by downwelling and upwelling processes along the steep slope.
- 21 -
Fig. 2.12 Map of Peter the Great Bay, Russia
- 22 -
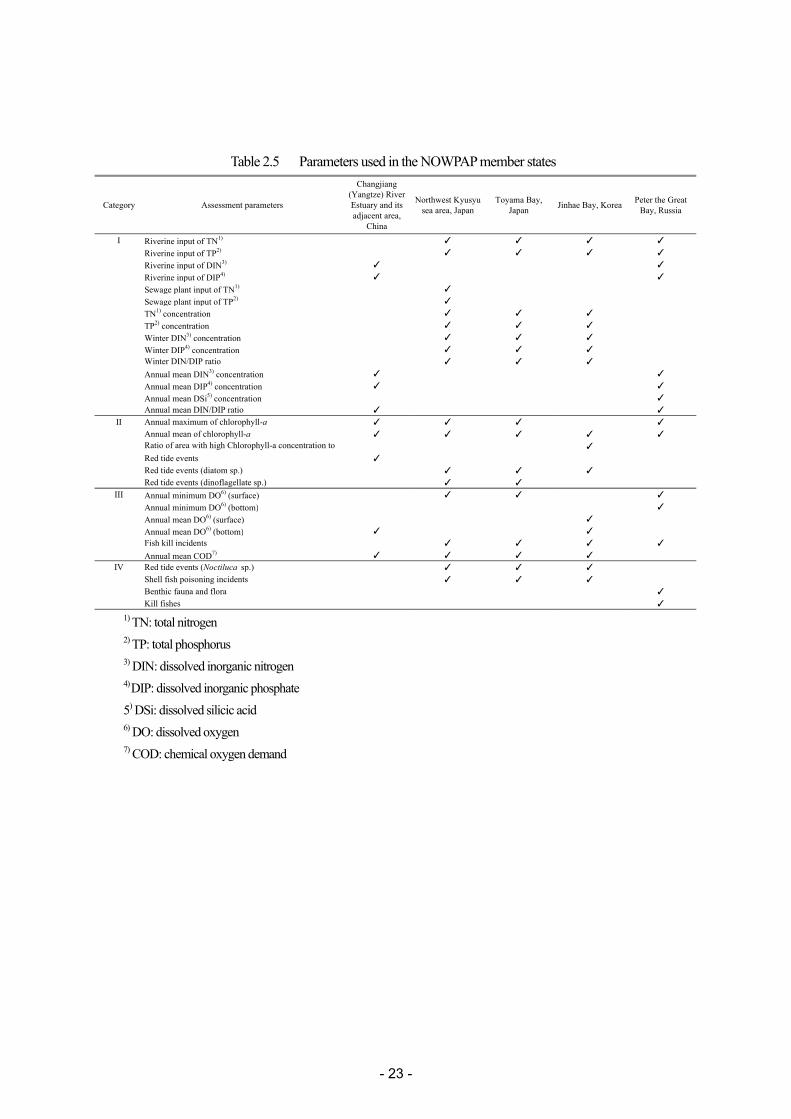
2.3 Data and parameters used in each selected sea area An assessment of the eutrophication status was conducted in the selected sea areas of China, Japan, Korea and
Russia. Table 2.5 lists the parameters of the four categories used in this assessment. In Category I, all of the member states selected riverine input of total nitrogen (TN) and total phosphorus (TP)
as assessment parameters. However, from 1995 to 1996, limited TN and TP input data were available for Jinhae Bay, Korea. TN and TP riverine input data for the Changjiang (Yangtze) River in China were only available for the 5-year period from 2006 to 2010, but dissolved inorganic nitrogen (DIN) and dissolved inorganic phosphate (DIP) inputs data were available between 1963 and 2007. In the Northwest Kyushu sea area in Japan, the trend of TN and TP released from sewage treatment plants was used. For Peter the Great Bay in Russia, data on TN, TP, DIN, DIP, dissolved silicic acid (DSi), chemical oxygen demand by potassium dichromate (CODCr), suspended substance (SS) and Biochemical Oxygen Demand (BOD5) inputs from rivers and sewage plants were used. Japan and Korea used monitoring data on TN and TP concentrations in the sea areas, whereas China and Russia did not. All states had common parameters for the DIN, DIP and DIN/DIP ratio; however, Japan and Korea used winter data, whereas China and Russia used annual means.
For Category II, all of the member states used the annual mean chlorophyll-a concentration (Chl-a) as one parameter. In addition, China, Japan and Russia used the annual maximum of Chl-a. In Korea, the ratio of areas with high Chl-a to the total area was used as a parameter. In relation to red tides, the number of occurrences was used in China, Japan and Korea. In Japan, red tide events were divided into three taxonomic groups: diatom sp., dinoflagellate sp. and Noctiluca sp. The first two of these groups were in Category II and the third was included in Category IV in Japan.
In Category III, all of the member states selected Dissolved Oxygen (DO) as a common parameter. However, their samples were different in terms of the depth of observations. In China DO at bottom layer was used. Japan and Korea used DO at the surface layer. Russia used DO data of both the surface and bottom layers. Further, China and Korea used the annual mean of DO, whereas Japan and Russia used the annual minimum. Fish kill incidents were used in Japan, Korea and Russia. The annual mean COD was also used as a parameter in China, Japan and Korea, but not in Russia.
In category IV, Japan and Korea used the red tide events of Noctiluca sp. and shellfish poisoning incidents as assessment parameters, whereas Russia used kills of benthic fauna, flora and fish. China did not use any assessment parameters in this category.
- 23 -
Table 2.5 Parameters used in the NOWPAP member states
Category Assessment parameters
Changjiang(Yangtze) RiverEstuary and itsadjacent area,
China
Northwest Kyusyusea area, Japan
Toyama Bay,Japan Jinhae Bay, Korea Peter the Great
Bay, Russia
I Riverine input of TN1) ✓ ✓ ✓ ✓
Riverine input of TP2) ✓ ✓ ✓ ✓
Riverine input of DIN3) ✓ ✓
Riverine input of DIP4) ✓ ✓
Sewage plant input of TN1) ✓
Sewage plant input of TP2) ✓
TN1) concentration ✓ ✓ ✓
TP2) concentration ✓ ✓ ✓
Winter DIN3) concentration ✓ ✓ ✓
Winter DIP4) concentration ✓ ✓ ✓
Winter DIN/DIP ratio ✓ ✓ ✓
Annual mean DIN3) concentration ✓ ✓
Annual mean DIP4) concentration ✓ ✓
Annual mean DSi5) concentration ✓
Annual mean DIN/DIP ratio ✓ ✓
II Annual maximum of chlorophyll-a ✓ ✓ ✓ ✓
Annual mean of chlorophyll-a ✓ ✓ ✓ ✓ ✓
Ratio of area with high Chlorophyll-a concentration to ✓
Red tide events ✓
Red tide events (diatom sp.) ✓ ✓ ✓
Red tide events (dinoflagellate sp.) ✓ ✓
III Annual minimum DO6) (surface) ✓ ✓ ✓
Annual minimum DO6) (bottom) ✓
Annual mean DO6) (surface) ✓
Annual mean DO6) (bottom) ✓ ✓
Fish kill incidents ✓ ✓ ✓ ✓
Annual mean COD7) ✓ ✓ ✓ ✓
IV Red tide events (Noctiluca sp.) ✓ ✓ ✓
Shell fish poisoning incidents ✓ ✓ ✓
Benthic fauna and flora ✓
Kill fishes ✓ 1) TN: total nitrogen 2) TP: total phosphorus 3) DIN: dissolved inorganic nitrogen 4) DIP: dissolved inorganic phosphate
5) DSi: dissolved silicic acid 6) DO: dissolved oxygen 7) COD: chemical oxygen demand
- 24 -
2.4 Assessment parameters and their national standards in NOWPAP member states 2.4.1 Standards in China
The Ministry of Environmental Protection of the People’s Republic of China (MEP) is responsible for all surface water, including lakes, reservoirs, rivers, underground water, coastal and near-shore seawater, and wastewater discharge. MEP monitors water quality, biology, sediments and discharge volumes. They provide national laws and regulations, such as the Environmental Protection Law and the Water Pollution Prevention Law. Monitoring units at every administrative level carry out routine monitoring tasks and additional tasks designated by supervisory requirements.
There are four levels of environmental monitoring in China: (1) China’s National Environmental Monitoring Center; (2) environmental monitoring centers in different provinces or municipalities governed by the central government; (3) environmental monitoring centers in municipalities governed by the provincial government; and (4) environmental monitoring centers of the counties and the district of municipalities.
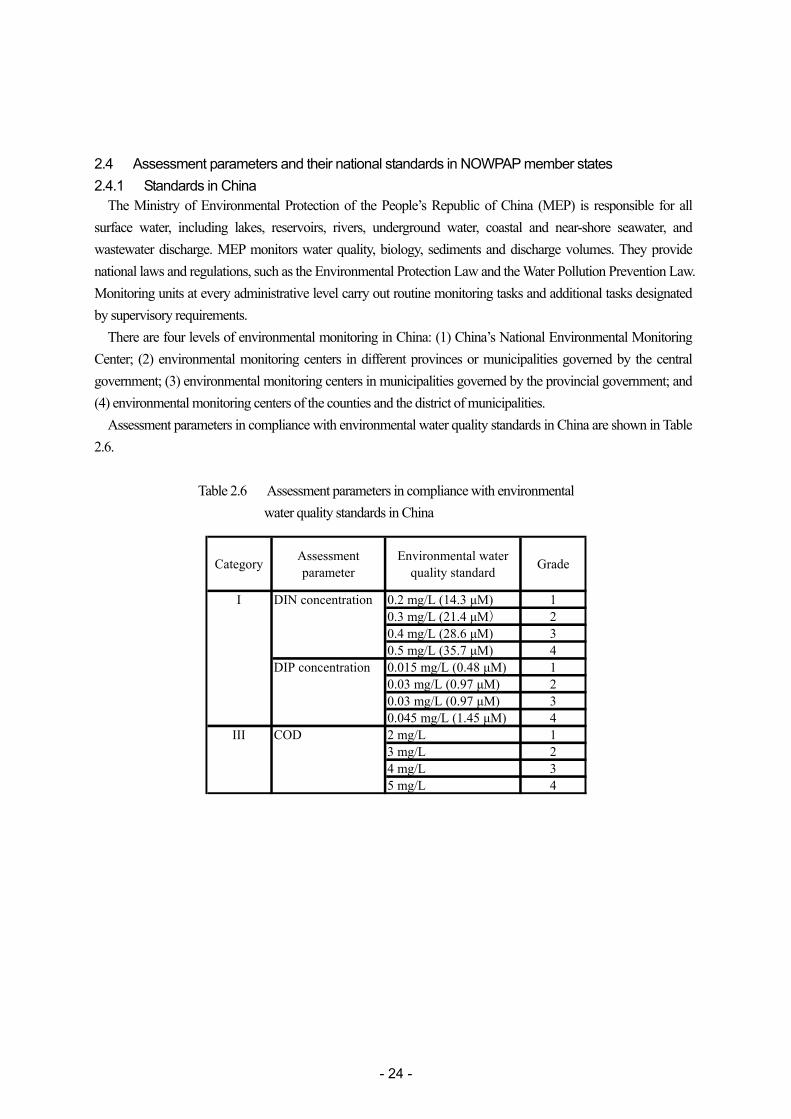
Assessment parameters in compliance with environmental water quality standards in China are shown in Table 2.6.
Table 2.6 Assessment parameters in compliance with environmental
water quality standards in China
Category Assessmentparameter
Environmental waterquality standard Grade
0.2 mg/L (14.3 μM) 10.3 mg/L (21.4 μM) 20.4 mg/L (28.6 μM) 30.5 mg/L (35.7 μM) 40.015 mg/L (0.48 μM) 10.03 mg/L (0.97 μM) 20.03 mg/L (0.97 μM) 30.045 mg/L (1.45 μM) 42 mg/L 13 mg/L 24 mg/L 35 mg/L 4
I DIN concentration
DIP concentration
III COD
- 25 -
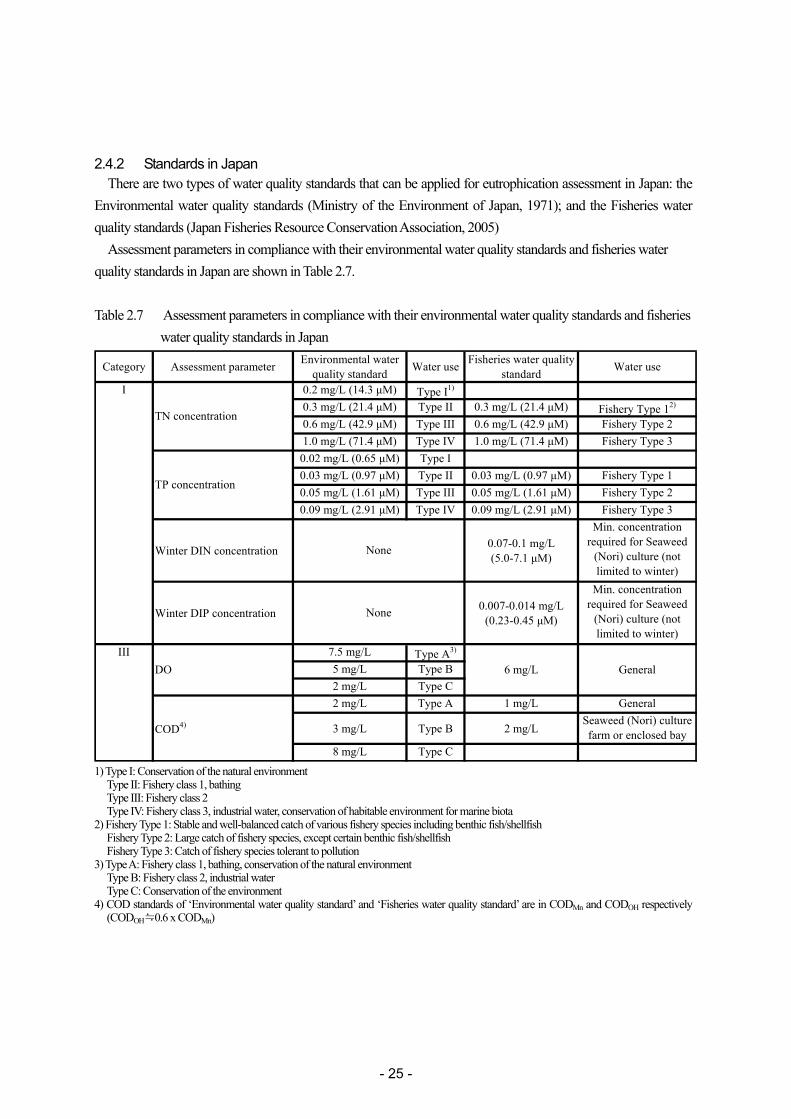
2.4.2 Standards in Japan There are two types of water quality standards that can be applied for eutrophication assessment in Japan: the
Environmental water quality standards (Ministry of the Environment of Japan, 1971); and the Fisheries water quality standards (Japan Fisheries Resource Conservation Association, 2005)
Assessment parameters in compliance with their environmental water quality standards and fisheries water quality standards in Japan are shown in Table 2.7. Table 2.7 Assessment parameters in compliance with their environmental water quality standards and fisheries
water quality standards in Japan
Category Assessment parameter Environmental waterquality standard Water use Fisheries water quality
standard Water use
0.2 mg/L (14.3 μM) Type I1)
0.3 mg/L (21.4 μM) Type II 0.3 mg/L (21.4 μM) Fishery Type 12)
0.6 mg/L (42.9 μM) Type III 0.6 mg/L (42.9 μM) Fishery Type 21.0 mg/L (71.4 μM) Type IV 1.0 mg/L (71.4 μM) Fishery Type 3
0.02 mg/L (0.65 μM) Type I0.03 mg/L (0.97 μM) Type II 0.03 mg/L (0.97 μM) Fishery Type 10.05 mg/L (1.61 μM) Type III 0.05 mg/L (1.61 μM) Fishery Type 20.09 mg/L (2.91 μM) Type IV 0.09 mg/L (2.91 μM) Fishery Type 3
Winter DIN concentration 0.07-0.1 mg/L(5.0-7.1 μM)
Min. concentrationrequired for Seaweed
(Nori) culture (notlimited to winter)
Winter DIP concentration 0.007-0.014 mg/L(0.23-0.45 μM)
Min. concentrationrequired for Seaweed
(Nori) culture (notlimited to winter)
7.5 mg/L Type A3)
5 mg/L Type B2 mg/L Type C2 mg/L Type A 1 mg/L General
3 mg/L Type B 2 mg/LSeaweed (Nori) culturefarm or enclosed bay
8 mg/L Type C
COD4)
None
None
6 mg/L
TN concentration
TP concentration
I
IIIDO General
1) Type I: Conservation of the natural environment
Type II: Fishery class 1, bathing Type III: Fishery class 2 Type IV: Fishery class 3, industrial water, conservation of habitable environment for marine biota
2) Fishery Type 1: Stable and well-balanced catch of various fishery species including benthic fish/shellfish Fishery Type 2: Large catch of fishery species, except certain benthic fish/shellfish Fishery Type 3: Catch of fishery species tolerant to pollution
3) Type A: Fishery class 1, bathing, conservation of the natural environment Type B: Fishery class 2, industrial water Type C: Conservation of the environment
4) COD standards of ‘Environmental water quality standard’ and ‘Fisheries water quality standard’ are in CODMn and CODOH respectively (CODOH≒0.6 x CODMn)
- 26 -
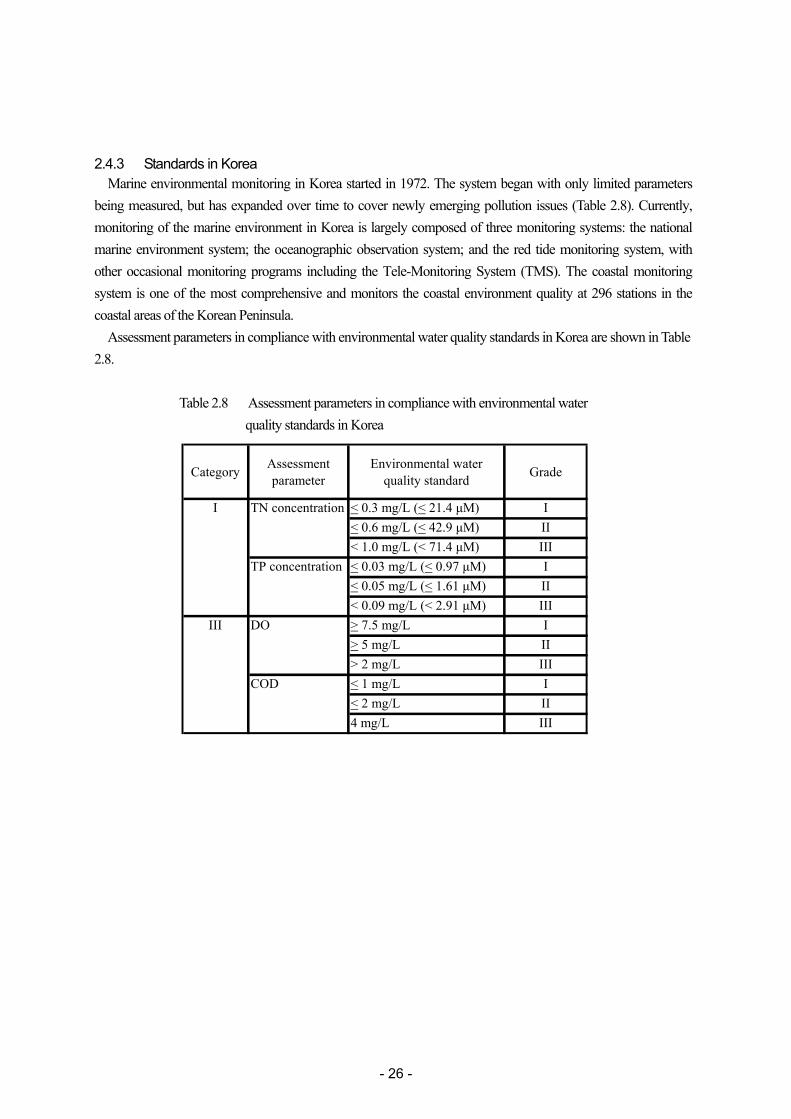
2.4.3 Standards in Korea Marine environmental monitoring in Korea started in 1972. The system began with only limited parameters
being measured, but has expanded over time to cover newly emerging pollution issues (Table 2.8). Currently, monitoring of the marine environment in Korea is largely composed of three monitoring systems: the national marine environment system; the oceanographic observation system; and the red tide monitoring system, with other occasional monitoring programs including the Tele-Monitoring System (TMS). The coastal monitoring system is one of the most comprehensive and monitors the coastal environment quality at 296 stations in the coastal areas of the Korean Peninsula.
Assessment parameters in compliance with environmental water quality standards in Korea are shown in Table 2.8.
Table 2.8 Assessment parameters in compliance with environmental water
quality standards in Korea
Category Assessmentparameter
Environmental waterquality standard Grade
< 0.3 mg/L (< 21.4 μM) I< 0.6 mg/L (< 42.9 μM) II< 1.0 mg/L (< 71.4 μM) III< 0.03 mg/L (< 0.97 μM) I< 0.05 mg/L (< 1.61 μM) II< 0.09 mg/L (< 2.91 μM) III> 7.5 mg/L I> 5 mg/L II> 2 mg/L III< 1 mg/L I< 2 mg/L II4 mg/L III
I TN concentration
TP concentration
III DO
COD
- 27 -
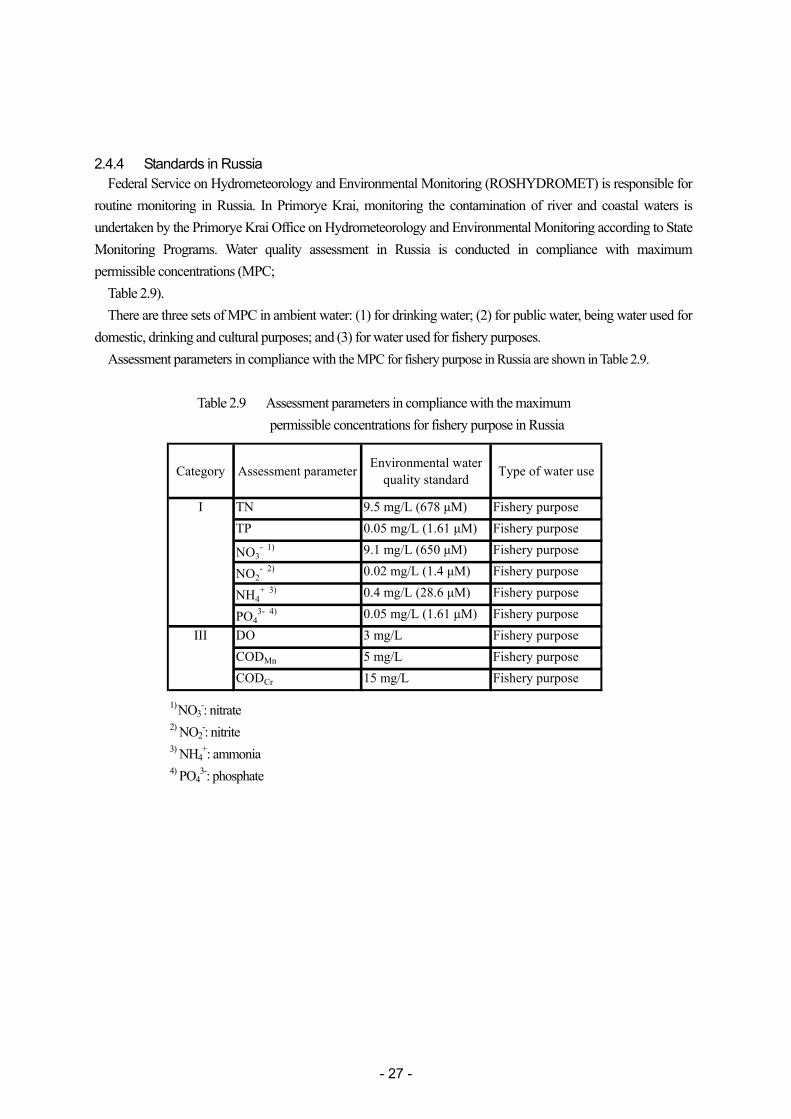
2.4.4 Standards in Russia Federal Service on Hydrometeorology and Environmental Monitoring (ROSHYDROMET) is responsible for
routine monitoring in Russia. In Primorye Krai, monitoring the contamination of river and coastal waters is undertaken by the Primorye Krai Office on Hydrometeorology and Environmental Monitoring according to State Monitoring Programs. Water quality assessment in Russia is conducted in compliance with maximum permissible concentrations (MPC;
Table 2.9). There are three sets of MPC in ambient water: (1) for drinking water; (2) for public water, being water used for
domestic, drinking and cultural purposes; and (3) for water used for fishery purposes. Assessment parameters in compliance with the MPC for fishery purpose in Russia are shown in Table 2.9.
Table 2.9 Assessment parameters in compliance with the maximum
permissible concentrations for fishery purpose in Russia
Category Assessment parameter Environmental waterquality standard Type of water use
TN 9.5 mg/L (678 μM) Fishery purposeTP 0.05 mg/L (1.61 μM) Fishery purpose
NO3- 1) 9.1 mg/L (650 μM) Fishery purpose
NO2- 2) 0.02 mg/L (1.4 μM) Fishery purpose
NH4+ 3) 0.4 mg/L (28.6 μM) Fishery purpose
PO43- 4) 0.05 mg/L (1.61 μM) Fishery purpose
DO 3 mg/L Fishery purposeCODMn 5 mg/L Fishery purposeCODCr 15 mg/L Fishery purpose
I
III
1) NO3
-: nitrate 2) NO2
-: nitrite 3) NH4
+: ammonia 4) PO4
3-: phosphate
- 28 -
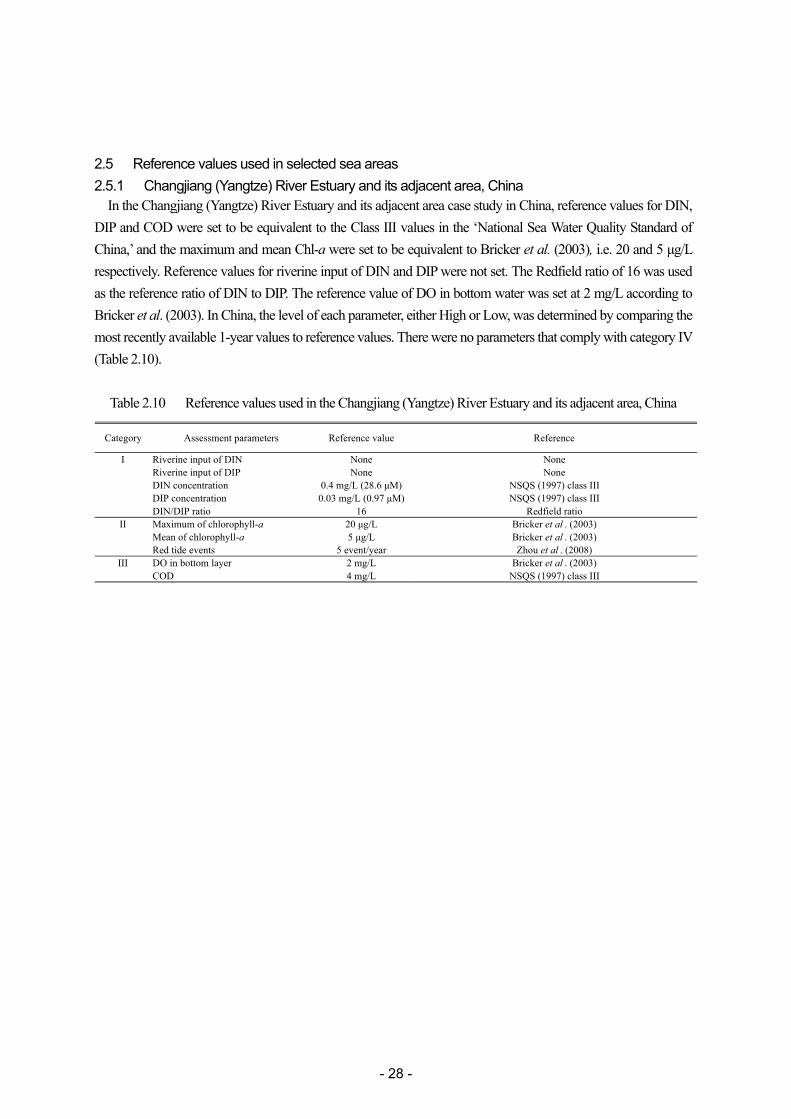
2.5 Reference values used in selected sea areas 2.5.1 Changjiang (Yangtze) River Estuary and its adjacent area, China
In the Changjiang (Yangtze) River Estuary and its adjacent area case study in China, reference values for DIN, DIP and COD were set to be equivalent to the Class III values in the ‘National Sea Water Quality Standard of China,’ and the maximum and mean Chl-a were set to be equivalent to Bricker et al. (2003), i.e. 20 and 5 μg/L respectively. Reference values for riverine input of DIN and DIP were not set. The Redfield ratio of 16 was used as the reference ratio of DIN to DIP. The reference value of DO in bottom water was set at 2 mg/L according to Bricker et al. (2003). In China, the level of each parameter, either High or Low, was determined by comparing the most recently available 1-year values to reference values. There were no parameters that comply with category IV (Table 2.10).
Table 2.10 Reference values used in the Changjiang (Yangtze) River Estuary and its adjacent area, China
Category Assessment parameters Reference value Reference
I Riverine input of DIN None NoneRiverine input of DIP None NoneDIN concentration 0.4 mg/L (28.6 μM) NSQS (1997) class IIIDIP concentration 0.03 mg/L (0.97 μM) NSQS (1997) class IIIDIN/DIP ratio 16 Redfield ratio
II Maximum of chlorophyll-a 20 μg/L Bricker et al . (2003)Mean of chlorophyll-a 5 μg/L Bricker et al . (2003)Red tide events 5 event/year Zhou et al . (2008)
III DO in bottom layer 2 mg/L Bricker et al . (2003)COD 4 mg/L NSQS (1997) class III
- 29 -
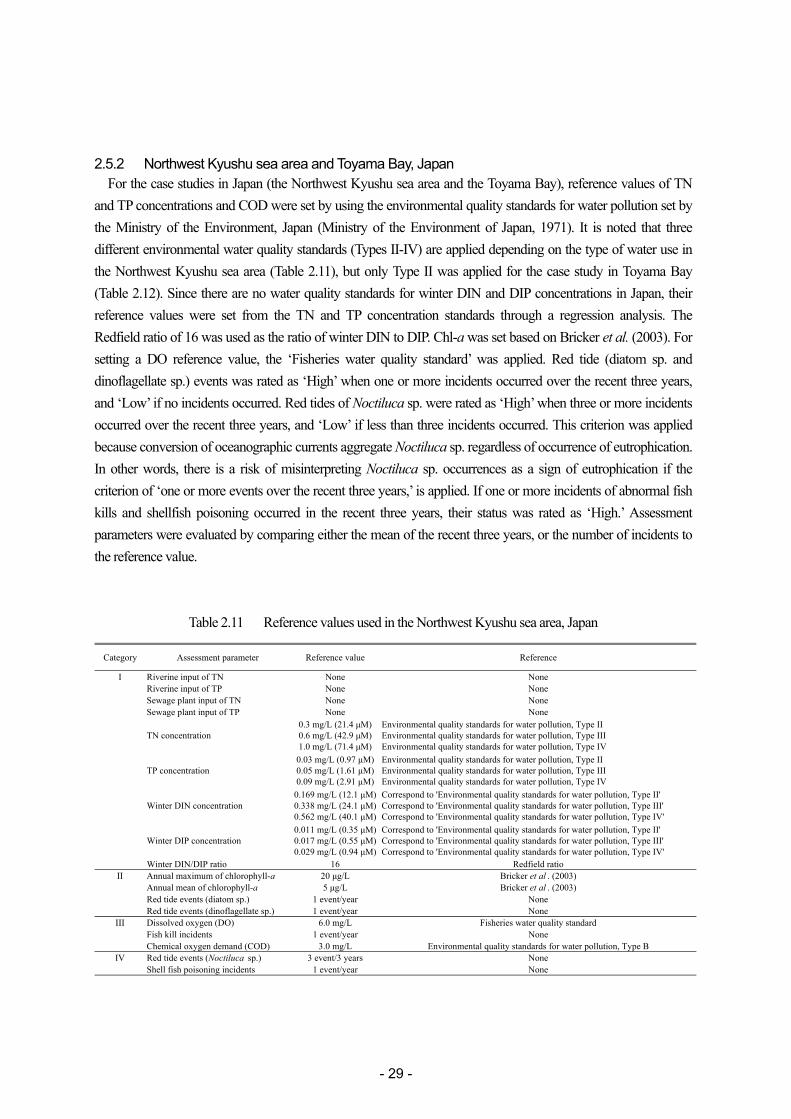
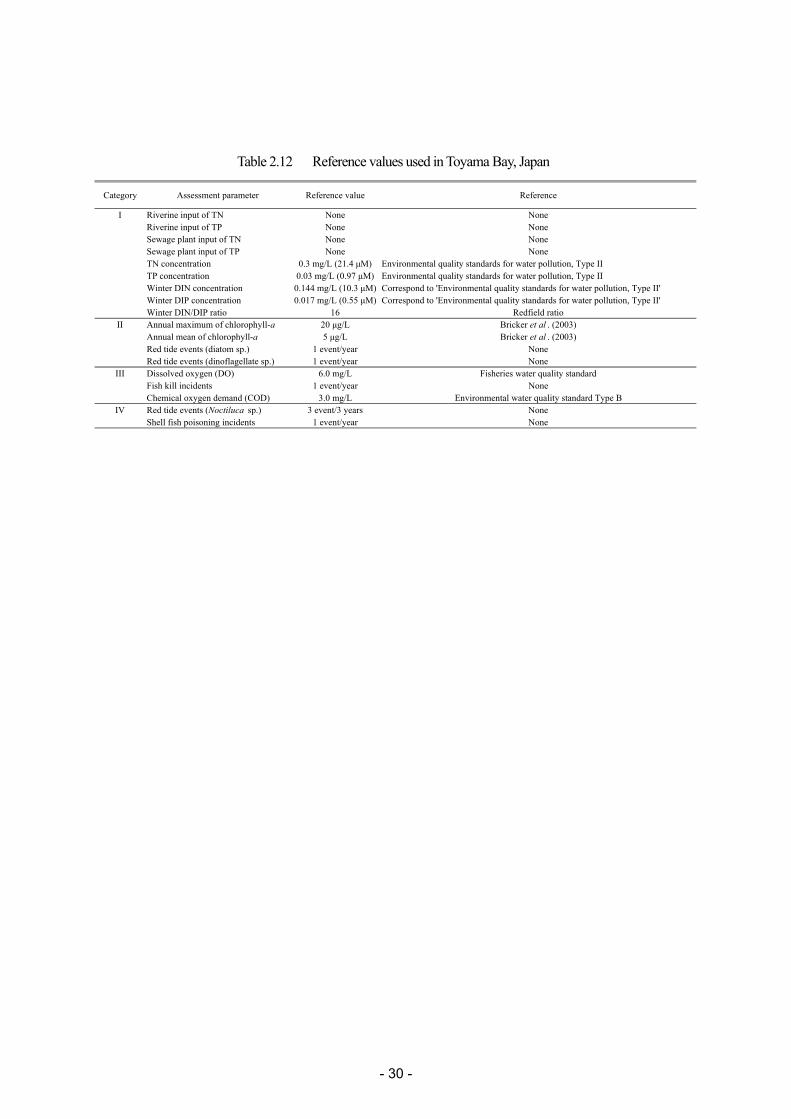
2.5.2 Northwest Kyushu sea area and Toyama Bay, Japan For the case studies in Japan (the Northwest Kyushu sea area and the Toyama Bay), reference values of TN
and TP concentrations and COD were set by using the environmental quality standards for water pollution set by the Ministry of the Environment, Japan (Ministry of the Environment of Japan, 1971). It is noted that three different environmental water quality standards (Types II-IV) are applied depending on the type of water use in the Northwest Kyushu sea area (Table 2.11), but only Type II was applied for the case study in Toyama Bay (Table 2.12). Since there are no water quality standards for winter DIN and DIP concentrations in Japan, their reference values were set from the TN and TP concentration standards through a regression analysis. The Redfield ratio of 16 was used as the ratio of winter DIN to DIP. Chl-a was set based on Bricker et al. (2003). For setting a DO reference value, the ‘Fisheries water quality standard’ was applied. Red tide (diatom sp. and dinoflagellate sp.) events was rated as ‘High’ when one or more incidents occurred over the recent three years, and ‘Low’ if no incidents occurred. Red tides of Noctiluca sp. were rated as ‘High’ when three or more incidents occurred over the recent three years, and ‘Low’ if less than three incidents occurred. This criterion was applied because conversion of oceanographic currents aggregate Noctiluca sp. regardless of occurrence of eutrophication. In other words, there is a risk of misinterpreting Noctiluca sp. occurrences as a sign of eutrophication if the criterion of ‘one or more events over the recent three years,’ is applied. If one or more incidents of abnormal fish kills and shellfish poisoning occurred in the recent three years, their status was rated as ‘High.’ Assessment parameters were evaluated by comparing either the mean of the recent three years, or the number of incidents to the reference value.
Table 2.11 Reference values used in the Northwest Kyushu sea area, Japan
Category Assessment parameter Reference value Reference
I Riverine input of TN None NoneRiverine input of TP None NoneSewage plant input of TN None NoneSewage plant input of TP None None
TN concentration0.3 mg/L (21.4 μM)0.6 mg/L (42.9 μM)1.0 mg/L (71.4 μM)
Environmental quality standards for water pollution, Type IIEnvironmental quality standards for water pollution, Type IIIEnvironmental quality standards for water pollution, Type IV
TP concentration0.03 mg/L (0.97 μM)0.05 mg/L (1.61 μM)0.09 mg/L (2.91 μM)
Environmental quality standards for water pollution, Type IIEnvironmental quality standards for water pollution, Type IIIEnvironmental quality standards for water pollution, Type IV
Winter DIN concentration0.169 mg/L (12.1 μM)0.338 mg/L (24.1 μM)0.562 mg/L (40.1 μM)
Correspond to 'Environmental quality standards for water pollution, Type II'Correspond to 'Environmental quality standards for water pollution, Type III'Correspond to 'Environmental quality standards for water pollution, Type IV'
Winter DIP concentration0.011 mg/L (0.35 μM)0.017 mg/L (0.55 μM)0.029 mg/L (0.94 μM)
Correspond to 'Environmental quality standards for water pollution, Type II'Correspond to 'Environmental quality standards for water pollution, Type III'Correspond to 'Environmental quality standards for water pollution, Type IV'
Winter DIN/DIP ratio 16 Redfield ratioII Annual maximum of chlorophyll-a 20 μg/L Bricker et al . (2003)
Annual mean of chlorophyll-a 5 μg/L Bricker et al . (2003)Red tide events (diatom sp.) 1 event/year NoneRed tide events (dinoflagellate sp.) 1 event/year None
III Dissolved oxygen (DO) 6.0 mg/L Fisheries water quality standardFish kill incidents 1 event/year NoneChemical oxygen demand (COD) 3.0 mg/L Environmental quality standards for water pollution, Type B
IV Red tide events (Noctiluca sp.) 3 event/3 years NoneShell fish poisoning incidents 1 event/year None
- 30 -
Table 2.12 Reference values used in Toyama Bay, Japan
Category Assessment parameter Reference value Reference
I Riverine input of TN None NoneRiverine input of TP None NoneSewage plant input of TN None NoneSewage plant input of TP None NoneTN concentration 0.3 mg/L (21.4 μM) Environmental quality standards for water pollution, Type IITP concentration 0.03 mg/L (0.97 μM) Environmental quality standards for water pollution, Type IIWinter DIN concentration 0.144 mg/L (10.3 μM) Correspond to 'Environmental quality standards for water pollution, Type II'Winter DIP concentration 0.017 mg/L (0.55 μM) Correspond to 'Environmental quality standards for water pollution, Type II'Winter DIN/DIP ratio 16 Redfield ratio
II Annual maximum of chlorophyll-a 20 μg/L Bricker et al . (2003)Annual mean of chlorophyll-a 5 μg/L Bricker et al . (2003)Red tide events (diatom sp.) 1 event/year NoneRed tide events (dinoflagellate sp.) 1 event/year None
III Dissolved oxygen (DO) 6.0 mg/L Fisheries water quality standardFish kill incidents 1 event/year NoneChemical oxygen demand (COD) 3.0 mg/L Environmental water quality standard Type B
IV Red tide events (Noctiluca sp.) 3 event/3 years NoneShell fish poisoning incidents 1 event/year None
- 31 -
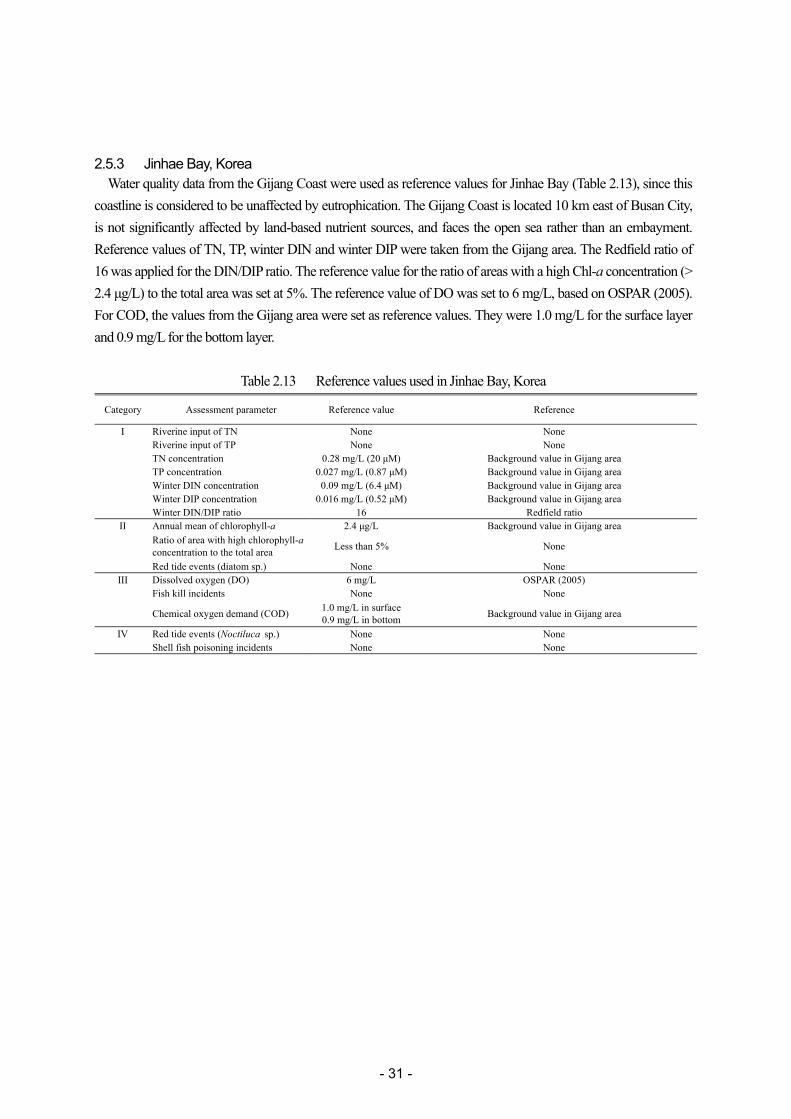
2.5.3 Jinhae Bay, Korea Water quality data from the Gijang Coast were used as reference values for Jinhae Bay (Table 2.13), since this
coastline is considered to be unaffected by eutrophication. The Gijang Coast is located 10 km east of Busan City, is not significantly affected by land-based nutrient sources, and faces the open sea rather than an embayment. Reference values of TN, TP, winter DIN and winter DIP were taken from the Gijang area. The Redfield ratio of 16 was applied for the DIN/DIP ratio. The reference value for the ratio of areas with a high Chl-a concentration (> 2.4 μg/L) to the total area was set at 5%. The reference value of DO was set to 6 mg/L, based on OSPAR (2005). For COD, the values from the Gijang area were set as reference values. They were 1.0 mg/L for the surface layer and 0.9 mg/L for the bottom layer.
Table 2.13 Reference values used in Jinhae Bay, Korea
Category Assessment parameter Reference value Reference
I Riverine input of TN None NoneRiverine input of TP None NoneTN concentration 0.28 mg/L (20 μM) Background value in Gijang areaTP concentration 0.027 mg/L (0.87 μM) Background value in Gijang areaWinter DIN concentration 0.09 mg/L (6.4 μM) Background value in Gijang areaWinter DIP concentration 0.016 mg/L (0.52 μM) Background value in Gijang areaWinter DIN/DIP ratio 16 Redfield ratio
II Annual mean of chlorophyll-a 2.4 μg/L Background value in Gijang areaRatio of area with high chlorophyll-aconcentration to the total area Less than 5% None
Red tide events (diatom sp.) None NoneIII Dissolved oxygen (DO) 6 mg/L OSPAR (2005)
Fish kill incidents None None
Chemical oxygen demand (COD) 1.0 mg/L in surface0.9 mg/L in bottom Background value in Gijang area
IV Red tide events (Noctiluca sp.) None NoneShell fish poisoning incidents None None
- 32 -
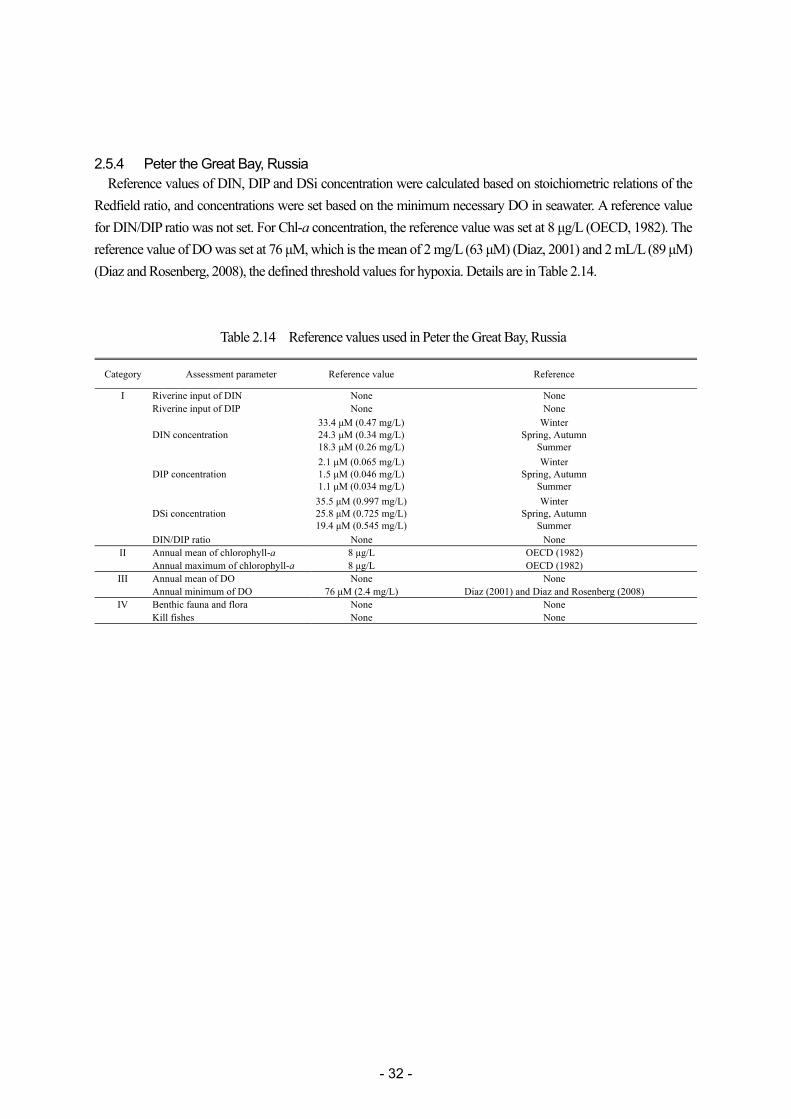
2.5.4 Peter the Great Bay, Russia Reference values of DIN, DIP and DSi concentration were calculated based on stoichiometric relations of the
Redfield ratio, and concentrations were set based on the minimum necessary DO in seawater. A reference value for DIN/DIP ratio was not set. For Chl-a concentration, the reference value was set at 8 μg/L (OECD, 1982). The reference value of DO was set at 76 μM, which is the mean of 2 mg/L (63 μM) (Diaz, 2001) and 2 mL/L (89 μM) (Diaz and Rosenberg, 2008), the defined threshold values for hypoxia. Details are in Table 2.14.
Table 2.14 Reference values used in Peter the Great Bay, Russia
Category Assessment parameter Reference value Reference
I Riverine input of DIN None NoneRiverine input of DIP None None
DIN concentration33.4 μM (0.47 mg/L)24.3 μM (0.34 mg/L)18.3 μM (0.26 mg/L)
WinterSpring, Autumn
Summer
DIP concentration2.1 μM (0.065 mg/L)1.5 μM (0.046 mg/L)1.1 μM (0.034 mg/L)
WinterSpring, Autumn
Summer
DSi concentration35.5 μM (0.997 mg/L)25.8 μM (0.725 mg/L)19.4 μM (0.545 mg/L)
WinterSpring, Autumn
SummerDIN/DIP ratio None None
II Annual mean of chlorophyll-a 8 μg/L OECD (1982)Annual maximum of chlorophyll-a 8 μg/L OECD (1982)
III Annual mean of DO None NoneAnnual minimum of DO 76 μM (2.4 mg/L) Diaz (2001) and Diaz and Rosenberg (2008)
IV Benthic fauna and flora None NoneKill fishes None None
- 33 -
2.6 Assessment data used in selected sea areas 2.6.1 Changjiang (Yangtze) River Estuary and its adjacent area, China
In the Changjiang (Yangtze) River Estuary and its adjacent area in China, assessment data were prepared based on the information as summarized in Table 2.15.
Table 2.15 Assessment data in the Changjiang (Yangtze) River Estuary and its adjacent area, China
Category Assessment parameter Spatial and temporal conditions
I Riverine input of DIN Annual input from the Changjiang (Yangtze) RiverRiverine input of DIP Annual input from the Changjiang (Yangtze) RiverDIN concentration Annual mean of spatially merged surface dataDIP concentration Annual mean of spatially merged surface dataDIN/DIP ratio Annual mean of spatially merged surface data
II Maximum of chlorophyll-a Annual maximum of spatially merged surface dataMean of chlorophyll-a Annual mean of spatially merged surface dataRed tide events Number of occurrences per year
III DO Annual mean of spatially merged bottom dataCOD Annual mean of spatially merged surface data
- 34 -
2.6.2 Northwest Kyushu sea area and Toyama Bay, Japan In the Northwest Kyushu sea area and Toyama Bay, Japan, the assessment data were prepared based on the
information as summarized in Table 2.16 and Table 2.17.
Table 2.16 Assessment data in the Northwest Kyushu sea area, Japan
Category Assessment parameter Spatial and temporal conditions
I Riverine input of TN Annual input from the 30 RiversRiverine input of TP Annual input from the 30 RiversSewage plant input of TN Annual input from the 11 sewage plantsSewage plant input of TP Annual input from the 11 sewage plantsTN concentration Annual mean of surface data at each stationTP concentration Annual mean of surface data at each stationWinter DIN concentration Seasonal (Jan-Mar) mean of surface data at each stationWinter DIP concentration Seasonal (Jan-Mar) mean of surface data at each stationWinter DIN/DIP ratio Seasonal (Jan-Mar) mean of surface data at each station
II Annual maximum of chlorophyll-a Annual maximumof surface data at each stationAnnual mean of chlorophyll-a Annual meanof surface data at each stationRed tide events (diatom sp.) Number of occurrences per yearRed tide events (dinoflagellate sp.) Number of occurrences per year
III Dissolved oxygen (DO) Annual minimumof surface data at each stationFish kill incidents Number of occurrences per yearChemical oxygen demand (COD) Annual mean surface data at each station
IV Red tide events (Noctiluca sp.) Number of occurrences per yearShell fish poisoning incidents Number of occurrences per year
Table 2.17 Assessment data in Toyama Bay, Japan
Category Assessment parameter Spatial and temporal conditions
I Riverine input of TN Annual input from the five RiversRiverine input of TP Annual input from the five RiversSewage plant input of TN noneSewage plant input of TP noneTN concentration Annual mean of surface data at each stationTP concentration Annual mean of surface data at each stationWinter DIN concentration Seasonal (Jan-Mar) mean of surface data at eachWinter DIP concentration Seasonal (Jan-Mar) mean of surface data at eachWinter DIN/DIP ratio Seasonal (Jan-Mar) mean of surface data at each
II Annual maximum of chlorophyll-a Annual maximum of surface data at each stationAnnual mean of chlorophyll-a Annual mean of surface data at each stationRed tide events (diatom sp.) Number of occurrences per yearRed tide events (dinoflagellate sp.) Number of occurrences per year
III Dissolved oxygen (DO) Annual minimum of surface data at each stationFish kill incidents Number of occurrences per yearChemical oxygen demand (COD) Annual mean of surface data at each station
IV Red tide events (Noctiluca sp.) Number of occurrences per yearShell fish poisoning incidents Number of occurrences per year
- 35 -
2.6.3 Jinhae Bay, Korea In Jinhae Bay, Korea, the assessment data were prepared based on the information as summarized in Table
2.18.
Table 2.18 Assessment data in Jinhae Bay, Korea
Category Assessment parameter Spatial and temporal conditions
I Riverine input of TN Annual input of the RiverRiverine input of TP Annual input of the RiverTN concentration Annual mean of surface data at each stationTP concentration Annual mean of surface data at each stationWinter DIN concentration Seasonal (Jan-Mar) mean of surface data at eachWinter DIP concentration Seasonal (Jan-Mar) mean of surface data at eachWinter DIN/DIP ratio Seasonal (Jan-Mar) mean of surface data at each
II Annual mean of chlorophyll-a Annual mean of surface data at each stationRatio of area with high chlorophyll-aconcentration to the total area Annual mean of spatially merged surface data
Red tide events (diatom sp.) Number of occurrences per yearIII Dissolved oxygen (DO) Number of occurrences per year
Fish kill incidents Number of occurrences per yearChemical oxygen demand (COD) Annual mean of surface data at each station
IV Red tide events (Noctiluca sp.) Number of occurrences per yearShell fish poisoning incidents Number of occurrences per year
2.6.4 Peter the Great Bay, Russia In Peter the Great Bay, Russia, the assessment data were prepared based on the information as summarized in
Table 2.19.
Table 2.19 Assessment data in Peter the Great Bay, Russia
Category Assessment parameter Spatial and temporal conditions
I Riverine input of DIN Annual input from the RiverRiverine input of DIP Annual input from the RiverDIN concentration Seasonal (Jan-Mar) mean of surface data at each stationDIP concentration Seasonal (Jan-Mar) mean of surface data at each stationDSi concentration Seasonal (Jan-Mar) mean of surface data at each stationDIN/DIP ratio Seasonal (Jan-Mar) mean of surface data at each station
II Annual mean of chlorophyll-a -Annual maximum of chlorophyll-a Annual maximum of surface data in each station
III Annual mean of DO -Annual minimum of DO Seasonal minimum of at surface and bottom at each station
IV Benthic fauna and flora -Kill fishes Number of occurrences per year
- 36 -
3 Eutrophication status in selected sea areas of the NOWPAP region 3.1 Changjiang (Yangtze) River Estuary and its adjacent area, China
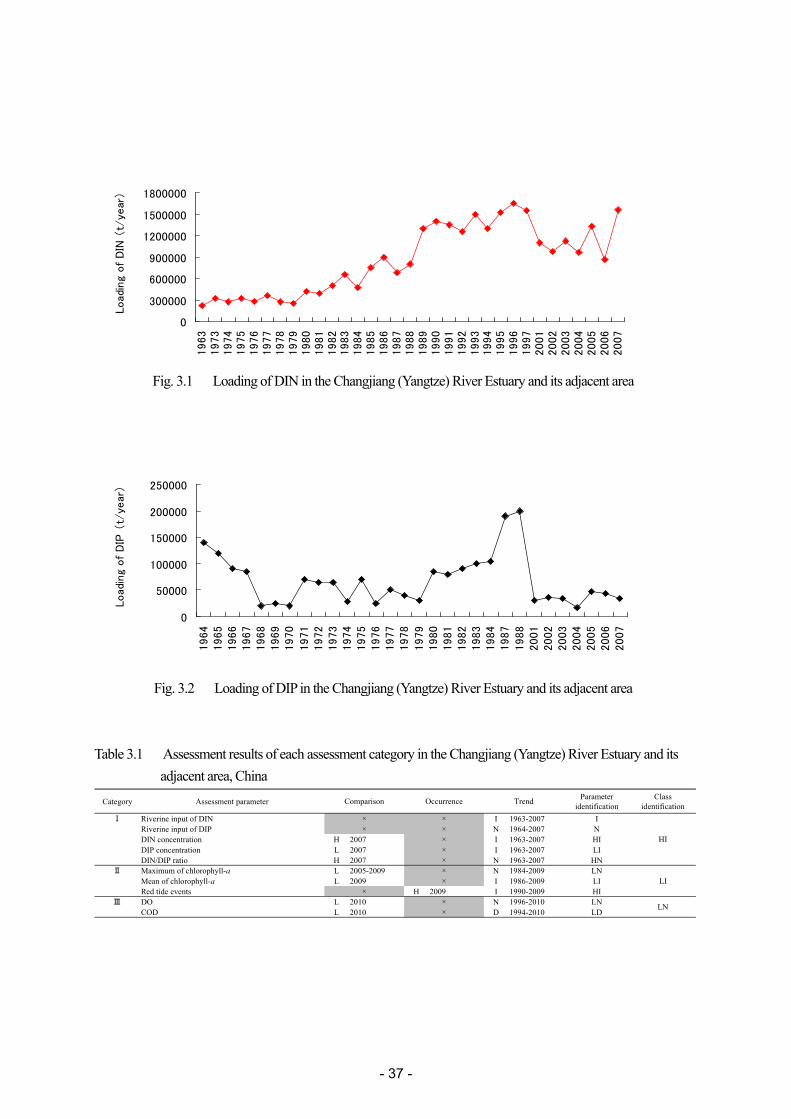
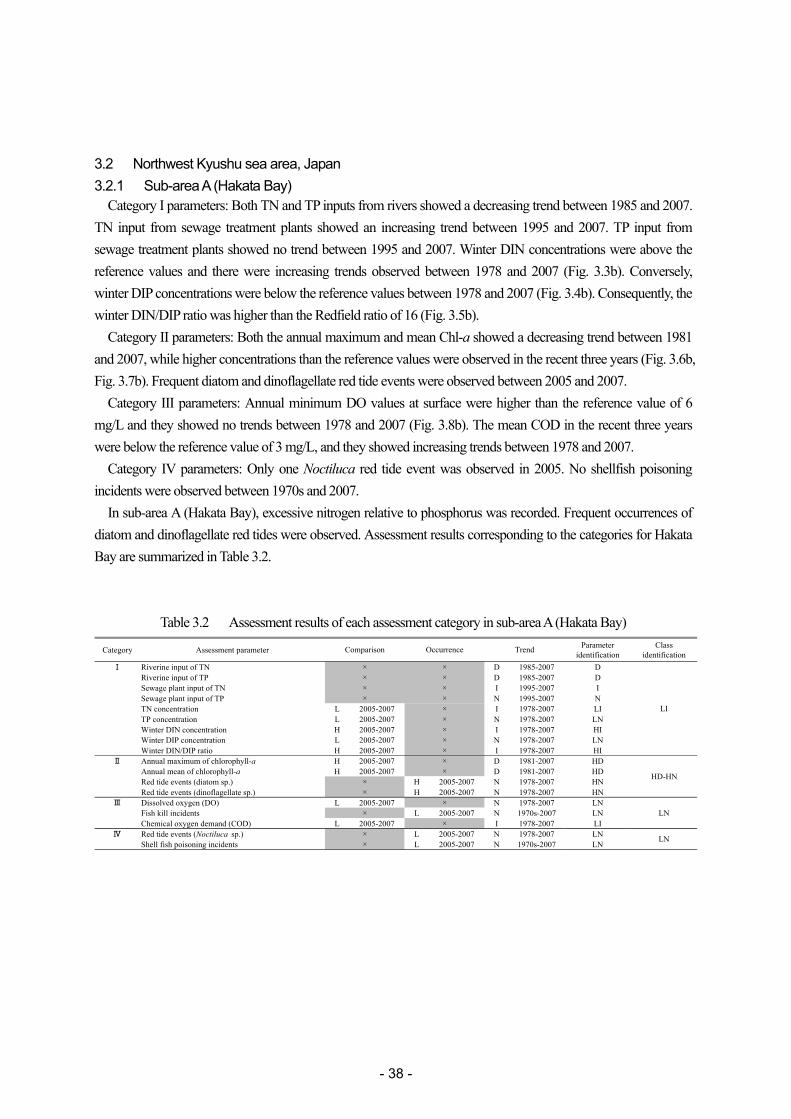
Category I parameters: Riverine input of DIN from the Changjiang (Yangtze) River showed an increasing trend between 1963 and 2007 (Fig. 3.1), whereas the input of DIP showed no trend between 1964 and 2007 (Fig. 3.2). DIN concentrations were higher than the reference value (28.6 μM) except in 1963 (Fig. 3.3a). However, the DIP concentration was generally lower than the reference value of 0.97 μM (Fig. 3.4a). Nutrient pollution of nitrogen was serious in this estuary, and also resulted in the high DIN/DIP ratio (Fig. 3.5a). Therefore, Category I was classified as ‘HI’.
Category II parameters: The average of annual maximum Chl-a in 2005, 2006 and 2009 was lower than the reference value of 20 μg/L, and no trend was detected between 1984 and 2009 (Fig. 3.6a). The annual mean Chl-a in 2009 was lower than the reference value (5 μg/L), but an increasing trend was detected between 1986 and 2009 (Fig. 3.7a). High occurrences of red tide events with an increasing trend were observed between 1990 and 2009. Therefore, Category II was classified as ‘LI’.
Category III parameters: DO at the bottom layer showed no trend between 1996 and 2010 and it was generally higher than the reference value of 2 mg/L (Fig. 3.8a). COD was lower than the reference value of 4 mg/L in 2010 and a decreasing trend was detected between 1994 and 2010. Therefore, Category III was classified as ‘LN’.
The Changjiang (Yangtze) River Estuary and its adjacent area was classified as ‘HI’, ‘LI’ and ‘LN’ in Category I, II and III, respectively. Assessment results corresponding to these categories are summarized in Table 3.1.
- 37 -
Fig. 3.1 Loading of DIN in the Changjiang (Yangtze) River Estuary and its adjacent area
Fig. 3.2 Loading of DIP in the Changjiang (Yangtze) River Estuary and its adjacent area
Table 3.1 Assessment results of each assessment category in the Changjiang (Yangtze) River Estuary and its adjacent area, China
Category Assessment parameter Parameteridentification
Classidentification
Ⅰ Riverine input of DIN I 1963-2007 IRiverine input of DIP N 1964-2007 NDIN concentration H 2007 I 1963-2007 HIDIP concentration L 2007 I 1963-2007 LIDIN/DIP ratio H 2007 N 1963-2007 HN
Ⅱ Maximum of chlorophyll-a L 2005-2009 N 1984-2009 LNMean of chlorophyll-a L 2009 I 1986-2009 LIRed tide events H 2009 I 1990-2009 HI
Ⅲ DO L 2010 N 1996-2010 LNCOD L 2010 D 1994-2010 LD
××
××××××
HI
LI
LN
Comparison Occurrence Trend
××
×
×
0
300000
600000
900000
1200000
1500000
18000001963
1973
1974
1975
1976
1977
1978
1979
1980
1981
1982
1983
1984
1985
1986
1987
1988
1989
1990
1991
1992
1993
1994
1995
1996
1997
2001
2002
2003
2004
2005
2006
2007
Load
ing
of
DIN
(t/
year
)
0
50000
100000
150000
200000
250000
1964
1965
1966
1967
1968
1969
1970
1971
1972
1973
1974
1975
1976
1977
1978
1979
1980
1981
1982
1983
1984
1987
1988
2001
2002
2003
2004
2005
2006
2007
Load
ing
of
DIP
(t/
year
)
- 38 -
3.2 Northwest Kyushu sea area, Japan 3.2.1 Sub-area A (Hakata Bay)
Category I parameters: Both TN and TP inputs from rivers showed a decreasing trend between 1985 and 2007. TN input from sewage treatment plants showed an increasing trend between 1995 and 2007. TP input from sewage treatment plants showed no trend between 1995 and 2007. Winter DIN concentrations were above the reference values and there were increasing trends observed between 1978 and 2007 (Fig. 3.3b). Conversely, winter DIP concentrations were below the reference values between 1978 and 2007 (Fig. 3.4b). Consequently, the winter DIN/DIP ratio was higher than the Redfield ratio of 16 (Fig. 3.5b).
Category II parameters: Both the annual maximum and mean Chl-a showed a decreasing trend between 1981 and 2007, while higher concentrations than the reference values were observed in the recent three years (Fig. 3.6b, Fig. 3.7b). Frequent diatom and dinoflagellate red tide events were observed between 2005 and 2007.
Category III parameters: Annual minimum DO values at surface were higher than the reference value of 6 mg/L and they showed no trends between 1978 and 2007 (Fig. 3.8b). The mean COD in the recent three years were below the reference value of 3 mg/L, and they showed increasing trends between 1978 and 2007.
Category IV parameters: Only one Noctiluca red tide event was observed in 2005. No shellfish poisoning incidents were observed between 1970s and 2007.
In sub-area A (Hakata Bay), excessive nitrogen relative to phosphorus was recorded. Frequent occurrences of diatom and dinoflagellate red tides were observed. Assessment results corresponding to the categories for Hakata Bay are summarized in Table 3.2.
Table 3.2 Assessment results of each assessment category in sub-area A (Hakata Bay)
Category Assessment parameter Parameteridentification
Classidentification
Ⅰ Riverine input of TN D 1985-2007 DRiverine input of TP D 1985-2007 DSewage plant input of TN I 1995-2007 ISewage plant input of TP N 1995-2007 NTN concentration L 2005-2007 I 1978-2007 LITP concentration L 2005-2007 N 1978-2007 LNWinter DIN concentration H 2005-2007 I 1978-2007 HIWinter DIP concentration L 2005-2007 N 1978-2007 LNWinter DIN/DIP ratio H 2005-2007 I 1978-2007 HI
Ⅱ Annual maximum of chlorophyll-a H 2005-2007 D 1981-2007 HDAnnual mean of chlorophyll-a H 2005-2007 D 1981-2007 HDRed tide events (diatom sp.) H 2005-2007 N 1978-2007 HNRed tide events (dinoflagellate sp.) H 2005-2007 N 1978-2007 HN
Ⅲ Dissolved oxygen (DO) L 2005-2007 N 1978-2007 LNFish kill incidents L 2005-2007 N 1970s-2007 LNChemical oxygen demand (COD) L 2005-2007 I 1978-2007 LI
Ⅳ Red tide events (Noctiluca sp.) L 2005-2007 N 1978-2007 LNShell fish poisoning incidents L 2005-2007 N 1970s-2007 LN
HD-HN
LN
LN
Comparison Occurrence Trend
LI
××××
×××××××××××
×
××
××
××
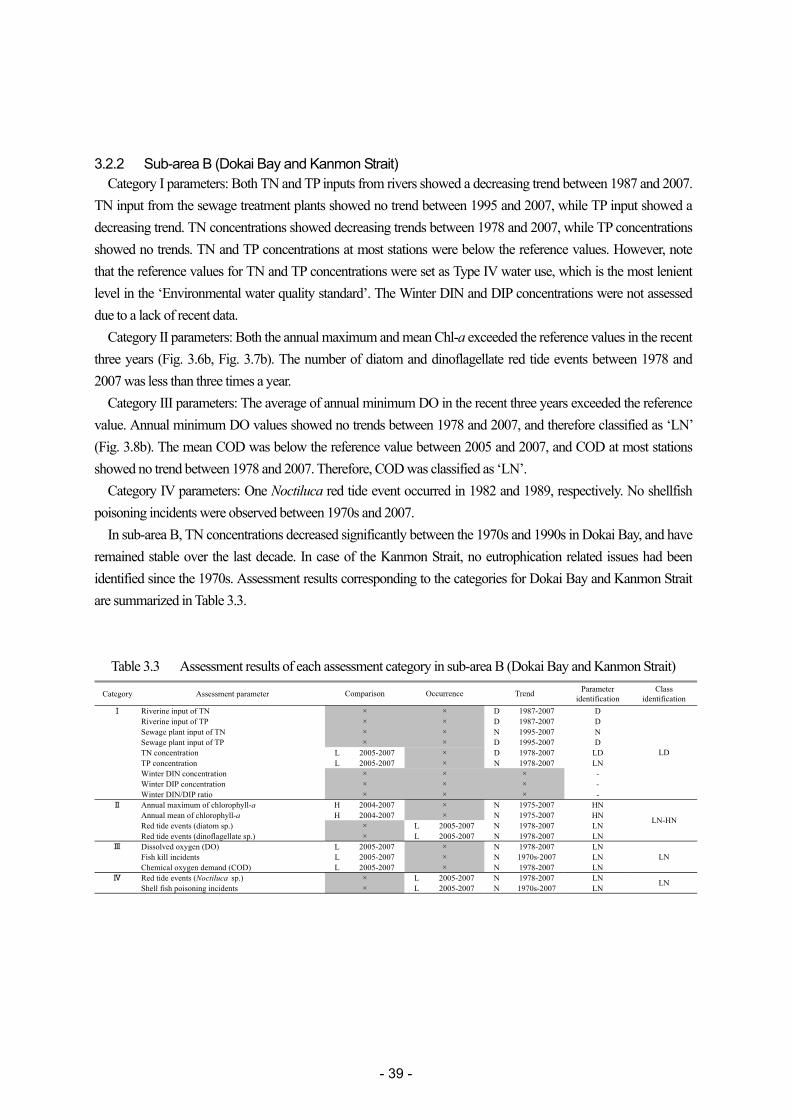
- 39 -
3.2.2 Sub-area B (Dokai Bay and Kanmon Strait) Category I parameters: Both TN and TP inputs from rivers showed a decreasing trend between 1987 and 2007.
TN input from the sewage treatment plants showed no trend between 1995 and 2007, while TP input showed a decreasing trend. TN concentrations showed decreasing trends between 1978 and 2007, while TP concentrations showed no trends. TN and TP concentrations at most stations were below the reference values. However, note that the reference values for TN and TP concentrations were set as Type IV water use, which is the most lenient level in the ‘Environmental water quality standard’. The Winter DIN and DIP concentrations were not assessed due to a lack of recent data.
Category II parameters: Both the annual maximum and mean Chl-a exceeded the reference values in the recent three years (Fig. 3.6b, Fig. 3.7b). The number of diatom and dinoflagellate red tide events between 1978 and 2007 was less than three times a year.
Category III parameters: The average of annual minimum DO in the recent three years exceeded the reference value. Annual minimum DO values showed no trends between 1978 and 2007, and therefore classified as ‘LN’ (Fig. 3.8b). The mean COD was below the reference value between 2005 and 2007, and COD at most stations showed no trend between 1978 and 2007. Therefore, COD was classified as ‘LN’.
Category IV parameters: One Noctiluca red tide event occurred in 1982 and 1989, respectively. No shellfish poisoning incidents were observed between 1970s and 2007.
In sub-area B, TN concentrations decreased significantly between the 1970s and 1990s in Dokai Bay, and have remained stable over the last decade. In case of the Kanmon Strait, no eutrophication related issues had been identified since the 1970s. Assessment results corresponding to the categories for Dokai Bay and Kanmon Strait are summarized in Table 3.3.
Table 3.3 Assessment results of each assessment category in sub-area B (Dokai Bay and Kanmon Strait)
Category Assessment parameter Parameteridentification
Classidentification
Ⅰ Riverine input of TN D 1987-2007 DRiverine input of TP D 1987-2007 DSewage plant input of TN N 1995-2007 NSewage plant input of TP D 1995-2007 DTN concentration L 2005-2007 D 1978-2007 LDTP concentration L 2005-2007 N 1978-2007 LNWinter DIN concentration -Winter DIP concentration -Winter DIN/DIP ratio -
Ⅱ Annual maximum of chlorophyll-a H 2004-2007 N 1975-2007 HNAnnual mean of chlorophyll-a H 2004-2007 N 1975-2007 HNRed tide events (diatom sp.) L 2005-2007 N 1978-2007 LNRed tide events (dinoflagellate sp.) L 2005-2007 N 1978-2007 LN
Ⅲ Dissolved oxygen (DO) L 2005-2007 N 1978-2007 LNFish kill incidents L 2005-2007 N 1970s-2007 LNChemical oxygen demand (COD) L 2005-2007 N 1978-2007 LN
Ⅳ Red tide events (Noctiluca sp.) L 2005-2007 N 1978-2007 LNShell fish poisoning incidents L 2005-2007 N 1970s-2007 LN
LN-HN
LN
LN
Comparison Occurrence Trend
LD
××××
×××××××××
×××
×××
××
××
×××
××
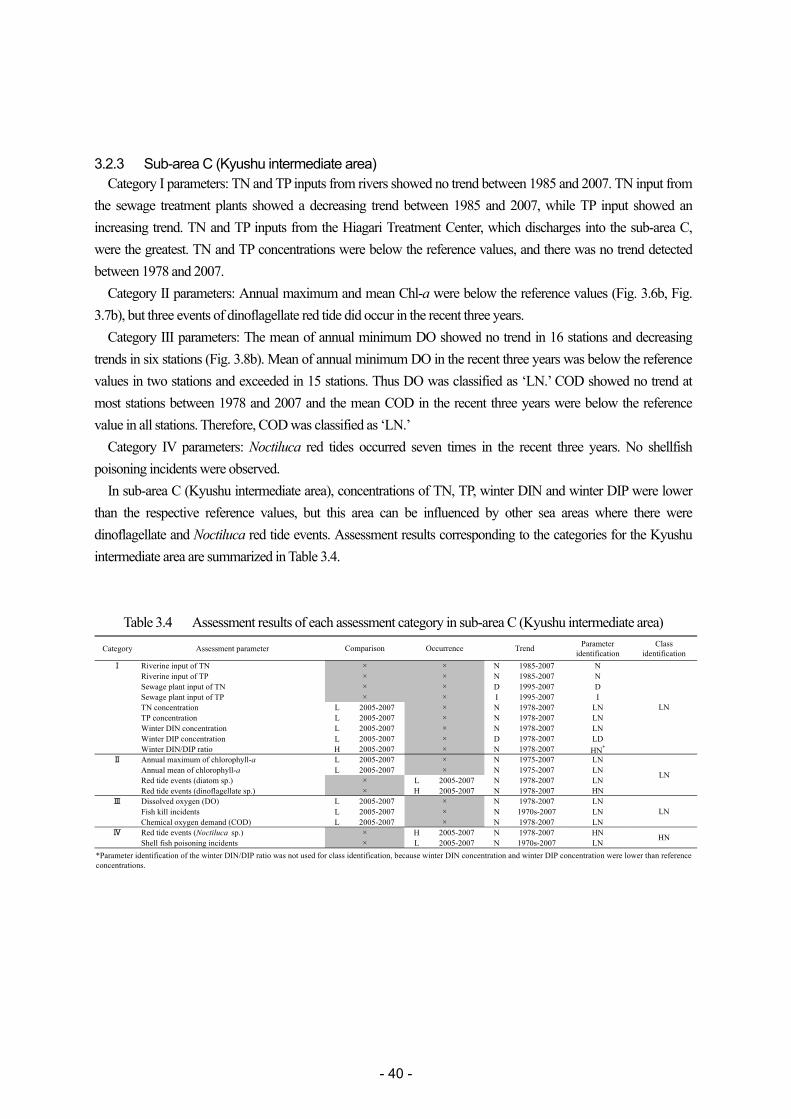
- 40 -
3.2.3 Sub-area C (Kyushu intermediate area) Category I parameters: TN and TP inputs from rivers showed no trend between 1985 and 2007. TN input from
the sewage treatment plants showed a decreasing trend between 1985 and 2007, while TP input showed an increasing trend. TN and TP inputs from the Hiagari Treatment Center, which discharges into the sub-area C, were the greatest. TN and TP concentrations were below the reference values, and there was no trend detected between 1978 and 2007.
Category II parameters: Annual maximum and mean Chl-a were below the reference values (Fig. 3.6b, Fig. 3.7b), but three events of dinoflagellate red tide did occur in the recent three years.
Category III parameters: The mean of annual minimum DO showed no trend in 16 stations and decreasing trends in six stations (Fig. 3.8b). Mean of annual minimum DO in the recent three years was below the reference values in two stations and exceeded in 15 stations. Thus DO was classified as ‘LN.’ COD showed no trend at most stations between 1978 and 2007 and the mean COD in the recent three years were below the reference value in all stations. Therefore, COD was classified as ‘LN.’
Category IV parameters: Noctiluca red tides occurred seven times in the recent three years. No shellfish poisoning incidents were observed.
In sub-area C (Kyushu intermediate area), concentrations of TN, TP, winter DIN and winter DIP were lower than the respective reference values, but this area can be influenced by other sea areas where there were dinoflagellate and Noctiluca red tide events. Assessment results corresponding to the categories for the Kyushu intermediate area are summarized in Table 3.4.
Table 3.4 Assessment results of each assessment category in sub-area C (Kyushu intermediate area) Category Assessment parameter Parameter
identificationClass
identificationⅠ Riverine input of TN N 1985-2007 N
Riverine input of TP N 1985-2007 NSewage plant input of TN D 1995-2007 DSewage plant input of TP I 1995-2007 ITN concentration L 2005-2007 N 1978-2007 LNTP concentration L 2005-2007 N 1978-2007 LNWinter DIN concentration L 2005-2007 N 1978-2007 LNWinter DIP concentration L 2005-2007 D 1978-2007 LDWinter DIN/DIP ratio H 2005-2007 N 1978-2007 HN*
Ⅱ Annual maximum of chlorophyll-a L 2005-2007 N 1975-2007 LNAnnual mean of chlorophyll-a L 2005-2007 N 1975-2007 LNRed tide events (diatom sp.) L 2005-2007 N 1978-2007 LNRed tide events (dinoflagellate sp.) H 2005-2007 N 1978-2007 HN
Ⅲ Dissolved oxygen (DO) L 2005-2007 N 1978-2007 LNFish kill incidents L 2005-2007 N 1970s-2007 LNChemical oxygen demand (COD) L 2005-2007 N 1978-2007 LN
Ⅳ Red tide events (Noctiluca sp.) H 2005-2007 N 1978-2007 HNShell fish poisoning incidents L 2005-2007 N 1970s-2007 LN
LN
LN
HN
*Parameter identification of the winter DIN/DIP ratio was not used for class identification, because winter DIN concentration and winter DIP concentration were lower than referenceconcentrations.
Comparison Occurrence Trend
LN
××××
××××××××××
××
×××
×××
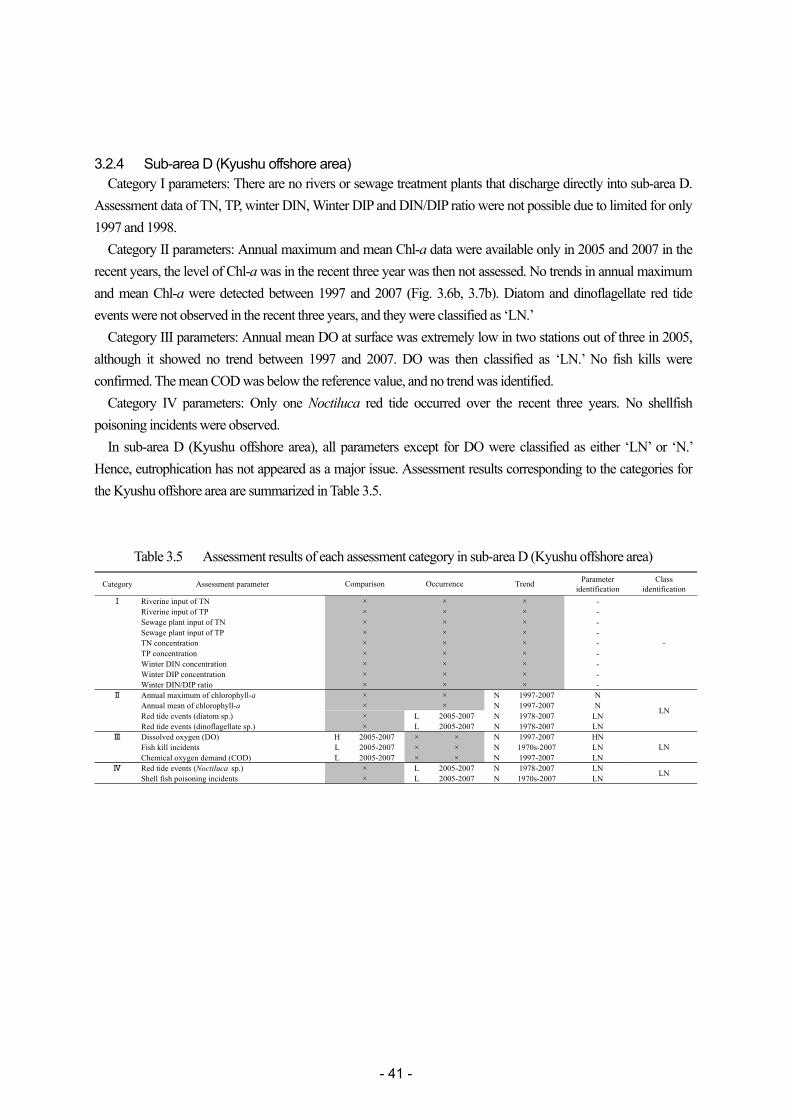
- 41 -
3.2.4 Sub-area D (Kyushu offshore area) Category I parameters: There are no rivers or sewage treatment plants that discharge directly into sub-area D.
Assessment data of TN, TP, winter DIN, Winter DIP and DIN/DIP ratio were not possible due to limited for only 1997 and 1998.
Category II parameters: Annual maximum and mean Chl-a data were available only in 2005 and 2007 in the recent years, the level of Chl-a was in the recent three year was then not assessed. No trends in annual maximum and mean Chl-a were detected between 1997 and 2007 (Fig. 3.6b, 3.7b). Diatom and dinoflagellate red tide events were not observed in the recent three years, and they were classified as ‘LN.’
Category III parameters: Annual mean DO at surface was extremely low in two stations out of three in 2005, although it showed no trend between 1997 and 2007. DO was then classified as ‘LN.’ No fish kills were confirmed. The mean COD was below the reference value, and no trend was identified.
Category IV parameters: Only one Noctiluca red tide occurred over the recent three years. No shellfish poisoning incidents were observed.
In sub-area D (Kyushu offshore area), all parameters except for DO were classified as either ‘LN’ or ‘N.’ Hence, eutrophication has not appeared as a major issue. Assessment results corresponding to the categories for the Kyushu offshore area are summarized in Table 3.5.
Table 3.5 Assessment results of each assessment category in sub-area D (Kyushu offshore area)
Category Assessment parameter Parameteridentification
Classidentification
Ⅰ Riverine input of TN -Riverine input of TP -Sewage plant input of TN -Sewage plant input of TP -TN concentration -TP concentration -Winter DIN concentration -Winter DIP concentration -Winter DIN/DIP ratio -
Ⅱ Annual maximum of chlorophyll-a N 1997-2007 NAnnual mean of chlorophyll-a N 1997-2007 NRed tide events (diatom sp.) L 2005-2007 N 1978-2007 LNRed tide events (dinoflagellate sp.) L 2005-2007 N 1978-2007 LN
Ⅲ Dissolved oxygen (DO) H 2005-2007 × × N 1997-2007 HNFish kill incidents L 2005-2007 × × N 1970s-2007 LNChemical oxygen demand (COD) L 2005-2007 × × N 1997-2007 LN
Ⅳ Red tide events (Noctiluca sp.) L 2005-2007 N 1978-2007 LNShell fish poisoning incidents L 2005-2007 N 1970s-2007 LN
LN
LN
LN
Comparison Occurrence Trend
-
×××××××××
×××××××××
×××××××
××
××
××××
××
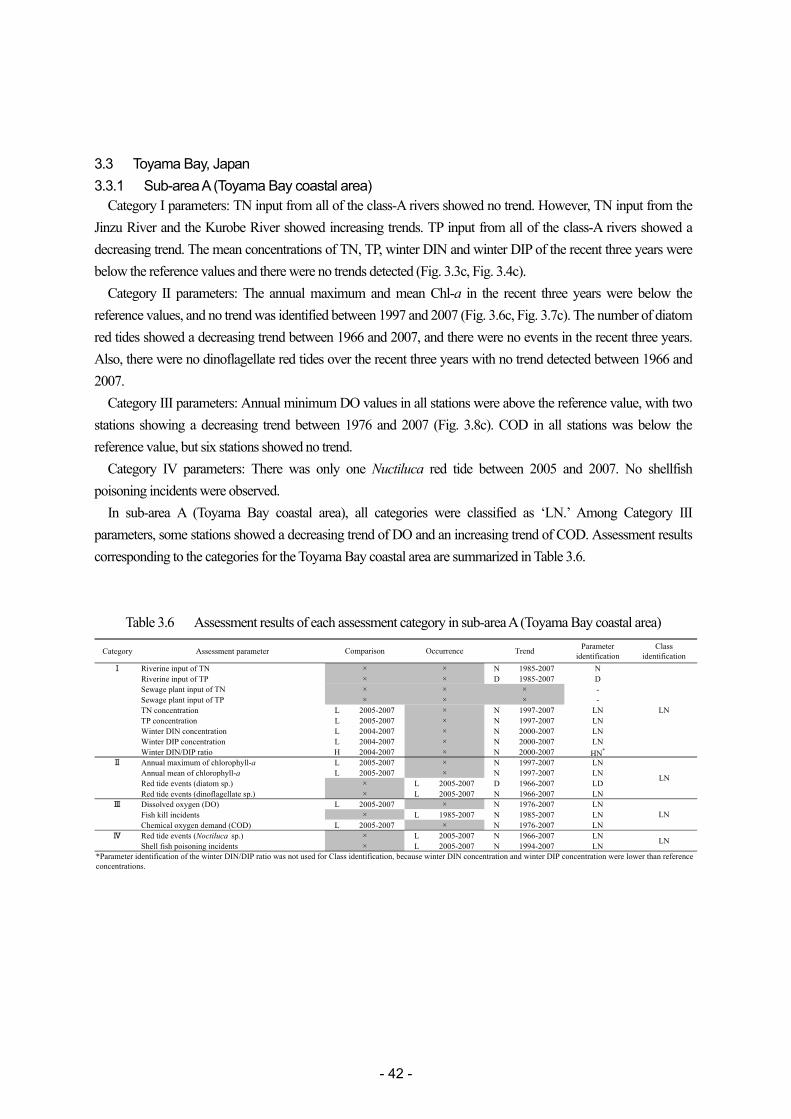
- 42 -
3.3 Toyama Bay, Japan 3.3.1 Sub-area A (Toyama Bay coastal area)
Category I parameters: TN input from all of the class-A rivers showed no trend. However, TN input from the Jinzu River and the Kurobe River showed increasing trends. TP input from all of the class-A rivers showed a decreasing trend. The mean concentrations of TN, TP, winter DIN and winter DIP of the recent three years were below the reference values and there were no trends detected (Fig. 3.3c, Fig. 3.4c).
Category II parameters: The annual maximum and mean Chl-a in the recent three years were below the reference values, and no trend was identified between 1997 and 2007 (Fig. 3.6c, Fig. 3.7c). The number of diatom red tides showed a decreasing trend between 1966 and 2007, and there were no events in the recent three years. Also, there were no dinoflagellate red tides over the recent three years with no trend detected between 1966 and 2007.
Category III parameters: Annual minimum DO values in all stations were above the reference value, with two stations showing a decreasing trend between 1976 and 2007 (Fig. 3.8c). COD in all stations was below the reference value, but six stations showed no trend.
Category IV parameters: There was only one Nuctiluca red tide between 2005 and 2007. No shellfish poisoning incidents were observed.
In sub-area A (Toyama Bay coastal area), all categories were classified as ‘LN.’ Among Category III parameters, some stations showed a decreasing trend of DO and an increasing trend of COD. Assessment results corresponding to the categories for the Toyama Bay coastal area are summarized in Table 3.6.
Table 3.6 Assessment results of each assessment category in sub-area A (Toyama Bay coastal area)
Category Assessment parameter Parameteridentification
Classidentification
Ⅰ Riverine input of TN N 1985-2007 NRiverine input of TP D 1985-2007 DSewage plant input of TN -Sewage plant input of TP -TN concentration L 2005-2007 N 1997-2007 LNTP concentration L 2005-2007 N 1997-2007 LNWinter DIN concentration L 2004-2007 N 2000-2007 LNWinter DIP concentration L 2004-2007 N 2000-2007 LNWinter DIN/DIP ratio H 2004-2007 N 2000-2007 HN*
Ⅱ Annual maximum of chlorophyll-a L 2005-2007 N 1997-2007 LNAnnual mean of chlorophyll-a L 2005-2007 N 1997-2007 LNRed tide events (diatom sp.) L 2005-2007 D 1966-2007 LDRed tide events (dinoflagellate sp.) L 2005-2007 N 1966-2007 LN
Ⅲ Dissolved oxygen (DO) L 2005-2007 N 1976-2007 LNFish kill incidents L 1985-2007 N 1985-2007 LNChemical oxygen demand (COD) L 2005-2007 N 1976-2007 LN
Ⅳ Red tide events (Noctiluca sp.) L 2005-2007 N 1966-2007 LNShell fish poisoning incidents L 2005-2007 N 1994-2007 LN
Comparison Occurrence Trend
*Parameter identification of the winter DIN/DIP ratio was not used for Class identification, because winter DIN concentration and winter DIP concentration were lower than referenceconcentrations.
LN
LN
LN
LN
××××
×××××××××
××
×××
××
××
××
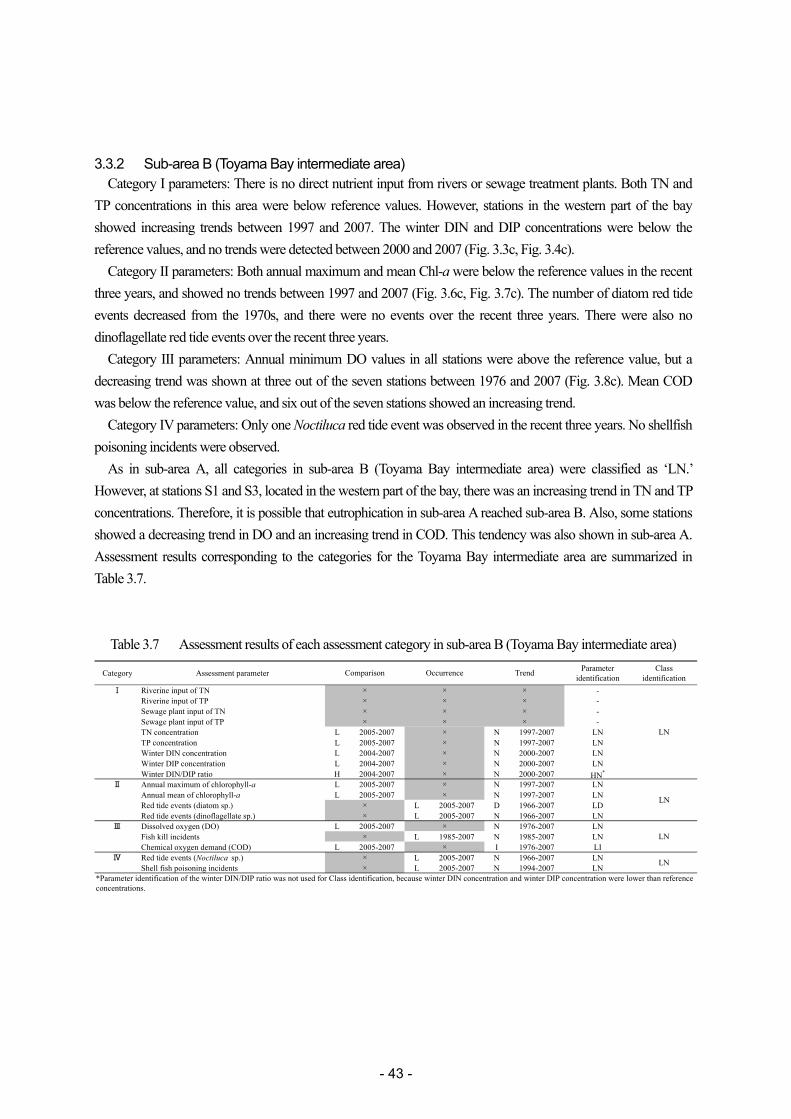
- 43 -
3.3.2 Sub-area B (Toyama Bay intermediate area) Category I parameters: There is no direct nutrient input from rivers or sewage treatment plants. Both TN and
TP concentrations in this area were below reference values. However, stations in the western part of the bay showed increasing trends between 1997 and 2007. The winter DIN and DIP concentrations were below the reference values, and no trends were detected between 2000 and 2007 (Fig. 3.3c, Fig. 3.4c).
Category II parameters: Both annual maximum and mean Chl-a were below the reference values in the recent three years, and showed no trends between 1997 and 2007 (Fig. 3.6c, Fig. 3.7c). The number of diatom red tide events decreased from the 1970s, and there were no events over the recent three years. There were also no dinoflagellate red tide events over the recent three years.
Category III parameters: Annual minimum DO values in all stations were above the reference value, but a decreasing trend was shown at three out of the seven stations between 1976 and 2007 (Fig. 3.8c). Mean COD was below the reference value, and six out of the seven stations showed an increasing trend.
Category IV parameters: Only one Noctiluca red tide event was observed in the recent three years. No shellfish poisoning incidents were observed.
As in sub-area A, all categories in sub-area B (Toyama Bay intermediate area) were classified as ‘LN.’ However, at stations S1 and S3, located in the western part of the bay, there was an increasing trend in TN and TP concentrations. Therefore, it is possible that eutrophication in sub-area A reached sub-area B. Also, some stations showed a decreasing trend in DO and an increasing trend in COD. This tendency was also shown in sub-area A. Assessment results corresponding to the categories for the Toyama Bay intermediate area are summarized in Table 3.7.
Table 3.7 Assessment results of each assessment category in sub-area B (Toyama Bay intermediate area)
Category Assessment parameter Parameteridentification
Classidentification
Ⅰ Riverine input of TN -Riverine input of TP -Sewage plant input of TN -Sewage plant input of TP -TN concentration L 2005-2007 N 1997-2007 LNTP concentration L 2005-2007 N 1997-2007 LNWinter DIN concentration L 2004-2007 N 2000-2007 LNWinter DIP concentration L 2004-2007 N 2000-2007 LNWinter DIN/DIP ratio H 2004-2007 N 2000-2007 HN*
Ⅱ Annual maximum of chlorophyll-a L 2005-2007 N 1997-2007 LNAnnual mean of chlorophyll-a L 2005-2007 N 1997-2007 LNRed tide events (diatom sp.) L 2005-2007 D 1966-2007 LDRed tide events (dinoflagellate sp.) L 2005-2007 N 1966-2007 LN
Ⅲ Dissolved oxygen (DO) L 2005-2007 N 1976-2007 LNFish kill incidents L 1985-2007 N 1985-2007 LNChemical oxygen demand (COD) L 2005-2007 I 1976-2007 LI
Ⅳ Red tide events (Noctiluca sp.) L 2005-2007 N 1966-2007 LNShell fish poisoning incidents L 2005-2007 N 1994-2007 LN
Comparison Occurrence Trend
*Parameter identification of the winter DIN/DIP ratio was not used for Class identification, because winter DIN concentration and winter DIP concentration were lower than referenceconcentrations.
LN
LN
LN
LN
××××
×××××××××
××××
×××
××
××
××
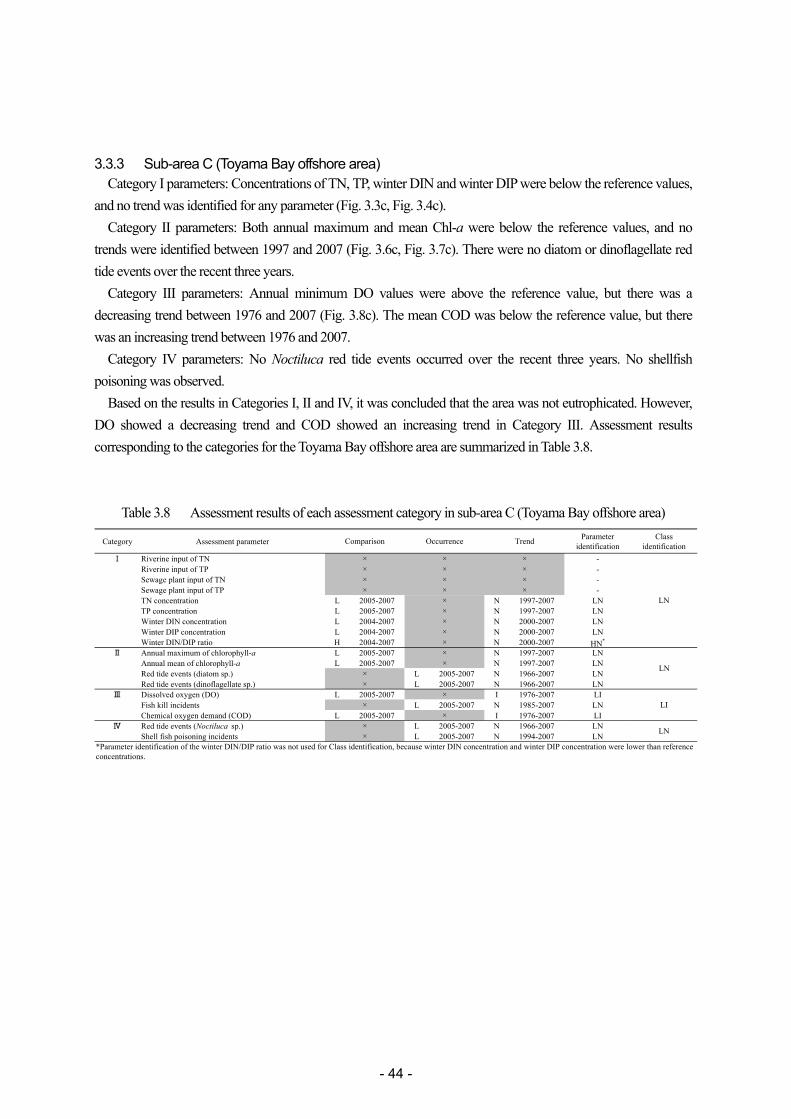
- 44 -
3.3.3 Sub-area C (Toyama Bay offshore area) Category I parameters: Concentrations of TN, TP, winter DIN and winter DIP were below the reference values,
and no trend was identified for any parameter (Fig. 3.3c, Fig. 3.4c). Category II parameters: Both annual maximum and mean Chl-a were below the reference values, and no
trends were identified between 1997 and 2007 (Fig. 3.6c, Fig. 3.7c). There were no diatom or dinoflagellate red tide events over the recent three years.
Category III parameters: Annual minimum DO values were above the reference value, but there was a decreasing trend between 1976 and 2007 (Fig. 3.8c). The mean COD was below the reference value, but there was an increasing trend between 1976 and 2007.
Category IV parameters: No Noctiluca red tide events occurred over the recent three years. No shellfish poisoning was observed.
Based on the results in Categories I, II and IV, it was concluded that the area was not eutrophicated. However, DO showed a decreasing trend and COD showed an increasing trend in Category III. Assessment results corresponding to the categories for the Toyama Bay offshore area are summarized in Table 3.8.
Table 3.8 Assessment results of each assessment category in sub-area C (Toyama Bay offshore area)
Category Assessment parameter Parameteridentification
Classidentification
Ⅰ Riverine input of TN -Riverine input of TP -Sewage plant input of TN -Sewage plant input of TP -TN concentration L 2005-2007 N 1997-2007 LNTP concentration L 2005-2007 N 1997-2007 LNWinter DIN concentration L 2004-2007 N 2000-2007 LNWinter DIP concentration L 2004-2007 N 2000-2007 LNWinter DIN/DIP ratio H 2004-2007 N 2000-2007 HN*
Ⅱ Annual maximum of chlorophyll-a L 2005-2007 N 1997-2007 LNAnnual mean of chlorophyll-a L 2005-2007 N 1997-2007 LNRed tide events (diatom sp.) L 2005-2007 N 1966-2007 LNRed tide events (dinoflagellate sp.) L 2005-2007 N 1966-2007 LN
Ⅲ Dissolved oxygen (DO) L 2005-2007 I 1976-2007 LIFish kill incidents L 2005-2007 N 1985-2007 LNChemical oxygen demand (COD) L 2005-2007 I 1976-2007 LI
Ⅳ Red tide events (Noctiluca sp.) L 2005-2007 N 1966-2007 LNShell fish poisoning incidents L 2005-2007 N 1994-2007 LN
Comparison Occurrence Trend
*Parameter identification of the winter DIN/DIP ratio was not used for Class identification, because winter DIN concentration and winter DIP concentration were lower than referenceconcentrations.
LN
LN
LI
LN
××××
×××××××××
××××
×××
××
××
××
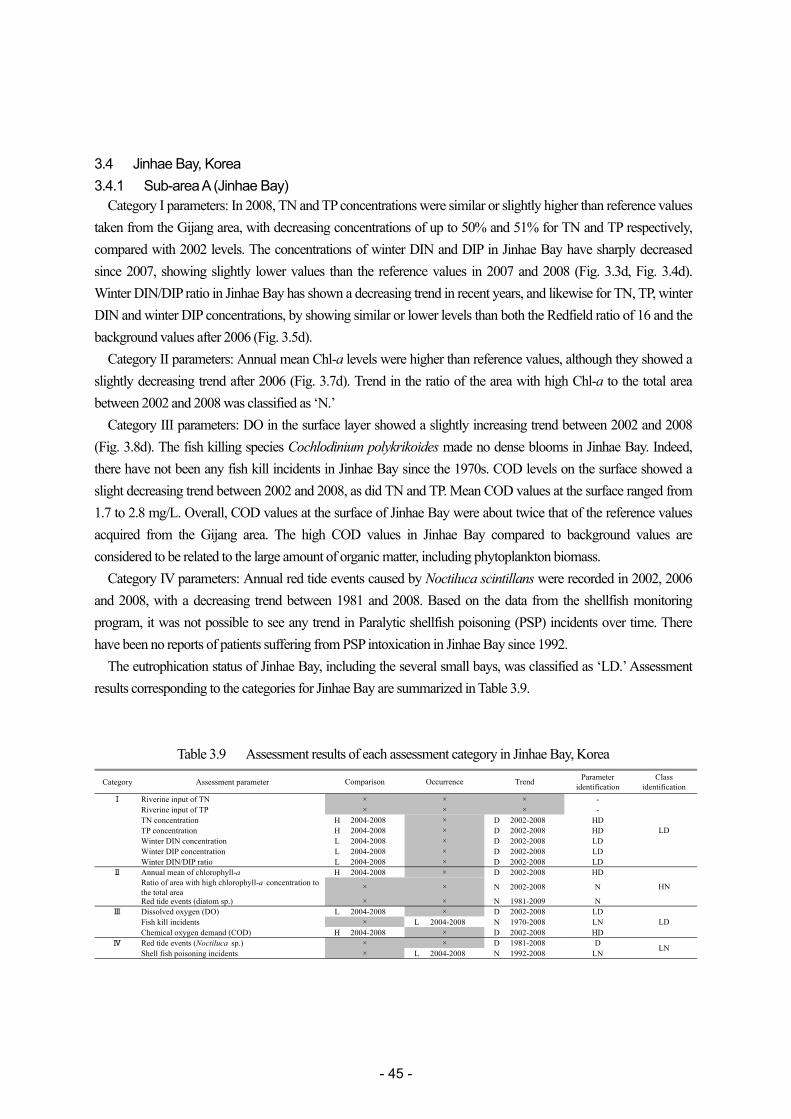
- 45 -
3.4 Jinhae Bay, Korea 3.4.1 Sub-area A (Jinhae Bay)
Category I parameters: In 2008, TN and TP concentrations were similar or slightly higher than reference values taken from the Gijang area, with decreasing concentrations of up to 50% and 51% for TN and TP respectively, compared with 2002 levels. The concentrations of winter DIN and DIP in Jinhae Bay have sharply decreased since 2007, showing slightly lower values than the reference values in 2007 and 2008 (Fig. 3.3d, Fig. 3.4d). Winter DIN/DIP ratio in Jinhae Bay has shown a decreasing trend in recent years, and likewise for TN, TP, winter DIN and winter DIP concentrations, by showing similar or lower levels than both the Redfield ratio of 16 and the background values after 2006 (Fig. 3.5d).
Category II parameters: Annual mean Chl-a levels were higher than reference values, although they showed a slightly decreasing trend after 2006 (Fig. 3.7d). Trend in the ratio of the area with high Chl-a to the total area between 2002 and 2008 was classified as ‘N.’
Category III parameters: DO in the surface layer showed a slightly increasing trend between 2002 and 2008 (Fig. 3.8d). The fish killing species Cochlodinium polykrikoides made no dense blooms in Jinhae Bay. Indeed, there have not been any fish kill incidents in Jinhae Bay since the 1970s. COD levels on the surface showed a slight decreasing trend between 2002 and 2008, as did TN and TP. Mean COD values at the surface ranged from 1.7 to 2.8 mg/L. Overall, COD values at the surface of Jinhae Bay were about twice that of the reference values acquired from the Gijang area. The high COD values in Jinhae Bay compared to background values are considered to be related to the large amount of organic matter, including phytoplankton biomass.
Category IV parameters: Annual red tide events caused by Noctiluca scintillans were recorded in 2002, 2006 and 2008, with a decreasing trend between 1981 and 2008. Based on the data from the shellfish monitoring program, it was not possible to see any trend in Paralytic shellfish poisoning (PSP) incidents over time. There have been no reports of patients suffering from PSP intoxication in Jinhae Bay since 1992.
The eutrophication status of Jinhae Bay, including the several small bays, was classified as ‘LD.’ Assessment results corresponding to the categories for Jinhae Bay are summarized in Table 3.9.
Table 3.9 Assessment results of each assessment category in Jinhae Bay, Korea
Category Assessment parameter Parameteridentification
Classidentification
Ⅰ Riverine input of TN -Riverine input of TP -TN concentration H 2004-2008 D 2002-2008 HDTP concentration H 2004-2008 D 2002-2008 HDWinter DIN concentration L 2004-2008 D 2002-2008 LDWinter DIP concentration L 2004-2008 D 2002-2008 LDWinter DIN/DIP ratio L 2004-2008 D 2002-2008 LD
Ⅱ Annual mean of chlorophyll-a H 2004-2008 D 2002-2008 HDRatio of area with high chlorophyll-a concentration tothe total area
N 2002-2008 N
Red tide events (diatom sp.) N 1981-2009 NⅢ Dissolved oxygen (DO) L 2004-2008 D 2002-2008 LD
Fish kill incidents L 2004-2008 N 1970-2008 LNChemical oxygen demand (COD) H 2004-2008 D 2002-2008 HD
Ⅳ Red tide events (Noctiluca sp.) D 1981-2008 DShell fish poisoning incidents L 2004-2008 N 1992-2008 LN
Comparison Occurrence Trend
LD
××
×
×××
HN
LD
LN
××
×
×
×
×
×
××
×
×××
××
×
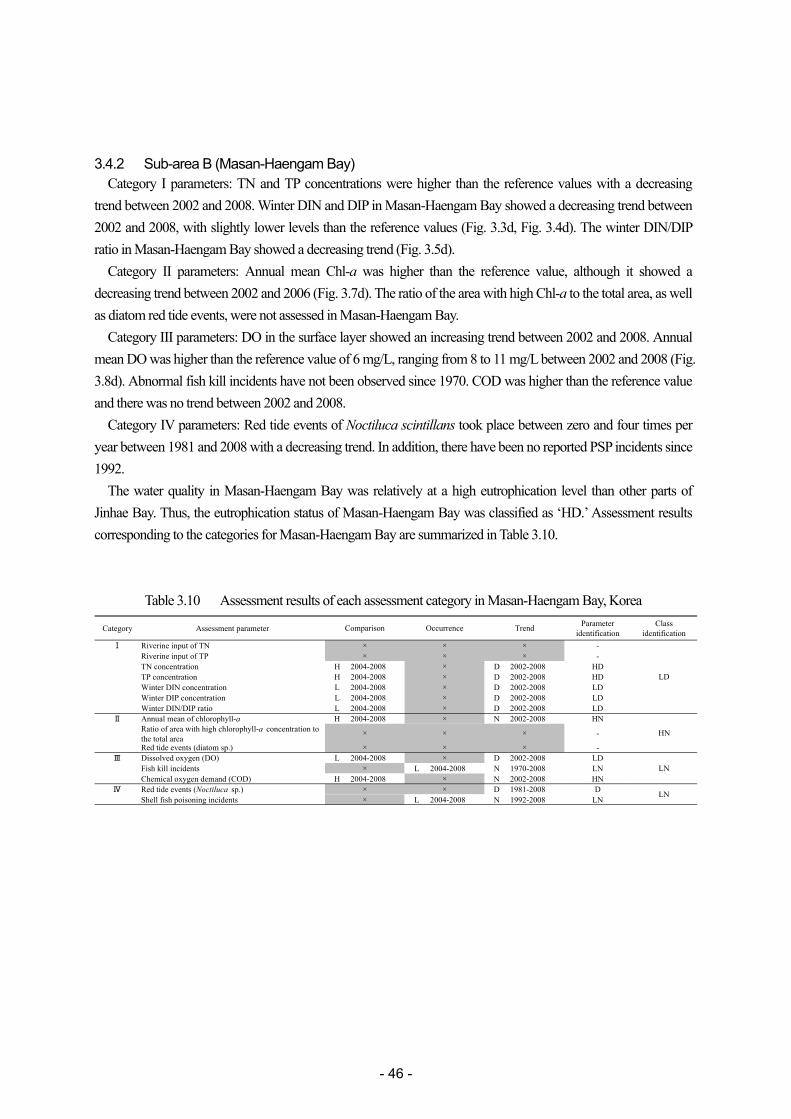
- 46 -
3.4.2 Sub-area B (Masan-Haengam Bay) Category I parameters: TN and TP concentrations were higher than the reference values with a decreasing
trend between 2002 and 2008. Winter DIN and DIP in Masan-Haengam Bay showed a decreasing trend between 2002 and 2008, with slightly lower levels than the reference values (Fig. 3.3d, Fig. 3.4d). The winter DIN/DIP ratio in Masan-Haengam Bay showed a decreasing trend (Fig. 3.5d).
Category II parameters: Annual mean Chl-a was higher than the reference value, although it showed a decreasing trend between 2002 and 2006 (Fig. 3.7d). The ratio of the area with high Chl-a to the total area, as well as diatom red tide events, were not assessed in Masan-Haengam Bay.
Category III parameters: DO in the surface layer showed an increasing trend between 2002 and 2008. Annual mean DO was higher than the reference value of 6 mg/L, ranging from 8 to 11 mg/L between 2002 and 2008 (Fig. 3.8d). Abnormal fish kill incidents have not been observed since 1970. COD was higher than the reference value and there was no trend between 2002 and 2008.
Category IV parameters: Red tide events of Noctiluca scintillans took place between zero and four times per year between 1981 and 2008 with a decreasing trend. In addition, there have been no reported PSP incidents since 1992.
The water quality in Masan-Haengam Bay was relatively at a high eutrophication level than other parts of Jinhae Bay. Thus, the eutrophication status of Masan-Haengam Bay was classified as ‘HD.’ Assessment results corresponding to the categories for Masan-Haengam Bay are summarized in Table 3.10.
Table 3.10 Assessment results of each assessment category in Masan-Haengam Bay, Korea
Category Assessment parameter Parameteridentification
Classidentification
Ⅰ Riverine input of TN -Riverine input of TP -TN concentration H 2004-2008 D 2002-2008 HDTP concentration H 2004-2008 D 2002-2008 HDWinter DIN concentration L 2004-2008 D 2002-2008 LDWinter DIP concentration L 2004-2008 D 2002-2008 LDWinter DIN/DIP ratio L 2004-2008 D 2002-2008 LD
Ⅱ Annual mean of chlorophyll-a H 2004-2008 N 2002-2008 HNRatio of area with high chlorophyll-a concentration tothe total area
-
Red tide events (diatom sp.) -Ⅲ Dissolved oxygen (DO) L 2004-2008 D 2002-2008 LD
Fish kill incidents L 2004-2008 N 1970-2008 LNChemical oxygen demand (COD) H 2004-2008 N 2002-2008 HN
Ⅳ Red tide events (Noctiluca sp.) D 1981-2008 DShell fish poisoning incidents L 2004-2008 N 1992-2008 LN
××
×××
×
×
×
×
×
×
×
×
××××
HN
×××
LN
LN
Comparison Occurrence Trend
LD
××
×
×
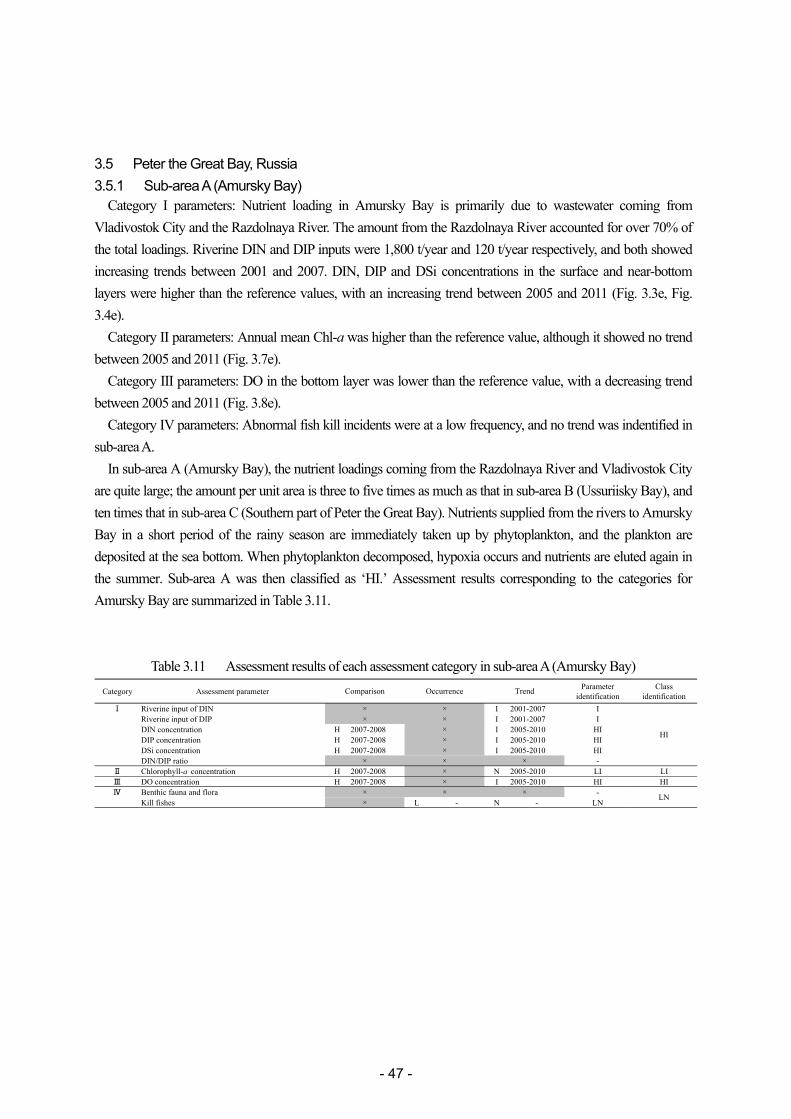
- 47 -
3.5 Peter the Great Bay, Russia 3.5.1 Sub-area A (Amursky Bay)
Category I parameters: Nutrient loading in Amursky Bay is primarily due to wastewater coming from Vladivostok City and the Razdolnaya River. The amount from the Razdolnaya River accounted for over 70% of the total loadings. Riverine DIN and DIP inputs were 1,800 t/year and 120 t/year respectively, and both showed increasing trends between 2001 and 2007. DIN, DIP and DSi concentrations in the surface and near-bottom layers were higher than the reference values, with an increasing trend between 2005 and 2011 (Fig. 3.3e, Fig. 3.4e).
Category II parameters: Annual mean Chl-a was higher than the reference value, although it showed no trend between 2005 and 2011 (Fig. 3.7e).
Category III parameters: DO in the bottom layer was lower than the reference value, with a decreasing trend between 2005 and 2011 (Fig. 3.8e).
Category IV parameters: Abnormal fish kill incidents were at a low frequency, and no trend was indentified in sub-area A.
In sub-area A (Amursky Bay), the nutrient loadings coming from the Razdolnaya River and Vladivostok City are quite large; the amount per unit area is three to five times as much as that in sub-area B (Ussuriisky Bay), and ten times that in sub-area C (Southern part of Peter the Great Bay). Nutrients supplied from the rivers to Amursky Bay in a short period of the rainy season are immediately taken up by phytoplankton, and the plankton are deposited at the sea bottom. When phytoplankton decomposed, hypoxia occurs and nutrients are eluted again in the summer. Sub-area A was then classified as ‘HI.’ Assessment results corresponding to the categories for Amursky Bay are summarized in Table 3.11.
Table 3.11 Assessment results of each assessment category in sub-area A (Amursky Bay)
Category Assessment parameter Parameteridentification
Classidentification
Ⅰ Riverine input of DIN I 2001-2007 IRiverine input of DIP I 2001-2007 IDIN concentration H 2007-2008 I 2005-2010 HIDIP concentration H 2007-2008 I 2005-2010 HIDSi concentration H 2007-2008 I 2005-2010 HIDIN/DIP ratio -
Ⅱ Chlorophyll-a concentration H 2007-2008 N 2005-2010 LI LIⅢ DO concentration H 2007-2008 I 2005-2010 HI HIⅣ Benthic fauna and flora -
Kill fishes L - N - LN
Comparison Occurrence
××
×
×
HI
×××
×
××
Trend
× LN
×
××
××
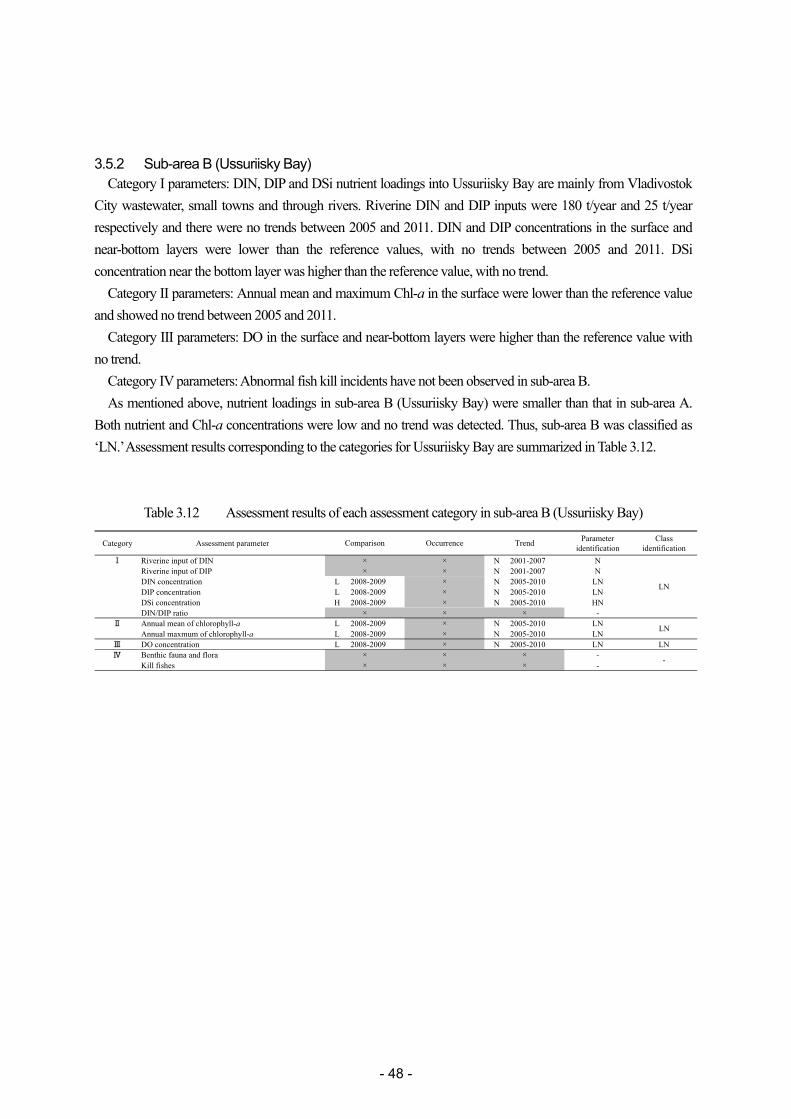
- 48 -
3.5.2 Sub-area B (Ussuriisky Bay) Category I parameters: DIN, DIP and DSi nutrient loadings into Ussuriisky Bay are mainly from Vladivostok
City wastewater, small towns and through rivers. Riverine DIN and DIP inputs were 180 t/year and 25 t/year respectively and there were no trends between 2005 and 2011. DIN and DIP concentrations in the surface and near-bottom layers were lower than the reference values, with no trends between 2005 and 2011. DSi concentration near the bottom layer was higher than the reference value, with no trend.
Category II parameters: Annual mean and maximum Chl-a in the surface were lower than the reference value and showed no trend between 2005 and 2011.
Category III parameters: DO in the surface and near-bottom layers were higher than the reference value with no trend.
Category IV parameters: Abnormal fish kill incidents have not been observed in sub-area B. As mentioned above, nutrient loadings in sub-area B (Ussuriisky Bay) were smaller than that in sub-area A.
Both nutrient and Chl-a concentrations were low and no trend was detected. Thus, sub-area B was classified as ‘LN.’ Assessment results corresponding to the categories for Ussuriisky Bay are summarized in Table 3.12.
Table 3.12 Assessment results of each assessment category in sub-area B (Ussuriisky Bay)
Category Assessment parameter Parameteridentification
Classidentification
Ⅰ Riverine input of DIN N 2001-2007 NRiverine input of DIP N 2001-2007 NDIN concentration L 2008-2009 N 2005-2010 LNDIP concentration L 2008-2009 N 2005-2010 LNDSi concentration H 2008-2009 N 2005-2010 HNDIN/DIP ratio -
Ⅱ Annual mean of chlorophyll-a L 2008-2009 N 2005-2010 LNAnnual maxmum of chlorophyll-a L 2008-2009 N 2005-2010 LN
Ⅲ DO concentration L 2008-2009 N 2005-2010 LN LNⅣ Benthic fauna and flora -
Kill fishes -
LN
-
Comparison Occurrence Trend
LN
××××××
××
×
× × ×
××××
× × ×
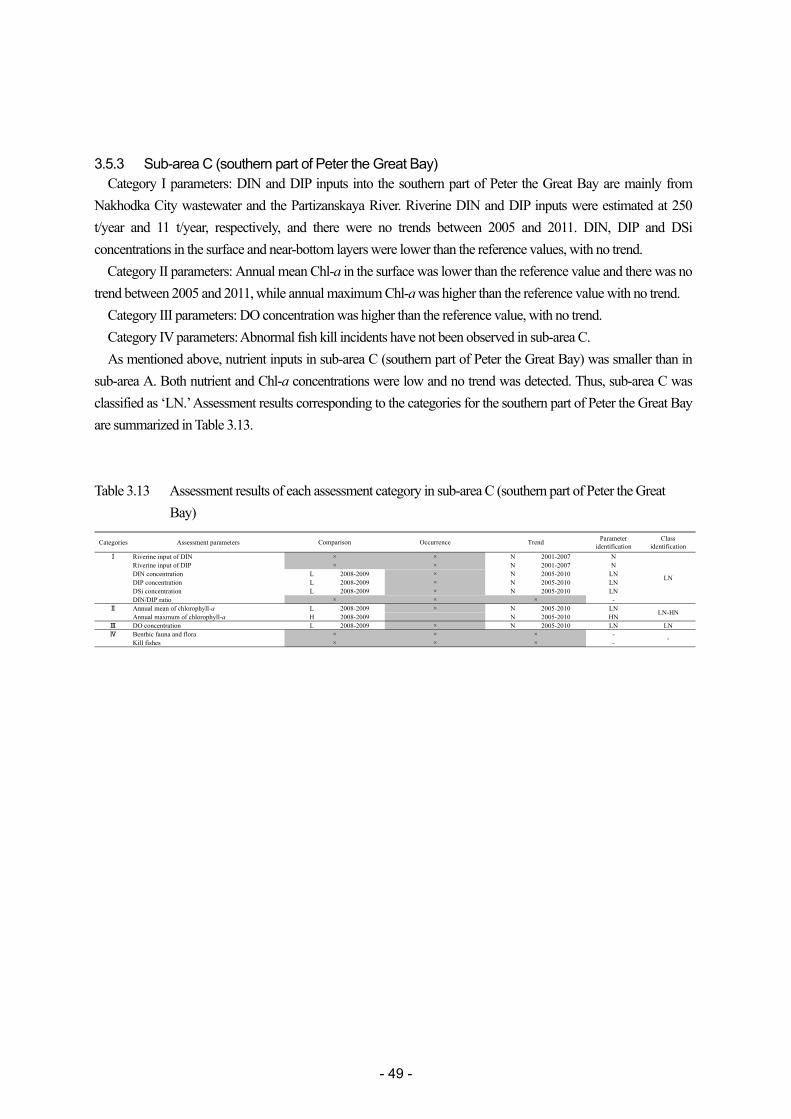
- 49 -
3.5.3 Sub-area C (southern part of Peter the Great Bay) Category I parameters: DIN and DIP inputs into the southern part of Peter the Great Bay are mainly from
Nakhodka City wastewater and the Partizanskaya River. Riverine DIN and DIP inputs were estimated at 250 t/year and 11 t/year, respectively, and there were no trends between 2005 and 2011. DIN, DIP and DSi concentrations in the surface and near-bottom layers were lower than the reference values, with no trend.
Category II parameters: Annual mean Chl-a in the surface was lower than the reference value and there was no trend between 2005 and 2011, while annual maximum Chl-a was higher than the reference value with no trend.
Category III parameters: DO concentration was higher than the reference value, with no trend. Category IV parameters: Abnormal fish kill incidents have not been observed in sub-area C. As mentioned above, nutrient inputs in sub-area C (southern part of Peter the Great Bay) was smaller than in
sub-area A. Both nutrient and Chl-a concentrations were low and no trend was detected. Thus, sub-area C was classified as ‘LN.’ Assessment results corresponding to the categories for the southern part of Peter the Great Bay are summarized in Table 3.13. Table 3.13 Assessment results of each assessment category in sub-area C (southern part of Peter the Great
Bay)
Categories Assessment parameters Parameteridentification
Classidentification
Ⅰ Riverine input of DIN N 2001-2007 NRiverine input of DIP N 2001-2007 NDIN concentration L 2008-2009 N 2005-2010 LNDIP concentration L 2008-2009 N 2005-2010 LNDSi concentration L 2008-2009 N 2005-2010 LNDIN/DIP ratio -
Ⅱ Annual mean of chlorophyll-a L 2008-2009 N 2005-2010 LNAnnual maxmum of chlorophyll-a H 2008-2009 N 2005-2010 HN
Ⅲ DO concentration L 2008-2009 N 2005-2010 LN LNⅣ Benthic fauna and flora -
Kill fishes -
LN-HN
-
Comparison Occurrence Trend
LN
××××××
××
× ×
× × ×× × ×
×
×
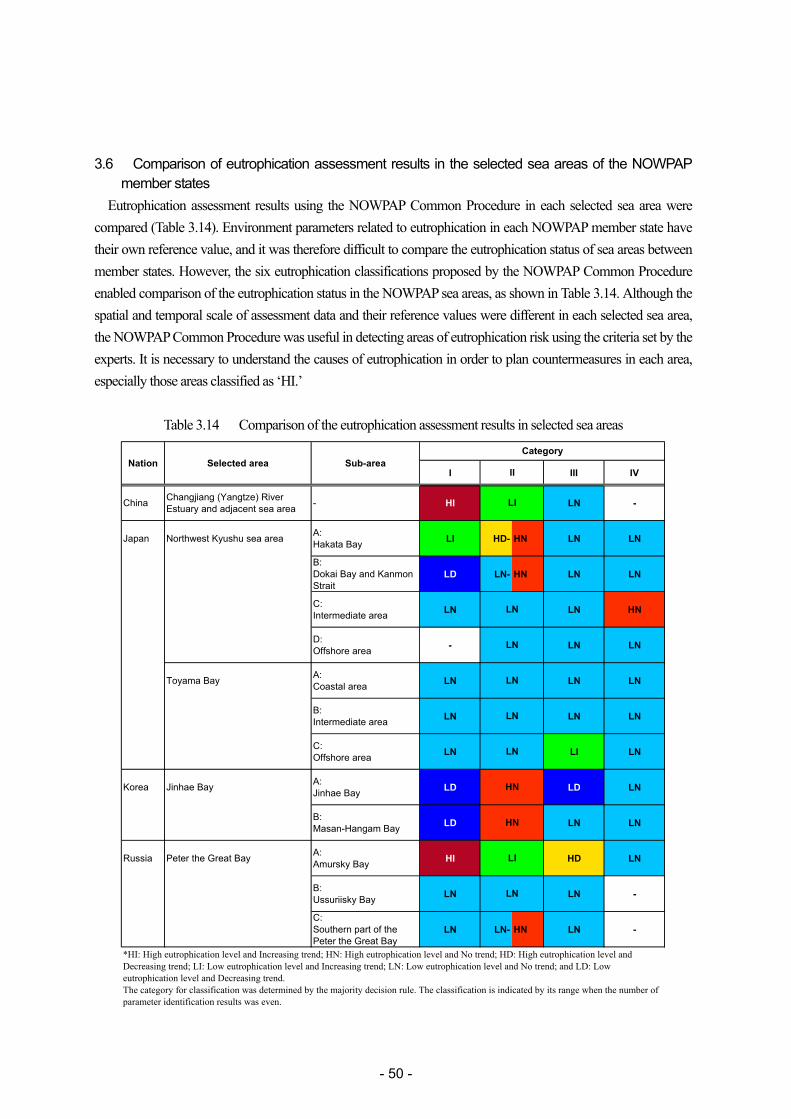
- 50 -
3.6 Comparison of eutrophication assessment results in the selected sea areas of the NOWPAP member states
Eutrophication assessment results using the NOWPAP Common Procedure in each selected sea area were compared (Table 3.14). Environment parameters related to eutrophication in each NOWPAP member state have their own reference value, and it was therefore difficult to compare the eutrophication status of sea areas between member states. However, the six eutrophication classifications proposed by the NOWPAP Common Procedure enabled comparison of the eutrophication status in the NOWPAP sea areas, as shown in Table 3.14. Although the spatial and temporal scale of assessment data and their reference values were different in each selected sea area, the NOWPAP Common Procedure was useful in detecting areas of eutrophication risk using the criteria set by the experts. It is necessary to understand the causes of eutrophication in order to plan countermeasures in each area, especially those areas classified as ‘HI.’
Table 3.14 Comparison of the eutrophication assessment results in selected sea areas
I III IV
China Changjiang (Yangtze) RiverEstuary and adjacent sea area - HI LN -
Japan Northwest Kyushu sea area A:Hakata Bay LI HD- HN LN LN
B:Dokai Bay and KanmonStrait
LD LN- HN LN LN
C:Intermediate area LN LN HN
D:Offshore area - LN LN
Toyama Bay A:Coastal area LN LN LN
B:Intermediate area LN LN LN
C:Offshore area LN LI LN
Korea Jinhae Bay A:Jinhae Bay LD LD LN
B:Masan-Hangam Bay LD LN LN
Russia Peter the Great Bay A:Amursky Bay HI HD LN
B:Ussuriisky Bay LN LN -
C:Southern part of thePeter the Great Bay
LN LN- HN LN -
LI
Nation Selected area Sub-areaCategory
II
HN
LI
LN
*HI: High eutrophication level and Increasing trend; HN: High eutrophication level and No trend; HD: High eutrophication level andDecreasing trend; LI: Low eutrophication level and Increasing trend; LN: Low eutrophication level and No trend; and LD: Loweutrophication level and Decreasing trend.The category for classification was determined by the majority decision rule. The classification is indicated by its range when the number ofparameter identification results was even.
LN
LN
LN
LN
LN
HN
- 51 -
3.7 Comparison of classification results of common parameters in the selected sea areas of the NOWPAP member states
DIN, DIP, DIN/DIP ratio, annual maximum and mean Chl-a and DO were commonly used parameters in the selected sea areas, and so the classifications of these parameters were compared.
3.7.1 Comparison of DIN concentrations DIN concentrations were compared among the selected sea areas as an assessment parameter in Category I
(Fig. 3.3). China used data on the annual mean DIN concentrations, whereas Japan and Korea used the winter DIN concentration as a parameter. Russia used average of DIN data observed in each cruise. Data from the Changjiang (Yangtze) River Estuary and its adjacent area, sub-area A in Northwest Kyushu sea area (Hakata Bay) and sub-area A in Peter the Great Bay (Amursky Bay) showed an increasing trend. However, data from Jinhae Bay and Masan-Haengam Bay in Korea showed a decreasing trend.
DIN concentrations in the Changjiang (Yangtze) River Estuary and its adjacent area and Hakata Bay exceeded their respective reference values and were classified as ‘High eutrophication level.’ On the other hand, the values of sub-area C (Kyushu intermediate area) in the Northwest Kyushu sea area, all of the sub-areas of Toyama Bay, Jinhae Bay and Masan-Haengam Bay were lower than their respective reference values and classified as ‘Low eutrophication level.’ There were no data in Sub-area B (Dokai Bay and Kanmon Strait) and sub-area D (Kyushu offshore area) in the Northwest Kyushu over the recent three years, so no classification was made. Assessment data in sub-area A (Amursky Bay) in Peter the Great Bay exceeded its reference values so sub-area A was classified as ‘High eutrophication level’. 3.7.2 Comparison of DIP concentrations
DIP concentrations were compared among the selected sea areas as an assessment parameter in Category I (Fig. 3.4). China used annual mean DIP concentration data, whereas Japan and Korea used that of winter DIP concentration. Russia used average of DIP data observed in each cruise. Data in the Changjiang (Yangtze) River Estuary and its adjacent area, and sub-area A (Amursky Bay) in Peter the Great Bay showed an increasing trend. However, data of Jinhae Bay and Masan-Haengam Bay in Korea and sub-are C (intermediate area) in the Northwest Kyushu area showed a decreasing trend. There was no trend identified in sub-area A (Hakata Bay) in the Northwest Kyushu sea area or any of the sub-areas in Toyama Bay.
DIP concentration in the Changjiang (Yangtze) River Estuary and its adjacent area, Hakata Bay and the Kyushu intermediate area, all of the sub-areas of Toyama Bay, Jinhae Bay and Masan-Haengam Bay were under their respective reference values and classified as ‘Low eutrophication level.’ There were no data in Dokai Bay and Kanmon Strait and the Kyushu offshore over the recent three years, and so no classification was made. DIP concentration in sub-area A (Amursky Bay) in Peter the Great Bay exceeded the reference value and so the bay was classified as ‘High eutrophication level.’
- 52 -
3.7.3 Comparison of DIN/DIP ratios DIN/DIP ratios were compared among the selected sea areas as an assessment parameter in Category I (Fig.
3.5). China used annual mean DIN/DIP ratios, whereas Japan and Korea used winter DIN/DIP ratios. Russia used average of DIN/DIP ratios in each cruise. Data in the Changjiang (Yangtze) River Estuary and its adjacent area, Hakata Bay, Dokai Bay and Kanmon Strait, and Kyushu intermediate area showed an increasing trend. However, data from Jinhae Bay and Masan-Haengam Bay showed a decreasing trend. There were no trends detected in any of the sub-areas of Toyama Bay in Japan.
The ratio in the Changjiang (Yangtze) River Estuary and its adjacent area, Hakata Bay, the Kyushu intermediate area and all sub-areas in Toyama Bay exceeded its reference value, and these areas were all classified as ‘High eutrophication level.’ Conversely, the ratios in Jinhae Bay and Masan-Haengam Bay were under the reference value and these areas were classified as ‘Low eutrophication level.’ Dokai Bay and Kanmon Strait and Kyushu offshore area did not have relevant data from the recent three years, and so no classification was made. No reference value was set for DIN/DIP ratio in Peter the Great Bay and classification was not made. 3.7.4 Comparison of annual maximum Chl-a
Annual maximum Chl-a data were compared among the selected sea areas as an assessment parameter in Category II (Fig. 3.6). There was no trend detected in the Changjiang (Yangtze) River Estuary and its adjacent area, Dokai Bay and Kanmon Strait, Kyushu intermediate area and Kyushu offshore area, or any Toyama Bay sub-areas. However, data in Hakata Bay showed a decreasing trend.
Annual maximum Chl-a in the Changjiang (Yangtze) River Estuary and its adjacent area, the Kyushu intermediate area, all sub-areas in Toyama Bay and Ussuriisky Bay were under the reference values and classified as ‘Low eutrophication level.’ Conversely, concentrations in Hakata Bay and Dokai Bay and Kanmon Strait and southern part of Peter the Great Bay exceeded their reference values and were classified as ‘High eutrophication level.’ There were no data in Kyushu offshore area over the recent three years, and so no classification was made. In Korea and Amursky Bay in Russia, annual maximum Chl-a was not used as an assessment parameter. 3.7.5 Comparison of annual mean Chl-a
Annual mean Chl-a data were compared among the selected sea areas as an assessment parameter in Category II (Fig. 3.7). Data from the Changjiang (Yangtze) River Estuary and its adjacent area and Amursky Bay showed an increasing trend. However, data from Hakata Bay and Jinhae Bay showed a decreasing trend. There was no trend detected in Masan-Haengam Bay.
Annual mean Chl-a in Hakata Bay, Dokai Bay and Kanmon Strait, Jinhae Bay and Masan-Haengam Bay exceeded their respective reference values, and these areas were classified as ‘High eutrophication level.’ Conversely, concentrations in the Changjiang (Yangtze) River Estuary and its adjacent area, the Northwest Kyushu intermediate area and all sub-areas in Toyama Bay were under their respective reference values and classified as ‘Low eutrophication level.’ There were no data in Kyushu offshore area over the recent three years, and so no classification was made.
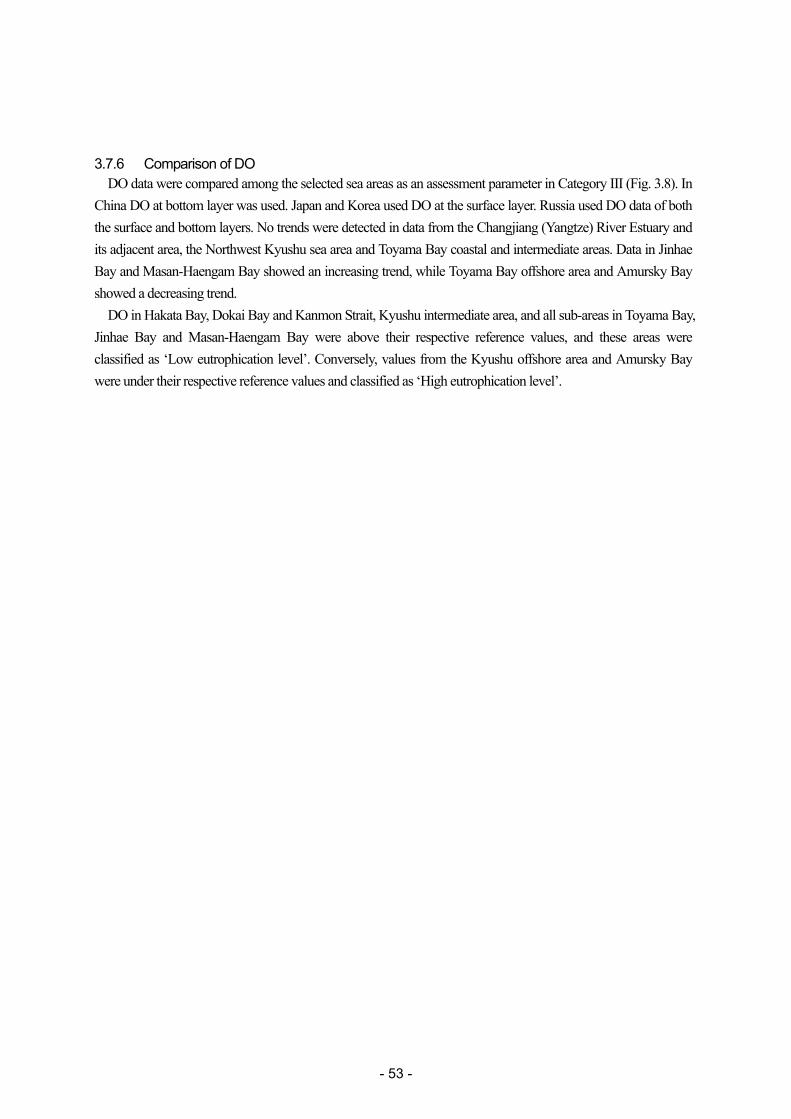
- 53 -
3.7.6 Comparison of DO DO data were compared among the selected sea areas as an assessment parameter in Category III (Fig. 3.8). In
China DO at bottom layer was used. Japan and Korea used DO at the surface layer. Russia used DO data of both the surface and bottom layers. No trends were detected in data from the Changjiang (Yangtze) River Estuary and its adjacent area, the Northwest Kyushu sea area and Toyama Bay coastal and intermediate areas. Data in Jinhae Bay and Masan-Haengam Bay showed an increasing trend, while Toyama Bay offshore area and Amursky Bay showed a decreasing trend.
DO in Hakata Bay, Dokai Bay and Kanmon Strait, Kyushu intermediate area, and all sub-areas in Toyama Bay, Jinhae Bay and Masan-Haengam Bay were above their respective reference values, and these areas were classified as ‘Low eutrophication level’. Conversely, values from the Kyushu offshore area and Amursky Bay were under their respective reference values and classified as ‘High eutrophication level’.
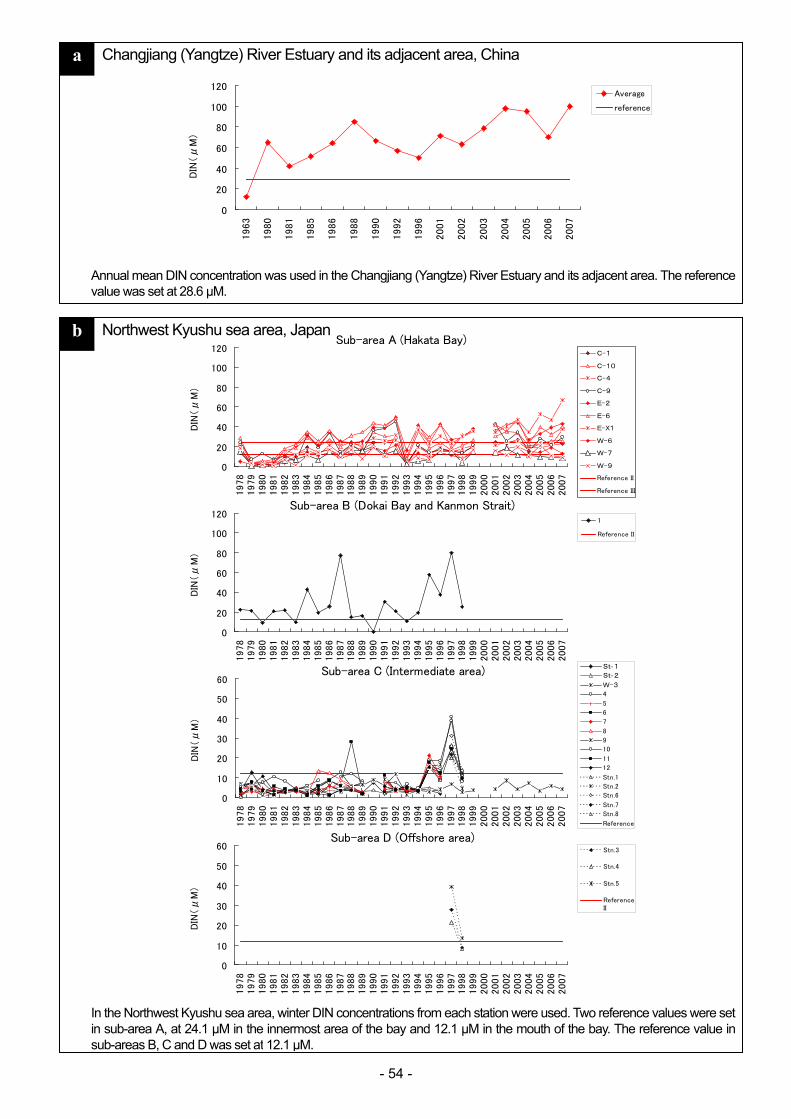
- 54 -
b Northwest Kyushu sea area, Japan
a Changjiang (Yangtze) River Estuary and its adjacent area, China
In the Northwest Kyushu sea area, winter DIN concentrations from each station were used. Two reference values were set in sub-area A, at 24.1 μM in the innermost area of the bay and 12.1 μM in the mouth of the bay. The reference value in sub-areas B, C and D was set at 12.1 μM.
Annual mean DIN concentration was used in the Changjiang (Yangtze) River Estuary and its adjacent area. The reference value was set at 28.6 μM.
0
20
40
60
80
100
120
1963
1980
1981
1985
1986
1988
1990
1992
1996
2001
2002
2003
2004
2005
2006
2007
DIN
(μ
M)
Average
reference
Sub-area A (Hakata Bay)
0
20
40
60
80
100
120
1978
1979
1980
1981
1982
1983
1984
1985
1986
1987
1988
1989
1990
1991
1992
1993
1994
1995
1996
1997
1998
1999
2000
2001
2002
2003
2004
2005
2006
2007
DIN
(μ
M)
C-1
C-10
C-4
C-9
E-2
E-6
E-X1
W-6
W-7
W-9
Reference II
Reference III
Sub-area B (Dokai Bay and Kanmon Strait)
0
20
40
60
80
100
120
1978
1979
1980
1981
1982
1983
1984
1985
1986
1987
1988
1989
1990
1991
1992
1993
1994
1995
1996
1997
1998
1999
2000
2001
2002
2003
2004
2005
2006
2007
DIN
(μ
M)
1
Reference II
Sub-area C (Intermediate area)
0
10
20
30
40
50
60
1978
1979
1980
1981
1982
1983
1984
1985
1986
1987
1988
1989
1990
1991
1992
1993
1994
1995
1996
1997
1998
1999
2000
2001
2002
2003
2004
2005
2006
2007
DIN
(μ
M)
St‐1
St‐2
W-3
4
5
6
7
8
9
10
11
12
Stn.1
Stn.2
Stn.6
Stn.7
Stn.8
Reference
Sub-area D (Offshore area)
0
10
20
30
40
50
60
1978
1979
1980
1981
1982
1983
1984
1985
1986
1987
1988
1989
1990
1991
1992
1993
1994
1995
1996
1997
1998
1999
2000
2001
2002
2003
2004
2005
2006
2007
DIN
(μ
M)
Stn.3
Stn.4
Stn.5
ReferenceII

- 55 -
Fig. 3.3 DIN concentration in selected sea areas of the NOWPAP region
e Peter the Great Bay, Russia d Jinhae Bay, Korea
c Toyama Bay, Japan
Sub-area A (Amursky Bay)
0
2
4
6
8
10
12
14
2001.7
2001.7
2005
2006
2007
2008.7
2008.8
2009
2010
DIN
(μ
M)
Average ofsurface
Average ofbottom
Jinhae Bay
0
10
20
30
40
50
60
2002
2003
2004
2005
2006
2007
2008
DIN
(μ
M)
Average
Backgroundvalues
Masan-Haengam Bay
0
10
20
30
40
50
60
2002
2003
2004
2005
2006
2007
2008
DIN
(μ
M)
Average
Backgroundvalues
In Toyama Bay, winter DIN concentration of each station was used. The reference value was 10.3 μM.
In Jinhae Bay Korea, Winter DIN concentration was used. The reference value was set at 5.7-7.0 μM, being the background value observed in the Gijang area.
In Peter the Great Bay, Russia, the data of sub-area A (Amursky Bay) are shown. The annual mean DIN concentrations in the surface and bottom layers are shown with open and solid circles respectively. Reference values were set at 33.4 μM, 18.3 μM and 24.3 μM for winter, summer and spring/autumn in 2008, respectively.
Sub-area A (coastal area)
0
5
10
15
20
25
30
35
402000
2001
2002
2003
2004
2005
2006
2007
DIN
(μ
M)
J5
O5
S4
S6
Reference II
Sub-area B (intermediate area)
0
5
10
15
20
25
30
35
40
2000
2001
2002
2003
2004
2005
2006
2007
DIN
(μ
M)
S2
S8
Reference II
Sub-area C (offshore area)
0
5
10
15
20
25
30
35
40
2000
2001
2002
2003
2004
2005
2006
2007
DIN
(μ
M)
C
S10
Reference II
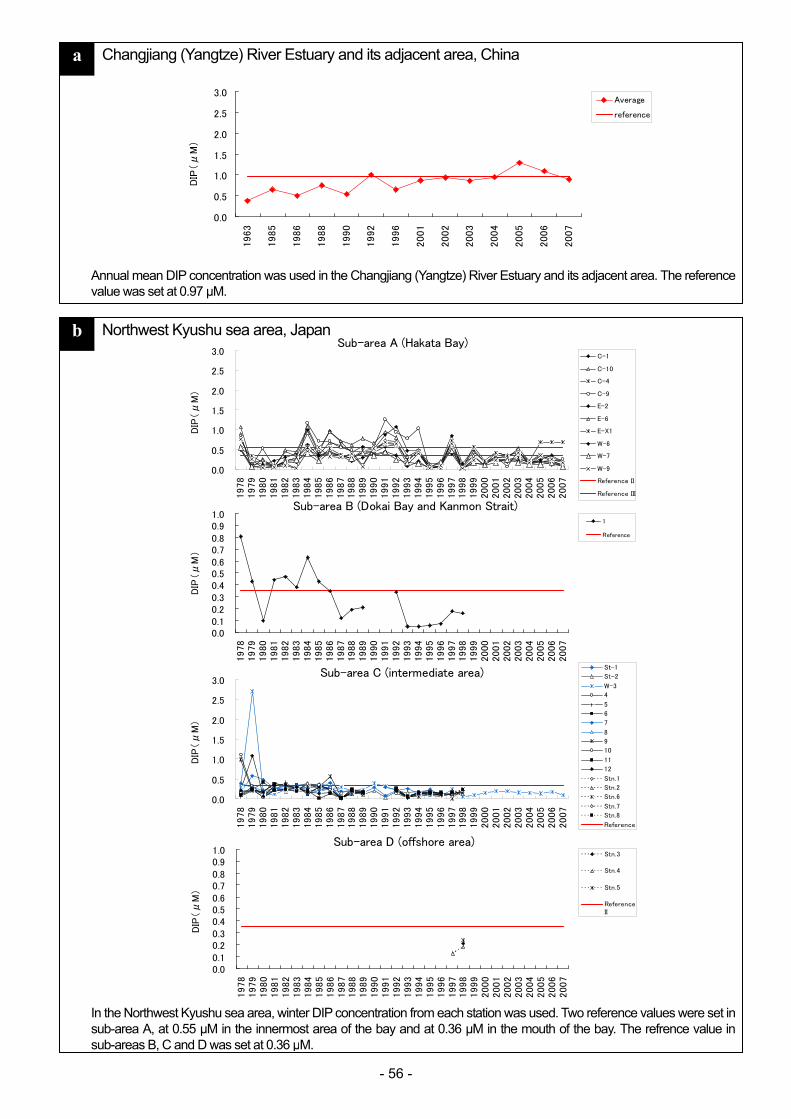
- 56 -
b Northwest Kyushu sea area, Japan
a Changjiang (Yangtze) River Estuary and its adjacent area, China
In the Northwest Kyushu sea area, winter DIP concentration from each station was used. Two reference values were set in sub-area A, at 0.55 μM in the innermost area of the bay and at 0.36 μM in the mouth of the bay. The refrence value in sub-areas B, C and D was set at 0.36 μM.
Annual mean DIP concentration was used in the Changjiang (Yangtze) River Estuary and its adjacent area. The reference value was set at 0.97 μM.
0.0
0.5
1.0
1.5
2.0
2.5
3.0
1963
1985
1986
1988
1990
1992
1996
2001
2002
2003
2004
2005
2006
2007
DIP
(μ
M)
Average
reference
Sub-area A (Hakata Bay)
0.0
0.5
1.0
1.5
2.0
2.5
3.0
1978
1979
1980
1981
1982
1983
1984
1985
1986
1987
1988
1989
1990
1991
1992
1993
1994
1995
1996
1997
1998
1999
2000
2001
2002
2003
2004
2005
2006
2007
DIP
(μ
M)
C-1
C-10
C-4
C-9
E-2
E-6
E-X1
W-6
W-7
W-9
Reference II
Reference III
Sub-area C (intermediate area)
0.0
0.5
1.0
1.5
2.0
2.5
3.0
1978
1979
1980
1981
1982
1983
1984
1985
1986
1987
1988
1989
1990
1991
1992
1993
1994
1995
1996
1997
1998
1999
2000
2001
2002
2003
2004
2005
2006
2007
DIP
(μ
M)
St-1
St-2
W-3
4
5
6
7
8
9
10
11
12
Stn.1
Stn.2
Stn.6
Stn.7
Stn.8
Reference
Sub-area D (offshore area)
0.00.10.20.30.40.50.60.70.80.91.0
1978
1979
1980
1981
1982
1983
1984
1985
1986
1987
1988
1989
1990
1991
1992
1993
1994
1995
1996
1997
1998
1999
2000
2001
2002
2003
2004
2005
2006
2007
DIP
(μ
M)
Stn.3
Stn.4
Stn.5
ReferenceII
Sub-area B (Dokai Bay and Kanmon Strait)
0.00.10.20.30.40.50.60.70.80.91.0
1978
1979
1980
1981
1982
1983
1984
1985
1986
1987
1988
1989
1990
1991
1992
1993
1994
1995
1996
1997
1998
1999
2000
2001
2002
2003
2004
2005
2006
2007
DIP
(μM
)
1
Reference

- 57 -
Fig. 3.4 DIP concentration in selected sea areas in the NOWPAP region
d Jinhae Bay, Korea e Peter the Great Bay, Russia
In Toyama Bay, winter DIP concentration from each station was used. The reference value was set at 0.55 μM.
In Jinhae Bay Korea, Winter DIP concentration was used. The reference value was set at 0.36-0.67 μM, being the background value observed in the Gijang area.
In Peter the Great Bay, Russia, sub-area A (Amursky Bay) data are shown. Annual mean DIP concentrations in the surface and bottom layers are shown with solid and open circles respectively. Reference values were set at 2.1 μM, 1.1 μM and 1.5 μM for winter, summer and spring/autumn in 2008, respectively.
Sub-area A (Amursky Bay)
0.0
0.5
1.0
1.5
2.0
2.5
3.0
2001.7
2001.7
2005
2006
2007
2008.7
2008.8
2009
2010
DIP
(μ
M)
Average ofsurface
Average ofbottom
Jinhae Bay
0.0
0.5
1.0
1.5
2.0
2.5
3.0
2002
2003
2004
2005
2006
2007
2008
DIP
(μ
M)
Average
Backgroundvalues
Masan-Haengam Bay
0.0
0.5
1.0
1.5
2.0
2.5
3.0
2002
2003
2004
2005
2006
2007
2008
DIP
(μ
M)
Average
Backgroundvalues
c Toyama Bay, Japan Sub-area A (coastal area)
0.00.10.20.30.40.50.60.70.80.91.0
2000
2001
2002
2003
2004
2005
2006
2007
DIP
(μ
M)
J5
O5
S4
S6
Reference II
Sub-area B (intermediate area)
0.00.10.20.30.40.50.60.70.80.91.0
2000
2001
2002
2003
2004
2005
2006
2007
DIP
(μ
M)
S2
S8
Reference II
Sub-area C (offshore area)
0.00.10.20.30.40.50.60.70.80.91.0
2000
2001
2002
2003
2004
2005
2006
2007
DIP
(μ
M/L)
C
S10
Reference II
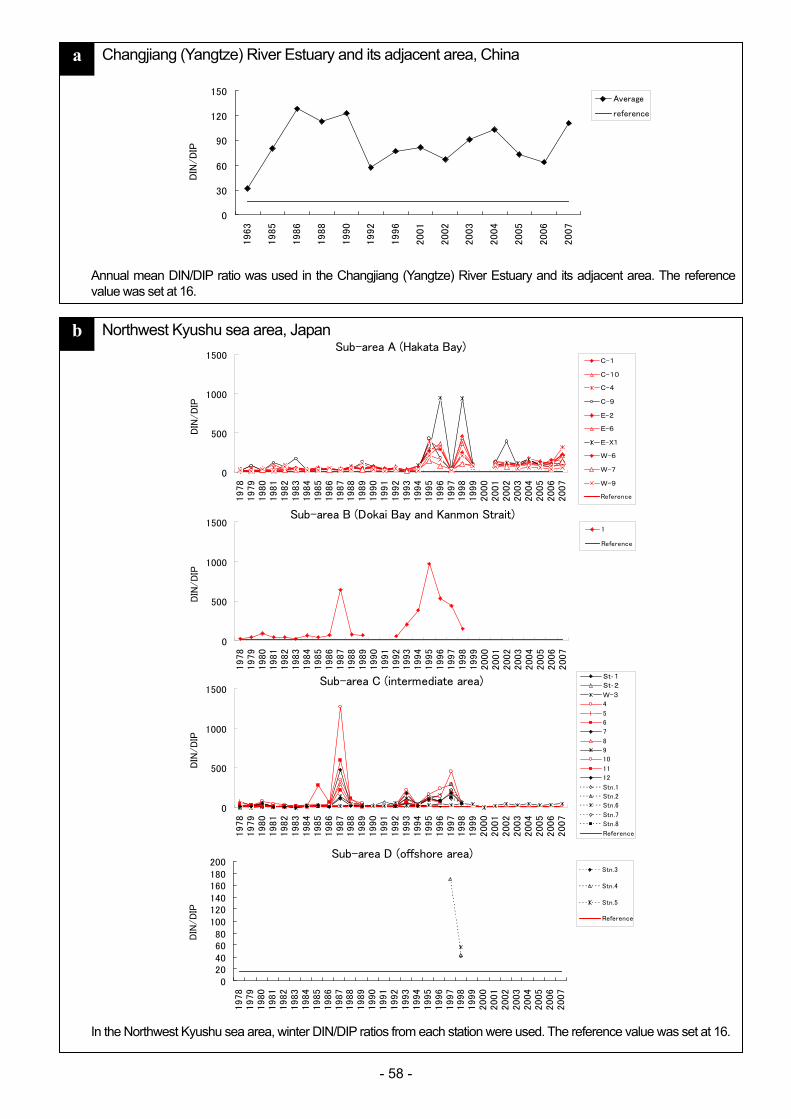
- 58 -
b Northwest Kyushu sea area, Japan
a Changjiang (Yangtze) River Estuary and its adjacent area, China
In the Northwest Kyushu sea area, winter DIN/DIP ratios from each station were used. The reference value was set at 16.
Annual mean DIN/DIP ratio was used in the Changjiang (Yangtze) River Estuary and its adjacent area. The reference value was set at 16.
0
30
60
90
120
150
1963
1985
1986
1988
1990
1992
1996
2001
2002
2003
2004
2005
2006
2007
DIN
/D
IP
Average
reference
Sub-area A (Hakata Bay)
0
500
1000
1500
1978
1979
1980
1981
1982
1983
1984
1985
1986
1987
1988
1989
1990
1991
1992
1993
1994
1995
1996
1997
1998
1999
2000
2001
2002
2003
2004
2005
2006
2007
DIN
/D
IP
C-1
C-10
C-4
C-9
E-2
E-6
E-X1
W-6
W-7
W-9
Reference
Sub-area B (Dokai Bay and Kanmon Strait)
0
500
1000
1500
1978
1979
1980
1981
1982
1983
1984
1985
1986
1987
1988
1989
1990
1991
1992
1993
1994
1995
1996
1997
1998
1999
2000
2001
2002
2003
2004
2005
2006
2007
DIN
/D
IP
1
Reference
Sub-area C (intermediate area)
0
500
1000
1500
1978
1979
1980
1981
1982
1983
1984
1985
1986
1987
1988
1989
1990
1991
1992
1993
1994
1995
1996
1997
1998
1999
2000
2001
2002
2003
2004
2005
2006
2007
DIN
/D
IP
St‐1
St‐2
W-3
4
5
6
7
8
9
10
11
12
Stn.1
Stn.2
Stn.6
Stn.7
Stn.8
Reference
Sub-area D (offshore area)
020406080
100120140160180200
1978
1979
1980
1981
1982
1983
1984
1985
1986
1987
1988
1989
1990
1991
1992
1993
1994
1995
1996
1997
1998
1999
2000
2001
2002
2003
2004
2005
2006
2007
DIN
/D
IP
Stn.3
Stn.4
Stn.5
Reference

- 59 -
Fig. 3.5 DIN/DIP ratio in selected sea areas in the NOWPAP region
c Toyama Bay, Japan
e Peter the Great Bay, Russia d Jinhae Bay, Korea
Sub-area A (Amursky Bay)
0
10
20
30
40
50
2001.7
2001.7
2005
2006
2007
2008.7
2008.8
2009
2010
DIN
/D
IP
Average ofsurface
Average ofbottom
Jinhae Bay
0
10
20
30
40
50
2002
2003
2004
2005
2006
2007
2008
DIN
/D
IP
Average
Backgroundvalues
Masan-Haengam Bay
0
10
20
30
40
50
2002
2003
2004
2005
2006
2007
2008
DIN
/D
IP
Average
Backgroundvalues
In Toyama Bay, winter DIN/DIP ratio from each station was used. The reference value was set at the Redfield ratio of 16.
In Jinhae Bay Korea, Winter DIN/DIP ratio was used. The reference value was set at 3.9-8.9, being the background values observed in the Gijang area.
In Peter the Great Bay, Russia, the data of sub-area A (Amursky Bay) are shown. Annual mean DIN/DIP ratio in the surface and bottom layers are shown with solid and open circles respectively. The reference value was set at 16.
Sub-area A (coastal area)
0
30
60
90
120
1502000
2001
2002
2003
2004
2005
2006
2007
DIN
/D
IP
J5
O5
S4
S6
Reference II
Sub-area B (intermediate area)
0
10
20
30
40
50
2000
2001
2002
2003
2004
2005
2006
2007
DIN
/D
IP
S2
S8
Reference II
Sub-area C (offshore area)
0
10
20
30
40
50
2000
2001
2002
2003
2004
2005
2006
2007
DIN
/D
IP
C
S10
Reference
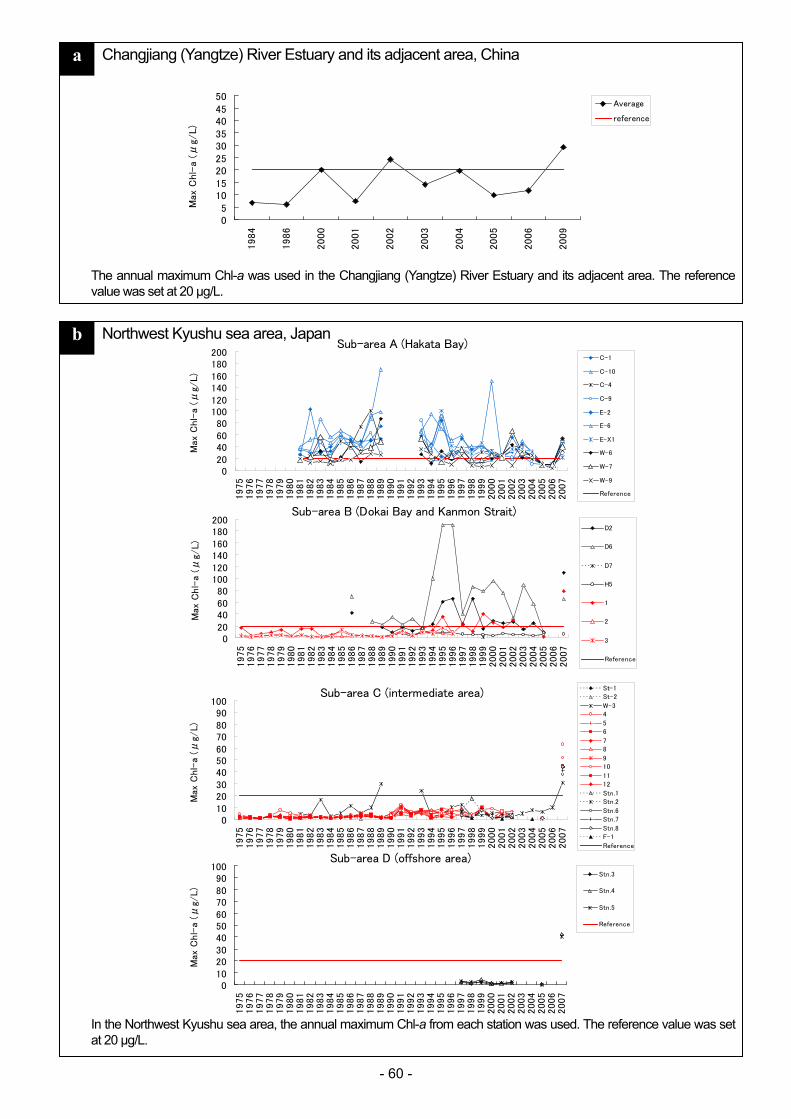
- 60 -
b Northwest Kyushu sea area, Japan
a Changjiang (Yangtze) River Estuary and its adjacent area, China
In the Northwest Kyushu sea area, the annual maximum Chl-a from each station was used. The reference value was set at 20 μg/L.
The annual maximum Chl-a was used in the Changjiang (Yangtze) River Estuary and its adjacent area. The reference value was set at 20 μg/L.
Sub-area A (Hakata Bay)
020406080
100120140160180200
1975
1976
1977
1978
1979
1980
1981
1982
1983
1984
1985
1986
1987
1988
1989
1990
1991
1992
1993
1994
1995
1996
1997
1998
1999
2000
2001
2002
2003
2004
2005
2006
2007
Max
Chl-
a (μ
g/L)
C-1
C-10
C-4
C-9
E-2
E-6
E-X1
W-6
W-7
W-9
Reference
Sub-area B (Dokai Bay and Kanmon Strait)
020406080
100120140160180200
1975
1976
1977
1978
1979
1980
1981
1982
1983
1984
1985
1986
1987
1988
1989
1990
1991
1992
1993
1994
1995
1996
1997
1998
1999
2000
2001
2002
2003
2004
2005
2006
2007
Max
Chl-
a (μ
g/L)
D2
D6
D7
H5
1
2
3
Reference
Sub-area C (intermediate area)
0102030405060708090
100
1975
1976
1977
1978
1979
1980
1981
1982
1983
1984
1985
1986
1987
1988
1989
1990
1991
1992
1993
1994
1995
1996
1997
1998
1999
2000
2001
2002
2003
2004
2005
2006
2007
Max
Chl-
a (μ
g/L)
St-1St-2
W-34
56
78
910
1112
Stn.1Stn.2
Stn.6Stn.7
Stn.8F-1
Reference
Sub-area D (offshore area)
0102030405060708090
100
1975
1976
1977
1978
1979
1980
1981
1982
1983
1984
1985
1986
1987
1988
1989
1990
1991
1992
1993
1994
1995
1996
1997
1998
1999
2000
2001
2002
2003
2004
2005
2006
2007
Max
Chl-
a (μ
g/L)
Stn.3
Stn.4
Stn.5
Reference
05
101520253035404550
1984
1986
2000
2001
2002
2003
2004
2005
2006
2009
Max
Chl-
a (μ
g/L)
Average
reference
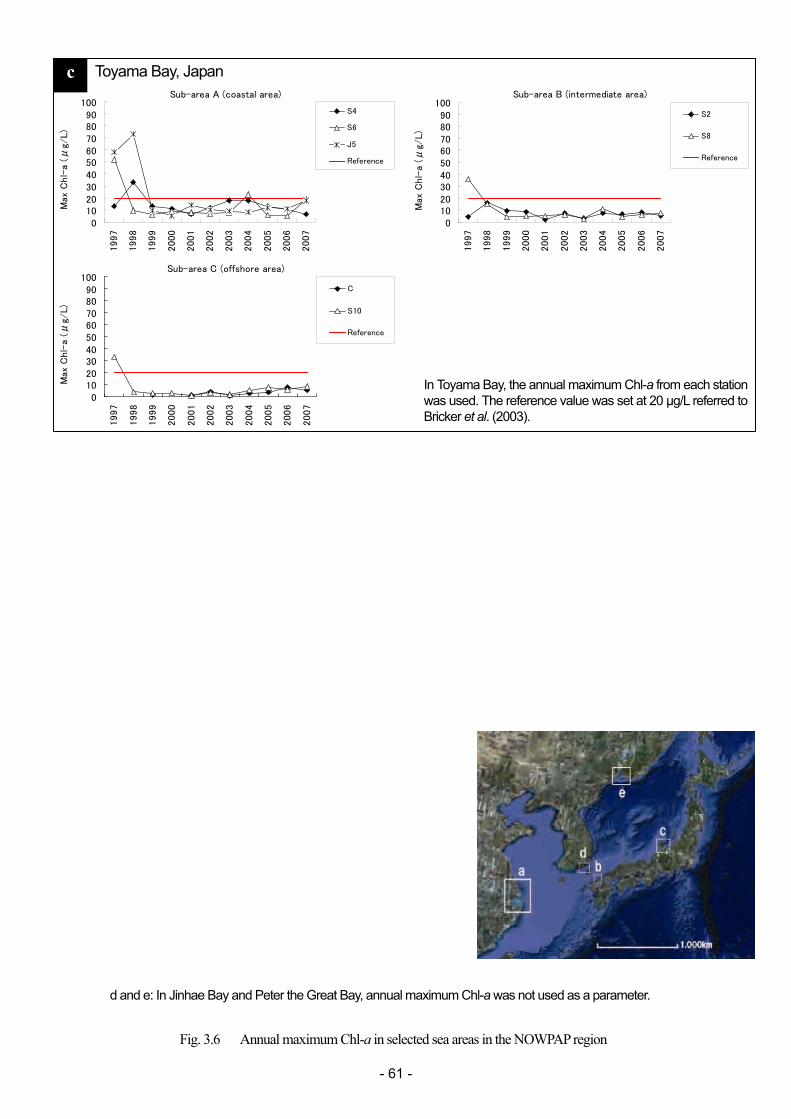
- 61 -
d and e: In Jinhae Bay and Peter the Great Bay, annual maximum Chl-a was not used as a parameter.
Fig. 3.6 Annual maximum Chl-a in selected sea areas in the NOWPAP region
c Toyama Bay, Japan
In Toyama Bay, the annual maximum Chl-a from each station was used. The reference value was set at 20 μg/L referred to Bricker et al. (2003).
Sub-area A (coastal area)
0102030405060708090
1001997
1998
1999
2000
2001
2002
2003
2004
2005
2006
2007
Max
Chl-
a (μ
g/L)
S4
S6
J5
Reference
Sub-area B (intermediate area)
0102030405060708090
100
1997
1998
1999
2000
2001
2002
2003
2004
2005
2006
2007
Max
Chl-
a (μ
g/L)
S2
S8
Reference
Sub-area C (offshore area)
0102030405060708090
100
1997
1998
1999
2000
2001
2002
2003
2004
2005
2006
2007
Max
Chl-
a (μ
g/L)
C
S10
Reference
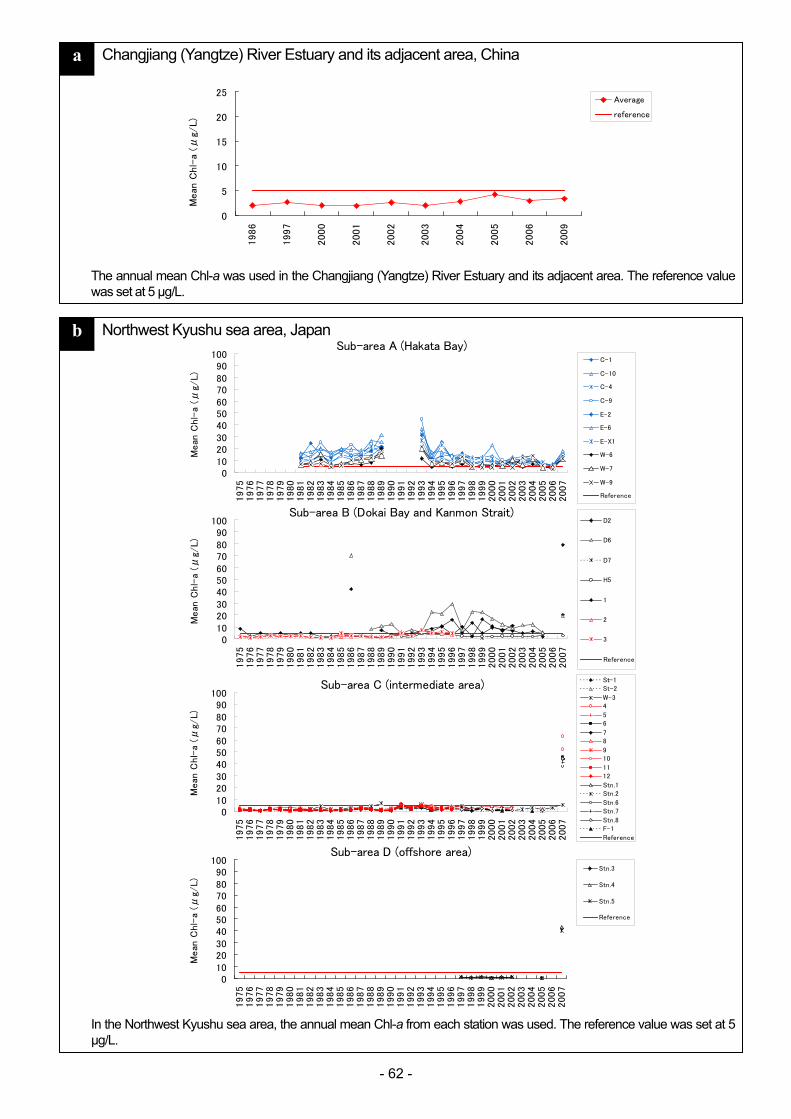
- 62 -
b Northwest Kyushu sea area, Japan
a Changjiang (Yangtze) River Estuary and its adjacent area, China
In the Northwest Kyushu sea area, the annual mean Chl-a from each station was used. The reference value was set at 5 μg/L.
The annual mean Chl-a was used in the Changjiang (Yangtze) River Estuary and its adjacent area. The reference value was set at 5 μg/L.
0
5
10
15
20
25
1986
1997
2000
2001
2002
2003
2004
2005
2006
2009
Mean
Chl-
a (μ
g/L)
Average
reference
Sub-area A (Hakata Bay)
0102030405060708090
100
1975
1976
1977
1978
1979
1980
1981
1982
1983
1984
1985
1986
1987
1988
1989
1990
1991
1992
1993
1994
1995
1996
1997
1998
1999
2000
2001
2002
2003
2004
2005
2006
2007
Mean
Chl-
a (μ
g/L)
C-1
C-10
C-4
C-9
E-2
E-6
E-X1
W-6
W-7
W-9
Reference
Sub-area B (Dokai Bay and Kanmon Strait)
0102030405060708090
100
1975
1976
1977
1978
1979
1980
1981
1982
1983
1984
1985
1986
1987
1988
1989
1990
1991
1992
1993
1994
1995
1996
1997
1998
1999
2000
2001
2002
2003
2004
2005
2006
2007
Mean
Chl-
a (μ
g/L)
D2
D6
D7
H5
1
2
3
Reference
Sub-area C (intermediate area)
0102030405060708090
100
1975
1976
1977
1978
1979
1980
1981
1982
1983
1984
1985
1986
1987
1988
1989
1990
1991
1992
1993
1994
1995
1996
1997
1998
1999
2000
2001
2002
2003
2004
2005
2006
2007
Mean
Chl-
a (μ
g/L)
St-1St-2
W-34
56
78
910
1112
Stn.1Stn.2
Stn.6Stn.7
Stn.8F-1
Reference
Sub-area D (offshore area)
0102030405060708090
100
1975
1976
1977
1978
1979
1980
1981
1982
1983
1984
1985
1986
1987
1988
1989
1990
1991
1992
1993
1994
1995
1996
1997
1998
1999
2000
2001
2002
2003
2004
2005
2006
2007
Mean
Chl-
a (μ
g/L)
Stn.3
Stn.4
Stn.5
Reference
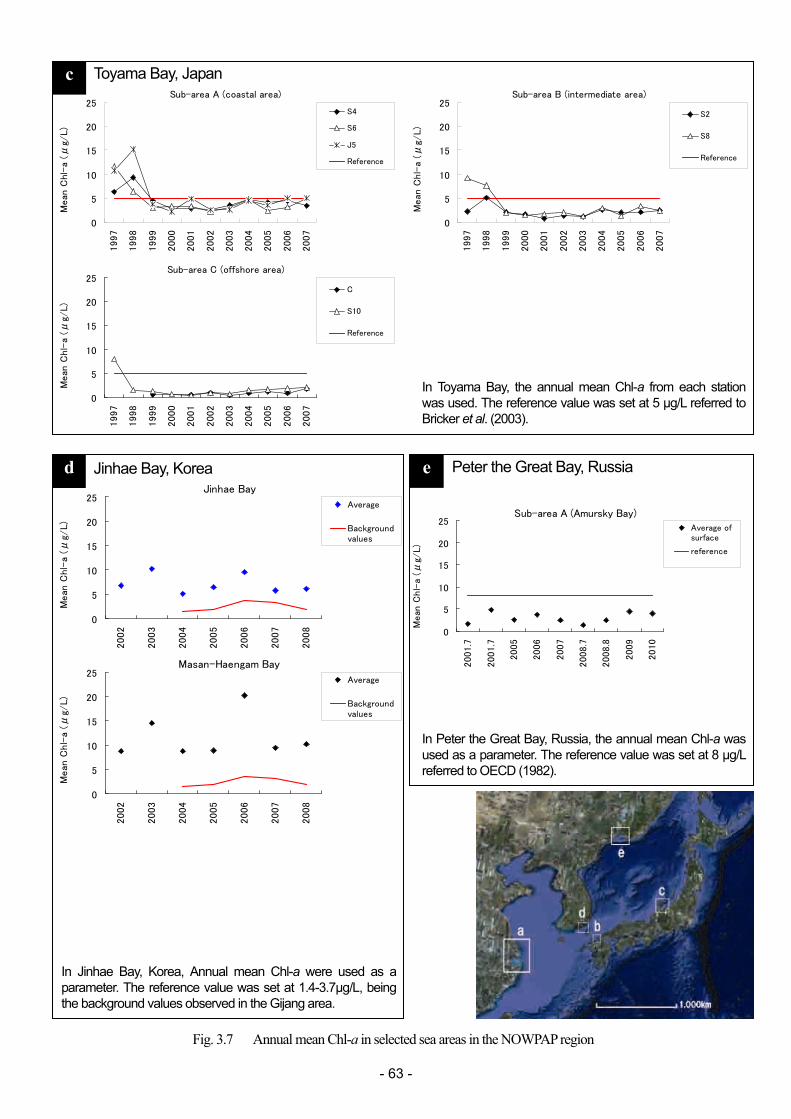
- 63 -
Fig. 3.7 Annual mean Chl-a in selected sea areas in the NOWPAP region
e Peter the Great Bay, Russia d Jinhae Bay, Korea
c Toyama Bay, Japan
In Toyama Bay, the annual mean Chl-a from each station was used. The reference value was set at 5 μg/L referred to Bricker et al. (2003).
In Jinhae Bay, Korea, Annual mean Chl-a were used as a parameter. The reference value was set at 1.4-3.7μg/L, being the background values observed in the Gijang area.
In Peter the Great Bay, Russia, the annual mean Chl-a was used as a parameter. The reference value was set at 8 μg/L referred to OECD (1982).
Sub-area A (coastal area)
0
5
10
15
20
251997
1998
1999
2000
2001
2002
2003
2004
2005
2006
2007
Mean
Chl-
a (μ
g/L)
S4
S6
J5
Reference
Sub-area B (intermediate area)
0
5
10
15
20
25
1997
1998
1999
2000
2001
2002
2003
2004
2005
2006
2007
Mean
Chl-
a (μ
g/L)
S2
S8
Reference
Sub-area C (offshore area)
0
5
10
15
20
25
1997
1998
1999
2000
2001
2002
2003
2004
2005
2006
2007
Mean
Chl-
a (μ
g/L)
C
S10
Reference
Sub-area A (Amursky Bay)
0
5
10
15
20
25
2001.7
2001.7
2005
2006
2007
2008.7
2008.8
2009
2010
Mean
Chl-
a (μ
g/L)
Average ofsurface
reference
Jinhae Bay
0
5
10
15
20
25
2002
2003
2004
2005
2006
2007
2008
Mean
Chl-
a (μ
g/L)
Average
Backgroundvalues
Masan-Haengam Bay
0
5
10
15
20
25
2002
2003
2004
2005
2006
2007
2008
Mean
Chl-
a (μ
g/L)
Average
Backgroundvalues
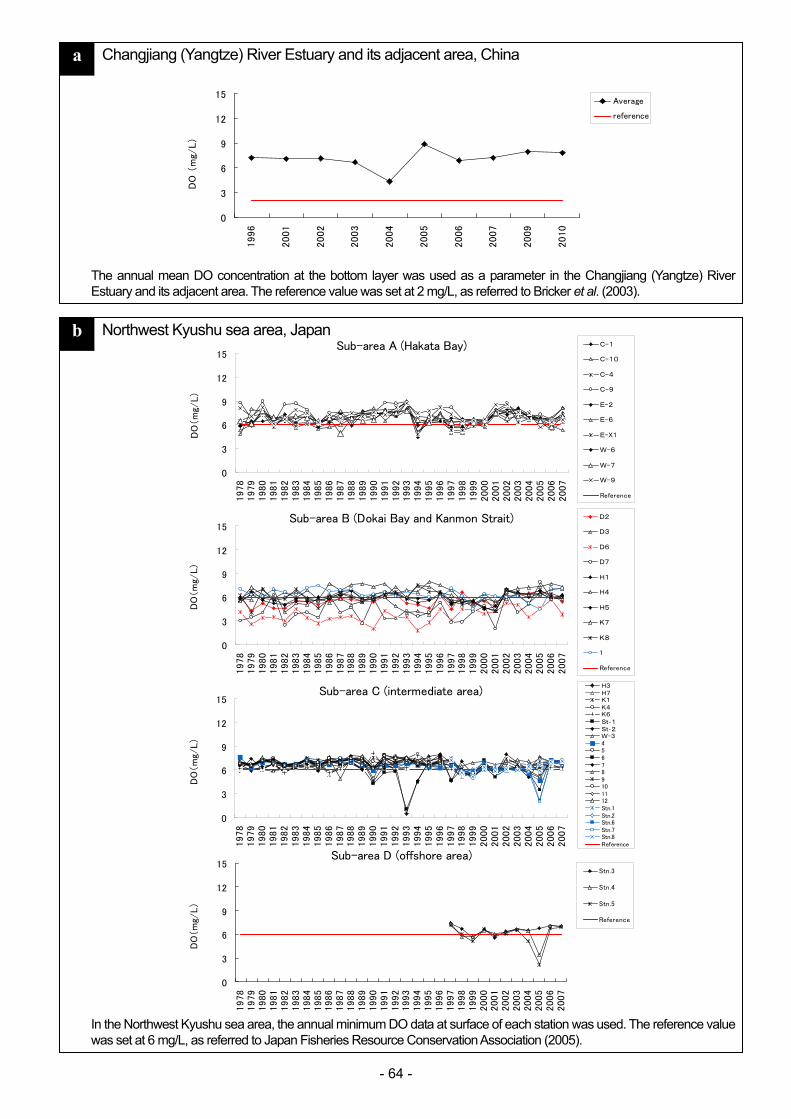
- 64 -
b Northwest Kyushu sea area, Japan
a Changjiang (Yangtze) River Estuary and its adjacent area, China
In the Northwest Kyushu sea area, the annual minimum DO data at surface of each station was used. The reference value was set at 6 mg/L, as referred to Japan Fisheries Resource Conservation Association (2005).
The annual mean DO concentration at the bottom layer was used as a parameter in the Changjiang (Yangtze) River Estuary and its adjacent area. The reference value was set at 2 mg/L, as referred to Bricker et al. (2003).
Sub-area A (Hakata Bay)
0
3
6
9
12
15
1978
1979
1980
1981
1982
1983
1984
1985
1986
1987
1988
1989
1990
1991
1992
1993
1994
1995
1996
1997
1998
1999
2000
2001
2002
2003
2004
2005
2006
2007
DO
(m
g/L)
C-1
C-10
C-4
C-9
E-2
E-6
E-X1
W-6
W-7
W-9
Reference
Sub-area B (Dokai Bay and Kanmon Strait)
0
3
6
9
12
15
1978
1979
1980
1981
1982
1983
1984
1985
1986
1987
1988
1989
1990
1991
1992
1993
1994
1995
1996
1997
1998
1999
2000
2001
2002
2003
2004
2005
2006
2007
DO
(m
g/L)
D2
D3
D6
D7
H1
H4
H5
K7
K8
1
Reference
Sub-area C (intermediate area)
0
3
6
9
12
15
1978
1979
1980
1981
1982
1983
1984
1985
1986
1987
1988
1989
1990
1991
1992
1993
1994
1995
1996
1997
1998
1999
2000
2001
2002
2003
2004
2005
2006
2007
DO
(m
g/L)
H3H7K1K4K6St‐1St‐2W-3456789101112Stn.1Stn.2Stn.6Stn.7Stn.8Reference
Sub-area D (offshore area)
0
3
6
9
12
15
1978
1979
1980
1981
1982
1983
1984
1985
1986
1987
1988
1989
1990
1991
1992
1993
1994
1995
1996
1997
1998
1999
2000
2001
2002
2003
2004
2005
2006
2007
DO
(m
g/L)
Stn.3
Stn.4
Stn.5
Reference
0
3
6
9
12
15
1996
2001
2002
2003
2004
2005
2006
2007
2009
2010
DO
(m
g/L)
Average
reference

- 65 -
Fig. 3.8 DO in selected sea areas in the NOWPAP region
e Peter the Great Bay, Russia d Jinhae Bay, Korea
c Toyama Bay, Japan
In Toyama Bay, annual minimum DO data at the surface of each station were used. The reference value was set at 6 mg/L referred to Japan Fisheries Resource Conservation Association (2005).
In Jinhae Bay Korea, The annual mean DO concentration was used as a parameter. The reference value was set at 6.0 mg/L referred to OSPAR (2005).
In Peter the Great Bay, Russia, the annual mean DO at the surface and bottom layers were used as a parameter. The reference value was set at 2.4 mg/L referred to Diaz (2001) and Diaz and Rosenberg (2008).
Sub-area A (Amursky Bay)
0
3
6
9
12
15
2000
2001
2005
2006
2007
2008.7
2008.8
2009
2010
DO
(m
g/L)
Average ofsurface
Average ofbottom
Sub-area A (coastal area)
0
3
6
9
12
151976
1977
1978
1979
1980
1981
1982
1983
1984
1985
1986
1987
1988
1989
1990
1991
1992
1993
1994
1995
1996
1997
1998
1999
2000
2001
2002
2003
2004
2005
2006
2007
DO
(m
g/L)
J4
J5
J6
O5
O6
S4
S5
S6
S7
Reference
Sub-area B (intermediate area)
0
3
6
9
12
15
1976
1977
1978
1979
1980
1981
1982
1983
1984
1985
1986
1987
1988
1989
1990
1991
1992
1993
1994
1995
1996
1997
1998
1999
2000
2001
2002
2003
2004
2005
2006
2007
DO
(m
g/L)
J7
O7
S1
S2
S3
S8
S9
Reference
Sub-area C (offshore area)
0
3
6
9
12
15
1976
1977
1978
1979
1980
1981
1982
1983
1984
1985
1986
1987
1988
1989
1990
1991
1992
1993
1994
1995
1996
1997
1998
1999
2000
2001
2002
2003
2004
2005
2006
2007
DO
(m
g/L)
C
S10
Reference
Jinhae Bay
0
3
6
9
12
15
2002
2003
2004
2005
2006
2007
2008
DO
(m
g/L)
Average
Masan-Haengam Bay
0
3
6
9
12
15
2002
2003
2004
2005
2006
2007
2008
DO
(m
g/L)
Average
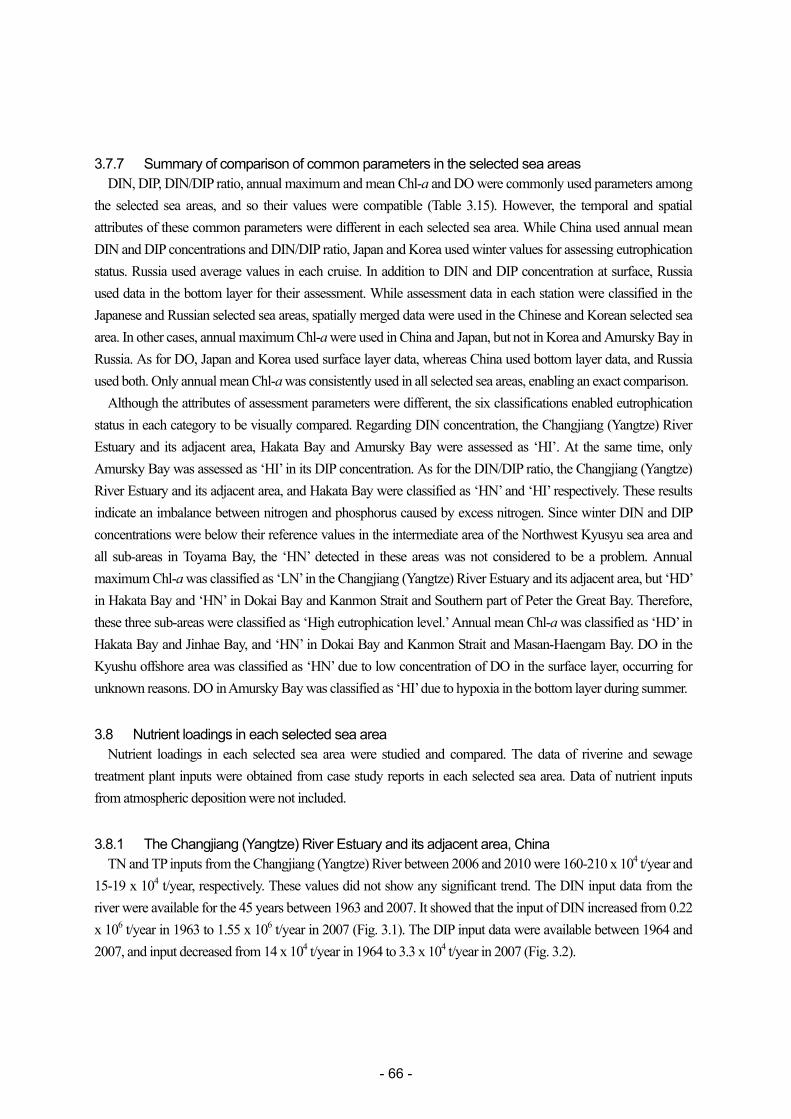
- 66 -
3.7.7 Summary of comparison of common parameters in the selected sea areas DIN, DIP, DIN/DIP ratio, annual maximum and mean Chl-a and DO were commonly used parameters among
the selected sea areas, and so their values were compatible (Table 3.15). However, the temporal and spatial attributes of these common parameters were different in each selected sea area. While China used annual mean DIN and DIP concentrations and DIN/DIP ratio, Japan and Korea used winter values for assessing eutrophication status. Russia used average values in each cruise. In addition to DIN and DIP concentration at surface, Russia used data in the bottom layer for their assessment. While assessment data in each station were classified in the Japanese and Russian selected sea areas, spatially merged data were used in the Chinese and Korean selected sea area. In other cases, annual maximum Chl-a were used in China and Japan, but not in Korea and Amursky Bay in Russia. As for DO, Japan and Korea used surface layer data, whereas China used bottom layer data, and Russia used both. Only annual mean Chl-a was consistently used in all selected sea areas, enabling an exact comparison.
Although the attributes of assessment parameters were different, the six classifications enabled eutrophication status in each category to be visually compared. Regarding DIN concentration, the Changjiang (Yangtze) River Estuary and its adjacent area, Hakata Bay and Amursky Bay were assessed as ‘HI’. At the same time, only Amursky Bay was assessed as ‘HI’ in its DIP concentration. As for the DIN/DIP ratio, the Changjiang (Yangtze) River Estuary and its adjacent area, and Hakata Bay were classified as ‘HN’ and ‘HI’ respectively. These results indicate an imbalance between nitrogen and phosphorus caused by excess nitrogen. Since winter DIN and DIP concentrations were below their reference values in the intermediate area of the Northwest Kyusyu sea area and all sub-areas in Toyama Bay, the ‘HN’ detected in these areas was not considered to be a problem. Annual maximum Chl-a was classified as ‘LN’ in the Changjiang (Yangtze) River Estuary and its adjacent area, but ‘HD’ in Hakata Bay and ‘HN’ in Dokai Bay and Kanmon Strait and Southern part of Peter the Great Bay. Therefore, these three sub-areas were classified as ‘High eutrophication level.’ Annual mean Chl-a was classified as ‘HD’ in Hakata Bay and Jinhae Bay, and ‘HN’ in Dokai Bay and Kanmon Strait and Masan-Haengam Bay. DO in the Kyushu offshore area was classified as ‘HN’ due to low concentration of DO in the surface layer, occurring for unknown reasons. DO in Amursky Bay was classified as ‘HI’ due to hypoxia in the bottom layer during summer.
3.8 Nutrient loadings in each selected sea area
Nutrient loadings in each selected sea area were studied and compared. The data of riverine and sewage treatment plant inputs were obtained from case study reports in each selected sea area. Data of nutrient inputs from atmospheric deposition were not included.
3.8.1 The Changjiang (Yangtze) River Estuary and its adjacent area, China TN and TP inputs from the Changjiang (Yangtze) River between 2006 and 2010 were 160-210 x 104 t/year and
15-19 x 104 t/year, respectively. These values did not show any significant trend. The DIN input data from the river were available for the 45 years between 1963 and 2007. It showed that the input of DIN increased from 0.22 x 10⁶ t/year in 1963 to 1.55 x 10⁶ t/year in 2007 (Fig. 3.1). The DIP input data were available between 1964 and 2007, and input decreased from 14 x 104 t/year in 1964 to 3.3 x 10⁴ t/year in 2007 (Fig. 3.2).
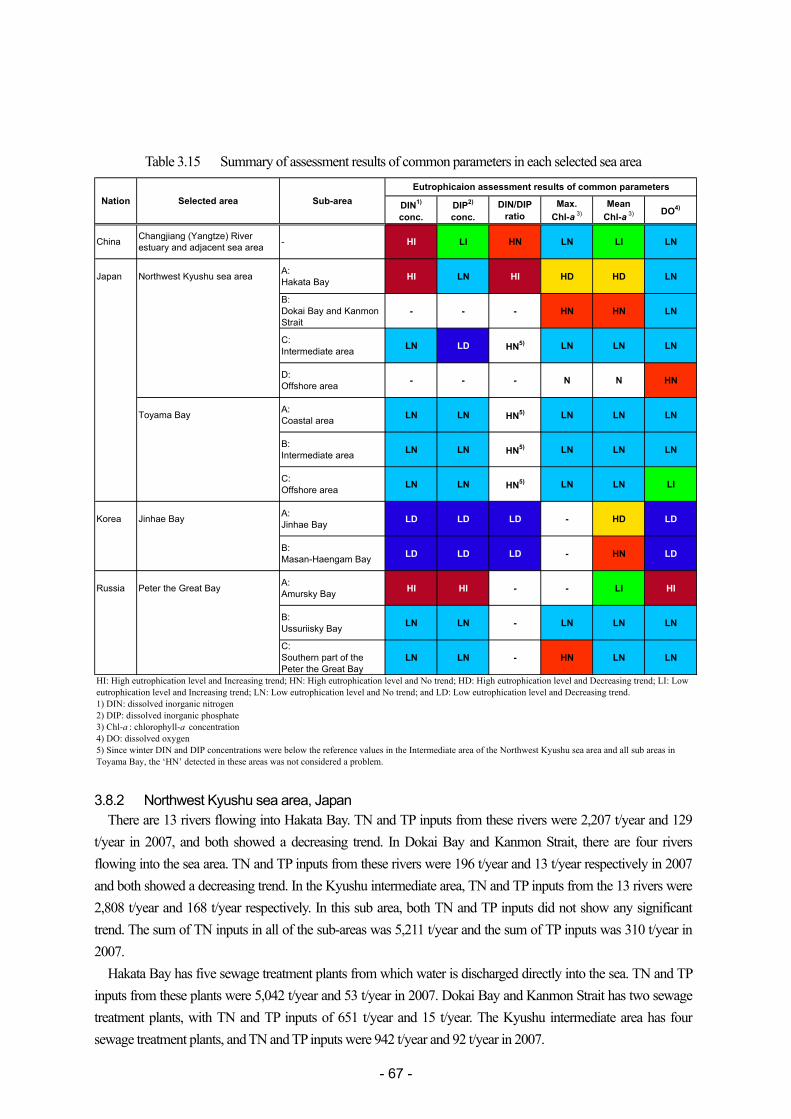
- 67 -
Table 3.15 Summary of assessment results of common parameters in each selected sea area
DIN1)
conc.DIP2)
conc.DIN/DIP
ratioMax.
Chl-a 3)Mean
Chl-a 3) DO4)
China Changjiang (Yangtze) Riverestuary and adjacent sea area - HI LI HN LN LI LN
Japan Northwest Kyushu sea area A:Hakata Bay HI LN HI HD HD LN
B:Dokai Bay and KanmonStrait
- - - HN HN LN
C:Intermediate area LN LD HN5) LN LN LN
D:Offshore area - - - N N HN
Toyama Bay A:Coastal area LN LN HN5) LN LN LN
B:Intermediate area LN LN HN5) LN LN LN
C:Offshore area LN LN HN5) LN LN LI
Korea Jinhae Bay A:Jinhae Bay LD LD LD - HD LD
B:Masan-Haengam Bay LD LD LD - HN LD
Russia Peter the Great Bay A:Amursky Bay HI HI - - LI HI
B:Ussuriisky Bay LN LN - LN LN LN
C:Southern part of thePeter the Great Bay
LN LN - HN LN LN
Nation Selected area Sub-areaEutrophicaion assessment results of common parameters
HI: High eutrophication level and Increasing trend; HN: High eutrophication level and No trend; HD: High eutrophication level and Decreasing trend; LI: Loweutrophication level and Increasing trend; LN: Low eutrophication level and No trend; and LD: Low eutrophication level and Decreasing trend.1) DIN: dissolved inorganic nitrogen2) DIP: dissolved inorganic phosphate3) Chl-a : chlorophyll-a concentration4) DO: dissolved oxygen5) Since winter DIN and DIP concentrations were below the reference values in the Intermediate area of the Northwest Kyushu sea area and all sub areas inToyama Bay, the ‘HN’ detected in these areas was not considered a problem.
3.8.2 Northwest Kyushu sea area, Japan There are 13 rivers flowing into Hakata Bay. TN and TP inputs from these rivers were 2,207 t/year and 129
t/year in 2007, and both showed a decreasing trend. In Dokai Bay and Kanmon Strait, there are four rivers flowing into the sea area. TN and TP inputs from these rivers were 196 t/year and 13 t/year respectively in 2007 and both showed a decreasing trend. In the Kyushu intermediate area, TN and TP inputs from the 13 rivers were 2,808 t/year and 168 t/year respectively. In this sub area, both TN and TP inputs did not show any significant trend. The sum of TN inputs in all of the sub-areas was 5,211 t/year and the sum of TP inputs was 310 t/year in 2007.
Hakata Bay has five sewage treatment plants from which water is discharged directly into the sea. TN and TP inputs from these plants were 5,042 t/year and 53 t/year in 2007. Dokai Bay and Kanmon Strait has two sewage treatment plants, with TN and TP inputs of 651 t/year and 15 t/year. The Kyushu intermediate area has four sewage treatment plants, and TN and TP inputs were 942 t/year and 92 t/year in 2007.
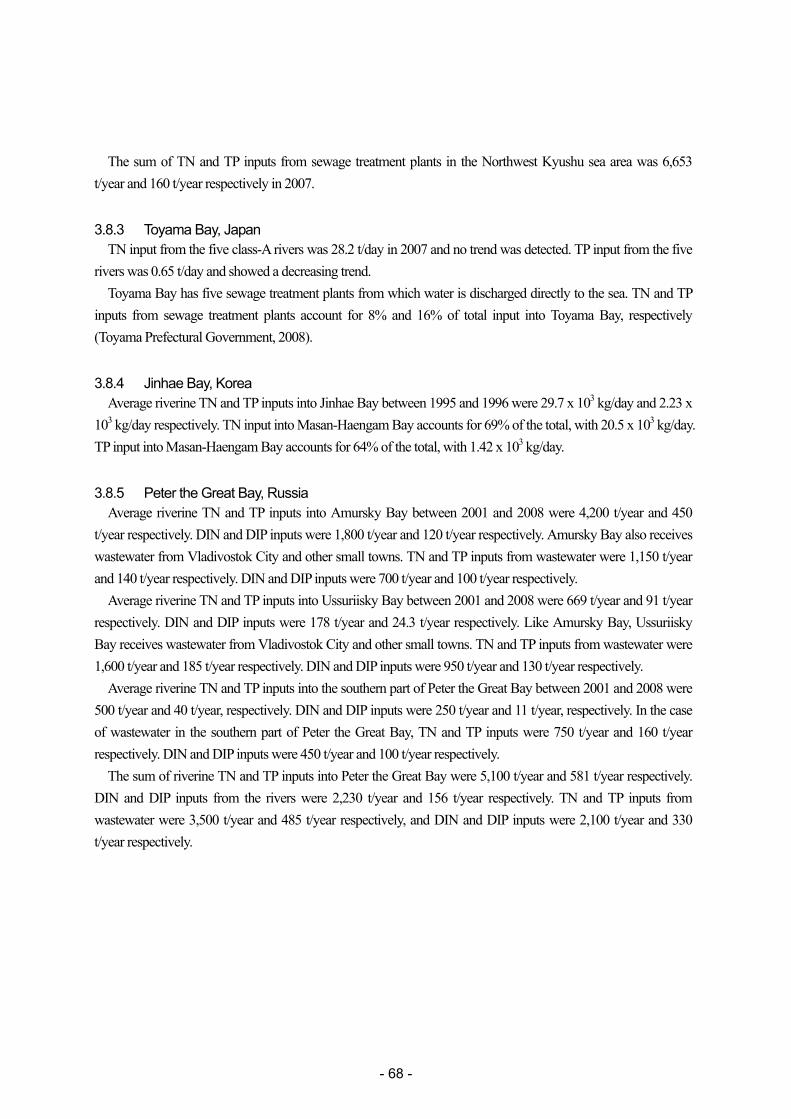
- 68 -
The sum of TN and TP inputs from sewage treatment plants in the Northwest Kyushu sea area was 6,653 t/year and 160 t/year respectively in 2007.
3.8.3 Toyama Bay, Japan TN input from the five class-A rivers was 28.2 t/day in 2007 and no trend was detected. TP input from the five
rivers was 0.65 t/day and showed a decreasing trend. Toyama Bay has five sewage treatment plants from which water is discharged directly to the sea. TN and TP
inputs from sewage treatment plants account for 8% and 16% of total input into Toyama Bay, respectively (Toyama Prefectural Government, 2008).
3.8.4 Jinhae Bay, Korea Average riverine TN and TP inputs into Jinhae Bay between 1995 and 1996 were 29.7 x 10³ kg/day and 2.23 x
103 kg/day respectively. TN input into Masan-Haengam Bay accounts for 69% of the total, with 20.5 x 10³ kg/day. TP input into Masan-Haengam Bay accounts for 64% of the total, with 1.42 x 10³ kg/day.
3.8.5 Peter the Great Bay, Russia Average riverine TN and TP inputs into Amursky Bay between 2001 and 2008 were 4,200 t/year and 450
t/year respectively. DIN and DIP inputs were 1,800 t/year and 120 t/year respectively. Amursky Bay also receives wastewater from Vladivostok City and other small towns. TN and TP inputs from wastewater were 1,150 t/year and 140 t/year respectively. DIN and DIP inputs were 700 t/year and 100 t/year respectively.
Average riverine TN and TP inputs into Ussuriisky Bay between 2001 and 2008 were 669 t/year and 91 t/year respectively. DIN and DIP inputs were 178 t/year and 24.3 t/year respectively. Like Amursky Bay, Ussuriisky Bay receives wastewater from Vladivostok City and other small towns. TN and TP inputs from wastewater were 1,600 t/year and 185 t/year respectively. DIN and DIP inputs were 950 t/year and 130 t/year respectively.
Average riverine TN and TP inputs into the southern part of Peter the Great Bay between 2001 and 2008 were 500 t/year and 40 t/year, respectively. DIN and DIP inputs were 250 t/year and 11 t/year, respectively. In the case of wastewater in the southern part of Peter the Great Bay, TN and TP inputs were 750 t/year and 160 t/year respectively. DIN and DIP inputs were 450 t/year and 100 t/year respectively.
The sum of riverine TN and TP inputs into Peter the Great Bay were 5,100 t/year and 581 t/year respectively. DIN and DIP inputs from the rivers were 2,230 t/year and 156 t/year respectively. TN and TP inputs from wastewater were 3,500 t/year and 485 t/year respectively, and DIN and DIP inputs were 2,100 t/year and 330 t/year respectively.
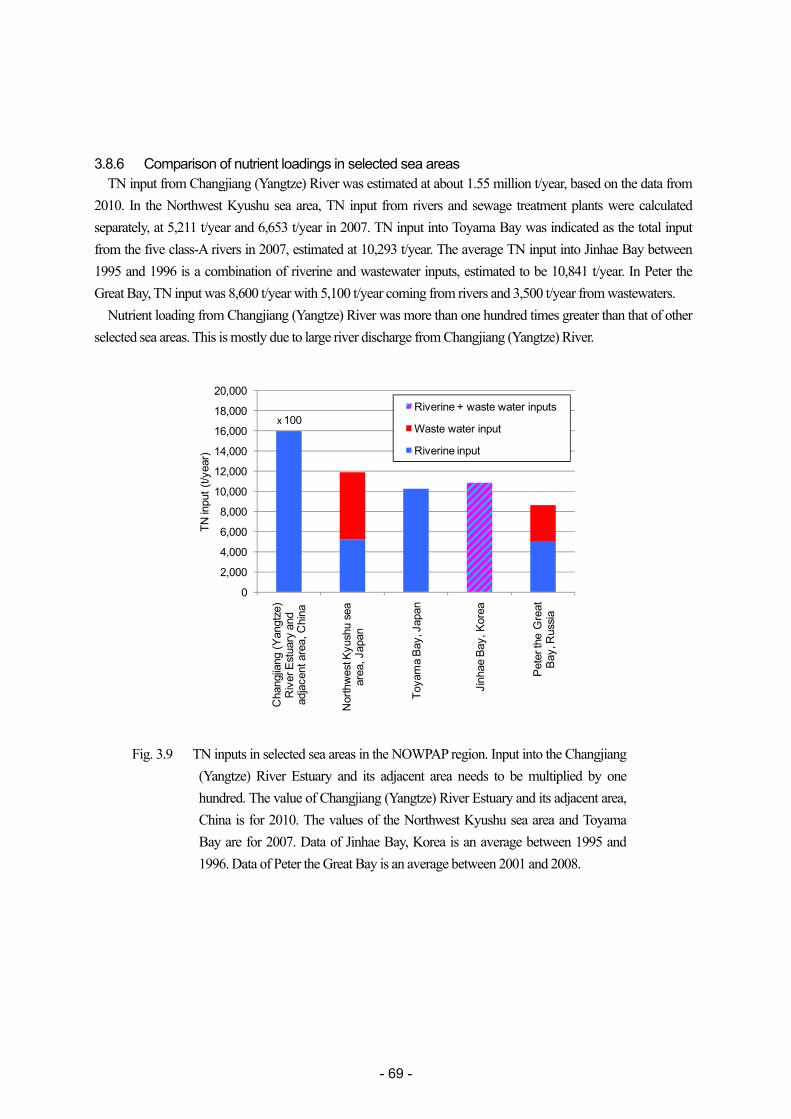
- 69 -
3.8.6 Comparison of nutrient loadings in selected sea areas TN input from Changjiang (Yangtze) River was estimated at about 1.55 million t/year, based on the data from
2010. In the Northwest Kyushu sea area, TN input from rivers and sewage treatment plants were calculated separately, at 5,211 t/year and 6,653 t/year in 2007. TN input into Toyama Bay was indicated as the total input from the five class-A rivers in 2007, estimated at 10,293 t/year. The average TN input into Jinhae Bay between 1995 and 1996 is a combination of riverine and wastewater inputs, estimated to be 10,841 t/year. In Peter the Great Bay, TN input was 8,600 t/year with 5,100 t/year coming from rivers and 3,500 t/year from wastewaters.
Nutrient loading from Changjiang (Yangtze) River was more than one hundred times greater than that of other selected sea areas. This is mostly due to large river discharge from Changjiang (Yangtze) River.
0
2,000
4,000
6,000
8,000
10,000
12,000
14,000
16,000
18,000
20,000
Cha
ngjia
ng (Y
angt
ze)
Riv
er E
stua
ry a
nd
adja
cent
are
a, C
hina
Nor
thw
est K
yush
u se
a ar
ea, J
apan
Toya
ma
Bay
, Jap
an
Jinh
ae B
ay, K
orea
Pet
er th
e G
reat
B
ay, R
ussia
TN in
put (
t/yea
r)
Riverine + waste water inputs
Waste water input
Riverine input
x 100
Fig. 3.9 TN inputs in selected sea areas in the NOWPAP region. Input into the Changjiang (Yangtze) River Estuary and its adjacent area needs to be multiplied by one hundred. The value of Changjiang (Yangtze) River Estuary and its adjacent area, China is for 2010. The values of the Northwest Kyushu sea area and Toyama Bay are for 2007. Data of Jinhae Bay, Korea is an average between 1995 and 1996. Data of Peter the Great Bay is an average between 2001 and 2008.
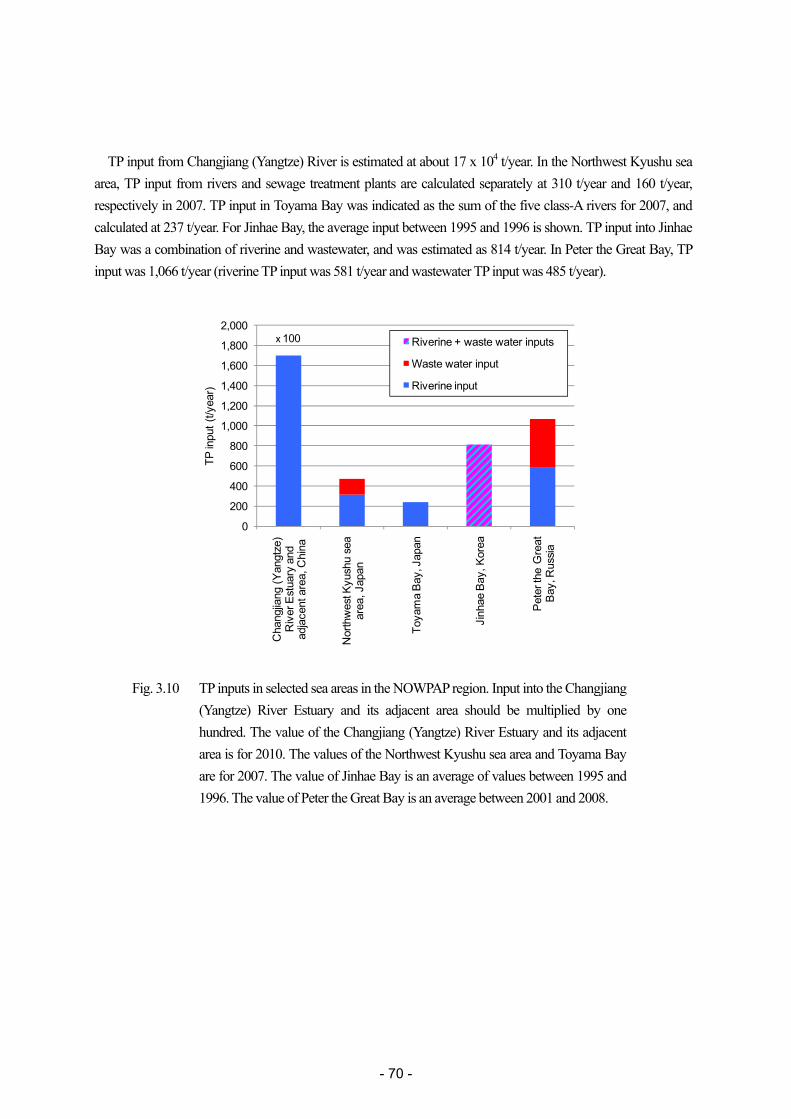
- 70 -
TP input from Changjiang (Yangtze) River is estimated at about 17 x 104 t/year. In the Northwest Kyushu sea area, TP input from rivers and sewage treatment plants are calculated separately at 310 t/year and 160 t/year, respectively in 2007. TP input in Toyama Bay was indicated as the sum of the five class-A rivers for 2007, and calculated at 237 t/year. For Jinhae Bay, the average input between 1995 and 1996 is shown. TP input into Jinhae Bay was a combination of riverine and wastewater, and was estimated as 814 t/year. In Peter the Great Bay, TP input was 1,066 t/year (riverine TP input was 581 t/year and wastewater TP input was 485 t/year).
0
200
400
600
800
1,000
1,200
1,400
1,600
1,800
2,000
Cha
ngjia
ng (Y
angt
ze)
Riv
er E
stua
ry a
nd
adja
cent
are
a, C
hina
Nor
thw
est K
yush
u se
a ar
ea, J
apan
Toya
ma
Bay
, Jap
an
Jinh
ae B
ay, K
orea
Pet
er th
e G
reat
B
ay, R
ussia
TP in
put (
t/yea
r)
Riverine + waste water inputs
Waste water input
Riverine input
x 100
Fig. 3.10 TP inputs in selected sea areas in the NOWPAP region. Input into the Changjiang (Yangtze) River Estuary and its adjacent area should be multiplied by one hundred. The value of the Changjiang (Yangtze) River Estuary and its adjacent area is for 2010. The values of the Northwest Kyushu sea area and Toyama Bay are for 2007. The value of Jinhae Bay is an average of values between 1995 and 1996. The value of Peter the Great Bay is an average between 2001 and 2008.
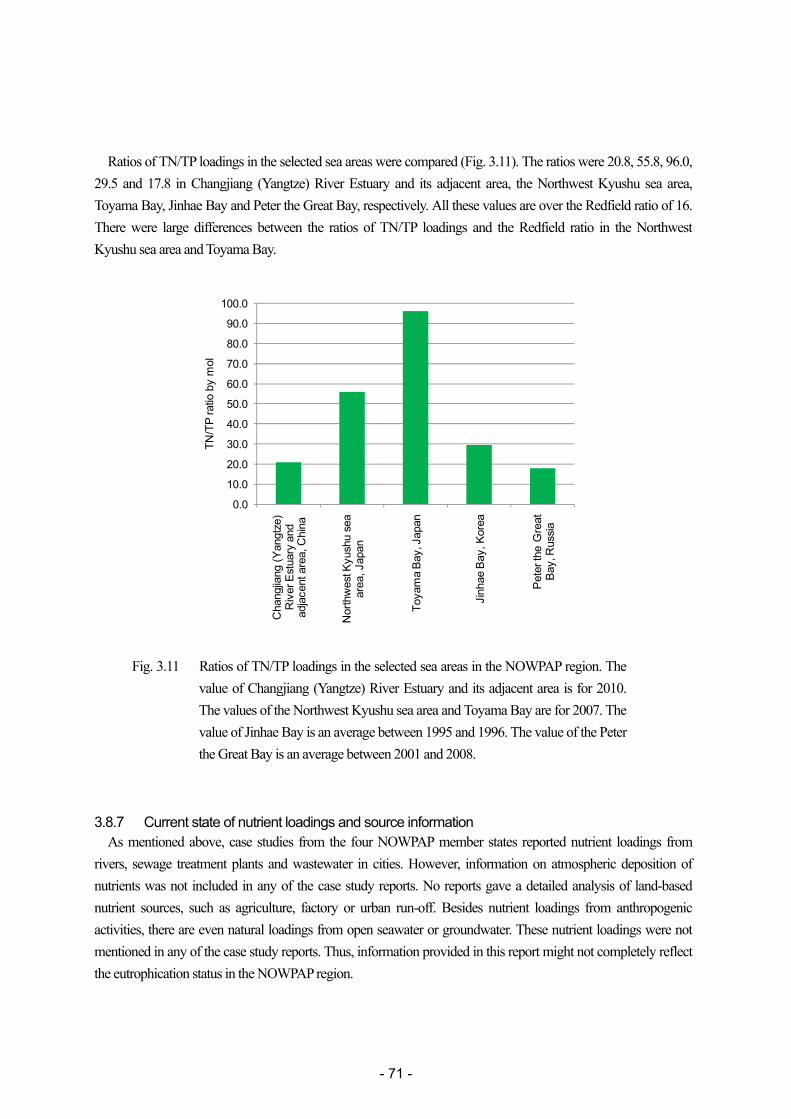
- 71 -
Ratios of TN/TP loadings in the selected sea areas were compared (Fig. 3.11). The ratios were 20.8, 55.8, 96.0, 29.5 and 17.8 in Changjiang (Yangtze) River Estuary and its adjacent area, the Northwest Kyushu sea area, Toyama Bay, Jinhae Bay and Peter the Great Bay, respectively. All these values are over the Redfield ratio of 16. There were large differences between the ratios of TN/TP loadings and the Redfield ratio in the Northwest Kyushu sea area and Toyama Bay.
0.0
10.0
20.0
30.0
40.0
50.0
60.0
70.0
80.0
90.0
100.0
Cha
ngjia
ng (Y
angt
ze)
Riv
er E
stua
ry a
nd
adja
cent
are
a, C
hina
Nor
thw
est K
yush
u se
a ar
ea, J
apan
Toya
ma
Bay
, Jap
an
Jinh
ae B
ay, K
orea
Pet
er th
e G
reat
B
ay, R
ussia
TN/T
P ra
tio b
y m
ol
Fig. 3.11 Ratios of TN/TP loadings in the selected sea areas in the NOWPAP region. The value of Changjiang (Yangtze) River Estuary and its adjacent area is for 2010. The values of the Northwest Kyushu sea area and Toyama Bay are for 2007. The value of Jinhae Bay is an average between 1995 and 1996. The value of the Peter the Great Bay is an average between 2001 and 2008.
3.8.7 Current state of nutrient loadings and source information As mentioned above, case studies from the four NOWPAP member states reported nutrient loadings from
rivers, sewage treatment plants and wastewater in cities. However, information on atmospheric deposition of nutrients was not included in any of the case study reports. No reports gave a detailed analysis of land-based nutrient sources, such as agriculture, factory or urban run-off. Besides nutrient loadings from anthropogenic activities, there are even natural loadings from open seawater or groundwater. These nutrient loadings were not mentioned in any of the case study reports. Thus, information provided in this report might not completely reflect the eutrophication status in the NOWPAP region.
- 72 -
4 Evaluation of eutrophication status and the NOWPAP Common Procedure 4.1 Evaluation of assessment results in the selected sea areas 4.1.1 Changjiang (Yangtze) River Estuary and its adjacent area, China
The eutrophication status in Changjiang (Yangtze) River Estuary and its adjacent area was classified as ‘HI.’ In Category I, nitrogen and phosphorus loadings from the Changjiang (Yangtze) River were large. An increasing trend was detected in riverine input of DIN between 1973 and 2007, whereas no trend was detected in the input of DIP between 1964 and 2007. The annual mean DIN concentration in the recent three years (2005-2007) in the Changjiang (Yangtze) River Estuary and its adjacent area exceeded the reference value (0.4 mg/L, 28.6 μM) and showed an increasing trend between 1963 and 2007. The annual mean DIP concentration in the recent three years was below the reference value (0.03 mg/L, 0.97μM), but an increasing trend was observed. The DIN/DIP ratio showed no trend between 1963 and 2007. In Category II, the annual maximum Chl-a was lower than the reference value (20 μg/L), but the number of red tide events showed an increasing trend between 1990 and 2009. In Category III, both DO and COD were under their reference values (DO, 2 mg/L; COD, 4mg/L). Based on these results, it is obvious to conclude that nutrient loadings from the Changjiang (Yangtze) River are significant and that nutrient concentrations are high in the estuary.
In the Changjiang (Yangtze) River Estuary and its adjacent area, various phenomena have been reported that are indicative of ecological deterioration caused by eutrophication. These include the expansion of anoxic/hypoxic water masses (Chen et al., 2007; Wei et al., 2007), red tide and harmful algal blooms (HAB; Zhou, 2010), green tide events (Leliaert et al., 2009; Liu et al., 2010; Hu et al., 2010) and jellyfish blooms (Dong et al., 2010). It has also been pointed out that construction of the Three Gorges Dam has resulted in a slower water residence time and reduced supply of silicate, and so it has been considered that its construction will affect species composition and phytoplankton productivity in the sea area (Chen, 2000; Gong et al., 2006; Harashima, 2007). Thus, reduction of nitrogen and phosphorus input to the Changjiang (Yangtze) River is necessary to maintain a favorable balance of nutrients and improve the quality of the marine environment in its estuary and adjacent sea area. 4.1.2 Northwest Kyushu sea area, Japan
In Category I, TN and TP inputs from rivers showed a decreasing trend in Hakata Bay. On the other hand, TN input from sewage treatment plants showed an increasing trend. In eight stations out of ten, winter DIN was higher than the reference value and showed an increasing trend. Annual mean and maximum Chl-a were also higher than the reference values, and red tide events were recorded between 2005 and 2007. Thus, assessment results indicated high eutrophication level in Category II. The assessment results in Category III indicated a low eutrophication level. In Hakata Bay, the input of nitrogen and phosphorus should be adjusted for a balanced biological productivity in the marine environment. Countermeasures for reduction of diatom and dinoflagellate red tide events should also be considered.
In Dokai Bay and Kanmon Strait, TN and TP concentrations decreased significantly between the 1970s and 1990s in Dokai Bay. COD also decreased between the 1970s and 1990s, and has remained stable over the past decade in Dokai Bay. Conversely, there are no obvious symptoms of eutrophication in the Kanmon Strait, and so it can be concluded that there are no negative effects of eutrophication in the area.
In the Kyushu intermediate area, concentrations of TN, TP, winter DIN and winter DIP were low. However, dinoflagellate and Noctiluca red tides were frequently observed over recent years. Miyahara et al. (2005) and
- 73 -
Onitsuka et al. (2010) suggested that Cochlodinium polykrikoides was transported from Korea through the Tsushima Warm Current. Therefore, possible causes of the dinoflagellate and Noctiluca red tides observed in this sub-area can be related to the flow of the Tsushima Warm Current..
In the Kyushu offshore area, all parameters except DO concentration were classified as either ‘LN’ or ‘N’. Although eutrophication did not appear to be a major issue, it is necessary to investigate the causes of the low DO in 2005.
Apart from Hakata Bay, where adjustment of nutrient input is needed, the eutrophication status of the Northwest Kyushu sea area was mostly classified as ‘LN.’ Great progress has been made to reduce loadings from sewage treatment plants in the Northwest Kyushu sea area. As a result of decreased nutrient concentrations, primary production along the coastal area has decreased. This phenomenon can induce decreased production of fish, problems in Nori seaweed Porphyra spp. culture and the natural growth of seaweeds used as alimentary products. This kind of oligotrophication has been reported in the Seto Inland Sea, Japan (Yamamoto, 2003) and adequate nutrient control is required to maintain biological production.
4.1.3 Toyama Bay, Japan There are five class-A rivers flowing into Toyama Bay. The sum of TN inputs from these rivers showed no
trend between 1985 and 2007, but the Jinzu River, the largest river, showed an increasing trend. Conversely, the sum of TP inputs from these rivers showed a decreasing trend. The concentration of nutrients in this sea area was under the reference value. The annual maximum Chl-a was lower than the reference value (20 μg/L) and showed no trend. The annual mean Chl-a was also lower than the reference value (5 μg/L) and showed no trend.
In the Toyama Bay coastal area, the eutrophication status in all categories was classified as ‘LN.’ However, among Category I parameters, an increase in TN input was identified among the Jinzu River data, and so it is necessary to reduce the TN input. Among Category III parameters, some stations showed a decreasing trend of DO and an increasing trend of COD. Thus, there is a need to improve the status by reducing nutrient loading, especially nitrogen.
Same as the Toyama Bay coastal area, the eutrophication status in all categories in Toyama Bay intermediate area was classified as ‘LN.’ However, two stations located in the western part of the bay showed an increasing trend in TN and TP concentrations, and so it is possible that eutrophication is progressing. In addition, some stations showed a decreasing trend of DO and an increasing trend of COD. This tendency was also shown in the Toyama Bay coastal area. Therefore, implementation of countermeasures against eutrophication in the Toyama Bay coastal area could lead to an improvement in the marine environment of this sub-area.
Based on the results in categories I, II and IV, it was concluded that the Toyama Bay offshore area was not facing a risk of eutrophication, even though DO showed a decreasing trend and COD showed an increasing trend. Since the coastal and intermediate areas show the same pattern, there is a need to find the cause of these phenomena.
The level of eutrophication in the three sub-areas of Toyama Bay was found to be low, and most parameters showed no trend. Only the TN input from the Jinzu River showed an increasing trend. However, all sub-areas had stations that showed a decreasing trend of DO and an increasing trend of COD. Thus, in order to address the negative effects of eutrophication in Toyama Bay, it is essential to pay attention to TN input from the Jinzu River and consider measures to reduce nutrient loadings. According to the Toyama Prefectural Government (2008), the main sources of TN input into this river are factories or plants (68%), domestic activities (4%) and diffuse sources
- 74 -
(28%). This means that for an effective reduction of TN input, countermeasures need to be developed against discharge from factories or plants and diffuse sources.
4.1.4 Jinhae Bay, Korea
In Jinhae Bay, the status of eutrophication has improved since 2002. However, eutrophication still exists as an issue in Masan-Haengam Bay and inner Jinhae Bay. In Category I, the mean concentrations of TN and TP halved from 2002 to 2008, but they still exceeded the reference values. Both winter DIN and DIP concentrations were below the reference values and showed a decreasing trend. The winter DIN/DIP ratio was also below the reference value and showed a decreasing trend. In Category II, the annual mean Chl-a showed a decreasing trend, but the value exceeded the reference value. Red tide events of diatom sp. showed a decreasing trend. In Category III and IV, incidents of paralytic shellfish poisoning by Alexandrium have been reported (Han et al. 1992; Lee and Lim, 2006).
In general, nutrient loadings are decreasing in Jinhae Bay, but they are still at a high eutrophication level, particularly in the Masan-Haengam Bay area. The case study report of Jinhae Bay, Korea recommends increasing the number of sewage treatment facilities and/or dredging up bottom sediment to improve water quality.
4.1.5 Peter the Great Bay, Russia In Peter the Great Bay in Russia, Amursky Bay was classified as ‘HI’ while both Ussuriisky Bay and the
southern part of Peter the Great Bay were classified as ‘LN.’ Addressing eutrophication in Amursky Bay is required in this sea area. Conversely, the effects of eutrophication in Ussuriisky Bay and the southern part of Peter the Great Bay were considered rather small. The Razdolnaya River flows into Amursky Bay, and Vladivostok (the largest city in Primorye Krai) is facing the bay. These are the main two sources of nutrient loading to Amursky Bay. Nutrient concentrations in the surface water of the bay were low, but the bottom layer had high concentrations. The reason for this is assumed to be that the nutrients from the sea surface are transferred to the deeper layer by vertical transport due to a biological pump. During the flooding period, nutrients from the Razdolnaya River were immediately taken up by diatom species and subsequently deposited and decomposed at the sea bottom. As a result, hypoxic water masses were observed at the sea bottom during the summer. Thus, the effects of eutrophication were more obvious in the bottom layer of the sea than the upper layer, and so addressing hypoxia in the sea bottom in this area is a priority (Tishchenko et al., 2008).
4.2 Nutrient sources and loadings 4.2.1 Land-based sources of nutrients
Case study reports provide information on TN and TP nutrient inputs from rivers. The inputs from the Changjiang (Yangtze) River are one hundred times larger than those from rivers in the other selected sea areas. The levels of TN and TP inputs from rivers in the Northwest Kyushu sea area and Toyama Bay in Japan, Jinhae Bay in Korea, and Peter the Great Bay in Russia were almost the same. The Changjiang (Yangtze) River has the biggest flow volume in the Northwest Pacific region, and this also results in the greatest nutrient loadings. There have been several studies done on eutrophication-related nutrient loadings in the Changjiang (Yangtze) River Estuary, and they indicate that nitrogen and phosphorus concentrations have increased compared to the 1960s (Chai et al., 2006; Wang, 2006; 2007). The nitrogen and phosphorus concentrations were significantly elevated in the Changjiang main stream, a region 2,000 to 3,000 km inland of the river mouth (Chai et al., 2006). With
- 75 -
nationwide economic growth, nutrient enrichments significantly increased from the 1960s to the 2010s. Fertilizers used in agriculture and household effluents are considered to be the main nutrient sources (Liu et al., 2003). In addition, due to the construction of the Three Gorges Dam, increases in nitrogen and phosphate and a decrease in silicon have been of concern (Chen, 2000; Gong et al., 2006). The consequent change of the N: P: Si stoichiometric ratio can be advantageous to flagellates but not to diatom phytoplankton in the sea area (Harashima, 2007).
The TN and TP inputs from the rivers in Hakata Bay, as well as Dokai Bay and Kanmon Strait, showed a decreasing trend. In these sub-areas, nutrient loadings have decreased as a result of the improvements in sewage treatment and enacted regulations on wastewater from factories. Conversely, TN and TP inputs from rivers into the Kyushu intermediate area did not show any trend.
In the case of Toyama Bay, TN input showed no trend, whereas TP input showed a decreasing trend. Nitrogen and phosphorus loadings from factories have decreased since the Toyama Prefectural Government strengthened wastewater regulations. However, while diffuse-source nitrogen loadings from the Jinzu River have increased (Toyama Prefectural Government, 2008), TN input from all rivers has not changed.
There was no long-term data on riverine inputs into Jinhae Bay, and so nutrient loadings from rivers were not assessed. However, as TN and TP concentrations and winter DIN and DIP concentrations in Jinhae Bay have decreased, it can be concluded that land-based nutrient loadings have steadily decreased. The winter DIN/DIP ratio has been close to the Redfield ratio of 16 since 2006, but it exceeded this reference value before 2005. In other words, the DIN/DIP ratio supports that the appropriate management of nutrient loadings has been applied.
Nutrient inputs from the Razdolnaya River account for more than 70% of all inputs to Amursky Bay in Russia, where 70-90% of loadings from the river were between April and September. The DIN and DIP inputs from rivers increased between 2001 and 2007. Eutrophication caused by nutrient loadings from rivers affects ecological succession in biological communities in Amursky Bay, which is indicated by the increasing the number of pollution resistant species.
The report ‘Regional overview on river and direct inputs of contaminants into the marine and coastal environment in NOWPAP Region with special focus on the land based sources of pollution’ (NOWPAP POMRAC, 2009) further explains nutrient inputs from major rivers into the NOWPAP sea area.
4.2.2 Atmospheric deposition of nutrients ‘National reports on atmospheric deposition of contaminants into the marine and coastal environment in the
NOWPAP region’ (NOWPAP POMRAC, 2006) and ‘Regional overview on atmospheric deposition of contaminants to the marine and coastal environment in NOWPAP Region’ (NOWPAP POMRAC, 2007) describe atmospheric deposition of nutrients in more detail. The main focus of these reports is on the amount of atmospheric deposition and the fact that information on their influence or damage on the marine environment is scarce. Atmospheric deposition is recognized as one means of transporting nutrient loadings, particularly nitrogen, into the sea. It is reported that in the East China Sea, the volume of the deposition of ammonium and nitrate is almost the same as that of loadings coming from the Changjiang (Yangtze) River (Uematsu et al., 2002; Nakamura et al., 2005). Deposition of terrestrial aerosols is one of the major sources of nutrients to the open waters. The effect of atmospheric nitrogen input on primary production in the eastern part of the NOWPAP sea area has been investigated using a coupled physical-ecosystem model (Onitsuka et al., 2009). The atmospheric nitrogen deposition supports > 10% of the annual export production in the near-shore region along the Japanese
- 76 -
coast. The increase in nitrogen availability caused by atmospheric deposition and riverine input has switched an extensive part of the study area in the Northwestern Pacific Ocean from being N-limited to P-limited (Kim et al., 2011). Thus, nitrogen enrichments by atmospheric deposition can influence eutrophication and biological production in the marine ecosystem. It can be expected that further increases in air pollution will lead to an increase in airborne nutrient loadings to the sea. Atmospheric alley deposited substances tends to be diffused fast and widely, and nitrogen is readily available to phytoplankton. Therefore, it is possible that the deposition of these substances results in widespread pollution, further eutrophication and trans-boundary problems. 4.2.3 Other possible sources of nutrients
There are other sources of nutrient loadings to the sea. The greatest nutrients are derived from the pelagic sea (Nixon, 2009). Even though the concentrations of nutrients are low, the total amount of nutrients is so large that they may have an influence on primary production, depending on the circulation of the sea water masses. The accumulation of nutrients on the sea bottom is also of concern, as they can be released back into the seawater. As the hypoxia of water at the sea bottom advances, nutrients are even more likely to be released. Thus, even if land-based nutrient loadings are reduced, its effect could not be seen immediately due to the reintroduction of nutrients accumulated in the past.
The influence of aquaculture on eutrophication has been pointed out. Aquaculture of fish and invertebrates produces postprandial leftovers and feces that accumulate at the sea bottom and these substances can accelerate eutrophication (Yokoyama, 2003). In seaweed culture, seaweeds absorb nutrients to grow, and in doing so function to prevent eutrophication.
Submarine groundwater discharge is also a source of nutrients in the sea. This type of nutrient loading has been reported in Toyama Bay, Japan (Zhang and Satake, 2003). In Masan Bay, Korea, negative effects from groundwater contaminated by industrialization have been reported (Lee et al., 2009).
4.3 Evaluation of the NOWPAP Common Procedure 4.3.1 Achievements with the use of the Common Procedure
The NOWPAP Common Procedure was developed by NOWPAP CEARAC in 2009. In this report, it was used to assess the eutrophication status in the selected sea areas in the NOWPAP member states. Although different reference values were used in each case study report in the selected sea area, classification of eutrophiation status was possible with the use of NOWPAP Common Procedure. By being compared the collected data to each reference value, the levels of eutrophication were determined as either ‘High eutrophication level’ when the assessment data exceeded the reference, or ‘Low eutrophication level’ when the data was under the reference. Further, significance of trend for time series of assessment data were detected as either ‘Increasing’, ‘Decreasing’ or ‘No Trend.’ As a result, there were six classes identified using a combination of Level and Trend (Fig. 2.1).
Using the results of this eutrophication assessment, it was possible to compare nutrient loadings (TN and TP inputs) and assessment parameters (DIN and DIP concentrations, DIN/DIP ratio, annual maximum Chl-a, annual mean Chl-a and DO) among countries. This assessment is considered to help identify the causes of and countermeasures against eutrophication.
- 77 -
4.3.2 Temporal and spatial differences in assessment parameters The NOWPAP Common Procedure recommends the use of annual data (e.g. annual mean, annual maximum,
annual number of events), other timescale data such as seasonal mean, or raw data as considered appropriate by the experts assessing eutrophication. Vertical or horizontal spatial scales of assessment parameters are not strictly defined in the NOWPAP Common Procedure. These flexibilities enable easier application of the NOWPAP Common Procedure, although they can result in collecting and analyzing different temporal and spatial scales of parameters, as described in Section 3.7.7.
The temporal and spatial scale of assessment data differ from place to place. Therefore, a comparison of the six classifications of eutrophication status obtained using the NOWPAP Common Procedure among the different areas needs careful interpretation of raw data by experts.
This temporal and spatial variability in assessment parameters was pointed out by CEARAC Focal Points and experts in the NOWPAP region when CEARAC first developed the NOWPAP Common Procedure. It was assumed that scientific judgment on the selection of assessment parameters by the experts would solve this issue to some extent. However, more standardized approaches in unifying temporal and spatial variability of assessment data are still necessary among the member states, especially when comparing the assessment results of eutrophication status across the entire NOWPAP region.
4.3.3 Criteria for classifying assessment category The NOWPAP Common Procedure indicates that one classification result should be chosen in each assessment
category. There are no rules other than to choose one classification result of the assessment parameters in each assessment category that most appropriately represents the eutrophication status of the area.
The Chinese case study applied a majority decision approach: the most dominant classification results were chosen as the classification result of an assessment category. The Japanese case study also applied the same approach. Because the Korean and Russian case studies did not conduct any classification of assessment category, the same rule as the Chinese and Japanese case studies was applied for obtaining classification results in this report as presented in sections 3.4 and 3.5.
On the other hand, the OSPAR Common Procedure (OSPAR Commission, 2005) and HELCOM HEAT (HELCOM, 2006) use ‘One out - all out’ approach and it is considered to best detect potential problematic areas, despite the risk of detecting a false positive result. Testing of ‘One out-all out’ approach can be considered in the further case studies.
4.3.4 Setting reference values Most reference values used in this eutrophication assessment were taken by different approaches in each
member state (Table 2.5). In China, the reference values were set according to the ‘National Sea Water Quality Standard of China’ and Bricker et al. (2003) (Table 2.10). The ‘Environmental Water Quality Standard’ (Ministry of the Environment of Japan, 1971) and ‘Fisheries Water Quality Standard’ (Japan Fisheries Resource Conservation Association, 2005) were used to set reference values in Japan (Table 2.11, Table 2.12). In Korea, reference values were set based on concentrations in the Gijang area, which is close to Jinhae Bay, but has not been eutrophicated (Table 2.13). In Russia, the maximum permissible concentration is set by the central government (NOWPAP POMRAC, 2009), but the standard value for DIN was quite high. The reference values in Russia for the eutrophication assessment were calculated by the Redfield, Ketchum and Richards (RKR)
- 78 -
model (Redfield et al., 1963) based on the minimum necessary oxygen concentration at the sea bottom (Table 2.14).
As mentioned above, approaches to set the reference values in each case study area were different. Accordingly, a comparison of the classification results (six classes) in the different assessment areas requires scrutiny and interpretation of the raw data. A standardized approach to setting reference values is expected while taking into account the carrying capacity of the marine environment in each area. 4.3.5 Application of remote sensing techniques for preliminary eutrophication assessment
The NOWPAP Common Procedure recommends the use of remote sensing techniques in eutrophication assessment. One of the responses to eutrophication is increase of phytoplankton biomass. Therefore, Chl-a, as a proxy for phytoplankton biomass, can be used as an indicator of eutrophication. Chl-a is categorized in Category II with the NOWPAP Common Procedure and Chl-a can be derived by ocean color remote sensing techniques with wider spatial scale and higher temporal frequencies than in situ measurement. Being realized the spatial and temporal advantages of satellite derived Chl-a, a new methodology using time series satellite data has been developed to preliminarily assess eutrophication status. This methodology has been applied in each selected sea area. The obtained results were used to divide the Northwest Kyushu sea area and Toyama Bay into some sub-areas through an evaluation of the reliability of satellite derived Chl-a by comparison with that measured in situ. In the other selected sea areas, the results of preliminary eutrophication assessment by satellite derived Chl-a were compared with the case study results with the NOWPAP Common Procedure. It was indicated that remote sensing techniques had potential to help identify sea areas at eutrophication risk in some cases. However, Chl-a concentrations estimated by satellites included errors in areas with high turbid waters. Results of the preliminary eutrophication assessment, including its advantages and limitations, are presented in detail in Annex C.
- 79 -
5 Existing policies related to the management of eutrophication in the NOWPAP member states 5.1 China
Marine environment in China is protected by the Marine Environmental Protection Law of the People’s Republic of China that was formulated in 1982 and revised in 1999. There are two categories in the Chinese legal system of marine environmental protection. The first category is applicable to all marine environmental protection-related activities, which include monitoring and management, pollution control, marine spatial planning, emergency response to major marine pollution incidents, marine protected areas, and the damage liability system. The second category is for management of specific cases, namely supporting legislation for the implementation of the ‘Marine Environment Protection Law’, including pollution prevention from shipping, offshore oil and gas exploration, marine dumping, prevention of pollution from ship dismantling, the building of coastal infrastructure and marine engineering works, and the prevention of land-based pollution.
Chinese practices related to the management of its ocean and coastal activities, including eutrophication management, were reviewed by a task force set up by the China Council for International Cooperation on Environment and Development (CCICED). The Task Force conducted an in-depth scientific analysis of a number of urgent ocean and coastal issues, including eutrophication, pollution, climate change, hydraulics (dams), land reclamation and fisheries management. CCICED (2010) published ‘Ecosystem Issues And Policy Options Addressing Sustainable Development Of China’s Ocean And Coast’ and provided eight policy recommendations, with 12 embedded stand-alone actions. To prevent eutrophication, a national strategy for the sustainable development of the ocean and coast was recommended.
China also endorsed the Regional Strategic Action Programme for the Yellow Sea Large Marine Ecosystem (UNDP/GEF, 2009), and agreed on a 10% reduction in total nutrient loading from point sources from 2006 to 2010. The reduction policy is still in effect today and will be continued in the future.
The Ministry of Environmental Protection of China and the Ministry of the Environment of Japan have been collaborating since 2007 to reduce total nutrient loading. An outcome of this international collaboration was the publication of ‘Guidance for Introducing the Total Pollutant Load Control System (TPLCS)’ (Ministry of the Environment of Japan, 2011), which aims to contribute to the improvement of water quality. 5.2 Japan
Water quality of coastal waters in Japan is protected by a domestic law, the Water Pollution Prevention Act established in 1971. Local governments are legally obligated to monitor water quality of coastal waters and discharge from factories and plants. Local governments can even set up their own regulations that are stricter than the Water Pollution Prevention Act.
Various activities have been implemented to prevent eutrophication in sea areas by reducing land-based COD, TN and TP loadings. Although these activities on total reductions have had some positive effects on eutrophication in the Seto Inland Sea, hypoxic water masses and the occurrence of red tides have still been reported. Furthermore, reduction of fish catch has been reported in the Seto Inland Sea because of oligotrophication (Yamamoto, 2003). Since the levels of nutrient and COD in the Seto Inland Sea have been complying with the environmental equality standard in recent years, the 7th Total Pollutant and Load Control, issued in 2011 by the Ministry of Environment of Japan, suggests maintaining the current levels of nutrient and COD in order not to degrade water quality.
- 80 -
5.3 Korea There are several laws promulgated to control the land-based source of pollution. Water Quality Act (1990)
sets the quality standard for discharges from industrial treatment facilities. Sewage Act (1990) regulates discharges from sewage treatment facilities. Act on the Disposal of Sewage, Excreta & Livestock Wastewater (1990) regulates discharges from livestock industries. Marine Pollution Prevention Act (MPPA, 1991) set the sea water quality standard.
In recent years, the Korean government has introduced Total Water Pollution Load Management System (TWPLMS) into the coastal environment management regime of Masan Bay. TWPLMS was initiated in 2005 to assess total pollution load and carrying capacity, and nutrient reduction was allocated to each city (Masan City, Jinhae City and Changwon City). Based on the newly formulated mechanisms, the central and local governments, these three cities, the navy, academies, business sectors and NGOs established a Community Advisory Council for management of the marine environment. The Korean government designated Masan Bay and Jinhae Bay as special marine management areas in 1982 under revision of the Korea Marine Pollution Prevention Law to mitigate eutrophication.
Korea also takes part in the YSLME project, and has agreed on a 10% reduction in total nutrient loading from point sources in the proposal documents to the Global Environment Facility for the second phase (UNDP/GEF, 2009).
5.4 Russia There are several key laws for water use and water protections in Russia. Water Code of Russian Federation –
Federal Law 74-FZ (2007) sets outs legal fundamentals for state policy in the sphere of environmental protections of water bodies. The Russian Federation Act on Protection of the Natural Environment (2002) and the Regulation on a State Control of the Use and Protection of Water Objects (1997) are also other main laws related to water protection.
National policies for the management of water pollution, including eutrophication, are being developed alongside the sets of Maximum Permissible Concentrations (MPCs) set up by the Federal Fish Agency and State Office for Supervision on the Protection of Consumer’s Rights and Human Welfare of the Ministry of Health and Social Development. The development of the Maximum Permissible Discharge (MPD) is a main tool to manage the municipal and industrial wastewaters. The MPDs are developed by scientific and engineering organizations for the different water users and should be affirmed by the Federal Service for Environmental, Technological and Nuclear Supervision, and Ministry of Natural Resources. The amount and quality of all types of wastewaters are controlled by the subdivisions of Federal Service for Environmental, Technological and Nuclear Supervision. The Federal Service on Hydrometeorology and Environmental Monitoring (ROSHYDROMET) is responsible for the monitoring of ambient water quality. Other than that, there are no other policies in Russia enforced for management of eutrophication as a separate issue so far.
- 81 -
6 Conclusions and recommendations 6.1 Conclusions
Case studies to assess the eutrophication status in the selected sea areas were conducted using the NOWPAP Common Procedure. The results were shown by the six eutrophication classifications and possible causes of eutrophication in each selected sea area were investigated. At the same time, the suitability of the NOWPAP Common Procedure was also evaluated through the case studies. Comparison of the eutrophication status among the selected sea areas was possible, but refinement of the NOWPAP Common Procedure is necessary for eutrophication assessment of the entire NOWPAP region.
6.2 Recommendations to combat eutrophication in the NOWPAP region 6.2.1 Integrated assessment of eutrophication status of the entire NOWPAP region
The selected sea areas included in this report are geographically limited. It is anticipated that an integrated assessment of eutrophication status will be carried out for the entire NOWPAP region. However, improvement of the NOWPAP Common Procedure is needed in terms of harmonizing assessment data and their reference values, adjusting algorithms of satellite derived Chl-a, particularly in turbid coastal waters, and including data on atmospheric deposition of nutrients, particularly nitrogen. Conducting more case studies and expanding assessment areas including the open sea are also recommended.
Taking OSPAR and HELCOM as good examples, the NOWPAP member states should follow their approaches to set reference values in each member state. Methodologies of eutrophication assessment in OSPAR and HELCOM set reference values from reference sites, historical data, ecological modeling and expert judgments. Their approaches also consider the concept of acceptable deviation, which defines the acceptable range above or below the reference values by taking into account disturbance and natural variability. Adoption of these approaches into the NOWPAP Common Procedure should be considered.
To compensate the limitation of eutrophication assessment with the use of the NOWPAP Common Procedure including geographical coverage, available data and so on, it is also recommended that extensive literature review on eutrophication, ecological modeling and available monitoring data be undertaken from papers and reports that have been published and/or released in the Northwest Pacific region.
6.2.2 Establishment of database for collaborative regional monitoring program The monitoring of coastal waters is still considered a national obligation and there has not been a collaborative
regional monitoring program yet in the NOWPAP region. One of the NOWPAP objectives is to assess regional marine environmental conditions by coordinating and integrating monitoring and data-gathering systems on a regional basis by making the best use of the expertise and facilities available within the region on a collective and consistent basis. However, there has been no framework to gather and share environmental monitoring data among the NOWPAP member states to date, except for data on marine litter collected through implementation of the NOWPAP Regional Action Plan on Marine Litter (RAP MALI) (NOWPAP, 2008). Monitoring results on marine litter surveys are submitted to the Data and Information Network Regional Activity Center (DINRAC) of NOWPAP and shared among the NOWPAP member states.
In HELCOM, monitoring has been well established for a long time, with the monitoring of physical and chemical variables of the open sea since 1979 and of radioactive substances in the Baltic Sea since 1984. Reporting such monitoring data in coastal waters has been an obligation to the HELCOM member countries
- 82 -
under the revised Helsinki Convention since 1992. Quality control of those monitoring data was done with the HELCOM COMBINE Manual (HELCOM, 2008). A similar approach taken such as in the NOWPAP RAP MALI and HELCOM COMBINE Manual should be undertaken to establish a database on collaborative regional monitoring programs to address eutrophication.
6.2.3 Using results of eutrophication assessment for Integrated Coastal and River Basin Management
It is essential to reduce nutrient enrichments into the sea to solve eutrophication-related problems in the selected sea areas. Anthropogenic sources of nutrients are highly varied, such as from industry, sewage treatment plants, urban run-off, agriculture, aquaculture and nutrient release by soil erosion. For effective management of nutrient, Integrated Coastal and River Basin Management (ICARM) is one possible effective measure. It is recommended that a concrete management plan in each basin be developed through cooperation with the Pollutions Monitoring Regional Activity Centre (POMRAC) of NOWPAP that implements activities on ICARM. As a result, national/regional/international policies and relevant legislations for management of eutrophication will be developed.
6.2.4 Assessment of negative impacts of eutrophication on the marine environment in the NOWPAP region
Although it is well known that eutrophication can negatively impact the marine environment in various ways, few quantitative assessments of those impacts in the NOWPAP region have been undertaken in an international framework. CEARAC has been collecting data on red tides and HAB events, including species composition of phytoplankton and resulting economic damage to the fisheries. Such information should be further analyzed in comparison with obtained eutrophication assessment results to quantify negative impacts of eutrophication. It is also necessary to study impacts of eutrophication on benthic communities, macro algae and sea grasses, which can lead to a loss of marine biodiversity.
6.2.5 Introducing ecological modeling to set appropriate amount of nutrient as a control target Nutrient enrichments can be caused by various anthropogenic activities and they often cause eutrophication.
However, it is necessary to remember that nutrients are also essential for the biological production in the sea. In Tokyo Bay, Ise Bay and the Seto Inland Sea, which are typical Japanese enclosed sea areas, discharge of
land-based TN, TP and COD have been regulated by ‘Water Quality Total-Volume Restriction’. This regulation has been effective on eutrophication management, but the occurrence of red tides and hypoxic water masses in the bottom layer have still not been completely prevented. Another possible approach can be to use ecological modeling to understand the appropriate level of nutrients required to maintain steady and smooth circulation of nutrients and carbon in the marine ecosystem. This will help the development and implementation of more effective nutrient management. Ultimately, it is necessary to consider integrating physical models and satellite data into ecological models to predict eutrophication status.
- 83 -
References Andersen, J. H. and J. H. Conley (2009) Eutrophication in coastal ecosystems towards better understanding and
management strategies. Springer. Bricker, S.B., C.G. Clement, D.E. Pirhalla, S.P. Orlando and D.T.G. Farrow (1999) National Estuarine
Eutrophication Assessment: Effects of Nutrient Enrichment in the Nation’s Estuaries. NOAA, National Ocean Service, Special Projects Office and the National Centers for Coastal Ocean Service, Silver Spring, MD, 71 pp. .
Bricker, S. B., J. G. Ferreira and T. Simas (2003) An integrated methodology for assessment of estuarine trophic status. Ecological Modelling, 169, 39-60. .
Bricker, S., B. Longstaff, W. Dennison, A. Jones, K. Boicourt, C. Wicks and J. Woerner (2007) Effects of Nutrient Enrichment in the Nation’s Estuaries: A Decade of Change. NOAA Coastal Ocean Program Decision Analysis Series No. 26. National Centers for coastal Ocean Science, Silver Spring, MD. 328 pp. .
CCIED (2010) Ecosystem Issues and Policy Options Addressing Sustainable Development of China’s Ocean and Coast. CCICED Task Force Report.
Chai, C., Z. Yu, X. Song and X. Cao (2006) The status and characteristics of eutrophication in the Yangtze River (Changjiang) Estuary and adjacent East China Sea, China. Hydrobiologia, 563, 313-328.
Chen, C-T. A. (2000) The Three Gorges Dam: Reducing the upwelling and thus productivity in the East China Sea. Geophysical Research Letters, 27, 381-383.
Chen, C-C., G-C. Gong and F-K. Shiah (2007) Hypoxia in the East China Sea: One of the largest coastal low-oxygen areas in the world. Marine Environmental Research, 64, 399-408.
Diaz, R. J. and R. Rosenberg (1995) Marine benthic hypoxia: a review of its ecological effects and the behavioural responses of benthic macrofauna. Oceanography and Marine Biology Annual Review, 33, 245-303.
Diaz, R. J. (2001) Overview of hypoxia around the world. Journal of Environmental Quality, 30, 275-281. Diaz, R. J. and R. Rosenberg (2008) Spreading dead zones and consequences for marine ecosystems. Science,
321, 926-929. Dong, Z., D. Liu, J. K. Keesing (2010) Jellyfish blooms in China: Dominant species, causes and consequences.
Marine Pollution Bulletin, 60, 954-963. Fukuyo, Y., Imai, I., Kodama, M. and Tamai, K. (2002) Red tides and other harmful algal blooms in Japan. in
‘Harmful Algal blooms in the PICES Region of the North Pacific (eds by F. J. R. ‘Max’ Taylor and V. L. Trainer)’, PICES Scientific Report, No.23, North Pacific Marine Science Organization, 7-20.
GEOHAB (2006) Global Ecology and Oceanography of Harmful Algal Blooms, Harmful Algal Blooms in Eutrophic Systems. P. Glibert (ed.). IOC and SCOR, Paris and Baltimore, 74 pp.
Gong, G-C., J. Chang, K-P. Chiang, T-M. Hsiung, C-C. Hung, S-W. Duan and L. A. Codispoti (2006) Reduction of primary production and changing of nutrient ratio in the East China Sea: Effect of the Three Gorges dam? Geophysical Research Letters, 33, L07610, doi: 10.1029/2006GL025800.
Han, M-S., J-K. Jeon and Y-O. Kim (1992) Occurrence of dinoflagellate Alexandrium tamarense, a causative organism of oaralytic shellfish poisoning in Chinhae Bay, Kore. Journal of Plankton Research, 14, 1581-1592.
Harashima, A. (2007) Evaluating the effects of change in input ratio of N: P: Si to coastal marine ecosystem. Journal of Environmental Science for Sustainable Society, 1, 33-38.
- 84 -
HELCOM (2006) Development of tools for assessment of eutrophication in the Baltic sea. Baltic Sea Environment Proceedings No. 104. Helsinki Commission, 62 pp.
HELCOM (2008) Manual for marine monitoring in the COMBINE programme of HELCOM. http://www.helcom.fi/groups/monas/CombineManual/en_GB/main/.
HELCOM (2009) Eutrophication in the Baltic Sea. An integrated thematic assessment of the effects of nutrient enrichment in the Baltic Sea. Baltic Sea Environment Proceedings No. 115B. Helsinki Commision 148 pp.
Hu, C., D. Li, C. Chen, J. Ge, F. E. Muller-Karger, J. Liu, F. Yu and M-X. He (2010) On the recurrent Ulva prolifera blooms in the Yellow Sea and East China Sea. Journal of Geophysical Research, 115, 1-8, C05017, doi: 10.1029/2009JC005561.
Japan Fisheries Resource Conservation Association (2005) Fisheries water quality standard. Kawahara, K. S. Uye, K. Ohtsu and H. Iizumi (2006) Unusual population explosion of the giant jellyfish
Nemopilema nomurai (Scyphozoa: Rhizostomeae) in East Asian waters. Marine Ecology Progress Series, 307, 161-173.
Kim, T-W., K. Lee, R. G. Najjar, H-D. Jeong and H. J. Jeong (2011) Increasing N abundance in the Northwestern Pacific Ocean due to atmospheric nitrogen deposition. Science, 334, 505-509.
Lee C-K. and W. Lim (2006) Variation of harmful algal blooms in Masan-Chinhae Bay. Science Asia, 32, 51-56. Lee, Y-W., D-W. Hwang, G. Kim, W-C. Lee, Y-T. Oh (2009) Nutrient inputs from submarine groundwater
discharge (SGD) in Musan Bay, an embayment surrounded by heavily industrialized cities, Korea. Science of the Total Environment, 407, 3181-3188.
Leliaert, F., X. Zhang, N. Ye, E. Malta, A. H. Engelen, F. Mineur, H. Verbruggen and O. D. Clerck (2009) Identity of the Qingdao algal bloom. Phycological Research, 57, 147-151.
Liu S. M., Zhang J., Chen H. T., Wu Y., Xiong H. and Zhang Z. F. (2003) Nutrients in the Changjiang and its tributaries. Biogeochemistry, 62, 1-18.
Liu, D., J. K. Keesing, Z. Dong, Y. Zhen, B. Di, Y. Shi, P. Fearns and P. Shi (2010) Recurrence of the world’s largest green-tide in 2009 in Yellow Sea, China: Porphyra yezoensis aquaculture rafts confirmed as nursery for macroalgal blooms. Marine Pollution Bulletin, 60, 1423-1432.
Ministry of the Environment of Japan (1971) Environmental quality standards for water pollution. Ministry of the Environment of Japan (2011) Guidance for Introducing the Total Pollutant Load Control System
101pp. Miyahara K, Uji R, Yamada H, Matsui Y, Nishikawa T, Onitsuka G (2005) A harmful algal bloom of
Cochlodinium polykrikoides Margalef (Dinophyceae) in the coastal area of San-in, western part of the Japan Sea, in September 2003. Bull Plankton Soc Japan 52: 11–18. (in Japanese with English abstract)
Nakamura, T., K. Matsumoto, M. Uematsu (2005) Chemical characteristics of aerosols transported from Asia to the East China Sea: an evaluation of anthropogenic combined nitrogen deposition in autumn. Atmospheric Environment, 39, 1749-1758.
Nam, J. H., D. S Kang, J. S. Yoon, A. A. Yoon, J. Y. Choi, H. J. Choi, H. H. Lim and J. D. Kim (2005) Management strategies for the coastal environment of the Masan-Chinhae Bay. Proceedings of the workshop on ecosystem management of interrelated river basins, estuaries and coastal sea. 104-112 pp.
Nixon, S. W. (2009) Eutrophication and the macroscope. Hydrobiologia, 629, 5-19. NOWPAP (2008) Regional Action Plan on Marine Litter. 25pp. NOWPAP (2010) Threats to marine and coastal biodiversity in the NOWPAP region.
- 85 -
NOWPAP CEARAC (2005) Integrated report on Harmful Algal Blooms (HABs) for the NOWPAP Region. NOWPAP CEARAC (2007) Booklet of countermeasures against Harmful Algal Blooms (HABs) in the
NOWPAP Region. NOWPAP CEARAC (2009) Procedures for the assessment of eutrophication status including evaluation of
land-based sources of nutrients for the NOWPAP region. NOWPAP POMRAC (2006) National reports on atmospheric deposition of contaminants into the marine and
coastal environment in NOWPAP region. POMRAC Technical Report No 1. NOWPAP POMRAC (2007) Regional overview on atmospheric deposition of contaminants to the marine and
coastal environment in NOWPAP Region. POMRAC Technical Report No 3. NOWPAP POMRAC (2009) Regional overview on river and direct inputs of contaminants into the marine and
coastal environment in NOWPAP Region with special focus on the land based sources of pollution. POMRAC Technical Report No 7.
NOWPAP POMRAC (2010) Regional overview on integrated coastal and river basin management (ICARM) in the NOWPAP Region. POMRAC Technical Report No 5.
NSQS (1997) National Seawater Quality Standard of China, GB3097-1997. OECD (1982) Eutrophication of water, monitoring assessment and control. Organization of Economic
Co-operation and Development, Paris. Oh, H. T., W. C. Lee. S. E. Park, S. J. Hong, R. H. Jung and J. S. Park (2006) Marine ecosystem response to
nutrient input reduction in Jinhae Bay, South Korea. Journal of Environmental Sciences, 9, 819-827. Onitsuka, G., I. Uno, T. Yanagi and J. H. Yoon (2009) Modeling the effect of atmospheric nitrogen input on
biological production in the Japan Sea. Journal of Oceanography, 65, 433-438. Onitsuka, G., K. Miyahara, N. Hirose, S. Watanabe, H. Semura, R. Hon, T. Nishikawa, K. Miyagi and M.
Yamaguchi (2010) Large-scale transport of Cochlodinium polykrikoides blooms by the Tsushima Warm Current in the southwest Sea of Japan. Harmful Algae, 9, 390-397.
OSPAR Commission (2003) OSPAR integrated report 2003 on the eutrophication status of the OSPAR maritime area based upon the first application of the comprehensive procedure. 59 pp.
OSPAR Commission (2005) Common procedure for the identification of the eutrophication status of the OSPAR Maritime Area. Ref. No. 2005-3.
OSPAR Commission (2008) Second OSPAR integrated report on the eutrophication status of the OSPAR maritime area. 107 pp.
Redfield, A. C., B. H. Ketchum, F. A. Richards (1963) The influence of organisms on the composition of seawater. The Sea vol. 2, Ed. M. N. Hill, Interscience, New York.
Salmi, T., A. Määttä, P. Antika, T. Ruoho-Airola, and T. Amnell (2002) Detecting trends of annual values of atmospheric pollutions by the Mann-Kendall test and Sen’s slope estimates -The Excel template application MAKESENS-. Finnish Meteorological Institute, 35pp, Helsinki.
Tian, R. C., F. X. Hu and J. M. Martin (1993) Summer nutrient fronts in the Changjiang (Yantze River) Estuary. Estuarine, Coastal and Shelf Science, 37, 27-41.
Tishchenko, P. Y., A. F. Sergeev, V. B. Lobanov, V.I. Zvalinski, A. M. Koltunov, T. A. Mikhailik, P. P. Tishchenko, M. G. Shvetsova (2008) Hypoxia in near-bottom waters of the Amursky Bay. Bulletin Far Eastern Branch Russia Academy Science, 6, 115-125.
Toyama Bay Water Quality Preservation Research Committee (2001) Report on water pollution in Toyama Bay.
- 86 -
Toyama Prefectural Government (2008) Clean Water Plan. 106pp. Uematsu, M., A. Yoshikawa, H. Muraki, K. Arao, I. Uno (2002) Transport of mineral and anthropogenic aerosols
during a Kosa event over East Asia. Journal of Geophysical Research, 107(D7), 4059, doi: 10.1029/2001JD000333.
UNEP/GEF (2009) Strategic action programme for the Yellow Sea Large Marine Ecosystem. UNEP/GEF YSLME project, Ansan, Republic of Korea, 52 pp.
Uye, S. (2008) Blooms of the giant jellyfish Nemopilema nomurai: a threat to the fisheries sustainability of the East Asian Marginal Seas. Plankton Benthos Research, 3, 125-131.
Wang, B. D. (2006) Cultural eutrophication in the Changjiang (Yangtze River) plume: History and perspective. Estuarine, Coastal and Shelf Science, 69, 471-477.
Wang, B. D. (2007) Assessment of trophic status in Changjiang (Yangtze) River estuary. Chinese Journal of Oceanology and Limnology, 25, 261-269.
Wei, H., Y. He, Q. Li, Z. Liu and H. Wang (2007) Summer hypoxia adjacent to the Changjiang Estuary. Journal of Marine Systems, 67, 292-303.
Yamamoto, T. (2003) The Seto Inland Sea-eutrophic or oligotrophic? Marine Pollution Bulletin, 47, 37-42. Yanagi, T. (2007) Sato-umi: A new concept for coastal sea management, Terra Scientific Publishing Company,
Tokyo, pp 86. Yokoyama, H. (2003) Environmental quality criteria for fish farms in Japan. Aquaculture, 226, 45-56. Zhang, J. and H. Satake (2003) Chemical characteristics of submarine groundwater seepage in Toyama Bay,
Central Japan. Land and Marine Hydrogeology. Ed. by M. Taniguchi, K. Wang and T. Gamo Elsevier, Amsterdam, The Netherlands.
Zhou, M., Z. Shen and R. Yu (2008) Responses of a coastal phytoplankton community to increased nutrient input from the Changjiang (Yangtze) River. Continental Shelf Research, 28, 1483-1489.
Zhou, M (2010) Environmental settings and harmful algal blooms in the sea area adjacent to the Changjiang River Estuary. pp. 133-149. Coastal environmental and ecosystem issues of the East China Sea (eds., Ishimatsu, A. and H. -J. Lie) TERRAPUB and Nagasaki University.
- 87 -
Glossary ADEOS-I: Advanced Earth Observing Satellite-I BOD5: Biochemical Oxygen Demand CCICED: China Council for International Cooperation on the Environment and Development CEARAC: Special Monitoring and Coastal Environmental Assessment Regional Activity Centre COD: Chemical Oxygen Demand CODCr: Chemical Oxygen Demand by Potassium Dichromate DIN: Dissolved Inorganic Nitrogen DINRAC: Data and Information Network Regional Activity Centre DIP: Dissolved Inorganic Phosphate DO: Dissolved Oxygen DSi: Dissolved Silicic acid FPM: Focal Points Meeting HABs: Harmful Algal Blooms HD: High-Decrease HELCOM: The Baltic Marine Environment Protection Commission (Helsinki Commission) HI: High Increase HN: High-No Trend ICARM: Integrated Coastal and River Basin Management JAXA: Japan Aerospace Exploration Agency Low-Decrease LI: Low-Increase LN: Low-No Trend MEP: The Ministry of Environmental Protection of the People’s Republic of China MODIS: Moderate Resolution Imaging Spectroradiometer MODIS-A: MODIS on board Aqua MPCs: Maximum Permissible Concentrations N: Nitrogen NASA: National Aeronautics and Space Administration NPEC: Northwest Pacific Region Environmental Cooperation Center NOAA: National Oceanic and Atmospheric Administration NOWPAP: Northwest Pacific Action Plan NOWPAP Common Procedure: Procedures for the assessment of eutrophication status including evaluation
of land based source of nutrients for the NOWPAP region NSQS: National Seawater Quality Standard of China OBPG: NASA Ocean Biology Processing Group OCTS: Ocean Color and Temperature Scanner OSPAR: Convention for the Protection of the Marine Environment of the North-East Atlantic (originally the
Oslo and Paris Conventions) P: Phosphorus POMRAC: Pollution Monitoring Regional Activity Centre
- 88 -
PSP: Paralytic Shellfish Poisoning RAP MALI: The NOWPAP Regional Action Plan on Marine Litter RAC: Regional Activity Center RSP: UNEP Regional Seas Programme ROSHYDROMET: The Russian Federal Service on Hydrometeorology and Environmental Monitoring SeaWiFS: Sea-viewing Wide Field-of-view Sensor SS: Suspended Substance TMS: Tele-Monitoring System TN: Total Nitrogen TP: Total Phosphorus TPLCS: Total Pollutant Load Control System TWPLMS: Total Water Pollution Loading Management System UNEP: United Nations Environment Programme WG3: Working Group 3 on Harmful Algal Blooms WG4: Working Group 4 on Remote Sensing YSLME: Yellow Sea Large Marine Ecosystem
- 89 -
Annex A Results of eutrophication assessment in each selected sea area (attached as CD-ROM)
Changjiang (Yangtze) River Estuary and adjacent area, China Northwest Kyushu sea area, Japan Toyama Bay, Japan Jinhae Bay, Korea Peter the Great Bay, Russia
Annex B Page 1
- 90 -
Procedures for assessment of eutrophication status including evaluation of land-based sources of nutrients for the NOWPAP region
(Developed in June 2009)
-Contents-
1. Introduction...........................................................................................................................................91
1-1. Background..................................................................................................................................91 1-2. Objectives of the Draft Procedures ............................................................................................92 1-3. Characteristics of the Draft Procedures .....................................................................................92 1-4. Overall structure ..........................................................................................................................93
2. Scope of assessment..........................................................................................................................93 2-1. Setting of assessment objective.................................................................................................93 2-2. Selection of assessment area ....................................................................................................94 2-3. Collection of relevant information ...............................................................................................94 2-4. Selection of assessment parameters and data.........................................................................96
2-4-1. Categorization of monitored/surveyed parameters...........................................................96 2-4-2. Selection of assessment parameters of each assessment category..............................96 2-4-3. Setting of assessment value ..............................................................................................97 2-4-4. Selection of monitoring/survey data for the assessment..................................................97
2-5. Division of assessment area into sub-areas..............................................................................97 2-6. Setting of assessment period .....................................................................................................97
3. Data processing...................................................................................................................................97 3-1. Data processing method.............................................................................................................97 3-2. Data screening.............................................................................................................................97 3-3. Selection of monitoring/survey data for sub-area assessment ................................................97 3-4. Data processing...........................................................................................................................98
4. Setting of assessment criteria.............................................................................................................98 4-1. Setting of criteria for selection of eutrophication identification tools..........................................98 4-2. Setting of criteria for classifying the eutrophication status of assessment parameter.............98 4-3. Setting of criteria for classifying the assessment category .....................................................101 4-4. Setting of criteria for classifying the assessment area/sub-area ............................................101
5. Assessment process and results......................................................................................................101 6. Review of results................................................................................................................................101 7. Conclusion and recommendation.....................................................................................................102
Annex B Page 2
- 91 -
1. Introduction
Eutrophication is the phenomenon of aquatic ecosystem enrichment due to increased nutrient loading. Eutrophication is often caused by human activities, such as inputs of fertilizers from agriculture farming, feed for aquaculture, untreated and/or treated sewage as well as industrial wastewater. Eutrophication causes the deterioration of the coastal environment and typically leads to the formation of harmful algal (phytoplankton) blooms which may subsequently induce fish kill, further ecosystem damage and, at times, are directly or indirectly associated with human health problems. Eutrophication degrades the water quality by decreasing oxygen amount and often light penetration through accelerating excessive production of organic matter in the coastal waters.
In the Northwest Pacific region, coastal areas of China, Japan and Korea are densely populated and eutrophication is often perceived as a potential threat for coastal environment, although eutrophication is rare in Russian waters. Ability to monitor their coastal systems is necessary to manage and sustain healthy coastal environments. However, the availability of continuous and synoptic water quality data, particularly in estuaries and bays is lacking, and it is difficult to characterize the response of water quality to human and natural impacts. Furthermore due to increases in agricultural and industrial activity as well as the possible changes of coastal run-off in this region, there has been an increase in the need for effective monitoring methods on the change of water quality.
Thus, Northwest Pacific Action Plan (NOWPAP) Working Group 3 (WG3) and Working Group 4 (WG4) have decided to use experience of the European countries and develop “Procedures for assessment of eutrophication status including evaluation of land-based sources of nutrients for the NOWPAP region (Procedures)”. It is hoped that the obtained assessments will provide arguments to limit or, if possible, to reduce anthropogenic change of the coastal ecosystem.
1-1. Background
1.1. Development of the Procedures was proposed and approved at the 5th CEARAC (Special Monitoring and Coastal Environmental Assessment Regional Activity Center) Focal Point Meeting (FPM) held in Toyama on September 18-19, 2007.
1.2. As part of the development processes of the draft Procedures, NPEC (Northwest Pacific Region Environmental Cooperation Center) has implemented a case study in Toyama Bay (Toyama Bay case study), by referring to the ‘Common Procedure for the Identification of the Eutrophication Status of the OSPAR Maritime Area’. An interim progress of the Toyama Bay case study was presented at the 5th CEARAC FPM and First Coastal Environment Assessment Workshop held in Toyama on March 6-8, 2008.
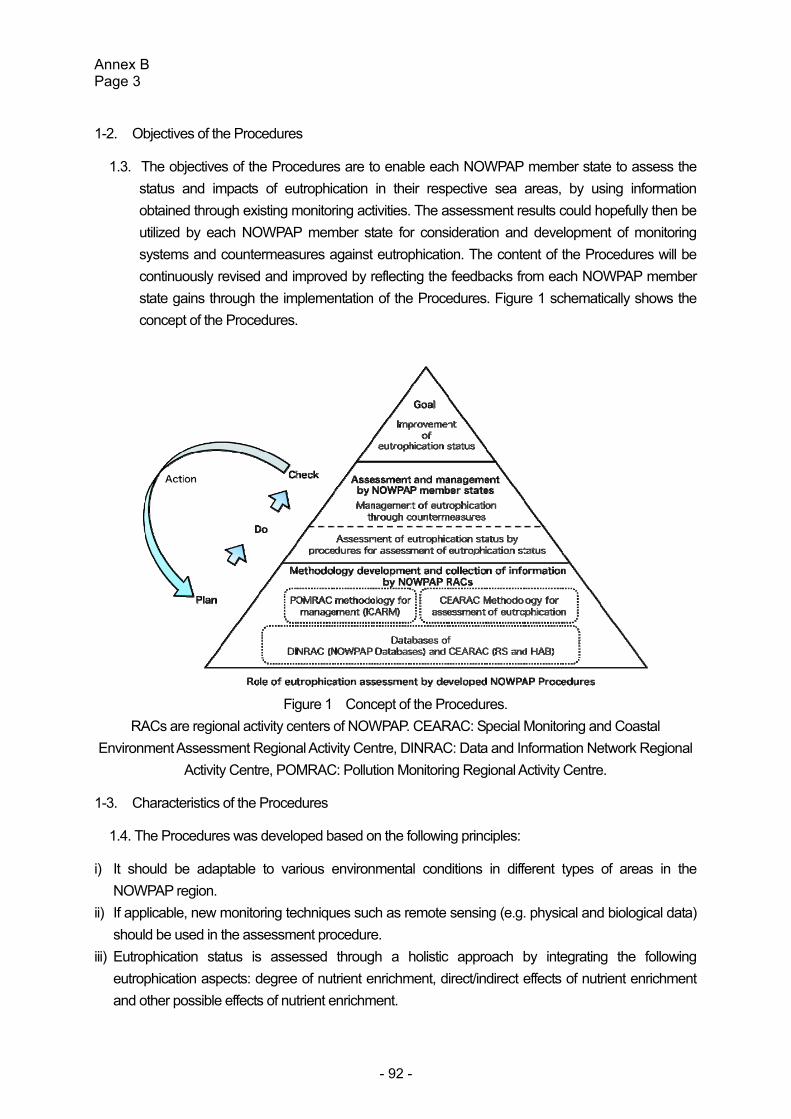
Annex B Page 3
- 92 -
1-2. Objectives of the Procedures
1.3. The objectives of the Procedures are to enable each NOWPAP member state to assess the status and impacts of eutrophication in their respective sea areas, by using information obtained through existing monitoring activities. The assessment results could hopefully then be utilized by each NOWPAP member state for consideration and development of monitoring systems and countermeasures against eutrophication. The content of the Procedures will be continuously revised and improved by reflecting the feedbacks from each NOWPAP member state gains through the implementation of the Procedures. Figure 1 schematically shows the concept of the Procedures.
Figure 1 Concept of the Procedures.
RACs are regional activity centers of NOWPAP. CEARAC: Special Monitoring and Coastal Environment Assessment Regional Activity Centre, DINRAC: Data and Information Network Regional
Activity Centre, POMRAC: Pollution Monitoring Regional Activity Centre.
1-3. Characteristics of the Procedures
1.4. The Procedures was developed based on the following principles:
i) It should be adaptable to various environmental conditions in different types of areas in the NOWPAP region.
ii) If applicable, new monitoring techniques such as remote sensing (e.g. physical and biological data) should be used in the assessment procedure.
iii) Eutrophication status is assessed through a holistic approach by integrating the following eutrophication aspects: degree of nutrient enrichment, direct/indirect effects of nutrient enrichment and other possible effects of nutrient enrichment.
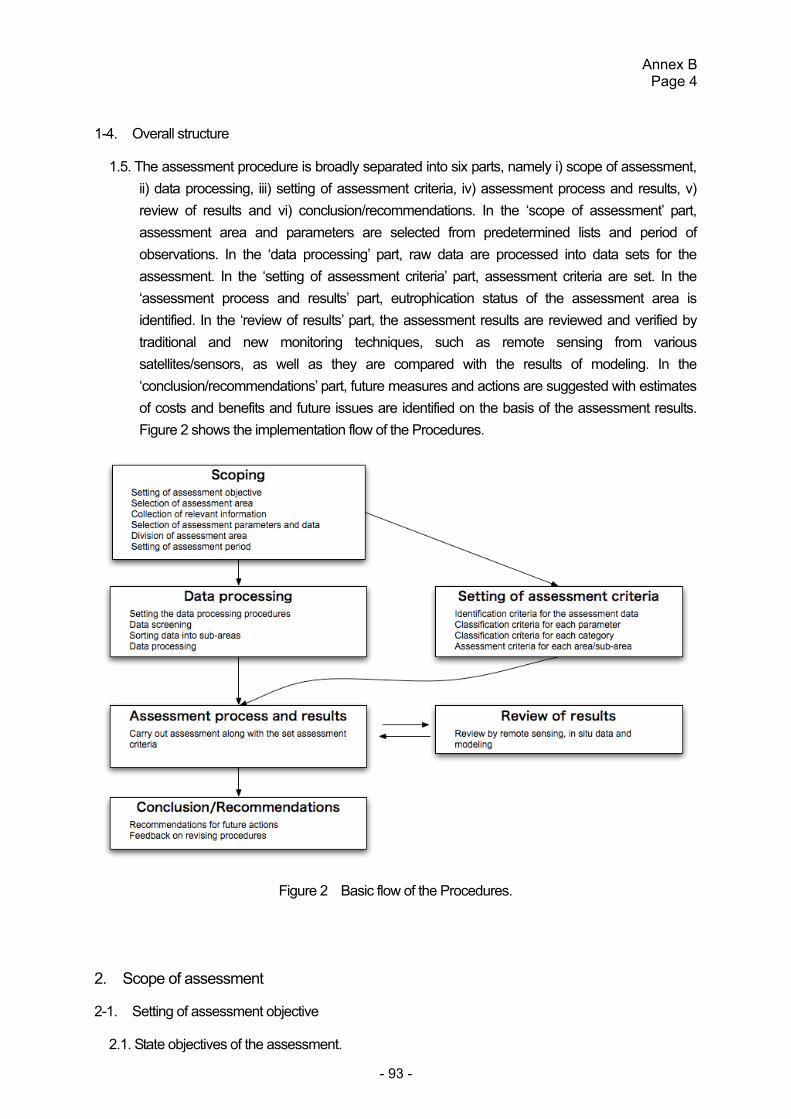
Annex B Page 4
- 93 -
1-4. Overall structure
1.5. The assessment procedure is broadly separated into six parts, namely i) scope of assessment, ii) data processing, iii) setting of assessment criteria, iv) assessment process and results, v) review of results and vi) conclusion/recommendations. In the ‘scope of assessment’ part, assessment area and parameters are selected from predetermined lists and period of observations. In the ‘data processing’ part, raw data are processed into data sets for the assessment. In the ‘setting of assessment criteria’ part, assessment criteria are set. In the ‘assessment process and results’ part, eutrophication status of the assessment area is identified. In the ‘review of results’ part, the assessment results are reviewed and verified by traditional and new monitoring techniques, such as remote sensing from various satellites/sensors, as well as they are compared with the results of modeling. In the ‘conclusion/recommendations’ part, future measures and actions are suggested with estimates of costs and benefits and future issues are identified on the basis of the assessment results. Figure 2 shows the implementation flow of the Procedures.
Figure 2 Basic flow of the Procedures.
2. Scope of assessment
2-1. Setting of assessment objective
2.1. State objectives of the assessment.
Annex B Page 5
- 94 -
2.2. In order to facilitate the understanding of the assessment results, clarify the preconditions and limitations involved in the assessment.
2.3. State any scientific uncertainties that users of the assessment results should take note of, such as:
i) The assessment results may not be applicable for use in environmental impact assessment.
ii) The assessment results may become less reliable/valid when scientific data/information are updated.
iii) The assessment results may have low degree of confidence due to insufficient data.
2-2. Selection of assessment area
2.4. Select an assessment area that can be considered as a single sea area (e.g. geographic unit).
2.5. An assessment area should be an area for which there are ongoing environmental monitoring and assessment programs and where eutrophication was earlier observed or amount of nutrients increases.
2-3. Collection of relevant information
2.6. Collect information on the assessment area that is necessary and relevant to eutrophication assessment such as: i) environmental monitoring/survey data* (e.g. water quality, nutrient load, red tide, marine flora/fauna, shellfish poisoning, ocean remote sensing); ii) pollutant sources (e.g. municipal, industrial, agricultural, marine aquaculture, atmospheric deposition); iii) supplementary information (e.g. oceanography, meteorology, catchment area population, wastewater management, fishery status, coastal recreation). The list of relevant information will be updated as further experiences are gained through the implementation of the Procedures.
*: Information on methodology (e.g. method of field measurement and chemical analysis) should also be collected to confirm data reliability.
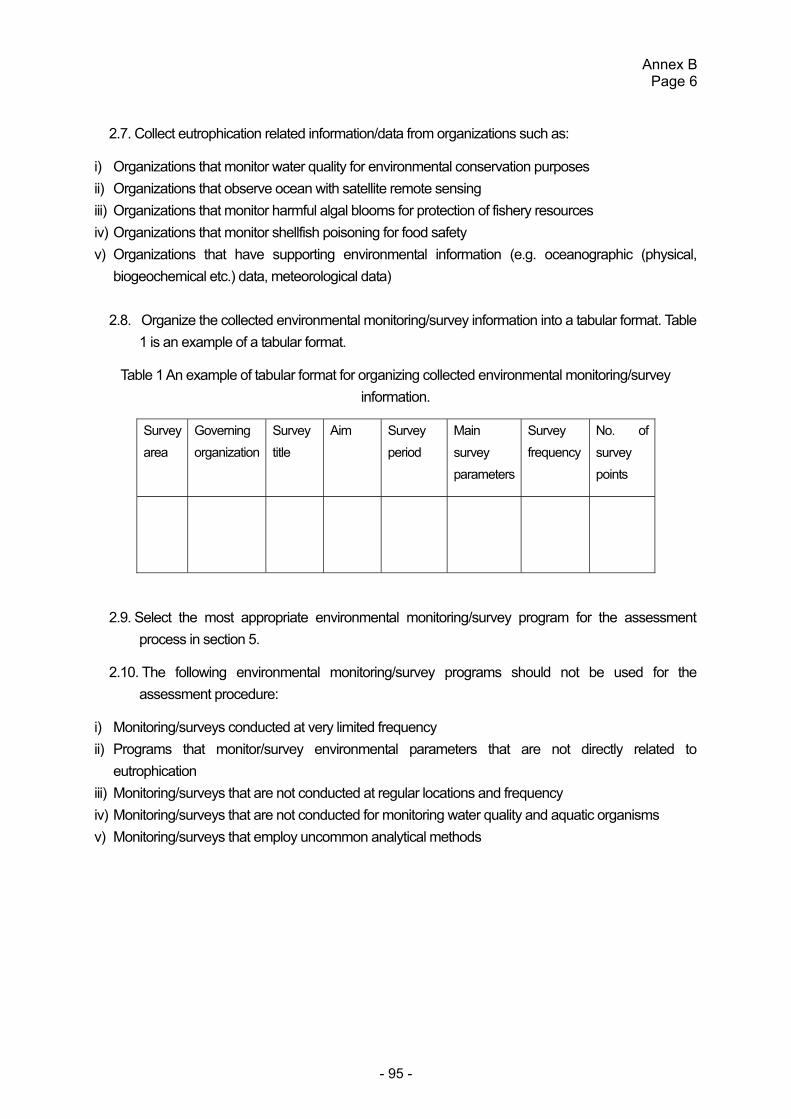
Annex B Page 6
- 95 -
2.7. Collect eutrophication related information/data from organizations such as:
i) Organizations that monitor water quality for environmental conservation purposes ii) Organizations that observe ocean with satellite remote sensing iii) Organizations that monitor harmful algal blooms for protection of fishery resources iv) Organizations that monitor shellfish poisoning for food safety v) Organizations that have supporting environmental information (e.g. oceanographic (physical,
biogeochemical etc.) data, meteorological data)
2.8. Organize the collected environmental monitoring/survey information into a tabular format. Table 1 is an example of a tabular format.
Table 1 An example of tabular format for organizing collected environmental monitoring/survey information.
Survey area
Governing organization
Survey title
Aim Survey period
Main survey parameters
Survey frequency
No. of survey points
2.9. Select the most appropriate environmental monitoring/survey program for the assessment process in section 5.
2.10. The following environmental monitoring/survey programs should not be used for the assessment procedure:
i) Monitoring/surveys conducted at very limited frequency ii) Programs that monitor/survey environmental parameters that are not directly related to
eutrophication iii) Monitoring/surveys that are not conducted at regular locations and frequency iv) Monitoring/surveys that are not conducted for monitoring water quality and aquatic organisms v) Monitoring/surveys that employ uncommon analytical methods
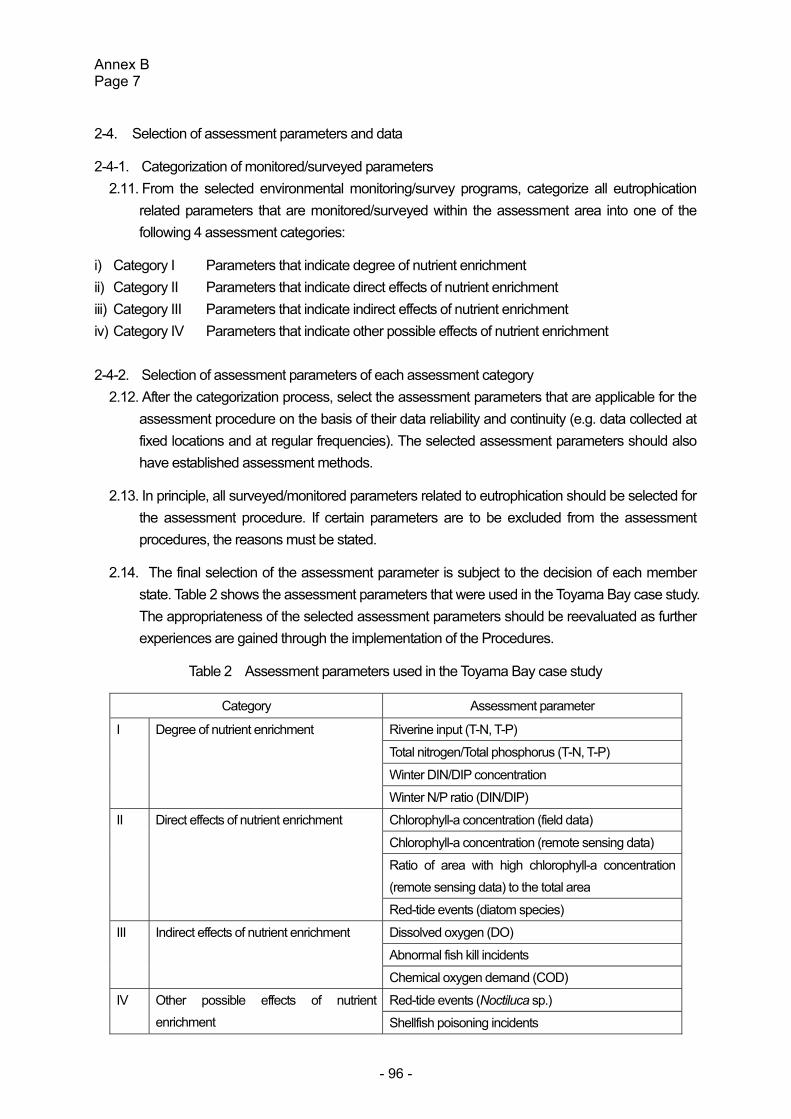
Annex B Page 7
- 96 -
2-4. Selection of assessment parameters and data
2-4-1. Categorization of monitored/surveyed parameters 2.11. From the selected environmental monitoring/survey programs, categorize all eutrophication
related parameters that are monitored/surveyed within the assessment area into one of the following 4 assessment categories:
i) Category I Parameters that indicate degree of nutrient enrichment ii) Category II Parameters that indicate direct effects of nutrient enrichment iii) Category III Parameters that indicate indirect effects of nutrient enrichment iv) Category IV Parameters that indicate other possible effects of nutrient enrichment
2-4-2. Selection of assessment parameters of each assessment category
2.12. After the categorization process, select the assessment parameters that are applicable for the assessment procedure on the basis of their data reliability and continuity (e.g. data collected at fixed locations and at regular frequencies). The selected assessment parameters should also have established assessment methods.
2.13. In principle, all surveyed/monitored parameters related to eutrophication should be selected for the assessment procedure. If certain parameters are to be excluded from the assessment procedures, the reasons must be stated.
2.14. The final selection of the assessment parameter is subject to the decision of each member state. Table 2 shows the assessment parameters that were used in the Toyama Bay case study. The appropriateness of the selected assessment parameters should be reevaluated as further experiences are gained through the implementation of the Procedures.
Table 2 Assessment parameters used in the Toyama Bay case study
Category Assessment parameter
Riverine input (T-N, T-P)
Total nitrogen/Total phosphorus (T-N, T-P)
Winter DIN/DIP concentration
I Degree of nutrient enrichment
Winter N/P ratio (DIN/DIP)
Chlorophyll-a concentration (field data)
Chlorophyll-a concentration (remote sensing data)
Ratio of area with high chlorophyll-a concentration (remote sensing data) to the total area
II Direct effects of nutrient enrichment
Red-tide events (diatom species)
Dissolved oxygen (DO)
Abnormal fish kill incidents
III Indirect effects of nutrient enrichment
Chemical oxygen demand (COD)
Red-tide events (Noctiluca sp.) IV Other possible effects of nutrient enrichment Shellfish poisoning incidents
Annex B Page 8
- 97 -
2-4-3. Setting of assessment value
2.15. In order to understand the inter-annual trends of eutrophication, assessment should be basically conducted with annual data (e.g. annual mean, annual max., annual number of events). However, other time scales (e.g. seasonal mean, raw value) may be used if it is considered more appropriate. It is recommended to analyze raw data carefully first to make reasonable statistical analysis. Descriptions of changes of sampling and analytical methods, such as sampling number, sampling time and location, preservation, and measurement procedure, is necessary for reasonable interpretation of data.
2.16. Set the assessment values*.
*Assessment value: The type of data (e.g. annual mean, annual max., annual number of events, seasonal mean, seasonal max.) that will be used for the assessment
2-4-4. Selection of monitoring/survey data for the assessment 2.17. Select the monitoring/survey data to be applied for each assessment parameter.
2-5. Division of assessment area into sub-areas
2.18. If it is necessary to understand and assess the causes and direct/indirect effects of eutrophication at more localized scales, the assessment area may be divided into sub-areas.
2.19. When dividing the assessment area into sub-areas, factors such as location of riverine input, monitoring locations, fishery activities, underwater topography, salinity distribution, ocean currents and red-tide events should be considered.
2-6. Setting of assessment period
2.20. Set the assessment period in accordance with the assessment objectives and availability of reliable data.
3. Data processing
3-1. Data processing method
3.1. For each assessment parameter, determine a methodology to process monitoring/survey data into the selected assessment values (e.g. annual mean).
3-2. Data screening
3.2. Within the selected monitoring/survey data, exclude data that are not suitable for the assessment.
3.3. If certain monitoring/survey data are excluded in the above process, state the reasons for their exclusion. Possible reasons could be related to survey location, data reliability and so on.
3-3. Selection of monitoring/survey data for sub-area assessment
3.4. If the assessment area is divided into sub-areas, the data for the sub-area assessment should
Annex B Page 9
- 98 -
be selected based on the location of the survey/monitoring sites.
3-4. Data processing
3.5. Process the selected monitoring/survey data into assessment values in accordance with the methods established in 3.1.
3.6. In principal, process monitoring/survey data of all survey/monitoring site.
3.7. Prior to data processing, it is preferable to arrange the monitoring/survey data into data sets (e.g. data sets for each assessment parameter and survey/monitoring site).
4. Setting of assessment criteria
4.1. Eutrophication status of an assessment area is assessed based on a set of assessment criteria. Detail explanations are provided in the ensuing sections.
4-1. Setting of criteria for selection of eutrophication identification tools
4.2. Eutrophication status based on each assessment parameter is assessed by identifying its current status and/or trend. The current status and trend of an assessment parameter are identified by using a combination of the following 3 identification tools. Selection of the identification tools should be based on set identification criteria*.
*Identification criteria: Criteria for selecting the identification tools for the assessment.
i) Identification by comparison (identifies current status): The eutrophication status is identified by comparing the obtained assessment value (e.g. annual mean value) with either environmental standards (standards may be set as absolute value or have a range of values such as for DO and chlorophyll-a) or background value (e.g. measurement values obtained at an area that has had negligible influence from anthropogenic activities). This identification tool is used for assessment parameters that can be expressed by concentration or ratio (e.g. N/P ratio).
ii) Identification by occurrence (identifies current status): Eutrophication status is identified by occurrence or non-occurrence of eutrophication-related events. This identification tool is used for assessment parameters that can be expressed by number or frequency of events (e.g. red tide).
iii) Identification by trend (identifies trend): Eutrophication status is identified by identifying the trend. This identification tool can be used for all assessment parameters with reasonably long time series.
4.3. The rationale behind the set identification criteria must be stated clearly and objectively.
4-2. Setting of criteria for classifying the eutrophication status of assessment parameter
4.4. After identifying the current status and/or trend with the eutrophication identification tool, the eutrophication status of the assessment parameter should be classified based on set classification criteria*.
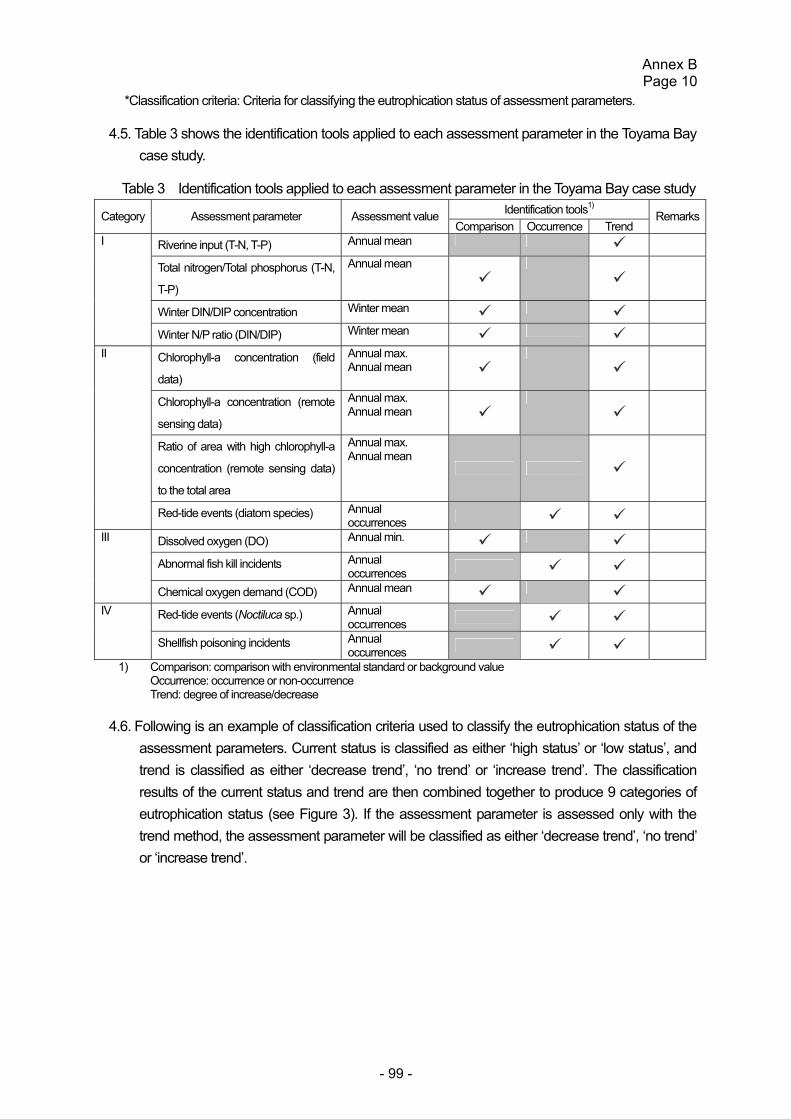
Annex B Page 10
- 99 -
*Classification criteria: Criteria for classifying the eutrophication status of assessment parameters.
4.5. Table 3 shows the identification tools applied to each assessment parameter in the Toyama Bay case study.
Table 3 Identification tools applied to each assessment parameter in the Toyama Bay case study Identification tools1) Category Assessment parameter Assessment value
Comparison Occurrence Trend Remarks
Riverine input (T-N, T-P) Annual mean
Total nitrogen/Total phosphorus (T-N,
T-P)
Annual mean
Winter DIN/DIP concentration Winter mean
I
Winter N/P ratio (DIN/DIP) Winter mean
Chlorophyll-a concentration (field
data)
Annual max. Annual mean
Chlorophyll-a concentration (remote
sensing data)
Annual max. Annual mean
Ratio of area with high chlorophyll-a
concentration (remote sensing data)
to the total area
Annual max. Annual mean
II
Red-tide events (diatom species) Annual occurrences
Dissolved oxygen (DO) Annual min.
Abnormal fish kill incidents Annual occurrences
III
Chemical oxygen demand (COD) Annual mean
Red-tide events (Noctiluca sp.) Annual occurrences
IV
Shellfish poisoning incidents Annual occurrences
1) Comparison: comparison with environmental standard or background value Occurrence: occurrence or non-occurrence
Trend: degree of increase/decrease
4.6. Following is an example of classification criteria used to classify the eutrophication status of the assessment parameters. Current status is classified as either ‘high status’ or ‘low status’, and trend is classified as either ‘decrease trend’, ‘no trend’ or ‘increase trend’. The classification results of the current status and trend are then combined together to produce 9 categories of eutrophication status (see Figure 3). If the assessment parameter is assessed only with the trend method, the assessment parameter will be classified as either ‘decrease trend’, ‘no trend’ or ‘increase trend’.
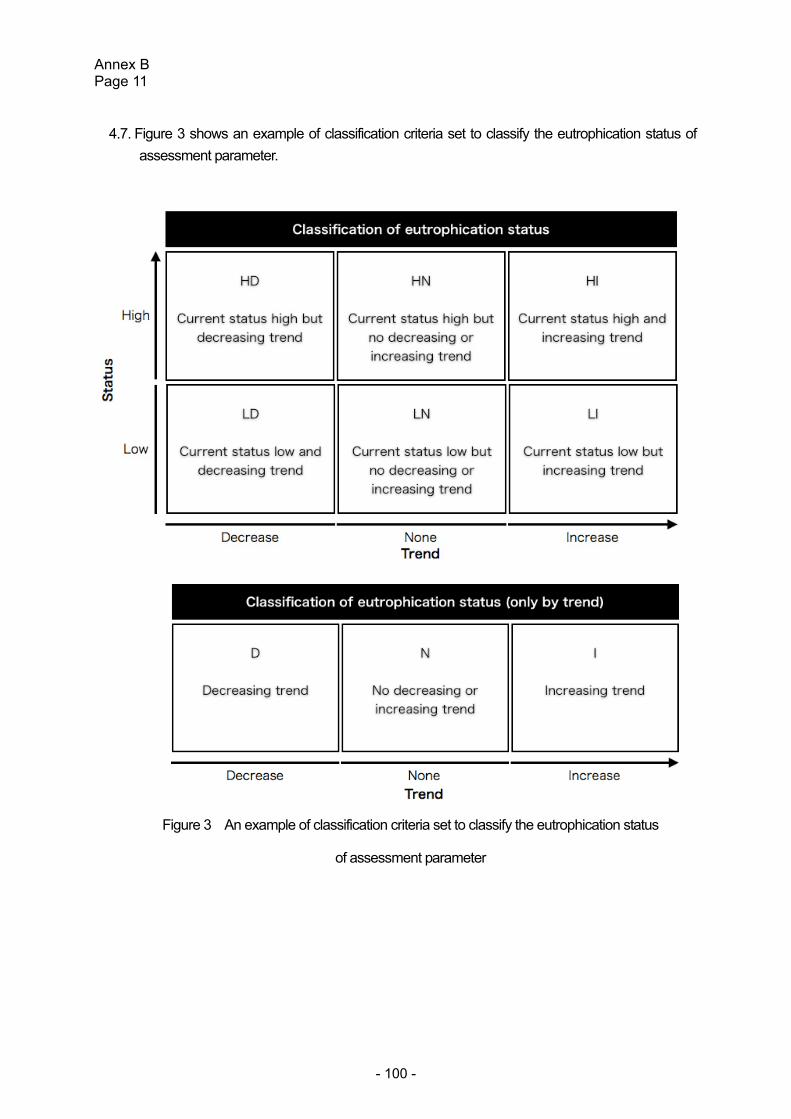
Annex B Page 11
- 100 -
4.7. Figure 3 shows an example of classification criteria set to classify the eutrophication status of assessment parameter.
Figure 3 An example of classification criteria set to classify the eutrophication status
of assessment parameter
Annex B Page 12
- 101 -
4-3. Setting of criteria for classifying the assessment category
4.8. Determine the eutrophication status of the assessment category by setting assessment category classification criteria.
4.9. Classify eutrophication status of the assessment category by selecting one classification result of the assessment parameters within the assessment category that most appropriately represents the eutrophication status of the area. However, if the classification results are contradictory among the assessment parameters in the assessment category, and therefore if it is unreasonable to select a representative classification result, this assessment category can be excluded from the classification procedure with its reasons stated.
4-4. Setting of criteria for classifying the assessment area/sub-area
4.10. Set holistic assessment criteria for the assessment area/sub-area so as to diagnostically explain classification results of each assessment parameter and category.
5. Assessment process and results
5.1. The eutrophication status of the assessment area should be assessed on the basis of the identification results of the assessment data and classification results of each parameter and parameter’s categories.
5.2. Identify the eutrophication status of the assessment data of each monitoring site based on the set identification criteria.
5.3. Classify each assessment parameter based on the identification results of the assessment data. If there are multiple monitoring sites in each sub-area, the identification results from all the monitoring sites should be taken into account.
5.4. Classify each assessment category based on the classification results of assessment parameters.
5.5. The eutrophication status of each area/sub-area should be assessed based on the classification results of each assessment parameter and category.
5.6. Explain diagnostically classification results of each assessment parameter and category.
6. Review of results
6.1. The assessment report should have all necessary information required for the objective review of the .assessment results.
6.2. If applicable, new techniques such as remote sensing could also be used for reviewing of the assessment results.
6.3. It is recommended to have interpretation of the results; if there is eutrophicated/oligotrophic
Annex B Page 13
- 102 -
status and/or trend, the possible reasons, such as changes of nutrient loads caused by anthropogenic activities and/or climate change would be described.
7. Conclusion and recommendations
7.1. Based on the assessment results, provide recommendations for future actions.
7.2. The results of each classification process should be clearly presented, so that policy makers etc. can consider the most appropriate monitoring or countermeasures against eutrophication.
Copyright © NOWPAP CEARAC 2009
For bibliographical purpose, this document may be cited as: NOWPAP CEARAC 2009: Procedures for assessment of eutrophication status including evaluation of
land-based sources of nutrients for the NOWPAP region.
Annex C Page 1
- 103 -
Annex C Evaluation of preliminary eutrophication assessment by satellite in each selected sea area 1. Objectives
Application of the NOWPAP Common Procedure (NOWPAP CEARAC, 2009) requires records of in situ measured data to assess eutrophication. Although this approach clearly helps to understand the causes and consequences of eutrophication, it is time consuming and not an easy task for coastal managers to apply the NOWPAP Common Procedure.
Chlorophyll-a (Chl-a) is regarded as a proxy for phytoplankton biomass, and it is categorized into Category II of the NOWPAP Common Procedure. Chl-a is a useful indicator of eutrophication because one of the responses to eutrophication is increase the phytoplankton biomass (Harding and Perry, 1997). Chl-a can be derived by ocean color remote sensing techniques, and it can be monitored with wider spatial scales and higher temporal frequencies than in situ measurements. Being realized the spatial and temporal advantages of satellite derived Chl-a, we have developed a new methodology to preliminarily assess eutrophication status with time series of satellite derived Chl-a. The advantages and limitations of the suggested methodology were then evaluated through comparison with the case study results in each selected sea area obtained under the NOWPAP Common Procedure.
2. Data and method
Since the launch of ADEOS-I satellite with the Japanese Ocean Color and Temperature Sensor (OCTS) in 1996, Chl-a of the world’s oceans have been observed by satellite remote sensing on a regular basis. Following OCTS, NASA launched the Sea-viewing Wide Field-of-view Sensor (SeaWiFS) on board Orbview-2 in 1997 and the Moderate Resolution Imaging Spectroradiometer (MODIS) in 1999 and 2002 on Terra and Aqua satellites, respectively.
We used time series of satellite derived Chl-a from 1997 to 2009, observed by the ocean color satellites, Ocean Color and Temperature Scanner (OCTS) of Japan Aerospace Exploration Agency (JAXA), NASA’s SeaWiFS and the MODIS on board Aqua (MODIS-A), obtained from NASA’s Ocean Color Website (http://oceancolor.gsfc.nasa.gov/). NASA’s Ocean Biology Processing Group (OBPG) reprocessed data for SeaWiFS and MODIS-A from late 2009 to early 2010 to improve the agreement of ocean color products between sensors, and the updated R2009 dataset is currently available. Therefore, the R2009 datasets for SeaWiFS and MODIS-A were used in this study.
Daily, monthly and 13-year overall mean Chl-a for each selected case study area were created by Windows Image Manager software (http://www.wimsoft.com/) from the level two datasets, which provide the best resolution satellite derived Chl-a data available (resolution of 4 km for OCTS, 1.1 km for SeaWiFS and 1 km for MODIS-A). Only the ‘cloud ice’ quality flag was used to exclude unreliable data at the cloud edge. SeaWiFS and MODIS-A data were both available from July 2002 to December 2004, and they were averaged to make a monthly mean Chl-a. A reference value of 5 ug L-1 was used, the lowest limit of the Medium Chl-a condition (5-20 ug L-1) suggested by Bricker et al. (2003). The reference was applied to the 13-year overall mean Chl-a to divide the study area into
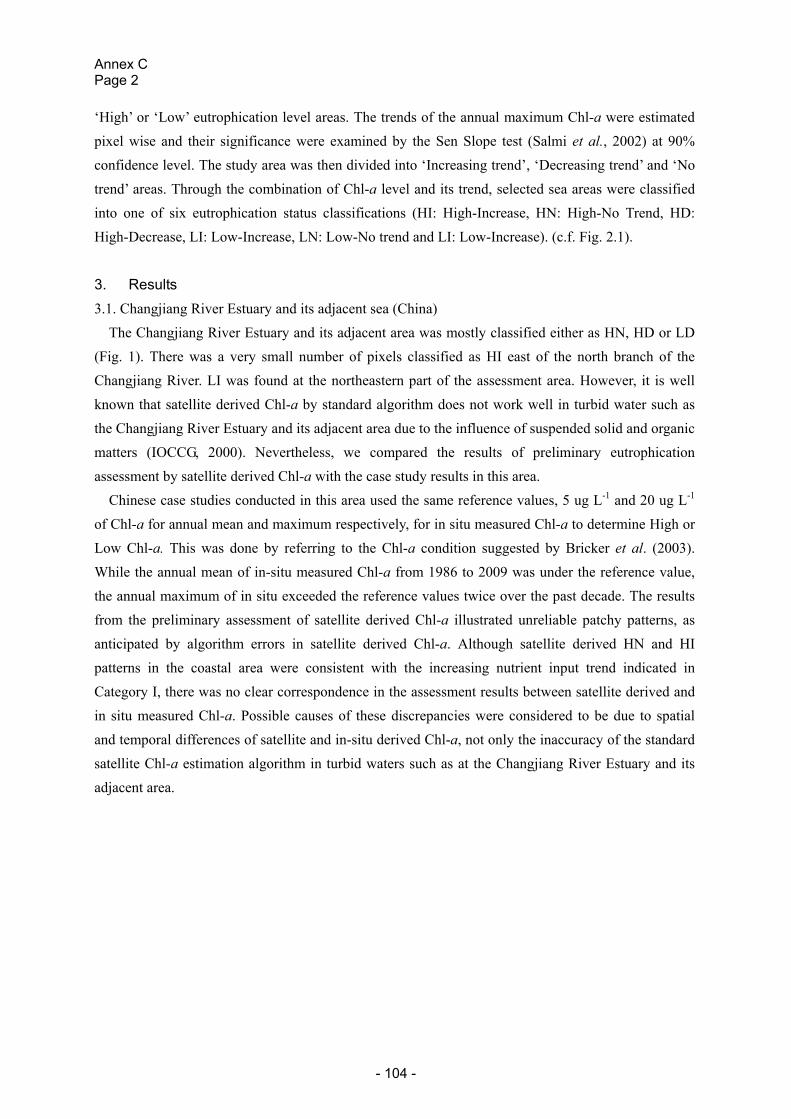
Annex C Page 2
- 104 -
‘High’ or ‘Low’ eutrophication level areas. The trends of the annual maximum Chl-a were estimated pixel wise and their significance were examined by the Sen Slope test (Salmi et al., 2002) at 90% confidence level. The study area was then divided into ‘Increasing trend’, ‘Decreasing trend’ and ‘No trend’ areas. Through the combination of Chl-a level and its trend, selected sea areas were classified into one of six eutrophication status classifications (HI: High-Increase, HN: High-No Trend, HD: High-Decrease, LI: Low-Increase, LN: Low-No trend and LI: Low-Increase). (c.f. Fig. 2.1). 3. Results 3.1. Changjiang River Estuary and its adjacent sea (China)
The Changjiang River Estuary and its adjacent area was mostly classified either as HN, HD or LD (Fig. 1). There was a very small number of pixels classified as HI east of the north branch of the Changjiang River. LI was found at the northeastern part of the assessment area. However, it is well known that satellite derived Chl-a by standard algorithm does not work well in turbid water such as the Changjiang River Estuary and its adjacent area due to the influence of suspended solid and organic matters (IOCCG, 2000). Nevertheless, we compared the results of preliminary eutrophication assessment by satellite derived Chl-a with the case study results in this area.
Chinese case studies conducted in this area used the same reference values, 5 ug L-1 and 20 ug L-1
of Chl-a for annual mean and maximum respectively, for in situ measured Chl-a to determine High or Low Chl-a. This was done by referring to the Chl-a condition suggested by Bricker et al. (2003). While the annual mean of in-situ measured Chl-a from 1986 to 2009 was under the reference value, the annual maximum of in situ exceeded the reference values twice over the past decade. The results from the preliminary assessment of satellite derived Chl-a illustrated unreliable patchy patterns, as anticipated by algorithm errors in satellite derived Chl-a. Although satellite derived HN and HI patterns in the coastal area were consistent with the increasing nutrient input trend indicated in Category I, there was no clear correspondence in the assessment results between satellite derived and in situ measured Chl-a. Possible causes of these discrepancies were considered to be due to spatial and temporal differences of satellite and in-situ derived Chl-a, not only the inaccuracy of the standard satellite Chl-a estimation algorithm in turbid waters such as at the Changjiang River Estuary and its adjacent area.
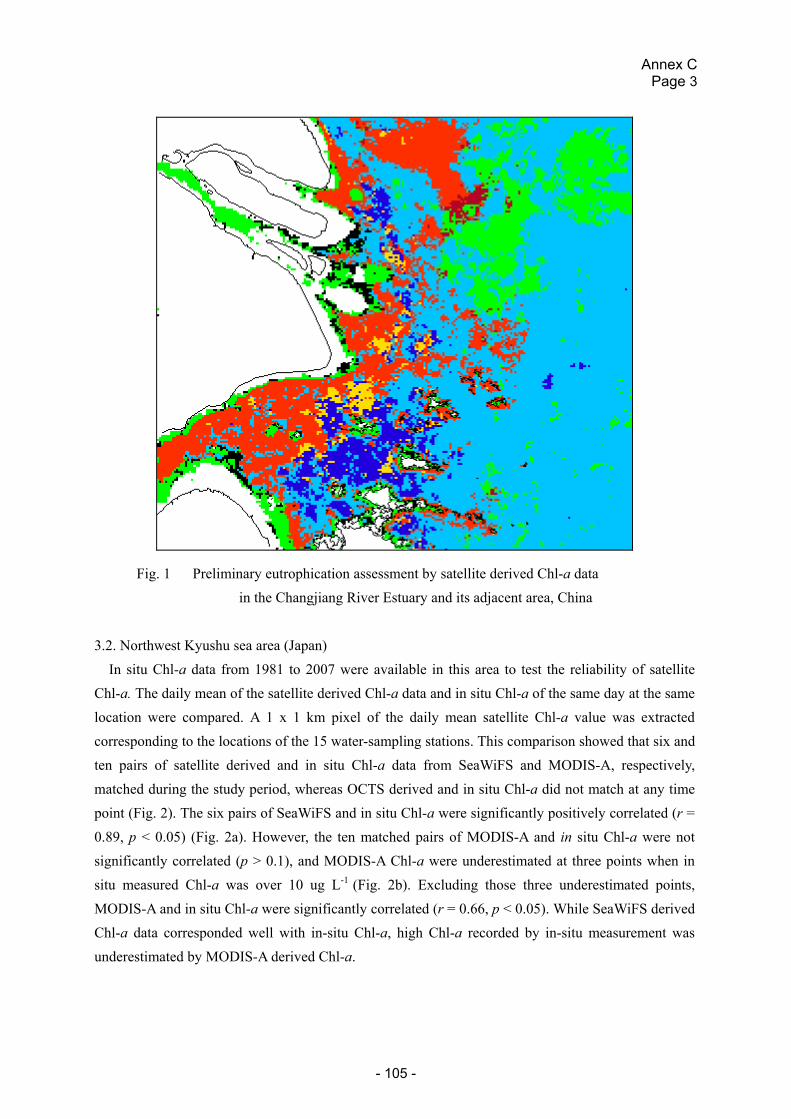
Annex C Page 3
- 105 -
Fig. 1 Preliminary eutrophication assessment by satellite derived Chl-a data in the Changjiang River Estuary and its adjacent area, China
3.2. Northwest Kyushu sea area (Japan)
In situ Chl-a data from 1981 to 2007 were available in this area to test the reliability of satellite Chl-a. The daily mean of the satellite derived Chl-a data and in situ Chl-a of the same day at the same location were compared. A 1 x 1 km pixel of the daily mean satellite Chl-a value was extracted corresponding to the locations of the 15 water-sampling stations. This comparison showed that six and ten pairs of satellite derived and in situ Chl-a data from SeaWiFS and MODIS-A, respectively, matched during the study period, whereas OCTS derived and in situ Chl-a did not match at any time point (Fig. 2). The six pairs of SeaWiFS and in situ Chl-a were significantly positively correlated (r = 0.89, p < 0.05) (Fig. 2a). However, the ten matched pairs of MODIS-A and in situ Chl-a were not significantly correlated (p > 0.1), and MODIS-A Chl-a were underestimated at three points when in situ measured Chl-a was over 10 ug L-1 (Fig. 2b). Excluding those three underestimated points, MODIS-A and in situ Chl-a were significantly correlated (r = 0.66, p < 0.05). While SeaWiFS derived Chl-a data corresponded well with in-situ Chl-a, high Chl-a recorded by in-situ measurement was underestimated by MODIS-A derived Chl-a.
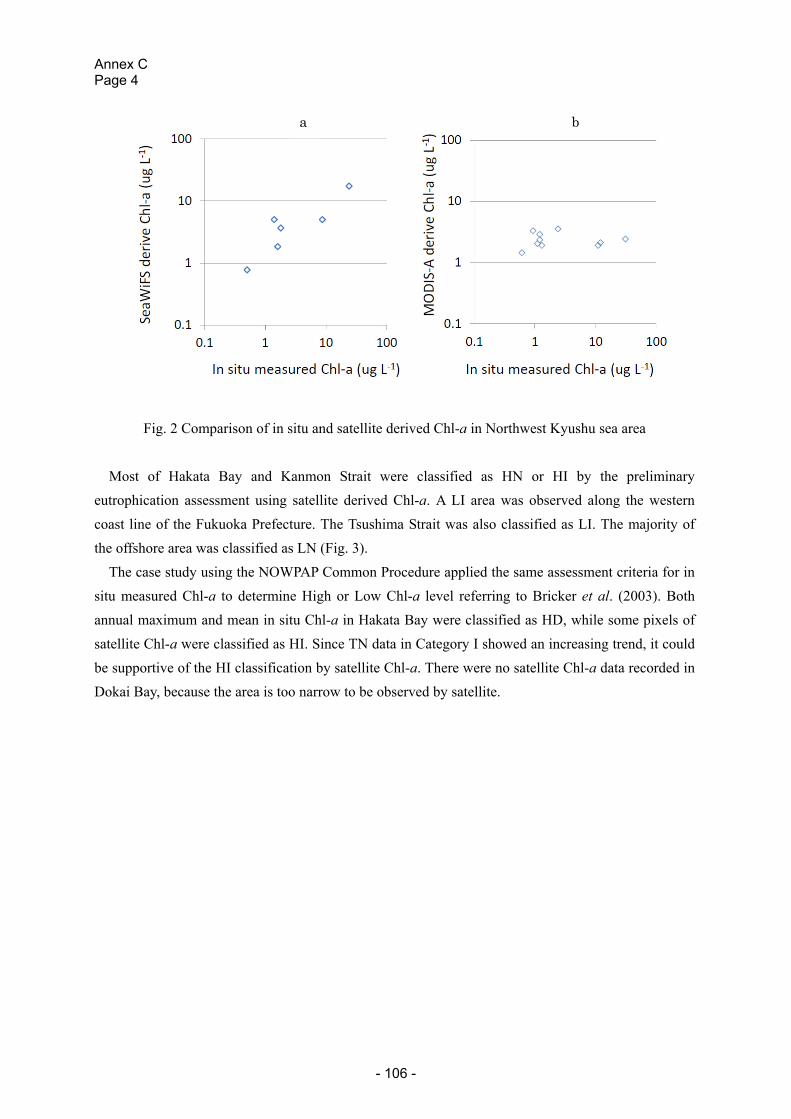
Annex C Page 4
- 106 -
Fig. 2 Comparison of in situ and satellite derived Chl-a in Northwest Kyushu sea area
Most of Hakata Bay and Kanmon Strait were classified as HN or HI by the preliminary eutrophication assessment using satellite derived Chl-a. A LI area was observed along the western coast line of the Fukuoka Prefecture. The Tsushima Strait was also classified as LI. The majority of the offshore area was classified as LN (Fig. 3).
The case study using the NOWPAP Common Procedure applied the same assessment criteria for in situ measured Chl-a to determine High or Low Chl-a level referring to Bricker et al. (2003). Both annual maximum and mean in situ Chl-a in Hakata Bay were classified as HD, while some pixels of satellite Chl-a were classified as HI. Since TN data in Category I showed an increasing trend, it could be supportive of the HI classification by satellite Chl-a. There were no satellite Chl-a data recorded in Dokai Bay, because the area is too narrow to be observed by satellite.
a b
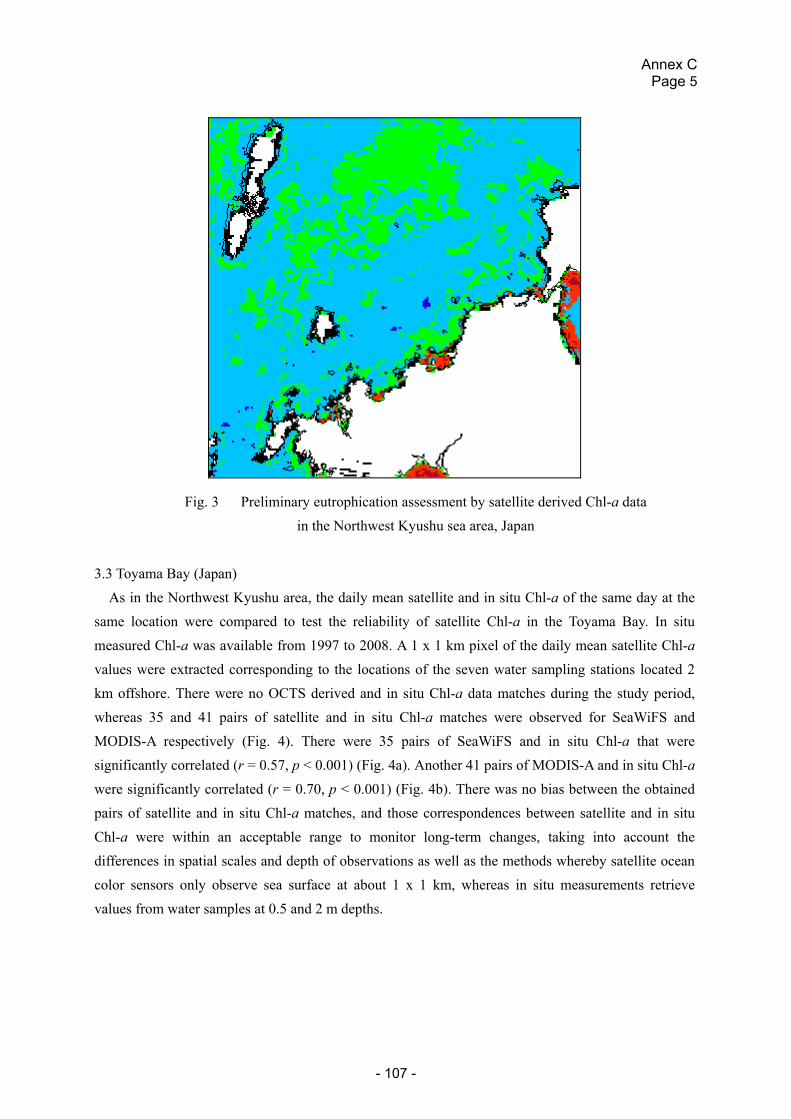
Annex C Page 5
- 107 -
Fig. 3 Preliminary eutrophication assessment by satellite derived Chl-a data in the Northwest Kyushu sea area, Japan
3.3 Toyama Bay (Japan)
As in the Northwest Kyushu area, the daily mean satellite and in situ Chl-a of the same day at the same location were compared to test the reliability of satellite Chl-a in the Toyama Bay. In situ measured Chl-a was available from 1997 to 2008. A 1 x 1 km pixel of the daily mean satellite Chl-a values were extracted corresponding to the locations of the seven water sampling stations located 2 km offshore. There were no OCTS derived and in situ Chl-a data matches during the study period, whereas 35 and 41 pairs of satellite and in situ Chl-a matches were observed for SeaWiFS and MODIS-A respectively (Fig. 4). There were 35 pairs of SeaWiFS and in situ Chl-a that were significantly correlated (r = 0.57, p < 0.001) (Fig. 4a). Another 41 pairs of MODIS-A and in situ Chl-a were significantly correlated (r = 0.70, p < 0.001) (Fig. 4b). There was no bias between the obtained pairs of satellite and in situ Chl-a matches, and those correspondences between satellite and in situ Chl-a were within an acceptable range to monitor long-term changes, taking into account the differences in spatial scales and depth of observations as well as the methods whereby satellite ocean color sensors only observe sea surface at about 1 x 1 km, whereas in situ measurements retrieve values from water samples at 0.5 and 2 m depths.
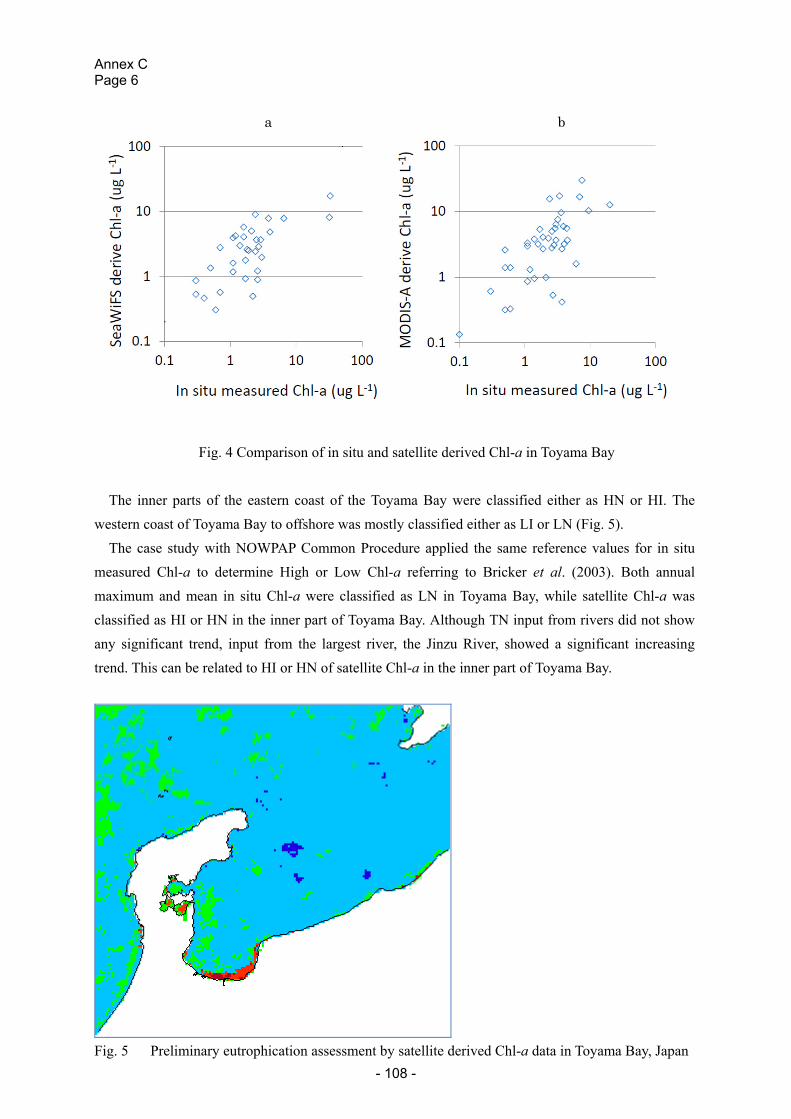
Annex C Page 6
- 108 -
Fig. 4 Comparison of in situ and satellite derived Chl-a in Toyama Bay
The inner parts of the eastern coast of the Toyama Bay were classified either as HN or HI. The western coast of Toyama Bay to offshore was mostly classified either as LI or LN (Fig. 5).
The case study with NOWPAP Common Procedure applied the same reference values for in situ measured Chl-a to determine High or Low Chl-a referring to Bricker et al. (2003). Both annual maximum and mean in situ Chl-a were classified as LN in Toyama Bay, while satellite Chl-a was classified as HI or HN in the inner part of Toyama Bay. Although TN input from rivers did not show any significant trend, input from the largest river, the Jinzu River, showed a significant increasing trend. This can be related to HI or HN of satellite Chl-a in the inner part of Toyama Bay.
Fig. 5 Preliminary eutrophication assessment by satellite derived Chl-a data in Toyama Bay, Japan
a b
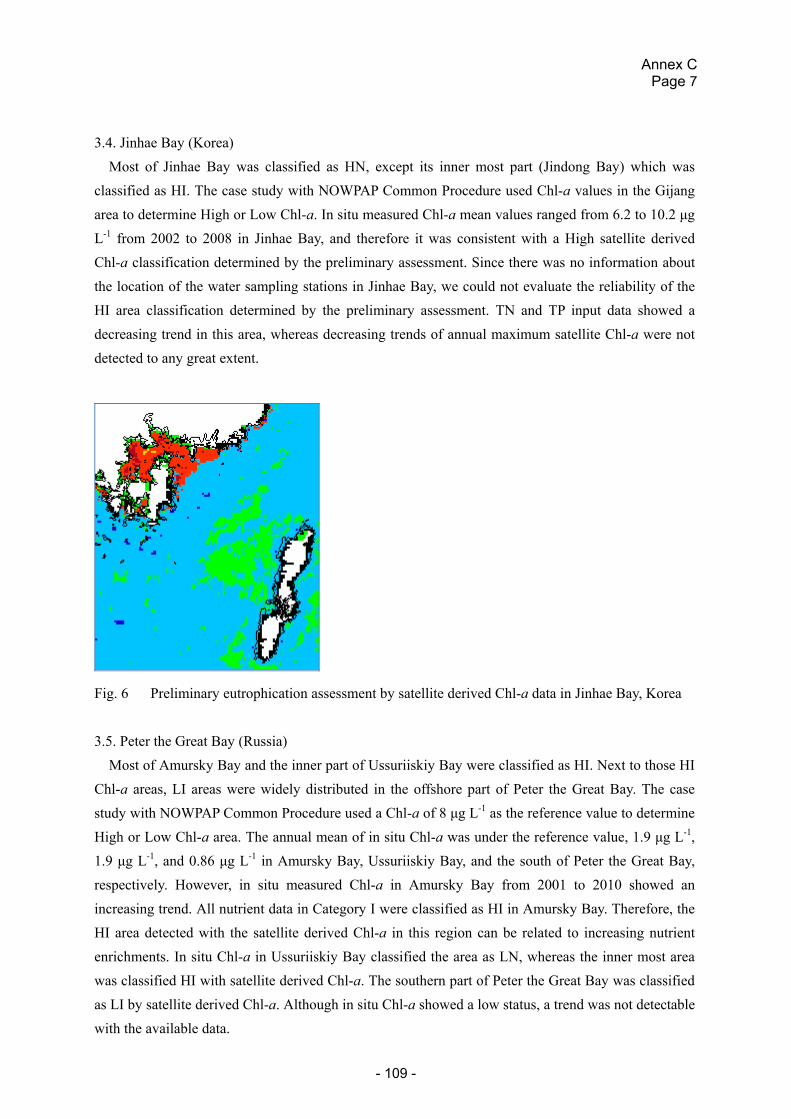
Annex C Page 7
- 109 -
3.4. Jinhae Bay (Korea)
Most of Jinhae Bay was classified as HN, except its inner most part (Jindong Bay) which was classified as HI. The case study with NOWPAP Common Procedure used Chl-a values in the Gijang area to determine High or Low Chl-a. In situ measured Chl-a mean values ranged from 6.2 to 10.2 μg L-1 from 2002 to 2008 in Jinhae Bay, and therefore it was consistent with a High satellite derived Chl-a classification determined by the preliminary assessment. Since there was no information about the location of the water sampling stations in Jinhae Bay, we could not evaluate the reliability of the HI area classification determined by the preliminary assessment. TN and TP input data showed a decreasing trend in this area, whereas decreasing trends of annual maximum satellite Chl-a were not detected to any great extent.
Fig. 6 Preliminary eutrophication assessment by satellite derived Chl-a data in Jinhae Bay, Korea 3.5. Peter the Great Bay (Russia)
Most of Amursky Bay and the inner part of Ussuriiskiy Bay were classified as HI. Next to those HI Chl-a areas, LI areas were widely distributed in the offshore part of Peter the Great Bay. The case study with NOWPAP Common Procedure used a Chl-a of 8 μg L-1 as the reference value to determine High or Low Chl-a area. The annual mean of in situ Chl-a was under the reference value, 1.9 μg L-1, 1.9 μg L-1, and 0.86 μg L-1 in Amursky Bay, Ussuriiskiy Bay, and the south of Peter the Great Bay, respectively. However, in situ measured Chl-a in Amursky Bay from 2001 to 2010 showed an increasing trend. All nutrient data in Category I were classified as HI in Amursky Bay. Therefore, the HI area detected with the satellite derived Chl-a in this region can be related to increasing nutrient enrichments. In situ Chl-a in Ussuriiskiy Bay classified the area as LN, whereas the inner most area was classified HI with satellite derived Chl-a. The southern part of Peter the Great Bay was classified as LI by satellite derived Chl-a. Although in situ Chl-a showed a low status, a trend was not detectable with the available data.
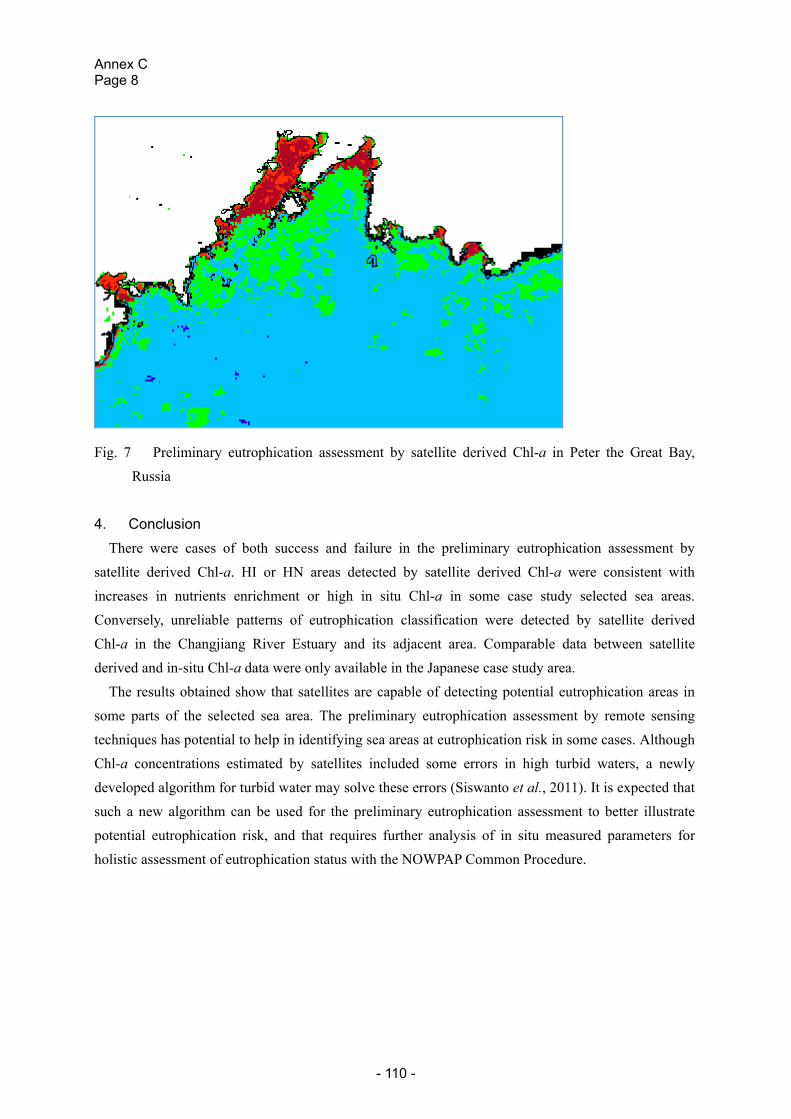
Annex C Page 8
- 110 -
Fig. 7 Preliminary eutrophication assessment by satellite derived Chl-a in Peter the Great Bay, Russia
4. Conclusion
There were cases of both success and failure in the preliminary eutrophication assessment by satellite derived Chl-a. HI or HN areas detected by satellite derived Chl-a were consistent with increases in nutrients enrichment or high in situ Chl-a in some case study selected sea areas. Conversely, unreliable patterns of eutrophication classification were detected by satellite derived Chl-a in the Changjiang River Estuary and its adjacent area. Comparable data between satellite derived and in-situ Chl-a data were only available in the Japanese case study area.
The results obtained show that satellites are capable of detecting potential eutrophication areas in some parts of the selected sea area. The preliminary eutrophication assessment by remote sensing techniques has potential to help in identifying sea areas at eutrophication risk in some cases. Although Chl-a concentrations estimated by satellites included some errors in high turbid waters, a newly developed algorithm for turbid water may solve these errors (Siswanto et al., 2011). It is expected that such a new algorithm can be used for the preliminary eutrophication assessment to better illustrate potential eutrophication risk, and that requires further analysis of in situ measured parameters for holistic assessment of eutrophication status with the NOWPAP Common Procedure.
Annex C Page 9
- 111 -
Reference Bricker, S. B., J. G. Ferreira and T. Simas (2003) An integrated methodology for assessment of
estuarine trophic status. Ecological Modelling, 169, 39-60. Harding, L. W. and E. S. Perry (1997) Long-term increase of phytoplankton biomass in Chesapeake
Bay, 1950-1994. Marine Ecology Progress Series, 157, 39-52. IOCCG (2000) Remote sensing of ocean colour in coastal, and other optically-complex, waters.
Sathyendranath, S. (ed.), Reports of the International Ocean-Colour Coordination Group, No. 3, IOCCG, Dartmouth, Canada.
NOWPAP CEARAC (2009) Procedures for the assessment of eutrophication status including evaluation of
land-based sources of nutrients for the NOWPAP region. Salmi, T., A. Määttä, P. Antika, T. Ruoho-Airola, and T. Amnell (2002) Detecting trends of annual values
of atmospheric pollutions by the Mann-Kendall test and Sen’s slope estimates -The Excel template
application MAKESENS-. Finnish Meteorological Institute, 35pp, Helsinki.
Siswanto, E., J. H. Tang, Y. Yamaguchi, Y.-H. Ahn, J. Ishizaka, S. Yoo, S.-W. Kim, Y. Kiyomoto, K. Yamada, C. Chiang, and H. Kawamura (2011) Empirical ocean color algorithms to retrieve chlorophyll-a, total suspended matter, and colored dissolved organic matter absorption coefficient in the Yellow and East China Seas. Journal of Oceanography, doi:10.1007/s10872-011-0062-z.
Integrated Report on Eutrophication Assessment in Selected Sea Areas
in the NOW
PAP Region: Evaluation of the NOW
PAP Comm
on ProcedureN
OW
PA
P C
EA
RA
C