predictability of seabed change due to underwater sand mining in coastal waters of korea
DESCRIPTION
2006ROMS/TOMS Europe Nov 6-8, 2006 Alcala De Henares Spain. Predictability of Seabed Change due to Underwater Sand Mining in Coastal Waters of Korea Chang S. Kim, Hak Soo Lim and Jinah Kim Korea Ocean R&D Institute Coastal Engineering Division 1270 Sa2Dong Ansan 426-744 South Korea. - PowerPoint PPT PresentationTRANSCRIPT
Predictability of Seabed Change due to UnderwaPredictability of Seabed Change due to Underwater Sand Mining in Coastal Waters of Korter Sand Mining in Coastal Waters of Koreaea
Chang S. Kim, Hak Soo Lim and Jinah KimChang S. Kim, Hak Soo Lim and Jinah Kim
Korea Ocean R&D InstituteKorea Ocean R&D InstituteCoastal Engineering DivisionCoastal Engineering Division
1270 Sa2Dong Ansan 426-744 South Korea.1270 Sa2Dong Ansan 426-744 South Korea.
[email protected]@kordi.re.kr
2006ROMS/TOMS Europe Nov 6-8, 2006
Alcala De Henares Spain
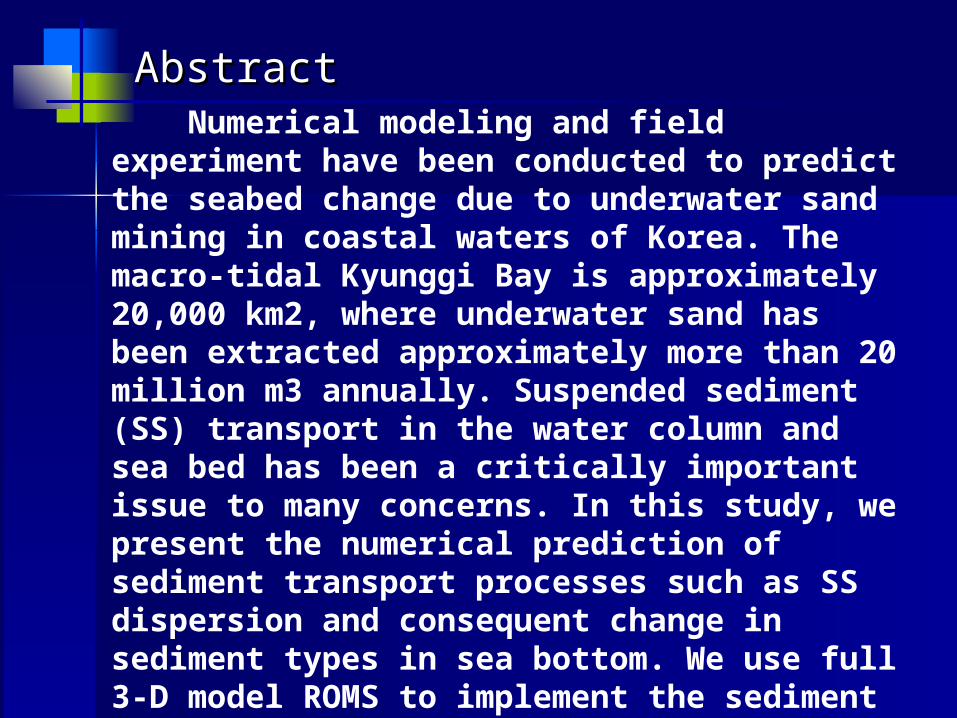
AbstractAbstract Numerical modeling and field experiment have been conducted to predict the seabed change due to underwater sand mining in coastal waters of Korea. The macro-tidal Kyunggi Bay is approximately 20,000 km2, where underwater sand has been extracted approximately more than 20 million m3 annually. Suspended sediment (SS) transport in the water column and sea bed has been a critically important issue to many concerns. In this study, we present the numerical prediction of sediment transport processes such as SS dispersion and consequent change in sediment types in sea bottom. We use full 3-D model ROMS to implement the sediment dynamics by adopting the extensively observed field data associated with modeling inputs and model validation.

Seabed Sand Mining Area Seabed Sand Mining Area in Kyunggi Bay, Koreain Kyunggi Bay, Korea
(Songap)선갑(Pungdo)풍도 (Kukwado)국화도(Paega)백아
(Kurop)굴업 (Tokchok)덕적 (Yonghung)영흥
(Yigok)이곡
8 8
44
66
77
11
22
33
55
99
283858688898283858688898
243454648494243454648494
263656668696263656668696
273757678797273757678797
103040607090103040607090
21315161819121
3151618191
223252628292223252628292
233353638393233353638393
253555658595253555658595
293959698999293959698999
48 7878 184818
72 72
71
80 80
77 77
76 76
74 74
7373
7575
7979
14441444
16461646
17471747
20502050
114111
4112421242
13431343
15451545
19491949
148 118128148118128
114124144114124144
116126146116126146
117127147117127147
100120130150100120130150
111121141111121141
112122142112122142
113123143113123143
115125145115125145
119129149119129149
138 108138108
104134104134
106136106136
107137107137
110140110140
101131101131
102132102132
103133103133
105135105135
109139109139
3 333
2222
4444
9999
1111
2222
5555
7777
9999
1111
3333
5555
6666
7777
8888
4444
6666
8888
43 33433343334333
3242324232423242
3444344434443444
3949394939493949
3141314131413141
3242324232423242
3545354535453545
3747374737473747
3949394939493949
3141314131413141
3343334333433343
3545354535453545
3646364636463646
3747374737473747
3848384838483848
4050405040504050
3444344434443444
3646364636463646
3848384838483848
4050405040504050
1323637383132363738313236373831323637383 5393539353935393
15
1222627282122262728212226272821222627282
1424647484142464748414246474841424647484
1929697989192969798919296979891929697989
1121617181112161718111216171811121617181
1222627282122262728212226272821222627282
1525657585152565758515256575851525657585
17276777871727677787172767778717276777
19
16
296979891929
60 60 60 60
98 58 98 58 98 58 98 58
96 56 96 56 96 56 96 56
94 54 94 54 94 54 94 54
60 60 60 60
98 58 98 58 98 58 98 58
97 57 97 57 97 57 97 57
96 56 96 56 96 56 96 56
95 55 95 55 95 55 95 55
93 53 93 53 93 53 93 53
91 51 91 51 91 51 91 51
99 59 99 59 99 59 99 59
97 57 97 57 97 57 97 57
95 55 95 55 95 55 95 55
92 52 92 52 92 52 92 52
91 51 91 51 91 51 91 51
99 59 99 59 99 59 99 59
94 54 94 54 94 54 94 54
92 52 92 52 92 52 92 52
90 80 70 30 20 10 90 80 70 30 20 10 90 80 70 30 20 10 90 80 70 30 20 10
88 78 68 28 18 88 78 68 28 18 88 78 68 28 18 88 78 68 28 18
86 76 66 26
69
86 76 66 26 16 86 76 66 26 16 86 76 66 26 16
84 74 64 24 14 84 74 64 24 14 84 74 64 24 14 84 74 64 24 14
90 80 70 30 20 10 90 80 70 30 20 10 90 80 70 30 20 10 90 80 70 30 20 10
88 78 68 28 18 88 78 68 28 18 88 78 68 28 18 88 78 68 28 18
87 77 67 27 17 87 77 67 27 17 87 77 67 27 17 87 77 67 27 17
86 76 66 26 16 86 76 66 26 16 86 76 66 26 16 86 76 66 26 16
85 75 65 25 15 85 75 65 25
87
85 75 65 25 15 85 75 65 25 15
83 73 63 23 13 83 73 63 23 13 83 73 63 23 13 83 73 63 23 13
81 71 61 21 11 81 71 61 21 11 81 71 61 21 11 81 71 61 21 11
89 79 69 29 19 89 79 69 29 19 89 79
123 113113113113 123123123
124
112112112112
114114114114
119119119119
111111111111
112112112112
115115115115
117117117117
119119119119
111111111111
113113113113
115115115115
116116116116
117117117117
118118118118
120120120120
114114114114
116116116116
118118118118
120120120120
122122122122
124124124124
129129129129
121121121121
122122122122
125125125125
127127127127
129129129129
121121121121
123123123123
125125125125
126126126126
127127127127
128128128128
130130130130
124124124
126126126126
128128128128
130130130130
103133143103133143103133143103133143
102132142102132142102132142102132142
104134144104134144104134144104134144
109139149109139149109139149109139149
101131141101131141101131141101131141
102132142102132142102132142102132142
105135145105135145105135145105135145
107137147107137147107137147107137147
109139149109139149109139149109139149
101131141101131141101131141101131141
103133143103133143103133143103133143
105135145105135145105135145105135145
106136146106136146106136146106136146
107137147107137147107137147107137147
108138148108138148108138148108138148
110140150110140150110140150110140150
104134144104134144104134144104134144
106136146106136146106136146106136146
108138148108138148108138148108138148
110140150110140150110140150110140150
100100100100
100100100100
Depth (m)

Numerical Model Grid for Kyunggi Bay
125.4 125.6 125.8 126.0 126.2 126.4 126.6 126.8 127.0
36.8
37.0
37.2
37.4
37.6
37.8
38.0
125.4 125.6 125.8 126.0 126.2 126.4 126.6 126.8 127.0
36.8
37.0
37.2
37.4
37.6
37.8
38.0
INCHEON
TAEAN
LA
TIT
UD
E(N
)
LONGITUDE (E)
125.75 126.00 126.25 126.50
-40
-30
-20
-10
0
DE
PT
H(M
)LONGITUDE (E)
VERTICAL STRUCTURE
Curvilinear Orthogonal Grid
Terrain-Following Vertical Grid(20 arrays)
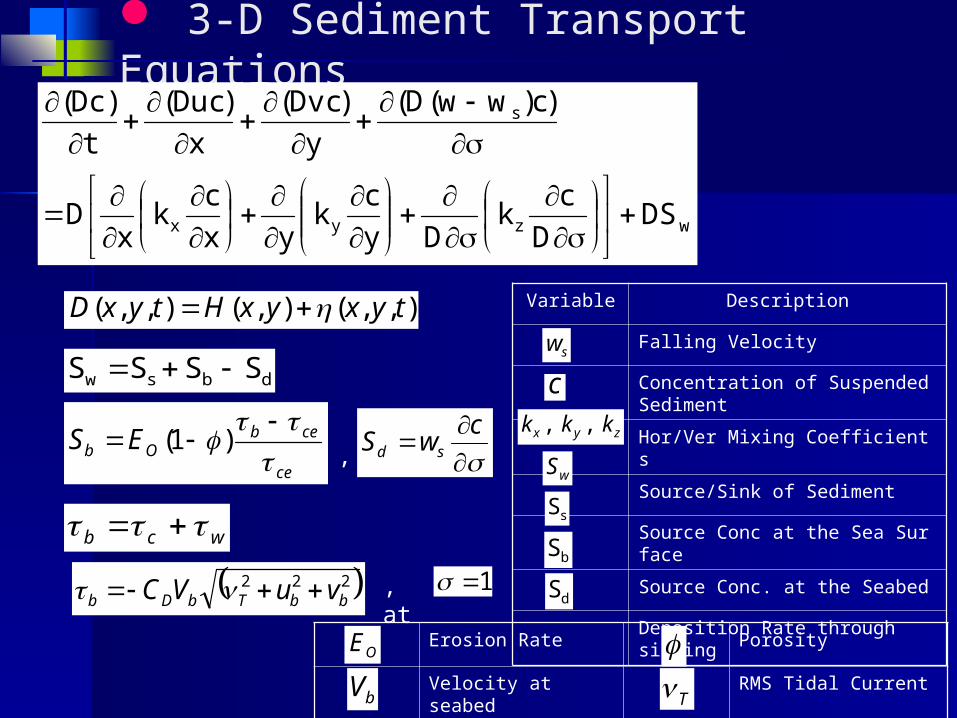
3-D Sediment Transport Equations
wzyx
s
DSD
ck
Dy
ck
yx
ck
xD
)c)ww(D(
y
)Dvc(
x
)Duc(
t
)Dc(
Variable Description
Falling Velocity
Concentration of Suspended Sediment
Hor/Ver Mixing Coefficients
Source/Sink of Sediment
Source Conc at the Sea Surface
Source Conc. at the Seabed
Deposition Rate through sinking
),,(),(),,( tyxyxHtyxD
c
zyx kkk ,,
wS
sS
sw
bS
dS
dbsw SSSS
ce
cebOb ES
)1(
222bbTbDb vuVC
c
wS sd
1, at
Erosion Rate Porosity
Velocity at seabed RMS Tidal Current
OE
,
wcb
bV T
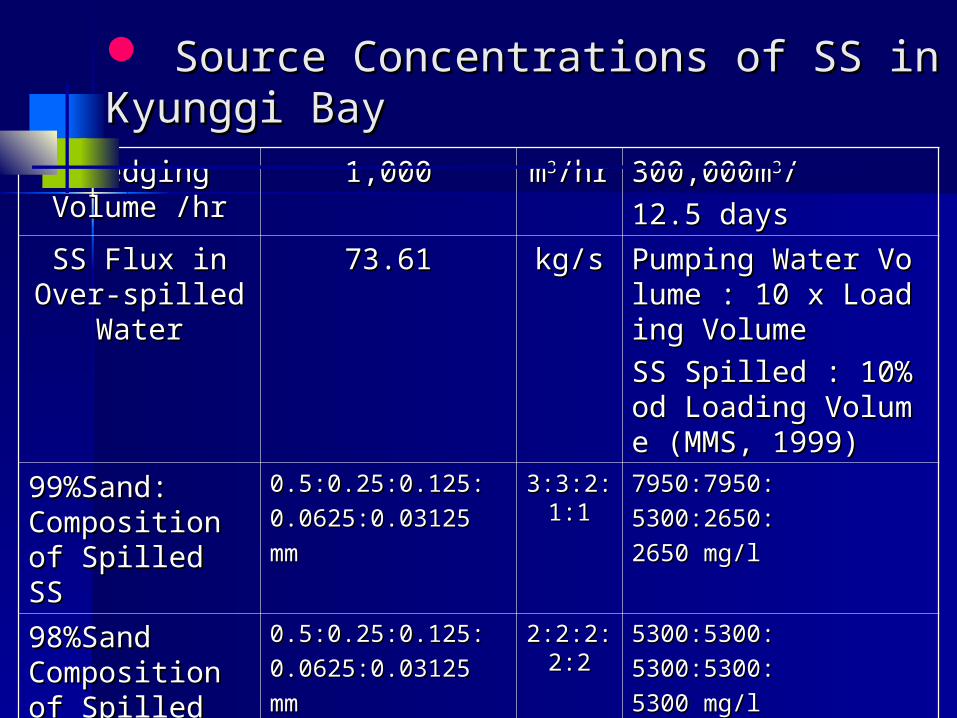
Source Concentrations of SS in Source Concentrations of SS in Kyunggi BayKyunggi Bay
Dredging Dredging Volume /hrVolume /hr
1,0001,000 mm33/hr/hr 300,000m300,000m33//
12.5 days12.5 days
SS Flux in Over-SS Flux in Over-spilled Waterspilled Water
73.6173.61 kg/skg/s Pumping Water VolumPumping Water Volume : 10 x Loading Volue : 10 x Loading Volumeme
SS Spilled : 10% od LSS Spilled : 10% od Loading Volume (MMS, oading Volume (MMS, 1999)1999)
99%Sand: 99%Sand: Composition of Composition of Spilled SSSpilled SS
0.5:0.25:0.125:0.5:0.25:0.125:
0.0625:0.031250.0625:0.03125
mmmm
3:3:2:1:3:3:2:1:11
7950:7950:7950:7950:
5300:2650:5300:2650:
2650 mg/l2650 mg/l
98%Sand 98%Sand Composition of Composition of Spilled SSSpilled SS
0.5:0.25:0.125:0.5:0.25:0.125:
0.0625:0.031250.0625:0.03125
mmmm
2:2:2:2:2:2:2:2:22
5300:5300:5300:5300:
5300:5300:5300:5300:
5300 mg/l5300 mg/l
Volume =3,000,000 m3 / 12.5day
Ø1:Ø2:Ø3:Ø4:Ø5 = 2:2:2:2:2
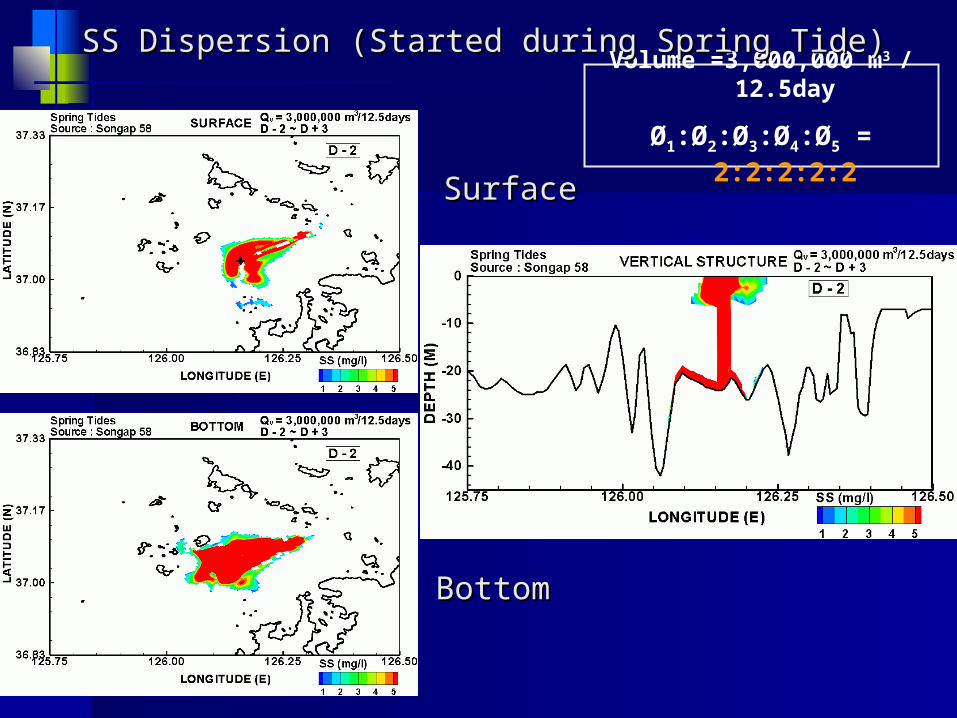
SS Dispersion (Started during Spring Tide)SS Dispersion (Started during Spring Tide)
BottomBottom
SurfaceSurface
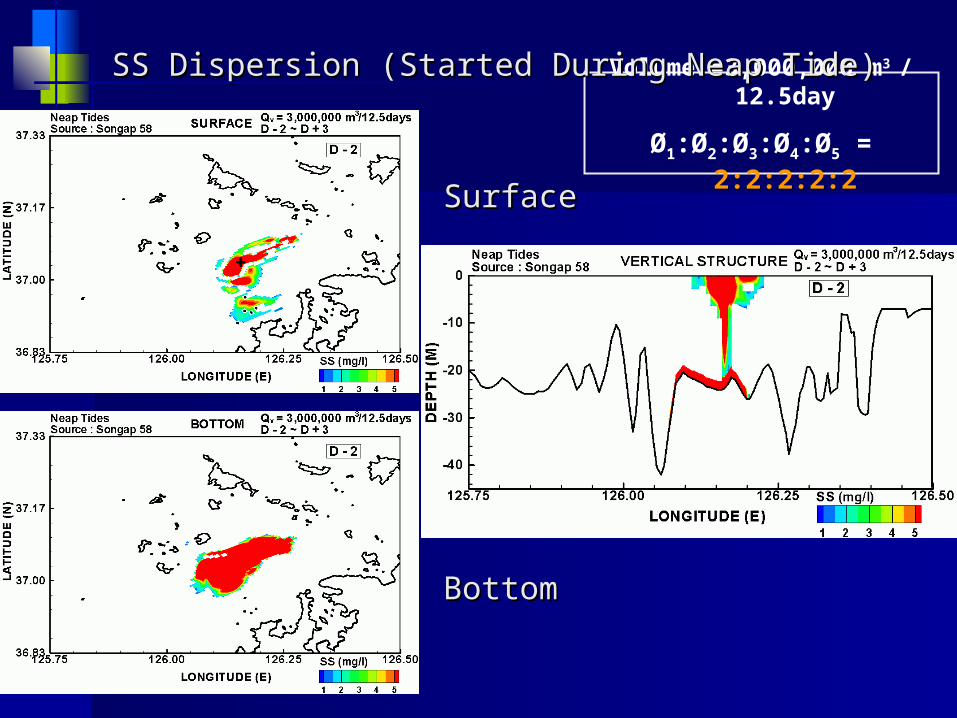
Volume =3,000,000 m3 / 12.5day
Ø1:Ø2:Ø3:Ø4:Ø5 = 2:2:2:2:2
SS Dispersion (Started During Neap Tide)SS Dispersion (Started During Neap Tide)
BottomBottom
SurfaceSurface
126.22 126.23 126.24 126.2537.09
37.10
37.11
37.12
LA
TIT
UD
E(N
)
LONGITUDE (E)
2001.10.12 16:00
BC
A
505
SURFACE
126.22 126.23 126.24 126.2537.09
37.10
37.11
37.12
LA
TIT
UD
E(N
)
LONGITUDE (E)
2001.10.12 18:00
BC
A5
5
SURFACE
126.22 126.23 126.24 126.2537.09
37.10
37.11
37.12
LA
TIT
UD
E(N
)
LONGITUDE (E)
2001.10.12 20:00
BC
A
5
5
SURFACE
5
126.22 126.23 126.24 126.2537.09
37.10
37.11
37.12
LA
TIT
UD
E(N
)
LONGITUDE (E)
2001.10.12 14:00 ~16:00
A
BC
4.3mg/l
89.0mg/l
: Barge C
9.5mg/l4.6mg/l
16.1mg/l
A
6.9mg/l
CB
: Barge A: Barge B
4.2mg/l
48.3mg/l
7.3mg/l
7.0mg/l
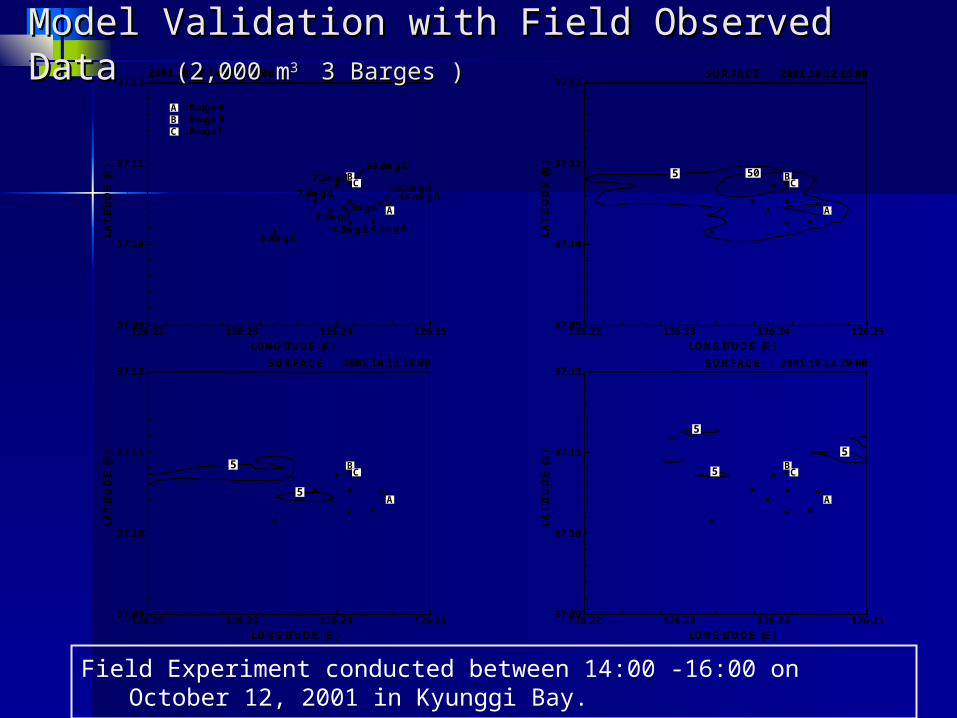
Field Experiment conducted between 14:00 -16:00 on October 12, 2001 in Kyunggi Bay.
Model Validation with Field Observed DataModel Validation with Field Observed Data (2,000 m (2,000 m3 3 3 3 Barges )Barges )

Vertical Profiles of SS Concentration Observed and Simulated for 14:00-16:00 on October12, 2001 in Kyunggi Bay.
Comparison of Model Results and Field Comparison of Model Results and Field Observed DataObserved Data

Tidal current of 0.5 m/s Extractuin Volume 300,000 m3
15 20 25 30 355
10
15
X (km)
Y (km)
SS (mg/l)
BOTTOMTidal Current = 0.5 m/sQ = 300,000 m /12.5daysD + 1
3v
5
1Ø3
+
15 20 25 30 355
10
15
X (km)
Y (km)
SS (mg/l)
BOTTOMTidal Current = 0.5 m/sQ = 300,000 m /12.5daysD + 1
3v
51
1
15
1
Ø4
+
15 20 25 30 355
10
15
X (km)
Y (km)
SS (mg/l)
BOTTOMTidal Current = 0.5 m/sQ = 300,000 m /12.5daysD + 1
3v
1
Ø5
+
15 20 25 30 355
10
15
1 2 3 4 5
X (km)
Y (km)
SS (mg/l)
BOTTOMTidal Current = 0.5 m/sQ = 300,000 m /12.5daysD + 1
3v
∑Ø
+
SS Redistribution at Seabed Based on Particle Size SS Redistribution at Seabed Based on Particle Size (Model Results)(Model Results)
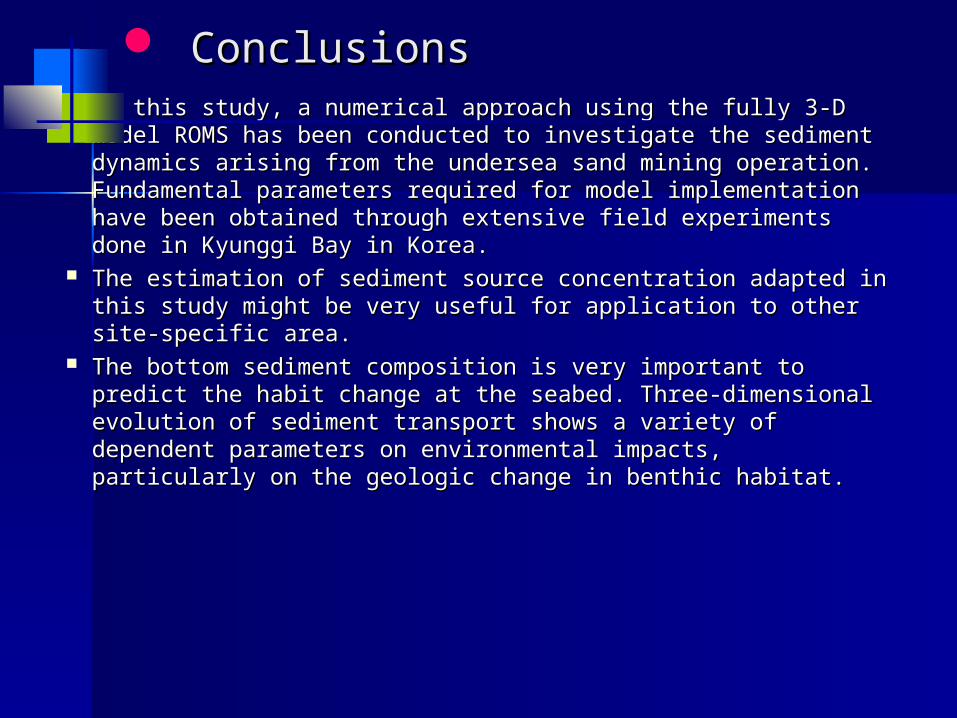
ConclusionsConclusions In this study, a numerical approach using the fully 3-D model ROMS In this study, a numerical approach using the fully 3-D model ROMS
has been conducted to investigate the sediment dynamics arising has been conducted to investigate the sediment dynamics arising from the undersea sand mining operation. Fundamental parameters from the undersea sand mining operation. Fundamental parameters required for model implementation have been obtained through required for model implementation have been obtained through extensive field experiments done in Kyunggi Bay in Korea. extensive field experiments done in Kyunggi Bay in Korea.
The estimation of sediment source concentration adapted in this The estimation of sediment source concentration adapted in this study might be very useful for application to other site-specific area. study might be very useful for application to other site-specific area.
The bottom sediment composition is very important to predict the The bottom sediment composition is very important to predict the habit change at the seabed. Three-dimensional evolution of habit change at the seabed. Three-dimensional evolution of sediment transport shows a variety of dependent parameters on sediment transport shows a variety of dependent parameters on environmental impacts, particularly on the geologic change in environmental impacts, particularly on the geologic change in benthic habitat. benthic habitat.