precision vs flexibility in gpcr...
TRANSCRIPT
Precision vs Flexibility in GPCR signalingMatthias Elgeti,*,† Alexander S. Rose,† Franz J. Bartl,†,‡ Peter W. Hildebrand,† Klaus-Peter Hofmann,*,†,‡
and Martin Heck†
†Institut fur Medizinische Physik und Biophysik (CC2), Charite-Universitatsmedizin Berlin, Chariteplatz 1, 10117 Berlin, Germany‡Zentrum fur Biophysik und Bioinformatik, Humboldt-Universitat zu Berlin, Invalidenstrasse 42, 10115 Berlin, Germany
*S Supporting Information
ABSTRACT: The G protein coupled receptor (GPCR)rhodopsin activates the heterotrimeric G protein transducin(Gt) to transmit the light signal into retinal rod cells. Therhodopsin activity is virtually zero in the dark and jumps bymore than one billion fold after photon capture. Such perfectswitching implies both high fidelity and speed of rhodopsin/Gtcoupling. We employed Fourier transform infrared (FTIR)spectroscopy and supporting all-atom molecular dynamics(MD) simulations to study the conformational diversity ofrhodopsin in membrane environment and extend the staticpicture provided by the available crystal structures. The FTIRresults show how the equilibria of inactive and active proteinstates of the receptor (so-called metarhodopsin states) are regulated by the highly conserved E(D)RY and Yx7K(R) motives. TheMD data identify an intrinsically unstructured cytoplasmic loop region connecting transmembrane helices 5 and 6 (CL3) andshow how each protein state is split into conformational substates. The C-termini of the Gtγ- and Gtα-subunits (GαCT andGγCT), prepared as synthetic peptides, are likely to bind sequentially and at different sites of the active receptor. The peptideshave different effects on the receptor conformation. While GγCT stabilizes the active states but preserves CL3 flexibility, GαCTselectively stabilizes a single conformational substate with largely helical CL3, as it is found in crystal structures. Based on theseresults we propose a mechanism for the fast and precise signal transfer from rhodopsin to Gt, which assumes a stepwise andmutual reduction of their conformational space. The mechanism relies on conserved amino acids and may therefore underlieGPCR/G protein coupling in general.
■ INTRODUCTION
G protein coupled receptors (GPCRs) receive signals from avariety of extracellular ligands and transmit them to intracellularG proteins. Ligands include activating agonists and deactivatinginverse agonists. In their agonist-bound active state, GPCRscatalyze the exchange of GDP for GTP in the α-subunit ofheterotrimeric G proteins.1 In the GTP-bound active form, theGαβγ holoprotein dissociates and the Gα- and Gβγ-subunitscouple to intracellular effectors thereby triggering varioussignaling pathways. In the past decade crystal structures ofseveral GPCRs were solved providing a molecular picture ofdifferent receptor states, including inactive conformationsbound to inverse agonists and structures which are supposedto represent the active, G protein activating conformation.2
These active structures exhibit gross structural changescompared to the inactive ones and bind agonistic ligands, Gprotein, fragments of the Gα-subunit or nanobodies (see ref 3).The major prerequisite of an active GPCR is an outward tiltedtransmembrane helix 6 (TM6) which was first identified bypioneering EPR work with the retinal photoreceptor rhodop-sin,4,5 an archetype of class A GPCRs. In contrast to otherGPCRs, rhodopsin bears its light-sensitive ligand, retinal,covalently bound by a protonated Schiff base. The absorption
of a photon induces 11-cis-/all-trans-retinal isomerization andswitches the ligand from an inverse agonist to a potent agonist.The subsequent activating adjustments in the protein culminatein coupled equilibria between inactive and active states of thereceptor, the so-called metarhodopsin states. Eventually, light-activated rhodopsin decays by hydrolysis of the Schiff base anddissociation of all-trans-retinal, leaving the opsin apoprotein.Opsin exhibits, like metarhodopsin, active and inactive states inequilibrium. Because the metarhodopsin and opsin states havestructural equivalents in other GPCRs,6,7 it can be concludedthat rhodopsin shares, after the actual photoactivation phase,important properties with GPCRs binding diffusible ligands.A key region for the coupling of rhodopsin with the G
protein transducin (Gt) is the third cytoplasmic loop (CL3)connecting TM5 and TM6 and located adjacent to theconserved E(D)RY motif.8−10 In the crystal structures ofmost GPCRs in their inactive conformation CL3 is a longprotein segment with high flexibility, as indicated by hightemperature factors or lack of electron density. Thus, in manyGPCR structures CL3 is truncated or substituted by a fusion
Received: May 22, 2013Published: July 24, 2013
Article
pubs.acs.org/JACS
© 2013 American Chemical Society 12305 dx.doi.org/10.1021/ja405133k | J. Am. Chem. Soc. 2013, 135, 12305−12312
protein to minimize its flexibility.11 In contrast, CL3 appearsmore structured in all crystal structures of active GPCRs withbound G protein (or mimicking fragments), even though inGPCRs exhibiting longer CL3, e.g., in the β2-adrenergicreceptor, it remains partially unresolved.12,13 CL3 is thereforea strong candidate to represent an intrinsically disorderedprotein region. Such regions become ordered only uponbinding to interacting partners and have high functionalrelevance for binding and regulation in various biologicalsystems.14 The question arises of how far the high flexibility ofCL3 is exploited for G protein coupling, i.e., binding andactivation.In the present study we performed FTIR difference
spectroscopy of the photoreceptor rhodopsin in the absenceor presence of interacting peptide fragments of two G proteinkey binding sites (C-termini of Gtα and Gtγ). Using a noveltitration approach we identify the binding modes of the two Gtfragments and provide support for the existence of differentbinding sites. Site-directed mutagenesis indicates a structuraltransition of CL3 which appears to be triggered by interactionwith the C-terminus of Gtα (GαCT), while the C-terminus ofGtγ (GγCT) does not influence this region. All-atom moleculardynamics (MD) simulations using rhodopsin crystal structuresas templates support the notion of high CL3 flexibility in allreceptor states except when GαCT peptide is bound. Wepropose a mechanism of GPCR/G protein coupling employingtwo different interaction modes of rhodopsin with GαCT andGγCT peptide, respectively. In agreement with our previouslyproposed “sequential fit” model, the actual coupling with the Gtholoprotein would first employ interaction with the Gtγsubunit. This interaction directs the holoprotein such that themore specific interaction with Gtα can readily occur, eventuallyleading to the release of GDP and nucleotide exchange.
■ EXPERIMENTAL SECTIONFTIR Spectroscopy. Rhodopsin in washed membranes was
prepared from frozen bovine retinae (W.L. Lawson Company,U.S.A.) using a protocol similar to ref 15. Membrane pellets wereobtained after pH adjustment by centrifugation at 10 000 g, Gt-derivedpeptides (GαCT 340-350, IKENLKDCGLF and GαCT2 340-350,ILENLKDCGLF synthesized by Selleck chemical, and farnesylatedGγCT 60-71, DKNPFKELKGGC-far and nonbinding GγCT 60-71,DKNPAKEAKGGC-far,16 synthesized by Dr. Petra Henklein, Institutfur Biochemie, Charite, Berlin) were added before centrifugation.K231A mutant and wild-type (WT) receptor reconstituted in lipidvesicles were prepared as described.17 Time-dependent FTIRdifference spectra were recorded on an ifs66v/s FTIR spectrometer(Bruker, Ettlingen, Germany) equipped with a MCT detector. Rawdata were processed in self-written MATLAB routines comprisingbaseline correction, singular value decomposition, matrix rotation, andglobal fitting.18 See the SI Methods section for in-depth description ofthe spectroscopic and analytic techniques.MD Simulations. Three different models were prepared based on
the crystal structures of rhodopsin dark state (pdb 1U19) and theopsin/GαCT complex (3DQB). Rhodopsin dark state serves asreference of an inactive GPCR, while active opsin contains all grossstructural features of the active conformation, e.g., the prominentoutward tilt of TM6.19 The palmitoylated receptors were equilibratedin a DMPC lipid bilayer, and three 200−400 ns nonbiased all-atomMD simulations were performed, each set starting from the sameinitial model. Subsequent cluster analysis regarding the residues 224−252 from CL3 was performed with a 2 Å root-mean-square deviation(RMSD). Further information on in silico preparation, simulationprotocols, and cluster analysis is found in the SI.
■ RESULTS
Conformational Diversity of the Agonist-BoundReceptor. In the following we use the three step equilibriumscheme of metarhodopsin states to describe the diversity ofagonist-bound receptor conformations. These equilibria arereached within milliseconds after illumination of dark staterhodopsin in native membranes, with a distribution thatstrongly depends on pH and temperature.20
Previous work has shown that the metarhodopsin statesexhibit distinct FTIR characteristics. For formation ofmetarhodopsin I (MI), infrared spectroscopy using azidoprobes21 has revealed only slight rearrangements of the 7TMbundle with respect to dark-state rhodopsin. The subsequentformation of MIIa involves deprotonation of the retinal Schiffbase linkage and formation of a new hydrogen bond of thecarboxyl side chain of D832.50 (Ballesteros-Weinstein number-ing, transmembrane residues are assigned two numbers X.Y,where X is the belonging helix and Y the number relative to themost conserved residue in this TM, which is assigned 50. Weuse H8 or CL3 for residues of helix 8 and third cytoplasmicloop, respectively) located in the Schiff base vicinity. This isreflected by an arising FTIR difference band at 1768/1752cm−1, meaning that the vibration shifts from 1768 cm−1 (darkstate) to 1752 cm−1 in MIIa.22 MIIb formation is accompaniedby large difference bands in the amide I (∼1650 cm−1) andamide II (∼1550 cm−1) regions and at 1745/1727 cm−1. Thelatter mirrors the reorganization of the important TM3/TM5hydrogen-bond network involving the side chain of E1223.37.23
This difference band marks the rotational outward tilt of TM6,which is a prerequisite of a G protein activating receptorconformation. The subsequent formation of MIIbH+ is“spectroscopically silent”, i.e., not coupled to conformationalchanges large enough to give rise to distinct FTIR bands.20
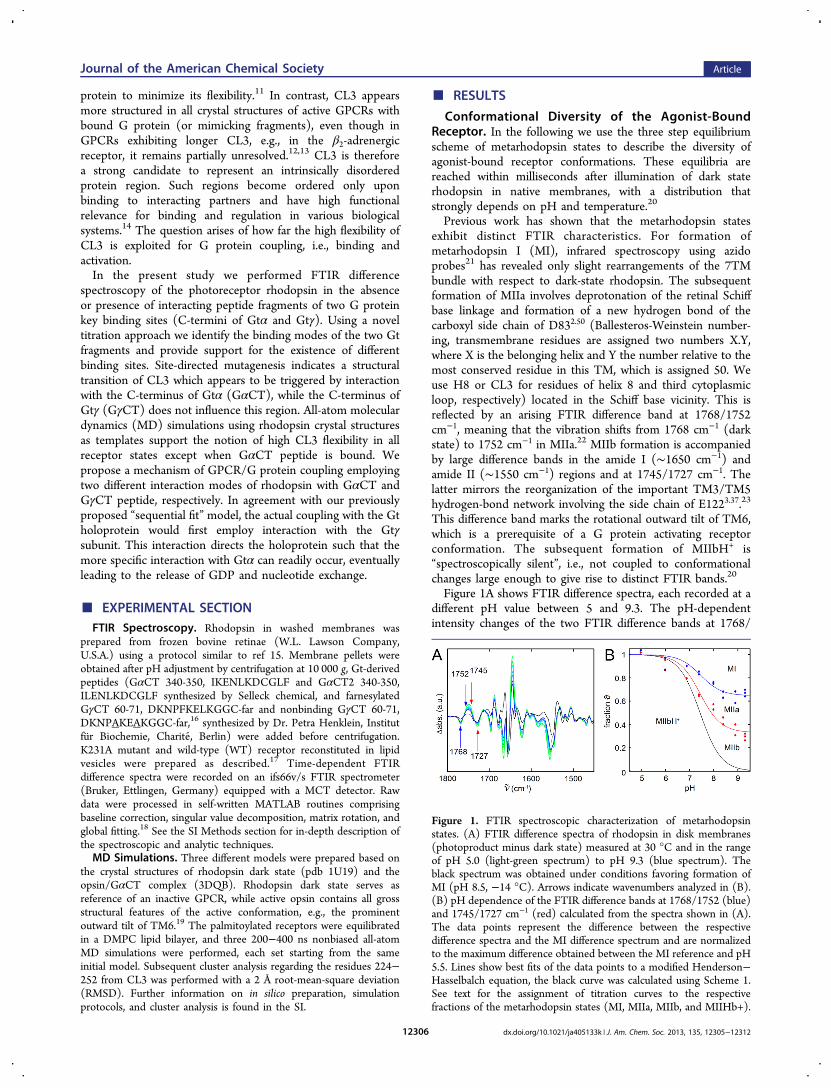
Figure 1A shows FTIR difference spectra, each recorded at adifferent pH value between 5 and 9.3. The pH-dependentintensity changes of the two FTIR difference bands at 1768/
Figure 1. FTIR spectroscopic characterization of metarhodopsinstates. (A) FTIR difference spectra of rhodopsin in disk membranes(photoproduct minus dark state) measured at 30 °C and in the rangeof pH 5.0 (light-green spectrum) to pH 9.3 (blue spectrum). Theblack spectrum was obtained under conditions favoring formation ofMI (pH 8.5, −14 °C). Arrows indicate wavenumbers analyzed in (B).(B) pH dependence of the FTIR difference bands at 1768/1752 (blue)and 1745/1727 cm−1 (red) calculated from the spectra shown in (A).The data points represent the difference between the respectivedifference spectra and the MI difference spectrum and are normalizedto the maximum difference obtained between the MI reference and pH5.5. Lines show best fits of the data points to a modified Henderson−Hasselbalch equation, the black curve was calculated using Scheme 1.See text for the assignment of titration curves to the respectivefractions of the metarhodopsin states (MI, MIIa, MIIb, and MIIHb+).
Journal of the American Chemical Society Article
dx.doi.org/10.1021/ja405133k | J. Am. Chem. Soc. 2013, 135, 12305−1231212306
1752 cm−1 (blue) and 1745/1727 cm−1 (red) are shown inFigure 1B, reflecting a population shift within the coupledequilibria (Scheme 1). These two titration curves were analyzed
using Scheme 1 yielding the fractions ϑ of the individualmetarhodopsin states (see ref 20 and SI Methods 1.3). At highpH and 30 °C we find MI, MIIa, and MIIb significantlypopulated, each state to approximately one-third. All titrationcurves converge at low pH with an apparent pKa of 7.5indicating the selective stabilization of only one receptor state,MIIbH+. This stabilization by proton uptake is furthercorroborated by temperature-dependent measurements athigh and low pH, respectively (Figure S1).Protein States That Interact with C-Terminal Frag-
ments of the G Protein. To uncover which of themetarhodopsin states interact with GαCT and/or GγCT, weextended the above spectroscopic titration assay to samples inwhich peptides (P) of either binding region were present. UsingScheme 2 with the respective equilibrium constants K1−3 and
the parameter a representing the ratio between the peptidebinding affinities of MIIb and MIIbH+, the pH-dependentdistribution of all species can be described.We omit MIIa, as both MI and MIIa share a similar
cytoplasmic conformation and the amount of MIIa is negligiblysmall under the experimental conditions (20 °C).20 A fit of thepH dependent 1745/1727 cm−1 difference band (see SIMethods) yields the fraction of MI (inactive cytoplasmicsurface), MIIb (TM6 outward tilted but E1343.49 deproto-nated), and MIIbH+ (TM6 outward, E1343.49 protonated). Theresulting plot is shown in Figure 2A for a sample of nativewashed membranes in the absence of any peptide (i.e., whenthe amount of complexed species is zero). Consistent withFigure S1, the fit yielded a ratio of ca. 70/30 for MI to MIIb at
the alkaline end point and a microscopic pKa = −log(K2) of 8.1for proton uptake and formation of MIIbH+.Addition of 10 mM GαCT peptide changed the titration
behavior of most difference bands. We found a selectivestabilization of the protonated complexed species over thebroad pH range from 5 to 9 (Figure 2B). Accordingly, the fit tothe data yielded a dissociation constant KD = a·K3 = (330 ± 80)μM (a = 1.2 × 10⁻⁴, K3 = 2.7 M), which fits well to the valuepreviously obtained with micromolar rhodopsin.24 While themicroscopic pKa value remained unaffected, the apparent pKashifted to 9.1 in the presence of 10 mM peptide. Increasing theGαCT peptide concentration led to a further shift of theapparent pKa, confirming our notion of a selective MIIbH+
stabilization (see Figure S2).Farnesylated GγCT peptide was also tested for its effect on
the distribution of the metarhodopsin states. GγCT peptide(Figure 2C) had a different influence as compared to GαCTpeptide. Besides a shift of the apparent pKa to higher values, anincrease of the alkaline end point level was also observed,meaning that MIIb is stabilized at the expense of MI.Consistently, the increase of peptide concentration led, as inthe case of GαCT, to a more pronounced pKa shift but also to afurther elevation of the alkaline titration level (see Figure S3).
Effect of Peptide Binding on Receptor Structure.Peptide binding was further investigated through a so-calledpeptide binding spectrum (PBS), which is the differencebetween two difference spectra measured in the presence andabsence of peptide (see Figure S5). Since all vibrational changesof the free receptor protein are subtracted from the differencespectrum of the receptor/peptide complex, the resulting PBS isa specific measure of peptide induced conformational changesin both receptor and peptide.25−27
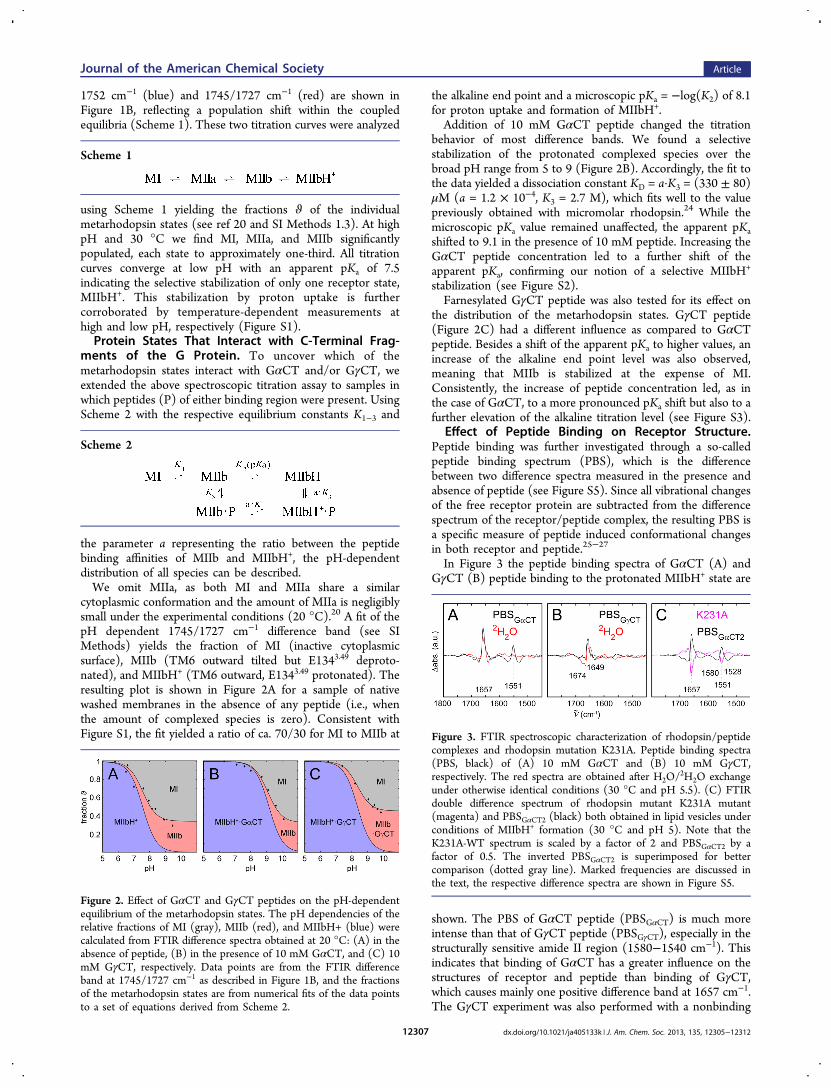
In Figure 3 the peptide binding spectra of GαCT (A) andGγCT (B) peptide binding to the protonated MIIbH+ state are
shown. The PBS of GαCT peptide (PBSGαCT) is much moreintense than that of GγCT peptide (PBSGγCT), especially in thestructurally sensitive amide II region (1580−1540 cm−1). Thisindicates that binding of GαCT has a greater influence on thestructures of receptor and peptide than binding of GγCT,which causes mainly one positive difference band at 1657 cm−1.The GγCT experiment was also performed with a nonbinding
Scheme 1
Scheme 2
Figure 2. Effect of GαCT and GγCT peptides on the pH-dependentequilibrium of the metarhodopsin states. The pH dependencies of therelative fractions of MI (gray), MIIb (red), and MIIbH+ (blue) werecalculated from FTIR difference spectra obtained at 20 °C: (A) in theabsence of peptide, (B) in the presence of 10 mM GαCT, and (C) 10mM GγCT, respectively. Data points are from the FTIR differenceband at 1745/1727 cm−1 as described in Figure 1B, and the fractionsof the metarhodopsin states are from numerical fits of the data pointsto a set of equations derived from Scheme 2.
Figure 3. FTIR spectroscopic characterization of rhodopsin/peptidecomplexes and rhodopsin mutation K231A. Peptide binding spectra(PBS, black) of (A) 10 mM GαCT and (B) 10 mM GγCT,respectively. The red spectra are obtained after H2O/
2H2O exchangeunder otherwise identical conditions (30 °C and pH 5.5). (C) FTIRdouble difference spectrum of rhodopsin mutant K231A mutant(magenta) and PBSGαCT2 (black) both obtained in lipid vesicles underconditions of MIIbH+ formation (30 °C and pH 5). Note that theK231A-WT spectrum is scaled by a factor of 2 and PBSGαCT2 by afactor of 0.5. The inverted PBSGαCT2 is superimposed for bettercomparison (dotted gray line). Marked frequencies are discussed inthe text, the respective difference spectra are shown in Figure S5.
Journal of the American Chemical Society Article
dx.doi.org/10.1021/ja405133k | J. Am. Chem. Soc. 2013, 135, 12305−1231212307
GγCT peptide variant. The respective PBS reveals that thecontrol peptide had no influence on the difference spectrum(Figure S5), providing evidence for a specific interaction of theGγCT peptide with the active receptor. To gain insight into thespecific molecular changes underlying PBSGαCT and PBSGγCT,we performed corresponding experiments after H2O/
2H2Oexchange. The exchange causes distinct spectral shifts ofmolecular vibrations coupled to protonation and thus facilitatesassignment of FTIR difference bands to their molecular origin,e.g., specific amino acids of backbone vibrations. As an example,the most likely candidate for parts of the 1657 cm−1 vibration isthe guanidinium side chain of R1353.50. R1353.50 is known to beinvolved in GαCT binding,10,28 and its frequency stronglydepends on whether it is bound via salt bridge or hydrogenbond. Furthermore, the arginine CN3H5
+ vibration decouplesafter H/2H exchange, leading to a pronounced downshift andoverall smaller difference bands in the 1650 cm−1 region. Theremaining intensity changes are most likely amide I vibrationsindicative of changes in the peptide backbone (e.g., secondarystructure), as amide I bands are known to exhibit only small ifany isotope shifts. Interestingly, the negative amide I and IIbands are broadly distributed, while only one positive bandarises in both regions. The position of the positive amide I bandfits to the absorption of a solvent exposed α-helix. This suggestsa structural transition from an unstructured to a clearlystructured segment. The notion is further substantiated bythe disappearing amide II vibrations of PBSGαCT in 2H2O.Amide II bands can be utilized to probe the flexibility of proteinregions, as amide protons undergo fast H+/2H+ exchange inunstructured loops, while hydrogen bonds in structured regionsare more protected even in solvent exposed protein parts (for acomprehensive review of FTIR signatures in proteins see ref29). To estimate the number of amino acids involved in thestructuring transition, we evaluated the GαCT binding inducedabsorbance change at 1657 cm−1 (in 2H2O to avoid the signalcaused by nonamide I groups). Using εamide I ≈ 500 M−1
cm−1,30 we obtain five amino acids per rhodopsin molecule.However, this certainly underestimates the effect, as α-helix andrandom coil exhibit very similar amide I frequencies, and thusseveral positive and negative bands may overlap or evencompensate each other.The lack of pronounced amide II features in the PBSGγCT
(Figure 3B) excludes a significant influence of GγCT peptidebinding on receptor structure as found for GαCT. Thedifferences between the two peptides were further confirmedafter 2H2O exchange, which led to a slightly more intensenegative and an additional positive band in PBSGγCT, likely dueto a shift of a positive band around 1674 to 1649 cm−1. This fitsto the absorption of a ν(CO) vibration of glutamine orasparagine side chains involved in the binding process.
Effect of Single Site Mutation on the Structuring ofCL3. K231CL3 (the position of K231 depends on the respectivecrystal structure, either 5.66 or CL3, and as a result of ouranalysis, we use the notation K231CL3) is part of the conservedY5.58x7K(R)
CL3 motif located in CL3 and participates in ahydrogen-bond network consisting of K231CL3, E2476.30, andT2516.34, which has been suggested to constitute a determinantof the active conformation7 (see Figure S4). Consistently,biased MD simulations found a strong influence of the K231Amutation on the distribution of activated receptor conforma-tions.31 We therefore expressed the K231A mutant andreconstituted the mutant and the WT receptor proteinseparately into lipid vesicles as described.17 Difference spectrawere recorded under conditions which favor E1343.49
protonation (MIIbH+), and the corresponding double differ-ence K231A minus WT was calculated to elucidate thestructural consequences of the K231A mutation (Figure 3C).The double difference spectrum of K231A shares distinctsimilarities with PBSGαCT2, the peptide binding spectrumrecorded for WT rhodopsin in lipid vesicles, but is inverted.This correlation suggests that the receptor conformation, whichis stabilized by GαCT peptide binding, is also present to a small
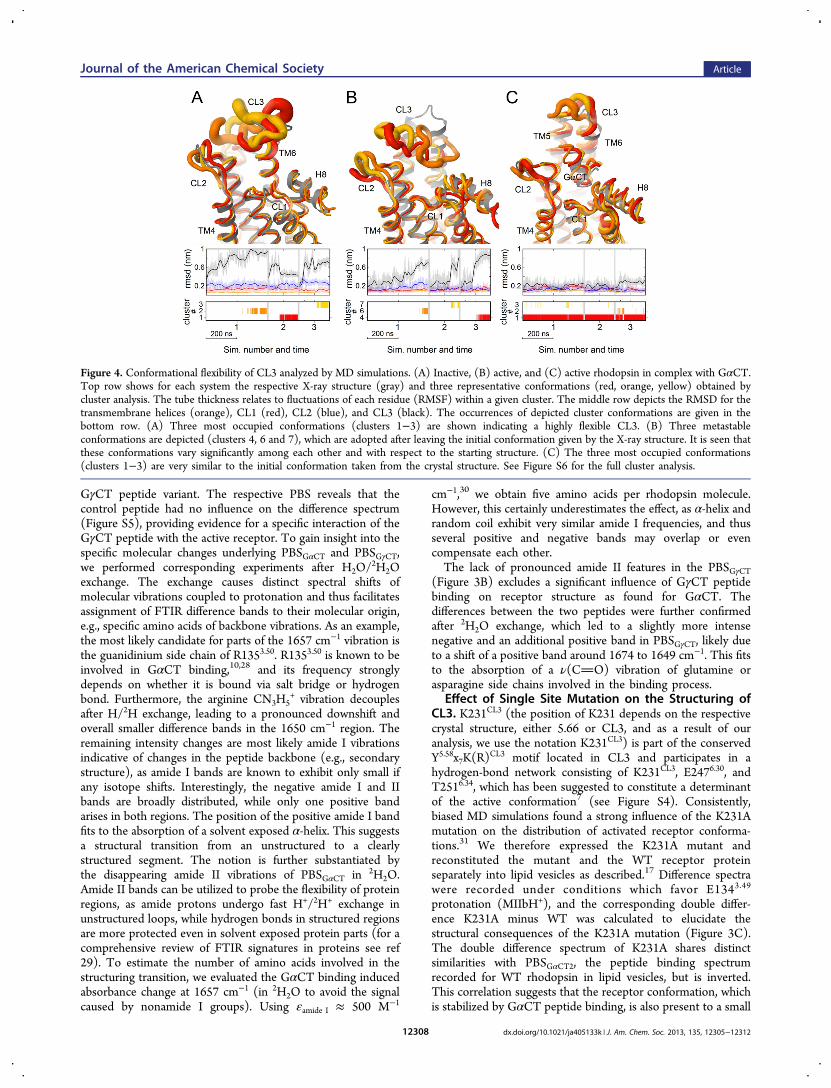
Figure 4. Conformational flexibility of CL3 analyzed by MD simulations. (A) Inactive, (B) active, and (C) active rhodopsin in complex with GαCT.Top row shows for each system the respective X-ray structure (gray) and three representative conformations (red, orange, yellow) obtained bycluster analysis. The tube thickness relates to fluctuations of each residue (RMSF) within a given cluster. The middle row depicts the RMSD for thetransmembrane helices (orange), CL1 (red), CL2 (blue), and CL3 (black). The occurrences of depicted cluster conformations are given in thebottom row. (A) Three most occupied conformations (clusters 1−3) are shown indicating a highly flexible CL3. (B) Three metastableconformations are depicted (clusters 4, 6 and 7), which are adopted after leaving the initial conformation given by the X-ray structure. It is seen thatthese conformations vary significantly among each other and with respect to the starting structure. (C) The three most occupied conformations(clusters 1−3) are very similar to the initial conformation taken from the crystal structure. See Figure S6 for the full cluster analysis.
Journal of the American Chemical Society Article
dx.doi.org/10.1021/ja405133k | J. Am. Chem. Soc. 2013, 135, 12305−1231212308
but significant extent in the absence of GαCT peptide and thatmutation of K231CL3 destabilizes this conformation. The smallresidual differences between the K231A double difference andPBSGαCT2 have two molecular origins: Some are a directconsequence of the disrupted hydrogen-bond network in theK231A mutant (lysine, glutamate, or threonine vibrations causeabsorptions around 1650 cm−1), while others can be attributedto the structural changes of the GαCT2 peptide which accountfor parts of the PBSGαCT2 (e.g., at 1580 and 1528 cm−1).27
MD Simulation of Receptor States. To specify the effectof GαCT on the CL3 structure, we performed several 200−400ns classical all-atom MD simulations of membrane embeddedrhodopsin starting from the crystal structures of the inactive32
and the active10 states with or without GαCT peptide.Comparison of the RMSD in the inactive and active statesindicates that CL3 is more flexible than the other twocytoplasmic loops (Figure 4). To identify conformations ofCL3 which were frequently occupied during the simulations, weperformed a cluster analysis with respect to residues 224−251(Figure S6). For each set of simulations three representativeCL3 conformations and their occurrence during the simulationswere used to monitor the structural heterogeneity of CL3 in thedifferent underlying receptor states (Figure 4).For dark-state rhodopsin the simulations suggest high CL3
flexibility (Figure 4A), which is in accordance with the high B-factors found in several of the crystal structures (e.g., pdb 1U19,see Figure S8). However, the distinct helical extension of TM6into the aqueous phase seen in the crystal structure is preservedduring all three simulations. For the active state in the absenceof GαCT, the initial structured conformation of CL3 becomesdisordered and highly flexible after <200 ns (Figure 4B).Among the different bent helical and coiled structures adopted,each is populated for <10% of the simulation period, withlifetimes of ∼10−8 s (as estimated from the timelines in FigureS6).During the simulations of the receptor/GαCT complex, CL3
is rigid, and its secondary structure is preserved (Figure 4C).Nearly 95% of the CL3 conformations fall into the largestcluster (Figure S6C) which fluctuate around the α-helical richCL3 conformation found in the crystal structure (Figure 4C,gray). The flexibility changes of CL3 were dissected on the levelof individual amino acids by calculating their root-mean-squarefluctuations (RMSF). Receptor activation results in a loss offlexibility specifically around A233, while the region aroundK248 becomes more flexible. Notably, binding of GαCTpeptide constrains all residues within CL3 (Figure S7). Thesalient result of the simulations is therefore that CL3 is likely tobe intrinsically disordered, becoming structured and more rigidupon binding of GαCT.Crystal Contacts in Available GPCR Structures. To
evaluate the possible influences of crystallization on thesecondary structure of CL3, we analyzed the available crystalstructures of GPCRs with respect to the CL3 conformations(Table S1). Structures where CL3 had been truncated orfusioned to a soluble protein were excluded. We find a shorterCL3 in the presence of cytoplasmic binding partners, such as Gprotein, GαCT peptides, or G protein mimetic nanobody.There is also a strong correlation between specific crystalcontacts within CL3 and its secondary structure. Particularly,these crystal contacts stabilize elongated helices TM5 or TM6at the cost of CL3. This is especially important to note for therhodopsin case, where all structures representing activeconformations exhibit crystal contacts between CL3 and
TM1/H8 of the adjacent receptor molecule (Figure S8B).The structuring of CL3 may thus be artificial in these crystalstructures and CL3 actually more flexible in the underlyingprotein states.
■ DISCUSSIONIn this study, we employed FTIR spectroscopy and MDsimulations of rhodopsin in the membrane environment toextend the static picture from X-ray analysis by complementarydynamic information. To classify the information, we willfollow the hierarchical concept of protein dynamics developedby Frauenfelder and co-workers.33 The concept distinguishesthree classes of conformational states by their differentlifetimes. We will identify several receptor conformations asprotein states (tier 0), which exhibit a lifetime greater than amicrosecond. Each protein state comprises several taxonomicsubstates (tier 1) with nanosecond lifetimes. These taxonomicstates can be further subdivided into so-called statisticalsubstates (tier 2), which form and decay on the picosecondtime scale, respectively.34 The interpretation of our results isbased on the notion that transitions between protein states arefacilitated by transitions between taxonomic substates.35 Finally,this led us propose a model of how signal transfer from anactivated receptor molecule to the G protein may occur.
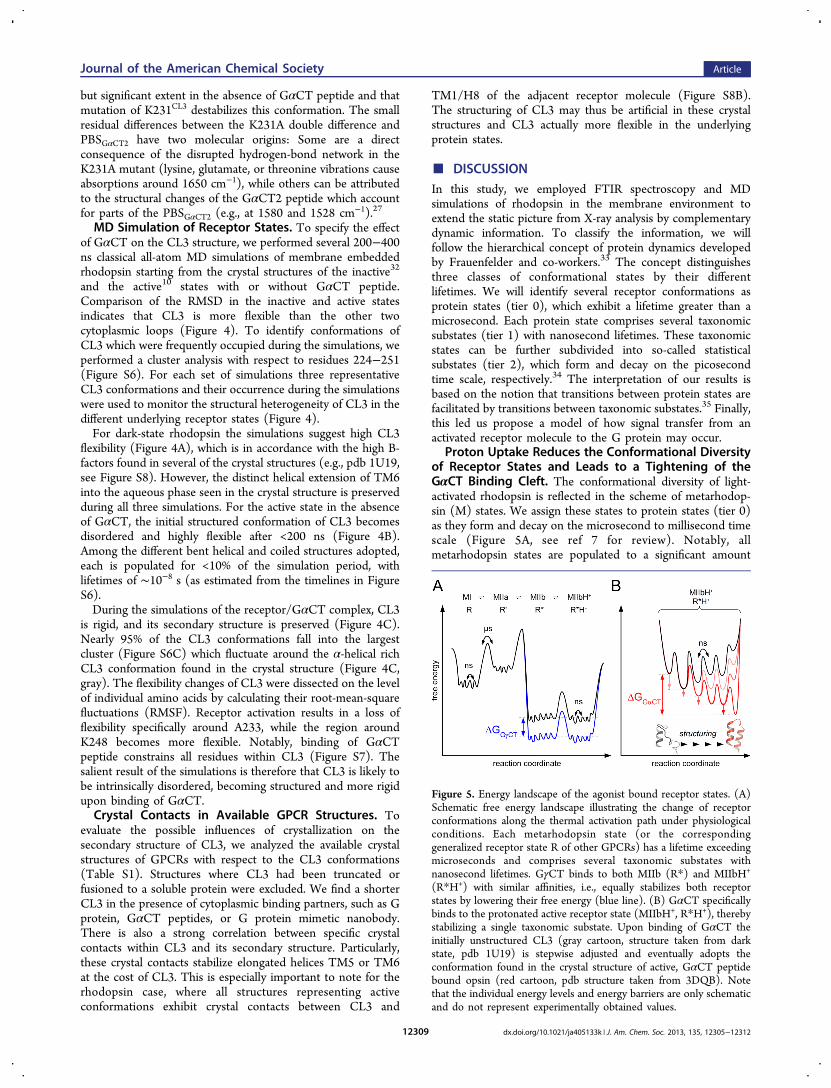
Proton Uptake Reduces the Conformational Diversityof Receptor States and Leads to a Tightening of theGαCT Binding Cleft. The conformational diversity of light-activated rhodopsin is reflected in the scheme of metarhodop-sin (M) states. We assign these states to protein states (tier 0)as they form and decay on the microsecond to millisecond timescale (Figure 5A, see ref 7 for review). Notably, allmetarhodopsin states are populated to a significant amount
Figure 5. Energy landscape of the agonist bound receptor states. (A)Schematic free energy landscape illustrating the change of receptorconformations along the thermal activation path under physiologicalconditions. Each metarhodopsin state (or the correspondinggeneralized receptor state R of other GPCRs) has a lifetime exceedingmicroseconds and comprises several taxonomic substates withnanosecond lifetimes. GγCT binds to both MIIb (R*) and MIIbH+
(R*H+) with similar affinities, i.e., equally stabilizes both receptorstates by lowering their free energy (blue line). (B) GαCT specificallybinds to the protonated active receptor state (MIIbH+, R*H+), therebystabilizing a single taxonomic substate. Upon binding of GαCT theinitially unstructured CL3 (gray cartoon, structure taken from darkstate, pdb 1U19) is stepwise adjusted and eventually adopts theconformation found in the crystal structure of active, GαCT peptidebound opsin (red cartoon, pdb structure taken from 3DQB). Notethat the individual energy levels and energy barriers are only schematicand do not represent experimentally obtained values.
Journal of the American Chemical Society Article
dx.doi.org/10.1021/ja405133k | J. Am. Chem. Soc. 2013, 135, 12305−1231212309
under physiological conditions (at least 10% each).22 It wasconceived early on that metarhodopsin states correspond tostructurally equivalent inactive (R) and active (R*) states ofother GPCRs.36 Because the outward tilt of TM6, the structuralprerequisite of GPCR activation, occurs with formation ofMIIb,4,37 we correlate this state with the active R* state andaccordingly the protonated state MIIbH+ with R*H+ (Figure5A). A similar assignment has been more recently suggested byDeupi and Kobilka.6
In agreement with earlier studies we found that threedeprotonated protein states, namely R, R′, and R* coexist athigh pH (see Figure 1B), all containing the intact salt bridgebetween E1343.49 and R1353.50.20,22 However, proton uptake atlow pH leads to disruption of the E1343.49−R1353.50 ionicinteraction and stabilization of the protonated active stateR*H+. The important question arises, which global structuralchanges are coupled to the proton uptake that is mandatory forfull catalytic activity of the receptor.38 In the structures of theinactive receptor, TM5 is kinked with highly conservedPro2155.50 serving as a hinge, while in the active receptorTM5 appears fully elongated with a slightly inwardly translatedcytoplasmic end (see Figures S4 and S8). Recently, we couldshow that inward stabilization of TM5 occurs only upon protonuptake.17 We hypothesize that, in its inward position, TM5constitutes a “doorstop”, hindering TM6 to leave its activeoutward tilted conformation. Furthermore we propose that theinward position of TM5 leads to a tightening of the cleftbetween TM3, TM5, and TM6 which constitutes the bindingsite of the C-terminus of the G protein α-subunit. Consistently,the MD analysis of CL3 flexibility suggests a stabilization of thecytoplasmic end of TM5 upon formation of R*H+ (Figure S7).The proposed doorstop mechanism is a possible explanation ofhow the uptake of a single proton suffices to reduce theconformational diversity to only one protein state.Binding of GαCT Peptide Stabilizes Only One
Conformational Substate of the Protonated ActiveReceptor. NMR spectroscopic studies have shown that thekey binding fragment of Gt, the extreme C-terminus of the Gαsubunit (GαCT peptide), forms an α-helix upon binding to thephotoactivated receptor.39 Furthermore, FTIR spectroscopyhas shown that GαCT binding also affects the receptorstructure.27 However, the influence of peptide binding on thereceptor structure is in apparent contradiction to X-raycrystallography, since the receptor with or without GαCTpeptide does not exhibit substantial conformational differ-ences.10,28,40 Analyzing a large set of GPCR structures, wefound that this structured CL3 conformation is stabilized notonly by GαCT or other stabilizing agents but also by crystalcontacts (Table S1), which explains the great similarity of activerhodopsin/opsin structures with or without GαCT peptide.Accordingly, our MD simulations suggest that the activereceptor conformation in the absence of GαCT peptidecomprises different bent and helical conformations of CL3,while the other cytoplasmic loops and helix 8 are considerablyless flexible (Figure 4B). The different CL3 conformationsexhibit lifetimes in the range of 10−8 s, which suggests thatthese conformations are taxonomic substates of R*H+ (tier 1,Figure 5B). Our findings are in agreement with results obtainedby an elaborate EPR analysis of the structural features of CL3.41
The broadly distributed negative FTIR features are compatiblewith the finding from MD simulations, suggesting that CL3 isdisordered and exhibits many different substate conformationsin the GαCT unbound state. Furthermore, both our
spectroscopic and in silico results point to the fact that GαCTpeptide stabilizes one specific taxonomic substate of R*H+ thatexhibits a largely helical conformation of CL3. That CL3constitutes an intrinsically unstructured protein domain whichbecomes structured upon complex formation has been alreadysuggested on the basis of sequence analysis.42
Prior to their coupling, CL3 as well as GαCT aredisordered,39,43 and coupling of these two domains wouldbecome extremely slow when a pure conformational selectionof the structured substates is assumed. Based on the dataobtained in this study, we therefore propose a sequentialbinding mechanism comprising several steps of conformationalselection and induced fit: In the first step, the long-range chargepotential of R1353.50 (∼1/r) is likely to support formation of anencounter complex44 between activated receptor and GαCT.The subsequent forced proton uptake of the receptor wouldthen lead to the inward “doorstop” movement of TM5 and thuscontraction of the binding site. Such a GαCT inducedtightening of the receptor binding domain has already beensuggested on the basis of radiolytic footprinting data.45 At thisstage of the reaction, we hypothesize that short-rangehydrophobic interactions (∼1/r6) can build up. The associatedexpulsion of water molecules would then promote helixformation in both GαCT and CL3. The proposed mechanismof stepwise complex formation includes several stages of mutualadjustment46 each accompanied by a population shift oftaxonomic substates along the reaction coordinate. Thiscorresponds to a progressively altered energy landscape (Figure5B), such that in each individual step, the next, more specificconformation along the binding trajectory is selected. Withinthe resulting binding funnel,47 multiple taxonomic substates aretransiently populated, each contributing merely a nanosecondlifetime.
GγCT Binds to Both the Protonated and Deproto-nated Active Receptor. The crystal structure of the β2-adrenergic receptor in complex with the Gs holoprotein12 doesnot show any interaction of GγCT with the receptor. However,GγCT peptide does specifically interact with light-activatedrhodopsin, i.e., stabilize MII conformations at the expense ofMI.24 The present titration assay now demonstrates that GγCTpeptide (in contrast to GαCT peptide) interacts with bothMIIb (R*) and MIIbH+ (R*H+) with similar affinities (Figure5A). This means that the interaction with GγCT peptide doesnot distinguish whether the E1343.49−R1353.50 salt bridge isintact or broken or whether TM5 is in- or outward tilted, whichis also consistent with the finding that GγCT binding does notlead to structuring of the CL3 region (Figure 3).In light of these observations, we assume that GγCT
occupies a binding site different from GαCT. Because GαCTand GγCT peptides have been shown to compete with oneanother for binding to the active receptor,48 the GγCT bindingsite is likely to be allosterically coupled to the GαCT bindingcleft. Such allostery has to span the ∼40 Å distance between theGα and Gγ C-termini in the footprint of the Gt holoprotein.43
The most distant region from the rim of CL3 is the end ofcytoplasmic helix 8 (43 Å between Cα-atoms of Q238CL3 andCys323H8 in the crystal structure of active opsin). This regionhas already been suggested to interact with the Gtholoprotein49 and is coupled to the ERY motif via the highlyconserved residues of the NPxxYx5/6F motif.50 Monomericrhodopsin thus provides a possible structural basis for anallosteric mechanism, in agreement with the finding thatrhodopsin monomers efficiently activate Gt.51,52 However, we
Journal of the American Chemical Society Article
dx.doi.org/10.1021/ja405133k | J. Am. Chem. Soc. 2013, 135, 12305−1231212310
cannot exclude that the Gα and Gγ C-termini can also bind todifferent protomers within a receptor dimer.53
Mechanistic Implications for GPCR-Mediated SignalTransduction. Rhodopsin’s perfect switching function de-pends on two factors: signal fidelity and speed. Fidelity relies inthe first instance on the inactivating and activating retinalligands which are covalently bound to the receptor andsufficiently potent to shift the equilibria of receptorconformations to the inactive or active side. Equally important,however, is an accurate and productive coupling mechanism ofthe activated receptor and G protein (up to more than 103 Gproteins per second).54 To tackle the latter point, we nowspecify our previously proposed “sequential fit” model ofrhodopsin/transducin coupling24,48,55 by structural and dynam-ic details obtained from FTIR spectroscopy and MDsimulations.Upon receptor activation the first specific contact is likely to
occur between receptor and the Gγ C-terminus. On the onehand GγCT exhibits a lipid anchor which is likely to ensuremore efficient collisional coupling by reducing the G proteindiffusion to a two-dimensional space. On the other hand ourresults show that binding of GγCT to the active receptor is lessselective than binding of GαCT, as GγCT peptide is capable ofinteracting with any active receptor form irrespective of thereceptor’s protonation state (Figure 5A). According to thisscenario, the initial receptor−GγCT interaction would confinethe search of the Gα C-terminus for its specific binding site to aone-dimensional rotational space. The intrinsically unstructurednature of CL3 maximizes its capture radius and thus acceleratesthe encounter with the C-terminus of the Gα-subunit.56 Hence,the subsequent mutual structuring steps of receptor and GαCTare nothing but a population shift of taxonomic substates (ofR*H+) proceeding on the nanosecond time scale (Figure 5B).Accordingly, a decrease of Gα C-terminal flexibility betweeninitial GDP-bound and final GDP-free receptor/G proteincomplex was identified in HD exchange measurements ofinteraction between β2-adrenergic receptor and Gsαβγ.57 Wetherefore assume that the fully structured binding site found inthe crystal structure of the rhodopsin/GαCT complexcorrelates to the empty site state after GDP release. Takentogether, the tight complex provides the large and stableinteraction surface required for the precise interrogation ofstructural elements to realize high signal fidelity.Thermodynamically, the formation of a specific secondary
structure with minimized degrees of conformational freedomconstitutes an entropic cost. This needs to be counterbalancedby the energy gain of new bonds, hydrophobic contacts, ordehydration and possibly by an increased flexibility in otherparts of the G protein.58 In any case, the intrinsic propensity tounfold opens the possibility of rapid dissociation after signaltransfer. The balance between enthalpic and entropic drivingforces is implemented in the precision and flexibility of GPCRand G protein key binding sites to build a functional catalyticmodule.
■ ASSOCIATED CONTENT
*S Supporting InformationFurther information on sample preparation, data analysis, andMD simulation protocols. This material is available free ofcharge via the Internet at http://pubs.acs.org.
■ AUTHOR INFORMATIONCorresponding [email protected]; [email protected] authors declare no competing financial interest.
■ ACKNOWLEDGMENTSWe are grateful to Jana Engelmann, Anja Koch, and Brian Bauerfor expert technical assistance, Roman Kazmin for thepreparation of the K231A and WT in lipid vesicles, andFriedrich Siebert for assistance with the interpretation of theFTIR data. We thank Helmut Grubmuller and Ulrich Zachariaefor providing additional computing resources and assistancewith running the MD simulations. The computer timenecessary for this project was provided by the “NorddeutscherVerbund fur Hoch- und Hochstleistungsrechner” (HLRN).This work was funded by the Deutsche Forschungsgesellschaft(SFB 740 to K.P.H., P.W.H., and M.H.) and the EuropeanResearch Council (TUDOR to K.P.H).
■ REFERENCES(1) Hepler, J. R.; Gilman, A. G. Trends Biochem. Sci. 1992, 17, 383−7.(2) Rosenbaum, D. M.; Rasmussen, S. G. F.; Kobilka, B. K. Nature2009, 459, 356−63.(3) Katritch, V.; Cherezov, V.; Stevens, R. C. Trends Pharmacol. Sci.2012, 33, 17−27.(4) Farrens, D. L.; Altenbach, C.; Yang, K.; Hubbell, W. L.; Khorana,H. G. Science 1996, 274, 768−70.(5) Altenbach, C.; Kusnetzow, A. K.; Ernst, O. P.; Hofmann, K. P.;Hubbell, W. L. Proc. Natl. Acad. Sci. U.S.A. 2008, 105, 7439−44.(6) Deupi, X.; Kobilka, B. K. Physiology 2010, 25, 293−303.(7) Hofmann, K. P.; Scheerer, P.; Hildebrand, P. W.; Choe, H.-W.;Park, J. H.; Heck, M.; Ernst, O. P. Trends Biochem. Sci. 2009, 34, 540−52.(8) Franke, R. R.; Konig, B.; Sakmar, T. P.; Khorana, H. G.;Hofmann, K. P.; Konig, B. Science 1990, 250, 123−5.(9) Ernst, O. P.; Hofmann, K. P.; Sakmar, T. P. J. Biol. Chem. 1995,270, 10580−6.(10) Scheerer, P.; Park, J. H.; Hildebrand, P. W.; Kim, Y. J.; Krauss,N.; Choe, H.-W.; Hofmann, K. P.; Ernst, O. P. Nature 2008, 455,497−502.(11) Tate, C. G.; Schertler, G. F. Curr. Opin. Struct. Biol. 2009, 19,386−395.(12) Rasmussen, S. G. F.; DeVree, B. T.; Zou, Y.; Kruse, A. C.;Chung, K. Y.; Kobilka, T. S.; Thian, F. S.; Chae, P. S.; Pardon, E.;Calinski, D.; Mathiesen, J. M.; Shah, S. T. A.; Lyons, J. A.; Caffrey, M.;Gellman, S. H.; Steyaert, J.; Skiniotis, G.; Weis, W. I.; Sunahara, R. K.;Kobilka, B. K. Nature 2011, 477, 549−55.(13) Rasmussen, S. G. F.; Choi, H.-J.; Fung, J. J.; Pardon, E.;Casarosa, P.; Chae, P. S.; Devree, B. T.; Rosenbaum, D. M.; Thian, F.S.; Kobilka, T. S.; Schnapp, A.; Konetzki, I.; Sunahara, R. K.; Gellman,S. H.; Pautsch, A.; Steyaert, J.; Weis, W. I.; Kobilka, B. K. Nature 2011,469, 175−80.(14) Wright, P. E.; Dyson, H. J. J. Mol. Biol. 1999, 293, 321−31.(15) Papermaster, D. S. Methods Enzymol. 1982, 81, 48−52.(16) Kisselev, O. G.; Downs, M. A. Biochemistry 2006, 45, 9386−92.(17) Elgeti, M.; Kazmin, R.; Heck, M.; Morizumi, T.; Ritter, E.;Scheerer, P.; Ernst, O. P.; Siebert, F.; Hofmann, K. P.; Bartl, F. J. J. Am.Chem. Soc. 2011, 133, 7159−65.(18) Elgeti, M.; Ritter, E.; Bartl, F. J. Z. Phys. Chem. 2008, 222,1117−1129.(19) Vogel, R.; Siebert, F. J. Biol. Chem. 2001, 276, 38487−93.(20) Mahalingam, M.; Martínez-Mayorga, K.; Brown, M. F.; Vogel, R.Proc. Natl. Acad. Sci. U.S.A. 2008, 105, 17795−800.(21) Ye, S.; Zaitseva, E.; Caltabiano, G.; Schertler, G. F. X.; Sakmar,T. P.; Deupi, X.; Vogel, R. Nature 2010, 464, 1386−9.
Journal of the American Chemical Society Article
dx.doi.org/10.1021/ja405133k | J. Am. Chem. Soc. 2013, 135, 12305−1231212311

(22) Zaitseva, E.; Brown, M. F.; Vogel, R. J. Am. Chem. Soc. 2010,132, 4815−21.(23) Fahmy, K.; Jager, F.; Beck, M.; Zvyaga, T. A.; Sakmar, T. P.;Siebert, F. Proc. Natl. Acad. Sci. U.S.A. 1993, 90, 10206.(24) Kisselev, O. G.; Meyer, C. K.; Heck, M.; Ernst, O. P.; Hofmann,K. P. Proc. Natl. Acad. Sci. U.S.A. 1999, 96, 4898−4903.(25) Nishimura, S.; Kandori, H.; Maeda, A. Biochemistry 1998, 37,15816−24.(26) Bartl, F. J.; Ritter, E.; Hofmann, K. P. FEBS Lett. 2000, 473,259−64.(27) Vogel, R.; Martell, S.; Mahalingam, M.; Engelhard, M.; Siebert,F. J. Mol. Biol. 2007, 366, 1580−8.(28) Choe, H.-W.; Kim, Y. J.; Park, J. H.; Morizumi, T.; Pai, E. F.;Krauss, N.; Hofmann, K. P.; Scheerer, P.; Ernst, O. P. Nature 2011,471, 651−5.(29) Barth, A. Biochim. Biophys. Acta 2007, 1767, 1073−101.(30) Goormaghtigh, E.; Cabiaux, V.; Ruysschaert, J. M. Subcell.Biochem. 1994, 23, 405−50.(31) Provasi, D.; Filizola, M. Biophys. J. 2010, 98, 2347−55.(32) Okada, T.; Sugihara, M.; Bondar, A.-N.; Elstner, M.; Entel, P.;Buss, V. J. Mol. Biol. 2004, 342, 571−83.(33) Frauenfelder, H.; Sligar, S.; Wolynes, P. Science 1991, 254,1598−1603.(34) Frauenfelder, H.; Chen, G.; Berendzen, J.; Fenimore, P. W.;Jansson, H.; McMahon, B. H.; Stroe, I. R.; Swenson, J.; Young, R. D.Proc. Natl. Acad. Sci. U.S.A. 2009, 106, 5129−34.(35) Henzler-Wildman, K.; Kern, D. Nature 2007, 450, 964−72.(36) Okada, T.; Ernst, O. P.; Palczewski, K.; Hofmann, K. P. TrendsBiochem. Sci. 2001, 26, 318−24.(37) Knierim, B.; Hofmann, K. P.; Ernst, O. P.; Hubbell, W. L. Proc.Natl. Acad. Sci. U.S.A. 2007, 104, 20290−5.(38) Robinson, P. R.; Cohen, G. B.; Zhukovsky, E. A.; Oprian, D. D.Neuron 1992, 9, 719−25.(39) Kisselev, O. G.; Kao, J.; Ponder, J. W.; Fann, Y. C.; Gautam, N.;Marshall, G. R. Proc. Natl. Acad. Sci. U.S.A. 1998, 95, 4270.(40) Park, J. H.; Scheerer, P.; Hofmann, K. P.; Choe, H.-W.; Ernst,O. P. Nature 2008, 454, 183−7.(41) Altenbach, C.; Yang, K.; Farrens, D. L.; Farahbakhsh, Z. T.;Khorana, H. G.; Hubbell, W. L. Biochemistry 1996, 35, 12470−8.(42) Jaakola, V.-P.; Prilusky, J.; Sussman, J. L.; Goldman, A. ProteinEng., Des Sel. 2005, 18, 103−10.(43) Lambright, D. G.; Sondek, J.; Bohm, A.; Skiba, N. P.; Hamm, H.E.; Sigler, P. B. Nature 1996, 379, 311−9.(44) Ubbink, M. FEBS Lett. 2009, 583, 1060−6.(45) Orban, T.; Jastrzebska, B.; Gupta, S.; Wang, B.; Miyagi, M.;Chance, M. R.; Palczewski, K. Structure 2012, 20, 826−40.(46) Csermely, P.; Palotai, R.; Nussinov, R. Trends Biochem. Sci.2010, 35, 539−46.(47) Ma, B.; Kumar, S.; Tsai, C.-J.; Nussinov, R. Protein Eng. 1999,12, 713−20.(48) Herrmann, R.; Heck, M.; Henklein, P.; Henklein, P.; Kleuss, C.;Hofmann, K. P.; Ernst, O. P. J. Biol. Chem. 2004, 279, 24283−90.(49) Lehmann, N.; Alexiev, U.; Fahmy, K. J. Mol. Biol. 2007, 366,1129−41.(50) Fritze, O.; Filipek, S.; Kuksa, V.; Palczewski, K.; Hofmann, K. P.;Ernst, O. P. Proc. Natl. Acad. Sci. U.S.A. 2003, 100, 2290−5.(51) Ernst, O. P.; Gramse, V.; Kolbe, M.; Hofmann, K. P.; Heck, M.Proc. Natl. Acad. Sci. U.S.A. 2007, 104, 10859−64.(52) Whorton, M. R.; Bokoch, M. P.; Rasmussen, S. G. F.; Huang, B.;Zare, R. N.; Kobilka, B.; Sunahara, R. K. Proc. Natl. Acad. Sci. U.S.A.2007, 104, 7682−7.(53) Jastrzebska, B.; Ringler, P.; Lodowski, D. T.; Moiseenkova-Bell,V.; Golczak, M.; Muller, S. A.; Palczewski, K.; Engel, A. J. Struct. Biol.2011, 176, 387−94.(54) Heck, M.; Hofmann, K. P. J. Biol. Chem. 2001, 276, 10000−9.(55) Scheerer, P.; Heck, M.; Goede, A.; Park, J. H.; Choe, H.-W.;Ernst, O. P.; Hofmann, K. P.; Hildebrand, P. W. Proc. Natl. Acad. Sci.U.S.A. 2009, 106, 10660−10665.
(56) Shoemaker, B. A.; Portman, J. J.; Wolynes, P. G. Proc. Natl.Acad. Sci. U.S.A. 2000, 97, 8868−73.(57) Chung, K. Y.; Rasmussen, S. G. F.; Liu, T.; Li, S.; DeVree, B. T.;Chae, P. S.; Calinski, D.; Kobilka, B. K.; Woods, V. L.; Sunahara, R. K.Nature 2011, 477, 611−5.(58) Preininger, A. M.; Meiler, J.; Hamm, H. E. J. Mol. Biol. 2013,425, 2288−98.
Journal of the American Chemical Society Article
dx.doi.org/10.1021/ja405133k | J. Am. Chem. Soc. 2013, 135, 12305−1231212312