precision spectroscopy of neutral radium: towards searches...
TRANSCRIPT

Precision Spectroscopy of Neutral
Radium: Towards Searches for
Permanent Electric Dipole Moments
To My Parents and Family

Cover: Cartoon of a particle with finite spin on a Mobius strip. When the time
axis is assumed along the side of the strip and a detector is placed in front of the
strip, the direction of spin appears to the detector as opposite for two different
section of the strip. This is an example of time reversal symmetry violation of
the particle observed by the detector in its reference frame.
This work has been performed as part of the research program of the “Sticht-
ing voor Fundamenteel Onderzoek der Materie” (FOM) through programme 114
(TRIµP), which is financially supported by the “Nederlandse Organisatie voor
Wetenschappelijk Onderzoek” (NWO). Additional funding was provided by the
European Comission under contract HPRI-CT-2001-50034 (NIPNET) and HPRI-
CT-2001-50022 (Ion Catcher).
Printed by: Ipskamp Drukkers, Enschede, December 2012

RIJKSUNIVERSITEIT GRONINGEN
Precision Spectroscopy of Neutral
Radium: Towards Searches for
Permanent Electric Dipole Moments
Proefschrift
ter verkrijging van het doctoraat in de
Wiskunde en Natuurwetenschappen
aan de Rijksuniversiteit Groningen
op gezag van de
Rector Magnificus, dr. E. Sterken,
in het openbaar te verdedigen op
vrijdag 18 januari 2013
om 11.00 uur
door
Bodhaditya Santra
geboren op 18 januari 1985
te Burdwan, India

Promotor: Prof. dr. K. Jungmann
Copromotor: Dr. L. Willmann
Beoordelingscommissie: Prof. dr. W. Heil
Prof. dr. Y. Blumenfeld
Prof. dr. P. Butler
ISBN: 978-90-367-5915-1 (printed version)
ISBN: 978-90-367-5914-4 (electronic version)

Abstract
Searches for non-zero permanent Electric Dipole Moments (EDM) of funda-
mental particles provide one promising approach for testing the range of validity
of fundamental symmetries. An EDM can arise from the known CP-violation
within the Standard Model (SM). However it is lower by several order of magni-
tude compared to the sensitivity of current and proposed EDM searches. In order
to push the EDM limit towards the SM prediction and beyond we have to explore
the sensitivity of experiments which depends on various issues. The present most
stringent experimental upper bound on dipole moment in an atomic system is
observed in 199Hg vapor, yielding a limit of |d(199Hg)| < 3.1×10⁻²⁹ e cm [1]. This
thesis describes a new experimental approach to search for an EDM in radium
which provides the highest possible sensitivity in such systems. The sensitivity
depend on the particular isotope and the atomic state considered. Production
of rare isotopes of radium with 1/2 nuclear spin and study the atomic physics
properties such as, absolute frequency measurement of the strongest laser cooling
transition and most suitable transition for trapping the radium atoms are the
main challenges of this thesis work. The challenge is accomplished by successful
operation of effusive atomic beam of the isotope 225Ra, production of thermal213Ra atoms and absolute frequency measurement of the main cooling transition
7s2 1S0 − 7s7p 1P1 and trapping transition 7s2 1S0 − 7s7p 3P1 with an accuracy
better than 5 MHz. The hyperfine structure interval of the 7s7p 1P1 level is
also determined with an accuracy better than 4 MHz which is in good agreement
with previous measurement at the ISOLDE facility at CERN. Further, a strategy
based on two-photon Raman transition is demonstrated with barium atoms for
sensitive probing of the metastable D stated in radium. These measurements
provide indespensible input to investigate SM predictions and beyond by means
of observing an EDM in optically trapped radium atoms.

Contents
1 Introduction 1
2 Permanent Electric Dipole Moments 7
2.1 Fundamental Interactions and Symmetries . . . . . . . . . . . . . 7
2.1.1 Fundamental Forces . . . . . . . . . . . . . . . . . . . . . 7
2.1.2 Discrete Symmetries C, P and T . . . . . . . . . . . . . . 8
2.2 Electric Dipole Moment . . . . . . . . . . . . . . . . . . . . . . . 9
2.3 Measurement Principle for Permanent Electric Dipole Moment . . 12
2.4 Sensitivity of an Experiment for Measuring a Permanent Electric
Dipole Moment . . . . . . . . . . . . . . . . . . . . . . . . . . . . 14
2.4.1 Enhancement Factors . . . . . . . . . . . . . . . . . . . . . 14
2.4.2 Achievable Sensitivity for an EDM . . . . . . . . . . . . . 16
3 Properties of Radium 23
3.1 Physical Properties . . . . . . . . . . . . . . . . . . . . . . . . . . 24
3.2 Isotopes of Radium . . . . . . . . . . . . . . . . . . . . . . . . . . 27
3.3 Atomic Structure . . . . . . . . . . . . . . . . . . . . . . . . . . . 27
3.4 Permanent Electric Dipole Moments in Radium . . . . . . . . . . 33
3.5 Conclusion . . . . . . . . . . . . . . . . . . . . . . . . . . . . . . . 35
4 Radium Atomic Beam Development 37
4.1 Sources of Radium Atoms . . . . . . . . . . . . . . . . . . . . . . 37
4.1.1 Radium from Radioactive Sources . . . . . . . . . . . . . . 39
4.1.2 209−214Ra at the TRIµP Facility . . . . . . . . . . . . . . . 41
4.2 Offline Atomic Beam of Radium . . . . . . . . . . . . . . . . . . . 44
4.3 Conversion of Ion to Atom . . . . . . . . . . . . . . . . . . . . . . 51
4.3.1 Characteristics of Effusive Beam . . . . . . . . . . . . . . . 51
4.3.2 Release of Radium from a Zirconium Foil . . . . . . . . . . 56
i

ii CONTENTS
4.3.3 The Ion to Atom Converter . . . . . . . . . . . . . . . . . 65
4.4 Conclusion . . . . . . . . . . . . . . . . . . . . . . . . . . . . . . . 69
5 Lasers and Spectroscopy Setup 71
5.1 Light at Wavelength λ1 from a Frequency Doubled Ti:Sapphire Laser 72
5.2 Diode Lasers . . . . . . . . . . . . . . . . . . . . . . . . . . . . . . 76
5.3 Frequency References . . . . . . . . . . . . . . . . . . . . . . . . . 78
5.3.1 Secondary Frequency References . . . . . . . . . . . . . . . 78
5.3.2 Frequency Comb . . . . . . . . . . . . . . . . . . . . . . . 88
5.4 Absolute Frequency Calibration of Molecular Reference Lines . . . 92
5.4.1 Estimate of Measurement Uncertainties . . . . . . . . . . . 96
5.5 Conclusion . . . . . . . . . . . . . . . . . . . . . . . . . . . . . . . 99
6 Spectroscopy of Radium and Barium in Effusive Atomic Beam 101
6.1 Laser Induced Fluorescence Spectroscopy . . . . . . . . . . . . . . 102
6.2 The 7s2 1S0 − 7s7p 1P1 Transition in 225Ra . . . . . . . . . . . . . 107
6.3 Intercombination Transition in 225Ra . . . . . . . . . . . . . . . . 112
6.4 Two Photon Transition in Atomic Barium . . . . . . . . . . . . . 118
6.5 conclusion . . . . . . . . . . . . . . . . . . . . . . . . . . . . . . . 129
7 Prospects for a Measurement of a Permanent Electric Dipole
Moment in Radium Atoms 131
8 Summary 137
9 Samenvatting 141
A Experimental Setup for Laser Cooling and Trapping of 225Ra 145
B Data Acquisition System 149
C Photomultiplier Tubes 151
C.1 Hamamatsu PMT R7449 . . . . . . . . . . . . . . . . . . . . . . . 151
C.2 Hamamatsu PMT R6060-12 . . . . . . . . . . . . . . . . . . . . . 153
D Bandpass Filters 155
Bibliography 157

CONTENTS iii
List of Publications 173
Acknowledgment 177


Chapter 1
Introduction
In particle physics elementry particles and their interactions are studied. Theories
and discoveries till date have provided ever deeper insights into the structure
and behavior of the most fundamental building blocks of nature. The Standard
Model (SM) summarizes the present understanding of particle physics [2–5] in
one coherent physical theory.
According to the SM there are 12 elementary fermions and 12 force-carrier
bosons. The elementary fermions are the three generations of leptons, i.e. elec-
tron, muon, tau and their respective neutrinos and the three generations of
quarks, i.e. (up, down), (charm, strange) and (top, bottom), which are the
building blocks of matter. The force-carrier bosons include the photon for elec-
tromagnetic interactions, W± and Z0 bosons for the weak interactions, and 8
independent gluons for the strong interactions. An overview of the elementary
particles −fermions and bosons− described by the SM is shown in Fig. 1.1. In
the framework of the SM the strong, weak, and electromagnetic interactions arise
from local symmetry principles [6].
Recent progress has been reported by the two collaborations CMS [7] and
ATLAS [8] at the Large Hadron Collider (LHC), CERN at Geneva, Switzerland.
Both experiments provided clear evidence for a new boson at a mass of about
126 GeV/c2 [7, 8]. This particle could very well be the long sought Higgs boson,
which completes the fundamental particles included in the SM (see Fig. 1.1). In
the near future the properties of this newly observed particle will be studied in
detail in order to identify it unanimously as the Higgs boson or recognize it as a
not yet foreseen new particle −which is still a possibility at present.
The SM provides at present the best and most complete description of all
1

2 Introduction
Fig. 1.1: The Standard Model of elementary particle physics with the elementary
fermions in first three columns representing particle generations, four types of
gauge bosons at two right most column and the Higgs boson at the center [9].
observed subatomic processes, whereas it still does not provide answers to many
yet open questions in particle physics. For example, the dominance of matter over
antimatter in the universe, the spectrum of fundamental particle masses and the
number of the three fundamental fermion generations are not yet explained. The
search for answers to such questions provides the driving force to performing
experiments at highest available energies at, e.g. LEP [10] or LHC [11], searching
for new particles, precision experiments such as the muon magnetic anomaly
[12], and experiments with highest possible sensitivity at low energies such as
the determination of experimental limits on flavor violation in rare decays [13]
and searches for symmetry violations in fundamental processes [14, 15]. The
latter type of experiments has revealed insights into nature where the SM can
not provide a prediction, in particular at energy scales which are by far not
reachable with present accelerator facilities. High mass yet undiscovered particles
can show up in vacuum polarization loops and can therefore be studied indirectly
in precision experiments. Examples of experiments where this road has lead to a
significant increase of our understanding about the elementary particles are the
observation of parity violation in weak interactions [16] in 60Co decay [17] and
the observation of CP-violation in the K0 −K0 oscillation [18]. These facts are

3
incorporated in the SM, however neither explained nor motivated.
Searches for non-zero permanent Electric Dipole Moments (EDM) of funda-
mental particles provide one promising approach for testing the range of validity
of fundamental symmetries. An EDM can arise from the known CP-violation
within the SM. The EDM of a fundamental particle is lower than 10−32 e cm
according to the SM [19]. The present most stringent experimental upper bound
on an EDM is |d(199Hg)| < 3.1 × 10⁻²⁹ e cm [1]. This limit was established by
an EDM measurement which used a dense vapor sample of 199Hg. In order to
push the EDM limit towards the SM prediction and beyond we have to explore
the sensitivity of experiments which depends on various issues.
Structure of This Thesis
This thesis describes a new experimental approach to search for an EDM in an
atom which provides the highest possible sensitivity in such systems, i.e. the
radium (Ra) atom (see Fig. 3.2). In this chapter 1 we provide a general introduc-
tion to the subject of Permanent Electric Dipole Moments and the framework of
the Standard Model in which the present research is carried out.
In Chapter 2 we introduce the EDM of a particle and its connection to fun-
damental interaction and symmetries. In this context we describe fundamental
forces and discrete symmetries. The principle of measurement of an EDM is
discussed in general. Various mechanisms contributing to enhancement factors
for the EDM of composite particles, such as atoms and molecules, are described.
We also estimate an achievable sensitivity for several different types of EDM ex-
periments. The higher sensitivity arises in radium from intrinsic enhancement
mechanisms for fundamental particle EDMs (Section 2.4.1) due to the particular
level scheme. Another relevant aspect of experimental searches is the achievable
signal-to-noise ratio of an EDM measurement which is compared for different
experimental approaches (Section 2.4.2).
In Chapter 3 we report the properties of radium as a physical and chemical
element, its atomic structure. Particularly we describe the atomic enhancement
of an intrinsic fundamental EDM.

4 Introduction
Ra EDM
Computer control and readout
Trap
Atomic data
Spectroscopy
Barium trapping Theory
Frequency references
Atomic beams
Lasers Radium sources
Fig. 1.2: Block diagram of the principal components of the radium EDM experi-
ment. Obtaining spectroscopic data on the atomic and the nuclear data of radium
is a crucial step. This requires a radium atomic beam, several lasers operating
at the relevant optical frequencies and corresponding frequency references. The
experimental data together with the parameters of the experimental setup are
recorded and stored using a data acquisition system. It provides in particular for
remote control of the experiment.

5
Chapter 4 to 6 contain the main body of the experimental work carried out in
the framework of this thesis. In Chapter 4 we describe potential sources of radium
isotopes. All radium nuclei are subject to radioactive decay. The characteristics
of an effusive atomic beam are discussed and the development of two different
effusive beam apparatuses is reported. Chapter 5 explains the optical setup for
precision spectroscopy of radium. In particular several necessary laser systems
and experimental tools are described. The frequency references are based on
molecular transitions in molecular tellurium and iodine. An absolute calibration
of the optical frequencies is performed with an optical frequency comb.
Chapter 6 exploits the achievements which are described in the previous two
chapters. Precision spectroscopy of the main transitions in atomic radium is
carried out in a radioactive atomic beam described in Chapter 4 using the cal-
ibrated laser systemdeveloped in Chapter 5. Optical transition frequencies are
determined with an accuracy better than the natural linewidth of the transitions.
This is required for a stable operation of optical trapping of radium isotopes. Fur-
thermore, a strategy for a sensitive detection scheme of metastable D-states in
radium atoms is demonstrated with the chemical homologue barium.
In Chapter 7 we conclude this work with a discussion of the prospects of an
EDM experiment in radium.


Chapter 2
Permanent Electric Dipole
Moments
2.1 Fundamental Interactions and Symmetries
The Standard Model of particle physics contains three generations of fundamental
fermions, i.e. quarks and leptons, force carrying bosons and the new paradigm
Higgs boson. In this chapter we describe the fundamental forces and discrete
symmetries. A discussion of possible Permanent Electric Dipole Moments in
fundamental and in composite particles is presented.
2.1.1 Fundamental Forces
There are four fundamental forces which are mediated by the exchange of gauge
bosons between fermioninc particles. Electromagnetic interactions are mediated
by photons and affects charged leptons and quarks. Weak interactions are medi-
ated by W± and Z0 bosons. In the electroweak theory electromagnetic and weak
forces are recognized as two different aspects of one force. Strong interactions are
mediated by gluons which carry a color charge. The strong force is independent
of electric charge and acts only on the quarks, nucleons. Gravity, which is not
included in the SM, is mediated by the graviton, which has not been observed
yet. An overview of the four fundamental forces is given in Table. 2.1 where
also their relative strengths and ranges are given. For massless force carriers the
range is infinite, while for massive ones the range is limited by the finite lifetime
of these particles.
7

8 Permanent Electric Dipole Moments
Force Carrier Strength proportionality range Relative
with distance [m] strength
Strong gluons 1 10−15 1038
Electromagnetic photon1
r2∞ 1036
Weak W±, Z0 1
rexp−kmB · r 10−18 1025
bosons
Gravitation graviton1
r2∞ 1
Table 2.1: An overview of four fundamental forces. The force carriers, strength
of the forces as a function of distance r, range and relative strength for the
corresponding interactions are given.
2.1.2 Discrete Symmetries C, P and T
Symmetries and invariances play an important role in physics. According to
Emmy Noether’s theorem every symmetry is connected to a conservation law [20].
There are two different types of symmetries. Continuous symmetries which are
characterized by continuous mathematical functions and discrete symmetries.
Examples of continuous symmetries contain translation and rotation. Invari-
ance under translational and rotational symmetry leads to the conservation of
linear and angular momentum respectively.
The SM knows the three discrete symmetries, the charge conjugation (C), the
parity (P) and the time reversal (T).
Charge conjugation means the exchange of all particles with their antiparticles
mathematically described by the charge conjugation operator C. This operator
C has the properties
CC|ψ〉 = C2|ψ〉 , (2.1)
where |ψ〉 is an eigenstate of the operator and the eigenvalue C can be +1 or −1.

2.2 Electric Dipole Moment 9
A Parity operation means the inversion of the spatial coordinates ~r → −~rthrough the origin. This operation is identical to a mirror image and a rotation.
Parity symmetry is represented by the parity operator P through
P P |ψ〉 = P 2|ψ〉 , (2.2)
where the eigenvalue P can be +1 or −1.
The Time reversal symmetry is the invariance of a particle or an interaction
under the transformation t → t′ = −t. There is no quantum number associated
with the time reversal symmetry. For this symmetry we have
|ψ(r, t)2| T−−→ |ψ′(r, t)2| = |ψ(r,−t)2| . (2.3)
Reaction rates and detailed balances in all chemical reactions are conserved be-
cause of time reversal invariance.
The role of a violation of the combined charge conjugation and parity opera-
tion, CP , is of particular importance because of possible relation to the observed
matter-antimatter asymmetry in the universe. A. Sakharov [21] has suggested
that the asymmetry in matter-antimatter may be explained via CP-violation in
the early universe in a state of thermal non-equilibrium together with baryon
number violating processes. The known sources of CP-violation in the SM are
insufficient to satisfy the needs of this elegant model. In particular the known
strength of CP violating processes is too small. EDMs, which also violate CP ,
offer excellent oppertunities to find and identify new sources of CP-violation be-
yond the present theory [22].
2.2 Electric Dipole Moment
The electric dipole moment ~d of a system is a vectorial quantity. For a system
composed of two charges +e and −e separated by distance ~r it is defined as
~d = e · ~r . (2.4)
The vector ~d is parallel to the direction of the spin ~I of a quantum mechanical
object since all components perpendicular to ~I are averaged to zero over time [23].
Thus we can write
~d = d~I
|~I|, (2.5)

10 Permanent Electric Dipole Moments
+e
-e
r T P +e
-e
r r
-e
+e
I I
I Parity Time reversal
Fig. 2.1: Electric dipole moment of a particle violates parity (P) and time reversal
(T) symmetries at the same time.
where d can be seen as the electrical counterpart to the magnetic moment µ. The
Hamiltonian of a neutral non-relativistic particle in a magnetic field ~B and an
electric field ~E is
H = −(µ~B + d ~E) ·~I
|~I|, (2.6)
where ~µ is the magnetic moment and ~d is the electric dipole moment of the
particle.
Under a parity operation we have P ( ~B ·~I ) = ~B ·~I for the magnetic interaction,
whereas P ( ~E · ~I ) = − ~E · ~I for the electric interaction. Therefore the existance
of a non-zero value of ~d will mean a violation of parity. Under the time reversal
operation we have T ( ~B · ~I ) = ~B · ~I, whereas T ( ~E · ~I ) = − ~E · ~I. Therefore,
there will be a violation of time reversal symmetry if a non-zero value of ~d is
found. Hence, a non-zero ~d can only exist if and only if parity and time resersal
symmetry are violated [24].
A Permanent Electric Dipole Moment of any fundamental particle violates
both parity (P) symmetry and time reversal (T) symmetry. With the assump-
tion of CPT invariance an Electric Dipole Moment also violates CP symmetry.
EDMs for all particles which are due to known sources of CP violation are at least
4 orders of magnitude below the present experimentally established limit [22]. A
large number of theoretical models foresees Permanent Electric Dipole Moments
which could be as large as the present experimental limits just allow [22]. His-

2.2 Electric Dipole Moment 11
Fig. 2.2: A variety of underlying mechanism responsible for an induced EDM of
a composite particle by EDM of fundamental particle [25].
torically the non-observation of Permanent Electric Dipole Moments has ruled
out more speculative models than any other single experimental approach in all
of particle physics [26]. The discovery of a non-zero EDM will also limit the θ
term in the QCD Lagrangian. The θ term is one of the fundamental SM param-
eters and, at this point, cannot be calculated from first principles [27]. There is
no prediction for this parameter within the SM. A limit on this term provides
information on the “Strong CP-problem” [28, 29]. Permanent Electric Dipole
Moments have been searched for several systems with different sensitivities (see
Table 2.2).
Any new limit on an EDM which is larger than the SM predicted values can
provide steering to model building. This could provide clues and hints towards
answering questions such as the asymmetry in the baryogenesis which led to the
large asymmetry of matter and antimatter in the universe [21].
EDM of a fundamental particle may be enhanced in composed systems such
as the atoms or molecules. Fig. 2.2 give an overview of mechanisms that explain
how an EDM of a fundamental particle can induce an EDM into a composite
system. A compilation of recent experimental limits on a possible Electric Dipole
Moment is given in Table. 2.2.

12 Permanent Electric Dipole Moments
Particle EDM Limit [e·cm] SM prediction [e·cm]
µ 1.8 × 10⁻¹⁹ (95% C.L.) [30] < 10−36 [31]
n 2.9 × 10⁻²⁶ (90% C.L.) [32] < 10−32 [33]199Hg 3.1 × 10⁻²⁹ (95% C.L.) [1] ∼ 10−33 [24]
YbF 10.5 × 10⁻²⁸ (90% C.L.) [34] < 10−38 [35]129Xe 3.4 × 10⁻²⁷ (90% C.L.) [36] ∼ 10−34 [37]205Tl 1.6 × 10⁻²⁷ (90% C.L.) [38]
Table 2.2: Limits on electric dipole moments of different systems as of 2012.
Here we have muon (µ), neutron (n), Mercury (199Hg), Ytterbium fluoride (YbF),
Xenon (129Xe) and Thallium (205Tl).
2.3 Measurement Principle for Permanent Elec-
tric Dipole Moment
A search for the existence of a non-zero permanent Electric Dipole Moment
(EDM) of a fundamental particle is an exclusively experimental assignment [14].
An EDM of a fundamental particle can induces an EDM into composite particles
like nuclei, atoms and molecules. The radium atom is one of such composite sys-
tems which has excellent properties for searching non-zero EDMs [39]. In order to
develop an EDM experiment using atomic radium, the atomic and nuclear prop-
erties of radium atom has to be known with high precision, i.e. all relevent atomic
properties need to be known at the 10−3 level for a state of the art experiment
capable of steering theory development.
For a particle with nuclear spin ~I, the Larmor precession frequency for parallel
and anti-parallel magnetic ( ~B) and electric ( ~E) fields are
|−→ω1| =~µ · ~B + ~d · ~E
~|~I|and (2.7)
|−→ω2| =~µ · ~B − ~d · ~E
~|~I|. (2.8)
The difference between the frequencies ~ω1 and ~ω2 is proportional to the contri-
bution from the electric dipole moment ~d (Eq. 2.9) and the electric field ~E. A
measurement of ~d is a measure of linear Stark shift of the energy level of the

2.3 Measurement Principle for EDM 13
particle under consideration
~d =~|~I|(−→ω1 −−→ω2)
2| ~E|. (2.9)
d
I = 1/2
mI =1/2
mI = -1/2
ω1 ω2
d
( i ) ( ii )
( iii )
E B E B
µ µ
_
Fig. 2.3: Principle of an EDM measurement, where a spin I = 1/2 particle is
alternatively subjected to parallel and antiparallel external magnetic and electric
fields orthogonal to its spin. An EDM manifests itself as a difference in the spin
precision frequencies ω1 and ω2 for both cases.

14 Permanent Electric Dipole Moments
2.4 Sensitivity of an Experiment for Measuring
a Permanent Electric Dipole Moment
At present the most sensitive limit on an Electric Dipole Moment of a particle
comes from an experiment in a composite particle, the 199Hg atom. Particularly
in composite systems large internal fields can exist, which increase the sensitiv-
ity of an EDM experiment. The present limits obtained for an Electric Dipole
Moment in different systems arise not only from the statistical sensitivity of the
EDM experiments but also they are due to the limited control over experimental
parameters in such experiments. In this section we discuss the aspects of gaining
sensitivity in an EDM experiment through the choice of a particular system and
control over systematic uncertainties.
2.4.1 Enhancement Factors
The predicted value of an EDM of a fundamental particle in the Standard Model
of particle physics is too small to be detect at the currently possible experimental
sensitivity. However, many extensions of the SM predict values, which could well
be detected with the achievable sensitivity of many experiments.
Heavy Nuclei
The EDM of a fundamental particle can induce an EDM into a composite system
like atoms or molecules. Paramagnetic atoms and molecules are sensitive to the
EDM which arises from an unpaired electron. In heavy paramagnetic atoms a
possible EDM of the electron is enhanced by a factor R≡ datom/de. R is given by
Eq. 2.10 [24].
R ∼ 10Z3α2
J(J + 1/2)(J + 1)2. (2.10)
For a large Z this factor can provide for a few orders of magnitude enhance-
ment of the electric field inside the atom or molecule [24]. Enhancement factors
for electron EDMs for several atoms and molecules are given in Table. 2.3 and
Table. 2.4.

2.4 Sensitivity of an Experiment for Measuring an EDM 15
Atom Cs Au Tl Fr Ra (3D1)
R ≡ datom/de 133 260 585 1150 5400
Table 2.3: Enhancement factors R of electron EDMs for several atomic systems.
Molecule YbF WC HfF+
|Eeff |/1010 [V/cm] 2.5 6 2.4
Table 2.4: Enhancement factors of electron EDMs for several molecular systems.
In presence of external electric field the effective internal electric field Eeff in the
molecules is enhanced by large factors.
Schiff Moment
In an external electric field there is an enhancement of the effective electric field
in an atom. If the atom is placed in an external electric field the original charge
distribution of the atom is polarized in such a way that the positive charges
are accumulated in one direction while the negative charges are accumulated
in the opposite direction to cancel the external electric field (Fig. 2.4). The
Fig. 2.4: Redistribution of the charge distribution of the electron cloud in an
atom while placed in an external electric field [40,41].

16 Permanent Electric Dipole Moments
redistribution of charges produce a net zero field at the center of the charge
distribution which effectively works in atoms as a shielding of the nucleus [40,41].
This argument does not include the fact that the size and structure of the particle
is finite, the direction of spin of the particle is correlated with the direction
of electric field, the corrections due to relativistic effects are incorporated in
the interaction Hamiltonian of the particle, and the spin dependent forces are
connected to the dynamics of the particle [40,41].
Atomic Structure
In an external electric field the states of opposite parity in a composite system are
mixed. The electric field due to a fundamental EDM may polarize the composite
system and the resultant EDM is then modified. As a consequence an EDM of its
constituents is enhanced in an atom. The polarizability of the atom is inversely
proportional to the difference in energy between the degenerate states of opposite
parity. The enhancement of the EDM increases as the energy difference between
the closely laying states decreases [42].
2.4.2 Achievable Sensitivity for an EDM
The achievable sensitivity for an EDM depends on the statistical and the system-
atic uncertainties. The statistical sensitivity arises from the number of particles
(Ntotal) in the experiment and the efficiency of the detection of the dipole mo-
ment. Systematic uncertainties arise from the overall control over the parameters
which effect the spin precession measurement. This includes the electric field (E),
the polarization (P), the coherence time (τ) and the efficiency of the experiment
(ε). The generic sensitivity of an electric dipole moment |~d| is
δd =~|~I|
EPετ√Ntotal
. (2.11)
The estimate of the total number of particles Ntotal depends on the type of the
EDM experiment. This is analyzed for experimental strategies employing beams,
cells or magnetic bottles, or neutral atom traps.
For a beam of flux F and total measurement time Ttotal, Ntotal can be written
as
N beamtotal = F · Ttotal . (2.12)
In a beam experiment atoms or molecules can not be reused for more than one
measurement. In a cell experiment particles can be reused for more than one
2.4 Sensitivity of an Experiment for Measuring an EDM 17
measurement. For a cell of volume V filled with particles of density n, Ntotal is
N celltotal = n · V ·Nmeasurements . (2.13)
An estimate of Ntotal for an EDM experiment in a trapped sample is similar to
that in a cell. For a number of trapped atoms Ntrap for a single measurement,
the total number of atoms in the EDM experiment is
N traptotal = Ntrap ·Nmeasurements (2.14)
For such an EDM experiment in a trap, Nmeasurements can be decomposed as
N trapmeasurements = ζ
T
τ(2.15)
where ζ is a proportionality constant. Depending on experimental stability ζ can
have a value in the range of 0.1 < ζ < 1. T is the time how long the atoms are
available for the measurement. For short-lived atoms T is defined by the mean
life time of the atomic nucleus and the trap lifetime. For an EDM experiment
with trapped atoms the sensitivity of the measurement can be redefined as
[δd]trap =~|~I|
EPετ
√Ntrap · ζ
T
τ
. (2.16)
From Eq. 2.16 one can see that the technique of trapping atoms renders the
possibility to reuse the atoms and thereby to perform more than one measure-
ment on each of them. This provides an advantage in particular for an EDM
measurement in scarce atomic isotopes. Reusing the atoms leads to a lower re-
quirement on the incoming flux of atoms. This increases the feasibility of a higher
sensitivity experiment for an EDM with rare atoms.

18 Permanent Electric Dipole Moments
Trapping efficiency [%]
-510 -410 -310 -210 -110 1
Ra
Flu
x [1
/s]
710
810
910
1010
1110
1210= 10 s
6= 10trapN
4= 10trapN
2= 10trapN
Trapping efficiency [%]
-510 -410 -310 -210 -110 1
Ra
Flu
x [1
/s]
710
810
910
1010
1110
1210= 100 ms
= 1 s
= 10 s
6= 10trapN
τ
τ
τ
τ
Fig. 2.5: (Top): Required flux of radium atoms for an EDM experiment as a
function of trapping efficiency (εtrap) and for a spin coherence time τ = 10 s.
Three different solid lines in the plot represents three different particle numbers
(Ntrap) in the trap. (Bottom): Required flux of radium atoms for an EDM
experiment as a function of trapping efficiency for Ntrap = 106. Three different
solid lines correspond to three different spin coherence times (τ). The dotted line
in both the plots shows the yield of 225Ra at the ISOLDE facility at CERN as an
example of present possibilities.

2.4 Sensitivity of an Experiment for Measuring an EDM 19
Flux of atoms required for a trapping efficiency εtrap is given by,
F =Ntrap
εtrap· 1
τ, (2.17)
where τ is the spin coherence time and Ntrap is the number of particles in the trap.
A plot of required flux as a function of trapping efficiency is shown in Fig. 2.5.
The top plot shows required flux of radium atoms required for a trap experiment
as a function of trapping efficiency for a spin coherence time of 10 s. Three
different lines in the plot represent three different particle numbers (Ntrap) in the
trap. The bottom plot shows the required flux of radium atoms as a function
of trapping efficiency for Ntrap = 106 particles in the trap. Three different lines
correspond to three different spin coherence times (τ). This analysis shows that
a larger trapping efficiency enables the feasibility of an EDM experiment even
with a low particle flux and with shorter spin coherence time.
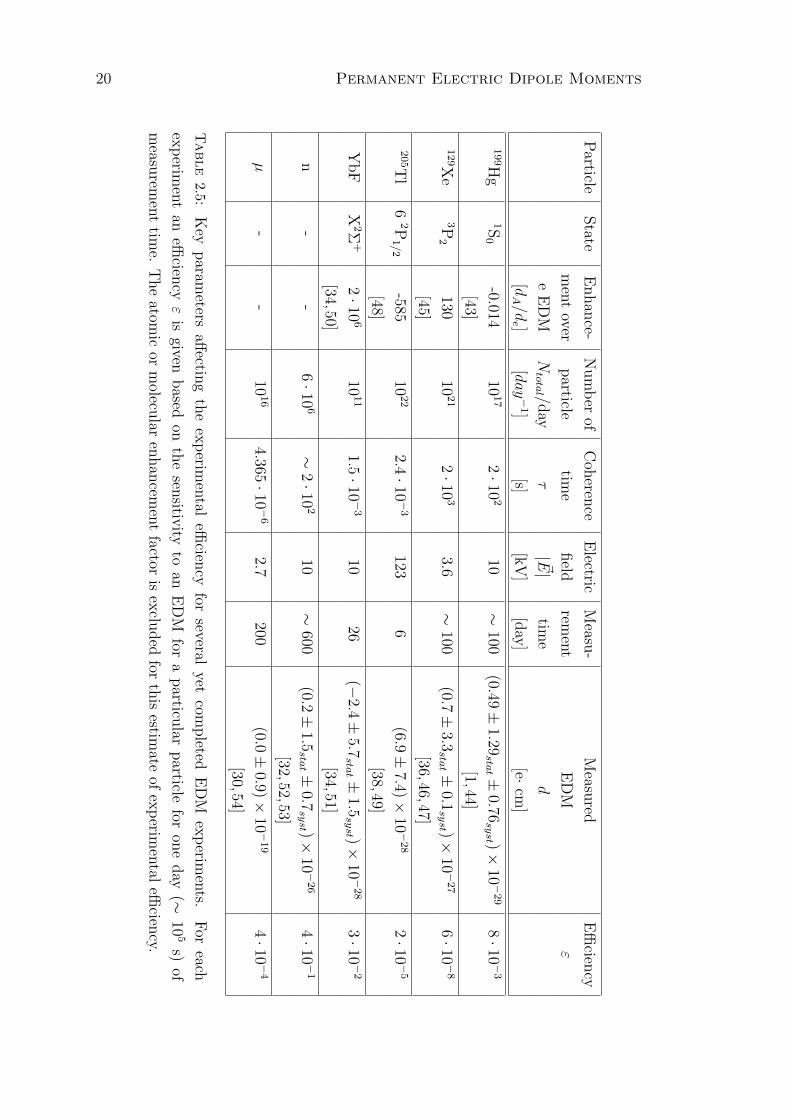
The parameters affecting the sensitivity of an EDM measurement for several
completed EDM experiments are summarized in Table. 2.5. For each experiment
the sensitivity of the EDM of the particle in the experiment is extracted for one
day of measurement time. This extraction is performed by considering the overall
sensitivity of the EDM experiment and the total measurement time. Atomic
enhancement factors are taken into account in order to find the sensitivity to the
EDM of the atom or molecule in the experiment.
EDM experiments on the deuteron and the atomic radium are presently under
development. The key parameters for the efficiency of the EDM experiments with
deuteron and radium atoms are summarized in Table. 2.6. The experimental
sensitivity of the radium EDM is analyzed for three possible EDM measurements
in three different states of the radium atom.
Fig. 2.6 represents a graphical comparison of the experimental efficiency for
several EDM experiments. The efficiency of the experiments are displayed as a
function of the total number of particles required per day for an EDM measure-
ment. Blue markers correspond to already completed EDM experiments. Green
markers represent the deuteron and Radium EDM experiments. The lines in the
plot represent the efficiency of an EDM experiment as a function of the total
number of particles per day in that particular experiment. Three lines are plot-
ted for three different EDM sensitivities (δd). This graphical analysis (Fig. 2.6)
is a compilation of the parameters given in Table. 2.5 and Table. 2.6 for several
EDM experiments. This analysis provides a guideline for choosing a direction for
a further increase of the experimental sensitivity of one of the EDM experiments
shown in Fig. 2.6.
20 Permanent Electric Dipole Moments
Particle
State
Enhan
ce-N
um
ber
ofC
oheren
ceE
lectricM
easu-
Measu
redE
fficien
cy
men
tover
particle
time
field
remen
tE
DM
ε
eE
DM
Ntotal /d
ayτ
| ~E|tim
ed
[dA/d
e ][day−
1][s]
[kV
][d
ay]
[e·cm
]
199H
g1S
0-0.014
1017
2·10
210
∼100
(0.49±
1.29sta
t ±0.76
syst )×
10−
29
8·10
−3
[43][1,44]
129X
e3P
2130
1021
2·10
33.6
∼100
(0.7±
3.3sta
t ±0.1
syst )×
10−
27
6·10
−8
[45][36,46,47]
205T
l6
2P1/2
-58510
22
2.4·10
−3
1236
(6.9±
7.4)×10−
28
2·10
−5
[48][38,49]
YbF
X2Σ
+2·10
610
11
1.5·10
−3
1026
(−2.4±
5.7sta
t ±1.5
syst )×
10−
28
3·10
−2
[34,50][34,51]
n-
-6·10
6∼
2·10
210
∼600
(0.2±
1.5sta
t ±0.7
syst )×
10−
26
4·10
−1
[32,52,53]
µ-
-10
16
4.365·10
−6
2.7200
(0.0±
0.9)×10−
19
4·10
−4
[30,54]
Table
2.5:K
eyparam
etersaff
ecting
the
exp
erimen
taleffi
ciency
forseveral
yetcom
pleted
ED
Mex
perim
ents.
For
each
exp
erimen
tan
efficien
cyε
isgiven
based
onth
esen
sitivity
toan
ED
Mfor
aparticu
larparticle
foron
eday
(∼10
5s)
of
measu
remen
ttim
e.T
he
atomic
orm
olecular
enhan
cemen
tfactor
isex
cluded
forth
isestim
ateof
exp
erimen
taleffi
ciency.

2.4 Sensitivity of an Experiment for Measuring an EDM 21
Par
ticl
eSta
teE
nhan
cem
ent
Enhan
cem
ent
Num
ber
ofC
oher
ence
Ele
ctri
cM
easu
-E
DM
Effi
cien
cy
over
eov
er199H
gpar
ticl
eti
me
fiel
dre
men
tlim
itε
ED
ME
DM
Ntotal/
day
τ|~ E|
tim
ed
[dA/d
e]
[dA/d
Hg]
[day−
1]
[s]
[kV
][d
ay]
[e·c
m]
deu
tero
n-
-10
310
13
103
120
∼10
0<
10−
29
1·1
0−2
[1,5
5][5
6]225R
a1S
0-
102−
103
109
102
100
100
3×
10−
28
7·1
0−1
[57,
58]
[59]
225R
a3D
2-
105
1015
3·1
0−5
101
<10−
22
4·1
0−1
[39,
42]
[42]
225R
a3D
15·1
03-
1014
5·1
0−4
101
<10−
23
9·1
0−1
[39,
42]
[42]
Table
2.6:
The
par
amet
ers
affec
ting
the
effici
ency
ofth
eE
DM
exp
erim
ents
usi
ng
deu
tero
nan
dra
diu
mat
oms.
The
radiu
m
atom
isan
alyze
dfo
rth
ree
pos
sible
ED
Mex
per
imen
tsan
dfo
rth
ree
diff
eren
tat
omic
stat
es.
Thes
eex
per
imen
tsar
epre
sentl
y
ata
dev
elop
men
tst
age.
The
exp
erim
enta
leffi
cien
cyε
ises
tim
ated
for
one
day
mea
sure
men
tti
me.

22 Permanent Electric Dipole Moments
/daytotalN710 910 1110 1310 1510 1710 1910 2110 2310
εE
ffic
ien
cy o
f ex
per
imen
t,
-910
-810
-710
-610
-510
-410
-310
-210
-110
1
Hg199
Xe129
Tl205
YbF
n
µ
deuteron
)0S1Ra(225
)2D3Ra(225
)1D3Ra(225
ecm-24 d=10δ
ecm-26 d=11δ
ecm-28 d=10δ
Fig. 2.6: The efficiency of EDM experiments as a function of the total number
of particles Ntotal per day for several EDM experiments. Blue markers represent
the completed EDM measurements. Green markers represent EDM experiments
under development. The lines in this graph represent the efficiency (ε) of the
respective EDM experiments as a function of Ntotal per day. Three lines are
plotted for three different EDM sensitivities (δd). The uncertainty reported with
the data are smaller than the symbol sizes. The data were compiled in Table 2.5
and 2.6 where references are given.

Chapter 3
Properties of Radium
A permanent Electric Dipole Moment (EDM) is proportional to the angular mo-
mentum in a fundamental system. Therefore the system needs to have a finite
angular momentum in order to exploit for an EDM search. Isotopes of radium
with non-zero nuclear spin, i.e. the isotopes with an odd number of nucleons,
have been identified as excellent candidates for such experiments [39]. In par-
ticular the isotopes with nuclear spin 1/2, i.e. 225Ra and 213Ra, are well suited
candidates because they offer a less complicated atomic level structure. The pe-
culiarities in the nuclear and atomic energy level structures of radium offers large
enhancement factors of a potential nuclear and electron EDM. This results in an
induced atomic EDM which is several order of magnitude larger than in other
atomic systems. This amplification gives access to a range of values for EDMs
which is not accessible otherwise. In order to develop an EDM experiment with
radium its nuclear and atomic properties need to be determined preciously.
This chapter provides an overview of radium, which is the heaviest element
in the second group of elements in the periodic table, the alkaline earth metals.
Group-2 elements have two valance electrons in the outer shell. All isotopes of
radium are radioactive with half lifetimes varying from 182 ns for 216Ra to 1600
years for 226Ra. The concentration of the naturally occurring isotope 226Ra in
nature is about one part in a trillion or 1 pCi g−1 [60]. It originates from the234U decay chain.
The physical properties of metallic radium, such as the vapor pressure, the
radioactive half lifetime and the nuclear spin are relevant for the design of an
atomic beam of radium. The knowledge of the atomic energy level structure of
radium is indispensable since not only the enhancement factors for a possible
EDM, but also the state preparation and manipulation depends on it. Informa-
23

24 Properties of Radium
tion on atomic transition frequencies, hyperfine structures, lifetimes of excited
states and metastable states is necessary for the design and operation of an EDM
experiment.
3.1 Physical Properties
In 1896 Henry Becquerel discovered the natural occurrence of phosphorescence
in pitchblende, an ore that contain uranium oxide. Shortly after that in 1898
Marie Curie and Pierre Curie investigated this new property of pitchblende and
extracted by chemical means a substance which was found to be much more
active than the original pitchblende. This new substance was named radium
derived from the Latin word radiare meaning radiating. There is about 1 g of
radium in 7000 kg of pitchblende. The term radioactivity was also coined by
Marie Curie. The activity of 1 g 226Ra was defined later used to the unit of
radioactivity, Curie (Ci). In 1911 radium was extracted as a pure metal, which
is brilliant white and solid. A list of various atomic properties of radium is given
below (Table. 3.1).
Property Radium
Symbol Ra
Atomic number 88
Atomic mass 226.03 gm/mol
Phase solid
Density 5 gm/cm3
Melting point 973 K
Boiling point 2010 K
1st ionization energy 509.3 kJ/ mol
2nd ionization energy 979.0 kJ/ mol
Most abundant isotope 226Ra (>90%)
Electron configuration [Rn] 7s2
Ground state 7s2 1S0
Table 3.1: Properties of the heavy alkaline earth element radium [61,62].
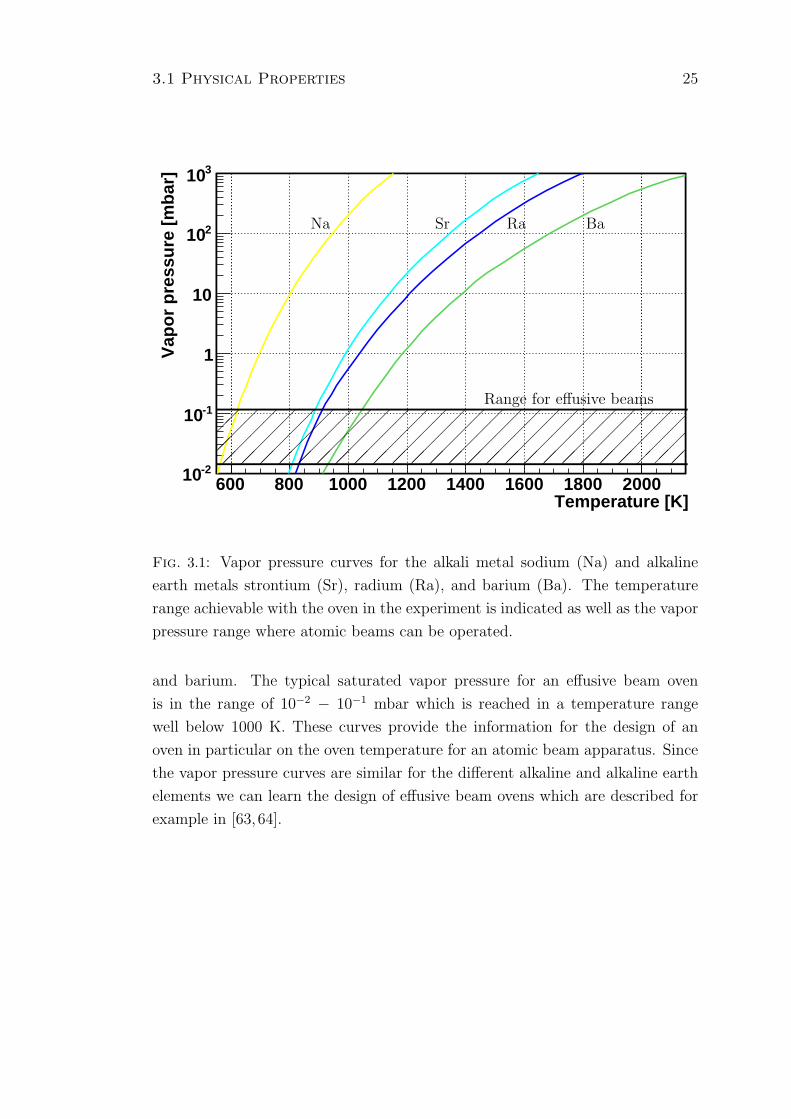
Figure. 3.1 shows the vapor pressure dependence on temperature for the alkali
metal element sodium and the alkaline earth metal elements strontium, radium,
3.1 Physical Properties 25
Temperature [K]600 800 1000 1200 1400 1600 1800 2000
Vap
or
pre
ssu
re [
mb
ar]
-210
-110
1
10
210
310
Na Sr Ra Ba
Range for effusive beams
Fig. 3.1: Vapor pressure curves for the alkali metal sodium (Na) and alkaline
earth metals strontium (Sr), radium (Ra), and barium (Ba). The temperature
range achievable with the oven in the experiment is indicated as well as the vapor
pressure range where atomic beams can be operated.
and barium. The typical saturated vapor pressure for an effusive beam oven
is in the range of 10−2 − 10−1 mbar which is reached in a temperature range
well below 1000 K. These curves provide the information for the design of an
oven in particular on the oven temperature for an atomic beam apparatus. Since
the vapor pressure curves are similar for the different alkaline and alkaline earth
elements we can learn the design of effusive beam ovens which are described for
example in [63,64].

26 Properties of Radium
Atomic mass Nuclear spin Nuclear magnetic Half-life
(A) (I) moment (µI) [µN ] (T1/2)
207 (3/2, 5/2) - 1.3 s
208 0 0 1.3 s
209 5/2 0.865(13) 4.6 s
210 0 0 3.7 s
211 5/2 0.8780(38) 13 s
212 0 0 13 s
213 1/2 0.6133(18) 2.73 m
214 0 0 2.46 s
221 5/2 -0.1799(17) 28 s
223 3/2 0.2705(19) 11.43 d
224 0 0 3.66 d
225 1/2 -0.7338(15) 14.9 d
226 0 0 1600 y
227 3/2 -0.4038(24) 42.2 m
228 0 0 5.75 y
229 5/2 0.5025(27) 4 m
230 0 0 93 m
231 (5/2) - 103 s
232 0 0 4.2 m
233 - - 30 s
234 0 0 30 s
Table 3.2: Radium isotopes with nuclear half-life T1/2 > 1 s. The atomic mass
(A), the nuclear spin (I), the half-life and the nuclear magnetic moment (µI) are
presented. µI is given in units of nuclear magneton µN = 3.1524512605(22)×10−14
MeV T−1 [65].

3.2 Isotopes of Radium 27
3.2 Isotopes of Radium
A crucial aspect relating to the development of an EDM experiment on radium
is the availability of suitable radium isotopes. All isotopes of radium are scarce
because of the rather short lifetimes of these radioactive isotopes. Radium has
25 different known isotopes [66]. Isotopes with a nuclear half-life larger than 1 s
are listed in Table 3.2. The isotope with the largest abundance and the longest
lifetime is 226Ra. Its nuclear spin is I = 0 and thus it is not suitable for EDM
searches. Some of the radium isotopes are daughter product of the decay chain
of uranium or thorium isotopes. All other radium isotopes can be produced at
the nuclear reactors.
The argument of spin 1/2 isotope of radium for the interpretation of a possible
EDM singles out the isotopes 213Ra and 225Ra. While 225Ra is available from a229Th source (Section 4.1.1) the short lived 213Ra is only available at radioactive
isotope production facilities, e.g. TRIµP, KVI, Groningen, The Netherlands or
ISOLDE, CERN, Geneva, Switzerland or TRIUMF, Vancouver, Canada.
3.3 Atomic Structure
Data on optical spectroscopy of the rare element radium are scare. Here we
present the spectroscopic work and the results from atomic structure calculations
that has been performed on atomic radium to date.
The first optical spectroscopy of radium was performed in 1933 by E. Ras-
mussen on atomic [67] and ionic [68] ensembles. The spectrum with a total of
96 transitions was recorded on photographic plates after a grating spectrometer.
The uncertainty of this measurement was estimated to 10−2 cm−1 or a relative
accuracy of 10−6 [67]. These measurements gave the first atomic energy level
structure of radium which confirmed identified radium as an alkaline earth ele-
ment. In 1934 a reanalysis by H. N. Russel yielded corrections to several term
energies of the triplet D states [69]. The new assignment resulted in a shift
of a few levels of 612 cm−1 with respect to their earlier classification by Ras-
mussen [67]. The analysis also yielded the first ionization potential of atomic
radium to be 5.252 eV [69]. In 1967 and 1980 the Rydberg series in radium atom
was measured by absorption spectroscopy in a radium cell [70, 71].
The first time laser spectroscopy of radium was performed in 1983 at the
ISOLDE isotope production and separation facility of CERN in Geneva, Switzer-
land [72]. The hyperfine structures and isotope shifts of a series of radium iso-

28 Properties of Radium
7s 7p 1P1
7s2 1S0
7s 7p
3P2
3P1 3P0
3D3 3D2 3D1
0
Ener
gy [c
m-1
]
10000
20000
7s 6d
7s 6d 1D2
λ1
λIC
λIR2
λIR3
3/2
1/2
3/2
1/2
λIR1
λ1= 482.7 nm λIC= 714 nm λIR1= 1428.6 nm λIR2= 1487.7 nm λIR3= 2751.6 nm
Fig. 3.2: Simplified energy level structure of atomic radium. The hyperfine states
are shown only for 1P1 and 3P1 states. Wavelengths are taken from [67].
topes with half-lives between 23 ms and 1600 year were investigated using online
collinear fast beam laser spectroscopy [72]. The measuremens were carried out
on 18 radium isotopes in the range A = 208 − 232 with intensities of up to 108
radium atoms/s in a beam of 60 keV of energy. The 7s2 1S0− 7s7p 1P1 transition
in the radium atom and the 7s 2S1/2−7p 2P1/2 transition in the Ra+ ion were
observed. The hyperfine splittings and the isotope shifts were evaluated with an
experimental error of <10 MHz. Later the isotope shift of the 7s2 1S0− 7s7p 3P1
and the 7s2 3P2− 7s7p 3D3 transitions were measured by the same technique [73].
The nuclear magnetic moments (µI) of 213Ra and 225Ra were measured by ob-
serving the Larmor precession of optically pumped atoms in a fast beam at the
ISOLDE facility [74]. A list of the nuclear magnetic moments, (µI) in units of
nuclear magneton (µN) is compiled, in Table. 3.2.
Recently the 7s2 1S0− 7s7p 1P1, 7s2 1S0− 7s7p 3P1 and 7s2 1P1− 7s7p 3D1 tran-
sition frequencies were measured at the Argonne National Laboratory, Chicago,
IL, USA with uncertainties of 180 MHz [78], 30 MHz [79] and 600 MHz [80] re-
spectively. The lifetimes of the 7s7p 3P1 [79], 7s6d 3D1 [80] and 7s6d 1D2 [78]

3.3 Atomic Structure 29
Upper Lower Wavelength Transition probability
level level [nm] (Aik) [s−1]
Ref. [67, 69] Ref. [75] Ref. [76]
7s8p 1P1 7s2 1S0 304.3 - 2.9·107
7s6d 1D2 633.9 - -
6d7p 3D1 7s2 1S0 310.3 - -
7s6d 1D2 660.1 - -
7s6d 3D2 548.4 - -
7s6d 3D1 540.1 - -
7s8s 1S0 7s7p 1P1 1417.9 - 1.2·107
7s8s 3S1 7s7p 1P1 1656.1 - 3.2·105
7s7p 3P1 748.8 - 2.4·107
7s7p 1P1 7s2 1S0 482.7 1.8·108 1.8·108
7s6d 1D2 2751.6 3.2·105 2·105
7s6d 3D2 1487.7 1·105 8·104
7s6d 3D1 1428.6 3.3·104 4.4·104
7s6d 1D2 7s7p 3P2 25451.1 5.9·100 6.4·100
7s7p 3P1 3244.6 6.7·102 1.4·103
7s7p 3P1 7s2 1S0 714.3 2.4·106 2.7·106
7s6d 3D2 1848428.8 1.8·10−3 2·10−3
7s6d 3D1 35269.6 8.8·101 1·102
Table 3.3: Wavelengths and decay rates of relevant transitions between low en-
ergy states in radium.
states were also measured in the same setup. Within the framework of this thesis,
the 7s2 1S0− 7s7p 1P1 and the 7s2 1S0− 7s7p 3P1 transition frequencies have been
determined by Doppler free fluorescence spectroscopy with uncertainties of less
than 5 MHz. The laser frequency in these measurements was stabilized with an
optical frequency comb (see also Section 5.3.2).
The unique nuclear and atomic properties are the core reason for the large
enhancement factors in radium isotopes which make precision experiments to
investigate fundamental characteristics of nature feasible [39]. This provides a
strong motivation for performing high precision calculations of wave functions
for different atomic states in radium [25, 81]. Knowledge of the wave function
close to and in some distance from the nucleus are important for the hyperfine

30 Properties of Radium
Lifetimes of the excited states in radium
States Theory Experiment
Ref. [42] Ref. [77] Ref. [76] Ref. [75] Ref. [78–80]
7s7p 1P1 5.5 ns 5.53 ns 5.5 ns 5.56 ns
7s7p 3P2 74.6 ns 5.55 µs 5.4 µs 6.46 µs
7s7p 3P1 505 ns 362 ns 360 ns 421 ns 422(20) ns
7s7p 3P0 - - - 34(15) s
7s6d 1D2 38 ms 129 ms 710 µs 1.37 ms 385(45) µs
7s6d 3D3 - - - 157 s
7s6d 3D2 15 s 3.3 s - 3.95 s
7s6d 3D1 617 µs 654 µs 640 µs 719 µs 510(60) µs
Table 3.4: Lifetimes of low lying states in atomic radium.
interactions and the transition probabilities. Calculations on the radium atom
are challenging because high precision calculations need to be carried out rela-
tivistically. Precision measurements of transition frequencies, hyperfine struc-
ture intervals, lifetime of excited states and isotope shifts provide indispens-
able input for such calculations. Different theoretical approaches such as rel-
ativistic Hartree-Fock (RHF), many-body perturbation theory (MBPT), multi-
configuration Dirac-Hartree-Fock (MCDHF) models were followed by different
groups [75–77,82,83] for these calculations. The term energies and lifetimes cal-
culated with different models have shown large discrepancies for some cases such
as lifetime of metastable D-states. The present knowledge about the transition
wavelengths and transition probabilities of different states of atomic radium are
represented in Table. 3.3. Theoretical and experimental values of lifetimes of
several lower laying atomic states of radium are listed in Table. 3.4. The large
variation of the results from the atomic structure calculations underlines the need
for experimental data which provides anchor points for such calculations.

3.3 Atomic Structure 31
7s 7p 1P1
7s2 1S0
7s 7p
6d 7p 3D1
548.4
540.1
660.1
714.3
7s 8p 1P1
633.9 7s 8s 1S0
7s 8s 3S1
Wavelengths are in nm
3P2
3P1 3P0
3D3 3D2 3D1
0
10000
20000
30000
1656.1
1417.9
2751.6
784.0310.3
1428.6
304.34
482.77s 6d
7s 6d 1D2 1487.7
Ener
gy [c
m-1
]
Fig. 3.3: Energy level structure of atomic radium showing the wavelengths of
all relevant transitions for efficient laser cooling of radium atoms. The data is
taken from atomic structure calculations [76,77], grating spectrometer data [67],
and laser spectroscopy ( [78–80] and this thesis). The near degeneracy of the 3Pi
and the 3Dj - states are the cause for the large atomic enhancement factors of
intrinsic EDMs in atomic radium.

32 Properties of Radium
7s 7p 1P1
7s2 1S0
7s 7p
6d 7p 3D1
2.760x10⁶
7s 8p 1P1
7s 8s 1S0
7s 8s 3S1
Transition Probabilities are in s-1
3P2
3P1 3P0
3D3 3D2 3D1
3.194x10⁵
4.195x10⁴
7s 6d
7s 6d 1D2 2.646x10⁴
1.572x10⁻³
9.805x101
0
10000
20000
30000
Ener
gy [c
m-1
]
7.722x10³
Fig. 3.4: Energy level structure of atomic radium showing the transition prob-
abilities from the excited states to the ground state and to metastable states of
relevant transitions. They are relevant for an efficient laser cooling scheme for
radium atoms. The data is taken from atomic structure calculations [76,77], and
laser spectroscopy ( [78–80] and this thesis).

3.4 Permanent Electric Dipole Moments in Radium 33
3.4 Permanent Electric Dipole Moments in Ra-
dium
In atomic radium there are several different effects present which cause strong
enhancements leading to potentially large atomic electric dipole moments. The
enhancements depend on the particular isotope and the atomic state considered.
It further depends on the actual source of the EDM. The different contributions
to the enhancement factor are described below.
Heaviest Alkaline Earth Atom
The enhancement of a nuclear EDM in heavy nuclei grows faster than the third
power of the atomic number Z (Section 2.4.1). Radium is the heaviest alkaline
earth element with atomic number Z = 88. Therefore an EDM in radium is
enhanced by a factor of 3 over an EDM in mercury [58].
Electron EDM in the 7s6d 3D1 state
The EDM of an electron interacts with the internal electric field of an atom. The
interaction results in a mixture of the states with the same total orbital angular
momentum but with opposite parity. As a consequence the EDM of an electron
de induces an EDM dA into the atom. The Hamiltonian of the interaction of de
with the internal electric field ~E of the atom can be written as
HEDM = −deβ(~Σ · ~E) , (3.1)
where, β is the Dirac matrix (Eq. 3.2) and ~Σ is the relativistic spin operator
(Eq. 3.3).
β =
(1 0
0 −1
)(3.2)
~Σ =
(~σ 0
0 ~σ
)(3.3)
The atomic EDM in the 7s6d 3D1 state of radium is enhanced by the presence of
opposite parity state 7s7p 3P1 at very close energy separation [39,42]. Under the
approximation that only the closest states are involved in the interaction of the
electronic EDM of radium in the 7s6d 3D1 state can be written as
d3D1= 2〈7s6d 3D1| − er|7s7p 3P1〉〈7s7p 3P1|HEDM |7s6d 3D1〉
E(7s6d 3D1)− E(7s7p 3P1). (3.4)

34 Properties of Radium
The enhancement of the atomic EDM arising from an electron EDM in the 7s6d3D1 state of radium is about a factor of 5000 [42].
Nuclear EDM in the 7s6d 3D2 state
An atomic EDM may also arise from the interaction of an electron with the
nuclear Schiff moment. The Hamiltonian of interaction between the electron and
the Schiff moment is
HSchiff = 4π~S · ~∇ρ(r) , (3.5)
where ~S represents the nuclear Schiff moment and 4π~∇ρ(r) represents the electron
part in the Hamiltonian caused by the Coulomb interactions. In the 7s6d 3D2
state the Schiff moment contribution to an EDM is strongly enhanced due to the
presence of closely lying 7s7p 3P1 state of opposite parity. The effective EDM in
the 7s6d 3D2 state can be approximated by
d3D2= 2〈7s6d 3D2| − er|7s7p 3P1〉〈7s7p 3P1|HSchiff |7s6d 3D2〉
E(7s6d 3D2)− E(7s7p 3P1). (3.6)
This results in a large enhancement of an EDM in the 7s6d 3D2 state of radium
[39, 42, 83] by a factor of about 105 compared to the enhancement in the EDM
of 199Hg. The enhancement does not mean that the EDM in radium is 105
times larger than the EDM in mercury, but rather that, radium EDM experiment
requires a fraction of the sensitivity of the 199Hg EDM experiment [84] in order
to achieve comparable limits on sources of CP violation.
Nuclear EDM in the ground state
An atomic EDM can occur because of the collective T-odd and P-odd moments as
a consequence of the asymmetric shape of an atomic nucleus. An enhancement
on an EDM may arise from the collectiveness of the intrinsic Schiff moment,
classically represented as [85]
~S =1
10
∫ρch(~r)
(r2 − 5
3r2ch
)~r · d3r , (3.7)
where ρch is the charge density of an atomic nucleus and r2ch is the mean square
charge radius. Because of octupole deformation of the charge distribution (Fig. 3.5)
of several radium nuclei near the valley of stability the Shiff moment causes a
large enhancement factor on radium EDM [57, 58, 85, 86]. The enhanced Shiff
moment and parity doubling induces an enhancement in the radium EDM of

3.5 Conclusion 35
102−103 compared to the EDM in 199Hg. The octupole deformation in the re-
gion of radium is experimentally studied by measuring the collectivity of nuclear
excitations in Coulomb excitation experiments with the Miniball detector array
and post accelerated radioactive beams from ISOLDE, CERN [87].
Fig. 3.5: Shape of the nuclear charge distribution of 225Ra [58]. An octupole
deformation is associated with a peer like shape of the charge distribution in the
nucleus. Since the shape is not an eigenstate of energy the nuclear state is a
superposition or identical of two intrinsic shapes [88].
3.5 Conclusion
The atomic and nuclear properties of the alkaline earth element radium makes
it a sensitive experimental system for studying fundamental symmetry violating
properties like EDM. The largest known atomic enhancement factor and the
design of an atomic physics measurement of the EDM depends strongly on the
precise knowledge of the atomic structure. The study of this and the creation
of thermal atomic beam of rare isotopes of radium is the main challange of this
thesis work and will be discussed in the subsequent chapters.

Chapter 4
Radium Atomic Beam
Development
A sensitive search for an EDM in the radium atom requires particular equipment
which is essential and necessary to reach the highest possible accuracy. To this
extent several key elements have been developed and optimized. We focus here
on the isotopes 213Ra and 225Ra, where sources to obtain these isotopes have been
developed. For 213Ra a beam of 206Pb from the AGOR cyclotron is utilized which
is directed on a 12C target and for 225Ra the α-decay of a radioactive 229Th source
is exploited. For both isotopes low energy atomic beams have been developed.
4.1 Sources of Radium Atoms
Atoms with nuclei of spin I = 1/2 have particular advantages for EDM experi-
ments because in such nuclei there is no quadrupole moment and also the number
of hyperfine components in their optical spectra is minimal. Therefore the iso-
topes 213Ra and 225Ra, with nuclear spin I = 1/2, are of special interest. Although,
other isotopes are of particular future interest, e.g. in connection with atomic
parity violation experiments, some of them may also be exploited in future EDM
experiments, because of nuclear enhancement mechanisms such as octupole de-
formation [87]. Most of the isotopes are available from nuclear reactions. The
full set of radium isotopes can be obtained from fusion and evaporation reac-
tions, from radioactive decay, or spallation of a uranium target with a proton
beam. In Table 4.1 we give summary of the possible radium isotope production
mechanisms.
37

38 Radium Atomic Beam Development
Atomic Decay Source Available
mass (A) series at KVI
208 - 204Pb + 12C → 208Ra + 8n√
209 - 204Pb + 12C → 209Ra + 7n√
210 - 204Pb + 12C → 2010Ra + 6n√
211 - 204Pb + 12C → 211Ra + 5n√
212 - 206Pb + 12C → 212Ra + 6n√
213 - 206Pb + 12C → 213Ra + 5n√
214 - 206Pb + 12C → 214Ra + 4n√
221 - spallation
223 235U 227Ac (21.8 y)√
224 232Th 228Th (1.9 y)
225 233U 229Th (7340 y)√
226 238U 226Ra, 230Th (1.9 y)
228 232Th 228Ra
230 - spallation
231 - spallation
232 - spallation
Table 4.1: Possible production mechanisms for a series of radium isotopes. The
isotopes with A= 208 - 214, 223 and 225 are available at KVI. Isotopes with A
= 208 -214 are produced at TRIµP facility. Isotopes with A = 225 and 223 are
produced from a radioactive parent sources.
Radium isotopes with non-zero nuclear spin I are typically short lived (see
Table 3.2). Here we focus particularly on the spin I = 1/2 isotopes, i.e. 213Ra
and 225Ra. This requires online production of the isotope 213Ra which has T1/2
= 2.73 min lifetime, while the isotope 225Ra which has a halflife of T1/2 = 14.9
day can be obtained from a radioactive source.
For the envisioned EDM experiment in radium at KVI a radium atomic beam
has been developed with low average kinetic energy. Atoms at such temperatures
can be conveniently cooled by laser cooling. Effusive beams have been well studied
before for alkaline and alkaline earth elements [63, 89]. The achievable beam
parameters can be best estimated using the information accumulated from the
performance of a barium atomic beam.

4.1 Sources of Radium Atoms 39
Chart of NuclidesClick on a nucleus for information
Color code Half-life Decay Mode Qβ- QEC Qβ+ Sn Sp Qα S2n S2p Q2β- Q2EC QECp
Qβ-n BE/A (BE-LDM Fit)/A E1st ex. st. E2+ E3- E4+ E4+/E2+ β2 B(E2)42/B(E2)20 σ(n,γ) σ(n,F) 235U FY 239Pu FY
Ground and isomeric state information for 22588
Ra
E(level) (MeV) Jπ Δ(MeV) T1/2 Decay Modes
0.0 1/2+ 21.9951 14.9 d 2 β- : 100.00 %
A list of levels, a level scheme and decay radiation information are available
Tooltips
On
Off
Zoom
1
2
3
4
5
6
7
Uncertainty
NDS
Standard
ScreenSize
Narrow
Wide
Nucleus
go
Seconds > 10+15 10-01
10+10 10-02
10+07 10-03
10+05 10-04
10+04 10-05
10+03 10-06
10+02 10-07
10+01 10-15
10+00 < 10-15
unknown
Search options:
Levels and GammasNuclear Wallet Cards
Decay Radiation
Help - Glossary
This site is better seen using the latest version of internet browsers.Database Manager and Web Programming: Alejandro Sonzogni, NNDC, Brookhaven National Laboratory, [email protected]
Data Source: National Nuclear Data Center, Brookhaven National Laboratory, based on ENSDF and the Nuclear Wallet Cards.
Interactive Chart of Nuclides http://www.nndc.bnl.gov/chart/reZoom.jsp?newZoom=1
1 of 1 7/16/12 1:15 PM
@@I
Fig. 4.1: 22588 Ra is the daughter product of the 229
90 Th α-decay. 22588 Ra decays to
22589 Ac, which decay to 221
87 Fr. The decay chain further continues until the stable
isotope 20983 Bi is reached [66].
4.1.1 Radium from Radioactive Sources
Some long lived radium isotopes can be obtained from the radioactive decay of
suitable parent nuclei. Such sources are 227Ac with a halflife of 21.8 years or 229Th
with T1/2 of 7340 year. We exploit the latter possibility. The production of an
effusive atomic beam as it has been employed in this work, is shown in Fig. 4.6
(details of its design are discussed in Section 4.2). The typical temperatures of
such ovens for producing atomic beams of alkaline earth elements are of order
melting temperatures of the respective alkaline earth elements. At these tem-
peratures the vapor pressure is ∼10−2 mbar (Fig. 3.1). This oven design is for
practical purposes only suited for long lived isotopes (T1/2 > 1 day), because the
radioactive material needs to be reloaded into the crucible and vacuum needs to
be achieved also. Nevertheless since the lifetime of the isotopes with nuclear spin
I 6= 0 is of order 15 days or less, frequent refilling of the oven is required. Such a
strategy is followed in the experiment at the Argonne National Laboratory [90].
There the isotope 225Ra is used which is chemically extracted from 229Th at the
Oak Ridge National Laboratory. Samples of 106 s−1 radium atoms (250 µCi
activity) [79] are then transferred to a crucible in a radiation safety guarded lab-

40 Radium Atomic Beam Development
]1/2
Time [T0 2 4 6 8 10
]R
aτ .
Th
[A
Ra
N
0
0.2
0.4
0.6
0.8
1
Fig. 4.2: Buildup of the amount of 225Ra inside the cavity containing 229Th of
activity ATh. The 225Ra reaches 92(2) % of the saturation value after 4 half
lifetimes of the 225Ra nuclei.
oratory. In this experiment at KVI, however, 229Th is transferred only once to
the crucible and breading of 225Ra occurs inside the oven cavity (Section 4.2).
Radium is extracted from the decay chain of 229Th (Fig. 4.1). The long-lived
isotope 229Th (T1/2 = 7340 years) [66] decays via α-decay into 225Ra
229Th (T1/2 = 7340 years) → α + 225Ra (T1/2 = 14.9 days) . (4.1)
Therefore a 225Ra atomic beam can be obtained from an oven which contains229Th in a cavity with a small opening. The very long lifetime of the parent
isotope 229Th provides for a constant production rate of 225Ra inside this cavity.
The 225Ra atoms from 229Th decay can be accumulated in such an oven. The
number of radium atoms built up inside the cavity is
N(t) = NRa
1− exp
(− tτ
), (4.2)
where t is the buildup time and τ (= T1/2/ln2) is the mean lifetime of 225Ra. NRa
is the number of radium atoms in equilibrium inside the oven which is reached
4.1 Sources of Radium Atoms 41
after a time t>> T1/2(225Ra). This number is given by the product of the activity
ATh of 229Th and the mean lifetime τ(225Ra).
NRa = ATh · τ(225Ra) . (4.3)
After 4 half lifetimes the number of radium atoms inside the cavity has reached
more than 92(2) % of the saturation value.
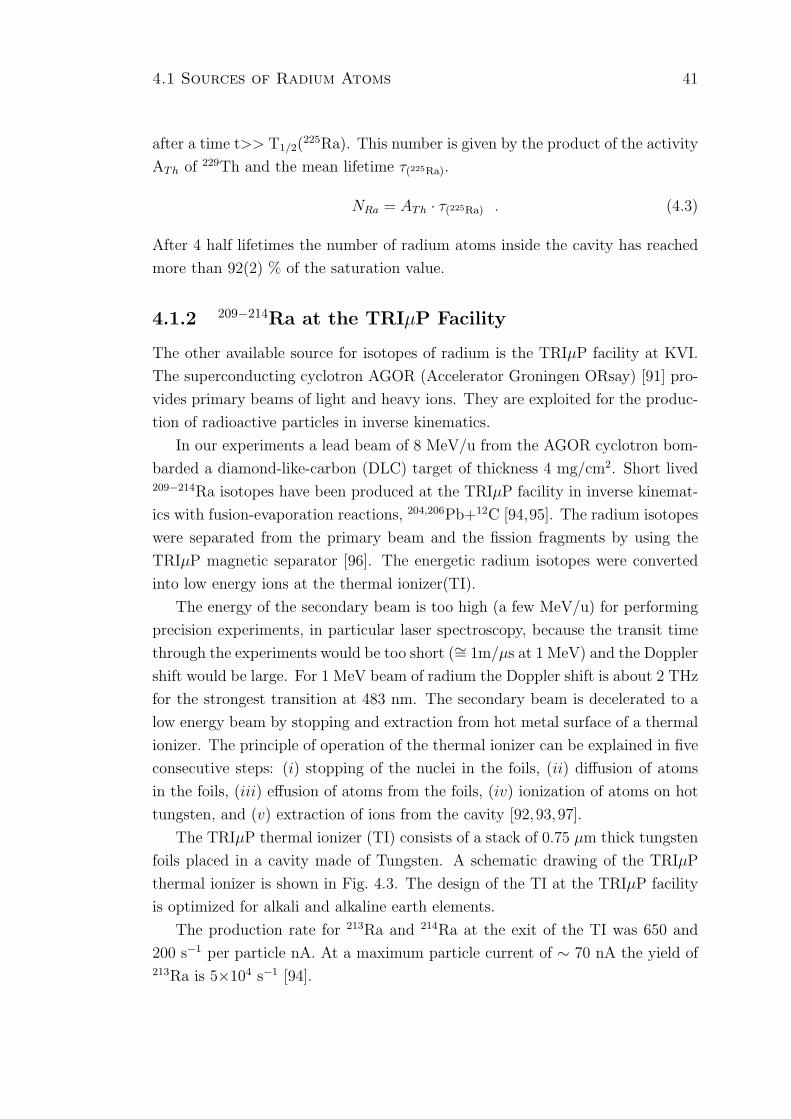
4.1.2 209−214Ra at the TRIµP Facility
The other available source for isotopes of radium is the TRIµP facility at KVI.
The superconducting cyclotron AGOR (Accelerator Groningen ORsay) [91] pro-
vides primary beams of light and heavy ions. They are exploited for the produc-
tion of radioactive particles in inverse kinematics.
In our experiments a lead beam of 8 MeV/u from the AGOR cyclotron bom-
barded a diamond-like-carbon (DLC) target of thickness 4 mg/cm2. Short lived209−214Ra isotopes have been produced at the TRIµP facility in inverse kinemat-
ics with fusion-evaporation reactions, 204,206Pb+12C [94,95]. The radium isotopes
were separated from the primary beam and the fission fragments by using the
TRIµP magnetic separator [96]. The energetic radium isotopes were converted
into low energy ions at the thermal ionizer(TI).
The energy of the secondary beam is too high (a few MeV/u) for performing
precision experiments, in particular laser spectroscopy, because the transit time
through the experiments would be too short (∼= 1m/µs at 1 MeV) and the Doppler
shift would be large. For 1 MeV beam of radium the Doppler shift is about 2 THz
for the strongest transition at 483 nm. The secondary beam is decelerated to a
low energy beam by stopping and extraction from hot metal surface of a thermal
ionizer. The principle of operation of the thermal ionizer can be explained in five
consecutive steps: (i) stopping of the nuclei in the foils, (ii) diffusion of atoms
in the foils, (iii) effusion of atoms from the foils, (iv) ionization of atoms on hot
tungsten, and (v) extraction of ions from the cavity [92,93,97].
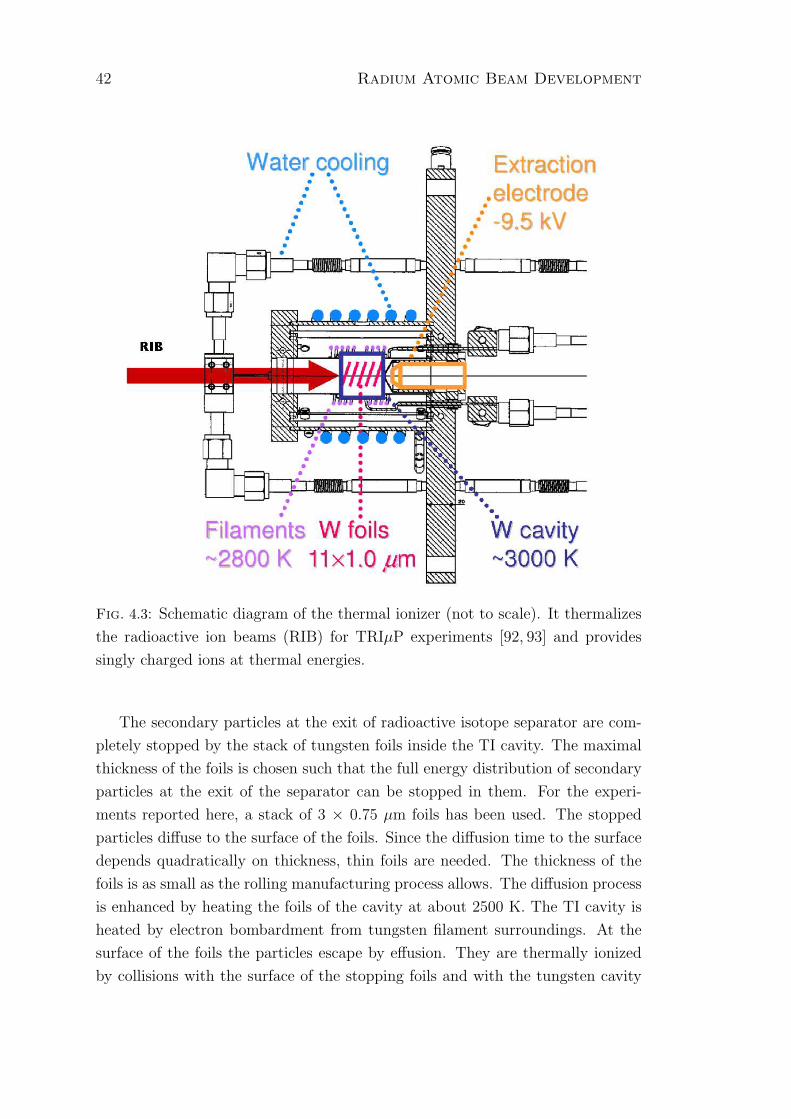
The TRIµP thermal ionizer (TI) consists of a stack of 0.75 µm thick tungsten
foils placed in a cavity made of Tungsten. A schematic drawing of the TRIµP
thermal ionizer is shown in Fig. 4.3. The design of the TI at the TRIµP facility
is optimized for alkali and alkaline earth elements.
The production rate for 213Ra and 214Ra at the exit of the TI was 650 and
200 s−1 per particle nA. At a maximum particle current of ∼ 70 nA the yield of213Ra is 5×10⁴ s−1 [94].
42 Radium Atomic Beam Development
Fig. 4.3: Schematic diagram of the thermal ionizer (not to scale). It thermalizes
the radioactive ion beams (RIB) for TRIµP experiments [92, 93] and provides
singly charged ions at thermal energies.
The secondary particles at the exit of radioactive isotope separator are com-
pletely stopped by the stack of tungsten foils inside the TI cavity. The maximal
thickness of the foils is chosen such that the full energy distribution of secondary
particles at the exit of the separator can be stopped in them. For the experi-
ments reported here, a stack of 3 × 0.75 µm foils has been used. The stopped
particles diffuse to the surface of the foils. Since the diffusion time to the surface
depends quadratically on thickness, thin foils are needed. The thickness of the
foils is as small as the rolling manufacturing process allows. The diffusion process
is enhanced by heating the foils of the cavity at about 2500 K. The TI cavity is
heated by electron bombardment from tungsten filament surroundings. At the
surface of the foils the particles escape by effusion. They are thermally ionized
by collisions with the surface of the stopping foils and with the tungsten cavity

4.1 Sources of Radium Atoms 43
Fig. 4.4: Calculation of electric potentials inside the thermal ionizer cavity created
by an extraction electrode potential of -9.5 kV. Equipotential lines are shown for
-0.1, -0.2, -0.3, and -0.4 V. A schematic of the trajectory of an ion is shown in
the figure [92,93].
wall of the thermal ionizer. During the multiple collisions of atoms its charge
state changes many times. A fraction of the particles is always neutral. The
charged particles can be extracted out of the Tungsten cavity of the thermal ion-
izer by electrostatic extraction, using an electric field formed by a DC potential
on an extraction electrode (see Fig. 4.3). The extraction process is schematically
depicted in Fig. 4.4.
The extracted particles are singly charged radium ions. Neutral radium atoms
inside the thermal ionizer remain there. They will diffuse out at a relatively lower
rate. The fraction of radium ions with charge states higher than +1 are negligible,
because of the difference in the work function of tungsten and the necessary
ionization energy to create higher charge states. Typical extraction efficiencies
are about 9 % for radium (Fig. 4.5), about 70 % for sodium and about 40 % for
rubidium [97].

44 Radium Atomic Beam Development
Fig. 4.5: Experimental extraction efficiencies of the TI as a function of tem-
perature for 212Ra(triangle), 213Ra (circle) and 214Ra (square). The predictions
according to the diffusion model described in [97] are 212Ra (dashed line), 213Ra
(solid line), and 214Ra (dot-dashed line)).
4.2 Offline Atomic Beam of Radium
A source of 10 µCi 229Th has been installed in a titanium crucible for producing a225Ra atomic beam at KVI. Because of the rather low vapor pressure of thorium
the accumulated radium can be heated out of the crucible at temperatures of
about 850 K without loosing 229Th mother nuclei. In order to achieve a vapor
pressure of 10−2 mbar for thorium a temperature of 2700 K is needed, whereas
for radium 850 K is sufficient. The vapor pressure of thorium is about 15 order
of magnitude smaller at the lower temperatures. The vapor pressure of thorium
at 1400 K is ∼ 10−13 mbar [98] which would lead to an escape rate of less than
1 Bq/ day of thorium from the oven at that temperature.

4.2 Offline Atomic Beam of Radium 45
a b c d e f g
h i j
Fig. 4.6: Schematic view of the 225Ra oven: (a) thermocouple; (b) titanium
crucible; (c) heater element; (d) inner heat shield; (e) outer heat shield; (f)
holding rod; (g) end cap; (h) mounting bars to CF40 feedthrough; (i) back holding
flange; (j) front holding flange. The full assembly can be mounted to a CF40 port
to a vacuum chamber (see also Fig. 4.7).
Fig. 4.7: The 225Ra oven is mounted on a CF40 vacuum electric feedthrough.
The oven is loaded with 229Th. At temperature 900 K a thermal atomic beam of225Ra emerges from the oven cavity.

46 Radium Atomic Beam Development
The oven was built at KVI. A schematic view and a picture are shown in
Fig. 4.6 and 4.7. The geometry of the crucible is of 6 mm diameter and 20 mm
length. The exit aperture of the crucible consists of six holes of 0.5 mm diameter
in a 5 mm thick end cap. The crucible is surrounded by 0.25 mm thick tantalum
wires which provide a resistive heater element. The tantalum wire is held in
alumina ceramic pieces in order to protect it from short circuit. The temperature
of the oven is measured with a N-type thermocouple. The operating temperature
of around 900 K is achieved at a heater power of about 50 W and is reached
within a few 100 sec after the heating commences. The design was developed
for experiments on spectroscopy and laser cooling and trapping od barium at
KVI [63, 89]. The oven is mounted on a standard CF40 flange to a vacuum
chamber with a residual gas pressure of about 10−10 mbar inside it. When the
oven is heated to its operating temperature of ∼ 900 K the gas pressure in the
vacuum chamber increases to about 10−8 mbar.
The 229Th activity was transferred to the crucible at NRG (Nuclear Research
and consultancy Group) in Petten, NL. The activity of 229Th as a solution in nitric
acid was dried inside the titanium crucible. A small amount of BaCO3 (∼ 50 mg)
together with fine grain zirconium powder was added inside the crucible. Barium
serves as a reducing agent for radium. Further it provides an atomic barium
beam which has the same characteristics as the radium beam and overlaps with
it. This can be exploited for alignment of the optical layout and light collection
elements. Radium is accumulated in the cold oven for timescales of the order of
the 225Ra lifetime. The saturated population NRa inside the oven is the 2 × 10¹¹
atoms.
The α-decay of 229Th results in a rather large recoil energy of ∼ 100 keV to
the 225Ra atoms. Because of this the 225Ra atoms are implanted into the walls of
the crucible. The 229Th atoms (10 µCi correspond to 5× 10⁻⁵ g) are distributed
inside the crucible. An even distribution corresponds to a layer of thickness 10
nm. The range distributions of 100 keV 225Ra in titanium and thorium have been
calculated with SRIM [99]. They are shown in Fig. 4.8. 100 keV radium has a
range of ∼ 20 nm in thorium. The depth reached by radium in titanium is of
order 30 nm. Thus, the 225Ra will gets trapped inside the oven wall material.
Depending on the direction of recoil the 225Ra may either stay in the thorium
layer or enter the bulk of titanium crucible material. The implantation depth is
such that only a small fraction of a few percent can be desorbed from the walls
of the crucible at the operation temperature. In order to leave the surface 225Ra
has to first diffuse out of the titanium wall and it then diffuses out of the thorium

4.2 Offline Atomic Beam of Radium 47
layer.
Range in titanium [nm]10 20 30 40 50 60
Pe
ne
tra
tio
n p
er
un
it l
en
gth
[a
.u.]
0
0.01
0.02
0.03
0.04
Range in thorium [nm]0 10 20 30 40 50 60
Pe
ne
tra
tio
n p
er
un
it l
en
gth
[a
.u.]
0
0.01
0.02
0.03
A
B
Fig. 4.8: Penetration range distribution of 100 keV 225Ra from the decay 229Th→α +225 Ra, where the recoil particles have the kinetic energies Eα = 5168.1 keV
and E225Ra = 100 keV in (A) titanium and (B) thorium calculated with SRIM [99].

48 Radium Atomic Beam Development
0.0 < E(level) < 171.0 Level Energy Level T1/2 Level Spin-parity Final Level
Highlight: Level Gamma Energy Gamma Intensity Gamma Multipolarity Decay Information
Image Height: 600 Level Width: 100 Band Spacing: 20 Plot Clear
Decay Scheme http://www.nndc.bnl.gov/chart/getdecayscheme.jsp?nucleus=...
1 of 1 7/16/12 12:15 PM
Fig. 4.9: Decay scheme of 22588 Ra. It β−-decay to 100 % into 225
89 Ac. The intensity
of the characteristic γ-rays at 40 keV following this decay is 30 % [66].
Next we consider how much of the radium can diffuse out of the oven when
the source is heated. The fraction of particles implanted at depth a and which
leave the material is
Nout
Nin
= exp
(− a√
Dτ
), (4.4)
where Nin is the number of atoms entering, Nout is the number of atoms diffusing
out, D is the diffusion coefficient, and τ is lifetime of the particle. For particles
evenly distributed in a foil of thickness a we have [97]
Nout
Nin
=
√Dτ
atanh
(a√Dτ
). (4.5)

4.2 Offline Atomic Beam of Radium 49
The time ∆t for the diffusion process to take place is of the order
∆t = a
√τ
D. (4.6)
The diffusion coefficient D depends on temperature and target material. There
are no data for D available for radium in titanium and thorium for temperature
around 1000 K. For an order of magnitude estimate we take known values for
radium in titanium and thorium targets, where D is DT i = 10−13 cm2 s−1 and
DTh = 10−20 cm2 s−1. This estimate is based on the diffusion of the alkaline earth
atom calcium in titanium [100] and the alkaline earth atom radium in tungsten
around 1000 K [94]. We assume the fraction of radium that diffuses out of the
titanium bulk material is given by Eq. 4.4. The fraction of radium diffusing out
of the thin thorium layer is governed by Eq. 4.5. The diffusion time for radium
in titanium is about 4 × 10³ s and that for radium in thorium is about 1 × 10⁷
s. This is in agreement with the observation that a few percent of the produced
radium atoms are released in the effusive beam.
The flux of radium was measured by the deposition of 225Ra on a glass window
70 cm downstream of the oven. For this the characteristic γ-ray spectrum emitted
from there has been recorded with a Germanium detector. A spectrum is shown
in Fig. 4.11. 225Ra is identified by characteristic emission of a 40.0(1) keV γ-
ray photon after its β−-decay (Fig. 4.9). Other characteristic gamma energies of
products in the decay chain of 225Ra were also observed.
At temperature 900 K of the crucible the accumulated 225Ra atoms leave the
oven in about 1000 s and provide a beam of 106 atoms per second in an angular
divergence of 100 mrad. This beam is sufficient for spectroscopy and optical
detection of the 7s2 1S0 - 7s7p 1P1 and the 7s2 1S0 - 7s7p 3P1 transitions in
atomic 225Ra (see Chapter 6).

50 Radium Atomic Beam Development
229Th source
ion pump
ion pump
gate valve
germanium detector
radium oven
optical window
Fig. 4.10: Vacuum chamber for laser cooling and trapping of 225Ra. The germa-
nium detector is situated in order to only detect γ-rays which originate from the
surface of the optical window. The measurement of the rate of 40 keV γ is used
to determine the flux of 225Ra atoms from the oven.
Fig. 4.11: Energy spectrum of γ-rays originating from atoms in the beam emerg-
ing from the radium oven. The spectrum is measured by a high resolution Ger-
manium detector. 225Ra is identified by the characteristic γ-ray peak at 40 keV.
The peak at 218.1 keV arises from the decay of 221Fr. The halflife of 221Fr is 286
s and the vapor pressure is ∼ 103 mbar at the oven temperature 900 K. The peak
at 440.5 keV arises from the decay of 213Bi.

4.3 Conversion of Ion to Atom 51
4.3 Conversion of Ion to Atom
Short-lived isotopes of radioactive elements are typically produced as ion beams
at the online isotope production facilities. In order to produce atomic beams
these ions need to be neutralized. In the following a model and the experimental
realization of an ion-to-atom converter is presented. This device was tested at
KVI but it can be implemented in any radioactive ion beam facility. Furthermore
it is a general setup which can be applied to many different isotopes. The concept
exploits the advantages of ion beam manipulation and the well proven design of
effusive atomic beams.
The time scale for neutralization and effusion from such a device is of crucial
importance for short lived radioactive isotopes. Thus we will discuss the relevant
parameters in the following. We have used the radioactive beams provided at
KVI for the determination of efficiencies.
4.3.1 Characteristics of Effusive Beam
At a gas pressure of 10−4 atm at room temperature, the mean free path of an atom
is of order 1 mm. The pressure region where the mean free path of atoms is much
larger than the dimension of the apparatus is called the Knudsen region [101]. We
estimated the beam characteristics for a container with a small tube as an exit
pass (Fig. 4.12). The parameters used for this estimate are introduced below.
Fig. 4.12: Conceptual model of an effusive atomic beam. Vapor pressure of the
element is a crucial parameter for designing such an oven.
The number of density n at a gas pressure P and at a temperature T is
n =P
kBT=NV
V, (4.7)
where kB is the Boltzmann constant and NV is the number of atoms in a container
of volume V. With the number of atoms on the inner surface of the container Ns,

52 Radium Atomic Beam Development
the total number of atoms inside the container is
N = NV +Ns. (4.8)
The characteristic time scale for the atoms inside the container before effusing
out through the exit tube can then be written as
τres =N
Φ. (4.9)
For a density n of atoms inside such a container the flux of atoms through a tube
of conductance S is
Φ = nS . (4.10)
The conductance for a hole of area A is
Shole =1
4Avave , (4.11)
whereas for a tube of length L and diameter d the conductance is
Stube =2kBTd
3
3MvaveL. (4.12)
Here, M is the mass and vave is the average velocity.
The number of atoms NV in the volume of the container is proportional to the
time τV during which the atoms are in gas phase. The number of atoms Ns at the
surface of the container is proportional to the sticking time (τs) of the atoms to the
surface of the container. The atoms get stuck to the surface of the container by
the physisorption or chemisorption interactions. At high temperatures (T>1000
K) the physisorption or chemisorption bonding of atoms to the surface breaks.
Physisorption interactions arise from the intermolecular forces between the
particle and the metal surface, which is similar to van der Waals forces. An atom
is physisorbed to the metal surface mainly because of its geometrical alignment
with the metal surface. This process does not produce significant changes in the
electronic structure of the interacting species. Physisorption plays an important
role as a precursor of the chemisorption interactions.
Chemisorption interactions arise essentially from the chemical reactions of the
atom with the metal surface. These reactions cause the formation of a chemi-
cal compound. As a consequence atoms are bonded to that chemical potential
barrier. The strength of this potential barrier is determined by the interaction
energy of the species and the relative distance between them at equilibrium.

4.3 Conversion of Ion to Atom 53
The Hamiltonian for the interaction of an atom with a metal surface is
Hatom−metal = HA +HM +Hem +HSR +HVW , (4.13)
where HA and HM are the Hamiltonians of the isolated atom and the metal. Hem
is the Hamiltonian of the vacuum quantized electromagnetic field, HSR represents
the Hamiltonian which arises from the short-range interaction between the atom
and metal and HVW is the Hamiltonian of the interactions between all the par-
ticles involved in the atom-metal interaction phenomena and quantized by the
long-wave-length electromagnetic field i.e., the Van der Walls interaction [102].
The sticking time τs for an atom adsorbed on a surface at temperature T is
given by
τs = τ0 exp
(Hat
RT
), (4.14)
where Hat is the enthalpy of atomization, R is the universal gas constant and τ0
is the period of vibration of the bond between the adsorbed atom and the sur-
face material [103]. There are no experimental data on sticking time and for τ0
available for radium on titanium or tungsten surfaces. For an order of magnitude
estimate we take τ0 ∼ 10−9 s based on the known values for barium atom on
tungsten surfaces [104, 105]. Hat is estimated to 159 kJ/mol for radium and 182
kJ/mol for barium [106].
The characteristics time scale for effusion, τres is defined as the sum of the
time spend in the volume τV between two successive collisions with walls and the
sticking time τs of the atom at the wall surface [92]
τres = χ(τV + τs) . (4.15)
Here χ is the mean number of collisions before leaving the exit aperture of the
oven.
225Ra Crucible at KVI
A measurement of the time the atomic beam needs to leave the existing 225Ra
oven is used to estimate the sticking time τs of radium on a mixed surface of
titanium, thorium and other elements, e.g. barium, zirconium. Total number of225Ra atoms N inside the crucible is 1011 and the operating temperature is around
900 K. The mean number of collisions of the radium atoms inside the crucible
before leaving the exit aperture is estimated to χ ≈ 500. An estimate for the
residence time τres for a set of parameters is given in Table. 4.2.

54 Radium Atomic Beam Development
Geom
etryF
ractionof
Volu
me
ofD
ensity
Con
ductan
ceR
esiden
cetim
eT
ime
spen
dStick
ing
ofth
eatom
sin
contain
erof
atoms
(S)
ofth
eatom
sin
the
volum
etim
eat
contain
erth
evolu
me
(V)
(n)
[m3/s]
inth
econ
tainer
(τV
)su
rface(τs )
(NV
/N)
[m3]
[atoms/m
3](τres )
[s][s]
[s]
225R
a10−
510−
710
13
10−
510
310−
52
crucib
le
TI
0.9610−
510
10
10−
40.04
10−
510−
5
cavity
Table
4.2:P
arameters
forestim
atingτres
forth
e225R
acru
cible
and
the
therm
alion
izer(T
I)cav
ityat
KV
I.

4.3 Conversion of Ion to Atom 55
Dia
met
erof
dia
met
erof
Len
gth
Tem
per
ature
Con
duct
ance
Con
duct
ance
ofP
robab
ilit
yof
exit
Div
erge
nce
of
entr
ance
hol
eex
ithol
eof
tub
e(T
)en
tran
cehol
eex
ithol
eof
atom
sth
rough
atom
icb
eam
(dhole
)(dtube
)(L
)[K
](Shole
)(Stube
)ex
ithol
e(θ
)
[mm
][m
m]
[mm
][m
3/s
][m
3/s
][%
][d
egre
e]
1.6
410
900-
2000
10−
45×
10−
477
±22
1.6
420
900-
2000
10−
410−
463
±11
1.6
620
900-
2000
10−
410−
385
±17
1.6
820
900-
2000
10−
42×
10−
393
±22
Table
4.3:
Par
amet
ers
for
esti
mat
ingτ res
for
TI
like
cavit
yaf
ter
the
ion
opti
csle
ns
for
213R
a.P
erfo
rman
cech
arac
teri
stic
sfo
r
diff
eren
tas
pec
tra
tios
ofth
ege
omet
ry.

56 Radium Atomic Beam Development
At the Thermal Ionizer Cavity
A measurement of the diffusion time out of the thermal ionizer provides further
data for radium on sticking to and diffusion on W surfaces [97]. The length of the
cavity is 25 mm and the diameter is 30 mm. The cavity has an entrance window
of thickness 62 µm and an exit tube of 2 mm diameter and 2 mm length. For
the estimate we assume that there are no stopping foils inside the TI. The total
number of atoms N inside the TI is 105 and the operating temperature of the TI
is about 2500 K. Mean number of collisions χ is estimated to 2000. An estimate
of τres at the TI cavity is given in Table. 4.2.
Conclusion
The main temperature dependent parameter which determines the residence time
of radium inside a thermal oven is the average sticking time τs of the radium atoms
to the W cavity surface walls. The estimates extracted from the existing 225Ra
oven and thermal ionizer cavity at KVI indicate that this time is 2 s at 900 K and
10−5 s at 2500 K. Thus an ion-to-atom converter should operate at temperatures
around 900 - 1200 K for 213Ra (T1/2 = 2.73 min).
4.3.2 Release of Radium from a Zirconium Foil
The adsorption of gas molecules and atoms on metal surfaces is one of the most
relevant phenomena in the interaction of gas particles with metal surfaces. The
understanding of the physical and chemical reactions between the particles and
the metal surfaces play an important role in the control of parameters governing
such interactions. We use the short lived radium isotopes from the TRIµP fa-
cility to study the capture and release of radium from hot metal foils. We have
chosen zirconium because of the low work function (4.05 eV), the mechanical
properties and the high melting point of 2100 K. This material was also used
for neutralization and release os sodium. In these studies release fraction of '40 % at temperature of 1080 K and release times shorter than 0.1 s have been
observed [107]. Further release studies have been published for alkali atoms from
several different materials (V, Fe, Ni, Y, Zr, Nb, Mo, Hf, Ta, W, Re, C, and
Pt) [108]. No information on alkaline earth elements can be found in literature.
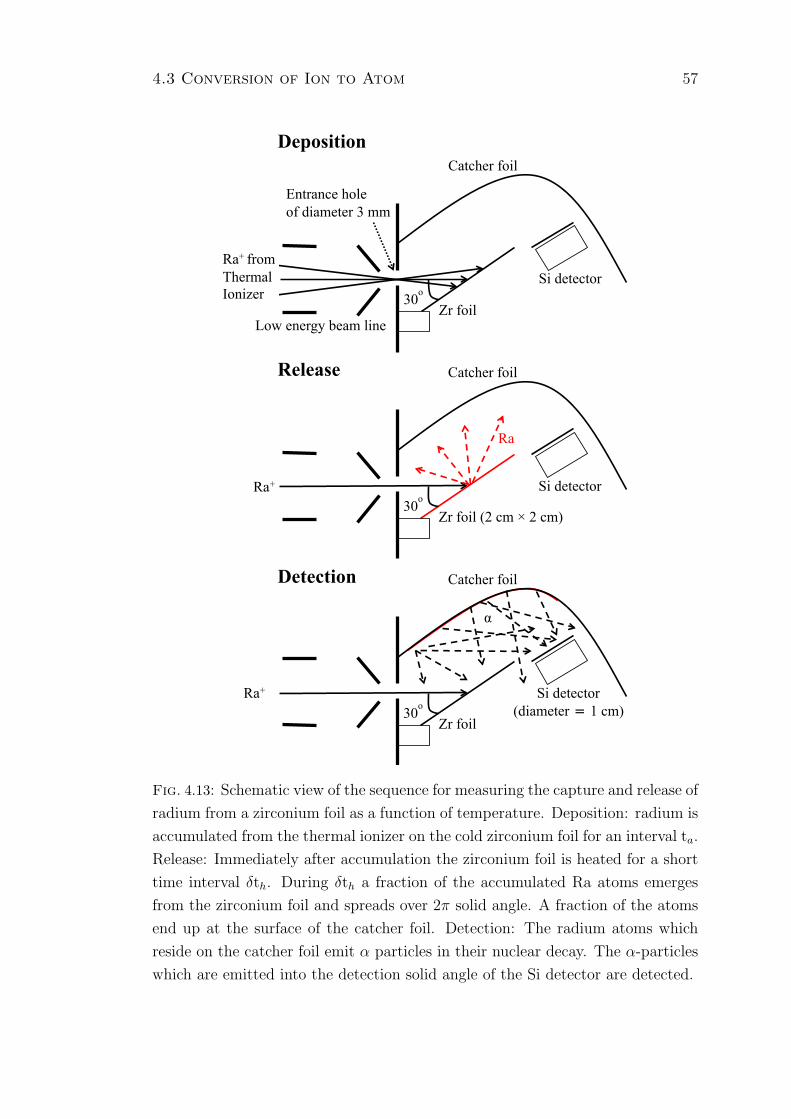
4.3 Conversion of Ion to Atom 57
Zr foil
Catcher foil
30o Si detector
Ra+
Zr foil (2 cm × 2 cm)
Catcher foil
30o
Ra
Si detector
Ra+
Zr foil
Catcher foil
30o
α
Si detector (diameter = 1 cm)
Deposition
Release
Detection
Entrance hole of diameter 3 mm
Ra+ from Thermal Ionizer
Low energy beam line
Fig. 4.13: Schematic view of the sequence for measuring the capture and release of
radium from a zirconium foil as a function of temperature. Deposition: radium is
accumulated from the thermal ionizer on the cold zirconium foil for an interval ta.
Release: Immediately after accumulation the zirconium foil is heated for a short
time interval δth. During δth a fraction of the accumulated Ra atoms emerges
from the zirconium foil and spreads over 2π solid angle. A fraction of the atoms
end up at the surface of the catcher foil. Detection: The radium atoms which
reside on the catcher foil emit α particles in their nuclear decay. The α-particles
which are emitted into the detection solid angle of the Si detector are detected.

58 Radium Atomic Beam Development
Fig. 4.14: Zr foil mounted on a copper support frame. The size of the foil is ∼ 2
cm × 2 cm. The radium ion-beam is projected on this foil. The release of radium
is measured by heating the foil for a short time interval. A fraction of the released
radium resides on the surface of a catcher foil (not shown here). A fraction of the
α-particles emitted from the radium atoms are detected by a Si detector. The
foil can be electrically biased to prevent the escape of charged particles.
δth = 7 s on
ta = 300 s off
δth = 7 s on
Pul
se h
eatin
g th
e Zr
foil
Time
Fig. 4.15: Heating sequence of the Zr foil. radium is accumulated for ta = 300 s.
Then the foil is resistively heated for δth = 7 s.

4.3 Conversion of Ion to Atom 59
(A)
(B)
Fig. 4.16: Responsivity of (A) the FDS1010 Silicon photodiode and (B) the FDG
Germanium photodiode (from [109]). The different wavelength dependence in the
response to light permits the determination of the temperature of a blackbody
radiator.

60 Radium Atomic Beam Development
Temperature [K]700 800 900 1000 1100 1200 1300
PD
[a.
u.]
0
0.5
1
1.5
2
2.5Ge
Si
Fig. 4.17: Measurement of temperature of the zirconium foil by exploiting the
difference in response of a germanium and a silicon photodiode to the blackbody
radiation from the heated zirconium foil.
The singly charged Ra+ are electrostatically extracted from the thermal ion-
izer. A transport system consisting out of an electrostatic lens, a Wien filter for
mass selection and another lens for focussing permits an efficient capturing of
the ions through a small aperture. The setup was designed for the injection of
ions into a gas filled radio-frequency quadrupole which is used as a cooler and
buncher in another experiment at the TRIµP facility [92,93] The geometry of the
setup for measuring release of neutral radium from zirconium surface (Fig. 4.13)
is designed such that all Ra+ ions which are focussed through the entrance hole
for ions end up on the zirconium foil. The size of the zirconium foil is ∼ 2 cm ×2 cm. It is placed at an angle of 30o at 2 cm from the entrance hole for ions. The
amount of radium is determined by the activity which is recorded on the silicon
detector. It is very small when the foil is not heated. The silicon detector has an
area of 150 mm2 and was protected against the light from the heated zirconium
foil by a 1.8 µm thin aluminum foil.
The Zirconuim foil is resistively heated by currents of up to 22 A which cor-
respond to a temperature of 1300(50) K. The voltage across the foil is ∼ 3.5 V.
The temperature is monitored by the emitted light from the hot foil. We employ
two photodiodes, one Silicon and one Germanium diodes each of which cover dif-

4.3 Conversion of Ion to Atom 61
Time [s]0 200 400 600 800 1000 1200
Rat
e [1
/s]
+R
a
1000
2000
3000
4000
5000
6000
Fig. 4.18: Activity of 213Ra+ measured on a Silicon detector in front of the
entrance of the ion-to-atom converter. This measurement is used as the incoming
flux for the determination of the efficiency of the conversion.
ferent wavelength ranges as shown in Fig. 4.16. The photodiodes integrate over
a different part of the spectrum of black body radiation and their scaling with
temperature is different. From these measurements we estimate the temperature
of the foil with an uncertainty of ' 100 K.
The release of radium from a zirconium foil is measured at different tempera-
tures of the Zirconium foil (Fig. 4.21). The sequence of the different steps in the
measurement is shown in Fig. 4.13. The low-energy Ra+ ion beam is projected to
the Zirconium foil. The accumulation of radium is followed by an electric heating
pulse to the Zirconium foil. Released fraction of neutral radium atoms from the
zirconium foil is measured by detecting the α-particles from the radium seating
on the surface of a catcher foil (Fig. 4.20). The released fraction of radium from
the zirconium foil can be quantified as
RSi = Ωtotal ·NRa , (4.16)
where RSi is the count rate seen by the silicon detector and Ωtotal is the total

62 Radium Atomic Beam Development
solid angle due to the geometry of the setup.
Number of cycle1 2 3 4 5 6
[1/
s]S
iR
0
1
2
3
4
5
6
7
8
9
Fig. 4.19: Rate of neutral radium measured with a Silicon detector for six consec-
utive accumulation and release cycle. Each cycle consists of deposition of Ra+ on
the zirconium foil for 300 s followed by a 7 s heating pulse to the zirconium foil
which desorbs out neutralized radium from the zirconium foil. The measurement
started with an zirconium foil without radioactive material on it. The heating
pulse causes the release of a fraction frel from the foil. This factor (1-frel) remain-
ing on the foil contributes to the release in following cycle. The small increase of
cycle 2 indicates that a large fraction has been released. As the number of events
increases the residue of Ra on the Zr foil increases. At one point the amount
of residual Ra reaches equilibrium. Therefore the Silicon detector reads a stable
count rate after first few events.
The solid angle Ωtotal can be split into two parts. First, the release of radium
from the zirconium foil which distributes the atoms on the catcher foil. Second,
the fraction of α-decays which are detected by the Silicon detector.
The probability for the released radium atoms to be detected is Ωtotal =
2(1)·10−3. The highest yield of radium atom detected is RSi = 7(2) s−1. Behind
the thermal ionizer we had of 6000(80) s−1 ions. This yields a total neutralization

4.3 Conversion of Ion to Atom 63
and release efficiency of 58(33) % at the maximum temperature of ∼1300 K in
the experiment in a time of 7 s. We observe that the majority of radium ions is
converted to neutral atoms on a time scale much shorter than the lifetime of the
isotope of interest.
Time [s]0 50 100 150 200 250 300
[1/
s]S
iR
0
2
4
6
8
Fig. 4.20: Release of radium from the Zr foil measured by the Si detector. The
green line represents the heating pulse for the Zr foil for a time interval δth of 7 s.
Accumulation time ta is 300 s. Six individual measurements have been averaged
over the heating on/off cycle. The red line is a fit through the data points. The
fit function RSi(t)=A+Be−t/τ is an exponential plus a polynomial of degree 0.
The fit yields a halflifetime of 175 (70) s which confirms 213Ra as the observed
decaying isotope.
Conclusion
Radium isotopes are available at radioactive beam facilities typically in beams of
several keV ions. The longer lived isotopes can also be extracted from radioactive
sources. Radium EDM experiments require the availability of atomic radium at
low enough energies for laser cooling and trapping. This can be provided by
effusive atomic beams. Here the design of such devices for offline available radium
from sources and online available short lived isotopes are described. A first offline
radium atomic beam is operated successfully at KVI. The design can be scaled
upto higher intensities if larger sources of 229Th are used. Also we demonstrate
the concept of an ion-to-atom converter which can be operated at radioactive ion
beam facilities like ISOLDE at CERN, Geneva, CH.

64 Radium Atomic Beam Development
Temperature [K]700 800 900 1000 1100 1200 1300
Rel
ease
fra
ctio
n [
a.u
.]
0
1
2
3
4
Fig. 4.21: The temperature dependence of the release of neutral radium from a
zirconium foil. α-particles from the decay of radium atoms at the catcher foil are
detected by a Silicon detector. The red line fitted through the measured data
points shows exponential (e−E/T ) behavior of the release fraction of radium from
the Zr foil as a function of temperature.

4.3 Conversion of Ion to Atom 65
4.3.3 The Ion to Atom Converter
L
dtubedholeRa+ 1000K
Heater
RaNeutraliza.ononsurface
Fig. 4.22: Conceptual drawing of the ion-to-atom converter built at KVI. Ions are
injected into the converter through a hole of diameter dhole. After neutralization
at the surface of the converter a large fraction of the atoms leaves through the
exit hole of diameter dtube.
The geometry of the device is an important aspect. The working principle of
the ion-to-atom converter developed at KVI is shown in Fig. 4.22. The central
part of the device is a zirconium tube of diameter dtube = 4.55 mm and length
L = 100 mm. One end of the tube is closed with a zirconium disc which has
a hole of diameter dhole = 1.6 mm at the centre. The low energy ion beam is
injected into the converter through this hole. The zirconium tube is surrounded
by tantalum wire for resistive heating of the tube. A detail geometric view of the
ion-to-atom converter is shown in Fig. 4.24 and Fig. 4.25. The source of radium
for the converter is a low energy (∼ 150 eV) ion beam from TRIµP thermal
ionizer. Fig 4.23 shows the direction of trajectory of the injected ions inside
the ion-to-atom converter. For the geometry mentioned above, more than 90
% of the injected ions are deposited and neutralized at the inner surface of the
zirconium tube. As the conductance of the atoms through dtube is much larger
than the conduction through dhole, a large fraction of neutralized atoms effuse out
through dtube. This provides an atomic beam with thermal velocity distribution.
An estimate of the probability of exit of atoms through dtube for several set of
geometry of the ion-to-atom converter is presented in Table. 4.3. An estimate
of the residence time of the neutralized atoms inside the Zirconium tube for
different temperatures is given in Table 4.4. The calibration of the temperature
of the ion-to-atom converter is shown in Fig. 4.26.

66 Radium Atomic Beam Development
Fig. 4.23: A low energy ion beam from TRIµP thermal ionizer is injected into
the ion-to-atom converter by a set of focussing electrodes. The direction of the
trajectories of the injected ions inside the ion-to-atom converter is shown. These
simulations were performed with SIMION code [110].

4.3 Conversion of Ion to Atom 67
Fig. 4.24: Schematic view of the ion-to-atom converter: (a) holding flange; (b)
converter tube of length 100 mm; (c) flange for mounting the device in beam-line;
(d) inner heat shield; (e) outer heat shield; (f) holding rod; (g) heater element; (h)
front holding flange; (i) spring load to keep the converter tube in place. The Ions
are injected through an injection hole of diameter 1.6 mm. After neutralization
at the inner surface of the converter the atoms leave the converter through an
exit hole of diameter 6 mm with a thermal velocity distribution corresponding to
the temperature of the converter.
Fig. 4.25: Ion-to-atom converter. A vacuum flange serves for mounting the ion-
to-atom converter to the beam-line as well as to the last electrode of the ion-
optics, which serves for injecting the ions from the low energy beam-line into the
converter.

68 Radium Atomic Beam Development
Tem
peratu
reA
veragevelo
cityT
ime
spen
dStick
ing
time
Fraction
ofR
esiden
cetim
e
(T)
ofth
eatom
sin
the
volum
eat
surface
atoms
inof
the
atoms
[K]
(Vave )
(τV
)(τs )
the
volum
ein
the
contain
er
[m/s]
[s][s]
(NV
/N)
[τres ]
(s)
900270
10−
42
10−
4424
1200310
9×10−
510−
210−
22
1500350
8×10−
54×
10−
410−
10.1
2000400
7×10−
510−
510−
10.02
Table
4.4:P
arameters
forestim
atingτres
forth
eT
Ilike
cavity
with
exit
tub
ediam
eterof
6m
mafter
ionop
ticslen
sfor
213R
a.V
olum
e(V
)of
the
cavity
is10−
5m
3.

4.4 Conclusion 69
Power [W]-110 1 10 210
Tem
per
atu
re [
K]
210×3
210×4
210×5
210×6
210×7
210×8
210×9
310
Fig. 4.26: The calibration of the temperature of the ion-to-atom converter was
performed with a K-type thermocouple. The solid line is a fit to the data points.
The fit line assumes a purely radiatively cooled converter. In this case the dissi-
pated power P = A·(T4 − T40), where A is a proportionality constant and T0 is
the temperature of the environment.
4.4 Conclusion
We considered an effusive beam of atomic radium for the experimental search
for EDMs. Radium is collected from a radioactive source of 229Th inside of the
crucible of the oven. The flux of the atomic beam is 106 s−1cm−2 and is scalable
to high fluxes with larger activity of the parent nuclei 229Th. Short lived isotopes
of radium require a different approach since they are only available as ion beam
at radioactive beam facilities. We have observed the neutralization of radium
ions on a zirconium surface and the subsequent release of neutral radium of more
than 58(33)% when the zirconium foil is heated. This is exploited in the design
of an ion-to-atom converter which can be employed at existing radioactive beam
facilities to create intense atomic beams.


Chapter 5
Lasers and Spectroscopy Setup
For the optical spectroscopy of radium atoms a laser system consisting of several
diode lasers have been set up. This system included establishing frequency ref-
erences and also the calibration of optical secondary frequency standards. The
reduction of background for the detection of the optical signal requires a precise
optical imaging system. For recording of the measurements a data acquisition
(DAQ) system was installed and integrated with the experiment and control sys-
tem. The development of these crucial elements for the EDM experiment and
their optimization is described in detail in this chapter.
Laser cooling of radium requires many lasers at different wavelengths. The
absolute stability and reproducibility of transition wavelengths is important. Not
for all wavelengths a secondary reference line like molecular iodine (I2) or molecu-
lar tellurium (Te2) can be found. There is a versatile option arises from an optical
frequency comb which is available within the TRIµP facility. The frequency comb
is shared with other experiments within the TRIµP group. We are in particular
interested in the laser light for the main laser cooling transition of radium. Light
at wavelength λ1 is required for exciting the 1S0 - 1P1 transition which offers
the strongest laser cooling force for radium atoms. Light at wavelength λIC is
needed to excite the 1S0 - 3P1 transition which can serve as the transition for
trapping the radium atoms. Furthermore the main repumping transitions are in
the infrared wavelength region. Light at 1428 nm and 1488 nm is required to
repump the atoms from the metastable D state to the laser cooling cycle.
71

72 Lasers and Spectroscopy Setup
5.1 Light at Wavelength λ1 from a Frequency
Doubled Ti:Sapphire Laser
Light at wavelength λ1 excites the radium atoms from the ground state to the
7s7p 1P1 state. The light is produced by second harmonic generation of infrared
light from a Ti:Sapphire laser.
Fig. 5.1: Block diagram showing the steps involved in the production of blue light
at wavelength λ1.
A commercial Ti:Sapphire laser(Coherent MBR-110) provides the infrared
light. The Ti:Sapphire crystal is pumped by a diode pumped solid-state laser
(Coherent Verdi-V10, 10 W) at 532 nm. The laser is arranged in a bow-tie cavity.
The linewidth is specified to be 500 kHz. It can be operated in the wavelength
range of 700-1000 nm. For 6 W pump power it delivers 300 mW at 965 nm.
The cavity of the laser is continuously flushed with dry nitrogen gas to reduce
the water vapor in the beam path, which shows strong absorption lines in this
wavelength range. The laser is tuned up to 40 GHz by adjusting the thickness of
an etalon.
The laser laboratory where the Ti:Sapphire laser is located is separated by 100
m from the radiation area where the radium atomic beam is accessible. Light
from the Ti:Sapphire laser is transported to the experimental hall by a single
mode optical fiber. Coherent Brillouin backscattering limits the available power
at the end of the optical transport fiber in the radiation area to about 120 mW.
Light at wavelength λ1 is produced by frequency doubling the infra red light
from the Ti:Sapphire laser [111]. Optical non-linear behavior of potassium nio-
bate (KNbO3) is utilized for obtaining the frequency doubling because of its
nonlinear coefficients at this wavelength [112, 113]. The crystal is placed in a
cavity (Fig. 5.2). Phase matching is critical for an efficient doubling process.
Furthermore, the phase matching condition can be achieved not only by the an-
gle of the fundamental light beam with the optical axis of the crystal, but also
by temperature [114–116]. In particular efficient phase matching for KNbO3 is
achieved by temperature tuning.

5.1 Light at Wavelength λ1 73
Fig. 5.2: Schematic of the second harmonic generation cavity and tilt locking
set-up.
The strong correlation of the index of refractive index with crystal tempera-
ture leads to an acceptance of only few mK for the crystal temperature [112,117].
The crystal temperature is controlled by a thermal contact to a Peltier element.
A stability of temperature is achieved by a servo loop to a level of a few mK.
The linear doubling cavity consists of a curved mirror and a flat mirror
(Fig. 5.2). The flat mirror is realized by a reflective coating for both the funda-
mental and second harmonic wavelengths at the back end surface of the KNbO3
crystal. The input coupler of the cavity is mounted on a piezo making the cavity
length tunable.
The error signal for locking the cavity length corresponding to resonance con-
dition is generated by tilt locking technique [118]. The fundamental laser beam
is slightly tilted with respect to the cavity and this tilted beam produces a non-
resonant spatial mode in the cavity. The interference between the two spacial
modes TEM00 and TEM01 reflected from the cavity is analysed by splitting of a
fraction of the beam and focussing the individual lobes of the TEM01 mode on
different halves of a split-photodiode.
The difference of the signals from the two parts of the spilt photodiode shows
a dispersive shape. The maximum value of the blue laser power corresponds to
the zero crossing of the dispersive signal. A servo loop controls the length of
the cavity by a piezo actuator and keeps the cavity on on resonance with the
incoming light. The servo bandwidth of the system is 5 kHz which ensures stable

74 Lasers and Spectroscopy Setup
Fig. 5.3: The two spatial modes TEM00 and TEM01 are focussed on the split-
photodiode. Individual lobes are falling onto different halves of the photodiode.
The bottom part shows the TEM00 mode being tilted, resulting in different size
on the separate halves of the photodiode [118].
operation in noisy environments.
The doubling efficiency of the crystal as a function of temperature is shown in
Fig. 5.4. A dip in the middle of the efficient doubling range is observed. This is a
property of the thickness of the double reflective coating at the end of the crystal.
This property causes a mismatch of the IR and blue laser phases [119]. This
phase mismatch yield a destructive interference between the second harmonic
generation and the reflected blue light. A coating taking care of the phase can
be designed in principle. In that case the maximum doubling efficiency can be a
factor of two larger [119]. The crystal used in this work was manufactured with
a cut at an angle θ= 19 o by FEE [120]. The phase matching temperature for
doubling light at 965 nm is calculated with the program SNLO [121] is 20 oC.
The optimum temperature at the experiment for this crystal at wavelength λ1 is
13.9 oC. The difference between these two temperatures could not be resolved.
Typically blue light of more than 20 mW power is produced using 125 mW
of infrared light using this setup. We split this light using an AOM and use
simultaneously for 225Ra and 130Te2 spectroscopy.
Conclusion
Laser light necessary to excite the 7s2 1S0 - 7s7p 1P1 transition in the radium atom
can be provided by second harmonic generation of a Ti:Sapphire laser beam. The

5.1 Light at Wavelength λ1 75
Fig. 5.4: Blue laser power as function of the temperature of the KNbO3 crystal. A
dip in the overall is observed at 13.94 oC. The maximum output power is achieved
at 13.9 oC. This temperature is critical within a few mK. This measurement was
obtained by varying slowly the temperature of crystal while monitoring the lock
of the second harmonic cavity. The dip at around 13.9 oC was caused by a brief
unlock of the cavity.
laser frequency can be locked to error signal generated by tilt locking technique,
which provides a robust stability for the frequency and the power of the light.
The achieved scan range covers the necessary full frequency range for all radium
isotopes. Temperature tuning of the crystal allows the tuning of the SHG over a
range of more than 20 nm for the fundamental wavelength. In particular wave-
length of 987 nm can be doubled efficiently at a crystal temperature of 72 oC
providing light for barium ion spectroscopy.

76 Lasers and Spectroscopy Setup
5.2 Diode Lasers
Lasers ranging from visible to infrared wavelengths are required to drive the tran-
sitions in atomic radium (Fig. 3.3). Many of the transitions can be accessed with
commercially available semiconductor diode lasers. These lasers are convenient
for using from economical and operational aspects [122, 123]. The home built
diode laser systems with such laser diodes and their frequency stabilizations are
described in this section.
The diode lasers for radium atom experiment are build and frequency stabi-
lized in an external cavity diode laser (ECDL) in Littrow configuration by pro-
viding frequency selective optical feedback [122, 123]. Laser diodes are possible
to operate in a single longitudinal and transverse mode. Within the gain profile
the wavelengthnof the emitted light is highly sensitive to optical feedback. This
feature is exploited in ECDL configuration where a grating provides frequency
selective optical feedback. A schematic drawing of the mechanical set up of a
ECDL in Littrow configuration is shown in Fig. 5.5.
Fig. 5.5: Schematic drawing of the mechanical set up of the External Cavity Diode
Laser in Littrow configuration. The design used in this thesis was developed at
KVI [63].

5.2 Diode Lasers 77
The external cavity consists of a diffraction grating which reflects a fraction of
the emitted light back into the diode. The grating angle is set in such a way that it
can reflect light for a particular wavelength against the direction of the incoming
light. This is the concept of frequency stabilization in the Littrow configuration.
The angle of diffraction for the grating in the Littrow configuration fulfills the
grating equation
2d sin θ = nλ , (5.1)
where d is the groove spacing which is inversely proportional to the number of
grooves per unit length, θ is the angle of incidence, n is the order of diffraction,
and λ is the wavelength of the incident light. The 0th order diffraction beam is
coupled out of the external resonator cavity and the −1st order diffraction beam
is coupled into the laser diode. The fraction of light which is coupled back into
the laser diode is around 20% of total emitted light. This defines the choice of the
grating in the external cavity. The wavelength which fulfills Eq. 5.1 is reflected
back into the diode. The frequency of the emitted light from the laser diode can
be tuned By changing the angle θ.
The mechanical setup for the ECDL configuration for the lasers for the ex-
periments in the TRIµP group is shown in Fig. 5.5. The setup consists of holders
for the laser diode and the collimation optics and an adjustable mount for the
grating. A temperature sensor (AD590) measures the temperature of the diode
and a thermoelectric cooling (TEC) element placed under the laser diode acts as
a heat sink. The laser diode is placed inside its mount in a way that the polar-
ization axis is aligned vertically. The light beam from the diode is collimated by
an aspheric lens.The narrow expansion of the beam is in the vertical direction
and direction of the polarization is orientated parallel to the lines in the grating.
Fine tuning of the grating angle is executed with the help of two screws, one
changes the direction perpendicular to the vertical plane while the other changes
the direction perpendicular to the horizontal plane. When the −1st order diffrac-
tion beam is coupled back into the laser diode the brightness of the emitted light
increases as a result of the initiation of the lasing action. The threshold current of
the laser diode for lasing action is decreased due to the optical feedback typically
by several mA. The whole mechanical setup is covered with a plastic or metal box
which screen the acoustic wave to the diode laser setup. The box also provides
an increased temperature stability of the diode laser.
The lasers operated in this configuration in our experiments are stable for
several hours. The frequency of such lasers can be scanned continuously over 10
78 Lasers and Spectroscopy Setup
GHz by tuning the operating current together with the PZT voltage.
The diode laser at 714 nm for driving the intercombination line in radium
(HL7001MG from Opnext [124]) is set up with a holographic grating (1800
lines/mm from Edmund Optics) with the angle of incidence θ. The diode can
provide 50 mW of power at an operation current of 150 mA.
The diode lasers at 1428 nm and 1488 nm are build for performing spec-
troscopy of the 7s6d 3D2 - 7s7p 1P1 and the 7s6d 3D1 - 7s7p 1P1 transitions in
atomic radium. Each of the lasers can provide more than 30 mW of power. We
can lock them using a wave length meter.
5.3 Frequency References
The stabilization of the frequency of a number of lasers required for radium
trapping demands absolute frequency stabilization over a large part of the optical
spectrum. Optical frequency references were identified and implemented in the
experimental setup. The state of the art technology of optical frequency combs
opens access to optical reference lines over a spectrum ranging from extreme
ultraviolet [125, 126] down to the mid infrared [127, 128]. The drawback of such
a system is that one has to resolve the ambiguity in frequency measurement
within multiples of the frequency comb line spacing or repetition rate (Section
4.4.2). This is in principle possible by performing two measurements where the
comb repetition rate difference is larger than the uncertainty of one individual
measurement. Another possibility to resolve this issue is the use of secondary
frequency references like transitions in atoms or molecules or the use of calibrated
wavelength meters. We have employed in this work all the different methods.
Secondary references are used to calibrate the wavelength meter and for the
unambiguous identification of the comb mode number.
5.3.1 Secondary Frequency References
Widely used secondary frequency references are molecular absorption lines, in
particular transitions in iodine and tellurium. Application of saturated absorp-
tion spectroscopy techniques provide a reproducibility of the frequencies to a level
better than MHz.
High resolution saturated absorption spectroscopy of molecular 127I2 hyper-
fine transitions deliver a natural frequency grid in the 500 nm - 900 nm range.
Particular properties like the absence of an intrinsic electric dipole moment lead

5.3 Frequency References 79
to extremely small perturbation by external electromagnetic fields. The many
strong transitions with typical linewidth of a few MHz make it an ideal sec-
ondary frequency standard. There are more than 60000 iodine lines, which give
about one hyperfine multiplet for every 5 GHz. Many of these lines have been
calibrated with precisions of better than 1 MHz [129]. Tellurium absorption lines
provide precise optical frequency standard for many atomic transition frequencies
in the visible wavelength region, especially in the blue part of the spectrum. The
absence of hyperfine structure results in a simpler Doppler-free spectrum. The
absorption lines are cataloged in the tellurium atlas [130]. Several particular lines
have been absolutely calibrated for particular experiments in the past. In partic-
ular for Hydrogen and Deuterium 1S - 2S transitions, Positronium and Muonium
spectroscopy [131]. It has been reported that several tellurium lines show devi-
ations from the values given in the tellurium atlas of the order of 0.003 cm−1 or
100 MHz [132], which makes a careful calibration necessary for relevant reference
lines in such experiments. The optical transitions in both molecular references
are between some excited rotational and vibrational states. This requires that
the vapor of the molecules to be heated to up to 900 K depending on which part
of the spectrum is of interest.
Reference for the 1S0 - 1P1 Transition in Atomic Radium
This transition is around 483 nm and was first identified by E. Rasmussen. Al-
though isotope shifts and hyperfine structures were determined with MHz ac-
curacy in online collinear spectroscopy at CERN ISOLDE [72, 73], the absolute
frequency was only know to within 1GHz uncertainty. We have chosen to use
molecular tellurium as a reference. We employ Doppler-free saturated absorption
spectroscopy of molecular tellurium. There are several strong lines in the vicin-
ity of the radium transition. The strongest reference line is at 20715.4777 cm−1
which has the label 2004 in the tellurium atlas [130].
The 130Te2 is kept in a quartz cell in order to maintain a high temperature.
The cell has a diameter of 25 mm and a length of 100 mm. It is placed in a
heater element (Watlow, USA) of inner diameter of 50 mm and 150 mm length.
A K-type thermocouple is inserted next to the cell to monitor the temperature.
The oven is surrounded by glass wool as isolation. The cell can be heated to
temperatures up to 900 K with about 100 W of electric heating power.

80 Lasers and Spectroscopy Setup
Ti:S
apph
ire
Lase
r
Freq
uenc
y C
omb
SHG
Cav
ity
AO
M1
AO
M2
Lock
-in-
Am
plifi
er
Ref
eren
ce
sign
al
D
A
Q
Wat
low
Ove
n
Te c
ell
Bea
t no
te
Fig. 5.6: Setup for amplitude modulation saturated absorption spectroscopy of
tellurium. The pump beam is amplitude modulated with a modulation frequency
around 13 kHz with the acousto-optic-modulator AOM2. The difference signal
between transmission between the two probe beams passing through the tellurium
cell is detected on a balanced split photodetector.

5.3 Frequency References 81
The amplitude modulated saturated absorption spectroscopy setup is shown
schematically in Fig. 5.6. About 2 - 4 mW of light at wavelength λ1 is taken
from the output of the frequency doubling setup (Section 4.3.1). The light is
split of by an AOM1 which allows for a flexible division of the light between the
tellurium spectroscopy and the radium spectroscopy. Furthermore it provides
also a frequency offset between the two parts. The AOM1 operates between 250
- 500 MHz [(MT350-AO, 12VIS) from AA Optoelectronics [133]]. We operated
it mainly at 328.5 MHz to bridge the gap between the radium and tellurium line.
After the AOM1 we pass the light through a thick glass plate in order to produce
two weak probe beams of about 4 % of the main beam. The beams are directed
through the heated Te-cell.
Overlap of the pump beam and the probe beam inside the tellurium cell is
determined by looking at the overlap on a white card at a distance of 130 mm
away from the centre of the cell. This was done on both ends of the cell. The
counter-propagating beam alignment cancels the first-order Doppler shift, but
the second-order Doppler shift (v2/2c2)fTe is not. The shift could be obtained by
substituting the root mean square velocity v =√
3kBT/M into the expression
of second-order Doppler shift. This gives shift of 0.001 MHz for the operating
temperature of our cell. The shift estimated here is an upper bound for the
second-order Doppler shift.
The intensities of the two probe beams are measured in a split photo diode
which is operated as a balanced photo detector. The signal of the individual
photodiodes is amplified and subtracted in a homebuild amplifier [63] and the
difference is sent to a lockin amplifier. The transmitted beam is focused into a
second AOM2 operated at 60 MHz. The -1st order is overlapped on a polarizing
beam splitter with one of the probe beams. The rf to this AOM2 is amplitude
modulated (chopped) at around 13 kHz to provide the amplitude modulation of
the pump beam. The transmitted power through the tellurium cell is measured
on a photodiode in order to measure the linear absorption of tellurium. The
output from the lockin-amplifer provides the saturated absorption spectrum of
tellurium with a good signal-to-noise ratio. It is digitized by feeding the signal
in a voltage-to-frequency converter and counting the frequency (Appendix B).

82 Lasers and Spectroscopy Setup
]-1Wave number - 20715.46753 [cm-0.2 -0.1 0 0.1 0.2 0.3
Sat
ura
ted
ab
sorp
tio
n
0
5
10
15
20
25
]-1Wave number - 20715.46753 [cm-0.2 -0.1 0 0.1 0.2 0.3
Lin
ear
abso
rpti
on
0.7
0.8
0.9
1
0.25 0.2550
0.10.20.3
-3-2
-1
0
1
2
3
45
51
6
2004
20715.59 cm−1
Fig. 5.7: Saturated absorption and linear absorption spectrum of 130Te2 cover-
ing the 2004 line in Te atlas. Saturated absorption line corresponding to the
2004 absorption line is calibrated to 20715.46886(5) cm−1. (Inset) The satu-
rated absorption line at 20715.72148(5) cm−1 is closest to the 7s2 1S0(F=1/2) -
7s7p1P1(F=3/2) transition in 225Ra.

5.3 Frequency References 83
]-1Wave number - 20715.46753 [cm1.5 1.6 1.7 1.8 1.9 2
Sat
ura
ted
ab
sorp
tio
n
0
2
4
6
8
]-1Wave number - 20715.46753 [cm1.5 1.6 1.7 1.8 1.9 2
Lin
ear
abso
rpti
on
0
0.2
0.4
0.6
0.8
1
80
81
82
8390
91
2008 2009
Fig. 5.8: Saturated absorption and linear absorption spectra of 130Te2 covering
the lines 2008 and 2009 in the tellurium atlas [130].

84 Lasers and Spectroscopy Setup
Reference for the 1S0 - 3P1 Transition in Atomic Radium
This intercombination transition is around 714 nm and has a narrow line width.
To achieve a lower Doppler temperature for trapped radium atoms a second-stage
laser cooling is required as there is no sub-Doppler cooling mechanism possible
for alkaline earth atoms as in alkali atoms. The second stage cooling can be
employed by the intercombination transition. We perform Doppler free saturated
absorption spectroscopy of molecular iodine to determine the absolute frequency
of the intercombination transition in radium.
To excite the molecules to these states the iodine is heated inside an oven at
about 650 K. The temperature of the iodine vapor is measured with a K-NiCr
type thermocouple in the middle of the oven. At these elevated temperatures
the pressure of the iodine is so high that the individual transition lines become
invisible because of collisional broadening. A cold finger made of copper and is
kept at a temperature of about 340 K is employed to overcome this problem. The
molecular iodine condenses on this cold finger which reduces the overall vapor
pressure in the cell and make the transition visible.
The saturated absorption setup of iodine is quite similar to the setup used
for tellurium. Two small fraction of laser beams, the probe and reference are
split with an optical window, while the principle pump beam is guided around
the oven to make it counter propagating with respect to the other probe and
reference beams.
The frequency modulation is realized by double passing a laser beam through
an AOM, which is modulated in frequency with the pump beam. The pump
beam passes through a λ/4 plate and is then focussed in the AOM. A concave
mirror reflects the beam at 180o and only the 1st order beam is used for double
passing while the 0th order is blocked by a diaphragm. The reflected beam passes
through the AOM and λ/4 plate again which rotates the polarization of the beam
by 90o . The beam can pass then through the polarizing beam splitter (PBS).
The probe beam is saturated by the pump beam by overlapping both the
probe and pump beams within the iodine cell. The probe and reference beams
are monitored by a split-photodiode, giving the absolute difference between the
two halves as an output signal. This signal is feed into the input of a lock-in
amplier, which extracts the frequency modulated signal with a good signal-to-
noise ratio.

5.3 Frequency References 85
Saturated Absorption Spectroscopy of 127I2
Iodine is another well known secondary frequency reference for stabilizing the
laser frequencies at visible wavelengths. The experimental setup for frequency
modulated saturated absorption spectroscopy setup for providing secondary fre-
quency reference for radium intercombination transition is same as described in
reference [63].
The first diode laser at wavelength λIC is locked to the R(116) (2-9) a15
transition of 127I2 at 13999.2459 cm−1. This laser was referenced to an optical
frequency comb for absolute frequency measurement of radium intercombination
transition. A series of iodine transitions including the reference transition for
radium is shown in Fig.5.10.

86 Lasers and Spectroscopy Setup
I 2 O
ven
BS
Split
Ph
otod
iode
Loc
k-In
A
mpl
ifier
λ/4 A
OM
f
PBS1
PB
S2
Isol
ator
Bea
t no
te
BS
Col
d fin
ger
Dio
de
Las
er
VC
O
PID
L
oop
From
seco
nd la
ser
Fig. 5.9: Setup for frequency modulation saturated absorption spectroscopy of
iodine 127I2. Linear polarized laser light is employed both for the probe and the
pump beam. The pump beam polarization is orthogonal to the polarization of the
two probe beams. The pump beam light is frequency modulated with a double
passed AOM. The difference signal between the two probe beams is detected on
a balanced split photodetector [63,134].

5.3 Frequency References 87
(A)
(B)
Fig. 5.10: (A) Recorded saturated absorption spectrum of molecular iodine, 127I2
for the secondary frequency reference for the intercombination transition at wave-
length λIC in atomic radium. (B) Calculated spectrum of the using the iodine
software [135]. The parameters used are temperature T = 650 K and hyperfine
linewidth = 0.0003 cm−1.

88 Lasers and Spectroscopy Setup
5.3.2 Frequency Comb
An optical frequency comb is a very precise tool to measure frequencies of light
with unprecedented accuracy. The accuracy of a reference frequency in the ra-
dio frequency domain is transferred to the optical regime by the exploitation of
properties of a mode-locked laser. The output of a mode-locked laser in the time
domain consists out of short pulses which are separated by a constant time ∆trep.
Furthermore, the phase between the envelope and the carrier has a determinis-
tic evolution, i.e. the phase shift between to consecutive pulses is a constant
(Fig. 5.11). Under these conditions the Fourier transformation of the electric
field of the light field results in a comb like structure with lines separated by a
frequency interval frep = 1/trep. Due to the phase shift ∆Φ between two pulses
in the time domain the frequencies of the lines can be written as
fn = n · frep + fCEO , (5.2)
where n is the mode number and fCEO = ∆φ/trep is the so called carrier envelop
offset. The typical repetition rate of frequency comb is 50 MHz upto GHz. In
order to exploit such a mode locked laser for optical frequency measurements the
repetition rate and the phase shift ∆φ have to be controlled to a high accuracy.
Offset Frequency Determination of an Optical Frequency Comb
The spectral width over which the optical power is distributed depends on the
pulse width of the individual pulses in the domain. Coupling the light into a
photonic crystal fiber causes an additional broadening of the optical spectrum
[137] which can then span more than one octave. In this case the carrier envelope
phase offset fCEO can be measured. Light from the long wavelength part of the
spectrum is frequency doubled in a nonlinear crystal. This light is overlapped
with light from the short wavelength part of the spectrum. The two frequencies
are then
f2n = 2nfrep + fCEO and f ′ = 2f2n = 2nfrep + 2fCEO . (5.3)
The difference frequency of this two frequencies can be detected as a beat note on
a fast photodiode. The repetition rate and the career envelope offset fCEO can be
electronically locked to a stable rf reference and transfer by this the stability to all
comb lines. We employ a frequency comb from Menlo systems with a repetition
rate between 248.8 - 251.2 MHz. The comb operates in infrared region between
1 - 2.1 µm. The visible part of the spectrum is covered by frequency doubling

5.3 Frequency References 89
Time domain- Femtosecond pulse train
nf+f0 2nf+f0
SHG 2(nf+f0) Beat note f0=2(nf+f0)-(2nf+f0)
Frequency domain- Frequency comb
Fourier transformation
Frequency
Time
Phase shift
2 × Phase shift
Repetition frequency
Offset frequency
Fig. 5.11: (Top) Pulse train emitted from a mode locked laser. As the carrier
wave (blue) moves with a phase velocity while the envelop (red) moves with a
different group velocity the carrier wave experiences a phase shift with respect
to the envelop after each round trip. (Bottom) Working principle of an optical
frequency synthesizer [136].
of the amplified output of the comb which is centered around 1560 nm. The
doubled light at 780 nm is then broadened in a crystal fiber to cover the optical
spectrum from 480 nm - 1000 nm.
Determination of Unknown Optical Frequencies
Principle equation for determining the frequency of the light from a CW laser is
fCW = nfrep ± fCEO ± fBN (5.4)
where, fBN is the beat-note produced by the CW laser and the comb laser fre-
quencies.

90 Lasers and Spectroscopy Setup
Fig. 5.12: Broad spectrum from a photonic crystal fiber frequency comb laser in
the TRIµP optics laboratory at KVI.
The repetition rate of the comb laser is approximately 250 MHz. This rate
can be calculated using the following equation
frep =fDDS
4+ 245 MHz (5.5)
where, fDDS is the counter readout for the corresponding repetition rate.
The mode number n for a light at wave length λ can be obtained by taking
the integer part of the following equation,
n =c
λfrep. (5.6)

5.3 Frequency References 91
Fig. 5.13: The light from a CW laser produces beat-notes with more than one
neighboring modes in the frequency spectrum of the frequency comb.
Frequency[100MHz/div.]
Beat‐note[10dB
/div.]
0 frep 2×frep 3×frep
Fig. 5.14: The beat note spectrum between Ti:Sapphire laser light and the fre-
quency comb light on a photodiode on a Hameg 1 GHz rf spectrum analyzer
(HM5510).

92 Lasers and Spectroscopy Setup
5.4 Absolute Frequency Calibration of Molecu-
lar Reference Lines
The frequencies of the reference lines in molecular tellurium are calibrated by
comparing the fundamental frequency at the Ti:Sapphire laser light with the
frequency of laser radiation from an optical frequency comb. This is done simul-
taneously with the saturated absorption spectroscopy described in Section 5.3.1.
A fraction of the IR light from the Ti:Sapphire laser is overlapped with light from
the frequency comb on the pn junction of a InGaAs Photodiode (FGA04, 100 ps
Rise Time, 800 - 1800 nm) from Thorlabs Inc., NJ, USA. The photodiode cur-
rent contains frequency components at the difference frequency of the two lasers
(beat note). The tellurium transition frequency, fTe is then obtained through
equation 5.7
fTe = 2× (nfrep + fCEO + fBN) +mAOM1 × fAOM1 +mAOM2 ×fAOM2
2, (5.7)
Where frep and fCEO are the repetition frequency and offset frequency of the
frequency comb. The sign of frep and fCEO may be negative as well as positive and
needs to be determined. The integer n is mode number which can be determined
by equation. 5.6 (see Fig. 5.6) and mAOM1 and nAOM2 are the order numbers of
the sidebands from the two AOMs used in this measurement. fAOM1 and fAOM2
represents the operating frequencies of the two AOMs.
The saturated absorption lines shown in Fig. 5.7 and Fig. 5.8 were individually
scanned and recorded. The repetition rate frep was chosen such that the beat note
frequency fBN at resonance was between 30 - 80 MHz. For the measurements
temperature of the 130Te2 oven was 804(1) K. The spectroscopy was performed
with a total 3.5(5) mW blue power.
Frequency [MHz] Order number to tellurium setup
AOM1 328.500 0
AOM2 60.000 -1
Table 5.1: Frequencies and order numbers of the laser beams from the two AOMs
used for tellurium spectroscopy.
A better indication of the vapor pressure in the tellurium cell at a given tem-
perature is given by the linear absorption at a particular resonance. It has been

5.4 Absolute Frequency of Molecular Transitions 93
used previously [131,138–140] as a basis for determining the effective temperature
of tellurium cell, and hence the vapor pressure. For a cell of length l, containing N
molecules per unit volume, the linear absorption of a line is A = 1− exp(−Nσl),where effective absorption cross section σ in the range of the tellurium absorption
spectrum is of the order of 10−22m2 [140]. In order to determine A as a function
of temperature T, it is necessary to express N as a function of temperature. For
Temperature [K]720 740 760 780 800
Lin
ear
abso
rpti
on
[%
]
0
5
10
15
20
Fig. 5.15: Linear absorption as a function of temperature on a tellurium absorp-
tion line corresponding to the Te#3 line at 20715.59 cm−1. The measured data
is fitted with a least χ2 function described in [141].
a gas at saturated vapor pressure P confined in a cell of volume V at absolute
temperature T
N =PV
kBT, (5.8)
where kB is the Boltzmann constant. Thus
N
V=P (T )
kBT. (5.9)
Linear absorption is measured as a function of cell temperature for a tellurium
absorption line corresponding to the Te#3 saturated absorption line (Fig. 5.15).
94 Lasers and Spectroscopy Setup
A least χ2 fit through the data points shows right behavior as observed in previous
measurements [140,141].
Under these conditions we calibrate the tellurium lines against the frequency
comb. A subset of six of the lines is presented in Fig. 5.16. The line shape is
in good agreement with a Lorentzian form. The linewidth of these transitions is
between 11 and 28 MHz while the signal strength varies by a factor of 300 from
line #0 (Fig. 5.7) to line #51 (Fig. 5.7).
Note that the strength of the saturated absorption signal is not proportional
to the strength of the linear absorption or the number density of the molecules.

5.4 Absolute Frequency of Molecular Transitions 95
Frequency - 621 034 100 [MHz]-20 0 20 40 60 80
Sat
ura
ted
ab
sorp
tio
n [
a.u
.]
0
20
40
60
80
100
Frequency - 621 034 100 [MHz]1950 2000 2050
Sat
ura
ted
ab
sorp
tio
n [
a.u
.]
0
10
20
30
Frequency - 621 034 100 [MHz]3750 3800
Sat
ura
ted
ab
sorp
tio
n [
a.u
.]
0
5
10
15
20
Frequency - 621 034 100 [MHz]5450 5500 5550
Sat
ura
ted
ab
sorp
tio
n [
a.u
.]
0
5
10
Frequency - 621 034 100 [MHz]7600 7650
Sat
ura
ted
ab
sorp
tio
n [
a.u
.]
0
0.01
0.02
0.03
Frequency - 621 034 100 [MHz]9050 9100
Sat
ura
ted
ab
sorp
tio
n [
a.u
.]
0
5
10
15
Te#0
- 14.8(1) MHz
Te#2
- 16.2(2) MHz
Te#3
-
28.5(4)MHz
Te#5
- 13.9(2) MHz
Te#51
- 11.0(2) MHz
Te#6
- 13.5(3) MHz
Fig. 5.16: Six individual saturated absorption lines in 130Te2 as a function of
absolute frequency. The full width at half maxima for all the lines is extracted
by fitting the peaks with a Lorentzian fit function.

96 Lasers and Spectroscopy Setup
5.4.1 Estimate of Measurement Uncertainties
The Uncertainty of the frequency measurement arises from the statistical and
systematic uncertainties. Statistical uncertainty arises due to finite signal to
noise ratio of the data points. Systematic uncertainties arise from the drift of
parameters in the experimental setup, e.g. density related shifts, ac Stark shift,
second-order Doppler shift, and frequency standard and computer fitting . An
estimate of the systematic uncertainties for the absolute frequency calibration of
molecular tellurium is given below.
Collision Induced Shifts
Collisions induce pressure shifts of atomic and molecular transition frequen-
cies [142]. These shifts are after referred to as pressure shifts. In case of an
absolute accuracy to be better than 0.1 MHz is needed for a certain line, a criti-
cal investigation of pressure shift is necessary. In order to determine the pressure
shift for tellurium lines, the vapor pressure of tellurium inside the cell needs to
be stable and known on a level of 0.1 mbar or the cell temperature to 6 oC [143].
Assuming that the pressure shift is about 1 MHz/ mbar as observed for previ-
ously measured for some lines [138–140, 144] we estimate the uncertainty due to
pressure shift in our measurement. During the data collection, the maximum
observed fluctuation of the tellurium cell temperature is ±1 oC, which limits the
uncertainty on tellurium frequency due to pressure shift to ±0.17 MHz.
ac Stark Shift
The ac Stark shift or light shift is the shift of energy levels of atoms and molecules
due to presence of an external electromagnetic field (see e.g. [145]). The uncer-
tainty in the intensity arises from the knowledge of the beam diameters in the
overlapped region. We measured the ac Stark shift for the Te#0 line by vari-
ation of the intensity of light beam under the same beam focusing conditions.
The lowest and highest intensities correspond to 190(50) mW/cm2 and 570(160)
mW/cm2 respectively. The transition frequency changes by less than 1 MHz over
this range of intensities. An ac Stark coefficient of 0.0016 MHz/(1 mW/cm2) is
obtained from the fit of the data points shown in Fig. 5.17.

5.4 Absolute Frequency of Molecular Transitions 97
]2Intensity [mW/cm200 400 600
Fre
qu
ency
- 6
21 0
34 1
00 [
MH
z]
6.5
7.0
7.5
Fig. 5.17: The ac Stark shift is determined for the line Te#0 by measuring the
transition frequency at different intensities.
Frequency Standard
The accuracy of our optical frequency comb is derived from a Global Positioning
System stabilized Rb clock to be better than 10−11 [146]. The corresponding
frequency uncertainty for the tellurium measurements is 0.006 MHz. To check
the consistency of the frequency calibration by the frequency comb we measure
the beatnote frequencies for the line #0 in molecular tellurium at three different
repetition rates of the frequency comb as a function of the frequency difference
between repetition rates. The slope of Fig. 5.18 provides the mode number of
the comb-line with an uncertainty less than one mode. In this means the mode
number can be determined if there is no frequency marker available at the order
of the repetition rate of the comb.

98 Lasers and Spectroscopy Setup
[MHz]rep f∆-180 -160 -140 -120 -100 -80 -60 -40 -20 0
Bea
tno
te F
req
uen
cy [
Hz]
0
50
100
150
200
Fig. 5.18: The beatnote frequencies for the line #0 in molecular 130Te2 at three
different repetition rates of the frequency comb were measured. The vertical axis
shows the frequency difference between repetition rates. The slope of this plot
provides the mode number of the comb line with an uncertainty less than one
mode. In this means the mode number can be determined if there is no frequency
marker available at the order of the repetition rate of the comb.
Signal to Noise
In order to determine centre frequency of the measured saturated absorption
peak, they are fitted by Lorentzian function
L(ω) =1
2π
Γ
(ω − ω0)2 + Γ2/4, (5.10)
where ω0 is the center and Γ is the width of the profile. The accuracy of the
fitted parameters depends on the signal to noise for the data points and the
agreement of the line model with the measured data points. For all individual
lines frequency uncertainty due to the fitting is 0.1 MHz.
The systematic uncertainties arising from various sources for the absolute fre-
quency calibration of molecular 130Te2 at 483 nm are listed in Table 5.2. Root
mean square of all the uncertainties is 0.200 MHz. This uncertainty is smaller

5.5 Conclusion 99
Source of uncertainty Uncertainties
(MHz)
Pressure shift 0.170
ac Stark shift 0.048
Optical frequency comb 0.006
Signal to noise 0.100
Total (root mean square) 0.200
Table 5.2: Systematic uncertainties for the absolute frequency calibration of
molecular tellurium.
than the statistical uncertainty in our measurement which arise from the contri-
bution to the tellurium frequency from several measurements taken at identical
conditions. Finally, serious consideration of frequency shift due to cell-to-cell
variation is necessary for comparison of laser light frequencies stabilized to dif-
ferent tellurium cells. The cell-to-cell shift arises from the possible foreign gas
contaminants in the cell. Previous measurement shows that this variation is less
than MHz level [140] and therefore can be neglected to the laser spectroscopy
experiments where an accuracy of ≤5 MHz is sufficient.
5.5 Conclusion
The laser spectroscopy tools for radium spectroscopy and laser cooling and trap-
ping have been setup. This includes the light sources as well as the calibration
and control of the optical frequencies of the laser light. Particularly we identified
and calibrated reference lines in molecular 130Te2 and 127I2 by saturated absorp-
tion spectroscopy technique together with an optical frequency comb. These
references permit the stabilization of the lasers for radium experiments.

100 Lasers and Spectroscopy Setup
Saturated Absorption line Measured Measured Relative
absorption marked in Wave number Frequency strength
line Te Atlas [cm−1] [MHz]
-3 20715.22252 621026747.7(1.0) 23
-1 20715.44056 621033284.4(1.2) 37
0 # 2004 20715.46886 621034132.9(1.5) 100
1 20715.49432 621034896.2(1.6) 9
2 20715.53421 621036092.1(0.7) 34
3 20715.59374 621037876.7(1.6) 19
4 20715.60749 621038288.8(1.5) 9
5 20715.65112 621039596.9(1.6) 14
51 20715.72148 621041706.3(1.7) 0.03
6 20715.77029 621043169.4(1.5) 16
80 # 2008 20716.98905 621079707.1(0.3) 12
81 20717.08818 621082678.8(0.7) 21
82 20717.15013 621084536.0(0.8) 3
83 20717.34167 621090278.2(0.4) 6
90 # 2009 20717.43666 621093126.1(0.3) 15
91 20717.46039 621093837.3(0.4) 16
Table 5.3: Wave numbers, frequencies and relative strengths of saturated absorp-
tion and linear absorption lines in 130Te2. The uncertainty of the wave number
measurements is 0.00005 cm−1. This corresponds to 1.5 MHz in the optical fre-
quency measurement.
Chapter 6
Spectroscopy of Radium and
Barium in Effusive Atomic Beam
Performing a search for permanent Electric Dipole Moments with radium isotopes
requires not only precise knowledge of atomic states and nuclear properties, but
also the practical implementation of the manipulation of the atomic states. In
this chapter we report on the progress in laser spectroscopy of the main transition
in radium for laser cooling and trapping. The strong singlet-singlet 1S0 − 1P1
transition is the only path to large optical slowing forces which are essential in
reaching high capture efficiencies for a magneto optical trapp (see Section 3.3).
In addition it is required for state selective population of the metastable 3D-
states in which large atomic enhancement factor for EDMs are present. The
weaker intercombination line 1S0 − 3P1 is essential for second stage laser cooling
since it give access to two orders of magnitude smaller Doppler temperature.
There are two major aspects. Firstly the absolute calibration of these transitions
with an uncertainty below the natural linewidth. This is required for stable
operation of laser cooling and trapping. Secondly the stable realization of these
optical frequencies is realized by stabilization of the lasers to secondary frequency
standards in molecular transitions or directly by controlling the frequency with an
optical frequency comb. The laser spectroscopic results were obtained by Doppler
free fluorescence spectroscopy of the 225Ra. Properties of the 225Ra atomic beam
is described in Section 4.2. The laser system and their frequency calibration
is presented in Section 5.1, 5.2 and 5.3. The measurements presented here are
required to test the atomic theory for upcoming experiments to search for an
EDM in the radium atom.
101

102 Spectroscopy of Radium and Barium in Effusive Atomic Beam
7s 7p 1P1
7s2 1S0
7s 7p
3P2
3P1 3P0
3D3 3D2 3D1
0
Ener
gy [c
m-1
]
10000
20000
7s 6d
7s 6d 1D2
λ1
λIC
λIR2
λIR3
3/2
1/2
3/2
1/2
λIR1
λ1= 482.7 nm λIC= 714 nm λIR1= 1428.6 nm λIR2= 1487.7 nm λIR3= 2751.6 nm
Fig. 6.1: Simplified energy level structure of atomic radium. The hyperfine states
are shown only for 1P1 and 3P1 states. Wavelengths are taken from [67].
6.1 Laser Induced Fluorescence Spectroscopy
Laser spectroscopy of the two transitions from ground state in atomic radium
is performed by laser induced Doppler free spectroscopy. As the flux of radium
atoms in this experiment is about 105 − 106 s−1 and the atoms are available
for spectroscopy for a few hundred second, a good signal-to-noise ratio of the
fluorescence spectroscopy is necessary. The Doppler free technique allows to
simultaneously excite all the atoms in an atomic beam to a same frequency. This
results in an enhanced signal-to-noise ratio for the fluorescence spectroscopy.
The laser beam at λ1 is overlapped with the atomic beam in a perpendicular
direction (Fig. 6.2). This orthogonal geometry between the atomic beam and
the laser beam eliminates the shifts in atomic transition frequencies due to first
order Doppler effect. The laser power is measured after the laser-atom interaction
region. The fluorescence count rate detected by a photomultiplier is normalized
by laser power to eliminate unwanted noise in the fluorescence signal arising from
fluctuation of the laser power.
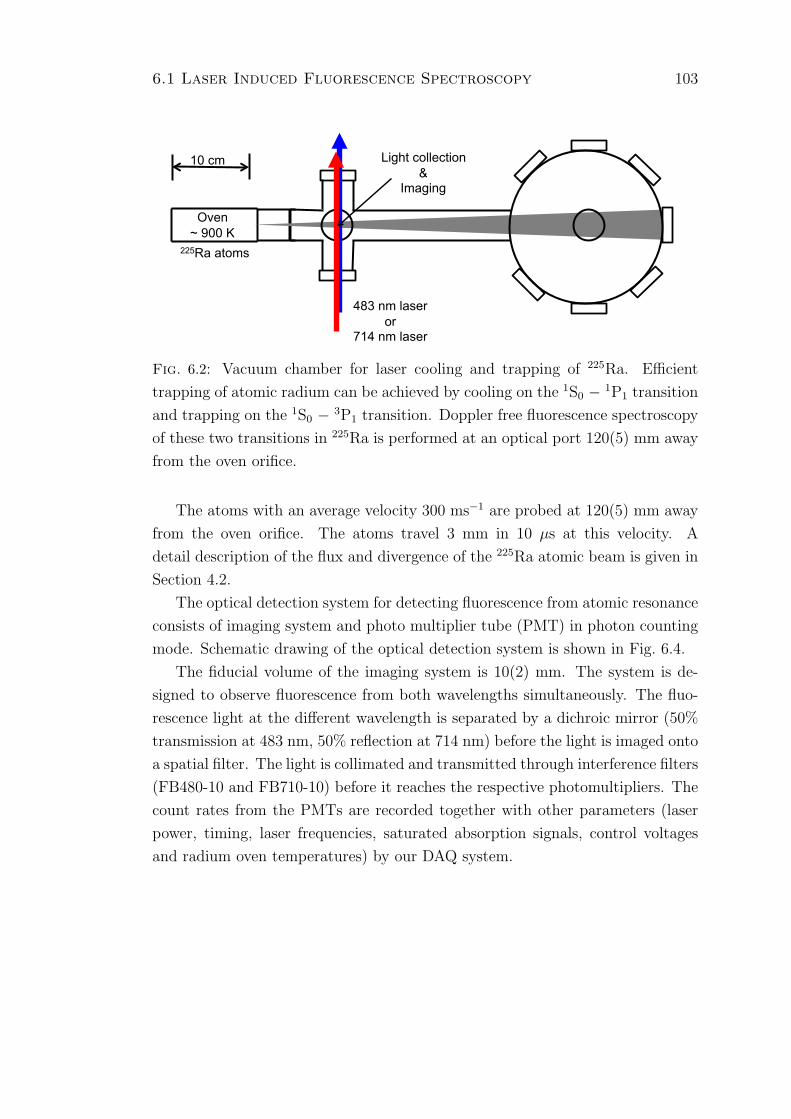
6.1 Laser Induced Fluorescence Spectroscopy 103
10 cm
Oven ~ 900 K
225Ra atoms
Light collection &
Imaging
483 nm laser or
714 nm laser
Fig. 6.2: Vacuum chamber for laser cooling and trapping of 225Ra. Efficient
trapping of atomic radium can be achieved by cooling on the 1S0 − 1P1 transition
and trapping on the 1S0 − 3P1 transition. Doppler free fluorescence spectroscopy
of these two transitions in 225Ra is performed at an optical port 120(5) mm away
from the oven orifice.
The atoms with an average velocity 300 ms−1 are probed at 120(5) mm away
from the oven orifice. The atoms travel 3 mm in 10 µs at this velocity. A
detail description of the flux and divergence of the 225Ra atomic beam is given in
Section 4.2.
The optical detection system for detecting fluorescence from atomic resonance
consists of imaging system and photo multiplier tube (PMT) in photon counting
mode. Schematic drawing of the optical detection system is shown in Fig. 6.4.
The fiducial volume of the imaging system is 10(2) mm. The system is de-
signed to observe fluorescence from both wavelengths simultaneously. The fluo-
rescence light at the different wavelength is separated by a dichroic mirror (50%
transmission at 483 nm, 50% reflection at 714 nm) before the light is imaged onto
a spatial filter. The light is collimated and transmitted through interference filters
(FB480-10 and FB710-10) before it reaches the respective photomultipliers. The
count rates from the PMTs are recorded together with other parameters (laser
power, timing, laser frequencies, saturated absorption signals, control voltages
and radium oven temperatures) by our DAQ system.

104 Spectroscopy of Radium and Barium in Effusive Atomic Beam
Fig. 6.3: Experimental setup for laser spectroscopy of 225Ra at KVI. In this setup
an effusive atomic beam of 225Ra is produced at 900 K. 225Ra is the product of α-
decay of 229Th inside a titanium crucible (Section 4.2). Laser light for excitation
of the transitions enters the vacuum chamber perpendicular to the divergence
of the atomic beam. Fluorescence from the excited atoms is collected by a lens
assembly and imaged on two photomultiplier tubes, which are sensitive for the
wavelength λ1 and λIC .
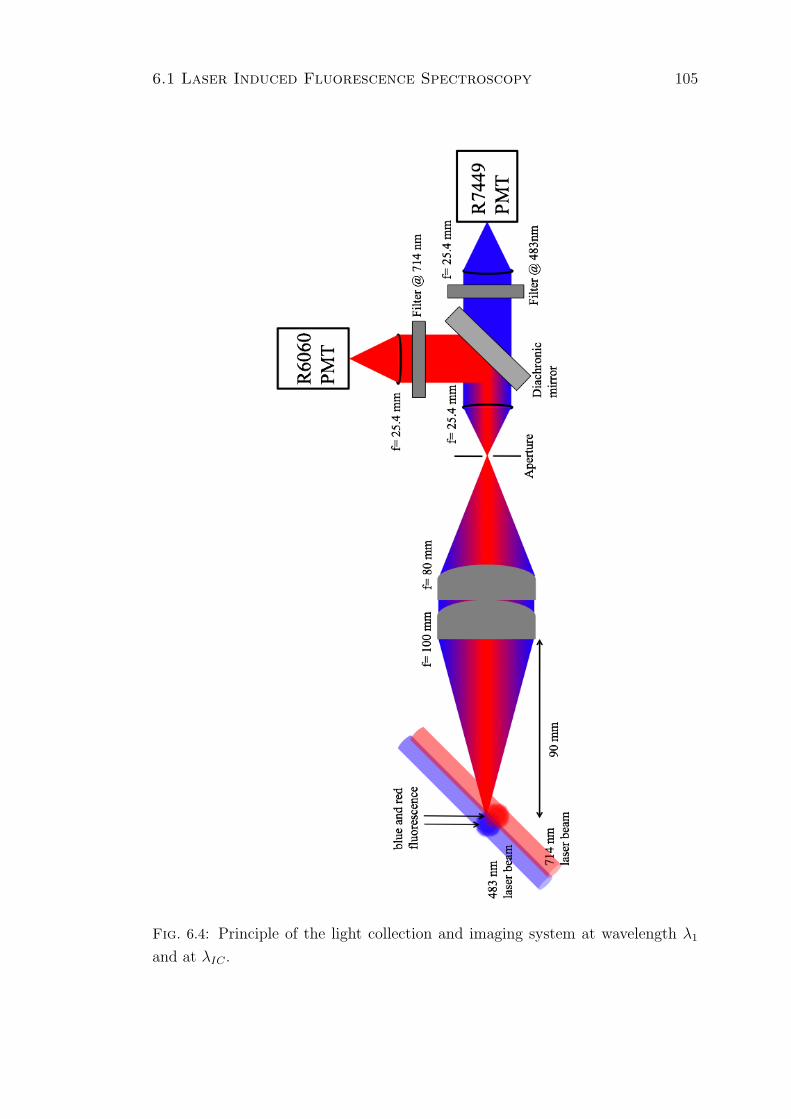
6.1 Laser Induced Fluorescence Spectroscopy 105
Fig. 6.4: Principle of the light collection and imaging system at wavelength λ1
and at λIC .

106 Spectroscopy of Radium and Barium in Effusive Atomic Beam
The blue fluorescence is projected on to the photo cathode of a Hamamatsu
R7449 PMT with head on type bialkali photocathode of an effective area of
diameter 25 mm. The dark count rate of this PMT is ∼ 100 s−1. The quantum
efficiency of this PMT at wavelength λ1 is 18(1)% (Appendix C). A band pass
filter (FB480-10) with center wavelength 480 nm, spectral width 10 nm and
transmission 55 % (Appendix D) is placed in front of this PMT.
The red fluorescence is projected on a R6060-12 peltier cooled PMT with side
on type multialkali photocathode of an effective area of 4 × 13 mm2. The dark
count rate of this PMT is < 10 s−1 when the cathode is cooled to 0 oC. The
quantum efficiency of this PMT at wavelength λIC is 9(1)% (Appendix C). A
band pass filter (FB710-10) with center wavelength 710 nm, spectral width 10
nm and transmission 55 % (Appendix D) is placed in front of this PMT.
The detection efficiency (εi) of a PMT for a wavelength depends on the solid
angle (Ω) of light collection, the splitting factor of the dichroic mirror (εd), quan-
tum efficiency (εi) of the PMT at that wave length, and the transmission efficiency
(εf ) of the filter
εi = Ω · εd · εi · εf . (6.1)
The area A of the light-atom interaction section which is imaged on the PMT
through a light collection system situated at a distance r from the image plane is
defined by the solid angle of light collection Ω
Ω =
∫∫s
ndA
r2. (6.2)
The light collection and imaging system consists of two achromatic doublet
lenses of focal lengths f1= 100 mm and f2= 80 mm mounted next to the window
of the vacuum chamber at a distance of 90(5) mm from the center of the vacuum
chamber. The solid angle of light collection is 1× 10⁻² Sr. An aperture is placed
at the focal plane of the combination of the achromatic doublet lenses. The object
to image ratio for this system is 1:1. After the focal plane the image is collimated
by another lens of focal length f3= 25.4 mm placed at a distance of 25.4 mm
from the aperture. The collimated beam is split in blue and red components by
using a dichroic mirror of splitting ratio 1:1. The detection efficiency for the blue
fluorescence is 5(1) · 10−4 and that for red is 3(1) · 10−4.

6.2 The 7s2 1S0 − 7s7p 1P1 Transition in 225Ra 107
6.2 The 7s2 1S0 − 7s7p 1P1 Transition in 225Ra
The 7s2 1S0 - 7s7p 1P1 transition at wavelength λ1 is the strongest transition
available in atomic radium from the ground state. The transition is crucial for
an efficient slowing of radium atom from a thermal beam and as a sensitive
probe for detecting metastable D-states, e.g. by two-photon Raman transition.
The measurement employed radium atomic beam (Section 4.2), the laser system
(Section 5.1) and the absolute frequency calibration in our experiment.
The setup for Doppler free fluorescence spectroscopy of the 1S0 − 1P1 transi-
tion in 225Ra is shown in Fig. 6.2. The light at wavelength λ1 which is produced
by frequency doubling IR light from the Ti:Sapphire laser light is split for the
saturated absorption spectroscopy of 130Te2 and the radium fluorescence spec-
troscopy by AOM1. About 1 mW of light at wavelength λ1 diffracted in the first
order by AOM1 for the saturated absorption spectroscopy. A fraction of IR light
is overlapped on a photodiode with the light from an optical frequency comb in
order to create a beatnote. The absolute transition frequency of the reference130Te2 line and the 225Ra transition is recorded simultaneously by the beatnote
of IR laser with frequency comb light. A collimation lens is employed to produce
a collimated laser beam at λ1. Diameter of the beam at the interaction section is
6(1) mm. This correspond to an intensity of 26(2) mW/cm2 which is about 80%
of the saturation intensity of the transition. At the saturation intensity Iλ1s = 31
mW cm−2 scattering rate of this transition is 4.5·107 s−1. Interaction time of the
atoms with laser beam in the fiducial volume is about 20 µs. During the time of
flight through the laser beam at λ1 the radium atoms are re-excited for ∼ 3000
times to collect fluorescence from the decay of radium atoms from the 7s7p 1P1
state.
Absolute frequency calibration of the transition is performed against a ref-
erence saturated absorption line of 130Te2 which is frequency calibrated by an
optical frequency comb. AOM1 with an RF frequency, frf1 of 450 MHZ (Section.
4.5.2; Fig. 4.26) splits the light beam at wavelength λ1 for 130Te2 and 225Ra
spectroscopy. 0th order beam goes to 130Te2 setup and -1st order beam goes to225Ra experiment. Absolute frequency of the 1S0(F=1/2) − 1P1(F
′=3/2) tran-
sition in 225Ra is measured against the saturated absorption line #51 in 130Te2.
The radium transition frequency is obtained by
fRa − fTe = nAOM1 · fAOM1 −nAOM2 · fAOM2
2+ ∆fTeRa (6.3)
where ∆fTeRa is the observed frequency difference between the reference tel-

108 Spectroscopy of Radium and Barium in Effusive Atomic Beam
Ti:Sapphire Laser
Frequency C
omb
SHG
Cavity
AO
M1 R
a oven
AO
M2
Lock-in-A
mplifier
Reference signal
Oven
Te cell
Beat
note
Imaging system
&
PM
T
PBS
BS
λ/2
λ/2 Split Photodiode
PD
PD
Dichroic
mirror
Collim
ation lens
Telescope
BS
Dichroic
mirror
Single-mode-Fiber
(~ 100 meter long)
Retro-reflection
mirror
BS
Fig
.6.5:F
orth
em
easurem
ent
ofth
e7s
21S
0 −7s7p
1P1
transition
frequen
cyth
elaser
system
(Section
5.1),th
erad
ium
atomic
beam
(Section
4.2)an
dth
eab
solute
frequen
cym
easurem
ent
(with
the
combin
ationof
the
frequen
cycom
ban
dth
esatu
rated
absorp
tionsp
ectroscopy)
arecom
bin
edto
work
inon
eex
perim
ent.
The
light
atw
avelength
λ1
ispro
duced
by
frequen
cy
dou
blin
gIR
light
fromth
eT
i:Sap
phire
laser.T
he
pow
erof
the
laserb
eamis
split
by
the
acousto
optical
modulator
AO
M1
for
the
saturated
absorp
tionsp
ectroscopy
and
the
radiu
mfluorescen
cesp
ectroscopy.
The
beatn
otetogeth
erw
ithth
esign
alsfrom
the
radiu
mfluorescen
cean
dth
e130T
e2
saturated
absorp
tionsp
ectroscopy
yield
the
transition
frequen
cyin
radiu
m.
Afraction
ofIR
light
isoverlap
ped
ona
photo
dio
de
with
the
light
froman
optical
frequen
cycom
b.
Absolu
tetran
sitionfreq
uen
cyof
reference
130T
e2
line
and
225R
atran
sitionis
measu
redby
measu
ring
the
beatn
oteof
IRlaser
with
frequen
cycom
bligh
t.

6.2 The 7s2 1S0 − 7s7p 1P1 Transition in 225Ra 109
lurium line and the radium line.
[MHz]Te#51
Laser Frequency - f-500 -480 -460 -440 -420 -400 -380 -360 -340 -320
flu
ore
scen
ce [
1/s]
1P1 - 0
S1
132
134
136
138
140
142310×
[MHz]Te#51
Laser Frequency - f-40 -20 0 20 40 60 80
sat
ura
ted
ab
sorp
tio
n [
a.u
.]2
Te
130
0
0.01
0.02
0.03
Fig. 6.6: (Top) Fluorescence from the 1S0(F=1/2)-1P1(F=3/2) transition in225Ra. (Bottom) Saturated absorption line #51 in 130Te2. The frequency of
the transition in radium is 418(1) MHz lower than the reference line #51 (Sec-
tion 5.4) in tellurium. The frequency axis is derived from the absolute frequency
of the line #51 and the beatnote frequency fBN with the frequency comb.

110 Spectroscopy of Radium and Barium in Effusive Atomic Beam
Isotope Transition Frequency Experiment by
[MHz]
225Ra 1SF=1/20 − 1P
F ′=3/21 621042124 (2) This work
226Ra 1S0 − 1P1 621038004 (180) ANL [78]226Ra 1S0 − 1P1 621041362 (1500) Rasmussen [67]
Table 6.1: Wave numbers of the 1S0 − 1P1 transition in radium atom. The mea-
surement in this work yield more than a factor of 100 improvement in uncertainty
of the wave number or frequency of the strongest transition from ground state in
atomic radium.
The radium transition is measured at 418(1) MHz lower in frequency relative
to the reference tellurium line (Fig. 6.6). The measurement yields an absolute fre-
quency for the radium transition to 621042124(2) MHz or 20715.73542(6) cm−1.
This is a factor of 100 improvement in uncertainty over other laser spectroscopic
measurements [78] and three orders of magnitude better than Rasmussen [67].
Hyperfine Structure Interval of the 7s7p1P1 Level
The hyperfine structure of the 7s7p 1P1 level in 225Ra atoms is observed in the
same setup. The hyperfine structure is a sensitive probe of the atomic wave
functions for short distances. It arises due to the interaction of the orbital angular
moment L of electron with the nuclear spin I. The magnetic moment µI, of the
nucleus acquires in a magnetic field Be which is created by the orbital electrons
of an interaction energy of
HHFS = −µI ·Be . (6.4)
The hyperfine structure interval energy is given by [147]
EHFS =1
2CA+
3
4C(C + 1)− J(J + 1)I(I + 1)
2J(2J − 1)I(2I − 1)B , (6.5)
where C = F (F +1)−J(J +1)− I(I+1) and F = |J + I|, |J + I−1|...|J− I| for
nuclear spin I and total angular momentum quantum number J . A and B are
the magnetic dipole interaction and electric quadrupole interaction constants.
Experimental setup (Fig. 6.5) for determining the hyperfine structure split-
ting of the 7s7p1P1 state in 225Ra is same as for the Doppler free fluorescence

6.2 The 7s2 1S0 − 7s7p 1P1 Transition in 225Ra 111
7s 7p 1P1
7s2 1S0 F=1/2
F = 1/2
F = 3/2
HFS
Fig. 6.7: Hyperfine splitting of the 7s7p 1P1 state in 225Ra (I=1/2).
spectroscopy except the order number of the beams taken for radium and tel-
lurium from both AOMs. From AOM1 (rf = 450 MHz) 0th order beam is taken
for 225Ra spectroscopy and +1st order beam is taken for tellurium spectroscopy.
From AOM2 (rf = 60 MHz) +1st order beam is taken for the pump beam of the
tellurium saturation absorption spectroscopy. Frequency difference between the
tellurium saturated absorption line #3 and 6 (see Fig. 5.7) are taken for calibrat-
ing the frequency axis. In order to determine the hyperfine structure interval of
the 7s7p1P1 state in 225Ra atoms frequency of the light at λ1 for driving the 1S0 −1P1 transition is scanned over both the hyperfine states (F=1/2 and F= 3/2) of
the 7s7p1P1 level. Few such scans are averaged to obtain a better signal-to-noise
ratio.
The hyperfine structure interval of the 7s7p1P1 level is determined to 4198(4)
MHz. Our result is in good agreement with the previous measurement at ISOLDE,
CERN [73]. These measurements provide valuable inputs for atomic theory to
calculate wave functions of the low laying states in radium atom.

112 Spectroscopy of Radium and Barium in Effusive Atomic Beam
-4400 -4000 -4200 Frequency Offset [MHz]
28000
27000
26000
1 S0-
1 P1 f
luor
esce
nce
[1/s
]
29000
27000
25000
1 S0-
1 P1 f
luor
esce
nce
[1/s
]
Frequency Offset [MHz] -200 800 200 1200
-4400 -4000 -4200 Frequency Offset [MHz]
Te s
atur
ated
abs
orpt
ion
0
4
8
Frequency Offset [MHz] -200 800 200 1200 Te
sat
urat
ed a
bsor
ptio
n 0
4
8
-4
Fig. 6.8: (Top) Fluorescence signals from 1S0(F=1/2)-1P1 (F= 1/2) transition
(left) and 1S0(F=1/2)-1P1 (F= 3/2) transition (right) in 225Ra. (Bottom) 130Te2
saturated absorption line #3 (left) and 6 (right).
6.3 Intercombination Transition in 225Ra
Presence of the 7s7p 3P1 level enhances the Electric Dipole Moment of radium in3D states (see section 3.4). Precise measurement of the energy of this level is of
crucial importance towards measuring EDMs in radium atom in the 3D states.
The 7s7p 3P1 level has a branching ratio to the 7s6d 3D1 state of 4 · 10−5, and
a single repump laser tuned to the 7s6d 3D1 - 7s7p 1P1 transition is sufficient
to bring the atoms back into the cooling cycle. The advantages of using this
transition are the lower Doppler cooling limit and the simplicity of repumping.
The intercombination transition is ideal for trapping and second stage cooling
but not efficient for capturing atoms from a thermal beam.
We setup a laser system consists of two diode lasers at wavelength λIC to pro-
vide relative and absolute frequency reference for the intercombination transition
in atomic radium. A schematic drawing of the laser system is shown in Fig. 6.9.
First laser is locked to iodine (I2) saturated absorption transition. Second laser is
locked to the first laser by frequency offset locking. A fraction of light from first
laser is mixed with the laser radiation from an optical frequency comb to produce
beatnote. Another two diode lasers with same specifications at wavelength λIC
are employed for spectroscopy of radium atoms.

6.3 Intercombination Transition in 225Ra 113
Diode laser 714 nm
Frequency Comb
Locked to I2 transition
Diode laser 714 nm
AO
M4
Frequency offset lock
To Ra experiment
Fig. 6.9: Schematics of the laser system for providing light at 714 nm.
The 1S0 − 3P1 intercombination transition in atomic radium is investigated by
means of laser induced fluorescence spectroscopy. Absolute transition frequency
of the 1S0(F=1/2) − 1P1(F=3/2) transition is measured with reference to sec-
ondary frequency standard molecular iodine. The iodine transitions are frequency
stabilized to an optical frequency comb which is stabilized to a Rb clock. The
Rb clock provides a relative precision to be better than 10−11.

114 Spectroscopy of Radium and Barium in Effusive Atomic Beam
Oven
127I2 cell
Lock-in-D
etection FI
AOM3
Frequency C
omb
Diode laser 714 nm
AOM4
FI D
iode laser 714 nm
~ 100 m
long fiber
Ra
oven
Imaging system
&
PM
T
Collim
ation lens
PD
Beat
note
PD
Frequency offset lock
rf-switch
Retro-reflection
mirror
Fig
.6.10:
Exp
erimen
talsetu
pfor
Dop
pler
freefluorescen
cesp
ectroscopy
ofth
e1P
1−
3P1
intercom
bin
ationtran
sitionin
radiu
matom
.L
ight
atw
avelength
λIC
ispro
duced
by
adio
de
lasersy
stem.
Satu
ratedab
sorption
spectroscop
yof
molecu
lar
iodin
eis
employed
forprov
idin
gsecon
dary
frequen
cyreferen
ceto
the
radiu
mtran
sition.
Ligh
tfrom
one
ofth
edio
de
lasersis
split
intw
oparts.
One
part
istaken
forio
din
esp
ectroscopy
and
beatn
otew
ithfreq
uen
cycom
b.
Oth
erpart
isoverlap
ped
with
the
light
froma
second
dio
de
laserw
hich
was
locked
toth
efirst
dio
de
laserby
frequen
cyoff
setlo
ck.
Ligh
tfrom
the
second
dio
de
laseris
takenfor
radiu
msp
ectroscopy.
Absolu
tetran
sitionfreq
uen
cyof
the
intercom
bin
ationtran
sitionin
225R
ais
determ
ined
by
measu
ring
the
beatn
oteb
etween
the
light
fromth
efirst
dio
de
laserw
ithth
efreq
uen
cycom
ban
dth
efreq
uen
cy
offset
betw
eentw
odio
de
lasers.

6.3 Intercombination Transition in 225Ra 115
Experimental setup for Doppler free fluorescence spectroscopy of the 1P1 −3P1 intercombination transition in radium atom is shown in Fig. 6.10. Light
at wavelength λIC is produced by a diode laser system. Saturated absorption
spectroscopy of molecular iodine is employed for providing secondary frequency
reference to the radium transition. Light from one of the diode lasers is split in
two parts. One part is taken for iodine spectroscopy and beatnote with frequency
comb. Other part is overlapped with the light from a second diode laser which
was locked to the first diode laser by frequency offset lock. Stabilization and
control of laser frequency for the intercombination transition is performed in two
steps,
• The first diode laser at wavelength λIC (I2-laser) is locked to the R(116) (2-
9) a15 hyperfine component of 127I2. The stability of locking is monitored
by the beat note of this laser with the frequency comb.
• The second diode laser at wavelength λIC (Ra-laser) is locked to the I2-laser
by frequency offset lock [63]. The offset lock takes care of the stability of the
Ra-laser as well as scanning of the Ra-laser light frequency at wavelength
λIC over a suitable range for the experiment.
Light from the second diode laser is taken for radium spectroscopy. Absolute
transition frequency of the intercombination transition in 225Ra is determined
by measuring the beatnote between the light from the first diode laser with the
frequency comb and the frequency offset between between two diode lasers. Scat-
tering rate of this transition is two orders of magnitude smaller compare to the
strongest 1S0 − 1P1 transition. In order to achieve a good signal-to-noise in the
fluorescence signal light at wavelength λIC to the radium experiment is chopped
to 200 ns on and next 600 ns off by AOM4. The timing scheme is chosen based
frf3 [MHz] nAOM3 frf4 [MHz] nAOM4
78.9 +1 200 -1
Table 6.2: Frequencies and order numbers of the laser beams from the two AOMs
employed for the spectroscopy of intercombination transition in 225Ra.
on the lifetime of the 7s7p 3P1 state [79]. The photomultiplier tube is gated to
400 ns off and 400 ns on. This excludes the background count occurring from
scattered light. The synchronized timing scheme for the photomultiplier gate
time and the laser on/off time is shown in Fig. 6.11. Diameter of the laser beam

116 Spectroscopy of Radium and Barium in Effusive Atomic Beam
at λIC at the interaction section is 6(1) mm. The power was 4.2(2) mW. This
correspond to an intensity of 50(2) mW/cm2. At the saturation intensity IλICs
= 136 µW cm−2 scattering rate of this transition is about 2.4·106 s−1. At these
experimental parameters the the radium atoms can be reused for 30 times for
collecting fluorescence at λIC transition.
5 V
0 V
Laser @ 714 nm On
Off
200 µs 600 µs
5 V
0 V
PMT gate @ 714 nm On
Off
400 µs 400 µs
Fig. 6.11: TTL pulses for timing of the Ra-laser on/off (red) and for gate time
of the photo multiplier tube (magenta) employed during the spectroscopy of 7s2
1S0(F=1/2) - 7s7p 3P1(F=3/2) transition in 225Ra. Laser is on for 200 ns and off
for next 600 ns. Photo multiplier count rate is gated for 400 ns on and next 400
ns off.
Absolute frequency of the 1S0 (F=1/2) − 3P1 (F=3/2) transition in 225Ra is
determined by
fRa − fI = ∆fIRa − nAOM3 × frf3 + nAOM4 × frf4 , (6.6)
where, ∆fIRa represents relative frequency difference between the radium tran-
sition and the reference 127I2 line. ∆fIRa is determined to 1005(1) MHz. The
parameters for AOM3 and AOM4 are provided in Table 6.2.
Frequency of the 7s2 1S0 (F=1/2) - 7s7p 3P1 (F=3/2) transition in 225Ra is
determined to 726(1) MHz high in relative to the frequency of the R(116) (2-9)
a15 hyperfine component of 127I2. The measurement yield an absolute frequency
of the 7s2 1S0 (F=1/2) - 7s7p 3P1 (F=3/2) transition to 13999.26932(13) cm−1
or 419687536(4) MHz.

6.3 Intercombination Transition in 225Ra 117
[MHz]a15
Frequency - f620 640 660 680 700 720 740 760
flu
ore
scen
ce [
1/s]
1P3
-
0S1
800
850
900
950
1000
Fig. 6.12: The 7s2 1S0 (F=1/2) - 7s7p 3P1 (F=3/2) transition in 225Ra calibrated
with an optical frequency comb to 419687536(4) MHz. The line through the data
is a gaussian distribution due to residual Doppler shifts in the experiment.
Isotope Transition Frequency Experiment by
[MHz]
225Ra 1SF=1/20 − 3P
F ′=3/21 419687536 (4) This work
225Ra 1SF=1/20 − 3P
F ′=3/21 419687526 (30) ANL [79]
226Ra 1S0 − 3P1 419690854 (1500) Rasmussen [67]
Table 6.3: Wave numbers of the 1S0 − 3P1 transition in radium atom. The mea-
surement in this work yield more than a factor of 10 improvement in uncertainty
of the wave number or frequency of this intercombination transition in atomic
radium.

118 Spectroscopy of Radium and Barium in Effusive Atomic Beam
A list of measured absolute wave number of the 1S0 − 3P1 intercombination
transition in radium atom till date is presented in Table 6.3. Our measurement
improves the uncertainty by a factor of 10 over previous measurement [79].
6.4 Two Photon Transition in Atomic Barium
Laser spectroscopy of the transitions from the metastable D-states in heavy al-
kaline earth elements are indispensable for laser trapping because they provide
significant losses from any laser cooling cycle. These losses are on the order
3·10−3 (see Table 3.3). The strategies to overcome these losses have been inves-
tigated with atomic barium which provide a very similar atomic level scheme as
radium [63,89,148]. The first infrared laser spectroscopy of these transitions from
the D-states were performed in atomic beam spectroscopy [63,134] and then the
results were exploited in trapping of barium in a magneto optical trap [89, 148].
In these experiments a trapping efficiency from an effusive atomic beam of about
1% was achieved [148]. The efficiency was limited by the available laser power.
The strategy of the approach for barium needs to be transferred to radium
trapping. Apart from the scarcity of radium isotopes the challenge in radium is
that the respective transitions have not been observed yet directly. The approxi-
mate transition frequencies are extracted from calculated level energies (Section
3.3). A direct observation by laser driven transition would reduce the uncertainty
on the transition frequencies. Furthermore, the energy gap between the 7s7p 3P1
and 7s6d 3D2 levels of 150 GHz is crucial for the size of the atomic enhancement
of the EDM in these states (see Section 3.4).
Here we discuss a setup which exploits two photon Raman transitions in order
to improve the signal-to-noise of laser induced fluorescence spectroscopy. First
we will discuss the physics of coherent two photon transitions in a three level
system. Then we describe the experimental setup for the three level system 1S0,1P1,
3D2 in atomic barium. The measurements on barium will then be discussed
in term of signal-to-noise compared to laser induced fluorescence from a beam of
metastable atoms which were employed in previous measurements [63,134].

6.4 Two Photon Transition in Atomic Barium 119
Fig. 6.13: Observation of magneto-optical trapping of barium (Top): Low-lying
energy levels of atomic barium relevant for laser cooling. Full lines indicate laser-
driven transitions and dashed lines show spontaneous decay channels. (Bottom):1S0 − 1P1 fluorescence signal, R1 from trapped atoms as a function of detuning,
δtrap of the trapping laser light at wavelength λ1. The black points is the Doppler-
free fluorescence signal arising from the MOT laser beam which is orthogonal to
the atomic beam [148].

120 Spectroscopy of Radium and Barium in Effusive Atomic Beam
Two Photon Transition
A two-photon transition can be observed in a three level system, for example
consisting of a ground state |1〉, an excited state |2〉, and a long lived state |3〉.A system simultaneously excited by two light fields at frequencies, f1 and f2, in
|1>
nsnp 1P1
ns2 1S0
ns(n-1)p 3Dj Ω1, λ1
Ω2, λ2
Ω3
Δ
|2>
|3>
n = 6 (Ba atom) n = 7 (Ra atom)
Fig. 6.14: Atomic level scheme for the observation of two-photon Raman tran-
sition in atomic barium (n = 6) and radium (n = 7). The 1S0,1P1 and 3Dj
(j=1, 2) states forms three level Λ-system. They are referred to as |1 >, |2 >
and |3 >. The interaction with the coherent light fields with the atomic levels
are represented by the Rabi oscillation frequencies Ω1 and Ω2. Ω3 represents the
strength of coupling between the 1S0 and the 3Dj states by means of two-photon
transition. ∆ is the common detuning of the two lasers lights from their central
frequencies at wavelengths λ1 and λ2.
such a way that the frequency difference (f1 - f2) matches the frequency differ-
ence between the ground state |1〉 and the |3〉 state results in a direct coupling
of states |1〉 and |3〉 [149,150]. The coupling is even present when the light fields
f1 and f2 are detuned by a frequency ∆ from the one-photon resonance condition
(Fig. 6.14). The two-photon coupling yields a larger population in the state |3〉

6.4 Two Photon Transition in Atomic Barium 121
than in the case of purely spontaneous decay. The population in |3〉 is removed
from the fluorescence cycle |1〉− |2〉 and results in a reduction of the fluorescence
from this transition. Hence, the fluorescence from the excited state can be effi-
ciently exploited to monitor the coupling of the ground state and the metastable
state.
The Raman coherence process between the ground state and the metastable
state associated with a two-photon transition can lead to narrow linewidth of
the dark resonance signal. Therefore, a two-photon process can be utilized as
a proficient tool to probe the dipole-forbidden transitions in ions, atoms and
molecules [151]. After the first experimental observation of dark resonance [152]
it has been explored in many experiments. Such as high precision frequency
measurements [153], single trapped ions [154, 155], optical lattice clocks [156],
quantum information processing [157] and nuclear clocks [158].
A schematic overview of a three level system in atomic barium and radium is
shown in Fig. 6.14. The population density at ith (or jth) level, is represented by
the density matrix element ρij (for i = j). Sum over all states fulfills∑i=1,2,3
ρii = 1 , (6.7)
where i and j represents the initial and final states of the atom. For a detuning
∆ of both the laser fields from the excited state the coupling strength Ω1 and Ω2
between the ground state and the metastable state represented by Rabi frequency
can be written as
Ω3 =Ω1Ω2
2∆, (6.8)
with the approximation ∆ >> Ω1,Ω2. A more detailed theoretical discussion of
coherent dark resonance in three level Λ-system in atomic barium can be found
in [63].

122 Spectroscopy of Radium and Barium in Effusive Atomic Beam
Fluo
resc
ence
de
tect
ion
syst
em
&
PMT
Dye
lase
r 55
3 nm
Fibe
r las
er
1130
nm
Cho
pper
C
ontro
ller
TTL
to
NIM
co
nver
ter
Dis
crim
i-na
tor
NIM
Lo
gic
NIM
Log
ic
OR
/AN
D
NO
R/
NA
ND
DA
Q
Cou
ntin
g
Ba
Ove
n
λ/2
λ/2
Sync
hron
izat
ion
ou
tput
(TTL
)
in
Fig. 6.15: Experimental setup for the two-photon Raman transition in 138Ba.
Light at wavelengths λ1 and λ2 are overlapped and taken to the atomic beam
for two-photon spectroscopy. Light at wavelength λ2 is chopped by a mechanical
chopper. The reference signal from the chopper controller provides the timing
information for the gated counting of the fluorescence at λ1 from the atomic
beam. This permits counting of the fluorescence of the one photon transition
|1〉 − |2〉 and the Raman transition at the same time. Fractional coupling of
the barium atoms from the ground state to the D state is measured by taking a
difference between these two signals.

6.4 Two Photon Transition in Atomic Barium 123
Two-photon Raman transition is experimentally investigated in beam of the
heavy alkaline earth atom barium. A schematic overview of the experimental
setup is shown in Fig. 6.15. The 6s2 1S0 (|1〉), 6s6p 1P1 (|2〉) and 6s5d 3D2
(|3〉) states in 138Ba are coupled by the two laser fields at wavelengths λ1 and λ2
which are superimposed in copropagating direction. The laser beam direction is
perpendicular to the direction of the atomic beam. Diameter of the superimposed
beam is 3.0(2) mm, which defines the interaction time of 10 µs between the atoms
and the laser beams. The relative polarization of the two laser beams is linear ||linear. The dark resonance is monitored by observing the fluorescence from the
6s2 1S0 - 6s6p 1P1 transition. The fluorescence is collected in a light collection
system and subsequently imaged on a photomultiplier tube similar to the setup
for the radium spectroscopy. The laser beam at wavelength λ2 is chopped with a
chopping frequency of 200 Hz by a mechanical chopper with 50% duty cycle. The
reference output of the chopper controller is utilized to obtain gate signals from
the photomultiplier. The gated signal Sλ1 contains information of one-photon 6s2
1S0 - 6s6p 1P1 transition. The other signal Sλ1λ2 contains the count rate when
the Raman transition is driven by both laser fields. The fractional depletion of
the dark resonance signal Sdark can be written as
Sdark =Sλ1λ2 − Sλ1
Sλ1λ2 + Sλ1
. (6.9)
In Fig. 6.16 (top) green full circles represent the fluorescence signal Sλ1 with
the presence of light at wavelength λ1 only. The dark red open circles represent
the fluorescence signal Sλ1λ2 . Intensity of the light at wavelength λ1 was 10(1)
mW/cm2 and the frequency of this light is scanned over the resonance. Intensity
of the light at wavelength λ2 was 90(6) mW/cm2 and is fixed in frequency. The
coupling between the ground state |1〉 and the metastable state |3〉 due to the
two-photon excitation is strongest for zero detuning∆ which was chosen in this
example. A maximum fractional depletion of the atoms to the metastable state
represented by a dark resonance signal of 35(2) % of the total fluorescence is
observed [Fig. 6.16 (bottom)].

124 Spectroscopy of Radium and Barium in Effusive Atomic Beam
Detuning [MHz]-40 -30 -20 -10 0 10 20 30 40
Co
un
ts [
1/S
]
0
10000
20000
30000
40000
Detuning [MHz]-40 -30 -20 -10 0 10 20 30 40
Fra
ctio
nal
dep
leti
on
0
0.1
0.2
0.3
0.4
(A)
(B)
Fig. 6.16: (Top): 1S0 − 1P1 fluorescence signal as a function of common detuning
∆ of the laser light wavelengths at λ1 and λ2 in 138Ba atom. Green markers
represent one-photon signal for laser light only at wavelength λ1 interacting with
barium atoms. Dark red markers represent two-photon signal for light at both
wavelengths λ1 and λ2 interacting with barium atoms. (Bottom): Fractional
depletion of the barium atoms from the 1S0 ground state to the 3D2 metastable
by means of coherent Raman transition. The process causes a coherent dark
resonance. The scatter in the count rates in A reflects the power fluctuation of
the laser light at wavelength λ1. This fluctuation is reduced in the differential
measurement of the fractional depletion sdark (B).

6.4 Two Photon Transition in Atomic Barium 125
)]1λ(s
[I1P1-0S1Intensity 0 1 2 3 4 5
Fra
ctio
nal
dep
leti
on
0
0.1
0.2
0.3
0.4
)]1λ(s
[I1P1-0S1Intensity 0 1 2 3 4 5
FW
HM
[M
Hz]
0
10
20
30
Fig. 6.17: (Top): Fractional depletion of the barium atoms from the 1S0 ground
state to the 3D2 metastable state as a function of laser light intensity at wave-
length λ1. The depletion is maximum for an intensity which is very close to the
saturation intensity of the transition at wavelength λ1. (Bottom): FWHM of the
coherent dark resonance signal as a function of the intensity of the laser light
at wavelength λ1. FWFM increases due to the power broadening as the light
intensity increases.

126 Spectroscopy of Radium and Barium in Effusive Atomic Beam
)]2λ(s
[I2D3-1P1Intensity 0 20 40 60 80 100 120 140 160 180 200
Fra
ctio
nal
dep
leti
on
0
0.1
0.2
0.3
0.4
)]2λ(s
[I2D3-1P1Intensity 0 20 40 60 80 100 120 140 160 180 200
FW
HM
[M
Hz]
0
5
10
15
Fig. 6.18: (Top): Fractional depletion of the barium atoms from the 1S0 ground
state to the 3D2 metastable state as a function of laser light intensity at wave-
length λ2. The depletion starts to occur at an threshold intensity which is above
20×Is(λ2) and reaches a maximum at an intensity above 100×Is(λ2). (Bottom):
FWHM of the coherent dark resonance signal as a function of the intensity of
the laser light at wavelength λ2. FWFM does not change by a significant factor
with the increase of light intensity at wavelength λ2. This happens because the
fluorescence signal collected at wavelength λ1 is less affected due to the change
of light intensity of light at wavelength λ2.

6.4 Two Photon Transition in Atomic Barium 127
Amplitude of fractional depletion (Sdark) and full width at half maximum
(FWHM) of the dark resonance signal is characterized as a function of both of
the laser light intensities involved in the two-photon process. One set of mea-
surements for different intensities of the light at wavelength λ1 while keeping the
intensity of the light at wavelength λ2 unchanged at 127(8) mW/cm2 (Fig. 6.17)
were recorded. Under this condition a maximum reduction of fluorescence is ob-
served close to the saturation intensity Iλ1s of the transition at wavelength λ1.
Increasing the intensity I(λ1) of the light at wavelength λ1 leads to an expected
increase of the width of the resonance, which is a measurement of the Rabi fre-
quency Ω3. Measurement is performed also for different intensities of the light
at wavelength λ2 (Fig. 6.18) while keeping the intensity of the light at wave-
length λ1 unchanged at 10(1) mW/cm2. Sdark reaches maximum at an intensity
∼100×Is(λ2). No significant change in the FWHM is observed for the change of
intensity I(λ2) of the light at wavelength λ2.
Signal-to-noise of the dark resonance can be written as
S
N=
Sdark × FWHM × γp(λ1)√FWHM × γp(λ1) +
(I(λ1)
Iλ1s
)× Sb
, (6.10)
where γp(λ1) is the scattering rate of the transition at wavelength λ1. Best signal-
to-noise is observed near the saturation intensity of the transition at wavelength
λ1 (Fig. 6.19).
Sensitivity of two-photon process for probing 7s6d 3D2 state in Radium
Precise determination of the energy and lifetime of the 7s6d 3D2 state in atomic
radium is indispensable for efficient laser cooling of radium atoms. The knowledge
also plays a crucial role for electric dipole moment measurements in radium atom
[77,82].
Detection of the metastable 7s6d 3D2 state can be performed by two subse-
quent one-photon transitions. The detection scheme then consists of two steps
(i) Production of metastable atoms by exciting the atoms from the ground
state to the 7s7p 1P1 state. With the assumption that all the atoms in
the excited state decay to the metastable state, about 20 % of the atoms
populate the 7s6d 3D2 state.
(ii) Exciting the metastable atoms from the 7s6d 3D2 state to the 7s7p 1P1
state. This excitation is followed by a photon burst from the 7s7p 1P1 state

128 Spectroscopy of Radium and Barium in Effusive Atomic Beam
while the atoms decay to the ground state.
For this sequential detection the number of photons/atom in the signal are
S2×one−photon = Br ×Nphoton , (6.11)
where, Br represents the fraction of atoms which populates the metastable state
and Nphoton is the number of photon emitted per atom. For the 7s6d 3D2 state in
atomic radium the number of photons per atom in the sequential detection signal
is 0.2 under the above assumptions.
) ]1λ(s
[ I1P1 - 0S1Intensity 0 1 2 3 4 5
Sig
nal
-to
-No
ise
0
10
20
30
40
50
60
70
80
Fig. 6.19: Signal-to-noise of the coherent dark resonance for the three level system
1S0,1P1,
3D2 in 138Ba atom as a function of intensity of light at wavelength
λ1. Intensity of the light at wavelength λ2 is 145(3)×Is(λ2). Best signal-to-noise
is observed for an intensity of the light at wavelength λ1 which is close to the
saturation intensity of the transition at wavelength λ1.
Another detection scheme for the metastable 7s6d 3D2 state is performing
two-photon excitation. The number of dark photons per atom for this detection
scheme can be written as
Stwo−photon = γp ×∆t× Sdark , (6.12)

6.5 conclusion 129
where, γp represents the scattering rate of the atoms from the 7s7p 1P1 excited
state and ∆t represents the time atoms spend in the superimposed laser beams
for two photon excitation. At the saturation intensity of the 7s2 1S0 - 7s7p 1P1
transition in radium γp is 3×10⁷ s−1. For a ∆t of 10 µs and Sdark of 35 % the
number of uncounted photons per atom in the signal is Stwo−photon = 105. The
number of uncounted photons in the two-photon signal is more than a factor of
500 more compare to the number of photons in the sequential detection of the
7s6d 3D2 state by two one-photon spectroscopy.
6.5 conclusion
In this chapter we presented the results obtained with the effusive atomic beam of225Ra (Chapter 4) and the laser system and calibration (Chapter 5) on the laser
spectroscopy of atomic radium. We obtained values for the transitions from the
ground state (7s2 1S0 - 7s7p 1P1, 7s2 1S0 - 7s7p 3P1) with an accuracy sufficient
for laser cooling and manipulation of trapped radium atoms. Furthermore, we
demonstrated a spectroscopy technique for the sensitive detection of weak tran-
sitions by employing Raman resonances. This technique is well suited for optical
detection of the weak repump transitions from metastable D-states in radium.
With this we have a complete set of building blocks to implement efficient laser
cooling and trapping method for radium, which have been demonstrated with
barium [148].


Chapter 7
Prospects for a Measurement of
a Permanent Electric Dipole
Moment in Radium Atoms
This thesis was written in the framework of the TRIµP group at KVI. The main
interest of the group is in studies of fundamental interactions and symmetries.
The search for permanent electric dipole moments, which violate parity (P) and
charge conjugation (C) simultaneously has a strong leverage on model building
beyond the Standard Model. Such searches, which exploit low energy precision
measurements of properties of elementary particles, are complementary to the
direct searches for new particles like the recent discovery of a new boson in the
experiments ATLAS and CMS at LHC, CERN [7, 8]. Limits on EDMs of fun-
damental particles are providing the length scale of substructure of fundamental
particles which is not accessible by direct searches.
Searches for permanent Electric Dipole Moments are conducted on many dif-
ferent objects, from elementary particles (µ, τ) to neutron, proton and deuteron
and even complex systems like atoms and molecules. The systems are described
to a very high degree by the known interactions. We have categorized the different
experimental approaches in terms of their statistical sensitivity and sensitivity to
new physics, which can be orders of magnitude larger due to intrinsic enhance-
ment factors of the chosen systems. A measurement of a non-zero EDM in a
single system does not provide a unique identification of the underlying process
which generates the EDM. This is a consequence of the complex structure of the
systems studied and the particular enhancement factors. Improvement of the
sensitivity for some of the ongoing experiments, e.g. the neutron EDM, is only
131

132 Prospects for Measurement of EDM in Radium Atoms
possible by a larger total number of particles which is the product of the avail-
able rate and measurement time. Currently several collaborations worldwide are
active in this field [53].
The sensitivity to fundamental physics can be increased by improving existing
experimental strategies or by developing new experimental approaches. We fol-
lowed the latter one. Here we were guided by selecting a system in which a large
natural enhancement of EDMs is present. Apart from the enhancement which
is proportional to the third power of the nuclear charge, some systems provide
additional large factors due to molecular, atomic and nuclear structure. A careful
analysis of the requirements for an EDM measurement in such a system is re-
quired and the experimental techniques need to be developed. Special care has to
be taken in order to extract the small effect from the dominating atomic physics
properties contributions. In addition, the availability of the respective atoms or
molecules of interest can provide an additional challange for the development of
a new EDM experiment.
Another major step towards new and sensitive EDM experiments is the explo-
ration of new experimental strategies. We followed the strategy to employ ultra-
cold atoms in a neutral atom trap which becomes attracive due to the advances
in laser cooling and trapping methods in the two decades. A demonstration of
the outmost sensitivity and control over external perturbation are neutral atom
optical clocks in optical latices [146,159,160]. A first proposal for an EDM search
with trapped atoms was presented for Yb [161]. The main advantages are possible
long coherence times, very small volumes over which magnetic and electric fields
have to be controlled and low velocities. Furthermore, there are experimental
approaches for the electron EDM with Cs or Rb in optical lattices [162].
The described boundary conditions were the basic guidlines for this work. The
identification of the promising candidate system with direct consequences for the
availability of the material. Further, the implementation of the experimental
strategies have to be developed. The main part of the thesis discusses these
aspects in detail for EDM searches in atomic radium. It builds on work in the
TRIµP group [63,89,134,148] and at Argonne National Lab [78–80].
Radium was selected because of its large enhancement factors for intrinsic
EDMs, which are originating from the nuclear and atomic properties (Chapter
3). One additional aspect is that some states are sensitive to nuclear induced
EDMs and others are sensitive to the electron EDM. The enhancement of the
electron EDM in the 7s6d 3D1 is almost four orders of magnitude while the nuclear
induced EDM is enhanced in the 7s6d 3D2 state by a factor of 105 over 199Hg

133
EDM. In addition some octupole deformed radium nuclei lead to enhancements
by a factor of 102 - 103 over 199Hg EDM. The currently ongoing measurement
campain on collectivity in these isotopes which can be related to the octupole
induced enhancement factors at the ISOLDE facility at CERN in an attempt
to lower the uncertainty of the nuclear enhancement [87]. The experiment was
triggered by the interest in EDM searches.
The scarcity of radium isotopes with nuclear spin I> 0 will only allow sensitive
experiments with confined atoms and long coherence times. The implementation
of this experimental strategy to radium requires laser cooling of this heavy alkaline
earth atom. The atomic structure of radium requires a complex approach to laser
cooling because of the unavailability of a strong closed transition. Effcient laser
cooling This was approached by the group at ANL with laser cooling on the weak
intercombination line which leads to an inherent low trapping efficiency of 10−6
[80]. A way out of this is several additional lasers in the cooling process to avoid
losses from the cooling cycle. Our group has demonstrated this successfully with
the chemical homologue barium. In this case a significant increase in trapping
efficiency of four orders of magnitude can be achieved [148]. The transfer of
this cooling scheme in coupled to driving weak transitions which have not yet
spectroscopically observed. The strategy for observing these weak transitions
was developed in this thesis.
We discuss a setup for a sensitive measurement of weak metastable states,
which was demonstrated with transitions in the chemical homologue barium
(Chapter 5). The transitions from the metastable D states in atomic radium
are essential repump transitions for effcient slowing of the atomic beam of ra-
dium. Furthermore, the energy gap between the 3D2 and 3P1 state determines
the enhancement factor for the nuclear EDM. We have demonstrated a sensitive
detection scheme for weak transition originating from metastable D-states with138Ba. The scheme comprises of twophoton Raman spectroscopy. An increase of
more than two orders of magnitude in signal-to-noise compare to laser induced
fluorescence spectroscopy has been achieved. This opens the path to observe
weak transitions for scarce atomic species.
Source of Radium Iosotopes
A significant part of the work was devoted to sources of a set of radium isotopes
and the subsequent conversion into an intense atomic beam (Chapter 4). Ra-
dium is available from online production at radioactive beam facilities. We have

134 Prospects for Measurement of EDM in Radium Atoms
executed experiments with beams at the TRIµP facility. Here, isotopes with live-
times of a few seconds to minutes (211−214Ra) are produced in fusion-evaporation
reactions in inverse kinematics [94,97]. The production reaction is highly isotope
specific and pure beams of radium can be produced. The available rates are 650
s−1 per particle nA [94] of lead beam with a maximum 2 µA Pb. The produced
isotopes are also exploited. The results are for laser spectroscopy of trapped Ra+
which aims at a measurement of atomic parity violation [95,163,164].
Some isotopes of radium near the valley of stability are available from radioac-
tive sources. These are in particular 225Ra from an alpha decay of 229Th and 223Ra
from 227Ac. We are interested in 225Ra because of the nulcear spin I=1/2. One
possibility is radiochemical extraction of radium from a thorium source, which is
done at Oak Ridge National Laboratory for the radium experiment at Argonne
National Laboratory [90]. The chemically extracted radium is then transfered to
an oven crucible which is then place in a vacum system. The crucible is refilled
after the radium has decayed or heated out of the oven.
Radium Atomic Beams
We have investigated various possibilities to build an atomic beam of radium and
characterized two types of atomic beam of radium.
The first type is from a 229Th source. This is a beam of 225Ra atoms. This
beam allows to perform spectroscopic measurement for 1000 s in each half-life of225Ra isotope. The second type of atomic beam characterized in this work is by
converting ions to atoms at metal surface. Therefore the concept of the ion-to-
atom converter is not isotope specific. It can be used for alkaline and alkaline
earth elements at facilities where ion beams are available.
The Lasers for Spectroscopy of Radium
The laser and atomic physics system has been designed and setup at KVI.
We exploited the offline atomic beam of 225Ra for Doppler-free laser induced
spectroscopy of transition from the ground state where we achieved several re-
sults. We investigated the strong 7s2 1S0 - 7s7p 1P1 transition which is the main
transition for effcient slowing of atoms and capture range of a magneto optical
trap. We have measured the absolute frequency of this transition with an optical
frequency comb and relative against saturated absorption spectroscopy of 130Te2.
The measurements yield the absolute frequency of the 7s2 1S0 - 7s7p 1P1 transi-
tion in atomic radium with an uncertainty of 5 MHz, which is more than factor

135
of 30 better compare to previous measurements for same transition in 226Ra. The
hyperfine structure interval of the 7s7p 1P1 in 225Ra is in good agreement with
an earlier measurement with a similar uncertainty. Furthermore, the weak in-
tercombinations line 7s2 1S0 - 7s7p 3P1 was is the most suitable transition for
trapping radium atoms from a slow beam and keeping the trapped atoms in the
cooling cycle for a longer time. The measurement yielded an absolute frequency
of the 7s2 1S0 - 7s7p 3P1 transition with an uncertainty < 5 MHz, which is factor
of 6 improvement over previous measurement. The absolute frequencies and the
reference lines in molecular tellurium and iodine are fundamental in a reliable
and stable laser cooling and trapping setup for the radium atom.
The developed tools for intense radium atomic beams and the atomic physics
tools together with the laser spectroscopy of radium are major ingreedients in
a sensitive search for permanent electric dipole moments in radium isotopes.
Intense radium sources are available a existing, i.e. ISOLDE [165], and future,
i.e. ISOL@Myrrha [166], radioactive beam facilities which gives access not only
to the long lived radium isotopes around 225Ra, but also to the short lived 213Ra.


Chapter 8
Summary
Discoveries in experimental endeavors and theories till date have provided ever
deeper insights into the structure and behavior of the most fundamental building
blocks of nature. The Standard Model (SM) summarizes the present understand-
ing of particle physics in one coherent physical theory. This includes even the
recent results from experiments at the Large Hadron Collider (LHC), CERN at
Geneva, Switzerland. However, the SM does not provide answers to many yet
open questions. For example, the origin of parity violation, the number of fun-
damental fermion generations and the dominance of matter over antimatter in
the universe are not yet explained. The search for answers to such questions pro-
vides the driving force to performing precision experiments with highest possible
sensitivity at low energies.
The SM knows the three discrete symmetries, charge conjugation (C), parity
(P) and time reversal (T). The violations of these symmetries in some interactions
produce major constrains for the underlying theory. The CP violation can be
studied by searching for permanent Electric Dipole Moments (EDMs) in atomic
physics experiments. Currently several experiments worldwide are underway in
this field. Providing stringent experimental upper bound on an atomic EDM, e.g.
the EDM of 199Hg is |d(199Hg)| < 3.1× 10⁻²⁹ e cm.
Radium provides the largest enhancement factors for intrinsic EDMs of any
atomic system. They arise from the particular nuclear and atomic properties.
One additional aspect is that some states are sensitive to nuclear induced EDMs
and others are sensitive to the electron EDM. The enhancement of the electron
EDM in the 7s6d 3D1 is almost four orders of magnitude while the nuclear induced
EDM is enhanced in the 7s6d 3D2 state by a factor of 105 over 199Hg EDM. In
addition some octupole deformed radium nuclei lead to enhancements by a factor
137

138 Summary
of 102 - 103 over 199Hg EDM. We have identified the most sensitive system, radium
for our experiment. This thesis analyses possible EDM searches in radium and
provides steps towards a measurement.
The scarcity of radium isotopes with nuclear spin I> 0 will only allow sensitive
experiments with confined atoms and long coherence times. The implementation
of this experimental strategy to radium requires laser cooling of this heavy alkaline
earth atom. The atomic structure of radium requires a complex approach to laser
cooling because of the unavailability of a strong closed transition. Our group
has demonstrated this successfully with the chemical homologue barium. The
transfer of this cooling scheme in radium is coupled to driving weak transitions
which have not yet spectroscopically observed. The strategy for observing these
week transitions was developed in this thesis.
We have investigated possibilities to create an atomic beam of radioactive
radium isotopes and characterized two types of effusive thermal beams. One
option is to collect radium from a radioactive source of thorium (229Th) inside of
the heated crucible of an oven. We successfully created the first thermal beam
of atomic radium atoms with a flux of 106 atoms/(s cm2) which enabled laser
spectroscopic studies of the atomic structure of radium. Short lived isotopes of
radium require a different approach since they are only available as ion beams
at radioactive beam facilities. We have observed the neutralization of radium
ions on a metallic surface (e.g. zirconium) and the subsequent release of neutral
radium when the metal is heated. The release at temperature above 1300 K
is first compared to the lifetime of the isotopes of interest and an ion-to-atom
converter is designed which can be employed at radioactive beam facilities to
create intense atomic beams.
We exploited the offline atomic beam of 225Ra for Doppler-free laser induced
spectroscopy of transition from the ground state where we achieved several re-
sults. We investigated the strong 7s2 1S0 - 7s7p 1P1 transition which is the main
transition for effcient slowing of atoms and capture range of a magneto optical
trap. We have determined the absolute frequency of this transition with an opti-
cal frequency comb and relative against molecular reference transitions in 130Te2.
The absolute frequency accuracy of the 7s2 1S0 - 7s7p 1P1 transition is improved
by more than factor of 30 better compare to previous measurements and is now
known with an uncertainty which is smaller than the natural linewidth of the
transition. The hyperfine structure interval of the 7s7p 1P1 in 225Ra is in good
agreement with an earlier measurement with a similar accuracy. Furthermore, the
weak intercombinations line 7s2 1S0 - 7s7p 3P1 is the most suitable transition for

139
(a) 7s 7p 1P1
7s2 1S0
7s 7p
3P2
3P1 3P0
λ1
λIC (c)
(b)
Fig. 8.1: (a) Energy level structure of atomic radium. Fluorescence signals from
the (b) 1S0 − 1P1 transition at wavelength λ1 and the (c) 1S0 − 3P1 transition
at wavelength λIC , which permits the determination of the absolute transition
frequencies.
trapping radium atoms from a slow beam and keeping the trapped atoms in the
cooling cycle for a longer time. The measurement yielded an absolute frequency
of the 7s2 1S0 - 7s7p 3P1 transition with an accuracy better than the linewidth
of the transition, which is factor of 6 improvement over previous measurement.
The absolute frequencies and the reference lines in molecular tellurium and iodine
are fundamental in a reliable and stable laser cooling and trapping setup for the
radium atom.
The developed tools for intense radium atomic beams and the atomic physics
tools together with the laser spectroscopy of radium are major ingredients in a
sensitive search for permanent Electric Dipole Moments in radium isotopes.


Chapter 9
Samenvatting
Ontdekkingen in experimentele en theoretische natuurkunde hebben steeds dieper
inzicht verschaft in de structuur en het gedrag van de meest fundamentele bouw-
stenen van de natuur. Het Standaard Model beschrijft ons huidige begrip van de
elementaire deeltjesfysica in een coherente theorie, inclusief de recente resultaten
van experimenten bij de Large Hadron Collider op CERN in het Zwitserse Gen-
eve. Het Standaard Model heeft echter nog een aantal open vragen. Zo worden
pariteitsschending, het aantal fundamentele fermion generaties en de overheersing
van materie over antimaterie in het heelal niet verklaard. Het beantwoorden van
zulke vragen is de drijvende kracht voor het uitvoeren van precisie-experimenten
bij lage energie.
De drie discrete symmetrieen ladingconjugatie (C), pariteit (P) en tijdsomkeer
(T) zijn onderdeel van het Standaard Model. Het behoud en de schending van
deze symmetrieen leggen een enorme beperking op aan de theorie. De schending
van CP kan bestudeerd worden door naar permanente electrische dipoolmomenten
(EDMs) te zoeken in experimenten met atomen. Momenteel zijn er wereldwijd
een aantal experimenten onderweg op dit gebied. Deze zetten stringente boven-
grenzen aan atomaire EDMs, zoals bijvoorbeeld |d(199Hg)| < 3.1× 10⁻²⁹ e cm.
Radium biedt door z’n atomaire structuur de grootste versterkingsfactoren
voor intrinsieke EDMs. Sommige toestanden zijn gevoelig voor het EDM van de
kern, terwijl anderen gevoelig zijn voor het elektron EDM. De versterking van
het elektron EDM in de 7s6d 3D1 toestand is bijna vier ordes van grootte, terwijl
de invloed van de kern EDM in de 7s6d 3D2 toestand versterkt is met een factor
105 ten opzichte van die van 199Hg. Voor octupool-gedeformeerde kernen wordt
de kern EDM zelfs nog verder versterkt met 102 - 103. In dit proefschrift worden
de mogelijkheden voor een zoektocht naar een EDM in radium geanalyseerd en
141

142 Samenvatting
worden een aantal stappen gezet.
De zeldzaamheid van radiumisotopen met kernspin I>0 maakt het alleen mo-
gelijke om gevoelige experimenten te doen met ingevangen atomen en met lange
coherentietijden. De implementatie van een experimentele strategie voor radium
vereist laserkoeling van dit zware aard-alkali atoom. De atomaire structuur van
radium, waarin een sterke gesloten overgang afwezig is, compliceert laserkoeling.
Onze groep heeft laserkoeling van het chemisch homologe barium gedemonstreerd.
Het ontwikkelde koel-schema voor radium bevat zwakke atomaire overgangen die
nog niet spectroscopisch waargenomen zijn. In dit proefschrift is de ontwikkeling
van een strategie voor het waarnemen van deze zwakke overgangen beschreven.
We hebben onderzocht welke mogelijkheden er zijn voor het maken van een
atomaire bundel van radioactieve radiumisotopen en hebben twee soorten ther-
mische bundels gekarakteriseerd. Een mogelijkheid is het verzamelen van radium
uit een thoriumbron (229Th) in een oven. We zijn er in geslaagd om de eerste
thermische bundel van atomair radium te maken met een flux van 106 atomen/(s
cm2). Dit maakt het mogelijk om laser-spectroscopisch onderzoek te doen naar de
atoomstructuur van radium. Kortlevende radiumisotopen vergen een andere be-
nadering want zij zijn alleen beschikbaar als ionenbundels bij radioactieve bundel
faciliteiten. We hebben de neutralizatie van radiumionen waargenomen op met-
allische opervlakken (bijv. zirconium) en de daaropvolgende emissie als atoom als
het metaal verwarmd word. De emissiesnelheid bij temperaturen boven 1300 K
is vergelijkbaar met de levensduur van de gewenste isotopen. Op basis hier-van is
een ion-naar-atoom omzetter ontwikkeld die gebruikt kan worden bij radioactieve
bundel faciliteiten om intense atoombundels te maken.
We hebben de offline atomaire bundel van 225Ra gebruikt om Doppler-vrije
laser spectroscopie te doen aan de overgang vanuit de atomaire grondtoestand.
We hebben de sterke 7s2 1S0 - 7s7p 1P1 overgang bestudeerd. Deze overgang is
de basis voor het efficient afremmen van atomen en het invangen in een magneto-
optische val. We hebben de absolute frequentie van deze overgang bepaald ten
opzichte van een optische frequentie-kam en relatief ten opzichte van moleculaire
referentielijnen in 130Te2. De absolute nauwkeurigheid in de frequentie van deze
overgang is met meer dan een factor 30 verbeterd ten opzichte van eerdere metin-
gen en is nu bekend met een precisie beter dan de natuurlijke lijnbreedte. De
gemeten hyperfijn-structuur van de 7s7p 1P1 toestand in 225Ra komt goed overeen
met eerdere metingen met een vergelijkbare precisie. De zwakke overgang 7s2 1S0
- 7s7p 3P1 is het meest geschikt voor het invangen van langzame radium atomen
en om ze vervolgens langere tijd in de koelcyclus te houden. De meting van

143
(a) 7s 7p 1P1
7s2 1S0
7s 7p
3P2
3P1 3P0
λ1
λIC (c)
(b)
Fig. 9.1: (a) Energieniveaus van het radiumatoom. Waargenomen fluorescen-
tiesignalen van de overgang (b) 1S0 - 1P1 bij golflengte λ1 en (c) 1S0 - 3P1 bij
golflengte λIC . Deze resultaten maken het mogelijk om de absolute frequenties
van de overgangen te bepalen.
de absolute frequentie van deze overgang heeft een precisie die beter is dan de
lijnbreedte en is zes keer beter dan eerdere metingen. De absolute frequenties
en de referentielijnen in moleculair tellurium en iodium zijn de basis voor een
betrouwbare en stabiele opstelling voor het laserkoelen en invangen van radium
atomen.
De ontwikkelde mogelijkheden voor het maken van intense bundels van atom-
air radium en de bijbehoren apparatuur, samen met de laser spectroscopie van
radium zijn de hoofdingredienten van een gevoelige zoektocht naar permanente
electric dipoolmomenten in radium isotopen.


Appendix A
Experimental Setup for Laser
Cooling and Trapping of 225Ra
Efficient laser cooling and trapping of radium requires an extended cooling cycle
consists of at least five levels which are 7s2 1S0, 7s7p 1P1, 7s7p 3P1, 7s7p 1P1,
7s6d 3D2 and 7s6d 3D1. The complexity in cooling cycle arises because of leakage
from the strongest optical transition to transitions connecting metastable states.
In this appendix we describe an experimental setup for slowing radium atoms
from a thermal atomic beam and a magneto optical trap (MOT) for capturing
slowed radium atoms with high efficiency.
229Th source
ion pump
ion pump
gate valve
Fig. A.1: Vacuum chamber for laser cooling and trapping of 225Ra.
145

146 Experimental Setup for Laser Cooling and Trapping of 225Ra
DL-
R1
(λIC
)
DL-
R2
(λIC
) FI
FI
FOL2
(f
offs
et-1
)
DL-
IR1
(λIR
1)
AOM-4
SHG
cav
ity
(λ1)
AOM-1
110
mW
from
Ti:S
a
Ligh
t sta
biliz
ed to
R
116(
2-9)
a15
hy
perf
ine
com
pone
nt o
f 127 I
2
FI
Bea
m sp
litte
r
Mirr
or
Dic
hroi
c m
irror
λ/4
plat
e
Fara
day
isol
ator
Phot
o di
ode
Bea
m b
road
ener
Mag
netic
coi
l
Tele
scop
e
λ/2
plat
e
Phot
omul
tiplie
r tu
be
Lens
Ligh
t sta
biliz
ed to
sa
tura
ted
abso
rptio
n
peak
of 13
0 Te 2
Slow
ing
beam
A
tom
ic b
eam
FOL1
(f
offs
et-2
)
Verti
cal M
OT
beam
Pola
rizin
g
Bea
m sp
litte
r
FOL#
(f
offs
et-#
) Fr
eque
ncy
of
fset
lock
Pow
er
norm
aliz
atio
n
-1 0
-2 0
Ove
n
Fig. A.2: Optical layout of the experimental setup for laser cooling and trapping
of 225Ra.

147
The vacuum chamber for this experiment consists of a resistively heated ef-
fusive beam of 225Ra atoms, an optical port for transverse laser cooling of the
radium atomic beam and a chamber with sufficient optical access for the laser
beams for slowing and magneto optical trapping (Fig. A.1). The detailed de-
scription of the 225Ra atomic beam source is presented in Section 4.2. When the
oven is operating, the pressure inside the vacuum chamber is maintained to 10−8
mbar by two ion pumps attached to the chamber.
Laser light at four wavelengths, λ1, λIC , λIR1 and λIR2 (not shown in Fig. A.2)
are employed in the setup. The generation of light at wavelength λ1 by frequency
doubling the output of a Ti:Sapphire laser (Section 5.1). The light at the other
wavelengths is obtained from home build diode lasers (Section 5.2). The light at
wavelength λ1 is used for obtaining the strongest slowing forces to the radium
atomic beam as well as detection of laser cooled atoms. Light at wavelengths
λIR1 and λIR2 are overlapped with the slowing laser beam in order to provide re-
pumping of atoms from metastable states. High signal-to-noise can be obtained
by modulating the light intensity at wavelength λ1 by an acousto optical modula-
tor AOM1. Frequency offset locking is employed to provide suitable detuning for
the trapping laser beam at wavelength λIC . A set of six λ/4 plates which works
for both wavelengths λ1 and λIC permit the control of the polarization of the
six trapping laser beams in three orthogonal directions. A pair of magnetic coils
electrically connected in anti-Helmholtz configuration provides the quadrupole
magnetic field for holding the captured radium atoms in the MOT.


Appendix B
Data Acquisition System
The data acquisition system (DAQ) is utilized to control the components involved
in the experiment and to acquire the data from the experiment. In order to
provide an integrated data acquisition system a Control and Distributed Data-
acquisition Integrated Environment (CADDIE) was developed at KVI.
The data stream from the experiment consists of analog, digital and wavelength-
meter data. Analog and digital data are recorded using scalar module by a CAD-
DIE installed in VME computer. Analog voltages are converted to frequencies
by using voltage to frequency converter (VFC) before sending to scalar module.
Data from each wavelength meter (WLM) is recorded by a CADDIE installed
in the same computer for controlling the WLM. The data streams from different
CADDIEs are combined by a master system called CatchCADDIE, which takes
care of the storage and make the data available for online analysis.
In order to make the CADDIE data events available for online and offline
analysis a programme, Bogey is developed. Bogey is an object oriented software
based on analysis framework ROOT, which is a C++ based framework for large
scale data analysis. Bogey interpret the CADDIE data format and makes it
available in the form of ROOT classes.
149

150 Data Acquisition System
Fig. B.1: Principle of the data acquisition system in the Ra EDM experiment.

Appendix C
Photomultiplier Tubes
This appendix give the data-sheets for the photomultiplier tubes (PMT) which
were used throughout this thesis. In order to collect fluorescence at wavelengths
λ1 and λIC the R7449 PMT and the R6060-12 PMT was employed. Both the
PMTs were bought from Hamamatsu photonics, Japan.
C.1 Hamamatsu PMT R7449
151

152 Photomultiplier Tubes

C.2 Hamamatsu PMT R6060-12 153
C.2 Hamamatsu PMT R6060-12

154 Photomultiplier Tubes

Appendix D
Bandpass Filters
This appendix provides the transmission of light as function of wavelength for the
bandpass filters used in the laser spectroscopy in the frame work of this thesis.
The filters we employed are from Thorlabs GmbH, Munich, Germany.
155

156 Bandpass Filters

Bibliography
[1] W. C. Griffith, M. D. Swallows, T. H. Loftus, M. V. Romalis, B. R. Heckel,
and E. N. Fortson. Improved limit on the permanent electric dipole moment
of 199Hg. Phys. Rev. Lett., 102(10):101601, 2009.
[2] Sheldon L. Glashow. Partial-symmetries of weak interactions. Nuclear
Physics, 22(4):579, 1961.
[3] Steven Weinberg. A model of leptons. Phys. Rev. Lett., 19(21):1264, 1967.
[4] Abdus Salam. Gauge unification of fundamental forces. Rev. Mod. Phys.,
52(3):525, 1980.
[5] G. ’t Hooft and M. Veltman. Regularization and renormalization of gauge
fields. Nuclear Physics B, 44(1):189, 1972.
[6] Sheldon L. Glashow. Towards a unified theory - threads in a tapestry. Nobel
lecture, 1979.
[7] CMS Collaboration. Observation of a new boson at a mass of 125 gev.
Phys. Lett. B, 716(1):30, 2012.
[8] ATLAS Collaboration. Observation of a new particle in the search for the
standard model higgs boson with the atlas detector at the lhc. Phys. Lett.
B, 716(1):1, 2012.
[9] Fermi National Accelerator Laboratory. Batavia, IL, USA.
[10] LEP Collaboration. Search for the Standard Model Higgs boson at LEP.
Phys. Lett. B, 565(0):61, 2003.
[11] J.A. Casas, J.R. Espinosa, and M. Quiros. Standard Model stability bounds
for new physics within LHC reach. Phys. Lett. B, 382(4):374, 1996.
157

158 Bibliography
[12] Muon (g–2) Collaboration, G. W. Bennett, B. Bousquet, H. N. Brown,
G. Bunce, R. M. Carey, P. Cushman, G. T. Danby, P. T. Debevec, M. Deile,
H. Deng, S. K. Dhawan, V. P. Druzhinin, L. Duong, F. J. M. Farley, G. V.
Fedotovich, F. E. Gray, D. Grigoriev, M. Grosse-Perdekamp, A. Gross-
mann, M. F. Hare, D. W. Hertzog, X. Huang, V. W. Hughes, M. Iwasaki,
K. Jungmann, D. Kawall, B. I. Khazin, F. Krienen, I. Kronkvist, A. Lam,
R. Larsen, Y. Y. Lee, I. Logashenko, R. McNabb, W. Meng, J. P. Miller,
W. M. Morse, D. Nikas, C. J. G. Onderwater, Y. Orlov, C. S. nzben, J. M.
Paley, Q. Peng, C. C. Polly, J. Pretz, R. Prigl, G. zu Putlitz, T. Qian, S. I.
Redin, O. Rind, B. L. Roberts, N. Ryskulov, Y. K. Semertzidis, P. Shagin,
Yu. M. Shatunov, E. P. Sichtermann, E. Solodov, M. Sossong, L. R. Su-
lak, A. Trofimov, P. von Walter, and A. Yamamoto. Measurement of the
negative muon anomalous magnetic moment to 0.7ppm. Phys. Rev. Lett.,
92(16):161802, 2004.
[13] Hans-Kristian Walter and Klaus Jungmann. Rare decays: Experiments. Z.
Phys. C, 56(0):S135, 1992.
[14] Aaron E. Leanhardt. Precision measurement: A search for electrons that
do the twist. Nature, 473(7348):459, 2011.
[15] Klaus Jungmann. Good fortune from a broken mirror. Physics, 2:68, 2009.
[16] T. D. Lee and C. N. Yang. Parity nonconservation and a two-component
theory of the neutrino. Phys. Rev., 105(5):1671, 1957.
[17] C. S. Wu, E. Ambler, R. W. Hayward, D. D. Hoppes, and R. P. Hud-
son. Experimental test of parity conservation in beta decay. Phys. Rev.,
105(4):1413, 1957.
[18] J. H. Christenson, J. W. Cronin, V. L. Fitch, and R. Turlay. Evidence for
the 2 π decay of the K02 meson. Phys. Rev. Lett., 13(4):138, 1964.
[19] W Korsch. The hunt for permanent electric dipole moments. J. Phys.:
Conference Series, 337(1), 2012.
[20] E. Noether. Invariante variationsprobleme. Nachr. v. d. Ges. d. Wiss. zu
Gottingen, page 235, 1918.
[21] A. D. Sakharov. CP Symmetry Violation, C-Asymmetry and Baryonic
Asymmetry of the Universe. Pisma Zh. Eksp. Theor. Fiz., 5:32, 1967.

Bibliography 159
[22] K. Jungmann. Fundamental symmetries and interactions –some aspects.
Eur. Phys. J. A, 25:677, 2005.
[23] Norval Fortson, Patrick Sandars, and Stephen Barr. The search for a per-
manent electric dipole moment. Physics Today, 56(6):33, 2003.
[24] Maxim Pospelov and Adam Ritz. Electric dipole moments as probes of new
physics. A. Phys., 318(1):119, 2005.
[25] Klaus Jungmann. Fundamental interactions. Hyperfine Interactions, 172:5,
2006.
[26] N. F. Ramsey. Breit Symposium, Yale. 1999.
[27] Varouzhan Baluni. CP-nonconserving effects in quantum chromodynamics.
Phys. Rev. D, 19(7):2227, 1979.
[28] B. R. Martin. Nuclear and Particle Physics an introduction. John Wiley
and Sons Ltd, 2nd edition, 2009.
[29] R. D. Peccei and Helen R. Quinn. CP conservation in the presence of
pseudoparticles. Phys. Rev. Lett., 38(25):1440, 1977.
[30] Muon (g–2) Collaboration, G. W. Bennett, B. Bousquet, H. N. Brown,
G. Bunce, R. M. Carey, P. Cushman, G. T. Danby, P. T. Debevec, M. Deile,
H. Deng, W. Deninger, S. K. Dhawan, V. P. Druzhinin, L. Duong, E. Efs-
tathiadis, F. J. M. Farley, G. V. Fedotovich, S. Giron, F. E. Gray, D. Grig-
oriev, M. Grosse-Perdekamp, A. Grossmann, M. F. Hare, D. W. Hertzog,
X. Huang, V. W. Hughes, M. Iwasaki, K. Jungmann, D. Kawall, M. Kawa-
mura, B. I. Khazin, J. Kindem, F. Krienen, I. Kronkvist, A. Lam, R. Larsen,
Y. Y. Lee, I. Logashenko, R. McNabb, W. Meng, J. Mi, J. P. Miller,
Y. Mizumachi, W. M. Morse, D. Nikas, C. J. G. Onderwater, Y. Orlov, C. S.
nzben, J. M. Paley, Q. Peng, C. C. Polly, J. Pretz, R. Prigl, G. zu Putlitz,
T. Qian, S. I. Redin, O. Rind, B. L. Roberts, N. Ryskulov, S. Sedykh, Y. K.
Semertzidis, P. Shagin, Yu. M. Shatunov, E. P. Sichtermann, E. Solodov,
M. Sossong, A. Steinmetz, L. R. Sulak, C. Timmermans, A. Trofimov,
D. Urner, P. von Walter, D. Warburton, D. Winn, A. Yamamoto, and
D. Zimmerman. Improved limit on the muon electric dipole moment. Phys.
Rev. D, 80(5):052008, 2009.

160 Bibliography
[31] F. J. M. Farley, K. Jungmann, J. P. Miller, W. M. Morse, Y. F. Orlov,
B. L. Roberts, Y. K. Semertzidis, A. Silenko, and E. J. Stephenson. New
method of measuring electric dipole moments in storage rings. Phys. Rev.
Lett., 93(5):052001, 2004.
[32] C. A. Baker, D. D. Doyle, P. Geltenbort, K. Green, M. G. D. van der Grin-
ten, P. G. Harris, P. Iaydjiev, S. N. Ivanov, D. J. R. May, J. M. Pendle-
bury, J. D. Richardson, D. Shiers, and K. F. Smith. Improved experimen-
tal limit on the electric dipole moment of the neutron. Phys. Rev. Lett.,
97(13):131801, 2006.
[33] I. B. Khriplovich. The quark electric dipole moment and the induced θ-term
in the Kobayashi-Maskawa model. Phys. Lett. B, 173(2):193, 1986.
[34] J. J. Hudson, D. M. Kara, I. J. Smallman, B. E. Sauer, M. R. Tarbutt, and
E. A. Hinds. Improved measurement of the shape of the electron. Nature,
473(7348):493, 2011.
[35] M. E. Pospelov and I. B. Khriplovich. Electric Dipole Moment of the W-
Boson and the electron in the Kobayashi-Maskawa model. Soviet J. Nucl.
Phys., 53(4):638, 1991.
[36] M. A. Rosenberry and T. E. Chupp. Atomic electric dipole moment mea-
surement using spin exchange pumped masers of 129Xe and 3He. Phys. Rev.
Lett., 86(1):22, 2001.
[37] M. J. Ramsey-Musolf and S. Su. Low-energy precision tests of supersym-
metry. Phys. Reports, 456(1-2):1, 1 2008.
[38] B. C. Regan, Eugene D. Commins, Christian J. Schmidt, and David De-
Mille. New limit on the electron electric dipole moment. Phys. Rev. Lett.,
88(7):071805, 2002.
[39] V. V. Flambaum. Enhancement of parity and time invariance violation in
the radium atom. Phys. Rev. A, 60(4):R2611, 1999.
[40] L. I. Schiff. Measurability of nuclear electric dipole moments. Phys. Rev.,
132(5):2194, 1963.
[41] P. G. H. Sandars. Electric dipole moments of charged particles. Contem-
porary Physics, 42(2):97, 2001.

Bibliography 161
[42] V. A. Dzuba, V. V. Flambaum, and J. S. M. Ginges. Calculation of
parity and time invariance violation in the radium atom. Phys. Rev. A,
61(6):062509, 2000.
[43] V. V. Flambaum and I. B. Khriplovich. New bounds on the electric dipole
moment of the electron and on t-odd electron- nucleon coupling. Zh. Eksp.
Teor. Fiz, 89:1505, 1985.
[44] M. V. Romalis and L. Lin. Surface nuclear spin relaxation of 199Hg. J.
Chem. Phys., 120(3):1511, 2004.
[45] M. A. Player and P. G. H. Sandars. An experiment to search for an electric
dipole moment in the 3P2 metastable state of xenon. J. Ph. B: At. Mol.
Opt. Phys., 3(12), 1970.
[46] T. E. Chupp, R. J. Hoare, R. L. Walsworth, and Bo Wu. Spin-exchange-
pumped 3He and 129Xe Zeeman masers. Phys. Rev. Lett., 72(15):2363, 1994.
[47] R. E. Stoner, M. A. Rosenberry, J. T. Wright, T. E. Chupp, E. R. Oteiza,
and R. L. Walsworth. Demonstration of a two species noble gas maser.
Phys. Rev. Lett., 77(19):3971, 1996.
[48] Z. W. Liu and Hugh P. Kelly. Analysis of atomic electric dipole moment in
thallium by all-order calculations in many-body perturbation theory. Phys.
Rev. A, 45(7):R4210, 1992.
[49] Eugene D. Commins, Stephen B. Ross, David DeMille, and B. C. Regan.
Improved experimental limit on the electric dipole moment of the electron.
Phys. Rev. A, 50(4):2960, 1994.
[50] J. J. Hudson, B. E. Sauer, M. R. Tarbutt, and E. A. Hinds. Measurement
of the electron electric dipole moment using YbF molecules. Phys. Rev.
Lett., 89(2):023003, 2002.
[51] Dhiren Kara. Toward an electron electric dipole moment measurement
using ytterbium fluoride. PhD thesis, Imperial College London, 2010.
[52] P. G. Harris, C. A. Baker, K. Green, P. Iaydjiev, S. Ivanov, D. J. R. May,
J. M. Pendlebury, D. Shiers, K. F. Smith, M. van der Grinten, and P. Gel-
tenbort. New experimental limit on the electric dipole moment of the neu-
tron. Phys. Rev. Lett., 82(5):904, 1999.

162 Bibliography
[53] S. K. Lamoreaux and R. Golub. Experimental searches for the neutron
electric dipole moment. J. Phys. G, 36(10), 2009.
[54] G. W. et. al. Bennett. Final report of the e821 muon anomalous magnetic
moment measurement at bnl. Phys. Rev. D, 73(7):072003, 2006.
[55] J. de Vries, E. Mereghetti, R. G. E. Timmermans, and U. van Kolck. P and
T violating form factors of the deuteron. Phys. Rev. Lett., 107(9):091804,
2011.
[56] dEDM collaboration. Search for a permanent electric dipole moment of the
deuteron nucleus at the 1e−29 e cm level. AGS Proposal BNL, 2008.
[57] J. Engel, M. Bender, J. Dobaczewski, J. H. de Jesus, and P. Olbratowski.
Time-reversal violating schiff moment of 225Ra. Phys. Rev. C, 68(2):025501,
2003.
[58] J. Dobaczewski and J. Engel. Nuclear time-reversal violation and the schiff
moment of 225Ra. Phys. Rev. Lett., 94(23):232502, 2005.
[59] R. J. Holt, I. Ahmad, K. Bailey, B. Graner, J. P. Greene, W. Korsch, Z. T.
Lu, P. Mueller, T. P. O’Connor, I. A. Sulai, and W. L. Trimble. Progress
toward an edm measurement in 225Ra. Nucl. Phys. A, 844(1-4):53c, 11
2010.
[60] Web page on the Naturally Occurring Radioactive Materials (NORM). Ar-
gonne National Laboratory. 2005.
[61] Mark Winter. The periodic table of elements on web. The University of
Sheffield, 2012.
[62] The Handbook of Chemistry and Physics online. 2012.
[63] U. Dammalapati. Metastable D-State Spectroscopy and Laser Cooling of
Barium. PhD thesis, University of Groningen, NL, 2006.
[64] S. Hoekstra. Atom trap trace analysis of calcium isotopes. PhD thesis,
University of Groningen, NL, 2005.
[65] J. Beringer et. al. (Particle Data Group). Review of particle physics. Phys.
Rev. D, 86(1):010001, 2012.

Bibliography 163
[66] Chart of Nuclides. National Nuclear Data Center. Brookhaven National
Laboratory, 2012.
[67] Ebbe Rasmussen. Das Bogenspektrum des Radiums. Z. Physik A Hadrons
and Nuclei, 87(9):607, 1933.
[68] Ebbe Rasmussen. Serien im Funkenspektrum des Radiums. Ra II. Z. Phys.
A Hadrons and Nuclei, 86(1):24, 1933.
[69] Henry Norris Russell. The spectrum and ionization potential of radium.
Phys. Rev., 46(11):989, 1934.
[70] F. S. Tomkins and B. Ercoli. A modified King furnace for absorption spec-
troscopy of small samples. Appl. Opt., 6(8):1299, 1967.
[71] J A Armstrong, J J Wynne, and F S Tomkins. Bound, 7snp 1P1,0 series
in Ra I: measurements and predictions. J. Phy. B: At. Mol. Opt. Phys.,
13(5):L133, 1980.
[72] S. A. Ahmad, W. Klempt, R. Neugart, E. W. Otten, K. Wendt, and C. Ek-
strm. Determination of nuclear spins and moments in a series of radium
isotopes. Phys. Lett. B, 133(1-2):47, 1983.
[73] K. Wendt, S. A. Ahmad, W. Klempt, R. Neugart, E. W. Otten, and H. H.
Stroke. On the hyperfine structure and isotope shift of radium. Z. Phys.
D, 4:227, 1987.
[74] E. Arnold, W. Borchers, M. Carre, H. T. Duong, P. Juncar, J. Lerme,
S. Liberman, W. Neu, R. Neugart, E. W. Otten, M. Pellarin, J. Pinard,
G. Ulm, J. L. Vialle, and K. Wendt. Direct measurement of nuclear mag-
netic moments of radium isotopes. Phys. Rev. Lett., 59(7):771, 1987.
[75] J. Bieron, P. Indelicato, and P. Jansson. Multiconfiguration dirac-hartree-
fock calculations of transition rates and lifetimes of the eight lowest excited
levels of radium. Eur. Phys. J. Special Topics, 144:75, 2007.
[76] V A Dzuba and V V Flambaum. Calculation of energy levels and transition
amplitudes for barium and radium. J. Phy. B: At. Mol. Opt. Phys., 40(1),
2007.
[77] V. A. Dzuba and J. S. M. Ginges. Calculations of energy levels and lifetimes
of low-lying states of barium and radium. Phys. Rev. A, 73(3):032503, 2006.

164 Bibliography
[78] W. L. Trimble, I. A. Sulai, I. Ahmad, K. Bailey, B. Graner, J. P. Greene,
R. J. Holt, W. Korsch, Z. T. Lu, P. Mueller, and T. P. O’Connor. Lifetime
of the 7s6d 1D2 atomic state of radium. Phys. Rev. A, 80(5):054501, 2009.
[79] N. D. Scielzo, J. R. Guest, E. C. Schulte, I. Ahmad, K. Bailey, D. L. Bowers,
R. J. Holt, Z. T. Lu, T. P. O’Connor, and D. H. Potterveld. Measurement
of the lifetimes of the lowest 3P1 state of neutral Ba and Ra. Phys. Rev. A,
73(1):010501, 2006.
[80] J. R. Guest, N. D. Scielzo, I. Ahmad, K. Bailey, J. P. Greene, R. J. Holt,
Z. T. Lu, T. P. O’Connor, and D. H. Potterveld. Laser trapping of 225Ra
and 226Ra with repumping by room-temperature blackbody radiation. Phys.
Rev. Lett., 98(9):093001, 2007.
[81] K Jungmann, G P Berg, U Dammalapati, P Dendooven, O Dermois, M N
Harakeh, R Hoekstra, R Morgenstern, A Rogachevskiy, M Sanchez-Vega,
R Timmermans, E Traykov, L Willmann, and H W Wilscut. TRIµP -
Trapped Radioactive Atoms - µicrolaboratories for Fundamental Physics.
Phys. Scripta, 2003(T104), 2003.
[82] Jacek Bieron, Charlotte Froese Fischer, Stephan Fritzsche, and Krzysztof
Pachucki. Lifetime and hyperfine structure of the 3D2 state of radium. J.
Phy. B: At. Mol. Opt. Phys., 37(17), 2004.
[83] Jacek Bieron, Gediminas Gaigalas, Erikas Gaidamauskas, Stephan
Fritzsche, Paul Indelicato, and Per Jnsson. Multiconfiguration dirac-
hartree-fock calculations of the electric dipole moment of radium induced
by the nuclear Schiff moment. Phys. Rev. A, 80(1):012513, 2009.
[84] W. C. Griffith, M. Swallows, and E. N. Fortson. Lepton Dipole Moments,
volume 20 of Advanced Series on Directions in High Energy Physics. World
Scientific Publishing Co. Pte. Ltd., 2010.
[85] J. Engel, J. L. Friar, and A. C. Hayes. Nuclear octupole correlations and the
enhancement of atomic time-reversal violation. Phys. Rev. C, 61(3):035502,
2000.
[86] V. V. Flambaum and V. G. Zelevinsky. Enhancement of nuclear schiff
moments and time-reversal violation in atoms due to soft nuclear octupole
vibrations. Phys. Rev. C, 68(3):035502, 2003.

Bibliography 165
[87] P. Butler et al. Measurements of octupole collectivity in odd-mass Rn, Fr
and Ra isotopes. HIE-ISOLDE LOI, 2010.
[88] K. Jungmann. (private communication).
[89] Subhadeep De. Laser Cooling and Trapping of Barium. PhD thesis, Uni-
versity of Groningen, NL, 2008.
[90] James Harvey et. al. Production of Actinium-225 via high energy proton
induced spallation of Thorium-232. Applications of High Intensity Proton
Accelerators - Proceedings of the Workshop, 2010.
[91] M. A. Hofstee et al. Progress towards high intensity heavy ion beams at
the AGOR-facility. Proceedings of CYCLOTRONS2010, Lanzhou, China,
2010.
[92] E. Traykov, U. Dammalapati, S. De, O. C. Dermois, L. Huisman, K. Jung-
mann, W. Kruithof, A. J. Mol, C. J. G. Onderwater, A. Rogachevskiy,
M. da Silva e Silva, M. Sohani, O. Versolato, L. Willmann, and H. W.
Wilschut. Development of a thermal ionizer as ion catcher. Nucl. Instrum.
Methods B, 266(19-20):4478, 2008.
[93] E. Traykov. Production of radioactive beams for atomic trapping. PhD
thesis, University of Groningen, NL, 2006.
[94] P. D. Shidling, G. S. Giri, D. J. van der Hoek, K. Jungmann, W. Kruithof,
C. J. G. Onderwater, M. Sohani, O. O. Versolato, L. Willmann, and H. W.
Wilschut. Production of short lived radioactive beams of radium. Nucl.
Instrum. Methods A, 606(3):305, 2009.
[95] O. O. Versolato, G. S. Giri, J. E. van den Berg, O. Boll, U. Dammalapati,
D. J. van der Hoek, S. Hoekstra, K. Jungmann, W. L. Kruithof, S. Mueller,
M. Nunez Portela, C. J. G. Onderwater, B. Santra, R. G. E. Timmermans,
L. W. Wansbeek, L. Willmann, and H. W. Wilschut. Hyperfine structure of
the level in trapped short-lived 211,209Ra+ ions. Phys. Lett. A, 375(35):3130,
2011.
[96] G. P. A. Berg, O. C. Dermois, U. Dammalapati, P. Dendooven, M. N.
Harakeh, K. Jungmann, C. J. G. Onderwater, A. Rogachevskiy, M. Sohani,
E. Traykov, L. Willmann, and H. W. Wilschut. Dual magnetic separator
for. Nucl. Instrum. Methods A, 560(2):169, 2006.

166 Bibliography
[97] P. D. Shidling, G. S. Giri, D. J. van der Hoek, K. Jungmann, W. L. Kruithof,
C. J. G. Onderwater, B. Santra, M. Sohani, O. O. Versolato, L. Willmann,
and H. W. Wilschut. Thermalization of different alkali and alkali-earth
elements at the facility. Nucl. Instrum. Methods A, 622(1):11, 2010.
[98] Kaye G. W. C. and Laby T. H. CRC Handbook of Chemistry and Physics.
CRC Press, 1995.
[99] J. P. Biersack and L. Haggmark. A Monte Carlo computer program for the
transport of energetic ions in amorphous targets. Nucl. Instr. and Meth.,
174:257, 1980.
[100] G. J. Beyer, E. Hageb, A. F. Novgorodov, and H. L. Ravn. The role of
diffusion in isol targets for the production of radioactive ion beams. Nucl.
Instrum. Methods B, 204(0):225, 2003.
[101] Charles Kittel and Herbert Kroemer. Thermal physics. W. H. Freenman
and Company, 1980.
[102] G. G. Kleiman and Uzi Landman. Theory of physisorption: He on metals.
Phys. Rev. B, 8(12):5484, 1973.
[103] J. P. Hobson. Pumping at solid surfaces. British Journal of Applied Physics,
14(9), 1963.
[104] R. Mueller and H. W. Wassmuth. Desorption kinetics of alkaline earth ad-
particles on tungsten with variation of the oxygen surface coverage. Surface
Science, 34(2):249, 1 1973.
[105] Yamamoto Shigehiko et al. Formation mechanism of a monoatomic order
surface layer on a Sc-type impregnated cathode. Jap. J. Appl. Phys., 28:490,
1989.
[106] R.H. Schumm, D.D. Wagman, S. Bailey, W.H. Evans, and V.B. Parker.
National Bureau of Standards (USA) Technical Notes, 270, 1973.
[107] W. Kruithof. Laser trapping of sodium isotopes for a high-precision β-decay
experiment. PhD thesis, University of Groningen, NL, 2012.
[108] D. Melconian, M. Trinczek, A. Gorelov, W. P. Alford, J. A. Behr, J. M.
D’Auria, M. Dombsky, U. Giesen, K. P. Jackson, T. B. Swanson, and
W. Wong. Release of 37K from catcher foils. Nuclear Instruments and

Bibliography 167
Methods in Physics Research Section A: Accelerators, Spectrometers, De-
tectors and Associated Equipment, 538:93, 2 2005.
[109] Thorlabs GmbH, Munich, Germany.
[110] SIMION. Industry standard charged particle optics simulation software.
Scientific Instrument Services, Inc., NJ, USA.
[111] A. Groot. Spectroscopy of neutral radium. Masters thesis, University of
Groningen, NL, 2010.
[112] Dongfeng Xue and Siyuan Zhang. Comparison of non-linear optical sus-
ceptibilities of KNbO3 and LiNbO3. J. Phys. Chem. of Solids, 58(9):1399,
1997.
[113] P. A. Franken, A. E. Hill, C. W. Peters, and G. Weinreich. Generation of
optical harmonics. Phys. Rev. Lett., 7(4):118, 1961.
[114] Z. Y. Ou, S. F. Pereira, E. S. Polzik, and H. J. Kimble. 85% efficiency for
cw frequency doubling from 1.08 to 0.54 ,m. Opt. Lett., 17(9):640, 1992.
[115] R. Paschotta, P. Krz, R. Henking, S. Schiller, and J. Mlynek. 82% ef-
ficient continuous-wave frequency doubling of 1.06 m with a monolithic
MgO:LiNbO3 resonator. Opt. Lett., 19(17):1325, 1994.
[116] Thomas Sudmeyer, Yutaka Imai, Hisashi Masuda, Naoya Eguchi, Masaki
Saito, and Shigeo Kubota. Efficient 2nd and 4th harmonic generation of
asingle-frequency, continuous-wave fiberamplifier. Opt. Express, 16(3):1546,
2008.
[117] Beat Zysset, Ivan Biaggio, and Peter Gunter. Refractive indices of or-
thorhombic KNbO3. I. Dispersion and temperature dependence. J. Opt.
Soc. Am. B, 9(3):380, 1992.
[118] D. A. Shaddock, M. B. Gray, and D. E. McClelland. Frequency locking a
laser to an optical cavity by use of spatial mode interference. Opt. Lett.,
24(21):1499, 1999.
[119] Bruce G. Klappauf, Yannick Bidel, David Wilkowski, Thierry ChaneliEre,
and Robin Kaiser. Detailed study of an efficient blue laser source by second-
harmonic generation in a semimonolithic cavity for the cooling of strontium
atoms. Appl. Opt., 43(12):2510, 2004.

168 Bibliography
[120] FEE Gmbh. LASER Crystals and Nonlinear Optical Crystals. Idar-
Oberstein, Germany.
[121] S. Arlee. SNLO software for modeling crystal nonlinear optics.
[122] Carl E. Wieman and Leo Hollberg. Using diode lasers for atomic physics.
Rev. Sci. Instrum., 62(1):1, 1991.
[123] H. Patrick and C. E. Wieman. Frequency stabilization of a diode laser using
simultaneous optical feedback from a diffraction grating and a narrowband
Fabry–Perot cavity. Rev. Sci. Instrum., 62(11):2593, 1991.
[124] GaAIAs Infrared Emitting Diode. HL7001MG/02MG. Opnext Japan Inc.,
Tokyo, Japan, 2008.
[125] T. J. Pinkert, D. Z. Kandula, C. Gohle, I. Barmes, J. Morgenweg, and
K. S. E. Eikema. Widely tunable extreme uv frequency comb generation.
Opt. Lett., 36(11):2026, 2011.
[126] Arman Cingoz, Dylan C. Yost, Thomas K. Allison, Axel Ruehl, Martin E.
Fermann, Ingmar Hartl, and Jun Ye. Direct frequency comb spectroscopy
in the extreme ultraviolet. Nature, 482(7383):68, 2012.
[127] P Maddaloni, P Malara, G Gagliardi, and P De Natale. Mid-infrared fibre-
based optical comb. New J. Physics, 8(11), 2006.
[128] Christine Wang, Tobias Herr, Pascal Del’Haye, Albert Schliesser, Ronald
Holzwarth, Theodor W. Haensch, Nathalie Picque, and Tobias Kippenberg.
Mid-infrared frequency combs based on microresonators. Optical Society
of America, 2011.
[129] S. Gerstenkorn et. al. Atlas du spectra d’Absortion de la Molecule d’Iode.
Laboratiry Aimr-Cotton, CERN, Orsay, France, 1993.
[130] J. Cariou and P. Luc. Atlas du Spectre d’Absorption de la Molecule
d’Tellure. Laboratiry Aimr-Cotton, CERN, Orsay, France, 1980.
[131] M. G. Boshier, P. E. G. Baird, C. J. Foot, E. A. Hinds, M. D. Plimmer, D. N.
Stacey, J. B. Swan, D. A. Tate, D. M. Warrington, and G. K. Woodgate.
Laser spectroscopy of the 1s-2s transition in hydrogen and deuterium: De-
termination of the 1s lamb shift and the rydberg constant. Phys. Rev. A,
40(11):6169, 1989.

Bibliography 169
[132] J. D. Gillaspy and Craig J. Sansonetti. Absolute wavelength determinations
in molecular tellurium: new reference lines for precision laser spectroscopy.
J. Opt. Soc. Am. B, 8(12):2414, 1991.
[133] A A Optoelectronics Ltd. Ontario, Canada.
[134] U. Dammalapati, S. De, K. Jungmann, and L. Willmann. Isotope shifts of
6s5d 3D - 6s6p 1P1 transitions in neutral barium. E. Phys. D, 53:1, 2009.
[135] H. Knnckel, B. Bodermann, and E. Tiemann. High precision description of
the rovibronic structure of the I B-X spectrum. Eur. Phys. J. D, 28(2):199,
2004.
[136] Menlo Systems GmbH Germany. Optical Frequency Combs.
[137] Philip Russell. Photonic crystal fibers. Science, 299(5605):358, 01 2003.
[138] D. H. McIntyre and T. W. Haensch. Interferometric frequency measurement
of a 130Te2 reference line for muonium 1s-2s spectroscopy. Phys. Rev. A,
36(8):4115, 1987.
[139] D. H. McIntyre, Jr. Fairbank, W. M., S. A. Lee, T. W. Haensch, and E. Riis.
Interferometric frequency measurement of 130Te2 reference transitions at
486 nm. Phys. Rev. A, 41(9):4632, 1990.
[140] G. P. Barwood, W. R. C. Rowley, P. Gill, J. L. Flowers, and B. W. Pet-
ley. Interferometric measurements of 130Te2 reference frequencies for 1s-2s
transitions in hydrogenlike atoms. Phys. Rev. A, 43(9):4783, 1991.
[141] Robert E. Machol and Edgar F. Westrum. Vapor pressure of liquid tel-
lurium. J. Am. Chem. Soc., 80(12):2950, 1958.
[142] W. Demtroder. Laser Spectroscopy: Basic Concepts and Instrumentation.
Spinger-Verlag, 2003.
[143] Robert F. Brebrick. Tellurium vapor pressure and optical density at 370-
615.degree. J. Phys. Chem., 72(3):1032, 1968.
[144] J. R. M. Barr, J. M. Girkin, A. I. Ferguson, G. P. Barwood, P. Gill, W. R. C.
Rowley, and R. C. Thompson. Interferometric frequency measurements of130Te2 transitions at 486 nm. Optics Communications, 54(4):217, 6 1985.

170 Bibliography
[145] C. Cohen-Tannoudji and D. Guery-Odelin. Advances in atomic physics.
World Scientific Publishing Co. Pte. Ltd., 2011.
[146] A. D. Ludlow, T. Zelevinsky, G. K. Campbell, S. Blatt, M. M. Boyd,
M. H. G. de Miranda, M. J. Martin, J. W. Thomsen, S. M. Foreman,
Jun Ye, T. M. Fortier, J. E. Stalnaker, S. A. Diddams, Y. Le Coq, Z. W.
Barber, N. Poli, N. D. Lemke, K. M. Beck, and C. W. Oates. Sr lattice
clock at 1× 10⁻¹⁶ fractional uncertainty by remote optical evaluation with
a Ca clock. Science, 319(5871):1805, 2008.
[147] C. J. Foot. Atomic Physics (Oxford Master Series in Atomic, Optical and
Laser Physics). Oxford University Press Inc., New York, 2005.
[148] S. De, U. Dammalapati, K. Jungmann, and L. Willmann. Magneto-optical
trapping of barium. Phys. Rev. A, 79:041402, 2009.
[149] A. Nagel, S. Brandt, D. Meschede, and R. Wynands. Light shift of coherent
population trapping resonances. E. Phys. Lett., 48(4), 1999.
[150] E Arimondo. Coherent population trapping in laser spectroscopy. In
Progress in Optics, Vol 35, volume 35 of Progress in Optics, page 257.
Elsevier Science Publ. B V, 1996.
[151] Thomas Zanon-Willette, Emeric de Clercq, and Ennio Arimondo.
Ultrahigh-resolution spectroscopy with atomic or molecular dark reso-
nances: Exact steady-state line shapes and asymptotic profiles in the adi-
abatic pulsed regime. Phys. Rev. A, 84(6):062502, 2011.
[152] G. Alzetta, A. Gozzini, L. Moi, and G. Orriols. Experimental-method for
observation of rf transitions and laser beat resonances in oriented na vapor.
Nuovo Cimento Della Soc. Italiana Di Fisica B, 36(1):5, 1976.
[153] Vishal Shah, John Kitching, P. R. Berman E. Arimondo, and C. C. Lin.
Chapter 2 - Advances in Coherent Population Trapping for Atomic Clocks,
volume Volume 59, page 21. Academic Press, 2010.
[154] I. Siemers, M. Schubert, R. Blatt, W. Neuhauser, and P. E. Toschek. The
trapped state of a trapped ion - line shifts and shape. E. Phys. Lett.,
18(2BIS):139, 1992.

Bibliography 171
[155] G. Janik, W. Nagourney, and H. Dehmelt. Doppler-free optical spec-
troscopy on the Ba+ mono-ion oscillator. J. Opt. Soc. Am. B, 2(8):1251,
1985.
[156] Robin Santra, Ennio Arimondo, Tetsuya Ido, Chris H. Greene, and Jun
Ye. High-accuracy optical clock via three-level coherence in neutral bosonic88Sr. Phys. Rev. Lett., 94(17):173002, 2005.
[157] A. Greilich, R. Oulton, E. A. Zhukov, I. A. Yugova, D. R. Yakovlev,
M. Bayer, A. Shabaev, Al. L. Efros, I. A. Merkulov, V. Stavarache,
D. Reuter, and A. Wieck. Optical control of spin coherence in singly charged
(In,Ga)As/GaAs quantum dots. Phys. Rev. Lett., 96(22):227401, 2006.
[158] E. Peik and Chr. Tamm. Nuclear laser spectroscopy of the 3.5 eV transition
in Th-229. E. Phys. Lett., 61(2), 2003.
[159] Hidetoshi Katori. Optical lattice clocks and quantum metrology. Nature
Photonics, 5(4):203, 2011.
[160] Masao Takamoto, Feng-Lei Hong, Ryoichi Higashi, and Hidetoshi Katori.
An optical lattice clock. Nature, 435(7040):321, 2005.
[161] M. V. Romalis and E. N. Fortson. Zeeman frequency shifts in an optical
dipole trap used to search for an electric-dipole moment. Phys. Rev. A,
59(6):4547, 1999.
[162] D. S. Weiss, F. Fang, and J. Chen. Measuring the electric dipole moment
of Cs and Rb in an optical lattice. Bull. Am. Phys. Soc., (APR03, J1.008),
2003.
[163] O. O. Versolato, G. S. Giri, L. W. Wansbeek, J. E. van den Berg, D. J.
van der Hoek, K. Jungmann, W. L. Kruithof, C. J. G. Onderwater, B. K.
Sahoo, B. Santra, P. D. Shidling, R. G. E. Timmermans, L. Willmann, and
H. W. Wilschut. Laser spectroscopy of trapped short-lived Ra+ ions. Phys.
Rev. A, 82(1):010501, 2010.
[164] G. S. Giri, O. O. Versolato, J. E. van den Berg, O. Boll, U. Dammala-
pati, D. J. van der Hoek, K. Jungmann, W. L. Kruithof, S. Mueller,
M. Nunez Portela, C. J. G. Onderwater, B. Santra, R. G. E. Timmer-
mans, L. W. Wansbeek, L. Willmann, and H. W. Wilschut. Isotope shifts

172 Bibliography
of the 6d 2D3/2-7p 2P1/2 transition in trapped short-lived 209−214Ra+. Phys.
Rev. A, 84(2):020503, 2011.
[165] E. Kugler. The ISOLDE facility. Hyperfine Interactions, 129(1-4):23, 2000.
[166] H. A. Abderrahim et. al. MYRRHA, a multipurpose hybrid research reactor
for high-end applications. Nucl. Phys. News, 20(1):24, 2010.

List of Publications
1. Online production of thermal radium atoms at the TRIµP facility,
B. Santra, H. Bekker, J. E. van den Berg, O. Boll, U. Dammalapati, E.
Dijck, K. Jungmann, S. Chirayath Mathavan, C. Meinema, A. Mohanty,
S. Muller, M. Nunez-Portela, C. J. G. Onderwater, A. van der Poel, M.
Santin, L. Willmann, and H. W. Wilschut,
(In preparation).
2. Absolute frequency measurement of the 1S0 − 3P1 intercombination transi-
tion in neutral radium,
B. Santra, U. Dammalapati, K. Jungmann, and L. Willmann,
(In preparation).
3. Absolute frequency measurement of the 1S0 − 1P1 transition in neutral ra-
dium,
B. Santra, U. Dammalapati, A. Groot, K. Jungmann, and L. Willmann,
(In preparation).
4. New precise determination of the unperturbed 8B neutrino spectrum,
T. Roger, J. Buscher, B. Bastin, O. S. Kirsebom, R. Raabe, M. Alcorta, J.
Aysto, M. J. G. Borge, M. Carmona-Gallardo, T. E. Cocolios, J. Cruz, P.
Dendooven, L.M. Fraile, H.O.U. Fynbo, D. Galaviz, L. R. Gasques, G. S.
Giri, M. Huyse, S. Hyldegaard, K. Jungmann, W. L. Kruithof, M. Lantz,
A. Perea, K. Riisager, A. Saastamoinen, B. Santra, P. D. Shidling, M.
Sohani, A.J. Sorensen, O. Tengblad, E. Traykov, D. J. van der Hoek, P.
Van Duppen, O. O. Versolato, and H. W. Wilschut,
Phys. Rev. Lett. 108, 162502 (2012).
5. Light shifts and magic wavelengths for heavy alkaline earth elements: Ba
and Ra,
U. Dammalapati, B. Santra and L. Willmann,
J. Phys. B: At. Mol. Opt. Phys. 45, 025001 (2012).
173

174 List of Publications
6. Isotope shifts of 6d 2D3/2 - 7p 2P1/2 transition in trapped short-lived 209−214Ra+,
G.S. Giri, O.O. Versolato, J.E. van den Berg, O. Boll, U. Dammalapati, D.J.
van der Hoek, K. Jungmann, W. Kruithof, S. Muller, M. Nunez Portela,
C.J.G. Onderwater, B. Santra, R.G.E. Timmermans, L.W. Wansbeek, L.
Willmann, H.W. Wilschut,
Phys. Rev. A 84, 020503(R) (2011).
7. Hyperfine structure of the 6d 2D3/2 level in trapped short-lived 211,209Ra+ ions,
O.O. Versolato, G.S. Giri, J.E. van den Berg, O. Boll, U. Dammalapati,
D.J. van der Hoek, S. Hoekstra, K. Jungmann, W. Kruithof, S. Muller,
M. Nunez Portela, C.J.G. Onderwater, B. Santra, R.G.E. Timmermans,
L.W. Wansbeek, L. Willmann, H.W. Wilschut,
Phys. Lett. A 375(35), 3130 (2011).
8. Atomic parity violation in a single trapped radium ion,
O.O. Versolato, L.W. Wansbeek, G.S. Giri, J.E. van den Berg, D.J. van
der Hoek, K. Jungmann, W.L. Kruithof, C.J.G. Onderwater, B.K. Sahoo,
B. Santra, P.D. Shidling, R.G.E. Timmermans, L. Willmann, and H.W.
Wilschut,
Hyperfine Interact, 199, 9 (2011).
9. Precision spectroscopy of trapped radioactive radium ions,
G.S. Giri, O.O. Versolato, L.W. Wansbeek, J.E. van den Berg, D.J. van
der Hoek, K. Jungmann, W.L. Kruithof, C.J.G. Onderwater, B.K. Sahoo,
B. Santra, P.D. Shidling, R.G.E. Timmermans, L. Willmann, and H.W.
Wilschut,
Can. J. Phys. 89(1), 69 (2011).
10. Atomic parity violation in a single trapped radium ion,
O.O. Versolato, L.W. Wansbeek, G.S. Giri, J.E. van den Berg, D.J. van
der Hoek, K. Jungmann, W.L. Kruithof, C.J.G. Onderwater, B.K. Sahoo,
B. Santra, P.D. Shidling, R.G.E. Timmermans, L. Willmann, and H.W.
Wilschut,
Can. J. Phys. 89(1), 65 (2011).
11. Thermalization of different alkali and alkali-earth elements at the TRIµP
facility,
P.D. Shidling, G.S. Giri, D.J. van der Hoek, K. Jungmann, W. Kruithof,
C.J.G. Onderwater, B. Santra, M. Sohani, O.O. Versolato, L. Willmann,

175
H.W. Wilschut,
Nucl. Instr. and Meth. A 622, 11 (2010).
12. Laser spectroscopy of trapped short-lived Ra+ ions,
O.O. Versolato, G.S. Giri, L.W. Wansbeek, J.E. van den Berg, D.J. van der
Hoek, K. Jungmann, W.L. Kruithof, C.J.G. Onderwater, B.K. Sahoo, B.
Santra, P.D. Shidling, R.G.E. Timmermans, L. Willmann, H.W. Wilschut,
Phys. Rev. A 82, 010501(R) (2010).
13. β-Decay and the electric dipole moment: Searches for time-reversal viola-
tion in radioactive nuclei and atoms,
H. W. Wilschut, D. J. van der Hoek, K. Jungmann, W. Kruithof, C. J. G.
Onderwater, B. Santra, P. Shidling and L. Willmann,
Pramana 75 163 (2010).
14. β-Decay and the electric dipole moment: Searches for time-reversal viola-
tion in radioactive nuclei and atoms,
H. W. Wilschut, U. Dammalapati, D. J. van der Hoek, K. Jungmann, W.
Kruithof, C. J. G. Onderwater, B. Santra, P. Shidling and L. Willmann,
Nuclear Physics A 844 143 (2010).


Acknowledgment
This PhD thesis is the tip of an iceberg, which has been grown up with the
invaluable support in many aspects from all my direct and indirect well wishers.
I am proud to be a children of my parents who have shown me many first
steps in my life. In particular my interest in physics has been grown by looking
at the exciting pictures in the books of my first physics teacher, my father.
I would like to thank many of my teachers starting from primary school to
the University. During my visit at Institute of Physics, Bhubaneswar, India
as summer research student in 2006 Prof. Kalyan Kundu taught me how to
learn physics and how to behave as a physicist. It will not be too much if I
say that, it was a great motivation for me to aspire for becoming a successful
physicist. From the day of my first meeting with Prof. Bhanu Pratap Das
at Indian Institute of Astrophysics, Bangalore, India in December 2010, I have
always received invaluable support and encouragement for pursuing successful
research. I am grateful to Prof. V. Srinivas, Indian Institute of Technology
Kharagpur (now at Madras) for his support whenever I needed.
I am thankful to my supervisors Prof. Klaus Jungmann and Dr. Lorenz
Willmann for guiding me and critically evaluating my work that led to this thesis.
At the beginning of my PhD work I did not know anything about experimental
research. Both of you took the pain to prepare me as someone who can do
something in a laboratory (I hope so). Lorenz taught me the concept of SMART
(Specific, Measurable, Achievable, Realistic, Time bound) working, which I think
I remember everyday at least once during my work. I have learnt from Klaus how
to take a critical decision in economic time scale as well.
I thank the members of the reading committee Prof. W. Heil, Prof. Y.
Blumenfeld, and Prof. P. Butler for the careful reading of this manuscript and
177

178 Acknowledgment
the constructive comments they provided.
I thank all my colleagues in the TRIµP group for their continuous support
for the Ra EDM project. I would like to thank Hans Wilschut for his support
on isotope production in a educational level and during the beam time. Many
thanks to Gerco Onderwater for his enthusiastic help for smooth running of the
data acquisition system. Otto Dermois and Leo Huisman were like GPS system
whenever I needed to build something from the workshop or from drawing office.
Enthusiastic support from Oliver Boll for setting up optics was adorable. I would
like to give Umakanth Dammalapati my sincere thanks for his active support to
the Ra EDM project and for the light shift paper. I thank Stefan Muller for his
encouraging attitude which has helped me a lot during my PhD days.
I thank Bijaya Sahoo for his suggestion and support to me for professional
and personal life. My sincere thanks to Subhadeep De, my long time senior for
his valuable suggestions and support.
I will always remember Gouri for his constructive suggestion during my PhD
days. I thank Steven Hoekstra, Oscar, Duurt, Mayerlin, Joost, Hendrik, El-
win, Amita, Sreekanth for their cooperation to run both offline and online Ra
atom experiment. I also thank ex-TRIµP members Moslem, Praveen, Marlene,
Alexandar and Sander. I was happy to get Wilbert, Jordy and Corine as my
office mates.
I thank Gerco, Lorenz, Corine and Joost for translating the summary of my
PhD thesis in Dutch language.
My sincere thanks to AGOR cyclotron group. I would like to thank all the
personnels from IT department, drawing office, mechanical, electronic and vac-
uum workshops, administration, financial and personal offices for their potential
support to complete my PhD work. I would like to give Hilde van der Meer a
special thanks for taking care of all paper works throughout my PhD.
My sincere thanks to Ronnie Hoekstra and the atomic physics group for many
useful discussions with them. A special thanks to Thomas, Erwin, Geert and
Olmo for allowing me to borrow continuously many vacuum components.
I would like to give special thanks to Amit-da, Deepak-vai, Ayanangsha,

179
Sujata-di, Soumya and Dipayan for many wonderful evening. Discussion on many
topics with Suresh and Ganesh was enjoyable. I thank Saurav Dhabal Deb for
helping me to designing the cover of my thesis.
Finally I thank my parents and my sister for their never ending support. I
thank Suranita for her love and support, and for willing to spend life with me. I
am thankful to my parent and sister in laws for their support.
This research was supported by the Stichting voor Fundamenteel Onderzoek
der Materie (FOM) under Program 114 (TRIµP), FOM and Nederlandse Organ-
isatie voor Wetenschappelijk Onderzoek (NWO) and Ubbo Emmius PhD schol-
arship from the graduate school of science of the University of Groningen, The
Netherlands.
Bodhaditya Santra