pre-season run size forecasts for fraser river sockeye & pink salmon in...
TRANSCRIPT
1
Pre-Season Run Size Forecasts: Fraser River Sockeye Salmon in 2014
authors: S. Grant & B. MacDonald
presented by: A.Huangto: FN Forumdate: 19/20 Feb, 2014
Fisheries and Oceans Pêches et Océans
Canada Canada
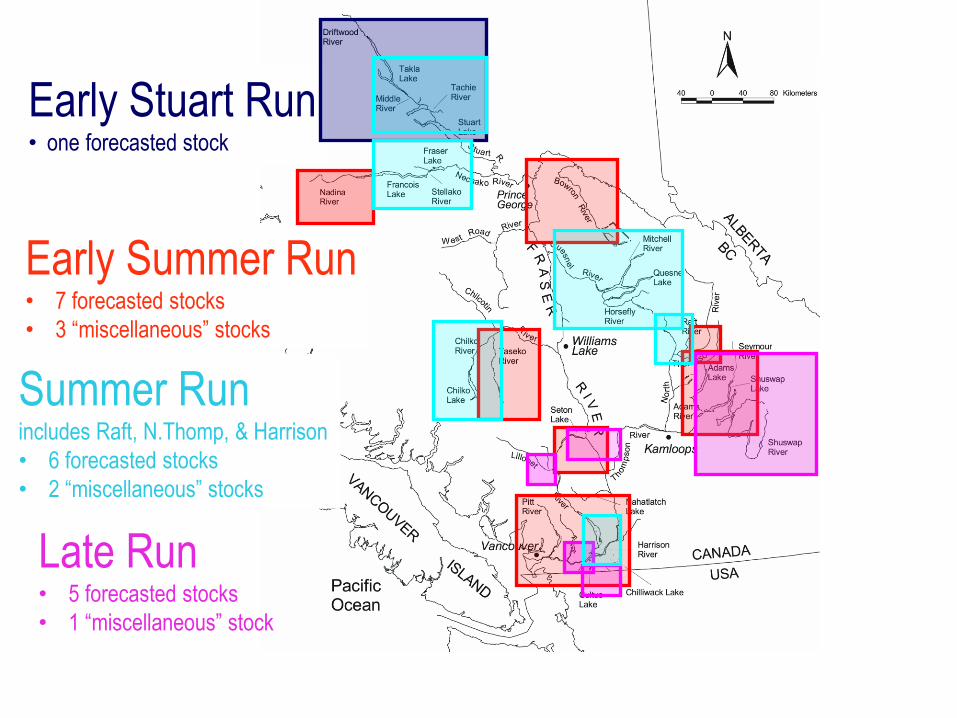
Early Summer Run• 7 forecasted stocks
• 3 “miscellaneous” stocks
Early Stuart Run• one forecasted stock
Summer Runincludes Raft, N.Thomp, & Harrison
• 6 forecasted stocks
• 2 “miscellaneous” stocks
Late Run• 5 forecasted stocks
• 1 “miscellaneous” stock

3
Age of Maturity # Adult Spawners Survival
Brood Year Escapement
Factors influencing total returns

4
Average age: 42
Age of Maturity
Spawn (eggs):
Fry emergence:
Smolts
Juveniles
2012
2010
2011
2012-2014
2014Returns
Fresh
water:
2 W
in
ters
Marin
e:
2 W
in
ters

5
Four Year Old Brood Year
smolts
effective female spawners
Chilko: 20%
age-3
L. Shuswap 53%
27%
Four Year Old Brood YearFive Year Old Brood Year
E. Shuswap 12 %
Harrison: 7%
# Adult Spawners
Run timing group Stocks
Stocks
Early Stuart 34,200
Early Summer
Bowron 4,400
Fennell 5,500
Gates 5,900
Nadina 11,900
Pitt 8,800
Scotch 273,900
Seymour 284,500
Summer 127,367
Chilko j
54.9 M
Late Stuart 43,500
Quesnel 133,000
Stellako 110,300
Raft 2,400
Harrison 399,700
Late
Cultus 318,400
Late Shuswap 3.1 M
Portage 26,700
Weaver 25,300
Birkenhead 67,800
2010 Brood Year
(Age-4)
Run timing group Stocks
Stocks
Early Stuart 21,900
Early Summer
Bowron 1,000
Fennell 700
Gates 5,300
Nadina 3,700
Pitt 18,800
Scotch 2,700
Seymour 3,100
Summer 127,367
Chilko j
34.4 M
Late Stuart 43,300
Quesnel 82,800
Stellako 15,900
Raft 6,000
Harrison 387,100
Late
Cultus 174,000
Late Shuswap 20,200
Portage 800
Weaver 12,900
Birkenhead 34,500
2009 Brood Year
(Age-5)
0%
2%
4%
6%
8%
10%
12%
14%
16%
0
25
50
75
100
125
150
175
200
225
250
275
300
325
350
375
Fre
qu
en
cy (%
)
Effective Females (1,000's)
0%
2%
4%
6%
8%
10%
12%
14%
16%
0
25
50
75
100
125
150
175
200
225
250
275
300
325
350
375
Fre
qu
en
cy (
%)
Effective Females (1,000's)
0%
2%
4%
6%
8%
10%
12%
14%
16%
0
25
50
75
100
125
150
175
200
225
250
275
300
325
350
375
Fre
qu
en
cy (
%)
Effective Females (1,000's)
6
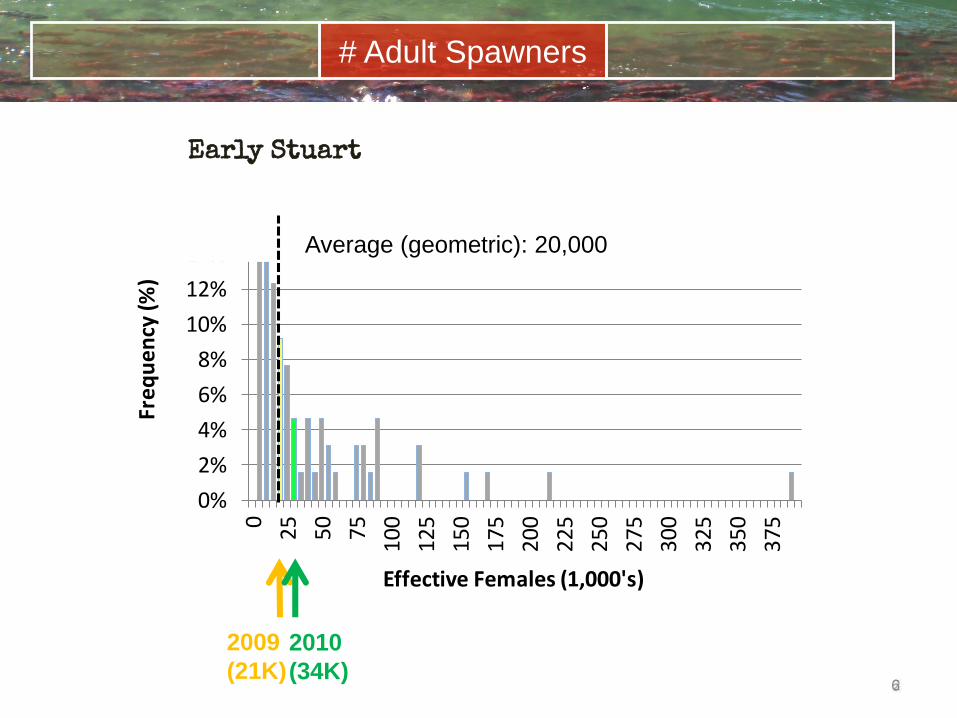
Early Stuart
2010
(34K)
2009
(21K)
Average (geometric): 20,000
# Adult Spawners
0%2%4%6%8%
10%12%14%16%18%20%0 4 8
12
16
20
24
28
32
36
40
44
48
52
56
60
Fre
qu
en
cy (
%)
Effective Females (10,000's)
0%2%4%6%8%
10%12%14%16%18%20%0 4 8
12
16
20
24
28
32
36
40
44
48
52
56
60
Fre
qu
en
cy (
%)
Effective Females (10,000's)
0%2%4%6%8%
10%12%14%16%18%20%0 4 8
12
16
20
24
28
32
36
40
44
48
52
56
60
Fre
qu
en
cy (
%)
Effective Females (10,000's)
7
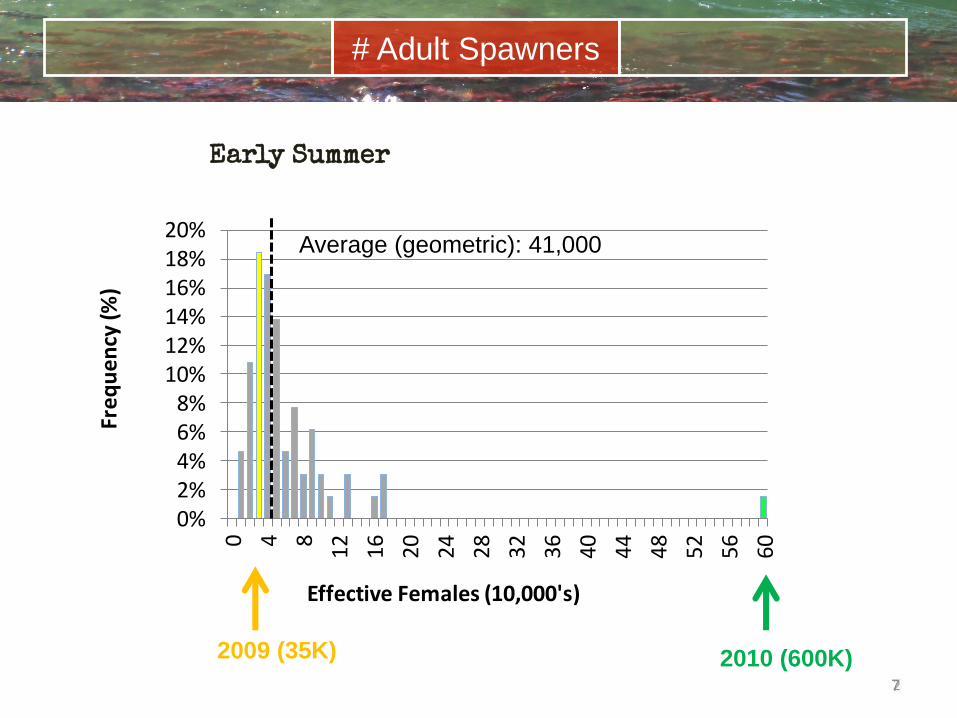
# Adult Spawners
2010 (600K)2009 (35K)
Early Summer
Average (geometric): 41,000
# Adult Spawners
0%
5%
10%
15%
20%
25%
30%
0
20
40
60
80
100
120
140
160
180
200
220
240
260
280
300
320
Fre
qu
en
cy (%
)
Effective Females (10,000's)
0%
5%
10%
15%
20%
25%
30%
0
20
40
60
80
100
120
140
160
180
200
220
240
260
280
300
320
Fre
qu
en
cy (%
)
Effective Females (10,000's)
0%
5%
10%
15%
20%
25%
30%
0
20
40
60
80
100
120
140
160
180
200
220
240
260
280
300
320
Fre
qu
en
cy (%
)
Effective Females (10,000's)
8
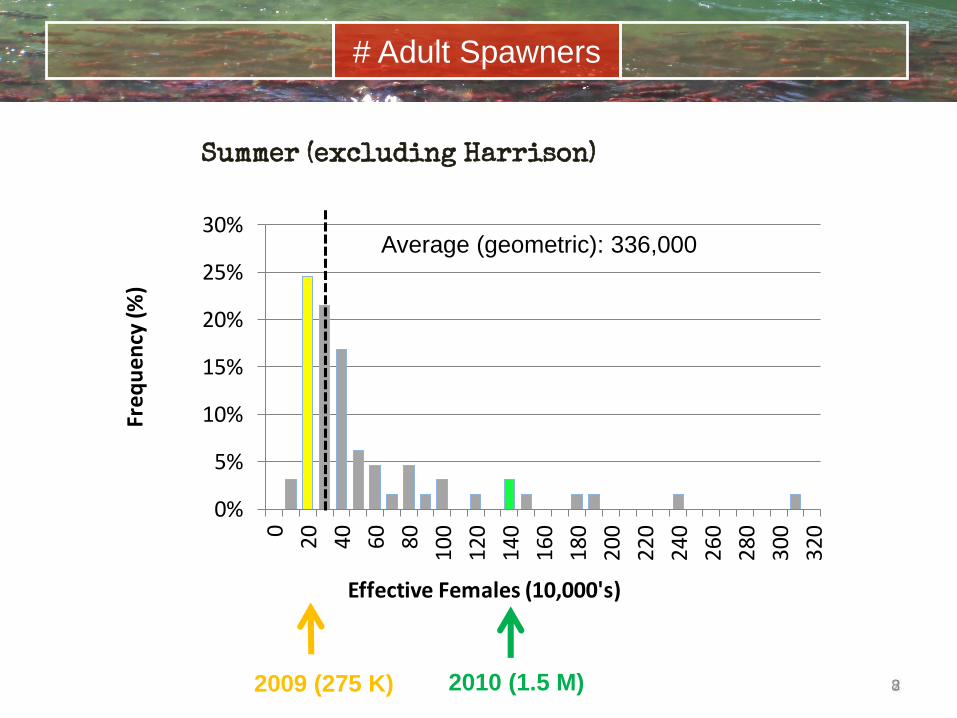
Summer (excluding Harrison)
2010 (1.5 M)2009 (275 K)
Average (geometric): 336,000
# Adult Spawners

0%
10%
20%
30%
40%
50%
60%
0
20
40
60
80
100
120
140
160
180
200
220
240
260
280
300
320
Fre
qu
en
cy (
%)
Effective Females (10,000's)
0%
10%
20%
30%
40%
50%
60%
0
20
40
60
80
100
120
140
160
180
200
220
240
260
280
300
320
Fre
qu
en
cy (
%)
Effective Females (10,000's)
0%
10%
20%
30%
40%
50%
60%
0
20
40
60
80
100
120
140
160
180
200
220
240
260
280
300
320
Fre
qu
en
cy (
%)
Effective Females (10,000's)
9
Late
2010 (3.2 M)2009 (68K)
Average (geometric): 125,000
# Adult Spawners

0%
10%
20%
30%
40%
50%
60%0
25
50
75
100
125
150
175
200
225
250
275
300
325
350
375
400
Fre
qu
en
cy (
%)
Effective Females (1,000's)
0%
10%
20%
30%
40%
50%
60%0
25
50
75
100
125
150
175
200
225
250
275
300
325
350
375
400
Fre
qu
en
cy (
%)
Effective Females (1,000's)
0%
10%
20%
30%
40%
50%
60%0
25
50
75
100
125
150
175
200
225
250
275
300
325
350
375
400
Fre
qu
en
cy (
%)
Effective Females (1,000's)
10
Harrison
2010 (400K)
Average (geometric): 6,000
2011 (400K)
# Adult Spawners
11
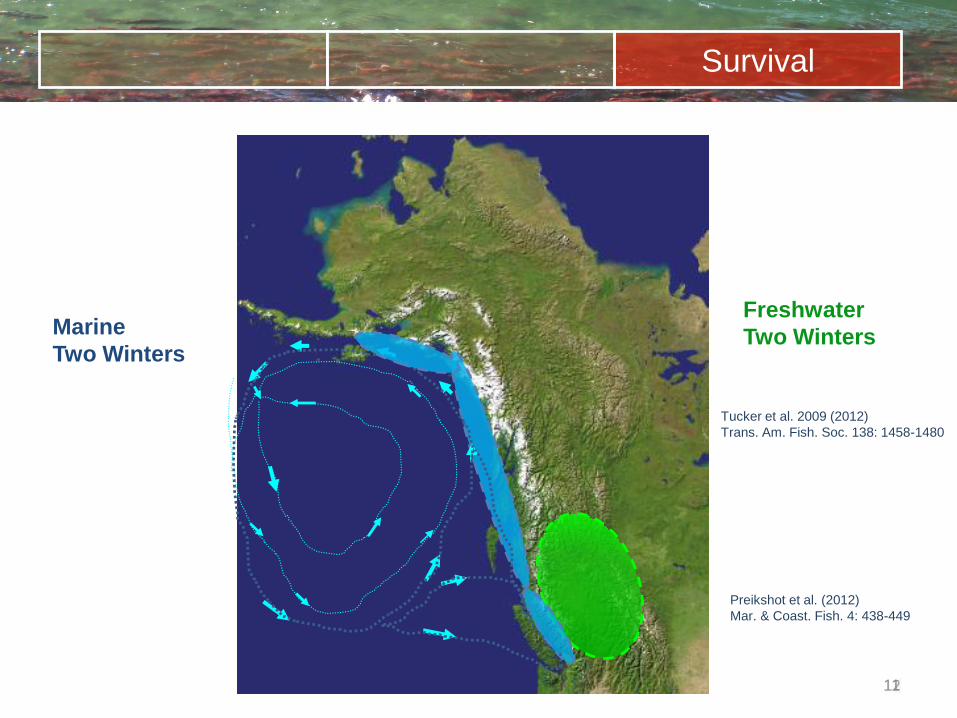
Marine
Two Winters
Freshwater
Two Winters
Survival
Preikshot et al. (2012)
Mar. & Coast. Fish. 4: 438-449
Tucker et al. 2009 (2012)
Trans. Am. Fish. Soc. 138: 1458-1480
12
Forecast Background

13
Sue’s gratuitous Olympics Image
Clara Hughes: pre-season Clara Hughes: in-season
frame out the range of fishing opportunities over different stock survival conditions
Bayesian priors for in-season run size estimation models. The have a diminishing influence as more stock-specific in-season data become available
Forecast distributions are used for the following:
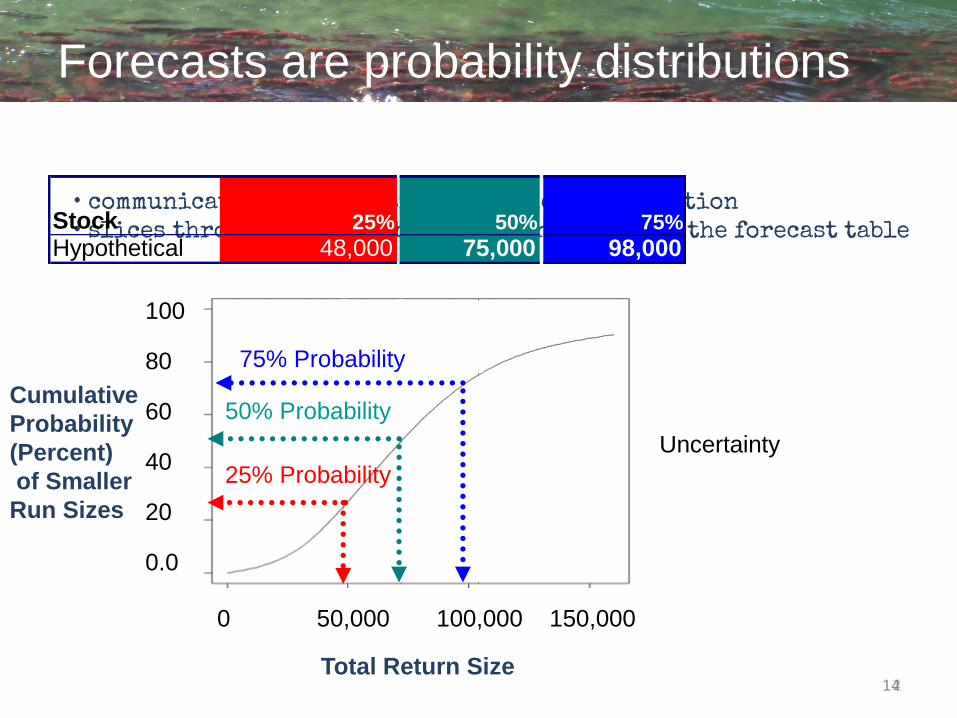
• communicated in cumulative frequency distribution• slices through the probability distribution in the forecast table
Hypothetical 48,000Stock 25%
Forecasts are probability distributions
14
100
80
60
40
20
0.0
0 50,000 100,000 150,000
Total Return Size
Cumulative
Probability
(Percent)
of Smaller
Run Sizes
25% Probability
50% Probability
75% Probability
75,00050%
98,00075%
Uncertainty
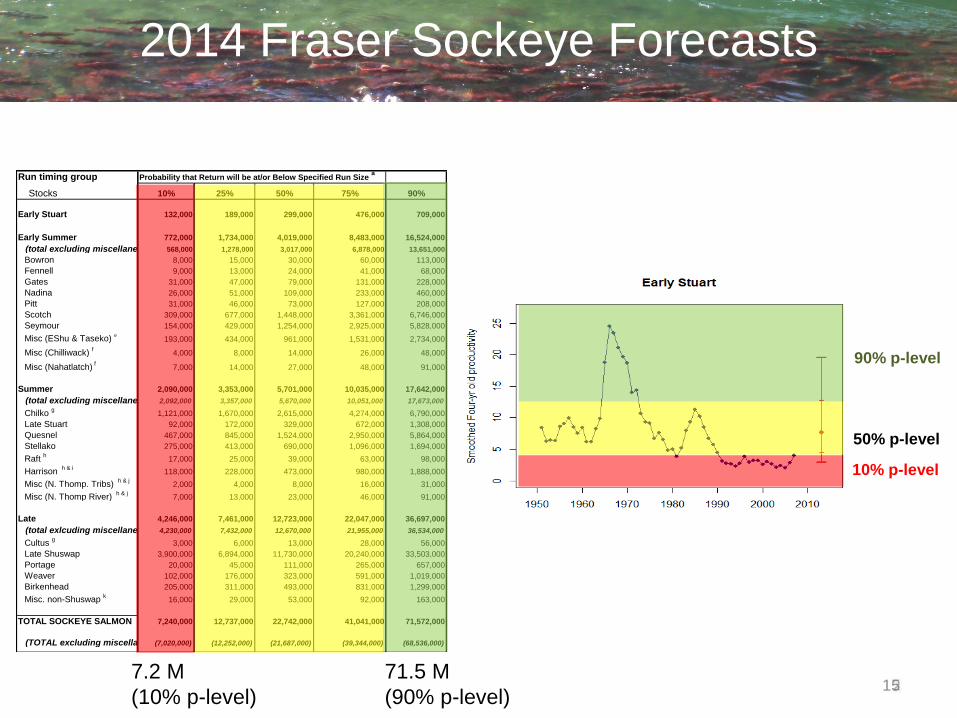
Run timing group StocksProbability that Return will be at/or Below Specified Run Size a
Stocks 10% 25% 50% 75% 90%
Early Stuart 132,000 189,000 299,000 476,000 709,000
Early Summer 772,000 1,734,000 4,019,000 8,483,000 16,524,000
(total excluding miscellaneous) 568,000 1,278,000 3,017,000 6,878,000 13,651,000
Bowron 8,000 15,000 30,000 60,000 113,000
Fennell 9,000 13,000 24,000 41,000 68,000
Gates 31,000 47,000 79,000 131,000 228,000
Nadina 26,000 51,000 109,000 233,000 460,000
Pitt 31,000 46,000 73,000 127,000 208,000
Scotch 309,000 677,000 1,448,000 3,361,000 6,746,000
Seymour 154,000 429,000 1,254,000 2,925,000 5,828,000
Misc (EShu & Taseko) e
193,000 434,000 961,000 1,531,000 2,734,000
Misc (Chilliwack) f
4,000 8,000 14,000 26,000 48,000
Misc (Nahatlatch) f
7,000 14,000 27,000 48,000 91,000
Summer 2,090,000 3,353,000 5,701,000 10,035,000 17,642,000
(total excluding miscellaneous) 2,092,000 3,357,000 5,670,000 10,051,000 17,673,000
Chilko g
1,121,000 1,670,000 2,615,000 4,274,000 6,790,000
Late Stuart 92,000 172,000 329,000 672,000 1,308,000
Quesnel 467,000 845,000 1,524,000 2,950,000 5,864,000
Stellako 275,000 413,000 690,000 1,096,000 1,694,000
Raft h
17,000 25,000 39,000 63,000 98,000
Harrison h & i
118,000 228,000 473,000 980,000 1,888,000
Misc (N. Thomp. Tribs) h & j
2,000 4,000 8,000 16,000 31,000
Misc (N. Thomp River) h & j
7,000 13,000 23,000 46,000 91,000
Late 4,246,000 7,461,000 12,723,000 22,047,000 36,697,000
(total exlcuding miscellaneous) 4,230,000 7,432,000 12,670,000 21,955,000 36,534,000
Cultus g
3,000 6,000 13,000 28,000 56,000
Late Shuswap 3,900,000 6,894,000 11,730,000 20,240,000 33,503,000
Portage 20,000 45,000 111,000 265,000 657,000
Weaver 102,000 176,000 323,000 591,000 1,019,000
Birkenhead 205,000 311,000 493,000 831,000 1,299,000
Misc. non-Shuswap k
16,000 29,000 53,000 92,000 163,000
TOTAL SOCKEYE SALMON 7,240,000 12,737,000 22,742,000 41,041,000 71,572,000
(TOTAL excluding miscellaneous)(7,020,000) (12,252,000) (21,687,000) (39,344,000) (68,536,000)
15
10% p-level
90% p-level
50% p-level
7.2 M
(10% p-level)
71.5 M
(90% p-level)
2014 Fraser Sockeye Forecasts
Run timing group StocksProbability that Return will be at/or Below Specified Run Size a
Stocks 10% 25% 50% 75% 90%
Early Stuart 107,000 165,000 255,000 426,000 645,000
Early Summer 264,000 443,000 739,000 1,338,000 2,284,000
Summer 2,858,000 4,914,000 8,677,000 16,071,000 31,813,000
Late (excl Harrison) 294,000 471,000 838,000 1,456,000 2,502,000
(Harrison Only) 33,000 46,000 69,000 160,000 373,000
TOTAL 3,556,000 6,039,000 10,578,000 19,451,000 37,617,000
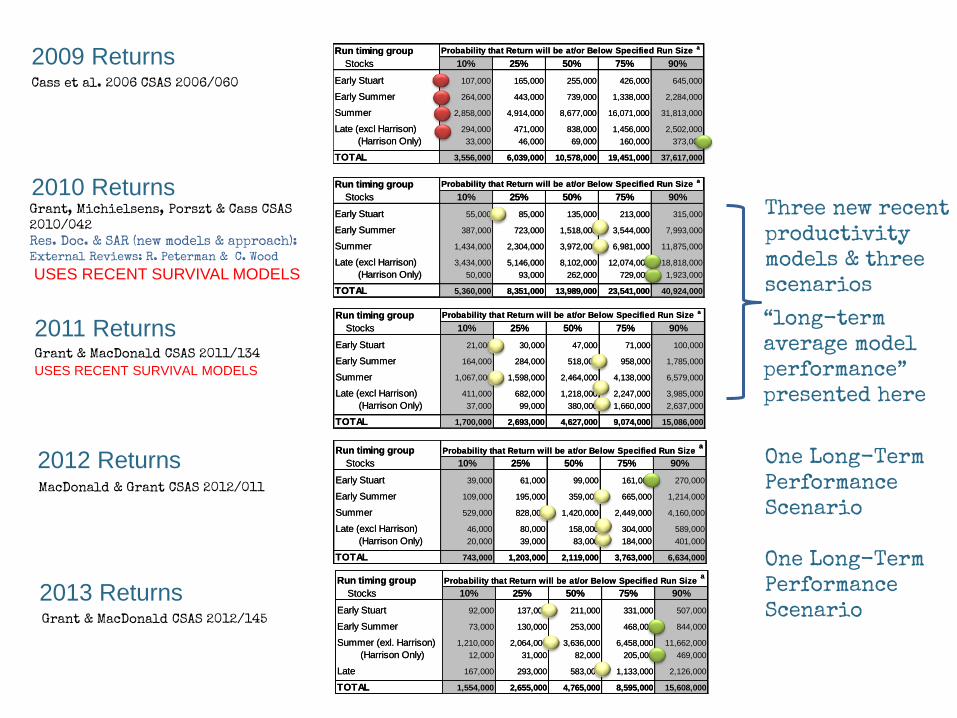
2013 Forecasts
2009 Returns
2010 Returns
2011 Returns
2012 Returns
Three new recent productivity models & three scenarios
“long-term average model performance” presented here
One Long-Term Performance Scenario
Grant, Michielsens, Porszt & Cass CSAS 2010/042Res. Doc. & SAR (new models & approach): External Reviews: R. Peterman & C. Wood
USES RECENT SURVIVAL MODELS
Grant & MacDonald CSAS 2011/134
USES RECENT SURVIVAL MODELS
MacDonald & Grant CSAS 2012/011
Cass et al. 2006 CSAS 2006/060
2013 ReturnsGrant & MacDonald CSAS 2012/145
One Long-Term Performance Scenario
Run timing group StocksProbability that Return will be at/or Below Specified Run Size a
Stocks 10% 25% 50% 75% 90%
Early Stuart 107,000 165,000 255,000 426,000 645,000
Early Summer 264,000 443,000 739,000 1,338,000 2,284,000
Summer 2,858,000 4,914,000 8,677,000 16,071,000 31,813,000
Late (excl Harrison) 294,000 471,000 838,000 1,456,000 2,502,000
(Harrison Only) 33,000 46,000 69,000 160,000 373,000
TOTAL 3,556,000 6,039,000 10,578,000 19,451,000 37,617,000
Run timing group StocksProbability that Return will be at/or Below Specified Run Size a
Stocks 10% 25% 50% 75% 90%
Early Stuart 55,000 85,000 135,000 213,000 315,000
Early Summer 387,000 723,000 1,518,000 3,544,000 7,993,000
Summer 1,434,000 2,304,000 3,972,000 6,981,000 11,875,000
Late (excl Harrison) 3,434,000 5,146,000 8,102,000 12,074,000 18,818,000
(Harrison Only) 50,000 93,000 262,000 729,000 1,923,000
TOTAL 5,360,000 8,351,000 13,989,000 23,541,000 40,924,000
Run timing group StocksProbability that Return will be at/or Below Specified Run Size a
Stocks 10% 25% 50% 75% 90%
Early Stuart 21,000 30,000 47,000 71,000 100,000
Early Summer 164,000 284,000 518,000 958,000 1,785,000
Summer 1,067,000 1,598,000 2,464,000 4,138,000 6,579,000
Late (excl Harrison) 411,000 682,000 1,218,000 2,247,000 3,985,000
(Harrison Only) 37,000 99,000 380,000 1,660,000 2,637,000
TOTAL 1,700,000 2,693,000 4,627,000 9,074,000 15,086,000
Run timing group StocksProbability that Return will be at/or Below Specified Run Size a
Stocks 10% 25% 50% 75% 90%
Early Stuart 39,000 61,000 99,000 161,000 270,000
Early Summer 109,000 195,000 359,000 665,000 1,214,000
Summer 529,000 828,000 1,420,000 2,449,000 4,160,000
Late (excl Harrison) 46,000 80,000 158,000 304,000 589,000
(Harrison Only) 20,000 39,000 83,000 184,000 401,000
TOTAL 743,000 1,203,000 2,119,000 3,763,000 6,634,000
Run timing group StocksProbability that Return will be at/or Below Specified Run Size a
Stocks 10% 25% 50% 75% 90%
Early Stuart 92,000 137,000 211,000 331,000 507,000
Early Summer 73,000 130,000 253,000 468,000 844,000
Summer (exl. Harrison) 1,210,000 2,064,000 3,636,000 6,458,000 11,662,000
(Harrison Only) 12,000 31,000 82,000 205,000 469,000
Late 167,000 293,000 583,000 1,133,000 2,126,000
TOTAL 1,554,000 2,655,000 4,765,000 8,595,000 15,608,000
Run timing group StocksProbability that Return will be at/or Below Specified Run Size a
Stocks 10% 25% 50% 75% 90%
Early Stuart 39,000 61,000 99,000 161,000 270,000
Early Summer 109,000 195,000 359,000 665,000 1,214,000
Summer 529,000 828,000 1,420,000 2,449,000 4,160,000
Late (excl Harrison) 46,000 80,000 158,000 304,000 589,000
(Harrison Only) 20,000 39,000 83,000 184,000 401,000
TOTAL 743,000 1,203,000 2,119,000 3,763,000 6,634,000
Run timing group StocksProbability that Return will be at/or Below Specified Run Size a
Stocks 10% 25% 50% 75% 90%
Early Stuart 92,000 137,000 211,000 331,000 507,000
Early Summer 73,000 130,000 253,000 468,000 844,000
Summer (exl. Harrison) 1,210,000 2,064,000 3,636,000 6,458,000 11,662,000
(Harrison Only) 12,000 31,000 82,000 205,000 469,000
Late 167,000 293,000 583,000 1,133,000 2,126,000
TOTAL 1,554,000 2,655,000 4,765,000 8,595,000 15,608,000

17
2014 Forecasts

50%
2014 Fraser Sockeye Forecasts
18
75%25% 90%10%
132 K - 709 K
Early Summer
730 K – 16.8 M
2.1 M – 17.8 M
4.3 M – 37.2 M
132K – 709 K
Late
0 5,000,000 10,000,000 15,000,000 20,000,000 25,000,000 30,000,000 35,000,000 40,000,000
Summer
0 5,000,000 10,000,000 15,000,000 20,000,000
Early Stuart
7.3 M – 72.5 M
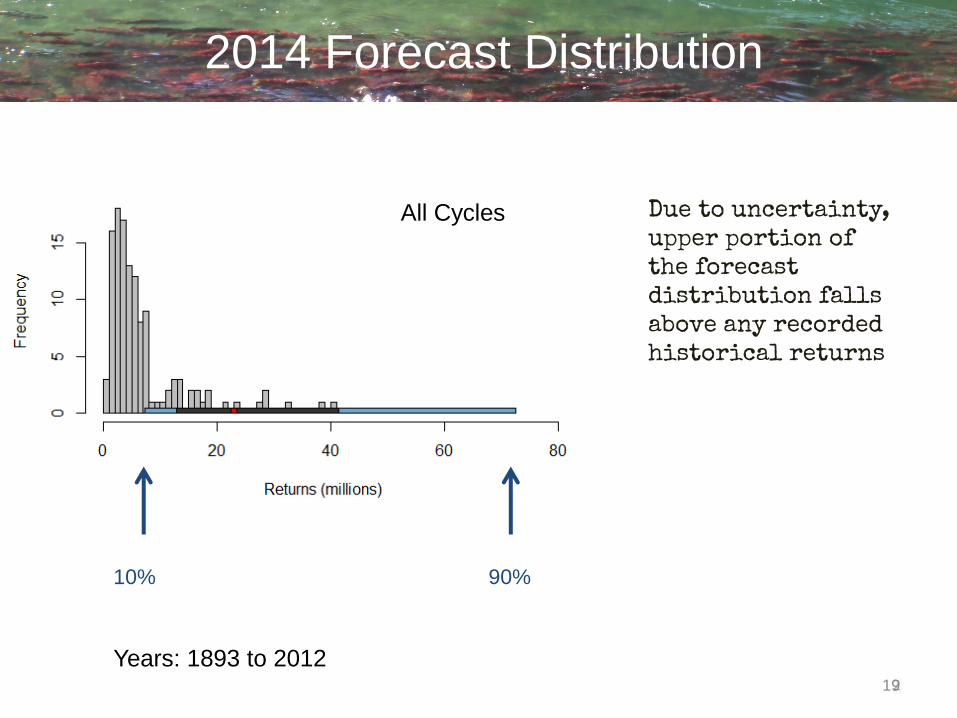
19
2014 Forecast Distribution
Due to uncertainty, upper portion of the forecast distribution falls above any recorded historical returns
All Cycles
10% 90%
Years: 1893 to 2012
20
Important Messages
• The return in 2014 is generally expected to be above cycle average (nearly 3 in 4 chance the return will be above average)
• The 2014 forecast distribution falls much higher than recorded historical returns at the upper end of the distribution (above the 75% p-level)
• Late Shuswap, Chilko, Quesnel, Scotch, and Seymour make up 85% of the forecasted return
• Forecasts are particularly uncertain for 2014, because for multiple driving stocks forecast models are being extrapolated outside their fitted range
• However juvenile data support model forms that predict overcompensation at high spawner abundances
• Sibling data also provide some support for forecasts
DFO CSAS Special Science Response
Contributors
Bronwyn MacDonald & Sue Grant DFO
Mike Lapointe & Catherine Michielsens PSC
Ann-Marie Huang & Timber Whitehouse DFO
Mike Staley IAS Ltd.
Aaron Dufault WA Dept. Fish & Wildlife