pre-ipo analyst coverage: hype or information … analyst coverage: hype or information production?...
TRANSCRIPT
Pre-IPO Analyst Coverage: Hype or Information Production?∗
Chunxin Jia Guanghua School of Management
Peking University
Jay R. Ritter Warrington College of Business
University of Florida
Zhen Xie School of Economics
Shanghai University of Finance and Economics
Donghang Zhang
Moore School of Business University of South Carolina
December 9, 2017
Abstract
Using a sample of China’s IPOs, we find that analyst coverage and earnings forecast optimism for an IPO before it starts trading have a positive impact on its offer price revision and first-day return. Pre-IPO analyst research is also positively associated with IPO long-run returns. Analysts with connections to the underwriter are more likely to cover an IPO and tend to provide more optimistic earnings forecasts. But the positive impact of pre-IPO analyst research on IPO pricing remains if connected analysts are excluded. Unlike the U.S. and other markets, offer price revisions are negatively related to initial returns in China. Keywords: Analysts, IPOs, Primary Market, Offer Price Revision, Underpricing, China JEL classification: G14, G15, G18, G24
∗ Jia can be reached at [email protected], Ritter can be reached at [email protected] or (352) 846-2837, Xie can be reached at [email protected], and Zhang can be reached at [email protected] or (803) 777-0242. Jia acknowledges the financial support from Natural Science Foundation of China (71673006), and Zhang acknowledges the financial support from the Governor Hodges Fellow program and the Wang Initiative at the Moore School of Business, University of South Carolina. We thank Mark Gruskin, Kathleen Hanley, Greg Niehaus, Rik Sen, Feng Zhang, and Ning Zhu for helpful comments. Kang Chen provided excellent research assistance.
Pre-IPO Analyst Coverage: Hype or Information Production?
Abstract
Using a sample of China’s IPOs, we find that analyst coverage and earnings forecast optimism for an IPO before it starts trading have a positive impact on its offer price revision and first-day return. Pre-IPO analyst research is also positively associated with IPO long-run returns. Analysts with connections to the underwriter are more likely to cover an IPO and tend to provide more optimistic earnings forecasts. But the positive impact of pre-IPO analyst research on IPO pricing remains if connected analysts are excluded. Unlike the U.S. and other markets, offer price revisions are negatively related to initial returns in China. Keywords: Analysts, IPOs, Primary Market, Offer Price Revision, Underpricing, China JEL classification: G14, G15, G18, G24
1
1. Introduction
Initial public offerings (IPOs) are persistently underpriced around the world. An
important reason for the persistent underpricing for both developing and developed markets is
information asymmetry. Analysts are known to play an important role in producing and
disseminating information in the securities markets. Yet for IPOs, an important question remains
unanswered: Can primary market (pre-IPO) analyst research help improve the pricing of IPOs?
In the U.S., pre-IPO coverage by affiliated analysts has generally been prohibited, and pre-IPO
analyst coverage has been almost non-existent. In China, however, pre-IPO research by
unaffiliated analysts is the norm. We use China’s IPOs to address this question and shed light on
the role of analysts in the primary market for IPOs.
Pre-IPO analyst research can either help or hinder IPO price discovery. On the one hand,
analysts can produce information and hence help the IPO market function more efficiently. On
the other hand, because IPOs are less well known, biased analyst research can also be used to
hype a stock and mislead the public about the valuation of an IPO. To balance out these two
opposite possibilities, quiet period restrictions existed in the U.S. market until their abolition for
most IPOs in the April 2012 JOBS (Jumpstart Our Business Startups) Act. These restrictions
prohibited issuing firms and their underwriters from publishing opinions concerning valuation
and from making forward-looking statements regarding earnings, revenues, and similar items
that are not in the written prospectus. The quiet period for a U.S. IPO, which starts from the time
a firm is “in registration”, has varied from 25 to 40 calendar days after the IPO until recently.1
Whether the quiet period restrictions provide the proper balance between information
production and hype remains debatable. Indeed, the 2012 Facebook IPO started a new round of
debate about this regulation. During the days leading to the offering of Facebook shares, analysts
at Facebook’s underwriters, including Morgan Stanley, Goldman Sachs, and J.P. Morgan, cut
revenue forecasts. They did not reveal this cut to the public, in compliance with the quiet period
restriction.2 After the IPO, Facebook experienced price declines and individual investors lost a
1 For more details about the quiet period restrictions in the U.S., see NASD Rule 2711 and NYSE Rule 472. Note that the 40-day quiet period does not apply to “Emerging Growth Company” (EGC) IPOs after April 2012, when the JOBS Act was signed into law, abolishing quiet period restrictions for these IPOs. More information can be found at the Financial Industry Regulatory Authority, Inc. (“FINRA”) website (see, e.g., http://www.finra.org/Industry/Regulation/RuleFilings/2012/P180831 and the links therein). The regulatory restrictions also apply to oral statements to the general public. Oral statements made to institutional investors are permissible. Note that the quiet period restrictions in the U.S. do not prevent unaffiliated brokers, investment banks, and other research houses from publishing their research on an IPO. In September 2015, FINRA Rule 2215 became effective, reducing the quiet period to end 10 calendar days after the IPO. 2 See Poornima Gupta and Alexei Oreskovic, “The numbers on the Facebook earnings revisions,” Reuters (May 22, 2012). Note
2
large amount of money, prior to the stock increasing to above its offer price a year later. Many
argue that the quiet period restrictions could “provide institutional investors with an
informational advantage over ordinary investors” and “inhibit price discovery in the IPO
process”.3 As a response to such concerns, including inquiries from the U.S. Congress, as well
as a part of the rulemaking for implementing the JOBS Act, the U.S. Securities and Exchange
Commission (SEC) and FINRA have issued new rules governing communications during IPOs.4
How to encourage and regulate information production, including analyst research, on IPOs in
the primary market is still of importance, as it probably always has been.
It is challenging to evaluate the potential impact of pre-IPO analyst research in the U.S.
market since to date few analysts publish their research before a firm’s IPO. Note that, although
the quiet period restrictions were lifted or relaxed in 2012 and 2015, industry practice continues
to be that unaffiliated analysts generally do not initiate coverage, and affiliated analysts wait 25
days before initiating coverage, for IPOs in the U.S. It is beyond the scope of this paper, but we
suspect that path dependency plays a role in such practices and changes will happen slowly.
Pre-IPO research coverage, however, is very active for China’s IPOs. For the 859 Chinese IPOs
in our sample, the average number of brokers with an analyst covering a stock before its first
trading day is 10.63, and it ranges from zero to 28 brokers. This active pre-IPO research
coverage provides a unique opportunity for researchers to shed light on the role of analysts in the
primary markets for arguably one of the most opaque security types – IPOs. More specifically,
we try to answer some simple yet fundamental questions: Does primary market analyst research
matter? If analysts indeed have significant influence over IPO pricing, do they do more good
than harm? That is, do they produce information, or do they mostly just hype the stock?
We acquire detailed information on analyst research for 859 IPOs in the Chinese market
from 2009 to 2012. There are three key dates for an IPO in China: the file date, the offer date,
and the listing date. The three dates refer to when the IPO is filed with the China Securities
Regulatory Commission (CSRC, China’s counterpart to the U.S. SEC), when the offer price and
allocation are determined, and when the stock starts trading, respectively. Unlike IPOs in the
U.S., for which there is only one evening between offering and listing/trading, there are typically
a few days between the offer date and the listing date for China’s IPOs. In order to differentiate
that many institutional clients were informed of the updated forecast via the phone in private, and this practice is legal. 3 See page 17 of former SEC Chairman Mary Schapiro’s letter to Congressman Darrell Issa on August 23, 2012. 4 See https://www.sec.gov/spotlight/jobs-act.shtml for more information on the JOBS Act.
3
the effects of analyst research on offer price and initial returns, we categorize pre-IPO analyst
reports into pre- and post-offer date reports. We do not include reports issued after the listing
date. It is likely that only the reports issued before the offer date affect the offer price, and the
reports issued on or before the listing date can have an effect on initial returns. Accordingly, we
construct measures of pre- and post-offer date analyst coverage and optimism, where coverage is
measured using the number of brokers providing research, and optimism is computed as the
negative of the industry-adjusted P/E ratio based on earnings forecasts. We use the negative of
the industry-adjusted P/E ratio since a more optimistic earnings forecast results in a lower P/E
ratio. Unlike the U.S., for our sample period, the CSRC requires that IPO candidates have
positive pre-IPO earnings, and it is rare for analysts to forecast negative earnings, allowing our
use of P/E ratios.
We first examine how analyst coverage and optimism affect offer price revisions. Offer
price revision, also referred to as price adjustment, for an IPO is defined as the percentage
change from the expected offer price to the final offer price (Hanley (1993)). After controlling
for firm and issue characteristics, we find that both pre-offer date analyst coverage and optimism
have statistically significant positive impacts on offer price revisions. Our estimates indicate that
an increase of 3.61 brokers (one standard deviation) covering a stock prior to the offer date will
result in a 5.13% to 11.31% increase in the offer price. For pre-offer date optimism, a
one-standard-deviation increase (0.66), reflecting a higher earnings forecast, in the negative of
the industry-adjusted P/E ratio measure leads to a 48% higher offer price. All these estimates are
statistically significant. Economically, these estimates suggest a substantial economic impact of
analyst coverage on the offer price. For example, the 5.13% to 11.31% increase in offer price
with an increase of analyst coverage by 3.61 brokers represents an increase of 43.7 to 96.5
million Chinese Yuan in offer proceeds for an average IPO in our sample.5
Another measure for IPO pricing is the first-day return, which is the return from the offer
price to the first-day market closing price. We use first-day return, underpricing, and initial
return interchangeably in the paper. We find that the post-offer date number of analysts covering
an IPO has an insignificant impact on initial returns. The coefficients on post-offer date
optimism are positive and statistically significant at the one percent level in regressions with
initial return as the dependent variable. Economically, a one standard deviation increase in this 5 The increase of 43.74 million Chinese Yuan in offer proceeds equals U.S. $6.96 million based on the exchange rate Chinese ¥6.2855/US $ at the end of 2012.

4
optimism measure implies that the first-day return will be 5.5% higher (e.g., from 35.1%, which
is the mean, to 40.6%).
An interesting and important result for IPOs in China is the association between offer
price revisions and initial returns. For IPOs in the U.S. and many other markets, a more positive
price revision is a reliable predictor of a higher first-day return. This empirical pattern is the
well-known partial adjustment phenomenon (Benveniste and Spindt (1989), Hanley (1993),
Loughran and Ritter (2002), and İnce (2014)). For the 859 IPOs in our sample, the offer price
revision has a statistically significant negative effect on initial returns, suggesting that the offer
price adjustment is largely complete in China,
The absence of a partial adjustment phenomenon for Chinese IPOs is, we posit, due to
share allocation rules. Unlike in most countries, the lead underwriter for an IPO in China cannot
allocate underpriced shares to its preferred clients for the IPOs in our sample. This lack of
discretion suggests that agency issues causing underpricing, as discussed in Loughran and Ritter
(2002), Reuter (2006), and Nimalendran, Ritter, and Zhang (2007), are not a significant concern
in China because the underwriter has less opportunity to engage in rent-sharing with its clients.
From an information acquisition perspective, the negative relationship between price adjustment
and initial returns also suggests that discretion over both offer price and allocations is needed for
the underwriter to use underpricing to induce information revelation by institutional investors
(Benveniste and Spindt (1989) and Benveniste and Wilhelm (1990)). Our results on the absence
of offer price partial adjustment thus provide useful insight into the importance of IPO share
allocation rules for the agency and information production-related theories of IPO underpricing.
Our results reject the Edelen and Kadlec (2005) opportunity cost explanation of the partial
adjustment pattern.
Another ancillary but important empirical contribution of this paper is the construction of
the measure for the expected offer price, which is often used as the starting point for information
production in the primary market. For U.S. IPOs, the literature uses the mid-point of the file
price as the expected offer price before the underwriter does the road show and collects
information from investors. In China, the issuing firm and its underwriter do not report such
price ranges in their initial filings with the CSRC. Instead, an IPO registration in China contains
detailed information on the proposed investment project(s) that the IPO proceeds will be used for.
In other words, the proposed investments essentially provide an estimate (albeit a biased estimate)
5
of the proceeds that the issuing firm expects to raise for the IPO. We then divide the proposed
investments by the number of shares for the IPO to get the expected offer price. Because of the
lack of file price ranges, it has been challenging to deal with price adjustments for Chinese IPOs.
Our expected offer price measure fills this important measurement gap.
The number of analysts covering an IPO and their earnings forecasts may be affected by
how “hot” an IPO is expected to be, resulting in an endogeneity bias. In 2SLS regressions, we
control for this potential bias and find that our OLS results are robust. More importantly, the full
adjustment of the offer price to an increase in the number of analysts results in the number of
analysts not being related to initial returns in our sample. Thus, there is no reverse causality
problem resulting from high initial returns attracting more analyst coverage.
Our results suggest that pre-IPO analyst research has significant influences on the pricing
of IPOs. But do analysts produce new information, or do they just aggregate public information
and try to hype the stock? Furthermore, will the lead underwriter of an IPO use its connections to
boost analyst coverage for its IPO? Will such connections result in more optimistic research?
These issues are important to assess the tradeoff underlying IPO quiet period regulations since
the goal of the regulations is to encourage information production but limit market manipulation.
We shed light on these issues with three different sets of results.
First, we decompose analyst coverage and their earnings forecast optimism into a
predicted component and a residual component. The predicted component is based on historical
analyst measures of IPOs by the same lead underwriter and in the same industry, in addition to
publicly available information about the current IPO. We attribute the residual component to
analysts’ private information. We find that any significant impacts on IPO pricing for pre-IPO
analyst research, including both pre- and post-offer date analyst coverage and optimism based on
earnings forecasts, only come from the residual components. This finding suggests that analysts
do produce information in their pre-IPO research and analysts’ impact of IPO pricing mainly
comes from their information production.
Second, we calculate the one-, two-, and three-year buy-and-hold returns (BHRs) for
IPOs in our sample starting from the end of the first month after trading started. We find that
pre-IPO analyst research has some predictive power for IPO long-run returns. The coefficients
on pre-IPO analyst coverage (post-offer date) are positive and statistically significant when it is
used to predict the one- and two-year BHRs. The market is unlikely to underreact to hype in the
6
long-run. Thus, the positive relation between pre-IPO analyst coverage and long-run returns
again suggests that the pre-IPO analyst research produces information.
Finally, we use cross-ownership among investment banks to examine how such
cross-ownership affects analyst coverage on IPOs. It is common for China’s investment banks to
have cross-ownership – one shareholder can own one investment bank while being a large
shareholder of another investment bank. We call analysts who are affiliated with investment
bank A Relationship Analysts for investment bank B if investment banks A and B have such
cross-ownership. If hype is a concern for pre-IPO analyst coverage, it is more likely to happen
with relationship analysts because quid pro quos can be more easily coordinated with connected
banks. We indeed find that relationship analysts are more likely to cover an IPO underwritten by
a connected investment bank before the offer date, and their coverage is more optimistic. But if
we remove all research coverage from relationship analysts, the effects of analyst coverage on
offer price revisions and initial returns remain positive and statistically significant. This
robustness test provides further support for the idea that pre-IPO analyst research is
informational, although hype also is likely to exist.
Primary market information production is critical for the pricing of IPOs, and to the best
of our knowledge, our paper is the first to examine comprehensively the impact of publicly
available analyst research on IPO pricing in the primary market. The literature suggests that
pre-IPO trading, which exists for some European and Asian markets and is largely driven by
retail investors, can be informative (Lӧffler, Panther, and Theissen (2005), Aussenegg, Pichler,
and Stomper (2006), Cornelli, Goldreich, and Ljungqvist (2006), Derrien and Kecskés (2007),
Dorn (2009), and Chang, Chiang, Qian, and Ritter (2017)). Our paper provides the first
comprehensive evidence on the role of analysts, arguably one of the most important information
providers in financial markets, in the IPO market before they are priced and traded.
We provide important new evidence for the ongoing debate about information production
for IPOs. The existing evidence on IPO analyst coverage only has an indirect connection to the
debate on such information production regulations because the existing research is based on
activities in the aftermarket after the quiet period ends (see, e.g., Michaely and Womack (1999),
Bradley, Jordan, and Ritter (2003, 2008), Cliff and Denis (2004), James and Karceski (2006),
Degeorge, Derrien, and Womack (2007), and Liu and Ritter (2011)). Our research directly
examines analyst behavior before a firm goes public.
7
The debate on IPO information production is far from being settled, and our evidence is
relevant and helpful for understanding the information production issues beyond China’s IPO
market. Although there are still many institutional differences between China and the developed
markets such as the U.S., analysts in China are also affiliated with securities firms that engage in
brokerage and investment banking services. Research analysts in China also try to balance their
own reputational concerns against pressure to attract trading and investment banking business for
their affiliated firms.6
Our evidence for China’s pre-IPO analyst research suggests that analysts’ reputational
concerns dominate and they produce useful information. This finding provides support for
promoting more primary market research in the U.S. and other markets, which is especially
useful in light of the potential impact of the JOBS Act. The early evidence suggests that most
eligible firms (emerging growth companies, or EGCs) have taken advantage of the new
regulations and reduced their information disclosure. The reduced information disclosure may
have reduced the regulatory burdens and enabled more firms to go public, but it has also resulted
in greater information asymmetries and more underpricing for these IPOs (Barth, Landsman, and
Taylor (2014), Chaplinsky, Hanley, and Moon (2017), and Dambra, Field, and Gustafson (2015)).
It would be helpful if (unaffiliated) analysts can be encouraged to step up their information
production on these EGC IPOs to fill the gap.
2. Data and Descriptive Statistics
2.1 Sample Construction
Our data are from the China Stock Market & Accounting Research (CSMAR) database
and several other sources. We start with a sample of 885 IPOs from 2009 to 2012 from the
CSMAR database. We choose the 2009-2012 sample period because until now, this period is the
only sample period for China’s IPOs during which the CSRC did not have a price/earnings ratio
cap for the IPO offer price.7 It is important for the underwriter and the issuing firm of an IPO
not to have a P/E ratio cap so that the offer price can reflect pre-IPO information production.
We then exclude 11 financial institutions, 15 firms with shares being already traded or 6 Research is generally supported by investment banking and trading activities within a brokerage or investment banking firm. See, e.g., Cliff and Denis (2003), Irvine (2001), Jackson (2005), Niehaus and Zhang (2010), and Michaely and Womack (1999) for descriptions on how research is paid for and the resulting biases in research. 7 The CSRC had used guidance and written rules or regulations to effectively limit the P/E ratio (based on offer price) for IPOs to be below certain levels up to 2008. IPOs were suspended between late 2012 and the end of 2013. After IPO activities were resumed in December 2013, the CSRC has been again using guidance to limit the P/E ratio of all IPOs to be below 23.
8
being simultaneously listed on the Hong Kong Stock Exchange (H-Shares), and five exchange
offers (exchange IPO shares for existing shares of another public company). The resulting
sample consists of 859 IPOs, with five IPOs excluded for two reasons. To investigate the
post-IPO performance of these firms, we also retrieve daily stock prices, the market index returns
(value-weighted average returns using all stocks listed on the Shanghai or Shenzhen stock
exchanges), and accounting information from the CSMAR database.
One important contribution of this paper for future research on China’s IPOs is the
construction of the expected offer price. For IPOs around the world where bookbuilding is used,
the underwriters acquire information from investors and revise the offer price accordingly. The
adjustment from initial file price (the midpoint of the file price range) to final offer price is often
used to measure such information acquisition (Hanley (1993)). For China’s IPOs, an issuing firm
and its underwriter(s) do not report any explicit price ranges in their filings with the CSRC
before the road show. This feature makes it difficult to measure information production in the
primary market for Chinese IPOs. Our reading of the prospectuses, however, suggests that the
issuing firm of an IPO always reports the proposed investment project(s) that the proceeds from
the IPO will be used for. A detailed financing plan will be included if other sources of funding
are used. Such investment proposals are approved by the appropriate government agencies
before the IPO prospectus is presented to investors during the road show. The proposed
investment amount from the IPO can thus be used as a reliable measure for the total expected
proceeds. In addition, the maximum number of shares offered for the IPO also has to be
approved by the CSRC. For all IPOs in our sample, the maximum approved number of shares
has been the final number of shares offered. We thus manually search both the preliminary and
final prospectuses for each IPO and retrieve the proposed investment amount and the approved
maximum number of shares for each IPO. We use the ratio of the two figures as a measure for
the expected offer price.8
Data on analyst research coverage are also from the CSMAR database. We only include
8 Our expected offer price measure is consistent with file price ranges when such comparisons are available due to simultaneous listings on multiple exchanges. For example, Metallurgical Corporation of China, Ltd. went public in September 2009 on both the Stock Exchange of Hong Kong (SEHK) and the Shanghai Stock Exchange (SSE). In its prospectus for the SEHK, the initial file price range is HK$ 6.16-6.81. Using the midpoint of HK$ 6.49, the company reports that the amount of expected proceeds is HK$ 15,988 million. This amount is the same as the amount of investment for the three projects reported in the prospectus for its listing on the SSE. That is, the implied offer price based on proposed investments for the IPO proceeds and number of IPO shares, which we call the expected offer price, is the same as the actual midpoint of file price range that is reported for the listing on SEHK. The prospectuses for all IPOs listed on the Shanghai and the Shenzhen Stock Exchanges can be found on CNINFO (http://www.cninfo.com.cn/information/companyinfo.html), a CSRC designated website for disclosing securities information.

9
research reports that are issued no later than the listing date of an IPO. After excluding reports
with a missing report date or identity of the broker, we have 8,863 reports covering 848 IPOs.
These reports are issued by at least 88 different brokers.9 Earnings forecasts are the most
common item in these reports. Note that firms eligible for going public in China are required to
have continuous positive earnings before the IPO.10 In contrast, Loughran and McDonald (2013)
report that only 37% of the firms in their U.S. IPO sample have positive earnings in the year
before the IPO. Our research optimism measure is calculated based on earnings forecasts for the
current fiscal year (fiscal year 1, or FY1) if the IPO offer date is at least 90 days away from the
end of FY1. If the IPO offer date is close to the current fiscal year end (within 90 days), we use
the forecasts for the next fiscal year. These forecasts are simply referred to as FY1 forecasts for
the rest of the paper. Note that our earnings forecasts are from unaffiliated analysts. Although the
regulations do not explicitly prevent the lead underwriter from issuing analyst reports before the
IPO, we see very few analyst reports from affiliated analysts.11
2.2 Variable Definitions
We study the impact of analysts on the pricing of IPOs, and our dependent variables are
two price changes (returns) for an IPO. The first dependent variable, Offer Price Revision, is
defined as the percentage change from the expected offer price to the offer price. The second
dependent variable, denoted as IR, is the initial return for an IPO and is defined as the percentage
change from the offer price to the first-day market closing price. We will briefly discuss the
constructions for the independent variables for the rest of this sub-section. A list of variable
definitions is provided in Appendix Table A1.
Our key independent variables are measures for pre-IPO analyst coverage and analyst
optimism. Following Mola and Guidolin (2009), we use the number of brokers that issue reports
during a particular period of the IPO process as a measure for the breadth of analyst coverage for
an IPO for that period.12 To study the impact of analyst coverage on offer price revisions, we use
9 The CSMAR Analyst database is similar to the I/B/E/S database. Both databases include forecasts of accounting variables for different fiscal years and stock recommendations. The CSMAR database includes the name and broker ID of the broker for each observation. We count the brokers based on the broker ID. Note that some reports do not include EPS forecasts. 10 For the Shanghai and Shenzhen exchanges, three years of positive earnings are required. For the Shenzhen ChiNext market, one year of positive earnings is required. 11 Lead underwriters do issue valuation reports before the IPO. These valuation reports were kept confidential before 2011. After 2011, the lead valuation reports are made public after the initial price inquiries and before the final offer price is set. These reports from lead underwriters are labeled differently and are not treated as analyst reports. We have a small number of regular research reports from affiliated analysts. These analyst reports are likely to be published in the gray area of the CSRC quiet period regulations. Our results remain virtually the same whether we include these reports or not. 12 If we use the number of analysts and the number of reports as our measures of coverage, the results are qualitatively the same.
10
the number of brokers that issue reports before the offer date, which we call Pre-Coverage. We
denote the number of brokers issuing reports after the offer date (but no later than the listing date)
as Post-Coverage, and the total number of brokers issuing reports until the listing date as
Overall-Coverage.13 We link both Post- and Overall-Coverage to the initial return of an IPO.
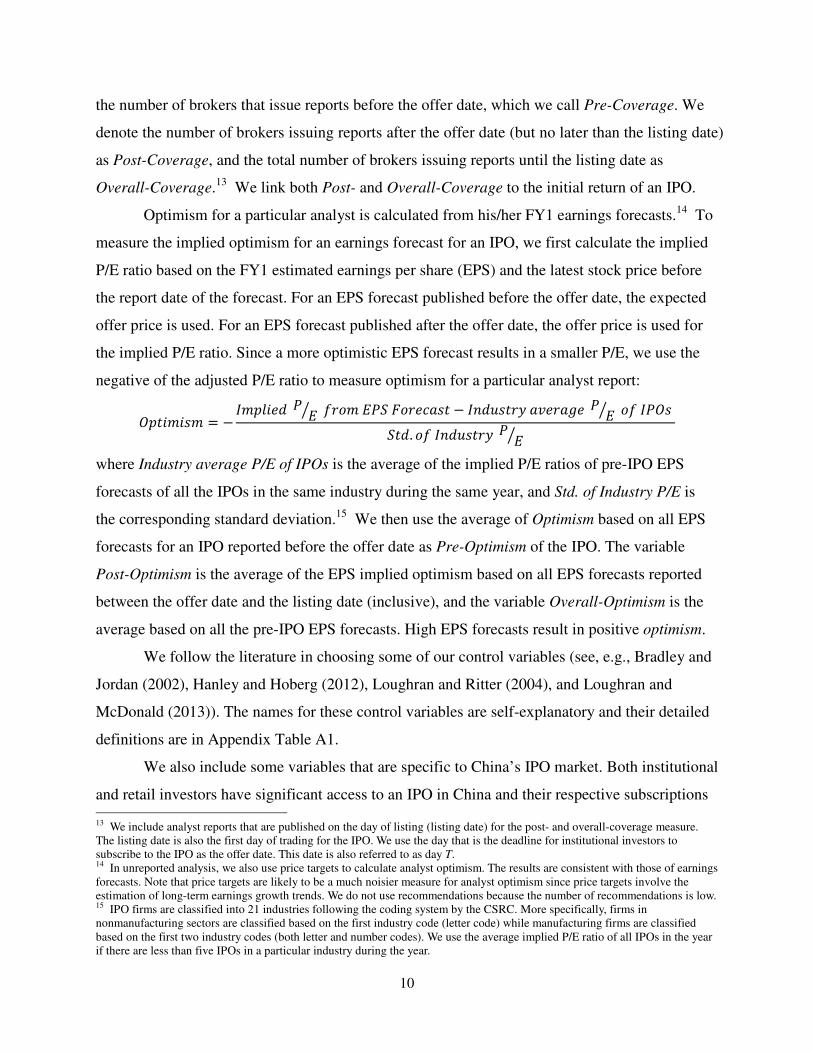
Optimism for a particular analyst is calculated from his/her FY1 earnings forecasts.14 To
measure the implied optimism for an earnings forecast for an IPO, we first calculate the implied
P/E ratio based on the FY1 estimated earnings per share (EPS) and the latest stock price before
the report date of the forecast. For an EPS forecast published before the offer date, the expected
offer price is used. For an EPS forecast published after the offer date, the offer price is used for
the implied P/E ratio. Since a more optimistic EPS forecast results in a smaller P/E, we use the
negative of the adjusted P/E ratio to measure optimism for a particular analyst report:
�������� = −����� � �� ��������������� − �������������� � �� �����
���. ��������� � ��
where Industry average P/E of IPOs is the average of the implied P/E ratios of pre-IPO EPS
forecasts of all the IPOs in the same industry during the same year, and Std. of Industry P/E is
the corresponding standard deviation.15 We then use the average of Optimism based on all EPS
forecasts for an IPO reported before the offer date as Pre-Optimism of the IPO. The variable
Post-Optimism is the average of the EPS implied optimism based on all EPS forecasts reported
between the offer date and the listing date (inclusive), and the variable Overall-Optimism is the
average based on all the pre-IPO EPS forecasts. High EPS forecasts result in positive optimism.
We follow the literature in choosing some of our control variables (see, e.g., Bradley and
Jordan (2002), Hanley and Hoberg (2012), Loughran and Ritter (2004), and Loughran and
McDonald (2013)). The names for these control variables are self-explanatory and their detailed
definitions are in Appendix Table A1.
We also include some variables that are specific to China’s IPO market. Both institutional
and retail investors have significant access to an IPO in China and their respective subscriptions 13 We include analyst reports that are published on the day of listing (listing date) for the post- and overall-coverage measure. The listing date is also the first day of trading for the IPO. We use the day that is the deadline for institutional investors to subscribe to the IPO as the offer date. This date is also referred to as day T. 14 In unreported analysis, we also use price targets to calculate analyst optimism. The results are consistent with those of earnings forecasts. Note that price targets are likely to be a much noisier measure for analyst optimism since price targets involve the estimation of long-term earnings growth trends. We do not use recommendations because the number of recommendations is low. 15 IPO firms are classified into 21 industries following the coding system by the CSRC. More specifically, firms in nonmanufacturing sectors are classified based on the first industry code (letter code) while manufacturing firms are classified based on the first two industry codes (both letter and number codes). We use the average implied P/E ratio of all IPOs in the year if there are less than five IPOs in a particular industry during the year.

11
are publicly available. To control for investor demand, we include both Ln(Offline OverSub) and
Ln(Online OverSub), which are defined as the natural logarithms of oversubscription from
institutional (offline) and retail (online) investors during the offering, respectively.16 For both
demand measures, oversubscription is calculated as the ratio of the subscription from a particular
group of investors (offline or online) divided by the total number of shares offered for that group.
SOE Central and SOE Local are dummy variables. SOE Central equals to one if the controlling
shareholder of the issuing firm is affiliated with the central government. SOE Local is defined in
a similar manner for local government shareholders. These variables are included to control for
the effect of political connections on IPO pricing (Fan, Wong, and Zhang (2007)).
2.3 Summary Statistics
We report the summary statistics on issue and firm characteristics for IPOs in our sample
in Table 1. One noticeable feature about China’s IPOs has been high initial returns. The average
initial return for the 859 IPOs in our sample from 2009 to 2012 is 35.1%. We also report the
number of IPOs and the annual average initial returns from 1992 to 2016 in Panel A of Figure 1,
and the quarterly numbers for 2009-2012 in Panel B of Figure 1. Although the average initial
return of 35.1% during 2009-2012 is greater than those in the U.S. and most other markets
(Loughran, Ritter, and Rydqvist (1994), with updated numbers available at
https://site.warrington.ufl.edu/ritter/ipo-data/), initial returns for IPOs in China have experienced
a significant decline over the years before they went back up in 2014. One of the key reasons for
the high initial returns for China’s IPOs is the price-earnings cap on the offer price by the CSRC
that existed for most of the years except for 2009-2012.
The average offer price revision, measured from the CSRC-approved proceeds per share
(i.e., the expected offer price) to the offer price, is 139.5% for the IPOs in our sample. This
average increase is much higher than the comparable U.S. figure. For example, Hanley and
Hoberg (2010) report an average price adjustment of 4.3% for the 1996-2005 period for the U.S.
market. Note that not all IPOs in our sample have positive price revisions. The minimum offer
price revision, as reported in Table 1, is -61.9%.
Also note that many state-owned enterprises had already gone public before 2006. During
our sample period of 2009 to 2012, private firms account for a large portion of IPOs. As shown
in Table 1, only 9% of the IPOs are controlled by either the central or local governments.
16 Institutional investors can participate in the online part as well, but their participation is uncommon.
12
We report the summary statistics on analyst coverage and optimism in Table 2. Our
sample only includes pre-IPO (primary market) analyst coverage. The average number of
brokers covering an IPO before listing is 10.63 (the median is 10), reflecting the unique active
primary market analyst coverage on IPOs in China. Neither Chinese nor U.S. quiet period
regulations prohibit recommendations by independent analysts. In the U.S., these reports are rare
for IPOs, whereas in China they are common. A likely reason for the difference is that both retail
and institutional investors in China do not depend on being a client of an underwriter to get an
allocation of shares in an IPO. Analysts working for the underwriters have an incentive to hype
an IPO in order to achieve a higher offer price and/or leave more money on the table if the
underwriters have allocation discretion. But all analysts have incentives to be excessively
optimistic for three other reasons (Bradley, Jordan, and Ritter (2008)). First, if issuing companies
prefer to hire investment banking firms for future deals that provide positive coverage, analysts
have an incentive to cover a company and make optimistic forecasts. Second, if management is
unwilling to talk to analysts that have a negative recommendation on the firm, a pessimistic
analyst is put at an informational disadvantage. Third, owners of a stock want an analyst to be
publicly optimistic. This latter incentive may have been especially strong in China during our
sample period because short-selling was prohibited.
Table 2 also reports analyst optimism based on FY1 EPS forecasts. Note that we use the
industry average of implied P/E ratios of all pre-IPO analyst forecasts, both before and after the
offer date, to standardize our optimism measure, so the Overall Optimism by construction has a
mean of nearly zero (-0.02 as reported in Table 2). The averages for Pre- and Post-Optimism
measures are 0.52 and -0.93, respectively. This pattern arises largely because pre- and
post-optimism measures use different prices (expected vs. actual offer price) to compute the
implied P/E ratios, while the overall average is used to standardize the two measures.17
17 We use the overall average during the same year in the same industry for standardizing the measures so that we can have more IPOs for the calculations. The mean expected offer price, which is used to calculate the implied P/E ratio for Pre-Optimism, is 11.87, and the mean offer price, which is used for the Post-Optimism calculation, is 26.43. So the means of 0.52 vs. -0.93 for Pre- and Post-Optimism implies that the pre-offer date earnings forecasts are slightly higher than the post-offer date ones. But note that our main analyses in the following sections rely on separate use of pre- and post-offer date optimism measures. The use of different base prices for the implied P/E calculations thus does not affect our results. Note that our optimism measure does not take into account of difference in growth rates between stocks. For cross-sectional comparisons, IPOs with greater growth rate will have higher prices and larger P/E ratios, which will result in lower optimism measures since analyst optimism is the negative of the adjusted P/E ratio. Because growth companies generally have more price revisions and greater underpricing, this will bias against our results.

13
3. Primary Market Analyst Research, Offer Price Revisions, and Initial Returns
The literature suggests that analyst research in the secondary markets is informative and
has impacts on stock prices and corporate activities (see, e.g., Brennan and Subrahmanyam
(1995), Kelly and Ljungqvist (2012), and Derrien and Kecskés (2013)). For the primary markets,
greater analyst following can produce more information, reduce information asymmetry, and
hence reduce a firm’s cost of capital by allowing a firm to go public at a higher offer price.
Furthermore, pre-IPO analyst coverage can also increase the stock price by increasing the
investor pool (Merton (1987) and Zhang (2004)) or by attracting more media coverage and hence
more attention from unsophisticated investors (see, e.g., Bhattacharya, Galpin, Ray, and Yu
(2009)). More optimistic coverage can induce larger demand for the stock and result in a higher
market price (see, e.g., James and Karceski (2006)). Overall, analysts can have a significant
impact on IPO pricing because of their information production, their marketing efforts, and their
access to information. We thus hypothesize that more research coverage and greater optimism
will have a positive impact on the first-day market closing price and hence a positive impact on
the initial return of an IPO if the offer price is not proportionally increased.
Since analyst research is publicly observable, the underwriter and the issuing firm can
condition the offer price on pre-issue analyst reports. In particular, when coverage is more
extensive and/or optimistic, the lead underwriter anticipates that the institutional investors will
be more willing to accept a higher offer price. Thus, we posit that an increase in analyst coverage
and optimism before the offer date will have a positive impact on offer price revisions.
In this section, we test the above hypotheses by examining the relations between pre-IPO
analyst research and offer price revisions and initial returns.
3.1 Analyst Research and Offer Price Revisions
We first investigate the relations between pre-offer date analyst coverage/optimism and
offer price revisions. The results are reported in Table 3. Regressions 1-3 focus on the relation
between offer price revisions and Pre-Coverage, which is the natural logarithm of one plus the
number of brokers covering an IPO before the offer date. Note that the definition of
Pre-Coverage in the regressions is different from that in Table 2, where it is simply the number
of brokers. Neither industry fixed effects nor year fixed effects are included in Regression (1).
Regression (2) includes year fixed effects, and Regression (3) includes both industry and year
fixed effects. The IPO market condition (IR[-30,offer], the average initial return of all IPOs that
14
were listed during the past 30 days until the offer date) and the overall market condition
(MktRet[-30,offer], the return on the composite market index for the past 30 days until the offer
date) are statistically significant in Regression (1) but not in Regressions (2) and (3), which
include year fixed effects. The negative coefficient on lagged market returns in Regression (1) is
in contrast to the positive coefficients typically found in U.S. studies.
For the other control variables, both Ln(Assets) and Ln(Expected Proceeds) are
statistically significant at the one percent level but with opposite signs. Larger firms attract
greater primary market institutional demand, presumably due to better name recognition and less
information asymmetry. This demand enables the underwriter to set a higher offer price.
Meanwhile, firms face a downward sloping demand curve, and a greater offer size (proceeds)
will induce them to set a lower offer price. The statistically negative coefficient on Overhang,
the number of shares retained divided by the number of shares offered, is also consistent with a
negatively sloped demand curve – a greater share overhang will depress the price expectation of
an IPO given that more shares will become available when share lockup expires.
Table 3 also shows that IPOs with higher earnings (higher ROE) or managed by
underwriters with a better reputation (measured as market share, Lead_MktShare) have more
positive offer price revisions. We also control for the identity of the controlling shareholder to
examine whether firms with connections to the government have greater price revisions.
Inconsistent with Fan, Wong, and Zhang (2007), however, the coefficients on SOE Central are
only statistically significant in Regression (1), while those on SOE Local are only statistically
significant in Regression (3). The coefficients on these two variables also have opposite signs.
The different impact of government ownership in Fan et al. (2007) and our regressions might be
due to the difference in how we measure political connections. Fan et al. (2007) measure
whether the CEO has political connections, and the two dummy variables that we use only
capture the political identity of the controlling shareholder.
The coefficients on the key independent variable, Pre-Coverage, are positive and
statistically significant in Regressions (1) to (3). Economically, when we control for both the
industry and the year fixed effects (Regression (3)), a one standard deviation increase in the
number of brokers covering an IPO before the offer date (3.61 brokers) from the mean (7.70
brokers) results in a 5.13% (14.77 × [ln(1 + 7.70 + 3.61) − ln(1 + 7.70)]) increase in the
offer price. For an average IPO with an expected offer price of ¥11.87 and an expected offer size

15
of 71.9 million shares, the 5.13% increase in the offer price represents an increase of 43.7 million
yuan (or US$ 7.0 million based on the 2012 exchange rate) in IPO proceeds.
We further include analyst optimism in Regressions (4) and (5). We include both industry
and year fixed effects in these two regressions. The coefficients on the control variables are
similar to those in Regression (3). The coefficient on the optimism measures are positive and
statistically significant at the one percent level, with and without controlling for the breadth of
analyst coverage. Economically, if we use Regression (5) as an example, the coefficient of 72.36
on Pre-Optimism suggests that a one-standard-deviation increase in Pre-Optimism leads to a 47.8%
(72.36×0.66) higher offer price revision. This effect is also economically significant. These
results suggest that greater analyst coverage and more optimistic research enable the lead
underwriter of an IPO to adjust the offer price further upwards.
Note that some of our variables, such as offer price revision, have high standard
deviations. To make sure that our results are robust, we also use bootstrap estimates for
calculating the standard errors and t-statistics for the regressions in Tables 3 and 4. To obtain
sufficient accuracy, we use 500 bootstrap repetitions (Andrews and Buchinsky (2000)). The
statistical significance of the coefficients on our key variables remains virtually the same.
To summarize, our results show that both analyst coverage breadth and optimism are
positively related to offer price revisions. Broader and more optimistic analyst coverage results
in a statistically significant and economically important upward revision of the offer price.
3.2 Analyst Research and Initial Returns
In this subsection we examine the relations between pre-IPO research and initial returns.
Since initial returns are measured as the price difference from the offer price to the first-day
market closing price, we distinguish analyst research before and after the offer date in studying
the relations between primary market research and initial returns.
The regression results are reported in Table 4. We include industry and year fixed effects
in all regressions. We report the baseline regression with only the control variables in Regression
(1). These control variables are generally well behaved and their coefficients are consistent with
what have been reported in the literature. Both the IPO and the overall market conditions, as
captured by IR[-30,offer] and MktRet[-30,List], have a statistically significant positive impact on
the initial returns (Lowry and Schwert (2004)). Large and profitable firms, as indicated by the
coefficients on Ln(Assets) and ROE, are less underpriced. This pattern is expected since these

16
firms are less risky and have less information asymmetry. IPOs with high investor demand and
larger oversubscriptions can have a greater price run-up on the first trading day since many
investors will not get share allocations due to oversubscription. This aftermarket demand
explains the statistically positive coefficients on Ln(Offline OverSub) and Ln(Online OverSub).
Share overhang is positively related to initial returns, albeit insignificant in Regression (1),
consistent with the U.S. evidence (Bradley and Jordan (2002)). Lead underwriter reputation as
captured by Lead_MktShare has a significantly negative impact on initial returns. IPOs
controlled by local governments are more underpriced.
The key variables of interest are the analyst related measures. In Regression (3), we
include the measure for the breadth of primary market analyst coverage after the offer date,
Post-Coverage. The variable Post-Coverage has a positive but insignificant coefficient. We
include both Post-Coverage and the measure for analyst optimism, Post-Optimism, in Regression
(5). The coefficient on Post-Optimism is positive and statistically significant at the one percent
level. The coefficient on Post-Coverage remains statistically insignificant. Economically, a one
standard deviation increase in Post-Optimism leads to an increase of 5.5% (7.80×0.70) for the
first-day return. For the IPOs in our sample, this effect represents an increase of about 15.6% of
the mean first-day return of 35.1%.
In Regressions (4) and (6), we also include the overall measures for primary market
analyst coverage and optimism, which include research reports before the offer date. The
coefficients on these overall measures are all insignificant, which is not surprising. Note that we
control for offer price revisions in all the regressions. The pre-offer date components that are
included in these overall measures add noise but have little additional information.
Another important variable of interest is the offer price revision. Three theories make
predictions regarding initial returns and offer price revisions. The mechanism design theory of
IPO underpricing states that when bookbuilding is used, underpricing is used to induce
institutional investors to reveal their information truthfully (Benveniste and Spindt (1989),
Benveniste and Wilhelm (1990), and Sherman (2005)). Hanley (1993) and numerous other
studies have documented that offer price revisions (price adjustments) are one of the most
reliable predictors for IPO first-day returns. This partial adjustment phenomenon is based on the
set-ups in markets such as the U.S. where the lead underwriter has discretionary allocation power.
Benveniste and Wilhelm show that, theoretically, both share allocation discretion and partial

17
price adjustment are needed to induce truthful information revelation from informed investors.
Put differently, without share allocation discretion, price adjustments should not be positively
related to initial returns. Lead underwriters in China do not have (or use) discretion in IPO share
allocations. Thus, the relation between price revisions and initial returns in our sample permits a
unique alternative test of the well-documented information acquisition mechanism.
The coefficients on Offer Price Revision in all regressions in Table 4 are reliably negative,
without and with including analyst related measures on the right hand side of the regressions.
Economically, the coefficients on Offer Price Revision imply a decrease of 4.32% to 6.49% in
the initial return for an IPO if its offer price revision is increased by one standard deviation
(108.11%). The statistically significant and economically important negative coefficients on
Offer Price Revision suggest that the well-documented partial adjustment phenomenon does not
exist for China’s IPO market. This non-positive relation is likely due to the fact that the lead
underwriter for an IPO in China does not control the allocation of the IPO shares and hence
cannot reward institutional investors with underpriced shares. The underwriter instead tries to
obtain a higher offer price so that its percentage spread income will be greater.18 Everything else
being equal, a higher offer price will leave less room for the price on the first trading day to go
up, resulting in a negative relationship between the offer price revision and the initial return.
From an information acquisition perspective, the negative coefficients on Offer Price
Revision is consistent with Benveniste and Wilhelm (1990), suggesting that uniform pricing and
evenhanded share distribution make information gathering from investors in the primary market
less useful. From an agency perspective, the lack of a positive coefficient on Offer Price
Revision is also consistent with the Loughran and Ritter (2002) prospect theory explanation for
the partial adjustment of offer prices, since without share allocation discretion, leaving money on
table does not generate additional revenue from rent-seeking investors. Regardless, the negative
coefficients on Offer Price Revision suggest that underwriters’ offer price adjustment behavior
changes when they do not have share allocation discretion, as is also the case for Indian IPOs
(Bubna and Prabhala (2011)).
The third theory, Edelen and Kadlec’s (2005) opportunity cost thoery, predicts that there
will be partial adjustment both when underwriters have discretion to allocate shares and when
18 Note that the lead underwriter’s incentives of increasing the offer price as we discuss here will not result in zero underpricing. The lead underwriter still has the incentive to avoid a failed IPO and investors are still compensated for taking risk in investing in an IPO. The risk-related factors are supported by the negative coefficients on Ln(Assets) and ROE.
18
they don’t, which is the Chinese case. They posit that when a firm receives positive feedback
from the market about its future profitability, the opportunity cost of a failed offering is higher,
and thus a firm will want to err on the side of leaving money on the table rather than risk a failed
offering. Using U.S. data, Ince (2014) conducts tests that he interprets as rejecting the
mechanism design and opportunity cost theories, and supporting the agency theory. Our evidence
also rejects the opportunity cost theory.
Overall, the results reported in Tables 3 and 4 suggest that greater pre-offer date analyst
coverage and optimism result in higher offer price revisions, and that post-offer date optimistic
analyst coverage has a positive impact on initial returns. These results suggest that analyst
coverage for IPOs in the primary market can significantly impact IPO pricing.
Analyst coverage can be endogenous, and our use of analyst coverage and optimism as
explanatory variables is potentially affected by the endogeneity of these variables. In the Internet
Appendix, we address this issue and report the 2SLS regression results. Our qualitative
conclusions are not affected.
4. Primary Market Analyst Research: Hype and/or Information Production?
Analysts can hype a stock. Or they can produce information. Both information production
and marketing (hype) can be useful for securities issuance. Gao and Ritter (2010) and Huang and
Zhang (2011) show that underwriters perform useful marketing functions. The recent debate on
quiet period regulations, as suggested by the correspondence between the U.S. Congress and the
SEC, focuses on encouraging more information production. The regulators are often concerned
about manipulative market hype for IPOs. The trade-off for the rule making for many SEC
regulations in the U.S., including the recent 2012 JOBS Act, is to balance these two forces. In
this and the next section, we present evidence on the existence of information production and
hype in primary market analyst research. We also try to shed light on the balance of hype and
information production with pre-IPO analyst research.
For affiliated and unaffiliated analysts, although the incentives for hyping a stock can be
different, their hype-motivated research coverage can be predictable. We thus decompose analyst
coverage and optimism into predicted and innovative components. We posit that the predicted
components of analyst coverage and optimism are more related to analyst hype, while the
innovative components can better capture their information production.
19
The underwriters of an IPO receive a certain percentage of the proceeds as fees and thus
have incentives to increase the offer price. The pro rata allocation rule means that China’s
investment banks do not have as strong an incentive for leaving money on the table as that in the
U.S., as suggested by Nimalendran, Ritter, and Zhang (2007), since all investors, not just the lead
underwriter’s clients, have equal access to the IPO shares. If the lead underwriter influences and
works with analysts from unaffiliated investment banks and brokers to provide research coverage
for its IPO, its connections and relationships are likely to be persistent. This persistence is the
rationale for us to use the past coverage to capture the impact of the lead underwriter in the first
stage regressions to decompose analyst coverage and optimism. We also use the averages for all
analyst reports on all IPOs in a particular industry during the last twelve months to capture the
market sentiment for the industry in the first stage regressions. The two measures capture the
effect of aggregating public information by analysts in their marketing efforts. Analyst hype is
likely to have a positive impact on the stock price (Aggarwal, Krigman, and Womack (2002)).
Consequently, if we use lead and industry measures to forecast research coverage and optimism
on an IPO, the predicted coverage and predicted optimism will have a positive impact on the
offer price and the market price.
Womack (1996) suggests that secondary market analyst research has investment value. It
is also reasonable to expect that analysts in China do valuable research and produce useful
information on IPOs that they cover. Unexpected research will be captured by the residual term
in the first-stage predictive regressions. We call the residual term in such predictive regressions
the innovation component of analyst research. Since the innovation component captures the
private information of analyst reports, it will be positively related to the offer price and the
market price (and initial returns) if analysts can produce useful private information.
We use the first-stage regressions in Internet Appendix Table IA1 to decompose the pre-
and post-offer date coverage and optimism measures into predicted and innovation (residual)
components. We examine how the predicted and residual components of these coverage and
optimism measures affect offer price revisions and initial returns. The regression results are
reported in Table 5. Note that the regressions in Table 5 include the same control variables as in
Table 3 (offer price revisions) or Table 4 (initial returns). The coefficients on the control
variables have similar patterns as in Tables 3 and 4 and are not reported.
In Regressions (1) – (4) in Panel A of Table 5, we regress Offer Price Revision on the

20
predicted and residual components of Pre-Coverage and Pre-Optimism. Except for the predicted
pre-offer date coverage by lead and industry and the predicted pre-offer date optimism by lead
and industry, which are marginally significant with opposite signs, the coefficients on most
predicted values of Pre-Coverage and Pre-Optimism are statistically insignificant. However,
regardless of the model specifications for decomposing analyst coverage and optimism, the
coefficients on the residual terms for both Pre-Coverage and Pre-Optimism are positive and
statistically significant at the one percent level. Put together, these results suggest that surprises
in analyst coverage and its optimistic information content increase the offer price.
In Regressions (1) – (4) in Panel B of Table 5, we examine whether the predicted and
residual components of Post-Coverage and Post-Optimism help predict the initial returns. As we
noted before, since the motivation of currying favor with the lead underwriter is less of a concern
during the post-offer date period, post-offer date coverage has little impact on initial returns in
Table 4. Both the predicted and residual components of Post-Coverage still have little effect on
the initial returns in the regressions in Panel B of Table 5. As expected, the coefficients on the
residual components, Residual Post-Optimism by LEAD&IND and Residual Post-Optimism by
LEAD, are positive and statistically significant.
Overall, the results reported in Table 5 suggest that for both analyst coverage and
earnings forecast optimism, their impact on offer price revisions and initial returns are due to the
residual components that are not expected by the market. There is little impact on IPO pricing
from predicted coverage and predicted optimism related to lead underwriter connections and
industry sentiment. Together, these results suggest that analyst research on IPOs does produce
information and reputational effects generally dominate, supportive of the relaxation of pre-IPO
communication restrictions such as those of the JOBS Act.
5. Further Evidence on Analyst Information Production: Long-Run Performance and
Relationship Analysts
Quiet period restrictions and the relaxations of such restrictions in the JOBS Act are
motivated by attempting to balance the good (information production that can help improve IPO
pricing) and the bad (hype that can mislead investors). It is likely to be challenging to quantify
the relative magnitude of hype and information production for analyst research in either the
primary or the secondary markets, especially for the subset of hype efforts that aim at misleading
21
investors. But for both investors and regulators, it would be useful to show that information
production is not a side show or dominated by hype. In this section, we shed further light on this
issue by examining two additional aspects of pre-IPO analyst research: the long-run prediction
power of primary market analyst research and the consequence of excluding research reports
from analysts affiliated with brokers that are at least partly owned by the lead underwriter.
5.1 Analyst Research and IPO Long-Run Performance
In this sub-section, we examine the relations between primary market analyst coverage
and optimism and the long-run performance of IPOs. Price reactions of analyst forecasts on the
secondary market are often incomplete and a post forecast drift is documented (Chan, Jegadeesh,
and Lakonishok (1996), Gleason and Lee (2003), and Hui and Yeung (2013)). Such a drift can
also exist in the stock returns of IPOs due to underreactions to the pre-IPO research. If analyst
research is just hype (a collection of marketing efforts), pre-IPO analyst research will have little
or negative marginal predictive power for the long-run performance of IPOs. If analyst research
contains new information, and if a forecast drift due to underreactions exists, pre-IPO research
would have a positive impact in a predictive regression of IPO long-run performance.
We use one-, two-, and three-year buy-and-hold returns (BHRs) after the IPO as the
measures for IPO long-run performance. We calculate the buy-and-hold returns for a specific
holding period (one to three years) using compounded monthly returns starting with the first
month after the IPO listing date (e.g., March for any IPO during February). As a control variable,
the market buy-and-hold returns for the same holding period are based on the value-weighted
market return of both the Shanghai and Shenzhen stock exchanges. The cumulative abnormal
return (CAR) for an IPO is calculated as the compounded monthly return differences of the IPO
and the corresponding market index for the same holding period.
We report the summary statistics of IPO long-run performance in Panel A of Table 6. The
regression results are reported in Panel B of Table 6. In Regressions (1)-(3), the dependent
variable is the one-year BHR after the IPO. We also use two- and three-year BHRs in
Regressions (4) and (5). It should be generally challenging for analysts to forecast long-run
returns beyond certain known factors. The coefficients on Post-Coverage are positive and
statistically significant in one regression for the one-year BHR and in the regression for the
two-year BHR. The coefficients on Post-Optimism are positive but statistically insignificant for
one- and two-year BHRs. These results are inconsistent with the hypothesis that analysts have
22
hyped the stock to an unsustainably high level, and provide some support for the argument that
analyst coverage involves information production. Note that we need market underreactions to
have the positive coefficients on the analyst coverage variables. Such underreactions are more
likely to exist if analyst forecasts involve information production.
5.2 Relationship Analysts
In our sample, all underwriters are subsidiaries of securities firms that also have asset
management and brokerage businesses. Except for one specialized research firm, almost all
analyst reports are from such securities firms. At the end of 2012, there were 113 securities firms
in China. A large shareholder can hold shares in no more than two securities firms, and if a
particular large shareholder does hold shares in two such securities firms, it can at most control
one of them (controlling is usually defined as holding more than 50% of the shares). This
limitation is called the “one equity participation, one controlling” policy by the CSRC. Although
it is not a widespread phenomenon, some securities firms that issue research reports and engage
in IPO underwriting do have the same large shareholder.
All securities firms in China are required to file annual reports with the government. We
hand collect large shareholder information of all the securities firms that issue research reports or
engage in IPO underwriting from the website of the Securities Association of China (SAC at
http://www.sac.net.cn/). We then combine all IPO lead underwriters and all securities firms
(brokers) that have issued any reports and create a matrix of 54,622 underwriter-broker pairs.
Note that an underwriter would be paired with each broker twice if it has underwritten two IPOs.
For each possible lead underwriter-broker pair, we code a dummy variable, ,�������ℎ��, that
equals one if the underwriter and the broker have the same larger shareholder, and equals zero if
no cross-ownership between the pair exists.19 Note that for a particular underwriter-broker pair,
the broker may or may not issue a report and cover the IPO by this particular underwriter.
We report the summary statistics for the underwriter-broker pairs in Panel A of Table 7.
The mean value of the ,�������ℎ�� measure is 2.67%, indicating that 2.67% of the 54,622
underwriter-broker pairs have cross-ownership over our sample period. An analyst from a broker
that has cross-ownership with the lead underwriter (Relationship=1), which we call a relationship
analyst, is more likely to cover an IPO, everything else being equal.20 We have analyst coverage
19 Central Huijin Investment Ltd. and China Jianyin Investment Securities Co., Ltd. are treated as same shareholder since the former is the parent company of the latter, and both are shareholders of big securities firms. 20 Note that all analysts covering an IPO in the primary market in our sample are unaffiliated with the lead underwriter.
23
from both of two brokerage firms for 15.86% of the pairs in our sample. But conditioning on the
variable ,�������ℎ�� being one, 29.95% of the pairs have coverage from both of the two
brokerage firms.
It is also possible that a relationship analyst receives pressure to provide more optimistic
coverage. We report the summary statistics on coverage optimism with different relationship
values in Panel B of Table 7. For both the pre- and post-offer date coverages, there is a
difference in analyst optimism for connected (,�������ℎ�� = 1) vs. unconnected
(,�������ℎ�� = 0) brokers, although the difference for post-offer date optimism is very small.
We examine the relationships between cross-ownership and analyst research using
multivariate regressions to control for the impact of confounding factors, and the results are
reported in Regressions (1) through (4) of Panel C of Table 7. Consistent with the patterns in the
summary statistics in Panels A and B of Table 7, ,�������ℎ�� has a statistically significant
positive impact on pre-offer date research coverage, while its impact on post-offer date coverage
is statistically indistinguishable from zero. Again, the insignificant result for post-offer date
coverage is not surprising, since the offer price is already determined at the offer date.
For the pre- and post-offer date earnings forecast, the coefficients on ,�������ℎ�� in
Regressions (3) and (4) of Panel C of Table 7 are positive but only statistically significant for
Pre-Optimism in Regression (3). These results suggest that relationship analysts affiliated with
the lead underwriter through cross-ownership are more likely to provide more optimistic research.
Note that earnings forecast optimism has a significant positive impact on IPO pricing as reported
in Tables 3 and 4; these results indicate that hype likely exists with pre-IPO analyst research, at
least when the connections between the analyst and the underwriter are strong (such as
cross-ownership). Our results are consistent with those reported by Huyghebaert and Xu (2015).
Given that cross-ownership has a significant positive impact on analyst coverage and
earnings forecast optimism, we want to make sure that the significant impact of analyst coverage
on offer price revisions (the results reported in Table 3) and the significant impact of post-offer
date optimism on initial returns (the results reported in Table 4) are not driven by relationship
analysts. We thus remove all the individual analyst reports by relationship analysts
(,�������ℎ��=1) and recalculate the pre- and post-coverage and optimism measures. We then
re-run the regressions and report the results in Regressions (5) (for offer price revisions) and (6)
(for initial returns) in Panel C of Table 7.

24
For the initial return regression, Regression (6) of Panel C of Table 7, only the coefficient
on post-offer date earnings forecast optimism is positive and statistically significant. The point
estimates of post-offer date analyst coverage and earnings forecast optimism are also similar to
those reported in Table 4. For the offer price revision in Regression (5) in Panel C of Table 7, the
coefficients on Pre-Coverage and Pre-Optimism are still positive and are still statistically
significant at the one percent levels. The results suggest pre-IPO analyst coverage and earnings
forecast optimism still have a significant impact on offer price revisions even after we remove all
the research reports from relationship analysts. We also want to point out, however, that the
magnitudes of the coefficients on Pre-Coverage and Pre-Optimism are only about half of those
in Regression (5) of Table 3 when research reports from relationship analysts are included. This
reduced magnitude suggests that, again, analysts with connections to the underwriter likely also
use their research to hype an IPO, although they do produce information as a group.
6. Conclusions
After more than twenty-five years since the rebirth of China’s stock market, many of the
operations and regulations of the IPO market are similar to those in the developed markets such
as the U.S. But due to path dependency and no regulatory restrictions, there exists active pre-IPO
analyst coverage for China’s IPOs. This coverage provides a unique opportunity to examine how
analysts and their information production in the primary market can affect the pricing of IPOs.
Using a sample of 859 IPOs from 2009 to 2012, we find that analyst coverage and
optimistic earnings forecasts have a significant positive impact on offer price revisions and initial
returns. For example, our lower bound estimates suggest that the offer price revision of an IPO
can increase by 5.13% if the number of brokers that publish reports before the offer date
increases by 3.61 (one standard deviation). For an average IPO, this effect represents a gain of
¥43.74 million (US$7.0 million) in proceeds at the lower bound.
A one standard deviation increase in forecasted earnings leads to a 48% higher offer price.
Importantly, there is no evidence that higher earnings forecasts result in lower long-run returns.
In other words, the earnings forecasts are not merely used for hyping the IPOs. Instead, the
evidence suggests that underwriters are rationally pricing IPOs based on forecasted earnings
rather than merely relying on historical earnings. In contrast, current CSRC policy restricts the
offer price to rely on historical earnings, with the price-earnings ratio capped at 23.
25
We decompose the number of brokers covering an IPO and the optimism of the earnings
forecast into predicted and residual components. We find that the significant impacts of pre-IPO
analyst research come from the residual components. This result suggests that it is the
information content of analyst coverage not expected by investors that drives the relationship
between pre-IPO analyst coverage and IPO pricing.
We also examine the relations between pre-IPO analyst coverage and the long-run
performance of IPOs. We find that pre-IPO analyst coverage and optimism are associated with
higher IPO long-run buy-and-hold returns. When we examine research reports from connected
and non-connected analysts, we find that a connection due to cross-ownership makes an analyst
more likely to cover an IPO before the offer date and to provide more optimistic earnings
forecasts. But after we remove the research reports from these connected analysts, pre-IPO
analyst research by the remaining analysts still demonstrates a significant positive impact on IPO
pricing. Together, these results suggest that analysts do produce useful information in their
pre-IPO coverage, although hype/marketing likely exists on China’s IPO market.
Finally, an interesting, and important, result for China’s IPOs is that offer price revisions
are negatively associated with initial returns. This finding is contradictory to the partial
adjustment phenomenon documented for IPOs in the U.S. and many other countries. We
interpret this result as a consequence of the pro rata share allocation rules for China’s IPOs.
Since the lead underwriter cannot use allocations of underpriced shares to reward regular
investors for supplying information or for being a profitable client, positive information provided
by analysts and other sources is more fully incorporated into the offer price. The negative
association between offer price revisions and initial returns thus provides alternative evidence
that is consistent with the information acquisition hypothesis for pricing IPOs (Benveniste and
Spindt (1989) and Benveniste and Wilhelm (1990)). The negative association is also consistent
with the Loughran and Ritter (2002) prospect theory explanation in that the pro rata share
allocation rules remove the lead underwriter’s incentive to leave money on the table to be shared
with rent-seeking investors. In other words, when underwriters no longer have the ability to
allocate shares to their preferred clients, their behavior in adjusting the offer price changes. This
evidence is inconsistent with the prediction of the Edelen and Kadlec (2005) framework, which
posits that partial adjustment exists because issuers have a higher opportunity cost of a failed
offering when there is a positive information revealed during bookbuilding.

26
References
Andrews, Donald W. K., and Moshe Buchinsky, 2000, A three-step method for choosing the
number of bootstrap repetitions, Econometrica 67, 23-51.
Aggarwal, Rajesh, Laurie Krigman, and Kent Womack, 2002, Strategic IPO underpricing,
information momentum, and lockup expiration selling, Journal of Financial Economics 66,
105-137.
Aussenegg Wolfgang, Pegaret Pichler, and Alex Stomper, 2006, IPO pricing with bookbuilding
and a when-issued market, Journal of Financial and Quantitative Analysis 41, 829-862
Barth, Mary E., Wayne R. Landsman, and Daniel Taylor, 2014, The JOBS Act and information
uncertainty in IPO firms, Stanford University working paper.
Beatty, Randolph, and Jay R. Ritter, 1986, Investment banking, reputation, and the underpricing
of initial public offerings, Journal of Financial Economics 15, 213-232.
Benveniste, Lawrence M., and Paul A. Spindt, 1989, How investment bankers determine the
offer price and allocation of new issues, Journal of Financial Economics 24, 343-361.
Benveniste, Lawrence M., and William J. Wilhelm Jr., 1990, A comparative analysis of IPO
proceeds under alternative regulatory environments, Journal of Financial Economics 28,
173-207.
Bhattacharya, Utpal, Neal Galpin, Rina Ray, and Xiaoyun Yu, 2009, The role of the media in the
internet IPO bubble, Journal of Financial and Quantitative Analysis 44, 657-682.
Bradley, Daniel J., and Bradford D. Jordan, 2002, Partial adjustment to public information and
IPO underpricing, Journal of Financial and Quantitative Analysis 37, 595-616.
Bradley, Daniel J., Bradford D. Jordan, and Jay R. Ritter, 2003, The quiet period goes out with a
bang, Journal of Finance 56, 1-36.
Bradley, Daniel J., Bradford D. Jordan, Jay R. Ritter, 2008, Analyst behavior following IPOs: the
"bubble period" evidence, Review of Financial Studies 21, 101-133.
Brennan, Michael J., and Avanidhar Subrahmanyam, 1995, Investment analysis and price
formation in securities markets, Journal of Financial Economics 38, 361-381.
Bubna, Amit, and Nagpurnanand R. Prabhala, 2011, IPOs with and without allocation discretion:
Empirical evidence, Journal of Financial Intermediation 20, 530-561.
Chan, Louis K.C., Narasimhan Jegadeesh, and Josef Lakonishok, 1996, Momentum strategies,
Journal of Finance 51, 1681-1713.

27
Chang, Chun, Yao-Min Chiang, Yiming Qian, and Jay R. Ritter, 2017, Pre-market trading and
IPO pricing, Review of Financial Studies 30, 835-865.
Chaplinsky, Susan, Kathleen Weiss Hanley, and S. Katie Moon, 2017, The JOBS Act and the
costs of going public, Journal of Accounting Research, forthcoming.
Cliff, Michael T., and David J. Denis, 2004, Do initial public offering firms purchase analyst
coverage with underpricing? Journal of Finance 59, 2871-2901.
Cornelli, Francesca, David Goldreich, and Alexander Ljungqvist, 2006, Investor sentiment and
pre-IPO markets, Journal of Finance 61, 1187-1216.
Dambra, Michael, Laura Casares Field, and Matthew Gustafson, 2015, The JOBS Act and IPO
volume: Evidence that disclosure costs affect the IPO decision, Journal of Financial
Economics 116, 121-143.
Degeorge, François, François Derrien, and Kent L. Womack, 2007, Analyst hype in IPOs:
Explaining the popularity of bookbuilding, Review of Financial Studies 20, 1021-1058.
Derrien, François, and Ambrus Kecskés, 2007, The initial public offerings of listed firms,
Journal of Finance 62, 447-479.
Derrien, François, and Ambrus Kecskés, 2013, The real effects of financial shocks: Evidence
from exogenous changes in analyst coverage, Journal of Finance 68, 1407-1440.
Derrien, François, and Kent L. Womack, 2003, Auctions vs. book-building and the control of
underpricing in hot IPO markets, Review of Financial Studies 16, 31-61.
Dorn, Daniel, 2009, Does sentiment drive the retail demand for IPOs? Journal of Financial and
Quantitative Analysis 44, 85–108.
Edelen, Roger M., and Gregory B. Kadlec, 2005, Issuer surplus and the partial adjustment of IPO
prices to public information, Journal of Financial Economics 77, 347-373.
Fama, Eugene, and Kenneth French, 2001, Disappearing dividends: Changing firm
characteristics or lower propensity to pay? Journal of Financial Economics 60, 3-43.
Fan, Joseph P. H., T. J. Wong, and Tianyu Zhang, 2007, Politically connected CEOs, corporate
governance and post-IPO performance of China’s newly partially privatized firms, Journal of
Financial Economics 84, 330-357.
Gao, Xiaohui, and Jay R. Ritter, 2010, The marketing of seasoned equity offerings, Journal of
Financial Economics 97, 33-52.
28
Gleason, Cristi A., and Charles M. C. Lee, 2003, Analyst forecast revisions and market price
discovery, The Accounting Review 78, 193-225.
Goldstein, Michael A., Paul Irvine, and Andy Puckett, 2011, Purchasing IPOs with commissions,
Journal of Financial and Quantitative Analysis 46, 1193-1225.
Hanley, Kathleen Weiss, 1993, The underpricing of initial public offerings and the partial
adjustment phenomenon, Journal of Financial Economics 34, 231-250.
Hanley, Kathleen Weiss, and Gerard Hoberg, 2010, The information content of IPO prospectus,
Review of Financial Studies 23, 2821-2864.
Hanley, Kathleen Weiss, and Gerard Hoberg, 2012, Litigation risk, strategic disclosure, and the
underpricing of initial public offerings, Journal of Financial Economics 103, 235-254.
Hayes, Rachel M., 1998, The impact of trading commission incentives on analysts’ stock
coverage decisions and earnings forecasts, Journal of Accounting Research 36, 299-320.
Hong, Harrison, and Marcin Kacperczyk, 2010, Competition and bias, Quarterly Journal of
Economics 125, 1683-1725.
Huang, Rongbing, and Donghang Zhang, 2011, Managing underwriters and the marketing of
seasoned equity offerings, Journal of Financial and Quantitative Analysis 46, 141-170.
Hui, Kai Wai, and P. Eric Yeung, 2013, Underreaction to industry-wide earnings and the
post-forecast revision drift, Journal of Accounting Research 51, 701-737.
Huyghebaert, Nancy, and Weidong Xu, 2015, Bias in the post-IPO earnings forecasts of
affiliated analysts: Evidence from a Chinese natural experiment, SSRN.
İnce , Özgür Ş., 2014, Why do IPO offer price only partially adjust? Quarterly Journal of
Finance 4, 1450009-1- 1450009-32.
Irvine, Paul J., 2001, Do analysts generate trade for their firms? Evidence from the Toronto stock
exchange, Journal of Accounting and Economics 30, 209-226.
Jackson, Andrew R., 2005, Trade generation, reputation, and sell-side analysts, Journal of
Finance 55, 673-717.
James, Christopher M., and Jason J. Karceski, 2006, Strength of analyst coverage following IPOs,
Journal of Financial Economics 82, 1-34.
Jia, Chunxin, and Peidao Gao, 2008, IPO pricing: Are the underwriters leaning against the wind?
Quarterly Journal of Finance 4, 1-19. In Chinese.

29
Kaneko, Takashi, and Richard H. Pettway, 2003, Auctions versus book building of Japanese
IPOs, Pacific-Basin Finance Journal 11, 439-462.
Kelly, Bryan, and Alexander Ljungqvist, 2012, Testing asymmetric information asset pricing
models, Review of Financial Studies 25, 1366-1413.
Kutsuna, Kenji, and Richard Smith, 2004, Why does book-building drive out auction methods of
IPO issuance? Evidence from Japan, Review of Financial Studies 17, 1129-1166.
Li, Kai, Tan Wang, Yan-Leung Cheung, and Ping Jiang, 2011, Privatization and risk sharing:
Evidence from the split share structure reform in China, Review of Financial Studies 24,
2499-2526.
Lim, Terence, 2001, Rationality and analysts’ forecast bias, Journal of Finance 56, 369-385.
Lin, Hsiou-wei, and Maureen F. McNichols, 1998, Underwriting relationships, analysts’ earnings
forecasts, and investment recommendations, Journal of Accounting and Economics
25,101-127.
Liu, Laura Xiaolei, Ann E. Sherman, and Yong Zhang, 2014, The long-run role of the media:
Evidence from initial public offerings, Management Science 60, 1945-1964.
Liu, Xiaoding, and Jay R. Ritter, 2011, Local underwriter oligopolies and IPO underpricing,
Journal of Financial Economics 102, 579-601.
Ljungqvist, Alexander, Tim Jenkinson, and William J. Wilhelm, Jr., 2003, Global integration in
primary equity markets: The role of U.S. banks and U.S. investors, Review of Financial
Studies 16, 63-99.
Lӧffler, Gunter, Patrick F. Panther, and Erik Theissen, 2006, Who knows what when? The
information content of pre-IPO market prices, Journal of Financial Intermediation 14,
466-484.
Loughran, Tim, and Bill McDonald, 2013, IPO first-day returns, offer price revisions, volatility,
and form S-1 language, Journal of Financial Economics 109, 307-326.
Loughran, Tim, and Jay R. Ritter, 2002, Why don’t issuers get upset about leaving money on the
table in IPOs? Review of Financial Studies 15, 413-444.
Loughran, Tim, and Jay R. Ritter, 2004, Why has IPO underpricing changed over time?
Financial Management 33, 5-37.

30
Loughran, Tim, Jay R. Ritter, and Kristian Rydqvist, 1994, Initial public offerings: International
insights, Pacific-Basin Finance Journal 2, 165-199. (The underpricing numbers for 53
countries are updated at https://site.warrington.ufl.edu/ritter/files/2017/07/Int2017.pdf.)
Lowry, Michelle, and G. William Schwert, 2004, Is the IPO pricing process efficient? Journal of
Financial Economics 71, 3-26.
Merton, Robert C., 1987, A simple model of capital market equilibrium with incomplete
information, Journal of Finance 42, 483-510.
Michaely, Roni, and Kent L. Womack, 1999, Conflict of interest and the credibility of
underwriter analyst recommendations, Review of Financial Studies 12, 653-686.
Mola, Simona, and Massimo Guidolin, 2009, Affiliated mutual funds and analyst optimism,
Journal of Financial Economics 93, 108-137.
Niehaus, Greg, and Donghang Zhang, 2010, The impact of sell-side analyst research coverage on
an affiliated broker’s market share of trading volume, Journal of Banking and Finance 34,
776-787.
Nimalendran, Mahendrarajah, Jay R. Ritter, and Donghang Zhang, 2007, Do today’s trades affect
tomorrow’s IPO allocation? Journal of Financial Economics 84, 87-109.
Piotroski, Joseph D., and Tianyu Zhang, 2014, Politicians and the IPO decision: The impact of
impending political promotions on IPO activity in China, Journal of Financial Economics
111, 111-136.
Reuter, Jonathan, 2006, Are IPO allocations for sale? Evidence from mutual funds, , Journal of
Finance 61, 2289–2324.
Sherman, Ann E., 2005, Global trends in IPO methods: Book building versus auctions with
endogenous entry, Journal of Financial Economics 78, 615–649.
Song, Liping, 2010, Reforms of China’s regulations of securities issuance, China Finance 8,
36-37, in Chinese.
Tian, Lihui, 2011, Regulatory underpricing: Determinants of Chinese extreme IPO returns,
Journal of Empirical Finance 18, 78-90.
Womack, Kent L., 1996, Do brokerage analysts’ recommendations have investment value?
Journal of Finance 51, 137-167.
Zhang, Donghang, 2004, Why do underwriters allocate extra shares that they have to buy back?
Journal of Financial and Quantitative Analysis 39, 571-594.
31
Figure 1 China’s IPOs
We plot the number of IPOs (on the left axis) and the average initial returns (on the right axis).
The data are from the China Stock Market & Accounting Research (CSMAR) database. Panel A
reports the annual numbers for China’s overall IPO market from 1992 to 2016 (based on listing
year and A-share only, where A-share refers to stocks for domestic investors). Initial return of an
IPO is defined as the percentage change from the offer price to the market closing price on the
first day when the price of the IPO is no longer subjected to a price cap. For all IPOs from 1992
to 2012, the market closing price on the first day of trading is used since IPO prices on the first
listing day were not subjected to price caps during the 1992-2012 period. For IPOs after 2013
(inclusive), the price increase of an IPO is capped at 44% on the first day of trading and at 10%
afterwards (this 10% cap applies to all seasoned stocks). We thus track each IPO until the day
when its price increase is no longer subjected to the price cap, and the market closing price on
that day is used as the ending price for initial returns. The longest time for an IPO to be no longer
subjected to the price cap is 29 trading days. Because of the variable length of the window for
calculating initial returns, we report both the raw and market-adjusted initial returns in Panel A.
The market returns are based on the value-weighted index of all stocks listed on either the
Shanghai or Shenzhen stock exchanges. The big drop in the number of IPOs in 2005 reflects the
suspension of IPOs by the China Securities Regulatory Commission (CSRC). We also have IPO
suspensions for 2008Q4, 2009Q1, 2009Q2, 2012Q4, and most of 2013. The big increase in the
number of IPOs in 2010 corresponds to the introduction of the Growth Enterprises Market,
ChiNext, on the Shenzhen Stock Exchange, which aims at helping small growth firms to go to
public. There were 13 IPOs before 1992 but some of the initial returns were very large. We also
exclude the following IPOs for the 1992-2016 sample: 66 financial institutions, 71 IPOs with
H-shares being listed on the Hong Kong Stock Exchange before or with the A-share IPO, 18
exchange offers (shares being offered in exchange of existing public listed shares), and 46 IPOs
with missing initial returns.
The Number of IPOs/Raw Initial Return (%)/Adjusted Initial Return (%) reported in Panel A of
Figure 1 for 2006 – 2016 are as follows: 2006: 59/90%/85%; 2007: 106/207%/203%; 2008:
72/119%/123%; 2009: 95/74%/74%; 2010: 340/42%/42%; 2011: 276/21%/21%; 2012:
148/21%/21%; 2013: 0/./.; 2014: 124/161%/157%; 2015: 216/390%/390%; 2016:
216/437%/437%.
Panel B reports the quarterly numbers of IPOs and initial returns for our sample period from
2009 to 2012 (based on listing date). We also report the price revisions on the right axis in Panel
B. Since no IPOs are subjected to price caps between 2009 and 2012, initial return in Panel B is
simply defined as the percentage change from the offer price to the market closing price on the
first day of trading. Offer price revision is defined as the percentage change from the expected
offer price to the offer price. We do not subtract market index returns for either price change in
Panel B.
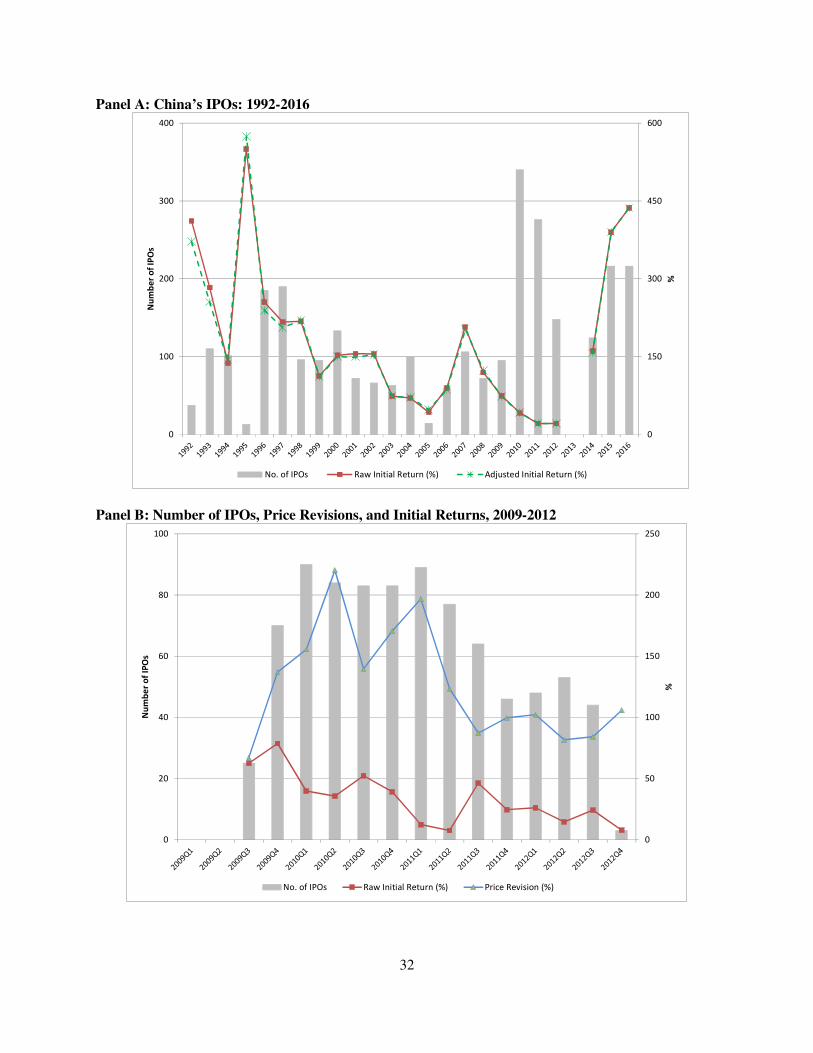
32
Panel A: China’s IPOs: 1992-2016
Panel B: Number of IPOs, Price Revisions, and Initial Returns, 2009-2012
0
150
300
450
600
0
100
200
300
400
%
Nu
mb
er o
f IP
Os
No. of IPOs Raw Initial Return (%) Adjusted Initial Return (%)
0
50
100
150
200
250
0
20
40
60
80
100
%
Nu
mb
er
of
IPO
s
No. of IPOs Raw Initial Return (%) Price Revision (%)
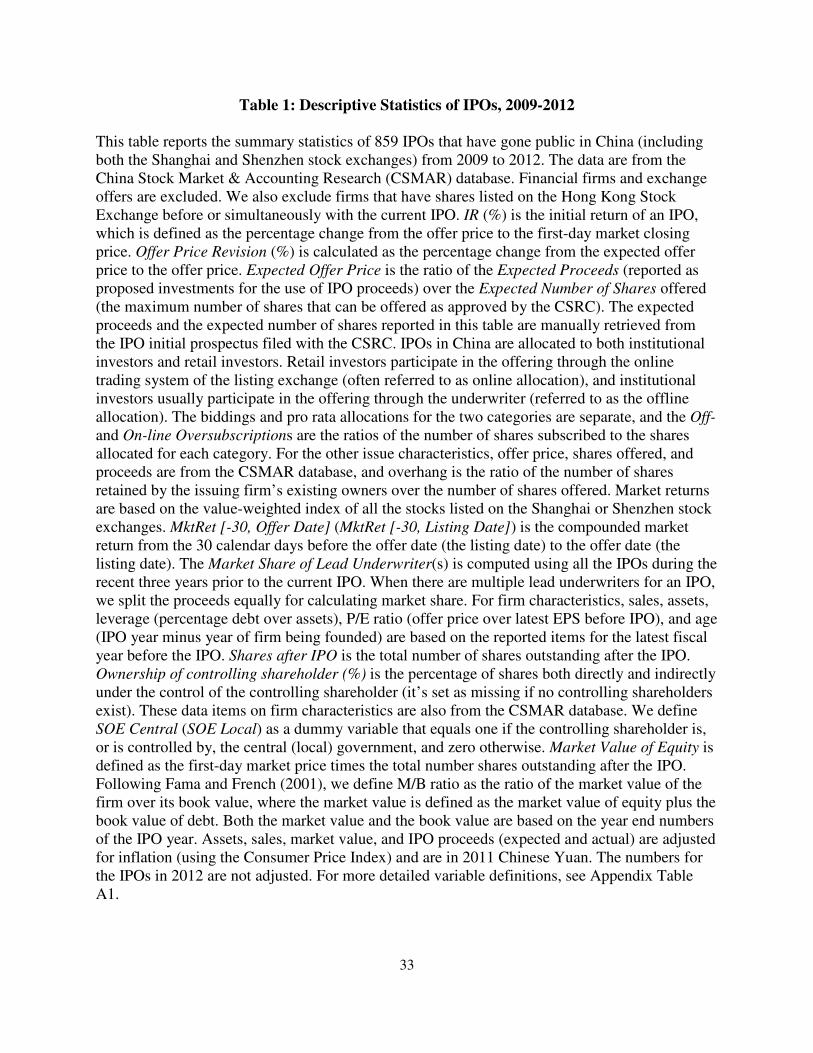
33
Table 1: Descriptive Statistics of IPOs, 2009-2012
This table reports the summary statistics of 859 IPOs that have gone public in China (including both the Shanghai and Shenzhen stock exchanges) from 2009 to 2012. The data are from the China Stock Market & Accounting Research (CSMAR) database. Financial firms and exchange offers are excluded. We also exclude firms that have shares listed on the Hong Kong Stock Exchange before or simultaneously with the current IPO. IR (%) is the initial return of an IPO, which is defined as the percentage change from the offer price to the first-day market closing price. Offer Price Revision (%) is calculated as the percentage change from the expected offer price to the offer price. Expected Offer Price is the ratio of the Expected Proceeds (reported as proposed investments for the use of IPO proceeds) over the Expected Number of Shares offered (the maximum number of shares that can be offered as approved by the CSRC). The expected proceeds and the expected number of shares reported in this table are manually retrieved from the IPO initial prospectus filed with the CSRC. IPOs in China are allocated to both institutional investors and retail investors. Retail investors participate in the offering through the online trading system of the listing exchange (often referred to as online allocation), and institutional investors usually participate in the offering through the underwriter (referred to as the offline allocation). The biddings and pro rata allocations for the two categories are separate, and the Off- and On-line Oversubscriptions are the ratios of the number of shares subscribed to the shares allocated for each category. For the other issue characteristics, offer price, shares offered, and proceeds are from the CSMAR database, and overhang is the ratio of the number of shares retained by the issuing firm’s existing owners over the number of shares offered. Market returns are based on the value-weighted index of all the stocks listed on the Shanghai or Shenzhen stock exchanges. MktRet [-30, Offer Date] (MktRet [-30, Listing Date]) is the compounded market return from the 30 calendar days before the offer date (the listing date) to the offer date (the listing date). The Market Share of Lead Underwriter(s) is computed using all the IPOs during the recent three years prior to the current IPO. When there are multiple lead underwriters for an IPO, we split the proceeds equally for calculating market share. For firm characteristics, sales, assets, leverage (percentage debt over assets), P/E ratio (offer price over latest EPS before IPO), and age (IPO year minus year of firm being founded) are based on the reported items for the latest fiscal year before the IPO. Shares after IPO is the total number of shares outstanding after the IPO. Ownership of controlling shareholder (%) is the percentage of shares both directly and indirectly under the control of the controlling shareholder (it’s set as missing if no controlling shareholders exist). These data items on firm characteristics are also from the CSMAR database. We define SOE Central (SOE Local) as a dummy variable that equals one if the controlling shareholder is, or is controlled by, the central (local) government, and zero otherwise. Market Value of Equity is defined as the first-day market price times the total number shares outstanding after the IPO. Following Fama and French (2001), we define M/B ratio as the ratio of the market value of the firm over its book value, where the market value is defined as the market value of equity plus the book value of debt. Both the market value and the book value are based on the year end numbers of the IPO year. Assets, sales, market value, and IPO proceeds (expected and actual) are adjusted for inflation (using the Consumer Price Index) and are in 2011 Chinese Yuan. The numbers for the IPOs in 2012 are not adjusted. For more detailed variable definitions, see Appendix Table A1.
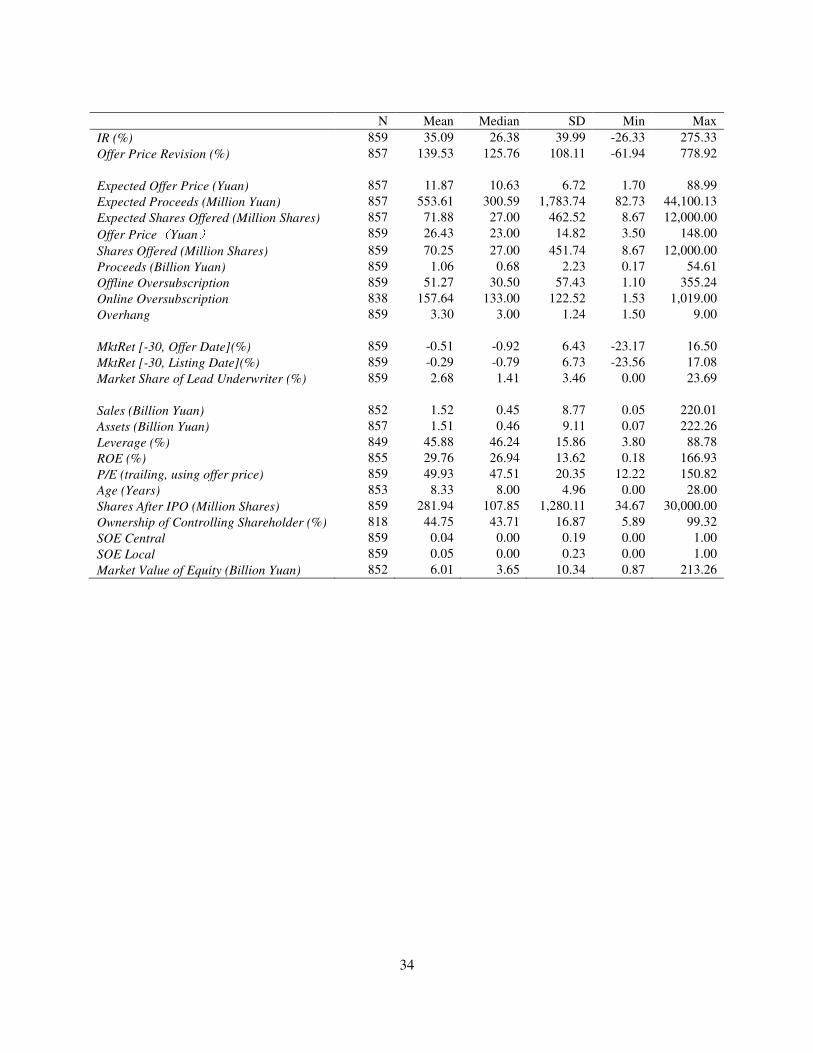
34
N Mean Median SD Min Max IR (%) 859 35.09 26.38 39.99 -26.33 275.33 Offer Price Revision (%) 857 139.53 125.76 108.11 -61.94 778.92 Expected Offer Price (Yuan) 857 11.87 10.63 6.72 1.70 88.99 Expected Proceeds (Million Yuan) 857 553.61 300.59 1,783.74 82.73 44,100.13 Expected Shares Offered (Million Shares) 857 71.88 27.00 462.52 8.67 12,000.00 Offer Price(Yuan) 859 26.43 23.00 14.82 3.50 148.00
Shares Offered (Million Shares) 859 70.25 27.00 451.74 8.67 12,000.00 Proceeds (Billion Yuan) 859 1.06 0.68 2.23 0.17 54.61 Offline Oversubscription 859 51.27 30.50 57.43 1.10 355.24 Online Oversubscription 838 157.64 133.00 122.52 1.53 1,019.00 Overhang 859 3.30 3.00 1.24 1.50 9.00 MktRet [-30, Offer Date](%) 859 -0.51 -0.92 6.43 -23.17 16.50 MktRet [-30, Listing Date](%) 859 -0.29 -0.79 6.73 -23.56 17.08 Market Share of Lead Underwriter (%) 859 2.68 1.41 3.46 0.00 23.69 Sales (Billion Yuan) 852 1.52 0.45 8.77 0.05 220.01 Assets (Billion Yuan) 857 1.51 0.46 9.11 0.07 222.26 Leverage (%) 849 45.88 46.24 15.86 3.80 88.78 ROE (%) 855 29.76 26.94 13.62 0.18 166.93 P/E (trailing, using offer price) 859 49.93 47.51 20.35 12.22 150.82 Age (Years) 853 8.33 8.00 4.96 0.00 28.00 Shares After IPO (Million Shares) 859 281.94 107.85 1,280.11 34.67 30,000.00 Ownership of Controlling Shareholder (%) 818 44.75 43.71 16.87 5.89 99.32 SOE Central 859 0.04 0.00 0.19 0.00 1.00 SOE Local 859 0.05 0.00 0.23 0.00 1.00 Market Value of Equity (Billion Yuan) 852 6.01 3.65 10.34 0.87 213.26
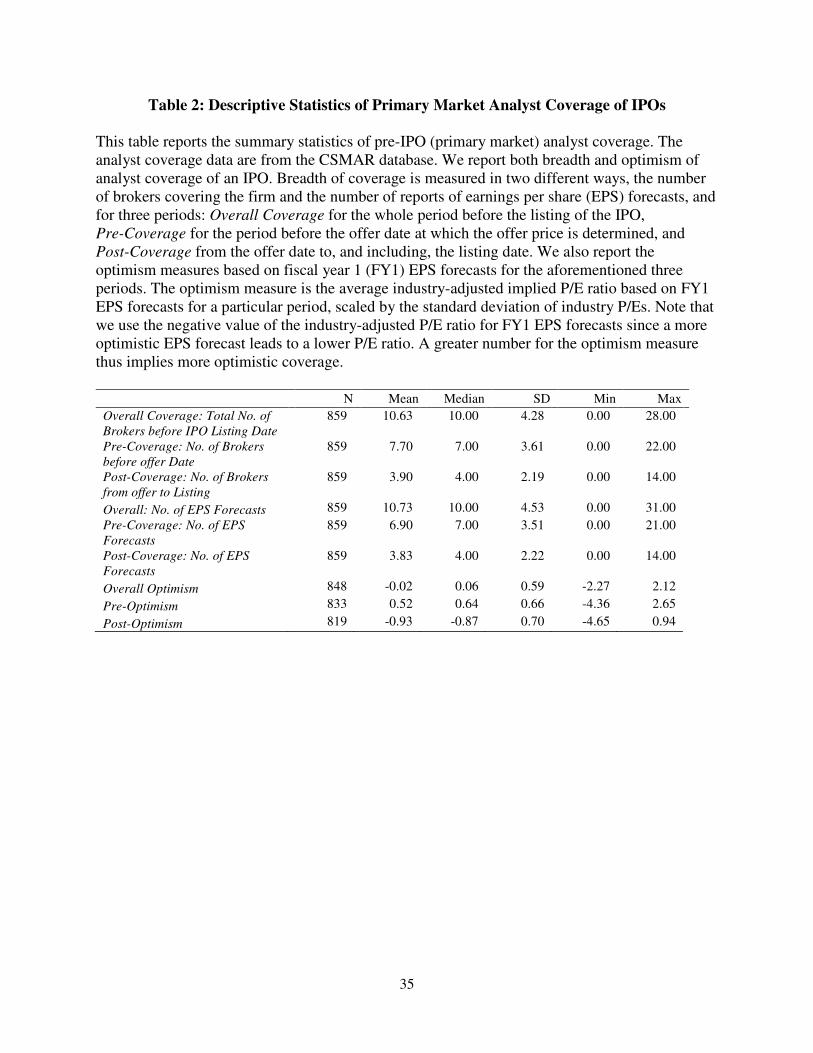
35
Table 2: Descriptive Statistics of Primary Market Analyst Coverage of IPOs
This table reports the summary statistics of pre-IPO (primary market) analyst coverage. The analyst coverage data are from the CSMAR database. We report both breadth and optimism of analyst coverage of an IPO. Breadth of coverage is measured in two different ways, the number of brokers covering the firm and the number of reports of earnings per share (EPS) forecasts, and for three periods: Overall Coverage for the whole period before the listing of the IPO, Pre-Coverage for the period before the offer date at which the offer price is determined, and Post-Coverage from the offer date to, and including, the listing date. We also report the optimism measures based on fiscal year 1 (FY1) EPS forecasts for the aforementioned three periods. The optimism measure is the average industry-adjusted implied P/E ratio based on FY1 EPS forecasts for a particular period, scaled by the standard deviation of industry P/Es. Note that we use the negative value of the industry-adjusted P/E ratio for FY1 EPS forecasts since a more optimistic EPS forecast leads to a lower P/E ratio. A greater number for the optimism measure thus implies more optimistic coverage.
N Mean Median SD Min Max Overall Coverage: Total No. of
Brokers before IPO Listing Date
859 10.63 10.00 4.28 0.00 28.00
Pre-Coverage: No. of Brokers
before offer Date
859 7.70 7.00 3.61 0.00 22.00
Post-Coverage: No. of Brokers
from offer to Listing
859 3.90 4.00 2.19 0.00 14.00
Overall: No. of EPS Forecasts 859 10.73 10.00 4.53 0.00 31.00
Pre-Coverage: No. of EPS
Forecasts
859 6.90 7.00 3.51 0.00 21.00
Post-Coverage: No. of EPS
Forecasts
859 3.83 4.00 2.22 0.00 14.00
Overall Optimism 848 -0.02 0.06 0.59 -2.27 2.12
Pre-Optimism 833 0.52 0.64 0.66 -4.36 2.65
Post-Optimism 819 -0.93 -0.87 0.70 -4.65 0.94
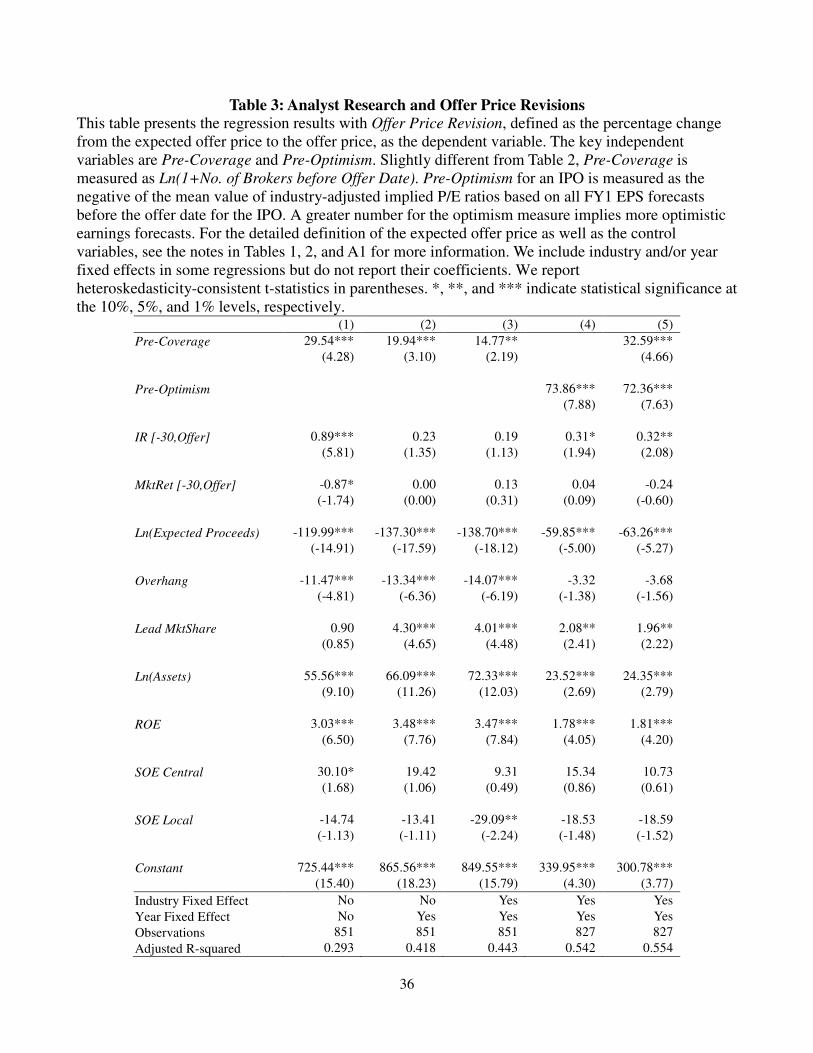
36
Table 3: Analyst Research and Offer Price Revisions
This table presents the regression results with Offer Price Revision, defined as the percentage change from the expected offer price to the offer price, as the dependent variable. The key independent variables are Pre-Coverage and Pre-Optimism. Slightly different from Table 2, Pre-Coverage is measured as Ln(1+No. of Brokers before Offer Date). Pre-Optimism for an IPO is measured as the negative of the mean value of industry-adjusted implied P/E ratios based on all FY1 EPS forecasts before the offer date for the IPO. A greater number for the optimism measure implies more optimistic earnings forecasts. For the detailed definition of the expected offer price as well as the control variables, see the notes in Tables 1, 2, and A1 for more information. We include industry and/or year fixed effects in some regressions but do not report their coefficients. We report heteroskedasticity-consistent t-statistics in parentheses. *, **, and *** indicate statistical significance at the 10%, 5%, and 1% levels, respectively.
(1) (2) (3) (4) (5) Pre-Coverage 29.54*** 19.94*** 14.77** 32.59*** (4.28) (3.10) (2.19) (4.66) Pre-Optimism 73.86*** 72.36*** (7.88) (7.63) IR [-30,Offer] 0.89*** 0.23 0.19 0.31* 0.32** (5.81) (1.35) (1.13) (1.94) (2.08) MktRet [-30,Offer] -0.87* 0.00 0.13 0.04 -0.24 (-1.74) (0.00) (0.31) (0.09) (-0.60) Ln(Expected Proceeds) -119.99*** -137.30*** -138.70*** -59.85*** -63.26*** (-14.91) (-17.59) (-18.12) (-5.00) (-5.27) Overhang -11.47*** -13.34*** -14.07*** -3.32 -3.68 (-4.81) (-6.36) (-6.19) (-1.38) (-1.56) Lead MktShare 0.90 4.30*** 4.01*** 2.08** 1.96** (0.85) (4.65) (4.48) (2.41) (2.22) Ln(Assets) 55.56*** 66.09*** 72.33*** 23.52*** 24.35*** (9.10) (11.26) (12.03) (2.69) (2.79) ROE 3.03*** 3.48*** 3.47*** 1.78*** 1.81*** (6.50) (7.76) (7.84) (4.05) (4.20) SOE Central 30.10* 19.42 9.31 15.34 10.73 (1.68) (1.06) (0.49) (0.86) (0.61) SOE Local -14.74 -13.41 -29.09** -18.53 -18.59 (-1.13) (-1.11) (-2.24) (-1.48) (-1.52) Constant 725.44*** 865.56*** 849.55*** 339.95*** 300.78*** (15.40) (18.23) (15.79) (4.30) (3.77) Industry Fixed Effect No No Yes Yes Yes Year Fixed Effect No Yes Yes Yes Yes Observations 851 851 851 827 827 Adjusted R-squared 0.293 0.418 0.443 0.542 0.554

37
Table 4: Analyst Research and Initial Returns
The dependent variable in this table, IR (%), is defined as the percentage return from the offer price to the market closing price on the first trading day. The key independent variables are as follows. Post-Coverage is defined as Ln(1+No. of Brokers after Offer Date), and Overall
Coverage is defined as Ln(1+ Total No. of Brokers until Listing Date). Post-Optimism is measured as the negative of the mean value of industry-adjusted implied P/E ratios based on all FY1 EPS forecasts for the IPO after the offer date. A greater optimism measure implies more optimistic coverage. Offer Price Revision is defined as the percentage change from the expected offer price to the offer price. For the definitions of other variables, see Tables 1, 2, and A1 for more information. We include industry and year fixed effects in all regressions but their coefficients are omitted. We report heteroskedasticity-consistent t-statistics in parentheses. *, **, and *** indicate statistical significance at the 10%, 5%, and 1% levels, respectively.
(1) (2) (3) (4) (5) (6) Post-Coverage 1.11 1.83 2.70 (0.44) (0.60) (0.56) Overall Coverage 0.51 -2.17 (0.20) (-0.43) Post-Optimism 7.80*** 7.97** (3.84) (2.43) Overall Optimism -0.43 (-0.11) Offer Price Revision -0.06*** -0.06*** -0.06*** -0.04*** -0.04** (-5.13) (-5.12) (-5.15) (-3.69) (-2.48) IR [-30,Offer] 0.27*** 0.29*** 0.29*** 0.29*** 0.33*** 0.33*** (4.06) (4.30) (4.29) (4.30) (4.72) (4.71) MktRet [-30,List] 1.86*** 1.83*** 1.83*** 1.82*** 1.78*** 1.80*** (11.74) (11.67) (11.69) (11.28) (10.94) (10.55) Lead_MktShare -0.67** -0.61** -0.61** -0.61** -0.60** -0.59** (-2.47) (-2.15) (-2.15) (-2.15) (-2.12) (-2.06) Overhang 1.83 1.49 1.51 1.50 2.31* 2.28* (1.52) (1.25) (1.25) (1.25) (1.92) (1.92) Ln(Offline OverSub) 5.01*** 6.18*** 6.09*** 6.13*** 6.40*** 6.46*** (3.20) (4.05) (3.98) (3.98) (4.06) (4.09) Ln(Online OverSub) 8.58*** 6.47*** 6.42*** 6.46*** 4.97*** 4.98*** (5.38) (4.04) (3.98) (4.03) (3.01) (3.01) Ln(Assets) -4.82*** -5.55*** -5.67*** -5.60*** -8.08*** -7.98*** (-2.64) (-3.05) (-3.08) (-3.05) (-4.09) (-4.01) ROE -0.32*** -0.24*** -0.24*** -0.24*** -0.34*** -0.34*** (-3.45) (-2.65) (-2.68) (-2.66) (-3.70) (-3.71) Leverage 0.01 -0.01 -0.00 -0.01 0.00 0.01 (0.16) (-0.06) (-0.03) (-0.06) (0.03) (0.07) SOE Central 1.43 0.63 0.39 0.55 2.62 2.69 (0.28) (0.11) (0.07) (0.10) (0.44) (0.45) SOE Local 13.09* 12.59* 12.46* 12.57* 11.96 11.90 (1.80) (1.76) (1.73) (1.75) (1.61) (1.61) Constant -47.41*** -51.79*** -52.82*** -52.87*** -33.09** -29.66* (-2.70) (-3.78) (-3.81) (-3.52) (-1.98) (-1.66) Industry Fixed Effect Yes Yes Yes Yes Yes Yes Year Fixed Effect Yes Yes Yes Yes Yes Yes Observations 825 824 824 824 786 786 Adjusted R-squared 0.395 0.412 0.412 0.412 0.426 0.425
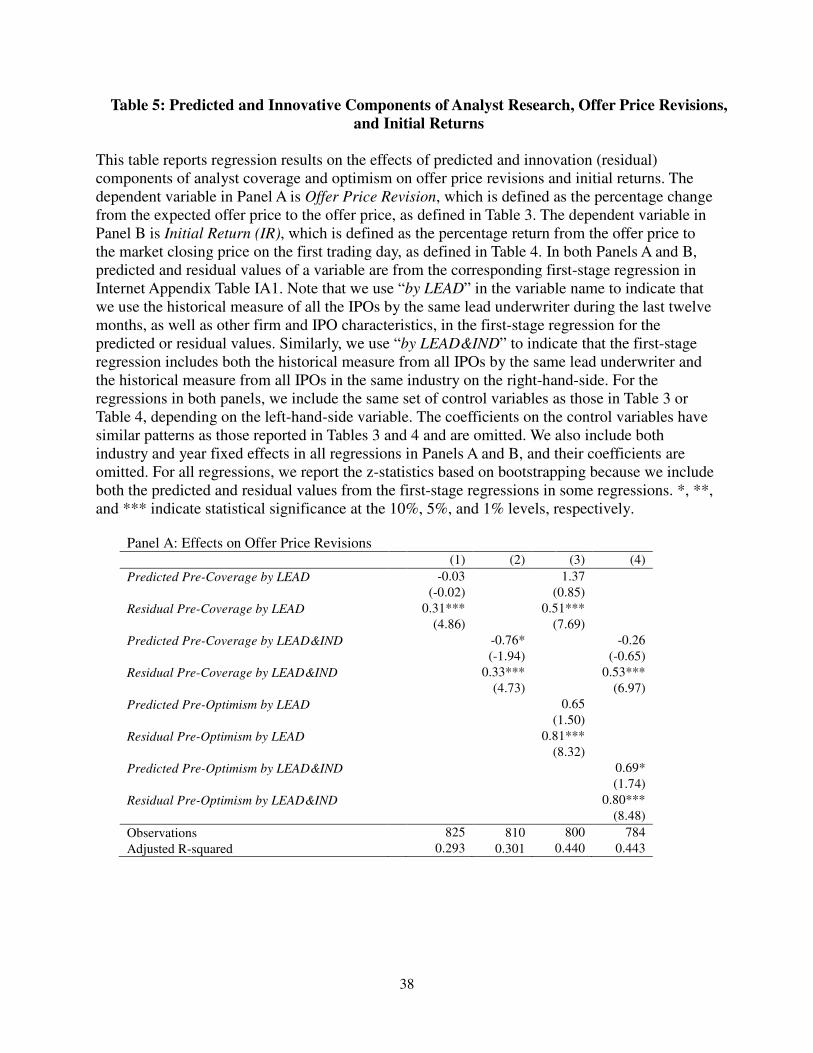
38
Table 5: Predicted and Innovative Components of Analyst Research, Offer Price Revisions,
and Initial Returns
This table reports regression results on the effects of predicted and innovation (residual) components of analyst coverage and optimism on offer price revisions and initial returns. The dependent variable in Panel A is Offer Price Revision, which is defined as the percentage change from the expected offer price to the offer price, as defined in Table 3. The dependent variable in Panel B is Initial Return (IR), which is defined as the percentage return from the offer price to the market closing price on the first trading day, as defined in Table 4. In both Panels A and B, predicted and residual values of a variable are from the corresponding first-stage regression in Internet Appendix Table IA1. Note that we use “by LEAD” in the variable name to indicate that we use the historical measure of all the IPOs by the same lead underwriter during the last twelve months, as well as other firm and IPO characteristics, in the first-stage regression for the predicted or residual values. Similarly, we use “by LEAD&IND” to indicate that the first-stage regression includes both the historical measure from all IPOs by the same lead underwriter and the historical measure from all IPOs in the same industry on the right-hand-side. For the regressions in both panels, we include the same set of control variables as those in Table 3 or Table 4, depending on the left-hand-side variable. The coefficients on the control variables have similar patterns as those reported in Tables 3 and 4 and are omitted. We also include both industry and year fixed effects in all regressions in Panels A and B, and their coefficients are omitted. For all regressions, we report the z-statistics based on bootstrapping because we include both the predicted and residual values from the first-stage regressions in some regressions. *, **, and *** indicate statistical significance at the 10%, 5%, and 1% levels, respectively.
Panel A: Effects on Offer Price Revisions (1) (2) (3) (4) Predicted Pre-Coverage by LEAD -0.03 1.37 (-0.02) (0.85) Residual Pre-Coverage by LEAD 0.31*** 0.51*** (4.86) (7.69) Predicted Pre-Coverage by LEAD&IND -0.76* -0.26 (-1.94) (-0.65) Residual Pre-Coverage by LEAD&IND 0.33*** 0.53*** (4.73) (6.97) Predicted Pre-Optimism by LEAD 0.65 (1.50) Residual Pre-Optimism by LEAD 0.81*** (8.32) Predicted Pre-Optimism by LEAD&IND 0.69* (1.74) Residual Pre-Optimism by LEAD&IND 0.80*** (8.48) Observations 825 810 800 784 Adjusted R-squared 0.293 0.301 0.440 0.443
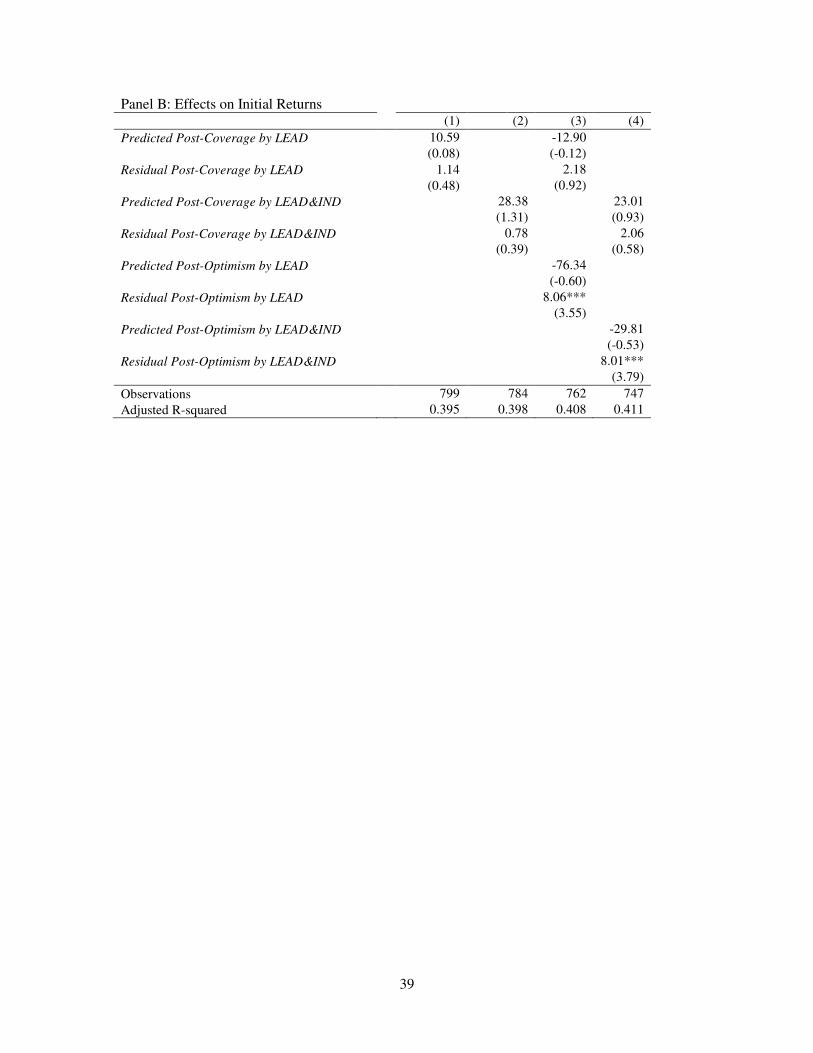
39
Panel B: Effects on Initial Returns (1) (2) (3) (4) Predicted Post-Coverage by LEAD 10.59 -12.90 (0.08) (-0.12) Residual Post-Coverage by LEAD 1.14 2.18 (0.48) (0.92) Predicted Post-Coverage by LEAD&IND 28.38 23.01 (1.31) (0.93) Residual Post-Coverage by LEAD&IND 0.78 2.06 (0.39) (0.58) Predicted Post-Optimism by LEAD -76.34 (-0.60) Residual Post-Optimism by LEAD 8.06*** (3.55) Predicted Post-Optimism by LEAD&IND -29.81 (-0.53) Residual Post-Optimism by LEAD&IND 8.01*** (3.79) Observations 799 784 762 747 Adjusted R-squared 0.395 0.398 0.408 0.411
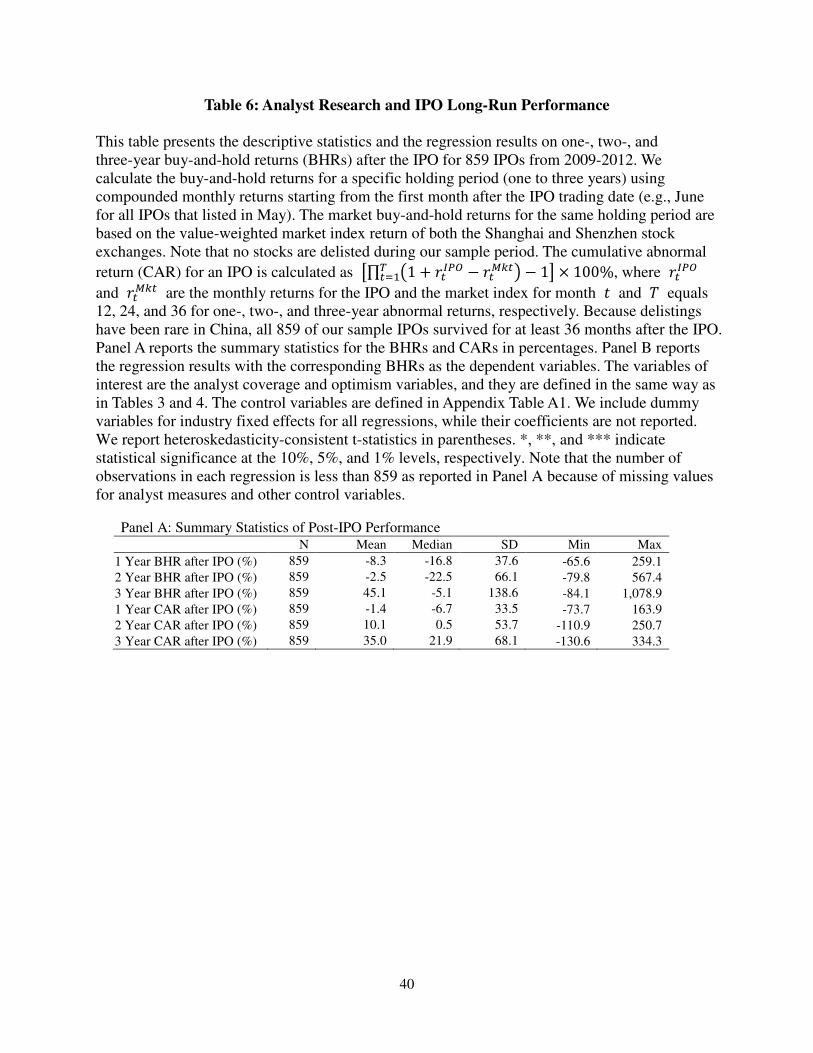
40
Table 6: Analyst Research and IPO Long-Run Performance
This table presents the descriptive statistics and the regression results on one-, two-, and three-year buy-and-hold returns (BHRs) after the IPO for 859 IPOs from 2009-2012. We calculate the buy-and-hold returns for a specific holding period (one to three years) using compounded monthly returns starting from the first month after the IPO trading date (e.g., June for all IPOs that listed in May). The market buy-and-hold returns for the same holding period are based on the value-weighted market index return of both the Shanghai and Shenzhen stock exchanges. Note that no stocks are delisted during our sample period. The cumulative abnormal return (CAR) for an IPO is calculated as .∏ 01 + �1234 − �156178
19: − 1; × 100%, where �1234 and �1561 are the monthly returns for the IPO and the market index for month � and = equals 12, 24, and 36 for one-, two-, and three-year abnormal returns, respectively. Because delistings have been rare in China, all 859 of our sample IPOs survived for at least 36 months after the IPO. Panel A reports the summary statistics for the BHRs and CARs in percentages. Panel B reports the regression results with the corresponding BHRs as the dependent variables. The variables of interest are the analyst coverage and optimism variables, and they are defined in the same way as in Tables 3 and 4. The control variables are defined in Appendix Table A1. We include dummy variables for industry fixed effects for all regressions, while their coefficients are not reported. We report heteroskedasticity-consistent t-statistics in parentheses. *, **, and *** indicate statistical significance at the 10%, 5%, and 1% levels, respectively. Note that the number of observations in each regression is less than 859 as reported in Panel A because of missing values for analyst measures and other control variables.
Panel A: Summary Statistics of Post-IPO Performance N Mean Median SD Min Max
1 Year BHR after IPO (%) 859 -8.3 -16.8 37.6 -65.6 259.1 2 Year BHR after IPO (%) 859 -2.5 -22.5 66.1 -79.8 567.4 3 Year BHR after IPO (%) 859 45.1 -5.1 138.6 -84.1 1,078.9 1 Year CAR after IPO (%) 859 -1.4 -6.7 33.5 -73.7 163.9 2 Year CAR after IPO (%) 859 10.1 0.5 53.7 -110.9 250.7 3 Year CAR after IPO (%) 859 35.0 21.9 68.1 -130.6 334.3
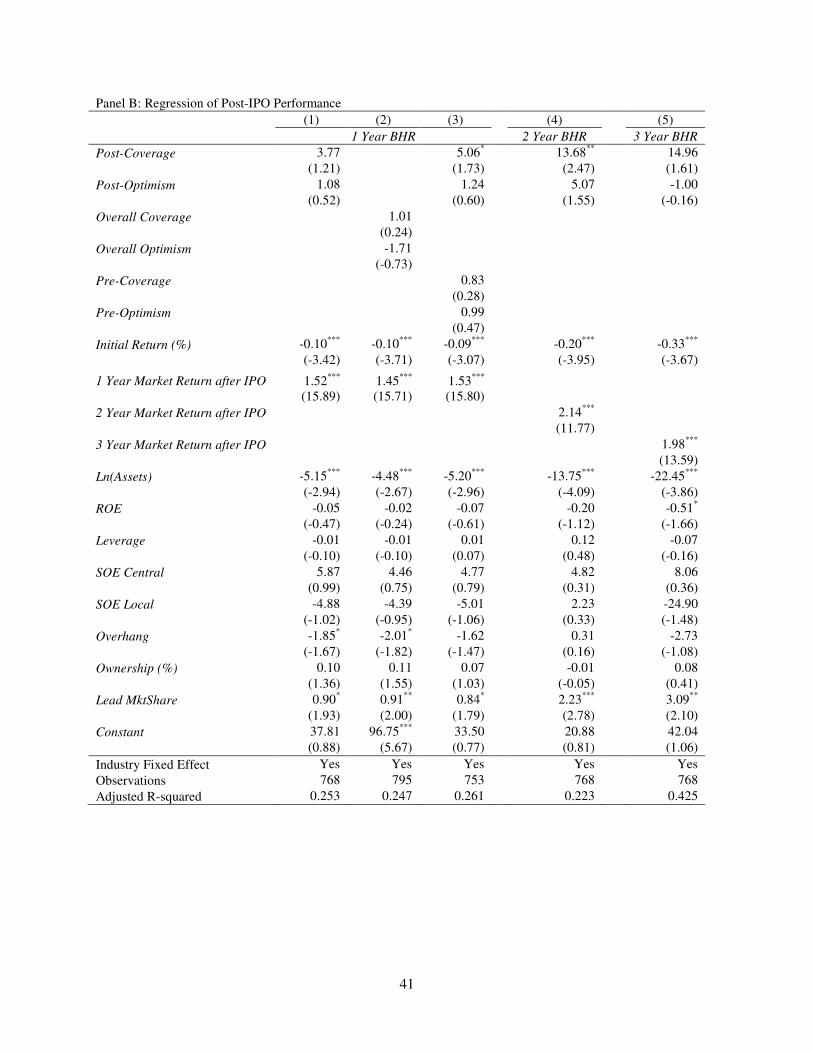
41
Panel B: Regression of Post-IPO Performance
(1) (2) (3) (4) (5) 1 Year BHR 2 Year BHR 3 Year BHR
Post-Coverage 3.77 5.06* 13.68** 14.96 (1.21) (1.73) (2.47) (1.61) Post-Optimism 1.08 1.24 5.07 -1.00 (0.52) (0.60) (1.55) (-0.16) Overall Coverage 1.01 (0.24) Overall Optimism -1.71 (-0.73) Pre-Coverage 0.83 (0.28) Pre-Optimism 0.99 (0.47) Initial Return (%) -0.10*** -0.10*** -0.09*** -0.20*** -0.33*** (-3.42) (-3.71) (-3.07) (-3.95) (-3.67)
1 Year Market Return after IPO 1.52*** 1.45*** 1.53***
(15.89) (15.71) (15.80) 2 Year Market Return after IPO 2.14*** (11.77) 3 Year Market Return after IPO 1.98*** (13.59) Ln(Assets) -5.15*** -4.48*** -5.20*** -13.75*** -22.45*** (-2.94) (-2.67) (-2.96) (-4.09) (-3.86) ROE -0.05 -0.02 -0.07 -0.20 -0.51* (-0.47) (-0.24) (-0.61) (-1.12) (-1.66) Leverage -0.01 -0.01 0.01 0.12 -0.07 (-0.10) (-0.10) (0.07) (0.48) (-0.16) SOE Central 5.87 4.46 4.77 4.82 8.06 (0.99) (0.75) (0.79) (0.31) (0.36) SOE Local -4.88 -4.39 -5.01 2.23 -24.90 (-1.02) (-0.95) (-1.06) (0.33) (-1.48) Overhang -1.85* -2.01* -1.62 0.31 -2.73 (-1.67) (-1.82) (-1.47) (0.16) (-1.08) Ownership (%) 0.10 0.11 0.07 -0.01 0.08 (1.36) (1.55) (1.03) (-0.05) (0.41) Lead MktShare 0.90* 0.91** 0.84* 2.23*** 3.09** (1.93) (2.00) (1.79) (2.78) (2.10) Constant 37.81 96.75*** 33.50 20.88 42.04 (0.88) (5.67) (0.77) (0.81) (1.06) Industry Fixed Effect Yes Yes Yes Yes Yes Observations 768 795 753 768 768 Adjusted R-squared 0.253 0.247 0.261 0.223 0.425
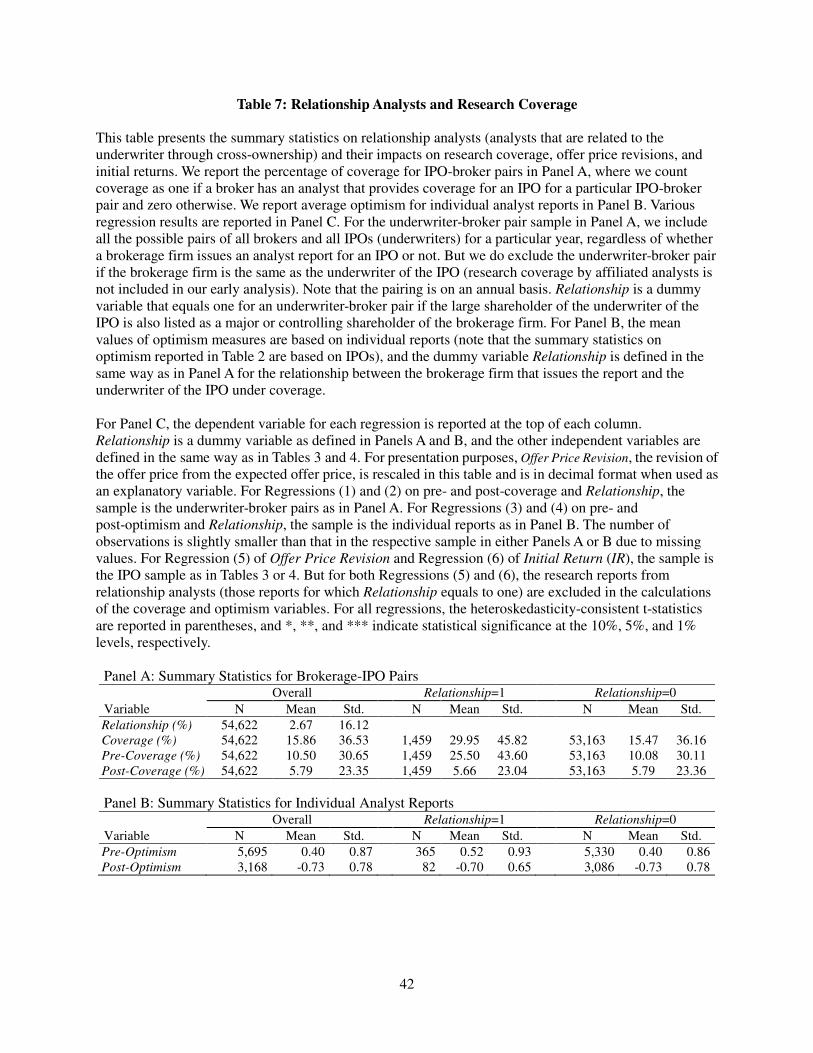
42
Table 7: Relationship Analysts and Research Coverage
This table presents the summary statistics on relationship analysts (analysts that are related to the underwriter through cross-ownership) and their impacts on research coverage, offer price revisions, and initial returns. We report the percentage of coverage for IPO-broker pairs in Panel A, where we count coverage as one if a broker has an analyst that provides coverage for an IPO for a particular IPO-broker pair and zero otherwise. We report average optimism for individual analyst reports in Panel B. Various regression results are reported in Panel C. For the underwriter-broker pair sample in Panel A, we include all the possible pairs of all brokers and all IPOs (underwriters) for a particular year, regardless of whether a brokerage firm issues an analyst report for an IPO or not. But we do exclude the underwriter-broker pair if the brokerage firm is the same as the underwriter of the IPO (research coverage by affiliated analysts is not included in our early analysis). Note that the pairing is on an annual basis. Relationship is a dummy variable that equals one for an underwriter-broker pair if the large shareholder of the underwriter of the IPO is also listed as a major or controlling shareholder of the brokerage firm. For Panel B, the mean values of optimism measures are based on individual reports (note that the summary statistics on optimism reported in Table 2 are based on IPOs), and the dummy variable Relationship is defined in the same way as in Panel A for the relationship between the brokerage firm that issues the report and the underwriter of the IPO under coverage. For Panel C, the dependent variable for each regression is reported at the top of each column. Relationship is a dummy variable as defined in Panels A and B, and the other independent variables are defined in the same way as in Tables 3 and 4. For presentation purposes, Offer Price Revision, the revision of the offer price from the expected offer price, is rescaled in this table and is in decimal format when used as an explanatory variable. For Regressions (1) and (2) on pre- and post-coverage and Relationship, the sample is the underwriter-broker pairs as in Panel A. For Regressions (3) and (4) on pre- and post-optimism and Relationship, the sample is the individual reports as in Panel B. The number of observations is slightly smaller than that in the respective sample in either Panels A or B due to missing values. For Regression (5) of Offer Price Revision and Regression (6) of Initial Return (IR), the sample is the IPO sample as in Tables 3 or 4. But for both Regressions (5) and (6), the research reports from relationship analysts (those reports for which Relationship equals to one) are excluded in the calculations of the coverage and optimism variables. For all regressions, the heteroskedasticity-consistent t-statistics are reported in parentheses, and *, **, and *** indicate statistical significance at the 10%, 5%, and 1% levels, respectively.
Panel A: Summary Statistics for Brokerage-IPO Pairs Overall Relationship=1 Relationship=0 Variable N Mean Std. N Mean Std. N Mean Std. Relationship (%) 54,622 2.67 16.12 Coverage (%) 54,622 15.86 36.53 1,459 29.95 45.82 53,163 15.47 36.16 Pre-Coverage (%) 54,622 10.50 30.65 1,459 25.50 43.60 53,163 10.08 30.11 Post-Coverage (%) 54,622 5.79 23.35 1,459 5.66 23.04 53,163 5.79 23.36 Panel B: Summary Statistics for Individual Analyst Reports Overall Relationship=1 Relationship=0 Variable N Mean Std. N Mean Std. N Mean Std. Pre-Optimism 5,695 0.40 0.87 365 0.52 0.93 5,330 0.40 0.86 Post-Optimism 3,168 -0.73 0.78 82 -0.70 0.65 3,086 -0.73 0.78
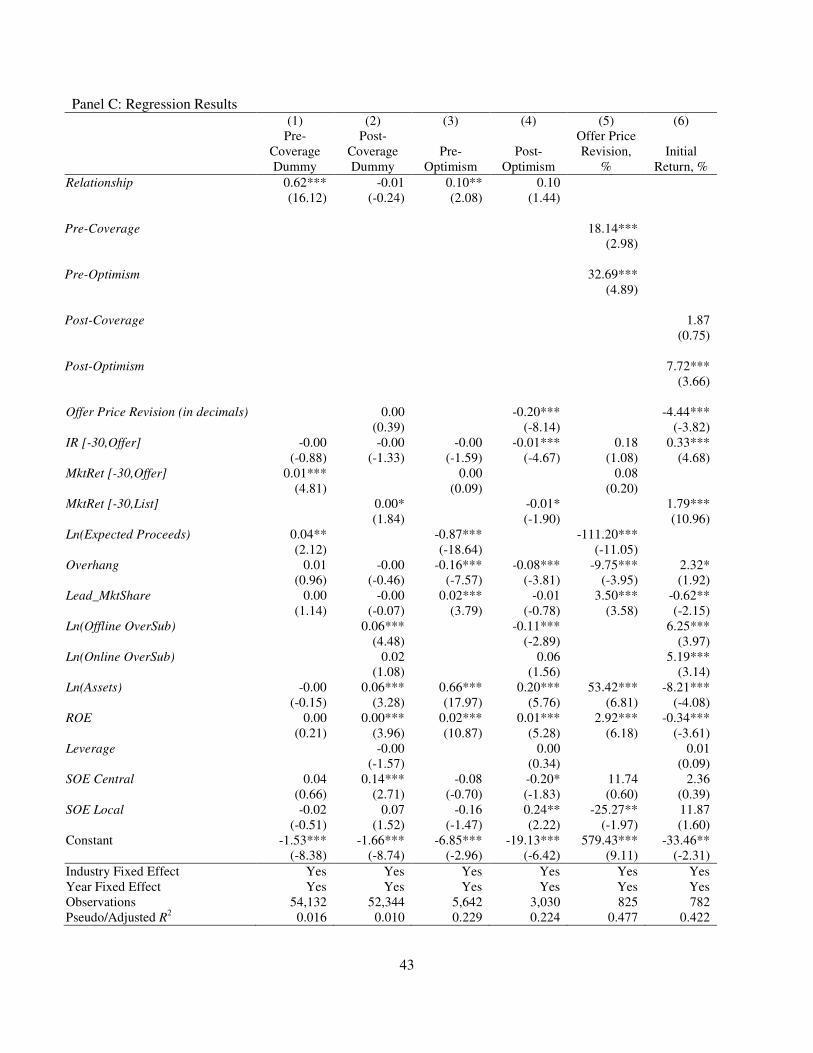
43
Panel C: Regression Results (1) (2) (3) (4) (5) (6) Pre-
Coverage Dummy
Post- Coverage Dummy
Pre- Optimism
Post- Optimism
Offer Price Revision,
% Initial
Return, % Relationship 0.62*** -0.01 0.10** 0.10 (16.12) (-0.24) (2.08) (1.44) Pre-Coverage 18.14*** (2.98) Pre-Optimism 32.69*** (4.89) Post-Coverage 1.87 (0.75) Post-Optimism 7.72*** (3.66) Offer Price Revision (in decimals) 0.00 -0.20*** -4.44***
(0.39) (-8.14) (-3.82) IR [-30,Offer] -0.00 -0.00 -0.00 -0.01*** 0.18 0.33*** (-0.88) (-1.33) (-1.59) (-4.67) (1.08) (4.68) MktRet [-30,Offer] 0.01*** 0.00 0.08 (4.81) (0.09) (0.20) MktRet [-30,List] 0.00* -0.01* 1.79*** (1.84) (-1.90) (10.96) Ln(Expected Proceeds) 0.04** -0.87*** -111.20*** (2.12) (-18.64) (-11.05) Overhang 0.01 -0.00 -0.16*** -0.08*** -9.75*** 2.32* (0.96) (-0.46) (-7.57) (-3.81) (-3.95) (1.92) Lead_MktShare 0.00 -0.00 0.02*** -0.01 3.50*** -0.62** (1.14) (-0.07) (3.79) (-0.78) (3.58) (-2.15) Ln(Offline OverSub) 0.06*** -0.11*** 6.25*** (4.48) (-2.89) (3.97) Ln(Online OverSub) 0.02 0.06 5.19*** (1.08) (1.56) (3.14) Ln(Assets) -0.00 0.06*** 0.66*** 0.20*** 53.42*** -8.21*** (-0.15) (3.28) (17.97) (5.76) (6.81) (-4.08) ROE 0.00 0.00*** 0.02*** 0.01*** 2.92*** -0.34*** (0.21) (3.96) (10.87) (5.28) (6.18) (-3.61) Leverage -0.00 0.00 0.01 (-1.57) (0.34) (0.09) SOE Central 0.04 0.14*** -0.08 -0.20* 11.74 2.36 (0.66) (2.71) (-0.70) (-1.83) (0.60) (0.39) SOE Local -0.02 0.07 -0.16 0.24** -25.27** 11.87 (-0.51) (1.52) (-1.47) (2.22) (-1.97) (1.60) Constant -1.53*** -1.66*** -6.85*** -19.13*** 579.43*** -33.46** (-8.38) (-8.74) (-2.96) (-6.42) (9.11) (-2.31) Industry Fixed Effect Yes Yes Yes Yes Yes Yes Year Fixed Effect Yes Yes Yes Yes Yes Yes Observations 54,132 52,344 5,642 3,030 825 782 Pseudo/Adjusted R2 0.016 0.010 0.229 0.224 0.477 0.422

44
Appendix: Table A1 Variable Definitions
We use data from the China Stock Market & Accounting Research (CSMAR) database or directly from the IPO prospectus filed with the CSRC to construct the variables for IPOs from 2009-2012. Most of the data are from the CSMAR database unless otherwise noted. For sales, assets, and proceeds (actual and expected), the number is adjusted for inflation and is expressed in the 2011 level of Chinese yuan. The numbers for the IPOs of 2012 are not adjusted.
Variable Definition IR (%) The percentage change from the offer price to the first-day market closing price. Offer Price Revision
(%)
The percentage change from the expected offer price to the offer price.
Expected Offer Price The ratio of the expected proceeds divided by the expected number of shares offered as approved by the CSRC.
Expected Proceeds The proposed investments for the use of IPO proceeds as reported in the prospectus. This data item is manually retrieved from the prospectus. Filings with the CSRC by public firms can be found at CNINFO (http://www.cninfo.com.cn/information/companyinfo.html).
Expected No. of Shares The maximum number of shares that can be offered as being approved by the CSRC. Proceeds Offer price times the number of shares offered, where the number of shares offered
is almost always the maximum number of shares approved by the CSRC. Ln(Expected Proceeds) The natural logarithm of expected proceeds.
Offline
Oversubscription
The ratio of the total subscriptions from institutional investors divided by the number of shares that are allocated to institutional investors.
Online
Oversubscription
The ratio of total subscriptions from retail investors divided by the number of shares that are allocated to retail investors.
Ln(Offline OverSub) The natural logarithm of Offline Oversubscription. Ln(Online OverSub) The natural logarithm of Online Oversubscription. Overhang The number of shares retained divided by the number of shares offered. IR [-30,Offer] Average percentage initial return for the IPOs during the past 30 calendar days
before the offer date of the current IPO. IR [-30,Listing] Average percentage initial return for IPOs during the past 30 calendar days before
the listing date of the current IPO. MktRet [-30, Offer] The compounded market percentage return for the past 30 calendar days before offer
date of the current IPO. Market returns are based on the value-weighted index of all stocks listed on the Shanghai or Shenzhen stock exchanges.
MktRet [-30,Listing] The compounded market percentage return for the past 30 calendar days before the listing date of the current IPO.
Lead MktShare The percentage market share for a lead underwriter based on the total IPO proceeds credited to the lead divided by the total proceeds of all IPOs during the past three years from the current IPO. For multiple lead underwriters in an IPO, the proceeds are split equally for each underwriter.
Assets Total assets for the latest fiscal year before the IPO. Ln(Assets) The natural logarithm of assets. Sales Sales for the latest fiscal year before the IPO. Leverage (%) Percentage of total debt over assets for the latest fiscal year before the IPO. ROE (%) Return on equity for the latest fiscal year before IPO.
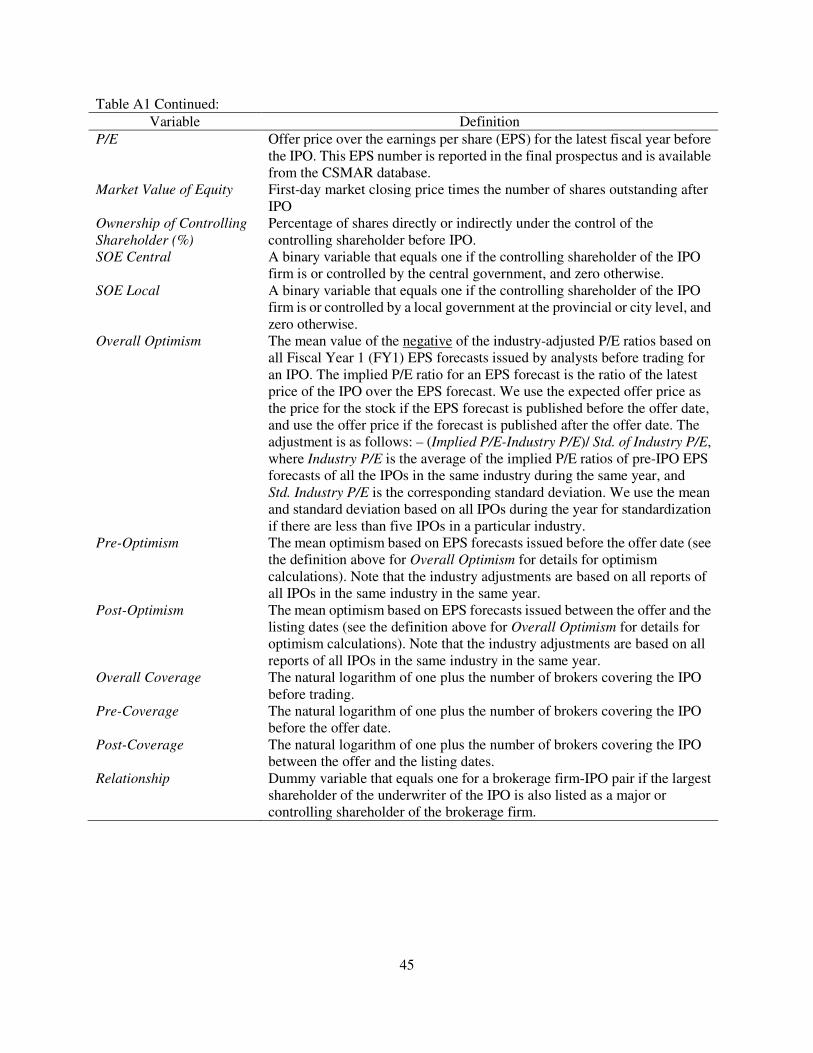
45
Table A1 Continued: Variable Definition
P/E
Market Value of Equity
Offer price over the earnings per share (EPS) for the latest fiscal year before the IPO. This EPS number is reported in the final prospectus and is available from the CSMAR database. First-day market closing price times the number of shares outstanding after IPO
Ownership of Controlling
Shareholder (%)
Percentage of shares directly or indirectly under the control of the controlling shareholder before IPO.
SOE Central A binary variable that equals one if the controlling shareholder of the IPO firm is or controlled by the central government, and zero otherwise.
SOE Local A binary variable that equals one if the controlling shareholder of the IPO firm is or controlled by a local government at the provincial or city level, and zero otherwise.
Overall Optimism The mean value of the negative of the industry-adjusted P/E ratios based on all Fiscal Year 1 (FY1) EPS forecasts issued by analysts before trading for an IPO. The implied P/E ratio for an EPS forecast is the ratio of the latest price of the IPO over the EPS forecast. We use the expected offer price as the price for the stock if the EPS forecast is published before the offer date, and use the offer price if the forecast is published after the offer date. The adjustment is as follows: – (Implied P/E-Industry P/E)/ Std. of Industry P/E, where Industry P/E is the average of the implied P/E ratios of pre-IPO EPS forecasts of all the IPOs in the same industry during the same year, and Std. Industry P/E is the corresponding standard deviation. We use the mean and standard deviation based on all IPOs during the year for standardization if there are less than five IPOs in a particular industry.
Pre-Optimism The mean optimism based on EPS forecasts issued before the offer date (see the definition above for Overall Optimism for details for optimism calculations). Note that the industry adjustments are based on all reports of all IPOs in the same industry in the same year.
Post-Optimism The mean optimism based on EPS forecasts issued between the offer and the listing dates (see the definition above for Overall Optimism for details for optimism calculations). Note that the industry adjustments are based on all reports of all IPOs in the same industry in the same year.
Overall Coverage The natural logarithm of one plus the number of brokers covering the IPO before trading.
Pre-Coverage The natural logarithm of one plus the number of brokers covering the IPO before the offer date.
Post-Coverage The natural logarithm of one plus the number of brokers covering the IPO between the offer and the listing dates.
Relationship Dummy variable that equals one for a brokerage firm-IPO pair if the largest shareholder of the underwriter of the IPO is also listed as a major or controlling shareholder of the brokerage firm.
46
Internet Appendix: Endogeneity of Analyst Coverage and 2SLS Regressions
IA.1 Endogeneity of Analyst Coverage
To shed light on the sources of potential biases due to endogenous analyst coverage, we
use offer price revision and analyst coverage to illustrate the sources of possible endogeneity.
The structural equations for offer price revision (Revision) and analyst coverage (Analyst) are as
follows:
,������� = >: + ?:@������ + A:B����� + C:� + D: (1)
B����� = >E + ?E@������ + CE� + DE (2)
In Equations (1) and (2), we explicitly separate out from the control variables the source of
information, denoted as �, that can be observed by an analyst but not an econometrician. The
information contained in � affects offer price revision, and its impact can be captured by a
regression as in Equation (1) in two different ways. First, if CE ≠ 0, that is, an analyst
incorporates her information into her coverage as captured by B�����, the impact of � on
,������� in Equation (1) will be captured by B����� and its coefficient A:. In this case, C:
is likely to be zero. Since the error term D: is uncorrelated with other right-hand-side variables
in Equation (1), we do not have an omitted variables concern. Second, if the analyst does not
incorporate her information into her coverage and she does this in a systematic way, i.e., CE = 0,
the impact of � on offer price revision will not be captured by B����� and its coefficient A:.
We then have C: ≠ 0. Since � cannot be explicitly controlled for, C:� + D: will become the
new error term. If � is correlated with any control variables in Equations (1) and (2), the new
error term will be correlated with some of the right-hand-side variables. This will create an
omitted-variable bias in estimating Equation (1).
For this omitted variable problem to arise, we assume that an analyst can observe �,
which affects the offer price revision, but � is not incorporated into her research coverage. This
lack of incorporation is possible, but we do not see strong reasons for such a case. To the
contrary, it is more likely that an analyst will base her research coverage on both public
information (partly captured by the control variables) and her private information captured by �.
This is the rationale for us to separate analyst coverage into a predicted part and an innovation
part and relate both to offer price revision and initial return in the next section. This is also the
47
rationale for us to use the innovation part, which is related to the analyst’s private information, �,
to capture analyst information production.21
We can make similar arguments with initial returns and analyst optimism. In addition to
� being omitted and thus being part of the error term in Equation (1), endogeneity biases can
also arise if D: and DE are correlated. Again we do not see a strong reason for this to be a
significant concern. But nevertheless, to make sure that endogeneity concerns do not drive our
results, in the next sub-section, we employ an instrumental variable (IV) approach and 2SLS
regressions to re-examine the relations between analyst coverage/optimism, offer price revisions,
and initial returns.
IA.2 2SLS Regression Results
We first decompose the pre- and post-offer date coverage and optimism measures into
predicted and innovation (residual) components. More specifically, we use two historical
measures as instrumental variables for the first-stage regressions, which we call the lead
momentum and the industry momentum. We use the average number of brokers and the average
optimism from all pre-IPO reports on IPOs underwritten by the same lead underwriter of the
current IPO during the last twelve months (LTM) to capture the lead momentum (or the effect of
potential lead connections). We also use the LTM averages for all pre-IPO reports on all IPOs in
the same industry of the current IPO to capture the market sentiment for the industry. For ease of
presentation, we term it industry momentum. We denote these four variables as LTM Lead
Pre-Coverage, LTM Industry Pre-Coverage, LTM Lead Pre-Optimism, and LTM Industry
Pre-Optimism, respectively, for the four LTM averages based on pre-offer date coverage and
optimism. The historical variables for the post-offer analyst coverage and optimism variables are
labeled in the same way.22
We argue that these historical variables can be useful IVs. It is well documented that
analysts are more likely to provide coverage and when they do, provide more optimistic
coverage, for stocks with which they have connections (Mola and Guidolin (2009), Irvine (2001),
and Niehaus and Zhang (2010)). Such connections can affect both current and past IPO research
21 If an analyst incorporates only part of her private information into her research reports, the above arguments will also apply (�can be viewed as the information that is being withheld) and endogeneity concerns still arise. We do not see any obvious reasons for analysts to withhold private information on China’s IPO market. 22 We use the last twelve months for which an underwriter has non-zero IPOs for each month. We go back for more than twelve calendar months if an underwriter does not have any IPOs during a particular month. We do so to minimize the impact of zeros on the mean calculations. We also use the last twelve calendar months for our calculations, and the results are virtually the same.
48
coverage. An analyst would thus be more likely to cover the lead underwriter’s current IPO if he
has covered the same underwriter’s past IPOs, suggesting that LTM measures based on lead
underwriters are relevant. IPOs also come in waves and firms from similar industries are often
clustered. This industry clustering suggests that the industry-based LTM measures are also
relevant. For these LTM measures to be valid IVs, we also need them to be uncorrelated with the
error terms of the respective second-stage regressions, i.e., these LTM measures are exogenous.
Note that the endogeneity concern is that information in � in Equations (1) and (2) is contained
in the regression error terms, and this happens because analyst coverage and optimism measures
can only partly capture the private information of the analysts represented by �. It is unlikely
that the historical measures for other IPOs by the same underwriter are correlated with the
private information of the current IPO. For the industry LTM measures, industry return
momentum likely causes series correlations, but analyst private information should not be
strongly auto-correlated. So both lead and industry LTM measures likely satisfy the exclusion
condition.
We report the first-stage regressions in Internet Appendix Table IA1. Note that no
industry or year fixed effects are included in these regressions since the LTM variables help to
capture such effects. For each of the four measures for pre- and post-offer date coverage and
optimism, we report two regressions: one with only lead-related LTM variables, and one with
both lead- and industry-related LTM variables.23 Also note that our control variables differ
depending on whether the dependent variable is pre- or post-offer date.
For pre-offer date coverage, the coefficients on the pre-offer date lead-based LTM
coverage measure, LTM Lead Pre-Coverage, are positive but insignificant in both Regressions (1)
and (2) in Internet Appendix Table IA1. For pre-offer date optimism, the coefficients on the
average optimism of past IPOs by the same underwriter are actually significantly negative. As
we show in Table 7 on relationship analysts that are affiliated through cross-ownership,
connected analysts are actually more likely to cover an IPO and are more likely to be more
positive. So these results are somewhat surprising. These results suggest that interactions with
the lead underwriter through past IPOs do not result in more coverage or more positive coverage
of the current IPO.
23 We use the lead-only based predictive component to address any concerns that the industry-based LTM measures can still be endogenous due to time-series correlations in industry momentums.
49
For the historical averages of past IPOs in the same industry, the historical analyst
coverage measures have positive and statistically significant coefficients. But historical optimism
has negative coefficients for both pre- and post-offer date optimism, although it is only
marginally significant for pre-offer date optimism and is insignificant for post-offer date
optimism. Put together, these results suggest that analysts are likely to have industry expertise –
if we have more analysts covering a social media IPO, we will have more analysts covering
another IPO if it is also from the industry of social media. But these analysts do not seem to
show any systematic biases in their coverage as their coverage optimism does not show any
persistence.
We report the second-stage regression results with the predicted values of analyst
coverage and optimism in Regressions (1) – (4) in Panels A (offer price revisions) and B (initial
returns) of Internet Appendix Table IA2. Compared to the results reported in Tables 3 and 4,
only predicted pre- coverage by lead and industry has a marginally significant effect on the offer
price revision; other predicted values for coverage and optimism measures are all statistically
insignificant. There could be two reasons for the insignificance of the coefficients on these
predicted values. One, we simply do not have good instrument variables. The pre-coverage and
post-coverage first-stage regressions both have ,Es below 10%. Two, these insignificant results
for the second-stage regressions are simply because there is little left to predict and there are no
significant omitted variable bias concerns. As we discussed in Section IA.1, endogeneity
concerns arise if our analyst measures fail to capture some information that is related to IPO
price revision and initial returns. Our results in Table 7 suggest that relationship analysts tend to
support a lead underwriter with which they have connections. If many analysts withhold or
exaggerate good or bad news in their coverage decisions and earnings forecasts, it is very likely
that some patterns would arise between past and current analyst coverage measures for IPOs by
the same lead underwriter. We do not observe that in our first- and second-stage regressions.
Also, our industry-related historical measures have some prediction power in the first-stage
regressions as reported in Internet Appendix Table IA1, but what such prediction power captures
is unrelated to IPO pricing as the predicted variables based on these historical measures show
little significance in the second-stage regressions. So we think that the second possibility is
probably more relevant for our results.
Overall, although our 2SLS results suggest that our historical measures do not preserve

50
the prediction power of analyst coverage and optimism measures, the overall pattern from both
the first- and the second-stage regression results suggests that endogeneity issues are not a
significant concern. Or put differently, private information in � is more likely to be captured by
our analyst measures if they have an impact on offer price revisions or initial returns.24
24 Hong and Kacperczyk (2010), Kelly and Ljungqvist (2012), and Derrien and Kecskés (2013) use mergers and closures of brokerage and investment banking firms and the resulted reduction in analyst coverage for seasoned stocks as an exogenous shock to study the effect of analyst coverage on analyst forecasting biases, information asymmetry, and investments. Although there are very few mergers and closures of brokerages in China during our sample period, due to intensive competition many brokerage firms cut their research teams or even closed their research departments altogether from 2009 to 2012. We track the disappearance of analysts due to these cuts and closures and treat them as exogenous shocks to stock coverage. More specifically, for the current IPO underwritten by a particular investment bank, say, bank A, if analyst B covered IPOs underwritten by bank A within three years of the current IPO and analyst B's affiliated firm experienced a downsizing and analyst B is no longer in the sample, we treat analyst B as a reduction for potential coverage for bank A's current IPO. We treat such potential analyst coverage reduction as being exogenous. We find that such potential analyst coverage reductions have a negative effect on offer price revisions, consist with our OLS regression results reported in Table 3. Our analyst coverage reduction measure is very noisy since we can only identify potential, not ongoing, coverage reductions. As a result, the negative relationship between the exogenous coverage reduction measure and offer price revisions is statistically insignificant.
51
Internet Appendix Table IA1: Predicting Analyst Coverage and Optimism: First-Stage Regressions
This table presents the regression results for predicting analyst coverage and optimism for an IPO by using the last twelve
month (LTM) average coverage and average optimism. For the pre-offer date period, the dependent variables, Pre-Coverage
and Pre-Optimism, are the same as in Table 3: the natural logarithm of one plus the number of brokers covering the IPO before
the offer date and the mean value of the negative of the industry adjusted implied P/E ratio based on all FY1 EPS forecasts
prior to the offer date for the IPO, respectively. For the period after the offer date to the listing date, the dependent variables,
Post-Coverage and Post-Optimism, are the same as in Table 4: the natural logarithm of one plus the number of brokers
covering the IPO between the offer and the listing dates and the mean value of the negative of the industry adjusted implied
P/E ratio based on all FY1 EPS forecasts between the offer and the listing dates for the IPO, respectively. In addition to the
firm and issue characteristics of an IPO, we also use LTM Lead Pre-Coverage, LTM Industry Pre-Coverage, LTM Lead
Pre-Optimism, and LTM Industry Pre-Optimism for the pre-offer period regressions, and LTM Lead Post-Coverage, LTM
Industry Post-Coverage, LTM Lead Post-Optimism, and LTM Industry Post-Optimism for the post-offer period regressions. As
indicated by each variable name, for an IPO, the variables are the average of a particular variable for all IPOs by either the same
lead underwriter or the same industry during the last twelve month from the IPO. For example, LTM Lead Pre-Coverage is the
average of Pre-Coverage for all IPOs during the last twelve month prior to the current IPO by the same lead underwriter, and
LTM Industry Pre-Coverage, the average of Pre-Coverage for all IPOs in the same industry during the last twelve month prior
to the current IPO. For either variable, if a month has no IPOs, we go back one extra calendar month until we have twelve months
with IPOs. For presentation purposes, MktRet[-30 Offer] (MktRet[-30 Listing]), the market returns for the past 30 calendar days
prior to the offer (listing date), Offer Price Revision, the revision of the offer price from the expected offer price, and IR[-30
Offer], the average initial return of IPOs during the past 30 calendar days prior to the offer date of the current IPO, have been
rescaled in this table and are in decimals. For the definitions of other control variables, see Tables 3, 4, and A1. We report
heteroskedasticity-consistent t-statistics in parentheses. *, **, and *** indicate statistical significance at the 10%, 5%, and 1%
levels, respectively.
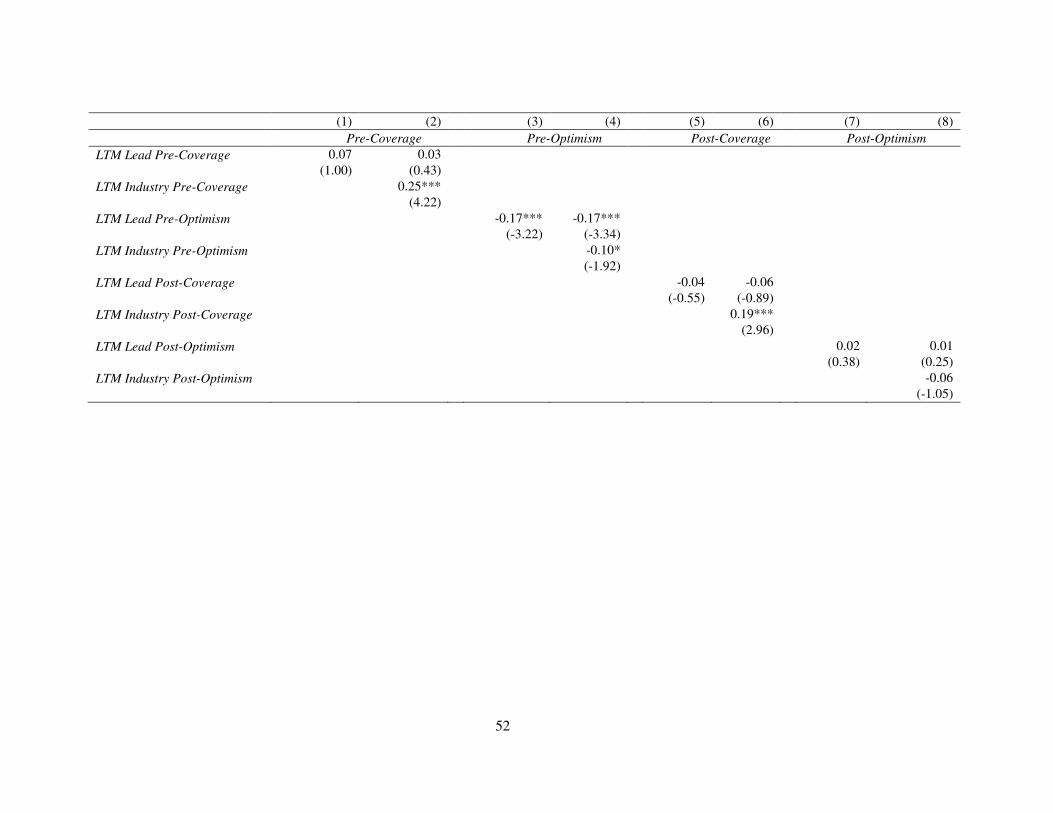
52
(1) (2) (3) (4) (5) (6) (7) (8) Pre-Coverage Pre-Optimism Post-Coverage Post-Optimism
LTM Lead Pre-Coverage 0.07 0.03 (1.00) (0.43) LTM Industry Pre-Coverage 0.25*** (4.22) LTM Lead Pre-Optimism -0.17*** -0.17*** (-3.22) (-3.34) LTM Industry Pre-Optimism -0.10* (-1.92) LTM Lead Post-Coverage -0.04 -0.06 (-0.55) (-0.89) LTM Industry Post-Coverage 0.19*** (2.96) LTM Lead Post-Optimism 0.02 0.01 (0.38) (0.25) LTM Industry Post-Optimism -0.06 (-1.05)
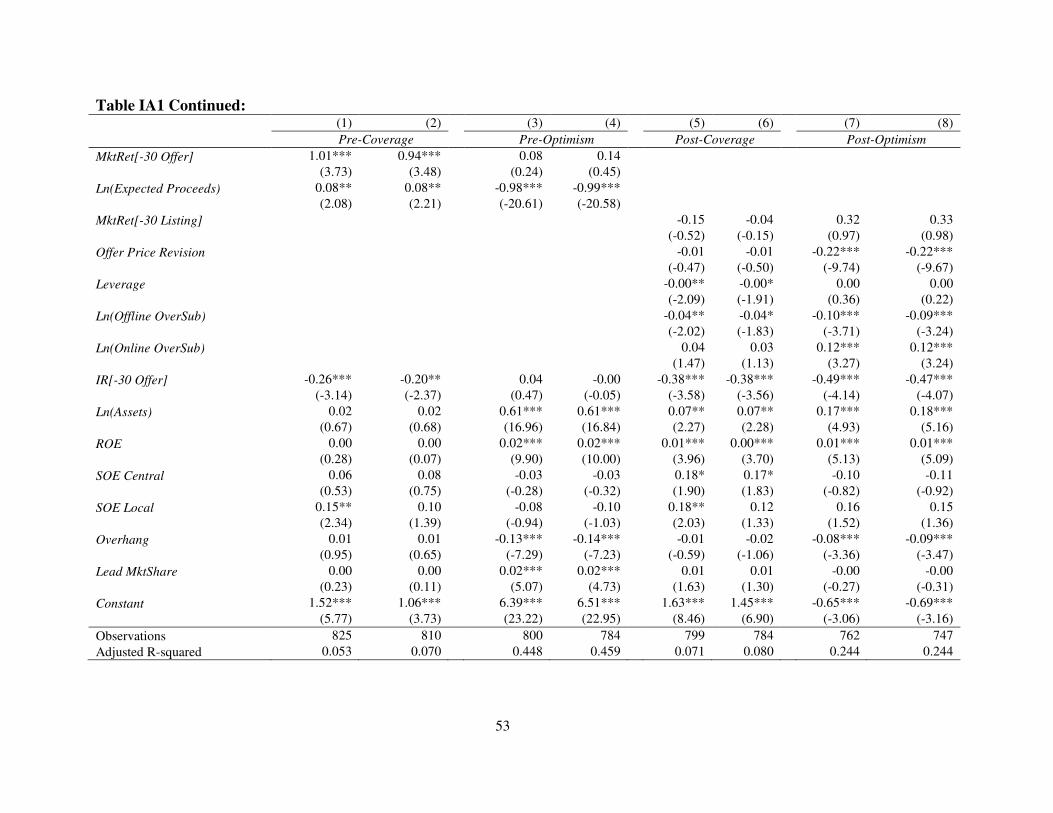
53
Table IA1 Continued: (1) (2) (3) (4) (5) (6) (7) (8) Pre-Coverage Pre-Optimism Post-Coverage Post-Optimism
MktRet[-30 Offer] 1.01*** 0.94*** 0.08 0.14 (3.73) (3.48) (0.24) (0.45) Ln(Expected Proceeds) 0.08** 0.08** -0.98*** -0.99*** (2.08) (2.21) (-20.61) (-20.58) MktRet[-30 Listing] -0.15 -0.04 0.32 0.33 (-0.52) (-0.15) (0.97) (0.98) Offer Price Revision -0.01 -0.01 -0.22*** -0.22*** (-0.47) (-0.50) (-9.74) (-9.67) Leverage -0.00** -0.00* 0.00 0.00 (-2.09) (-1.91) (0.36) (0.22) Ln(Offline OverSub) -0.04** -0.04* -0.10*** -0.09*** (-2.02) (-1.83) (-3.71) (-3.24) Ln(Online OverSub) 0.04 0.03 0.12*** 0.12*** (1.47) (1.13) (3.27) (3.24) IR[-30 Offer] -0.26*** -0.20** 0.04 -0.00 -0.38*** -0.38*** -0.49*** -0.47*** (-3.14) (-2.37) (0.47) (-0.05) (-3.58) (-3.56) (-4.14) (-4.07) Ln(Assets) 0.02 0.02 0.61*** 0.61*** 0.07** 0.07** 0.17*** 0.18*** (0.67) (0.68) (16.96) (16.84) (2.27) (2.28) (4.93) (5.16) ROE 0.00 0.00 0.02*** 0.02*** 0.01*** 0.00*** 0.01*** 0.01*** (0.28) (0.07) (9.90) (10.00) (3.96) (3.70) (5.13) (5.09) SOE Central 0.06 0.08 -0.03 -0.03 0.18* 0.17* -0.10 -0.11 (0.53) (0.75) (-0.28) (-0.32) (1.90) (1.83) (-0.82) (-0.92) SOE Local 0.15** 0.10 -0.08 -0.10 0.18** 0.12 0.16 0.15 (2.34) (1.39) (-0.94) (-1.03) (2.03) (1.33) (1.52) (1.36) Overhang 0.01 0.01 -0.13*** -0.14*** -0.01 -0.02 -0.08*** -0.09*** (0.95) (0.65) (-7.29) (-7.23) (-0.59) (-1.06) (-3.36) (-3.47) Lead MktShare 0.00 0.00 0.02*** 0.02*** 0.01 0.01 -0.00 -0.00 (0.23) (0.11) (5.07) (4.73) (1.63) (1.30) (-0.27) (-0.31) Constant 1.52*** 1.06*** 6.39*** 6.51*** 1.63*** 1.45*** -0.65*** -0.69*** (5.77) (3.73) (23.22) (22.95) (8.46) (6.90) (-3.06) (-3.16) Observations 825 810 800 784 799 784 762 747 Adjusted R-squared 0.053 0.070 0.448 0.459 0.071 0.080 0.244 0.244
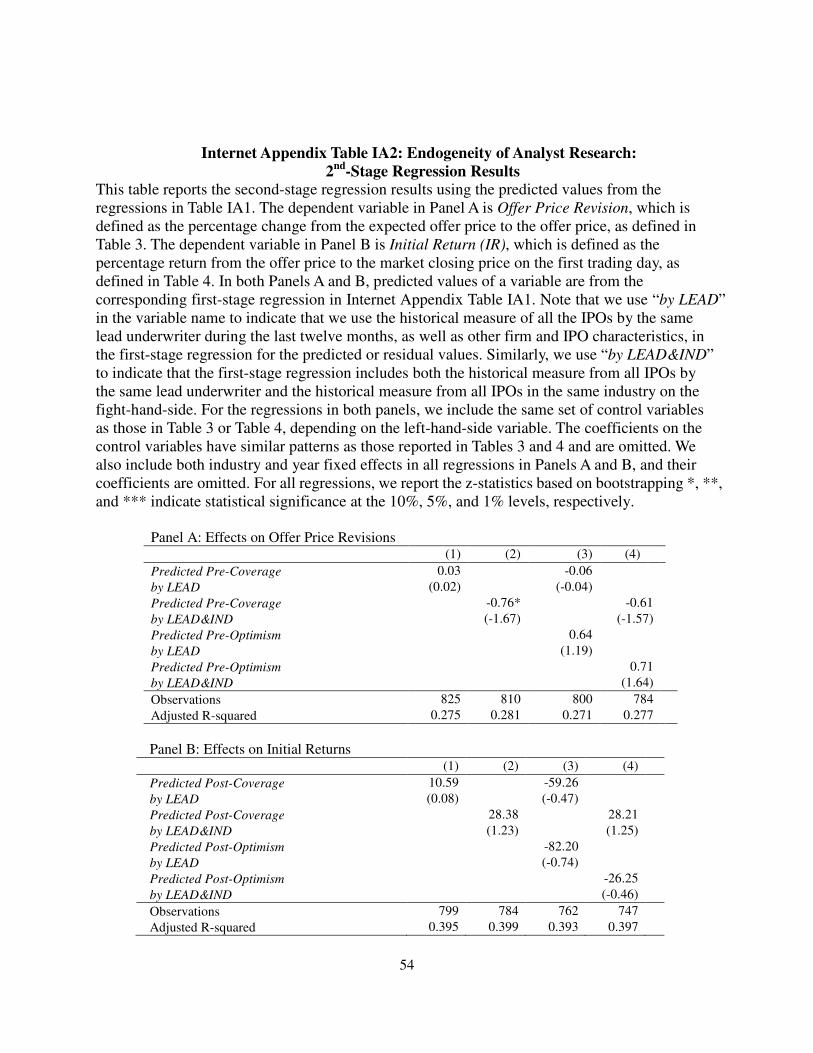
54
Internet Appendix Table IA2: Endogeneity of Analyst Research:
2nd
-Stage Regression Results
This table reports the second-stage regression results using the predicted values from the regressions in Table IA1. The dependent variable in Panel A is Offer Price Revision, which is defined as the percentage change from the expected offer price to the offer price, as defined in Table 3. The dependent variable in Panel B is Initial Return (IR), which is defined as the percentage return from the offer price to the market closing price on the first trading day, as defined in Table 4. In both Panels A and B, predicted values of a variable are from the corresponding first-stage regression in Internet Appendix Table IA1. Note that we use “by LEAD” in the variable name to indicate that we use the historical measure of all the IPOs by the same lead underwriter during the last twelve months, as well as other firm and IPO characteristics, in the first-stage regression for the predicted or residual values. Similarly, we use “by LEAD&IND” to indicate that the first-stage regression includes both the historical measure from all IPOs by the same lead underwriter and the historical measure from all IPOs in the same industry on the fight-hand-side. For the regressions in both panels, we include the same set of control variables as those in Table 3 or Table 4, depending on the left-hand-side variable. The coefficients on the control variables have similar patterns as those reported in Tables 3 and 4 and are omitted. We also include both industry and year fixed effects in all regressions in Panels A and B, and their coefficients are omitted. For all regressions, we report the z-statistics based on bootstrapping *, **, and *** indicate statistical significance at the 10%, 5%, and 1% levels, respectively.
Panel A: Effects on Offer Price Revisions (1) (2) (3) (4) Predicted Pre-Coverage 0.03 -0.06 by LEAD (0.02) (-0.04) Predicted Pre-Coverage -0.76* -0.61 by LEAD&IND (-1.67) (-1.57) Predicted Pre-Optimism 0.64 by LEAD (1.19) Predicted Pre-Optimism 0.71 by LEAD&IND (1.64) Observations 825 810 800 784 Adjusted R-squared 0.275 0.281 0.271 0.277
Panel B: Effects on Initial Returns
(1) (2) (3) (4) Predicted Post-Coverage 10.59 -59.26 by LEAD (0.08) (-0.47) Predicted Post-Coverage 28.38 28.21 by LEAD&IND (1.23) (1.25) Predicted Post-Optimism -82.20 by LEAD (-0.74) Predicted Post-Optimism -26.25 by LEAD&IND (-0.46) Observations 799 784 762 747 Adjusted R-squared 0.395 0.399 0.393 0.397