pre-feasibility investigation of infrared thermography for
TRANSCRIPT
Safety in Mines Research Advisory Committee
Final Report (Revised)
Pre-feasibility investigationof infrared thermography for
the identification of loosehangingwall and impending
falls of ground
Author: Dr V A Kononov
Research agency: CSIR Division of Mining Technology
Project number: GAP706
Date of report: September 2000
2
Executive summary
This report presents the results of a pre-feasibility study of Infrared (IR) Thermography/Radiometryfor detection of loose rock in hard rock mines. The method is based on the temperature difference(gradient) between solid rock and the tip of loose rock due to the heat exchange between looserock and ventilation air.
Early attempts to introduce this method of loose rock detection took place in the 1970’s in NorthAmerica. A relatively low temperature difference (5-8 0C) between the solid rock and ventilation airin mines is one of the possible explanations why the method has never been developed to acommercial stage. It was proposed that South African hard rock mine conditions would favour themethod due to the high rock temperatures and the relatively low temperature of the ventilation air.
Theoretical evaluation demonstrated that a temperature gradient of as much as 3-5 0C betweensolid rock and the tip of a loose rock could be expected in local hard rock mines. Four undergroundtests confirmed that an IR Radiometer with a 0.1 0C resolution could indeed detect loose rock. Inpractice, the maximum temperature gradient obtained between solid and loose rock was 5 0C.
Further investigation is required to establish a possible correlation between the temperaturegradient between solid and loose rock on the one hand and the level of the hazard on the other.
The IR radiometers currently available on the market are not able to provide reliable operation inthe harsh underground environment, particularly in deep gold mines. They also cannot be used ina potentially explosive atmosphere. A portable mine-worthy, intrinsically safe IR radiometer shouldbe developed for use in roof and wall scanning before any work is done in a particular area.
It is proposed to use IR Thermography/Radiometry for other aspects of mine safety, such ascondition monitoring of mechanical and electrical/electronic equipment.

3
Acknowledgements
I would like to express my gratitude towards the Kloof and Moab Khotsong Gold Mines andRustenburg Platinum Mine for the perfect organization of the underground tests and full supportduring implementation of the project.
Special thanks to my colleagues at CSIR Miningtek: Mr B.Spottiswoode and Mr K. Walker whoseefforts led to the project being implemented, as well as to Mr R. Hattingh for his assistance.
4
Table of contents
Executive summary 2Acknowledgements 3List of Figures 5Definitions and abbreviations 6
1 Introduction 7
2 Methods of remote non-contact temperature measurement 72.1 Infrared radiometry and some related problems of remote temperature
measurement 92.2 Infrared thermography 10
3 IR remote temperature measurement for industry application 103.1 Surface transport 103.2 Underground roof condition monitoring 113.3 Other underground applications 12
4. Theoretical estimation of heat transfer between a tunnelsurface and air flow 13
4.1 General South African underground environment andthe proposed method of loose rock location 13
4.2 Assumptions and initial data 134.3 Expected temperature gradient 16
5 Experimental evaluation of heat transfer 205.1 Methodology used 205.2 Instrumentation used for underground experiments 205.3 Results of tests in gold mines 205.3.1 Moab Khotsong Mine 205.3.2 Kloof Gold Mine 215.4 Results of tests in platinum mines 22
6 Comparison of obtained theoretical and practical results 23
7 Conclusion and recommendations 24
References 26
5
List of FiguresPage
Figure 2.1 Spectral radiant emittance of a blackbody 8
Figure 4.2.1 A 1-D fin model using theoretical correlations 13
Figure 4.2.2 Temperature profile in the slab (1-D fin model) 15
Figure 4.2.3 Temperature profile from the tunnel wall to thesurrounding rock 15
Figure 4.3.1 Results for case one (slab=1x1x0.4 m, air velocity 0.5 m/s) 17
Figure 4.3.2 Results for case two (slab=1x1x0.4 m, air velocity 1.0 m/s) 18
Figure 4.3.3 Results for case three (slab=0.8x1x0.4 m, air velocity 5 m/s) 18
Figure 4.3.4 Results for case four (slab=0.8x1x0.3 m, air velocity 0.5 m/s) 19
Figure 4.3.5 Results for one-month old mining 19
Figure 5.3.2.1 Site one 21
Figure 5.3.2.2 Site two 22
Figure 5.3.2.3 Site three 22

6
Definitions and abbreviations
IR Infrared (radiation, spectrum, source, detector, optics etc.)ε Emissivity: the ratio of radiant emittance of an object to that of a blackbody
at the same temperature krock Thermal conductivity of rock (W/mK)α Thermal diffusivity (m2/s)θ Age of the mining (s)dh Hydraulic diameter (m)hc Heat transfer coefficient (W/m2K)P Tunnel perimeter (m)Ts Tunnel wall temperature (°C)Tdb Dry bulb temperature (°C)TVR Virgin rock temperature (°C)ReL Reynolds numberV Air velocity (m/s)µ Air viscosity (kg/ms)ρ Air density (kg/m3)Pslab Modified slab perimeter -as top of slab not exposed (m)Ac Cross sectional area of slab (m2)kair Thermal conductivity of air (W/mK)Tb Base temperature of the finRij Thermal resistance (units)Tij TemperatureF0 Fourier number

7
1 Introduction
Falls of ground are a major source of accidents in South African mines. The identification ofimpending falls of ground would provide an early hazard warning and thereby reduce the risk ofaccidents.
Due to the exposed surface area, loose sections of ventilated rock should have a lower temperaturethan solid sections of ventilated rock because they work like cooling fins. The temperature gradientbetween loose and solid rock depends on the thermal conductivity of the rock, the ventilationconditions, the looseness of the rock and, to a lesser extent, the type of rock and age of mining.Such a gradient could be anything from a tenth of a degree to a few degrees Centigrade.
It was therefore proposed that Infrared (IR), non-contact, surface temperature measurement couldbe used for the identification of underground hazards. This more expensive method of IRThermography is able to provide a visualization of the temperatures present on a remote surface.Using a portable IR thermograph or an IR remote temperature-sensing device (a radiometer), it willbe possible to monitor roof temperature whilst moving along a road or stope. Areas exhibiting lowertemperatures would be indicative of potential hazards.
This is the first time that any attempt has been made to theoretically estimate such temperaturegradients. Both theoretical and experimental research have provided evidence supporting thesuitability of this method for use in South African mines. It recommended that a mine-worthy,intrinsically safe IR radiometer should be developed in order to conduct the industry-wideinvestigation. A next step will be the establishment of a relationship between the temperaturegradient and the hazard level. A method of hazard elimination will also need to be investigated.
2 Methods of remote non-contact temperaturemeasurement
There are many situations where it is necessary to measure temperature in places that arephysically inaccessible or dangerous. Remote non-contact temperature measurement is based onthe premise that any physical body with a temperature higher than absolute zero radiates someamount of IR radiation. The higher the body temperature, the higher the level of IR radiation emittedby the body.
A body may lose or gain thermal energy without requiring a physical medium or contact with anotherbody. This loss is due to an electromagnetic emission known as a thermal radiation. Infrared (IR)radiation, which is primarily responsible for thermal radiation, falls within the wavelength range of0.75 �m to about 1000 �m. Strictly speaking, some heat transfer also takes place in the visualband of electromagnetic radiation.
Fundamental to an understanding of the thermal emission of solids is the concept of a blackbody.A blackbody is defined as a substance that absorbs all radiation which strikes the body at anywavelength, without reflection or transmission.
The intensity of black body radiation is a function of temperature only. The rate at which energy isemitted per unit area of the emitting surface is given by the Stefan-Boltzmann law:
8
4TW εσ= 2.1
Where W - is the total emissive power;T - is the absolute temperature of the body;�- is a universal physical constant;� - is the emissivity of a surface, which for a black body is 1.0.
The emissivity εεεε is a numeric whose value lies from zero for a nonradiating object and 1.0 for ablackbody. Emissivity is a function of the type of material and its surface condition and can vary withwavelength and with the temperature of the object.
The emissivity of an object in the visible spectrum is no guide to its emissivity in the IR spectrum.For example, white paint has a low emissivity in the visible light but is nearly equivalent to ablackbody at wavelengths beyond 3 µm. A body which is covered with white paint stays relativelycool in sunlight because it not only reflects the sunlight well, but also reradiates the absorbed partof the energy almost as well as a blackbody.
On the contrary, aluminium plate is actually warmer in direct sunlight, as it has a low emissivity andtherefore cannot reradiate the absorbed energy efficiently. Aircraft are painted with a paint basedon white titanium dioxide which has ε=0.94, in order to reduce their internal temperatures while theyare parked on the ground in hot sun(Hudson, 1986:45), (Jamieson,1963:15).
The emissivity of human skin is veryhigh ε=0.94 and this value isindependent of skin colour. Humanskins are equally black beyond2 µm. Thus human skin is anotherexample of the inadvisability ofestimating the emissivity of an objecton the basis of its visual appearance(Hadson,1969:103).
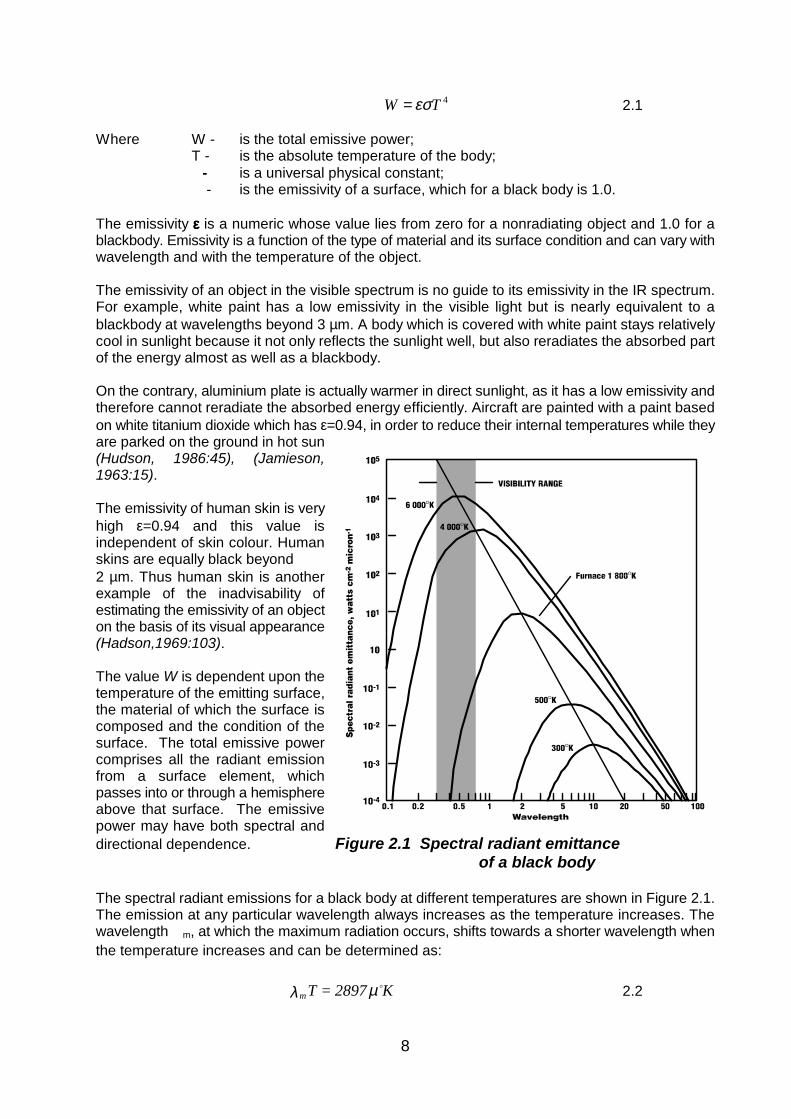
The value W is dependent upon thetemperature of the emitting surface,the material of which the surface iscomposed and the condition of thesurface. The total emissive powercomprises all the radiant emissionfrom a surface element, whichpasses into or through a hemisphereabove that surface. The emissivepower may have both spectral anddirectional dependence. Figure 2.1 Spectral radiant emittance
of a black body
The spectral radiant emissions for a black body at different temperatures are shown in Figure 2.1.The emission at any particular wavelength always increases as the temperature increases. Thewavelength �m, at which the maximum radiation occurs, shifts towards a shorter wavelength whenthe temperature increases and can be determined as:
K2897=Tm!µλ 2.2

9
The result is known as the Wien displacement law. In Figure 2.1 the family of emission curvesdemonstrate the law. The variation in the colour of hot objects with temperature is explained bythese curves. Near room temperature all radiation is in the IR spectrum. As the temperatureincreases, more and more of the radiation becomes visible. At first it is at the red end of thespectrum and shifts up towards white as the temperature approaches and then exceeds 5000 0K.
In accordance with the displacement law, the wavelength at which the maximum emission ofradiation from, for example, a silicon furnace occurs, given an operating temperature of1800 0K, is2.0 �m (Figure 2.1). Almost 25 % of the radiant energy is emitted at wavelengths of less than �m.
In accordance with Lambert's law, the intensity of radiation is greatest in the direction normal to theplane of the body and decreases with the cosine of the angle between the normal and the directionof observation.
2.1 IR radiometry and some related problems of remotetemperature measurement
The simplest, well-known radiation optical pyrometer that could be found is used in cases when anobject has a temperature of more than 700 0 C, or in a temperature range corresponding to visibleincandescence. In this pyrometer the electrical bulb filament is colour matched to a hightemperature object in the background by adjusting the current through the bulb filament. Thismeans that the temperature of the bulb filament and the object are the same. Knowing the relationbetween the filament current and its temperature makes it possible to measure remotely thetemperature of, for example, melted material in a furnace.
Contemporary radiometers contain at least a system of lenses, an on/off modulating device, asensitive detector and an amplifier, a reference source and a display. It is possible to obtain atemperature resolution of 0.1 0C and a measuring time of about 0.5-1 s.
From the viewpoint of an industrial application and without presenting too much of the theory onradiometry, which is given by Hudson (1969:432-433, 513), it should be noted that:
• When the object of interest fills the field of view of an IR detector, it is not necessary to knowthe distance to the object or its area in order to measure its temperature remotely.
• Temperature determined in this way is called equivalent blackbody radiation temperature.
This is correct when the following assumptions are applied:
1. The object radiates as a blackbody.2. Atmospheric absorption along the line of sight is negligible.3. The sensitivity of the IR detector is independent of wavelength.
If any of these conditions are not applied, then a correction should be applied. For example, whena practical object is not a blackbody, the true emissivity ε of the object should be taken into accountduring measurement; otherwise, the remotely measured temperature of the object will be lower thanthe true temperature obtained by a contact measurement.
Such a difference in emissivity can be neglected only when the relative temperature gradient of thesame object is the issue of interest. This is true for the case of loose rock detection when thedifference between the temperature of the solid and loose part of the same rock is important. At thesame time, in order to develop a proper understanding of the heat transfer between ventilation airand rock, data on the emissivity of different rocks should be obtained.

10
2.2 Infrared thermography
There is no doubt that the great advances in IR technology have been stimulated by military needs.The first commercial system that provided viewing of an object in the IR spectrum wasdemonstrated in 1942, and was designed to assist tank and truck drivers at night during a blackout.
IR Imaging Systems also provide a temperature resolution of 0.1 0C, which, presented in shadowsof grey or in colour, enables very easy identification of areas of different temperature, but at greatexpense. Some of these systems are not able to operate when the ambient temperature is morethan 40 0C. The cheapest IR thermal imaging digital camera costs R118 000 while the best systemmay cost up to R500 000.
In order to reduce running expenses on the current project, it was decided to conduct anunderground investigation using an IR handheld radiometer. If such an instrument were to bedeveloped for mining industry conditions, it would be useful for daily roof inspection.
3 IR remote temperature measurement for industrialapplication
The very first application of IR radiometry was by astronomers as far back as 1869 when LordRosse tried to measure the IR radiation of the moon using a telescope.
Since the end of the 1940’s, IR remote temperature measurement and IR thermography have beenwidely used in industry for heat radiation monitoring in engines and motors, measuring heat lossin buildings and numerous other applications. A description of these applications would takeenormous space, but a good overview is given by Hudson (1969). Only transport applications thatcould be relevant to the mining industry are presented here.
3.1 Surface transport
IR remote temperature sensing and IR thermography can be used for detection of subsurfaceanomalies below railroads, airfield runways and motorways.
Such monitoring is based on the premise that heat generated by the sun and the moving wheelsof vehicles penetrates into the road surface and near sub-surface. Due to the different thermalconductivity of a road bed structure, mechanical components such as piping, vessels, slabs andpiles can be identified (Okomoto, 1995). The method is able to detect buried moisture and erosionvoids of railroad track beds (Weil,1995).
Several factors can cause spurious surface temperature variations, such as screening from the sunand variations in traffic intensity. Therefore, tests are usually conducted after sunset, when thetemperature gradient between the different surface areas can reach 5 0C. Variations in traffic flowaffect this gradient by approximately 0.10C (Gustavsson, 1991).

11
3.2 Underground roof condition monitoring
It has been claimed that the United States Bureau of Mines (USBM) discovered the concept of IRroof condition detection through tests into methods of determining the strength of limestone pillars(Merrill 1958). During the experiments, a 15 cm layer became detached from the roof. During theremoval of this piece of limestone, it was observed that the temperature of this loose rock was lowerthan that of the solid rock. This was detected simply through feeling with the palm of a hand. At thattime, remote sensing technology had not progressed beyond the sensitivity of human touch.
During the next two decades, IR instrumentation was developed to the level where a 0.1 0Cresolution was obtained. The practical research demonstrating the possibility of using IRradiometers for detection of loose rock in underground conditions was conducted by Merrill (1970),when the Denver Mining Research Centre of the USBM began tests to detect hazardous orpotentially hazardous conditions. An IR radiometer capable of detecting a 0.2 0C temperaturedifference at distances of 3 m was used for the experiments. In order to provide visualisation ofsome of the results, an IR scanner supplied by the US Army Electronics Command=s Night VisionLaboratory was used. The scanner provided the same 0.2 0C resolution.
The handheld radiometer was used in several mines and the results were as following:
1. With no air flowing and no temperature difference between the air and a tunnel surface, notemperature transition on loose rock was detected.
2. However, after 15 minutes of air flow, the temperature gradient reached between 0.2 0C and7 0 C depending on the air temperature.
Unfortunately, no detailed information on either the air or rock temperature was given. It wasestimated that, in one case, the air temperature was between 14 and 19 0C and the rocktemperature was between 16 and17 0C.
An important observation was made when the temperature of a newly blasted face was measured.A temperature gradient of 3 0C per metre of rock was noted. The obtained temperature gradient ofthe loose rock was about 1.0-1.5 0C, or higher, than in the older mining.
This work provided one of the first confirmations of the applicability of the concept for loose rockdetection. No further information on development of the method by the USBM has been found.
More recently, in Yu (1990), a more systematic approach to the problem has been given. The maintask of this research was to enhance the temperature gradient between solid and loose rock.Through the use of an IR thermographer, the information was supplied to an operator of amechanized scaler in order to eliminate potentially dangerous spots. The method was based fullyon a previously described concept.
Initial tests were conducted on a 350 kg lump of rhyolite on which there was a loose section. Thetest piece was enclosed in a plywood box and was subjected to heating and an air flow of differenttemperature. Two sets of thermocouple wires provided the temperatures of the solid body and thetip of the loose rock. The resolution of the monitoring equipment was 0.2 0 C. The laboratory testsprovided the expected results that loose rock cools faster than solid rock and provides atemperature gradient of up to 1.7 0C.
Besides spot temperature measurements, laboratory and underground experiments were alsoconducted with AGA Thermovision 110 and 782 devices. The test rock was observed using an IRscanner in conjunction with a spot temperature measurement, and both numerical and visual datawere collected and analyzed for trends. No theoretical research has been done.

12
Mine monitoring under normal conditions at Kidd Creek Mines confirmed that some loose rockscould be detected using the method. It was also noted that the age of the underground miningexcavation tends to influence the detectability of loose rock. In order to enhance the temperaturegradient, different methods were tested depending on temperature relations between the rock andair. Information on the type of rock tested is not available.
In the majority of cases observed at Kidd Creek, in locations where the mine air temperatureexceeded the rock surface temperature, loose rock tended to be warmer than the adjacent solidrock. In locations where the mine air temperature was lower than the rock surface temperature,loose rock tended to be cooler than solid rock.
Checking, with a scaling bar, areas that were scanned with an IR scanner demonstrated that asignificant amount of loose rock was not identified using the IR method.
The following enhancement methods were tested:
1. Hot diesel exhaust from an LHD machine blowing against the roof for 20-30 minutes.2. Airflow rate acceleration using a local fan.3. Radiant heat from the IR source.4. Evaporation of water from the rock surface.
The use of hot diesel exhaust was recognized as the most effective method of gradient temperatureenhancement. The authors of the report on the experiment believed that the use of exhaustenhancement in a drier environment would be even more effective than in a humid environment.
Based on the test results, an underground trial was conducted to determine whether an IR scannermounted on a mechanical scaler is able to assist an operator. It was found that an IR scanner ismost effective when directed perpendicular to the surface (roof) being inspected. In order toenhance the temperature gradient, a machine’s exhaust was directed at the roof ahead of themachine. The trial demonstrated that, when using the IR scanner, the total miner’s exposure timerequired for roof checking and scaling was 30.4 minutes per 30 metres of the tunnel, instead of 64.4minutes for the non-IR technique. This represents about a 50 % reduction in risk during the roofconditioning process (Yu, 1990).
3.3 Other underground applications
In the 1980’s, an IR radiometer was used in the Ukraine by the MakNII research institute to identifythe areas on a longwall that are potentially dangerous in terms of an abrupt outburst of methaneand coal. It was proved that the coal temperature in such areas is about 1-4 0C higher than that ofthe surrounding coal.
Misfires, mine fires, combustion in waste dumps and underground water courses (Merrill 1970) arejust a few examples of the wide application that the IR radiometer has found in engineering.Numerous publications are devoted to condition monitoring of mechanical and electrical equipment,where local temperature increases very often result in impending mechanical or electrical failure.For example, IR scanning of electrical cables assists in identifying cable manufacturing defects, badelectrical contacts in connections and a reduction in the effective core cross-section due tomechanical load. The last example is very important in the case of flexible power trailing cables forLHD machines and shuttle cars. Early identification of such problems reduces maintenance andoperational cost, and improves safety.
13
4 Theoretical estimation of heat transfer between atunnel surface and air flow
4.1 General South African underground environment and theproposed method of loose rock location.
As was noted by Merryll (1970) and Yu (1990), North American underground conditions such asrelatively low rock and air temperatures, and their bi-directional relations and low differences, veryoften limited the application of the method unless a special enhancing technique was used. Allenhancing methods dramatically increase IR scanning times and thus detract from the methodefficiency, most probably the main reason why the method of IR Thermography has not foundcommercial application in North America.
On the other hand, the South African gold mining underground conditions favour the method asrock temperatures are high and the temperature of the ventilation air is much lower. It will bedemonstrated in Section 4 that even such conditions as low ventilation air velocity actually improvethe efficiency of the proposed method.
4.2 Assumptions and initial data
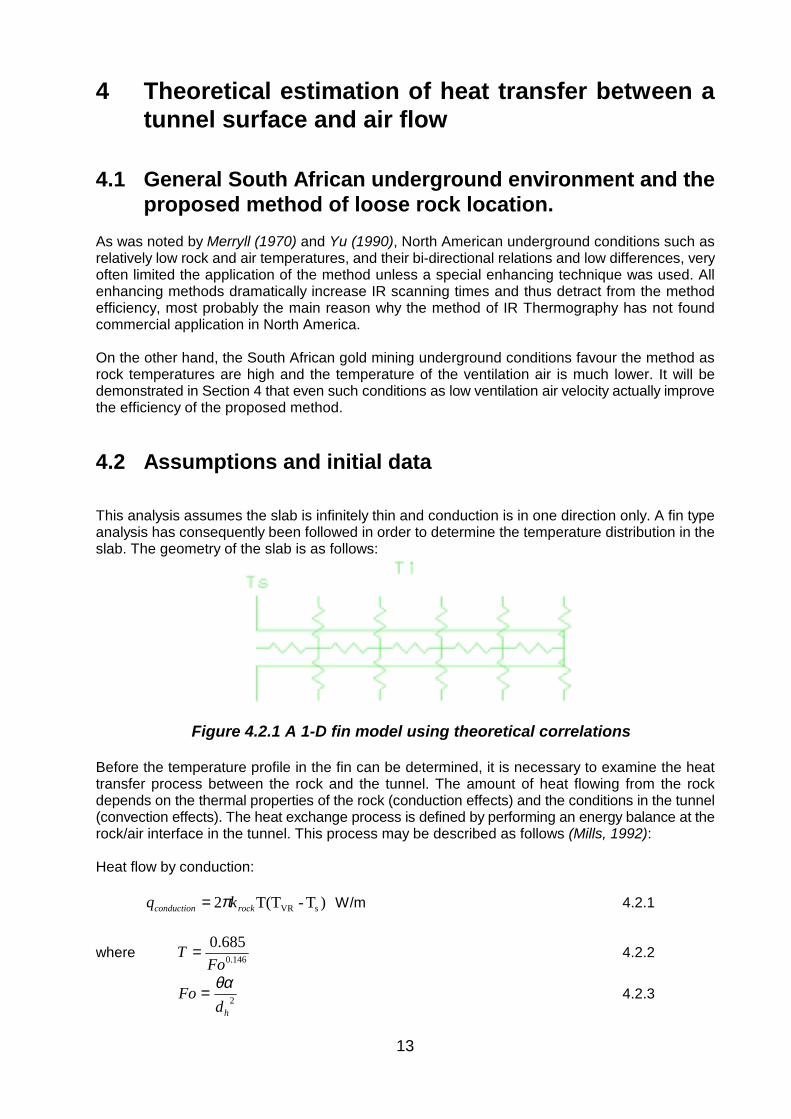
This analysis assumes the slab is infinitely thin and conduction is in one direction only. A fin typeanalysis has consequently been followed in order to determine the temperature distribution in theslab. The geometry of the slab is as follows:
Figure 4.2.1 A 1-D fin model using theoretical correlations
Before the temperature profile in the fin can be determined, it is necessary to examine the heattransfer process between the rock and the tunnel. The amount of heat flowing from the rockdepends on the thermal properties of the rock (conduction effects) and the conditions in the tunnel(convection effects). The heat exchange process is defined by performing an energy balance at therock/air interface in the tunnel. This process may be described as follows (Mills, 1992):
Heat flow by conduction:
)T-T(T2 sVRrockconduction kq π= W/m 4.2.1
where 146.0
685.0
FoT = 4.2.2
2hd
Foθα= 4.2.3

14
Heat flow by convection:
( )dbscconvection TTPhq −= W/m 4.2.4
Performing an energy balance at the wall:
convectionconduction qq = 4.2.5
The heat transfer coefficient is determined as follows:8.0Re02.0 L
air
hc
k
dh = 4.2.6
where
µρ h
L
Vd=Re 4.2.7
The temperature profile along the slab was calculated as follows:
! Assumptions° Conduction only takes place in one direction° The slab is assumed to be a fin° The tip of the fin is insulated (no heat transfer across the tip)° The base temperature is equal to the wall surface temperature
! Calculation of the temperature profile in the fin
L
xL
TTb
TT
db
db
ββ
cosh
)(cosh −=−−
4.2.8
wherecrock
slabc
Ak
Ph=2β 4.2.9
! Results of the 1-D model
To reach a temperature equilibrium between the air, surface of the tunnel and virgin mass of rock,some time is required. This is why the age of the tunnel affects the results considerably. The ageof the tunnel has therefore been varied from one day to 10 years to observe the change in thetemperature profile in the slab (Figure 4.2.2) and in the tunnel wall temperature (Figure 4.2.3).
Input parameters:
Velocity 0.5 m/sTVR 50 °CTdb 30 °CTunnel 3 m x 3 mSlab 1 m x 1 m x 0.4 m (length, width, thickness)

15
30
32
34
36
38
40
42
44
0 0.1 0.2 0.3 0.4 0.5 0.6 0.7 0.8 0.9 1
Distance from base (m)
Tem
per
atu
re (
deg
C)
1 day
1 month
1 year
10 years
Figure 4.2.2 Temperature profile in the slab (1-D fin model)
30
32
34
36
38
40
42
44
46
48
50
52
0 5 10 15 20 25 30 35 40 45 50
Distance from tunnel wall (m)
Tem
per
atu
re (
deg
C)
1 day
1 month
1 year
10 years
Tx=Ts+(T_vr-Ts)*erf(GAMMA)GAMMA=x/(2*(alpha*age)^0.5)
Figure 4.2.3 Temperature profile from the tunnel wall to the surrounding rock.
These data clearly explain the better results obtained by Yu (1990) in new mining areas than inothers. With time, the surface temperature becomes closer to the air temperature which reducesthe temperature gradient between solid and loose rock. The first year after mining makes the mostdifference for the temperature gradient. A conclusion could be made that it is more difficult toidentify loose rock in old mining areas.

16
4.3 Expected temperature gradient
This analysis assumes that heat conduction is in two directions. A numerical method was used todetermine the temperature profile in the slab. This method involved numerical formulation by theresistance method. A more realistic geometry was also chosen for the slab.
! Equations
The temperature profile in the slab was calculated by dividing the slab into a number of squareblocks, thus producing a mesh. The temperature profile could then be determined using thefollowing equation (valid for 1-D, 2-D and 3-D):
0=
−∑ jij
ij
R
TT 4.3.1
The resistance at each node was found using:
For conductionrock
ij yk
xR
∆∆=
For convectionxh
Ri ∆=∞
1
! Global Assumptions for the 2-D models
• The heat transfer coefficient was constant (for the specified velocity).• The slab was infinitely wide (conduction in x and y directions only).• The gap between the hanging rock and the wall was assumed to be 10 mm.• No convection takes place in this region, only conduction.• The mesh was assumed to be square.• The air temperature was assumed to approach the dry-bulb temperature in one node length
(CFD coding would be required to produce more accurate results).
! Results
Four different scenarios were examined for one-year old mining:
1. Velocity (0.5 m/s), slab (0.8 m x 1 m x 0.4 m) – Figure 4.3.12. Velocity (1 m/s), slab (0.8 m x 1 m x 0.4 m) – Figure 4.3.23. Velocity (5 m/s), slab (0.8 m x 1 m x 0.4 m) – Figure 4.3.34. Velocity (0.5 m/s), slab (0.8 m x 1 m x 0.3 m) – Figure 4.3.4
Figure 4.3.5 presents one-month old mining to compare with Figure 4.3.3.

17
(1) Hanging slab case 1
Assumptions and boundary conditionsTVR=50 0CV=0.5 m/sTdb=30 0Chc=1.872 W/m2KSlab height=0.4 mSlab length=0.8 mSlab width=1 mSpacing between wall & slab=10 mmTS=38.23 0C
38.74 38.37 38.37 38.37 38.37 38.37 38.37 38.37 38.37 38.37 38.37 38.37 Temp38.65 38.22 38.27 38.31 38.33 38.34 38.33 38.32 38.3 38.27 38.37 38.28 32.5-33.038.56 38.02 33.0-33.538.55 37.66 37.41 36.94 36.52 36.12 35.76 35.43 35.1 34.93 33.5-34.038.46 37.79 37.31 36.85 36.42 36.03 35.68 35.39 35.1 34.9 34.0-34.538.37 37.74 37.2 36.72 36.29 35.91 35.57 35.27 35.03 34.83 34.5-35.038.28 37.6 37.03 36.54 36.11 35.74 35.41 35.13 34.9 34.81 35.0-35.5
35.5-36.0 36.0-36.5 36.5-37.0 37.0-37.5 37.5-38.0 38.0-38.5 38.5-39.0
Figure 4.3.1 Results for case 1 (slab=1x1x0.4 m, air velocity=0.5 m/s)
The temperature gradient is 3.47 0C.
(2) Hanging slab case 2
Assumptions and boundary conditionsTVR=50 0CV=1 m/sTdb=30 0Chc=3.259 W/m2KSlab height=0.4 mSlab length=0.8 mSlab width=1 mSpacing between wall and slab=10 mmTS=35.73 0C

18
36.34 35.89 35.89 35.89 35.89 35.89 35.89 35.89 35.89 35.89 35.89 35.89 Temp36.23 35.78 35.81 35.85 35.86 35.87 35.86 35.85 35.83 35.78 35.71 35.76 32.5-33.036.12 35.58 33.0-33.536.11 35.23 34.98 34.53 34.12 33.75 33.41 33.10 32.80 32.64 33.5-34.036.00 35.35 34.88 34.43 34.02 33.66 33.33 33.04 32.79 32.60 34.0-34.535.89 35.27 34.75 34.29 33.88 33.52 33.21 32.94 32.72 32.54 34.5-35.035.78 35.11 34.55 34.09 33.69 33.35 33.05 32.80 32.60 32.52 35.0-35.5
35.5-36.0 36.0-36.5 36.5-37.0 37.0-37.5 37.5-38.0 38.0-38.5 38.5-39.0
Figure 4.3.2 Results for case 2 (slab=1x1x0.4 m, air velocity=1 m/s)
The temperature gradient is 3.26 0C.
(3) Hanging slab case 3Assumptions and boundary conditionsTVR=50 0CV=5 m/sTdb=30 0Chc=11.81 W/m2KSlab Height=0.4 mSlab Length=0.8 mSlab width=1 mSpacing between wall and slab=10 mmTS=31.99 0C
Hanging slab - corrected mesh, velocity=5m/s 32.76 32.20 32.20 32.20 32.20 32.20 32.20 32.20 32.20 32.20 32.20 32.20 Temp32.63 32.20 32.19 32.19 32.19 32.18 32.18 32.16 32.16 32.08 32.00 32.06 30.0-30.532.49 32.08 30.5-31.032.47 31.85 31.68 31.40 31.16 30.95 30.76 30.60 30.45 30.37 31.0-31.532.34 31.89 31.58 31.31 31.07 30.88 30.71 30.56 30.44 30.35 31.5-32.032.20 31.78 31.45 31.18 30.96 30.78 30.63 30.50 30.40 30.32 32.0-32.532.06 31.59 31.25 31.00 30.80 30.65 30.52 30.42 30.34 30.31 32.5-33.0
33.0-33.5 33.5-34.0 34.0-34.5 34.5-35.0 35.0-35.5 35.5-36.0 36.0-36.5
Figure 4.3.3 Results for Case 3 (slab=0.8x1x0.4 m, air velocity=5 m/s)
The temperature gradient is 1.75 0C.
19
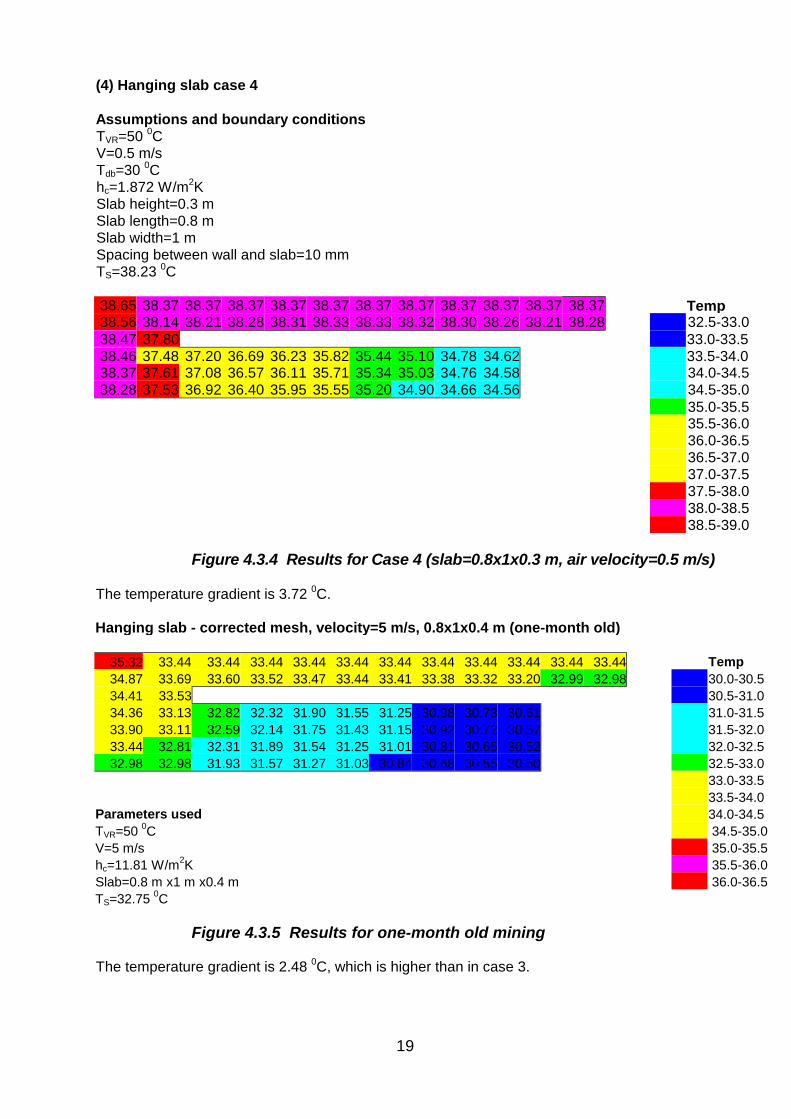
(4) Hanging slab case 4
Assumptions and boundary conditionsTVR=50 0CV=0.5 m/sTdb=30 0Chc=1.872 W/m2KSlab height=0.3 mSlab length=0.8 mSlab width=1 mSpacing between wall and slab=10 mmTS=38.23 0C
38.65 38.37 38.37 38.37 38.37 38.37 38.37 38.37 38.37 38.37 38.37 38.37 Temp38.56 38.14 38.21 38.28 38.31 38.33 38.33 38.32 38.30 38.26 38.21 38.28 32.5-33.038.47 37.80 33.0-33.538.46 37.48 37.20 36.69 36.23 35.82 35.44 35.10 34.78 34.62 33.5-34.038.37 37.61 37.08 36.57 36.11 35.71 35.34 35.03 34.76 34.58 34.0-34.538.28 37.53 36.92 36.40 35.95 35.55 35.20 34.90 34.66 34.56 34.5-35.0
35.0-35.5 35.5-36.0 36.0-36.5 36.5-37.0 37.0-37.5 37.5-38.0 38.0-38.5 38.5-39.0
Figure 4.3.4 Results for Case 4 (slab=0.8x1x0.3 m, air velocity=0.5 m/s)
The temperature gradient is 3.72 0C.
Hanging slab - corrected mesh, velocity=5 m/s, 0.8x1x0.4 m (one-month old)
35.32 33.44 33.44 33.44 33.44 33.44 33.44 33.44 33.44 33.44 33.44 33.44 Temp34.87 33.69 33.60 33.52 33.47 33.44 33.41 33.38 33.32 33.20 32.99 32.98 30.0-30.534.41 33.53 30.5-31.034.36 33.13 32.82 32.32 31.90 31.55 31.25 30.98 30.73 30.61 31.0-31.533.90 33.11 32.59 32.14 31.75 31.43 31.15 30.92 30.72 30.57 31.5-32.033.44 32.81 32.31 31.89 31.54 31.25 31.01 30.81 30.65 30.52 32.0-32.532.98 32.98 31.93 31.57 31.27 31.03 30.84 30.68 30.55 30.50 32.5-33.0
33.0-33.5 33.5-34.0
Parameters used 34.0-34.5TVR=50 0C 34.5-35.0V=5 m/s 35.0-35.5hc=11.81 W/m2K 35.5-36.0Slab=0.8 m x1 m x0.4 m 36.0-36.5TS=32.75 0C
Figure 4.3.5 Results for one-month old mining
The temperature gradient is 2.48 0C, which is higher than in case 3.

20
5. Experimental evaluation of heat transfer
In order to provide for experimental evaluation of heat transfer in underground conditions, two goldand platinum mines were selected. Current mining and old mining sites were identified for theexperiments.
5.1 Methodology used
It is obvious that the position of loose rock in a roof or wall does not affect the temperature gradientof the rock. At the same time, loose pieces of rock in a wall are more accessible for measuring theirdimensions and estimating the temperature gradient than those in a roof. Therefore, it was decidedto scan both sidewalls and the roof to obtain the required information.
The following information was recorded at each site:
1. Cross section of the tunnel.2. Ventilation air velocity.3. Air temperature.4. Rock temperature.5. Age of mining.6. Geometrical shape and size of loose rock.
After obtaining information on the temperature of the solid and loose rock, loose rocks wereremoved (where it was possible and safe to do this) to determine the degree of attachment of theloose rock to the solid rock.
5.2 Instrumentation used for underground experiments
A measuring tape was used for dimensional measuring. Ventilation air velocity and temperaturewere measured using a SKYMATE (Serial No5470) by Speedtech (USA).
An IR radiometer MINIRAY100 (Serial No34468) by Eurotron (Italy) was selected for use. Thisradiometer provides a temperature resolution of 0.10 C and spatial resolution of 30 mm at 1 mdistance between the instrument and rock. The measuring spectral band is 8-14 µm, whichcorresponds to the required temperature interval.
Both instruments are designed for normal industrial application.
5.3 Results of tests in gold mines
5.3.1 Moab Khotsong mine
Two tests were conducted at 11 shaft, 70 level (depth of 2400 m) at the same site, at two weekintervals, in order to verify the effect of age of mining on the temperature gradient.
Site 1. At 8 m from the face the stope was about two weeks old. The site has a very unstable hangingwalland the tips of the loose rock were about 10-30 mm thick. During the experiments, the air velocitywas 1-1.1 m/s and the air temperature was 29.8 0C. The average solid rock temperature was30.1 0C. The maximum measured temperature gradient between the tip of the loose rock and thesolid rock was 0.5 0C.

21
Site 2.The haulage was two years old. Air velocity during the experiment was 0.7 m/s and the airtemperature was 29.8 0C. The maximum measured gradient was 0.3 0C.
The obtained low temperature gradient is due to the nearly equal air and solid rock temperatures.
These tests were repeated at the same sites a week later in order to check the consistency of themeasurements. The obtained results were practically the same. Tests were also conducted at newsites.
5.3.2 Kloof Gold Mine
Tests were conducted at No 4 Shaft, 43 level, 43/51 North development. The site depth is 3216 m.The air temperature was 35 0C with variations of ±0.1 0C. Measured air velocity at the face was1.3 m/s. The age of the mining face was two days. The entire surface of the tunnel from the faceto 20 m back was scanned. Three typical situations of roofbolted loose rock are presented. Pointsmarked with (*) refer to solid rock temperature. Points marked with (• ) refer to the tips of the looserock.
In Figure 5.3.2.1 the measurement was taken about 10 m from the face. The measured solid rocktemperature was 37.8 0C and the tip temperature was 35 0C or equal to the air temperature. Thetemperature gradient was 2.8 0C.
Roof Bolt
2m
2m
10mm
300mm
T=35 C
Airflow
Figure 5.3.2.1 Site one
In Figure 5.3.2.2 the measurement was taken 5 m from the face. The temperatures of solid rockand the tip of the loose rock were 40 0C and 35 0C, respectively. The outlet of the ventilation tubewas about 3 m from the tip of the loose rock. The temperature gradient was 5 0C.

22
Roof bolt
Fissure
0.5m
T=35 C
Airflow
5m
Face
Figure 5.3.2.2. Site two
In Figure 5.3.2.3, a very similar scenario to the previous one is presented. The main difference isthat measurements were taken about 20 m from the face which means that the age of this miningwas about three weeks; therefore, a lower temperature gradient could be expected. The measuredtemperatures of the solid rock and the tip of the loose rock were 38.5 0C and 36 0C, respectively.This results in a 2.5 0C temperature gradient as compared with the 5 0C in the previous case.
Roof bolt
Small fissure
0.8m
20m to the face
T=35 C
Airflow
Figure 5.3.2.3 Site three
This confirms that older mining provides solid rock temperatures close to the air temperature and,therefore, the temperature gradient between the solid and loose rock is lower than in recent mining.
5.4 Results of tests in platinum mines
Tests were conducted at Rustenburg Platinum Mines (Amplats) Townland shaft at 14 level. The testsite was at a depth of approximately 570 m. The calculated virgin rock temperature at this depthwas 20.8374 +(570 x 0.021949)= 33.34833 0C.
Site 1.The site is in close proximity to the shaft and mining is about 30 years old. Due to the very goodventilation, the temperature of the air and rock was very similar: 18 0C and 19 0C, respectively.Because of both the age and ventilation, the temperature gradient between the loose and solid rockwas practically undetectable. Only the fallen rock resting on a protective steel mesh had a

23
temperature about 0.2 0C lower than the solid rock.
Site 2.This 30-year old site is about 300 m from the shaft. The air temperature was 21 0C, with a velocityof 2.6 m/sec. A temperature gradient of about 0.2 0C was registered on loose rock. Thetemperatures of the solid rock exposed to the ventilation air and in a cubby with a 0.1 m/s airvelocity were 18.6 0C and 19.9 0C, respectively.
Site 3.This three-month old site is about 500 m from the shaft. The site is in an upper gully, which wasdeveloped for mechanized shortwall mining. The air temperature was 22.3 0C with a velocity of0.7 m/s. A piece of loose rock, 200 mm x 200 mm, with a 1 mm air gap, produced a 1.2 0Ctemperature gradient.
Site 4.This site is in the same upper gully at a distance of about 600 m from the shaft. The age of miningwas about one month. The air temperature and velocity were 25.5 0C and 0.1 m/s, respectively. Apiece of rock, 300 mm x 500 mm with a 2 mm crack on the longer side, provided a 1.8 0Ctemperature gradient.
At the same site another loose rock, 500 mm x 500 mm with a smaller than 1 mm crack, wasexposed to a 0.4 m/s air velocity. In this case the temperature gradient was 0.6 0C.
Site 5.The most interesting results were obtained in the development of the lower gully, which was onlyone day old. The test took place at a time of scaling the hanging and installation of temporarywooden props before roof bolting. The measured air temperature and velocity were 24.1 0C and 2.0m/s, respectively. The solid rock temperature was between 22.8 0C and 23.5 0 C.
Three places that were supported and selected for scaling or supporting were inspected with theIR radiometer. The temperatures of loose rock tips were between 20.2 0C and 21 0C, providing atemperature gradient of up to 2.8 0C.
Three mine officials present during the test were satisfied with the results. It was suggested by themthat every team should be equipped with an IR radiometer to scan the roof before starting work inany area.
6. Comparison of theoretical and practical results
The main objective of this pre-feasibility study was to demonstrate that a theoretically expectedtemperature gradient could be obtained during an underground investigation.
As loose rocks are irregular with non-predictable shapes and thicknesses, it is very difficult to makea direct comparison between theoretical and practical results. Therefore, only cases where theloose rocks had more or less regular shapes were used in this evaluation.
All underground measurements were done assuming that the rock emissivity is 0.93. The mainproblem in a comparison of theoretical and practical results is the unknown emissivity of the testedrock. While the obtained results on the temperature gradient are correct, an absolute rocktemperature depends on its emissivity and, therefore, the data on solid rock temperature cannotbe used for a comparison of theoretical and practical results without correction.
It is obvious that the results obtained at Rustenburg Platinum Mines, where the air temperature wasalways higher than the solid rock temperature but the tips of loose rock were always cooler than the

24
solid rock, do not correspond with theory and even common sense. A similar situation was indirectlydescribed by Yu (1990:48). The data from Kloof Mine are the most reliable and consistent due tothe significant difference between the air and solid rock temperature.
During the underground experiments, it was noted that the hot and moist air created drift and“latching” of the measurements from the IR radiometer. In some cases, numerous subsequentmeasurements were required on the same spot to obtain stable results. It was suggested that thiswas related to environmental conditions. In order to reduce the negative impact of the harshunderground environment, particularly the moisture, the IR radiometer was wrapped in a plastic bagwith a silica-gel inside.
Considering the effect, which a plastic cladding around the instrument could make onmeasurements, it should be noted that polystyrene and polyethylene show good IR transmissionuntil 3-4 µm when they are about 0.1 mm thick. They also have good transmission in the regionbeyond 20 µm and in the very far IR spectrum (Fr hlich,1957:359). Transmission in the 8-14 µmrange depends significantly on the quality of the material and manufacturing process; therefore, aneffect on absolute temperature results could be expected. This does not affect the relativetemperature gradient measurement.
7. Conclusion and recommendations
From the results of a worldwide IR Thermography/Radiometry survey, a theoretical evaluation ofthe method and the underground tests in South African mines, the following conclusions have beendrawn:
* The method of non-contact remote temperature measurement using the emission of IRradiation by physical objects has found very wide industrial application.
* Research on loose rock detection based on this method started in the 1970’s in NorthAmerica but never became a commercially available option.
* A possible problem that has been identified is the effect a relatively low temperaturedifference between rock and ventilation air has on reducing the temperature gradient onloose rock.
* A theoretical evaluation of the method’s applicability in South African hard rock minesdemonstrated that South African underground conditions, where solid rock and airtemperatures differ by at least a few degrees, should favour the method.
* Underground investigations confirmed that the method could be used for loose rockdetection, particularly in newly mined areas. When mining is older than a year, the methodloses its effectiveness because the expected temperature gradient on loose rock is reducedby as much as two times.
* There is no available information on rock emissivity in the IR spectrum, therefore, only arelative temperature difference between solid rock and the tip of loose rock was obtained.
* There is no mine-worthy IR Radiometer on the market and instruments developed fornormal industrial application should not be used underground due to their low reliability.
* The method of remote temperature measurement offers many advantages for the miningindustry, ranging from machine and equipment condition monitoring to loose rock detection.
25
In order to enable a wider study of the implementation of the IR Thermography/Radiometry methodfor improving safety in mines, the following recommendations are formulated:
1. A portable, mine-worthy, intrinsically safe IR radiometer should be developed to use in roofand wall scanning before and during any work in an area.
2. Such an IR Radiometer should provide simultaneous measurement of the air temperatureand airflow, as well as of the temperature gradient in the roof. It should also processinformation based on the results obtained in recommendation 4 below, in an attempt toprovide an early warning of an impending fall of ground.
3. The main types of rock should be tested and a database on the IR emissivity of the rockshould be created to provide true information on air/solid rock temperature differences,which will enable a proper theoretical evaluation and practical processing of obtainedresults.
4. Further investigations are proposed to establish a possible correlation between themagnitude of the temperature gradient of loose rock and ventilation parameters, and thelevel of the potential hazard presented by the loose rock.

26
References
Fr hlich, W.J.H, Mott, N.F. and Bullard, E.C. 1957. The detection and measurement of Infra-redradiation. Oxford at the Clarendon Press. 448 p.Gustavsson, T. and Bogren, J. 1991. Infrared thermography in applied road climatologiocalstudies. International Journal, Remote Sensing. Vol.12, No 9, p.1811-1828.Harrison, T.R. 1960. Radiation Pyrometry and its underlying Principles of Radiant Heat Transfer.New York, London. John Wiley & Sons, Inc. 234 p.Hudson, R.D. 1969. Infrared System Engineering. Wiley- Interscience, John Wiley & Sons, NewYork/London/Sydney/Toronto. 642 p.Jamieson, J.A, McFee, R.H., Plass, G.N. et al. 1963. Infrared physics and engineering. McGraw-Hill Book Company, Inc. New York, Toronto, London. 673 p.Merril, R.H. and Morgan, T.A. 1958. Method of Determining the Strength of Mine Roof. USBMReport on Investigation 5406, 22 p.Merrill, R.H. and Stateham, R.M. 1970. Loose Rock Can Be Detected By Infrared Devices. MiningEngineering, November, p.59-62.Mills, A.F. 1992. Heat transfer. Richard Irwin Inc.Okamoto, Y., Zuo-fen Fan, Chun-liang and Terumi Inagaki. 1995. Thermal image study ofdetecting near-underground structures by means of infrared radiometer. Proceedings of the SPIE– The International Society for Optical Engineering. Vol.2473, p.281-288.Weil, G.J. 1995. Non-Destructive, Remote Sensing Technologies for Locating SubsurfaceAnomalies on Railroad Track Beds. Proceedings of the SPIE – The International Society for OpticalEngineering. Vol.2458, p.74-81.Yu, T.R., Henning, J.G. and Croxall, J.E. 1990. Loose rock detection with infrared thermography.CIM Bulletin, May, p.46-52.