prdm1−/− dendritic cells alters the tfh cell …female c57bl/6 mice for expression of h2-aa,...
TRANSCRIPT
1016 VOLUME 18 NUMBER 9 SEPTEMBER 2017 nature immunology
The TCR repertoire is determined through positive and negative selec-tion of T cells on the basis of recognition by the TCR of complexes of peptide and major histocompatibility complex (MHC) molecules pre-sented by antigen-presenting cells (APCs). In the periphery, CD11chi classical dendritic cells (cDCs) are the main APCs, with a critical role in both innate immune responses and adaptive immune responses1,2. DCs activate natural killer cells, natural killer T cells and innate lym-phocytes at the site of infection or sterile inflammation. They also process antigens and migrate to local lymphoid organs, where they activate naive T cells3. T cells require signals from a peptide–MHC class II complex, co-stimulatory molecules and cytokines provided by DCs for differentiation into various subsets of CD4+ effector T cells or CD4+ regulatory T cells (Treg cells), with each CD4+ effector T cell sub-set executing unique functions and secreting different cytokines4.
The cytokine milieu is critical for the differentiation of CD4+ T cells. Dominant cytokines help to establish the initial polarization of CD4+ helper T cell subsets: interleukin 12 (IL-12) establishes the TH1 subset; IL-4 establishes the TH2 subset; IL-6 and TGF-β establish the TH17 subset; IL-6 establishes the TFH cell subset; and TGF-β and IL-10 establish the Treg cell subset. The differentiation of CD4+ T cells can be modulated by several other factors, such as the type of antigen and dose of exposure, affinity of the TCR for the MHC class II complex, and duration of stimulation5,6.
The antigen-processing pathways in mouse DCs have been investi-gated extensively. After being taken up, antigens are transported into the endolysosomal compartment, where they are cleaved, and some of
the fragments that are generated enter the groove of the MHC class II molecule for presentation to CD4+ T cells7. This process is depend-ent on the action of endocytic proteases in endosomal–lysosomal compartments8 that fall into three main classes: cysteine proteases (cathepsins B, F, H, L, S and Z), aspartate proteases (cathepsins D and E) and serine proteases (cathepsins A and G). While all cathepsins can function in antigen processing and many show an overlapping expres-sion pattern, CTSS has been shown to be expressed mainly in profes-sional APCs, including B cells and DCs, in which it has a critical role in cleavage of the invariant chain to permit loading of peptides into MHC class II molecules9. CTSS also contributes to antigen process-ing through degradation of antigen in the endolysosome and helps to establish the pool of peptides that is available for presentation by MHC class II10,11. Appropriate expression of CTSS is critical for estab-lishment of the repertoire of immunocompetent cells. Modulation of the expression of cathepsins CTSS and CTSL can change the pool of peptides that are presented in vitro to CD4+ T cells10. Overexpression of CTSS in DCs and medullary epithelial cells in the thymus has been shown to permit autoreactive T cells to escape negative selection, presumably through too-exuberant degradation of autoantigens12. Whether negative regulation in the periphery is also affected by CTSS has not been addressed.
PRDM1, which encodes Blimp-1, was identified as a risk allele for systemic lupus erythematosus (SLE) in genome-wide association studies of Chinese Han and Northern European populations13,14. CD14+ monocyte-derived DCs (MO-DCs) derived from carriers of the
1Center for Autoimmune and Musculoskeletal Diseases, The Feinstein Institute for Medical Research, Manhasset, New York, USA. 2Department of Chemical Engineering, University of Texas at Austin, Austin, Texas, USA. 3Immunology, Inflammation, and Infectious Diseases (Disease and Therapeutic Area), Roche Pharma Research and Early Development, Roche Innovation Center Basel, F. Hoffmann-La Roche, Basel, Switzerland. 4Center for Genomics and Human Genetics, The Feinstein Institute for Medical Research, Manhasset, New York, USA. Correspondence should be addressed to B.D. ([email protected]).
Received 24 March; accepted 16 June; published online 10 July 2017; doi:10.1038/ni.3793
Increased cathepsin S in Prdm1−/− dendritic cells alters the TFH cell repertoire and contributes to lupusSun Jung Kim1, Sebastian Schätzle2, S Sohail Ahmed3, Wolfgang Haap3, Su Hwa Jang1, Peter K Gregersen4, George Georgiou2 & Betty Diamond1
Aberrant population expansion of follicular helper T cells (TFH cells) occurs in patients with lupus. An unanswered question is whether an altered repertoire of T cell antigen receptors (TCRs) is associated with such expansion. Here we found that the transcription factor Blimp-1 (encoded by Prdm1) repressed expression of the gene encoding cathepsin S (Ctss), a cysteine protease that cleaves invariant chains and produces antigenic peptides for loading onto major histocompatibility complex (MHC) class II molecules. The increased CTSS expression in dendritic cells (DCs) from female mice with dendritic cell–specific conditional knockout of Prdm1 (CKO mice) altered the presentation of antigen to CD4+ T cells. Analysis of complementarity-determining region 3 (CDR3) regions containing the b-chain variable region (Vb) demonstrated a more diverse repertoire of TFH cells from female CKO mice than of those from wild-type mice. In vivo treatment of CKO mice with a CTSS inhibitor abolished the lupus-related phenotype and reduced the diversity of the TFH cell TCR repertoire. Thus, Blimp-1 deficiency in DCs led to loss of appropriate regulation of Ctss expression in female mice and thereby modulated antigen presentation and the TFH cell repertoire to contribute to autoimmunity.
A rt i c l e s
nature immunology VOLUME 18 NUMBER 9 SEPTEMBER 2017 1017
risk single-nucleotide polymorphism (SNP) (C/C) have lower expres-sion of PRDM1 transcripts than do MO-DCs from carriers of the control (non-risk) SNP (T/T)15. To investigate the pathological func-tion of Blimp-1 in SLE, we generated mice with DC-specific condi-tional knockout of Prdm1 (CKO mice) by mating mice expressing Cre recombinase from the gene encoding the integrin CD11c to mice with loxP-flanked Prdm1 alleles. Mice with loxP-flanked Prdm1 alleles but no expression of Cre recombinase served as the control (called ‘wild-type’ here). In female CKO mice, DCs that lacked Blimp-1 exhibited an activated phenotype with enhanced expression of MHC class II and increased production of pro-inflammatory cytokines following stimu-lation via Toll-like receptors. Those DCs resembled DCs from people with the SLE-associated PRDM1 risk allele, characterized by increased expression of MHC class II and hyper-responsiveness to stimulation via Toll-like receptors15. The frequency of TFH cells is greater in the blood of patients with lupus16, which correlates with disease activ-ity17,18. Female CKO mice have population expansion of TFH cells that is associated with a greater number of germinal center B cells that produce autoantibodies and cause antibody-mediated glomerulone-phritis19. This phenotype is also critically dependent on greater pro-duction of IL-6 by Blimp-1-deficient DCs, as all autoimmune features are absent from female CKO Il6+/− mice19. In the present study, we found that Blimp-1 also regulated Ctss expression in DCs and that
Blimp-1-deficient splenic DCs and bone-marrow-derived DCs (BM-DCs) exhibited higher expression of Ctss and alterations in antigen presentation, relative to that of wild-type DCs. These alterations led to a more-diverse TCR repertoire in the TFH cells of CKO mice. Finally, inhibition of CTSS in CKO mice suppressed development of the lupus-like phenotype and was associated with a lower number and diversity in the TCR repertoire of TFH cells.
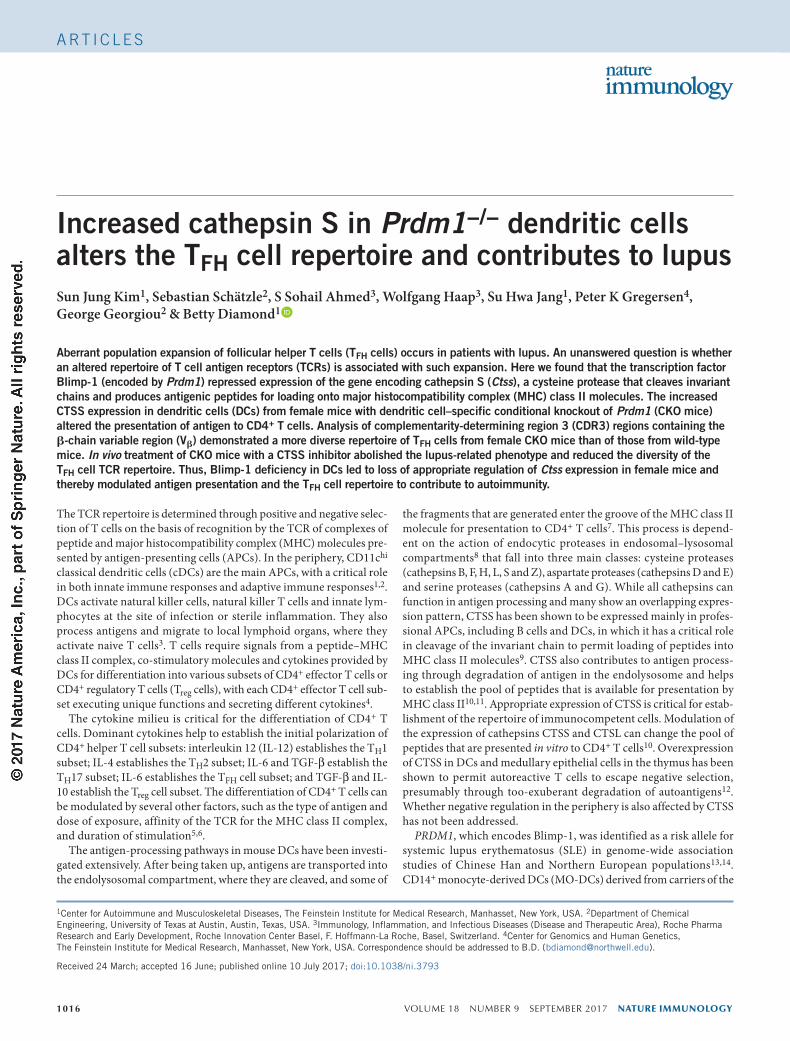
RESULTSIncreased CTSS expression in Blimp-1-deficient DCsBlimp-1 has been suggested to participate in antigen presentation through downregulation of the gene encoding the MHC class II trans-activator (Ciita) in B cells and CD11c+ DCs20,21. Consistent with those studies, in Blimp-1-deficient DCs have increased MHC class II expres-sion15. To investigate whether Blimp-1 deficiency in DCs also leads to altered antigen processing, we assayed Blimp-1-deficient DCs from female C57BL/6 mice for expression of H2-Aa, Ciita, H2dmb, Ctss and other genes encoding products involved in antigen presentation. The expression of H2-Aa, Ciita, H2dmb and Ctss was significantly higher in Blimp-1-deficient DCs than wild-type DCs, whereas other genes showed no difference in expression (Fig. 1a).
To investigate whether Blimp-1 can directly regulate the expres-sion of mouse cathepsin-encoding genes, we searched for the Blimp-1
104
103
102
101
100
104
105
103
102
101
104
103
102
101
10–1
102
101
100
10–1
Splenic DC
6
4
2
0 0 0
Control Risk
3
6
9
WT
20
40
60
80
Female Male Female Male Female Male
CT
SS
enz
ymat
icac
tivity
(R
FU
)
BM-DC
Splenic DC BM-DC
P = 0.03P = 0.001
P = 0.008
P = 0.003
P = 0.014
P = 0.008
P = 0.019P = 0.037
P = 0.0571
NS
NS NS
P = 0.008
P = 0.0315
WT
CKO
WT
CKO
Ccr7
Mar
ch1
H2-Aa
Ciita
H2dm
bCtss Irf
4CD74
H2-Oa
Lgm
nItg
am
CD209b
Male
Gen
e ex
pres
sion
(re
lativ
e)
Cts
s ex
pres
sion
(re
lativ
e)C
tsl e
xpre
ssio
n (r
elat
ive)
Cts
s ex
pres
sion
(re
lativ
e)
Cts
s ex
pres
sion
(rel
ativ
e)
PR
DM
1 ex
pres
sion
(rel
ativ
e)
CTS
S e
xpre
ssio
n(r
elat
ive)
a cb
d e fWT
CKO
CKO
WT0
5
10
15
20
MHCII–Pacific blueF4/80, Ly6C/G, NK-FITC
CD
11c-
Am
Cya
n
CD
19, T
CR
β-A
PC
100100
101
102
103
104
105
100
101
102
103
104
105
101 102 103 104 105100 101 102 103 104 105
CKO
Figure 1 Increased expression of Ctss in DCs from female CKO mice. (a) qPCR analysis of mRNA from various genes (horizontal axis) in splenic CD11c+ cDCs purified from 6- to 8-week-old female wild-type (WT) or CKO mice (key); results (obtained with specific primers) were normalized to those of the control gene Polr2a. (b) qPCR analysis of Ctss and Ctsl mRNA in splenic cDCs or BM-DCs from age-matched female wild-type and CKO mice (key); results were normalized to those of the control gene Hprt. (c) Flow cytometry (top) and qPCR analysis of Ctss mRNA (below) of blood cDCs from a female CKO mouse (top) or from age-matched female wild-type and CKO mice (horizontal axis, below); qPCR results were normalized as in b. (d) Enzymatic activity in vitro of CTSS in cDCs from wild-type and CKO mice (key); results (relative fluorescence units (RFU)) are presented relative to the fluorescence of cultures with no substrate. (e) qPCR analysis of Ctss mRNA in splenic DCs from male wild-type and CKO mice (horizontal axis); results were normalized as in b. (f) qPCR analysis of PRDM1 and CTSS mRNA in MO-DCs from carriers of the control SNP (Control) or the risk SNP (Risk); results were normalized to those of the control gene POLR2A. Each symbol (b,c,e) represents an individual mouse (n = 9 (splenic DCs, b), n = 6 (BM-DCs, b), n = 4 (c) or n = 3 (e) mice per genotype); small horizontal lines indicate the mean (± s.e.m.). P values, nonparametric, Mann-Whitney test. Data are from three independent experiments (a,b; n = 6 mice per genotype in a: horizontal bars, median; boxes, 25th percentile to 75th percentile; ‘whiskers’, 10th percentile and 90th percentile), two independent experiments (c), two independent experiments with n = 6 mice per group (d; plotted as in a), two independent experiments (e) or seven experiments with n = 19 female control carriers, n = 15 female risk carriers, n = 7 male control carriers and n = 11 male risk carriers (f; plotted as in a).
A rt i c l e s
1018 VOLUME 18 NUMBER 9 SEPTEMBER 2017 nature immunology
A rt i c l e s
consensus core binding sequence (5′-GAAAGT-3′) in a region 1,500 base pairs upstream of the transcriptional start site of the first exon of each gene22. Ctsc, Ctsd, Ctse, Ctsg, Ctsk, Ctsl1, Ctso, Ctss and Ctsw contained one or more of such sequences (Supplementary Table 1). We therefore measured the expression of each cathepsin-encoding gene in DCs from female wild-type and CKO mice. The expression of Ctss and Ctsl, but not that of other cathepsin-encoding genes, was higher in splenic DCs and BM-DCs of female CKO mice than in those of female wild-type mice (Fig. 1b and Supplementary Fig. 1). Expression of Ctss was also higher in blood DCs of female CKO mice than in those of female wild-type mice (Fig. 1c). To confirm that the increased expression of Ctss in DCs correlated with increased func-tional activity of CTSS, we assayed the enzymatic activity of CTSS in DCs purified from the spleen of female CKO and wild-type mice. We measured in vitro enzymatic activity by assaying fluorescence gener-ated after cleavage of a CTSS substrate. Blimp-1-deficient DCs exhib-ited more catalytic activity than that of wild-type DCs (Fig. 1d). Male CKO mice do not exhibit altered DC function and do not develop lupus-like disease19. Both the abundance of Ctss transcripts and the catalytic activity of CTSS were similar in DCs derived from male wild-type mice and those from male CKO mice (Fig. 1d,e), which suggested that Blimp-1 deficiency in combination with sex-specific alterations in DCs altered Ctss expression. To address whether CTSS expression is associated with Blimp-1 expression in human MO-DCs,
we measured CTSS expression in MO-DCs from the carriers of risk or control SNPs. MO-DCs from female carriers of the risk SNP exhibited lower PRDM1 expression, as reported15, and higher CTSS expression than that of MO-DCs from carriers of the non-risk SNP (Fig. 1f).
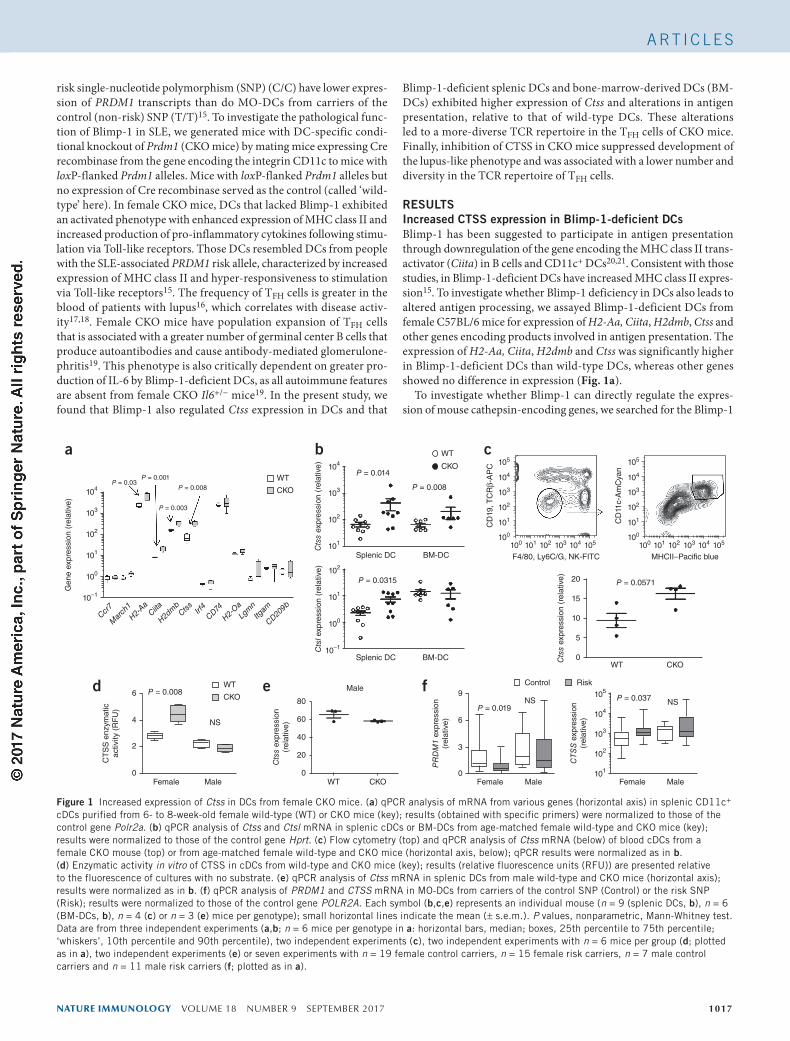
Given the presence of a Blimp-1 consensus binding site within the Ctss promoter and the enhanced expression of CTSS in DCs of female CKO mice, we performed chromatin-immunoprecipitation (ChIP) assays to determine whether Blimp-1 bound to the Ctss promoter region in splenic CD11c+ cDCs from wild-type mice. As expected, the Ctss promoter region was immunoprecipitated with antibody to Blimp-1 (Fig. 2a), which indicated that Blimp-1 bound in vivo to the Ctss promoter in wild-type mice but not in CKO mice. To investigate whether binding by Blimp-1 negatively regulates the transcription of Ctss, we performed assays with a luciferase expression reporter driven by the Ctss promoter (positions −1300 to +10 relative to the transcription start site). There was significant suppression of luci-ferase expression when Blimp-1 was expressed (Fig. 2b), which dem-onstrated that Blimp-1 downregulated activity of the Ctss promoter. Moreover, transfection of small interfering RNA (siRNA) specific for Prdm1 in wild-type DCs led to increased Ctss expression, but transfection of nonspecific (control) siRNA did not (Fig. 2c), and restoration of Blimp-1 expression suppressed the abundance of Ctss transcripts and CTSS protein in Blimp-1–deficient DCs (Fig. 2d). These data demonstrated that Ctss was a target of Blimp-1 in DCs
WT DCTo
tal in
put
Contro
l IgG
Anti-B
limp-
1
H 2O
Blimp-1-KO DC
0.08
0.06
0.04
0.02
0.00Control IgG
Control
GFP
100
75
50
25
0 0
0 0 0
n.s.
20
40
60
80
100
100
200
300
400
–
20
40
60
80
2
4
6
GFP Control Prdm1 Control Prdm1
Control Prdm1 – Control Prdm1 – Control Prdm1
10–3
103
0
104
105
10–1
103
0
104
105
10–1
103
0
104
105
GF
PP
rdm
1 ex
pres
sion
(rel
ativ
e)
Cts
s ex
pres
sion
(rel
ativ
e)
Cts
d e
xpre
ssio
n(r
elat
ive)
FSC
050
K10
0K15
0K20
0K25
0K
FSC
050
K10
0K15
0K20
0K25
0K
FSC
Actin
CTSS
Blimp-1– Con
trol
Prdm
1
050
K10
0K15
0K20
0K25
0K
0
Eve
nts
(% o
f max
)
20406080
100
0
Eve
nts
(% o
f max
)
20406080
100
Prdm1
Prdm1
Prdm1
Ctss
Control
Control
P = 0.019
siRNA
Prd
m1
expr
essi
on(r
elat
ive)
GF
P+ c
ells
(%
)
Cts
s lu
cife
rase
(R
LU)
0Cts
s ex
pres
sion
(rel
ativ
e ×
103 )
1
0.00
0.01
0.02
0.03
0.04
2
3
4
Prdm1ControlsiRNA
* *
–
Anti-Blimp-1
WT CKO
Exp
ress
ion
(% o
f inp
ut)
P = 0.014P = 0.003
P = 0.057a
c d
b
P = 0.002P = 0.001
P = 0.008
Figure 2 Blimp-1 regulates Ctss expression in DCs. (a) ChIP of cDCs purified from the spleen of female wild-type or CKO mice, with antibody to Blimp-1 (anti-Blimp-1) or goat polyclonal IgG (Control IgG), followed by qPCR with primers specific for the Ctss; presented as agarose-gel electrophoresis (left) and qPCR results (right). (b) Flow cytometry (left) of wild-type BM-DCs 24 h after transfection with a luciferase plasmid driven by the Ctss promoter alone or also transfected with (2:1 ratio) control vector encoding green fluorescent protein (GFP) alone (Control) or vector encoding Prdm1 and GFP (Prdm1), analyzing transfection efficiency via GFP expression (quantitation (as GFP+ cells), middle), followed immediately by analysis of luciferase activity of the Ctss promoter, normalized to the activity of renilla luciferase (right). (c) qPCR analysis of Prdm1 and Ctss mRNA in BM-DCs 48 h after transfection of control siRNA with a scrambled sequence (Control) or Prdm1-speficic siRNA (Prdm1) (below plot); results are presented relative to those of Polr2a. (d) qPCR analysis of Prdm1 mRNA, Ctss mRNA and Ctsd mRNA (irrelevant control) (bottom row) and immunoblot analysis of Blimp-1, CTSS and actin (loading control) (top right) in Blimp-1-deficient BM-DCs left untransfected (−) or transfected with a plasmid encoding Prdm1 and GFP or control plasmid encoding GFP only (2 µg), analyzed at day 5 after transfection in GFP+ (successfully transfected) populations (red asterisks) purified 2 d after transfection (top left); qPCR results are presented relative to those of Polr2a. Each symbol (c,d) represents an individual experiment; small horizontal lines indicate the mean (± s.e.m.). P values, nonparametric, Mann-Whitney test. Data are from one experiment representative of four independent experiments (a (bottom plotted as in Fig. 1a); b, top), are from four independent experiments with n = 4 mice per group (b, bottom left; plotted as in Fig. 1a), are representative of three experiments with n = 4 mice per group (b, right; plotted as in Fig. 1a), are from one experiment representative of three independent experiments (d, top) or are from three independent experiments (c; d, bottom).
nature immunology VOLUME 18 NUMBER 9 SEPTEMBER 2017 1019
A rt i c l e s
and that the binding of Blimp-1 to the promoter region of Ctss sup-pressed its transcription.
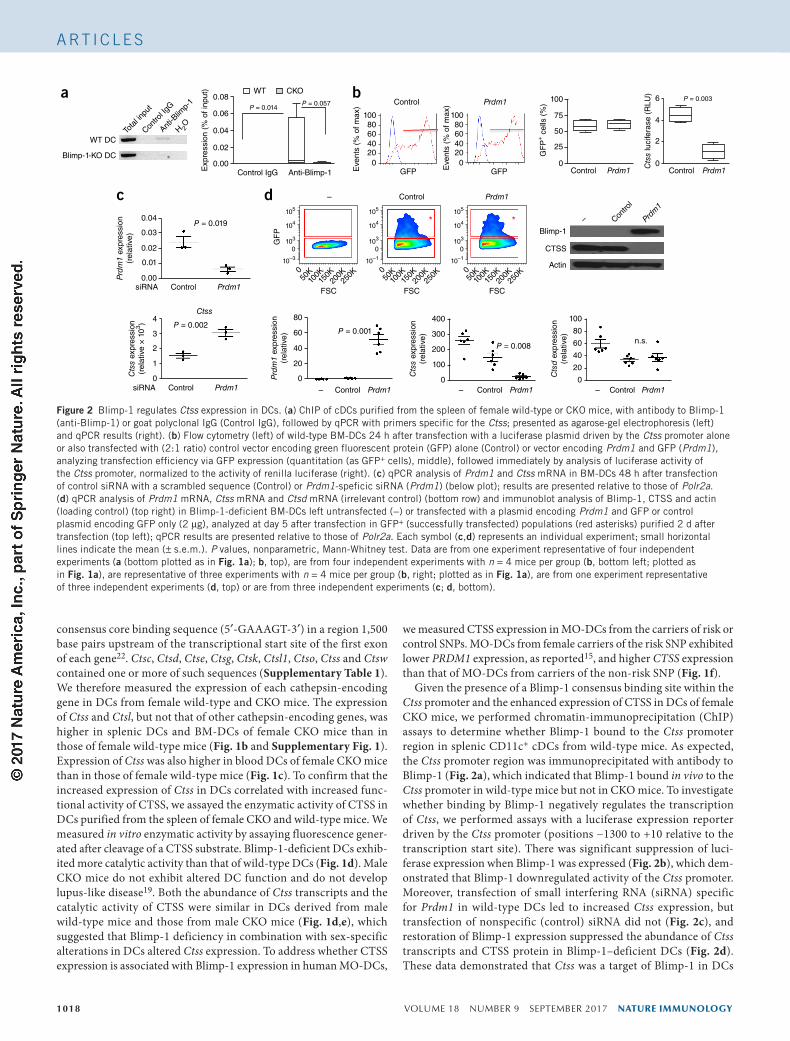
Sex specificity of altered Ctss expressionThe differential expression of Ctss in Blimp-1-deficient DCs from male mice relative to that in such cells from female mice suggested the presence of additional regulators in the cells of female mice that contributed to Blimp-1-mediated Ctss regulation. DCs from female CKO mice exhibit higher expression of IL-6 following activation of Toll-like receptors than do their counterparts from female wild-type mice, while DCs from male CKO and wild-type mice exhibit similar IL-6 expression19. That observation is not unexpected, as IL-6 has been shown to be positively regulated by estrogen in BM-DCs23, a finding that we confirmed here (Supplementary Fig. 2). The IL-6 signaling pathway activates the transcription activator and signal transducer STAT3, which is reported to be involved in the regulation of CTSS activity24 We first sought to determine whether IL-6 exerted a direct effect on Ctss expression. Exogenous IL-6 enhanced the promoter activity of Ctss in BM-DCs, as assessed with the luciferase reporter construct described above (Fig. 3a and Supplementary Fig. 3). We also investigated whether STAT3 bound to the Ctss promoter. We identified a canonical consensus sequence for STAT3 binding, TTCCnGGAA (where ‘n’ indicates any nucleotide)25, at position −1118 (relative to the transcription start site), and three additional candidate binding sequences upstream of the transcription-initiation site of the Ctss26 (Fig. 3b). We assessed the binding of STAT3 to each region by ChIP in wild-type BM-DCs. STAT3 bound at positions −1118 and −21 but not at position −2616 or −299 (Fig. 3b), which suggested direct upregulation of Ctss by the IL-6–STAT3 signaling pathway in DCs. To confirm the binding of STAT3 to position −1118, we deleted this binding site in the Ctss promoter region of the luci-ferase construct. IL-6 did not enhance luciferase expression from the construct with the deletion of TTCCnGGAA, while it significantly enhanced luciferase expression from the construct with the intact Ctss promoter (Fig. 3b).
To address the regulation of Ctss expression by IL-6 in vivo, we employed two approaches. First, we analyzed Ctss expression in DCs of female CKO mice that were haplosufficient for IL-6 (Il6+/−). Equivalent Ctss expression was observed in DCs from female CKO Il6+/− mice and those from wild-type Il6+/− mice (Fig. 3c). We also administered neutralizing antibody to IL-6 (MP5-20F3) to female CKO mice. There was significantly lower Ctss expression in DCs from mice treated with neutralizing antibody than in those from mice treated with the control antibody immunoglobulin G (IgG) (Fig. 3c. right). Thus, IL-6 participated in the positive regulation of Ctss in DCs and probably contributed to the increased abundance of Ctss transcripts seen in Blimp-1-deficient DCs from female mice.
Blimp-1-deficient DCs ‘preferentially’ induce IL-21+ T cellsThe greater number of TFH cells in female CKO mice might have resulted from skewed differentiation into TFH cells induced by Blimp-1-deficient DCs, as previously reported19, or from DC-induced changes in gene expression in TFH cells that led to enhanced survival of TFH cells in CKO mice. Irf4, Maf, Batf and Bcl6 encode transcrip-tion factors that positively influence the number of TFH cells27. We isolated TFH cells from female wild-type and CKO mice and assessed the expression of these genes. Only Bcl6 expression was significantly higher in TFH cells of female CKO mice than in those of female wild-type mice (Supplementary Fig. 4), which suggested the possibility of enhanced survival of TFH cells.
We reasoned that the higher expression of Ctss in Blimp-1-deficient DCs might affect antigen presentation by MHC class II molecules, which might influence the TCR repertoire in a manner favorable to the development of autoreactive TFH cells. We therefore assayed activation of OT-II CD4+ cells , which recognize a complex of oval-bumin (OVA) peptide (amino acids 323–339) and MHC class II. CD4+ T cells purified from OT-II mice were co-cultured for 3 d with CD11c+ cDCs isolated from the spleen of female CKO or wild-type mice and either intact OVA protein or OVA peptide. T cell prolifera-tion, measured as dilution of the division-tracking dye CFSE, was
3
2
1
0
15
10
5
0 0
2
4
6
8
10
II6+/+ II6+/–
Cts
s ex
pres
sion
(re
lativ
e ×
102 )
Cts
s ex
pres
sion
(rel
ativ
e ×
102 )
Medium
ControlIgG
MP5-20F3(anti-IL-6)
0.020
0.015
0.010
0.005
0.000Primer Fos Myc 1 2 3 4
0Medium IL-6
WTpromoter
Deletionmutationpromoter
NS2
4
6
8
10
Luci
fera
se (
RLU
)
DN
A (
% o
f inp
ut)
WT
Control IgG2a
124H6 (anti-STAT3)
CKO
P = 0.008
P = 0.001 P = 0.003 P = 0.028
P = 0.018
P = 0.013
P = 0.023
Position 1 (–2616)
TTCnGAA TTCCnGGAA TTCnnnnnGAA TTCnnnnGAA
Position 3 (–299) Position 4 (–21)
Position 2
WT promoter
Deletion mutation promoter
Luciferase
Luciferase
Position 2 (–1118)canonical sequence
NS
NS
IL-6
Cts
s-lu
cife
rase
(×10
5 )
a
c
b
Figure 3 IL-6 has a role in Ctss expression in DCs. (a) Luciferase activity of BM-DCs transfected with a luciferase plasmid driven by the Ctss promoter (2 µg), followed by culture for 2 h in the presence (IL-6) or absence (Medium) of IL-6 (100 ng/ml). (b) ChIP-qPCR analysis (bottom left) of BM-DCs stimulated with IL-6 (100 ng/ml), followed by cross-linking and incubation of DNA overnight with control antibody (IgG) or anti-STAT3 (124H6), then qPCR with each primer set (top left), with Fos and Myc amplified as positive control; results are presented relative to total input. Top left, putative STAT3-binding sites (below diagram) and primers used (1–4; double arrows). Bottom right, luciferase activity of cells transfected with luciferase construct driven by a wild-type or mutated Ctss promoter (green box; top right). (c) qPCR analysis of Ctss in splenic DCs from female wild-type or CKO mice of the Il6+/+ or Il6+/− genotype (horizontal axis) (left) or mice given intraperitoneal injection of anti-IL-6 (MP5-20F3; 50 µg) or control antibody (IgG) for 2 weeks (right); results were normalized to those of Polr2a. Each symbol represents an individual experiment (a,b (left)), sample (b, right) or mouse (c); small horizontal lines (b,c) indicate the mean (± s.e.m.); diagonal lines connect results for the same sample (a,b (bottom right)). P values, nonparametric, Mann-Whitney test. Data are representative of four experiments (a,c; plotted as in Fig. 1a (c, right)) or three experiments (b).
1020 VOLUME 18 NUMBER 9 SEPTEMBER 2017 nature immunology
A rt i c l e s
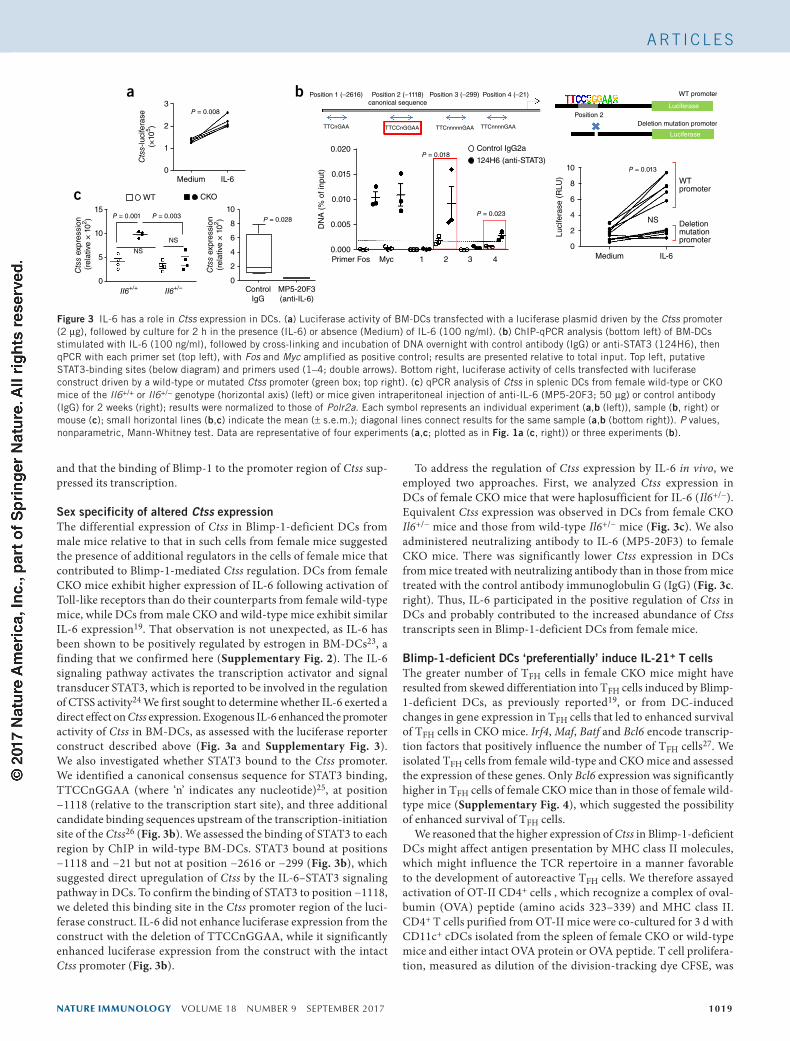
vigorous in the presence of each antigen preparation, regardless of the source of DCs (Fig. 4a).
The activation of CD4+ T cells is characterized also by cytokine pro-duction. Splenic DCs pre-incubated with OVA protein were cultured with OT-II T cells, and the expression of cytokine-encoding mRNA by T cells and the frequency of T cells staining positive for cytokine protein were measured by qPCR and flow cytometry, respectively. Culture with Blimp-1-deficient DCs led to modestly but significantly greater IL-2 mRNA in the T cells than that of T cells cultured with wild-type DCs; however, the intracellular abundance of IL-2 in T cells cultured with Blimp-1-deficient DCs did not differ from that in T cells cultured with wild-type DCs (Fig. 4b,c). The concentration of
secreted IL-2 was also not different in these two culture conditions (Supplementary Fig. 5), which explained the lack of difference in the proliferation index of T cells stimulated with wild-type DCs relative to that of T cells stimulated with Blimp-1-deficient DCs.
Many cytokines that are ‘preferentially’ expressed by TH1, TH2, TH17 or Treg cells were not significantly different in cultures of T cells with Blimp-1-deficient DCs versus cultures of T cells wild-type DCs (Supplementary Fig. 6). While the expression of IL-21, produced by TFH cells, was relatively low compared with that of other cytokines, Il21 transcription and IL-21 production were greater in cultures with Blimp-1-deficient DCs and intact OVA than in cultures with wild-type DCs and intact OVA (Fig. 4b,c and Supplementary Fig. 5).
Cou
ntT alone
DC + T + OVA
1.00
0.75
0.50
0.25
0.00OT-II +
––
+1:10
–
+1:1+
+1:5+
+1:10
+
+1:100
+DCOVA
Div
isio
n in
dex
CFSE
40
30
20
10
0 0
0.1
0.2
0.3
OT-II +––––
++–––
+++––
++++–
+++–+
+
+Fixed
––
DCOVA
OVA
WT
IL-2
–Per
CP
–Cy5
.5
CKO
OVA +Transwell
OVA +CTSS inh
TranswellCTSS inh
OT-II +––––
++–––
+++––
++++–
+++–+
+
+Fixed
––
DCOVATranswellCTSS inh
OT-II T +––––
++–––
+++––
++++–
+++–+
DCOVATranswellCTSS inh
OT-II T +––––
++–––
+++––
++++–
+++–+
DCOVATranswellCTSS inh
Il2 e
xpre
ssio
n (r
elat
ive)
Il21
expr
essi
on (
rela
tive)
P = 0.046
P = 0.003
P = 0.029
P = 0.001
NS
NS
NS
NS NS
10–3
10–310–3
103
103
104
104
105
105
0
0
1030 104 105
10–3 1030 104 105
WTWT DC
WT
CD11c-APC
OV
A u
ptak
e(g
eoM
FI ×
103 )
8
6
4
2
00 1 10
OVA (µg/ml)
1 µg
DQ
-OV
A
WT
CKO
10 µg
CKOWTCKO
WT40
30
20
10
00
20
40
60
80
100
IL-2
1+ T
cel
ls (
%)
IL-2
+ T
cel
ls (
%)
CKO
Blimp-1-KO DC
CKOa d
b
c
10–3 103 104 1050
10–3
103104
105
0
IL-21–FITC
Figure 4 ‘Preferential’ differentiation of IL-21-producing T cells by co-culture with Blimp-1-deficient DCs in vitro. (a) Proliferation of OT-II T cells labeled with CFSE (10 µM) and then cultured alone (T alone) or with wild-type or Blimp-1-deficient DCs (key) and OVA (DC + T + OVA), assessed by flow cytometry (left), and division of OT-II CD4+ T cells cultured for 3 d with DCs from the spleen of female wild-type or CKO mice (key) at various ratios (below plot), with (+) or without (−)OVA protein (10 µg/ml) (right), presented as the division index (total divisions / starting cells). (b) qPCR analysis of Il2 and Il12 mRNA among total RNA purified from OT-II T cells cultured with no DCs (−) or with unfixed DCs (+) or fixed DCs (far right) from wild-type or CKO mice (key), in the presence (+) or absence (−) of OVA protein, and a Transwell insert or an inhibitor (inh) of CTSS (below plot); results were normalized to those of Polr2a. (c) Intracellular staining of IL-2 and IL-21 in T cells cultured with DCs from wild-type or CKO mice (left margin) and OVA protein alone or OVA with a Transwell insert or an inhibitor of CTSS (above plots), then stimulated for 6 h with PMA (100 ng/ml) plus ionomycin (1 µg/ml), with brefeldin A (20 µg/ml) added during the final 4 h of stimulation (left), and frequency of IL-2+ T cells (middle) or IL-21+ T cells (right) among CD4+ T cells cultured as in b (below plot) and with PMA plus ionomycin and brefeldin A as at left. (d) Uptake of OVA into DCs from wild-type or CKO mice (left margin), incubated overnight with DQ-labeled OVA protein at various concentrations (above plots), then washed extensively and assessed by flow cytometry (top), and abundance of OVA in those cells, presented as geometric mean fluorescence intensity (geoMFI). Each symbol (d) represents an individual experiment; small horizontal lines indicate the mean (± s.e.m.). P values, nonparametric, Mann-Whitney test. Data are representative of four experiments (a; plotted as in Fig. 1a (right)), twelve experiments (unfixed DCs) or ten experiments (fixed DCs) (b; plotted as in Fig. 1a), or eight experiments (c, middle and right; plotted as in Fig. 1a), are from one experiment representative of four (c, left) or three (d, top) independent experiments, or are from three experiments (d, bottom).
nature immunology VOLUME 18 NUMBER 9 SEPTEMBER 2017 1021
A rt i c l e s
The increased IL-21 was dependent on antigen processing, since it was abolished in cultures in which OVA peptide (amino acids 323–339) was used as the antigen (Supplementary Fig. 7), and it was dependent on T cell–DC contact, as it was also abolished in Transwell cultures (Fig. 4b,c). Fixation of DCs after incubation with OVA protein also revealed higher expression of IL-21 in cultures with Blimp-1-deficient DCs than in those with wild-type DCs, although IL-21 production by fixed DCs of each strain was less than that of unfixed cells (Fig. 4b), presumably due to both the absence of cytokine secretion and the absence of membrane fluidity.
The activation of OT-II T cells by OVA protein represented a cog-nate interaction between T cells and DCs, since the OT-II T cells were not activated with an irrelevant antigen (hen egg lysozyme) (Supplementary Fig. 8). To confirm that the enhanced activation of T cells mediated by Blimp-1-deficient DCs resulted from increased CTSS, we treated cultures with the CTSS inhibitor 219393 (with selec-tivity for CTSS ~400-fold greater than its selectivity for CTSB)28 or with a CTSB inhibitor, as a control. When the CTSS inhibitor was added during OVA processing, there was no increased IL-21 production seen in cultures with Blimp-1-deficient DCs (Fig. 4b,c), but when the CTSB inhibitor was added, that increase did occur (Supplementary Fig. 8). To confirm that CTSS functions to alter antigen processing rather than antigen uptake, we incubated fluorescence (DQ)-conjugated OVA protein overnight with purified DCs from each strain and assessed OVA uptake by flow cytometry. There was no significant difference in the amoung of OVA internalized by wild-type DCs and that internalized by Blimp-1-deficient DCs (Fig. 4d). These data sug-gested that the Blimp-1-deficient DCs had altered antigen processing. Thus, the increased CTSS altered antigen presentation, which induced activated CD4+ T cells to differentiate into TFH cells.
Diversity of the TFH cell TCR repertoireTo investigate whether the population expansion of TFH cells in CKO mice was accompanied by a change in their antigenic specificity, we compared the TCR repertoires of TFH cells in wild-type mice with
those of CKO mice. TFH cells were purified from the spleens of young (6–10 weeks of age) female and male mice. TFH cells were identified by their expression of the chemokine receptor CXCR5 and costimula-tory molecule PD-1; they also expressed the transcriptional repressor Bcl-6 (~95%) and costimulatory receptor ICOS-1 (~70%) (Fig. 5a). Although no autoantibodies are detected at this age, there was already a greater number of TFH cells in female CKO mice than in wild-type mice (Fig. 5a). We focused on Vβ sequences, as these are more diverse than Vα sequences. We analyzed over 100,000 Vβ sequences in TFH cells from each of five female mice and five male mice of each strain. TFH cells from female CKO mice exhibited a more-diverse repertoire than that of TFH cells from female wild-type mice (Fig. 5b). Notably, TFH cells from male CKO mice and those from wild-type mice exhib-ited similar diversity (Fig. 5b).
To confirm that the diverse TCR Vβ repertoire of TFH cells was associated with autoimmunity, we assessed the Vβ repertoire of wild-type and female CKO Il6+/− mice. It has been shown that neither of these strains develops disease19. We found no difference in repertoire diversity (Fig. 5b), consistent with their similar number of TFH cells. Thus, the more diverse repertoire was seen only in association with a lupus phenotype.
CTSS inhibitor suppresses lupus developmentGiven the enhanced activity of CTSS in Blimp-1-deficient DCs and the promising effects of CTSS inhibition on TFH cell differentiation in vitro, we investigated whether inhibition of CTSS would suppress development of the lupus-like phenotype in CKO mice, as has been shown in the MRL/lpr mouse model of lupus29. First, we assessed lym-phocyte development following long-term treatment with the CTSS inhibitor RO5461111 in chow. Accumulation of the p10 fragment of the invariant chain was seen in splenocytes of wild-type and CKO mice fed RO5461111-treated chow but not in those of mice fed con-trol chow (Fig. 6a), which demonstrated the efficacy of the treatment. Treatment with RO5461111 did not alter the overall frequency of either lymphocytes or DC subsets in wild-type mice (Fig. 6b). DC activation,
CD4-APC-Cy7 PD-1–PE
ICOS-1–FITC
PD-1–PE
0Female
II6+/–
WT
P = 0.05
P = 0.01
P = 0.01
NS
NS NSNS
NS NSCKO
WT
CKO
Male
Female
TF
H c
ells
(×
105 )
TF
H c
ells
(×
105 )
0 0 0.0
0.5
1.0
1.5
2.0
2
4
6
8
1
2
3
4
Male WT CKO WT CKO
CX
CR
5hiP
D-1
+
TF
H c
ells
(%
)
2.0
1.5
1.0
0.5
0.0Female Male II6+/– female
Sha
nnon
ent
ropy
(nor
mal
ized
)
CX
CR
5hiP
D-1
+
TF
H c
ells
(%
)
2
4
6
8WT CKO
TC
Tβ–
Pac
ific
blue
CX
CR
5-A
mC
yan
CX
CR
5-A
mC
yan
10–3
10–3
103
103
0
0
104
104
105 10–3 1030 104 105 10–3 1030 104 105
105
10–3
103
0
104
105
BC
L-6–
Per
CP
–Cy5
.5
10–3
10–3
103
103
0
0
104
104
105
BC
L-6–
Per
CP
–Cy5
.5
10–3
103
0
104
105
105
ICOS-1–FITC10–3 1030 104 105
10–3
103
0
104
105
a b
II6+/–
Figure 5 The TFH cells of female CKO mice harbor a diverse CDR3 repertoire. (a) Flow cytometry identifying TFH cells (red outline) in the spleen of age-matched female wild-type or CKO mice (above plots) (left), and the frequency of TFH cells among CD4+ T cells (top right) and number of TFH cells (bottom right) in the spleen of female or male (horizontal axes) wild-type or CKO mice (key), identified as at left. (b) TCR Vβ diversity in TFH cells from female or male wild-type or CKO mice (key) or from female wild-type or CKO Il6+/− mice, presented as true Shannon diversity (average values) of 1 × 10⁵ sequences per mouse (n = 5 per group), normalized to the results of wild-type mice (left), and frequency and number of TFH cells in the spleen of female wild-type or CKO Il6+/− mice (right). Each symbol (a,b, right) represents an individual experiment; small horizontal lines indicate the mean (± s.e.m.). P values, nonparametric, Mann-Whitney test. Data are from one experiment representative of three independent experiments (a, left) or are representative of three independent experiments (a, right, b; plotted as in Fig. 1a (b, left)).
1022 VOLUME 18 NUMBER 9 SEPTEMBER 2017 nature immunology
A rt i c l e s
as measured by expression of MHC class II, was also not affected by such treatment (Fig. 6b). RO5461111 was given to female CKO mice to investigate whether inhibition of CTSS prevented development of the lupus-like phenotype. Splenomegaly was suppressed by inhibition of CTSS, with a reduction in the number of splenocytes in RO5461111-treated CKO mice relative to that in untreated CKO mice (Fig. 6c). Ciita expression was not altered in splenic DCs in RO5461111-treated CKO mice relative to that in untreated CKO mice (Fig. 6d). RO5461111-treated CKO mice showed significantly reduced titers of antibodies to double-stranded DNA at both 4 months and 6 months, relative to that in untreated CKO mice (Fig. 6e). Proteinuria and deposition of IgG in glomeruli were also significantly lower in RO5461111-treated CKO mice than in untreated CKO mice (Fig. 6f,g).
The frequency of TFH cells and effector memory T cells was sig-nificantly lower in RO5461111-treated CKO mice than in untreated CKO mice (~3.5-fold and 2-fold, respectively), while the frequency of naive T cells (CD44loCD62Lhi) was slightly higher (~2-fold) in RO5461111-treated CKO mice than in untreated CKO mice (Fig. 7a). Consistent with the lower frequency of TFH cells, the frequency of germinal-center B cells and plasma cells was also much lower (~10-fold) in RO5461111-treated CKO mice than in untreated CKO mice (Fig. 7b,c). These data demonstrated that increased CTSS expres-sion promoted the development of a lupus-like phenotype in CKO mice and that inhibition of CTSS activity was able to suppress the development of disease. Finally, the Vβ repertoire was significantly less diverse in TFH cells from RO5461111-treated CKO mice than in
RO5461111
B22
0–P
acifi
c bl
ue
CD
21–F
ITC
CD
8a–P
erC
PC
D4–
FIT
C
TC
Rβ–
AP
CC
D11
c–A
PC
CD
21–F
ITC
Com
p-F
ITC
-A
p10
Actin
RO5461111
MH
CII
(geo
MF
I × 1
03 )
RO5461
111
NS
Ciit
a ex
pres
sion
(rel
ativ
e)
Spl
enoc
ytes
0 0
10
20
30
40
50
100
150
200
250Splenocytes
P = 0.013
P = 0.004P = 0.002
P = 0.004
– +
RO5461111 – +
RO5461111 – +
AA4.1–APC
FSC
Siglec-H–FITC CD11b–PE-Cy7 MHCII–Pacific blue
CD8–PerCP cDC
CD23–PE CD23–PE
– + +
–103
–103
103
104105
103
104
105
a c d
e
g
f
b
0–1
03
103
104
1050
–103
103
104
1050
–103
103
104
1050
–103
103
104
1050
–103
103
104
1050
–103
103
104
1050
050
K10
0K15
0K20
0K25
0K
0–103
103
104105
0–103
103
104105
0
–103
103
104
105
0–103
103
104
105
0
–103
103
104
105
0–103
103
104
105
0
01020304050
Cou
nt
0
2
0 0
5
10
15
20
– + – + – +
2 4 4 6 6 PCAge (months)
RO5461111
–
–
RO5461111
Mature Immature
cDC pDC CD11b+ CD4+ CD8+CD8α+
T1FO MZ0 0
20
40
60
80
100
00
1
2
3
20
40
60
80
100
0
20
40
60
80
100
20
40
60
80
0
20
40
60
80
T2Imm
atur
e B
cel
ls (
%)
T c
ells
(%
)
cDC
s (%
)
DC
s (%
)
Mat
ure
B c
ells
(%
)
B c
ells
(%
)
Ant
i-dsD
NA
IgG
(A
405)
Urin
e al
bum
in(n
g/m
l × 1
03 )
1
2
3
4
CKORO5461111
CKO––
WT
2468
10
Figure 6 The CTSS inhibitor RO5461111 prevents development of the lupus-like phenotype in female CKO mice. (a) Immunoblot analysis of p10 in total splenocytes of wild-type mice fed standard chow (−) or RO5461111-treated chow (+) for 2 week (one mouse per lane)). (b) Flow cytometry identifying lymphocyte and DC subsets and the MHC class II (MHCII) expression of DCs (top, left and middle), and abundance of MHC class II (top right) in cDCs sorted (as at left) from mice treated as in a (below plot). Below, frequency of mature or immature B cells among all B cells (top left), follicular (FO) or marginal-zone (MZ) mature B cells among AA4.1− B cells (top middle), transitional stage 1 (T1) or stage 2 (T2) immature B cells among AA4.1+ B cells (top right), cDCs or plasmacytoid DCs (pDCs) among splenocytes (bottom left), CD11b+ or CD8α+ cDCs among CD11chiMHCIIhi cDCs (bottom middle), and CD4+ or CD8+ T cells among TCRβ+ T cells (bottom right), all sorted as above. (c) Quantification of splenocytes in 6-month-old female CKO mice fed standard chow (−) or RO5461111-treated chow (+) for 4 months. (d) qPCR analysis of Ciita in splenic DCs purified from CKO mice fed standard or RO5461111-treated chow; results were normalized to those of Polr2a. (e) ELISA of IgG antibody to double-stranded DNA (Anti-dsDNA IgG) in blood from 2-, 4- and 6-month old mice fed standard or RO5461111-treated chow (below plot) or in serum from proteinuria-positive (sick) female CKO mice (positive control (PC)); results are presented as absorbance at 405 nm (A405). (f) ELISA of albumin in urine from 6-month-old female CKO mice fed standard or RO5461111-treated chow, assessing proteinuria. (g) Fluorescence microscopy of IgG deposition in the kidneys of 6-month-old wild-type or CKO mice fed standard or RO5461111-treated chow. Original magnification, ×10; scale bars, 100 µm. Each symbol (b–f) represents an individual mouse; small horizontal lines indicate the mean (± s.e.m.). P values, nonparametric, Mann-Whitney test. Data are from one experiment representative of three independent experiments (a,b, top left), are representative of three experiments (b, top right (plotted as in Fig. 1a) and bottom), are from two independent experiments with n = 5 mice (control) or n = 6 mice (RO5461111) (c,e) or are representative of two experiments with five samples per group (f).

nature immunology VOLUME 18 NUMBER 9 SEPTEMBER 2017 1023
A rt i c l e s
those from untreated CKO mice (Fig. 7d). Thus, higher CTSS expres-sion and activity in DCs led to a TFH cell population with greater TCR diversity.
DISCUSSIONAlterations in antigen presentation can lead to autoimmune or inflam-matory diseases30. Human genetic studies have shown that genes encoding human leukocyte antigen class II represent prominent risk alleles for autoimmune diseases, including SLE31,32. As human leu-kocyte antigens are critical in establishing thresholds for the selection and activation of T cells, the TCR repertoire has been presumed to be a key contributor to many autoimmune diseases33.
A role for Blimp-1 in antigen presentation was initially sug-gested in a study showing that Blimp-1 regulates expression of Ciita, which encodes a positive regulator of MHC class II expres-sion in B cells20. Subsequently, Blimp-1 was shown to regulate MHC class II in DCs and thereby affect the threshold for activation of CD4+ helper T cells in a mouse model of experimental autoim-mune encephalomyelitis34.
The importance of antigen presentation prompted us to investigate whether Blimp-1 alters antigen presentation to T cells and, thus, the TCR repertoire. Blimp-1-deficient DCs showed altered expression of several genes encoding molecules involved in antigen presentation, including Ctss. Deletion of Blimp-1 led to increased Ctss transcrip-tion in DCs because Blimp-1 is a transcriptional repressor of Ctss and of Il6. IL-6 had high expression in Blimp-1-deficient DCs from female mice, which led to increased Ctss expression. Thus, Bimp-1 directly and indirectly regulated Ctss expression. As described in a published study, increased activation of IL-6 and STAT3 also decreases expression of the gene encoding cystatin C, which subse-quently enhances CTSS activity24. The increased CTSS activity in DCs of female CKO mice led to increased diversity in the TCR reper-toire of TFH cells, which was abolished by a CTSS-specific inhibitor. These findings suggested that an increase in CTSS expression associ-ated with absent or low expression of Blimp-1 generated a repertoire
more skewed toward self-reactivity. While it is likely that the PRDM1 risk allele for SLE also leads to a more-diverse repertoire of TFH cells, this will require confirmation in studies of human subjects with the risk allele or the non-risk allele.
The importance of appropriate expression of CTSS in antigen presentation is now widely accepted, and its molecular mechanism has been investigated in other studies. Modulation of the expres-sion of CTSS and CTSL has been shown to lead to alterations in the pool of peptides presented by MHC class II molecules in an in vitro study10,35. Thymic DCs express CTSS and efficiently cleave many known autoantigens; when CTSS concentrations are increased, it is presumed those T cell epitopes that mediate negative selection are destroyed, which allows autoreactive T cells to escape to the periphery12. Conversely, CTSS-deficient mice are very resistant to the development of experimental autoimmune myasthenia gravis36. Our study here has shown that enhanced CTSS in DCs can lead to an alteration of the T cell repertoire in the TFH cell compartment. Notably, increased CTSS has been observed in serum from patients with SLE and lupus nephritis37.
An increased frequency of TFH cells in peripheral lymphoid organs is a phenotype commonly observed in animal models of SLE38,39. However, it is not clearly understood whether an increased number of TFH cells results in a predisposition to autoimmunity or whether the antigenic specificity of the TFH cells in these models is also altered. The antigenic specificity of activated CD4+ T cells is determined largely by encounter with peptide–MHC class II complexes on DCs40,41. While TCR selection occurs in the thymus, the differentiation of effector T cells occurs in the periphery when CD4+ T cells encounter APCs presenting specific peptide–MHC class II complexes42. We do not yet know whether the more-diverse TCR repertoire of TFH cells observed in female CKO mice than in female wild-type mice was determined by selection in the thymus or activation in the periphery. Nonetheless, this study has demonstrated the importance of the precise regulation of CTSS in APCs in determining the T cell repertoire and the fate of autoreactive T cells.
CD
4-P
erC
P-C
y5.5
CD
4-P
erC
P-C
y5.5
CX
CR
5-A
mC
yan
CD
44-P
acifi
c bl
ue
B22
0-A
mC
yan
CD3-APC-Cy7 PD-1–PE
CK
O –C
KO
RO
5461
111
TFH TEM
105
105
104
104
103
10310–3
10–3
0
105
104
103
10–30
105
104
103
10–30
105
104
103
10–30 105
104
103
10–30
105
104
103
10–30
CD
44-P
acifi
c bl
ue 105
104
103
10–30
CX
CR
5-A
mC
yan
105
104
103
10–30
0
CD3-APC-Cy7
RO5461111 –0 0
20
40
60
80
PD
1+C
XC
R5+
ICO
S+
TF
H c
ells
(%
)
CP
D62
L-C
D44
int
TE
M c
ells
(%
)
5
10
15
+ RO5461111 – +
10510410310–30
10510410310–3 0CD62L-APC
GL7-FITC
CD138-PE
B22
0-A
mC
yan
RO5461111
B22
0+G
L-7+
GC
B c
ells
(%
)
0
2
4
6
8
– +
RO54611110
B22
0loC
D13
8+
plas
ma
cells
(%
)
2
4
6
8
– +
RO5461111
0.0
Sha
nnon
ent
ropy
(nor
mal
ized
)
0.5
1.0
1.5
2.0
+ –
P = 0.013
P = 0.004
P = 0.004 P = 0.008
P = 0.03
CKO–
CKO–
CKORO5461111
CKORO5461111
10510410310–3 0
10510410310–30
105
105
104
104
103
103
10–310–3
0
0
105
104
103
10–30
10510410310–30
10510410310–30
CD62L-APC10510410310–3 0
PD-1–PE10510410310–3 0
a b
c
d
Figure 7 RO5461111 suppresses the population expansion of TFH cells and germinal-center B cells in CKO mice. (a) Flow cytometry of lymphocytes from 6-month-old female CKO mice fed standard chow (−) or RO5461111-treated chow (+) (left margin), for the identification of TFH cells (middle) and effector memory T cells (TEM) (top), and frequency of PD-1+CXCR5+ICOS+ TFH cells (bottom left) or CD62L−CD44int effector memory T cells (bottom right) among CD4+ T cells from such mice. (b,c) Flow cytometry of B cells from mice as in a, for the identification of germinal-center (GC) B cells (b) or plasma cells (c) (left), and frequency of B220+GL-7− germinal-center B cells among B220+ B cells (b) or B220loCD138+ plasma cells among total singlets (c) (right). (d) TCR diversity of TFH cells obtained from female CKO mice and treated with CTSS inhibitor (+) or not (−). Each symbol (a–c) represents an individual mouse; small horizontal lines indicate the mean (± s.e.m.). P values, nonparametric, Mann-Whitney test. Data are from one experiment representative of five independent experiments (a, top left; b,c, left) or are representative of four experiments (a (top right and bottom), d (plotted as in Fig. 1a)) or three experiments (b,c, right).
1024 VOLUME 18 NUMBER 9 SEPTEMBER 2017 nature immunology
An inhibitor of CTSS has been shown to prevent disease onset in the MRL/lpr mouse model of lupus29. Our study also demonstrated that inhibition of CTSS was able to prevent disease onset and the lupus-related phenotype in CKO mice. More notably, treatment with this inhibitor made the TCR repertoire of TFH cells less diverse. Because long-term treatment with the inhibitor did not reduce the expression of MHC class II on DCs, we speculate that the main function of the inhibitor is to change the pool of peptides presented on MHC class II in vivo. Our data help explain how the SLE-associated PRDM1 risk allele, with low expression of Blimp-1 and high expression of IL-6 in DCs, contributes to the risk of developing SLE.
METHODSMethods, including statements of data availability and any associated accession codes and references, are available in the online version of the paper.
Note: Any Supplementary Information and Source Data files are available in the online version of the paper.
AcKnoWleDGmentSWe thank H. Borrero and C. Colon for assistance with the flow cytometry; G. Klein and M. DeFranco RN for recruiting PRDM1-genotyped subjects; and C. Chrysostomou for discussions and assistance in bioinformatics analysis. Supported by National Institute of Arthritis and Musculoskeletal and Skin Diseases, the US National Institutes of Health (R01 AR065209 to S.J.K. and B.D.), the Alliance of Lupus Research (B.D.) and the Defense Threat Reduction Agency (HDTRA 1-12-C-0105 for G.G.).
AUtHoR contRIBUtIonSS.J.K. designed and performed experiments, analyzed data and interpreted results; S.S. performed the sequencing experiments and analyzed data; S.S.A. and W.H. provided RO5461111, and critically reviewed the manuscript; S.H.J. performed the ChIP experiments and Il6 promoter assay; P.K.G. provided the samples for the human study; G.G. designed the sequencing experiments and interpreted data; B.D. designed the study and analyzed and interpreted results; S.J.K., S.S., G.G. and B.D. participated in the interpretation of the study and wrote the manuscript, and also provided critical review of the paper; and all contributing authors agreed to the submission of this manuscript for publication.
comPetInG FInAncIAl InteReStSThe authors declare competing financial interests: details are available in the online version of the paper.
reprints and permissions information is available online at http://www.nature.com/reprints/index.html. Publisher’s note: springer Nature remains neutral with regard to jurisdictional claims in published maps and institutional affiliations.
1. Pavli, P., Hume, D.A., Van De Pol, E. & Doe, W.F. Dendritic cells, the major antigen-presenting cells of the human colonic lamina propria. Immunology 78, 132–141 (1993).
2. Guilliams, M. et al. Skin-draining lymph nodes contain dermis-derived CD103− dendritic cells that constitutively produce retinoic acid and induce Foxp3+ regulatory T cells. Blood 115, 1958–1968 (2010).
3. Bousso, P. T-cell activation by dendritic cells in the lymph node: lessons from the movies. Nat. Rev. Immunol. 8, 675–684 (2008).
4. Zhu, J. & Paul, W.E. CD4 T cells: fates, functions, and faults. Blood 112, 1557–1569 (2008).
5. Rogers, P.R. & Croft, M. Peptide dose, affinity, and time of differentiation can contribute to the Th1/Th2 cytokine balance. J. Immunol. 163, 1205–1213 (1999).
6. Rogers, P.R., Dubey, C. & Swain, S.L. Qualitative changes accompany memory T cell generation: faster, more effective responses at lower doses of antigen. J. Immunol. 164, 2338–2346 (2000).
7. Théry, C. & Amigorena, S. The cell biology of antigen presentation in dendritic cells. Curr. Opin. Immunol. 13, 45–51 (2001).
8. Villadangos, J.A. et al. Proteases involved in MHC class II antigen presentation. Immunol. Rev. 172, 109–120 (1999).
9. Shi, G.P. et al. Human cathepsin S: chromosomal localization, gene structure, and tissue distribution. J. Biol. Chem. 269, 11530–11536 (1994).
10. Hsieh, C.S., deRoos, P., Honey, K., Beers, C. & Rudensky, A.Y. A role for cathepsin L and cathepsin S in peptide generation for MHC class II presentation. J. Immunol. 168, 2618–2625 (2002).
11. Beers, C. et al. Cathepsin S controls MHC class II-mediated antigen presentation by epithelial cells in vivo. J. Immunol. 174, 1205–1212 (2005).
12. Stoeckle, C. et al. Cathepsin S dominates autoantigen processing in human thymic dendritic cells. J. Autoimmun. 38, 332–343 (2012).
13. Han, J.W. et al. Genome-wide association study in a Chinese Han population identifies nine new susceptibility loci for systemic lupus erythematosus. Nat. Genet. 41, 1234–1237 (2009).
14. Gateva, V. et al. A large-scale replication study identifies TNIP1, PRDM1, JAZF1, UHRF1BP1 and IL10 as risk loci for systemic lupus erythematosus. Nat. Genet. 41, 1228–1233 (2009).
15. Kim, S.J., Gregersen, P.K. & Diamond, B. Regulation of dendritic cell activation by microRNA let-7c and BLIMP1. J. Clin. Invest. 123, 823–833 (2013).
16. Xu, H. et al. Increased frequency of circulating follicular helper T cells in lupus patients is associated with autoantibody production in a CD40L-dependent manner. Cell. Immunol. 295, 46–51 (2015).
17. Le Coz, C. et al. Circulating TFH subset distribution is strongly affected in lupus patients with an active disease. PLoS One 8, e75319 (2013).
18. Choi, J.Y. et al. Circulating follicular helper-like T cells in systemic lupus erythematosus: association with disease activity. Arthritis Rheumatol. 67, 988–999 (2015).
19. Kim, S.J., Zou, Y.R., Goldstein, J., Reizis, B. & Diamond, B. Tolerogenic function of Blimp-1 in dendritic cells. J. Exp. Med. 208, 2193–2199 (2011).
20. Piskurich, J.F. et al. BLIMP-I mediates extinction of major histocompatibility class II transactivator expression in plasma cells. Nat. Immunol. 1, 526–532 (2000).
21. Vander Lugt, B. et al. Transcriptional programming of dendritic cells for enhanced MHC class II antigen presentation. Nat. Immunol. 15, 161–167 (2014).
22. Doody, G.M. et al. An extended set of PRDM1/BLIMP1 target genes links binding motif type to dynamic repression. Nucleic Acids Res. 38, 5336–5350 (2010).
23. Seillet, C. et al. Estradiol promotes functional responses in inflammatory and steady-state dendritic cells through differential requirement for activation function-1 of estrogen receptor α. J. Immunol. 190, 5459–5470 (2013).
24. Kitamura, H. et al. IL-6-STAT3 controls intracellular MHC class II αβ dimer level through cathepsin S activity in dendritic cells. Immunity 23, 491–502 (2005).
25. Becker, S., Groner, B. & Müller, C.W. Three-dimensional structure of the Stat3β homodimer bound to DNA. Nature 394, 145–151 (1998).
26. Hutchins, A.P., Diez, D. & Miranda-Saavedra, D. The IL-10/STAT3-mediated anti-inflammatory response: recent developments and future challenges. Brief. Funct. Genomics 12, 489–498 (2013).
27. Pratama, A. & Vinuesa, C.G. Control of TFH cell numbers: why and how? Immunol. Cell Biol. 92, 40–48 (2014).
28. Walker, B., Lynas, J.F., Meighan, M.A. & Brömme, D. Evaluation of dipeptide α-keto-β-aldehydes as new inhibitors of cathepsin S. Biochem. Biophys. Res. Commun. 275, 401–405 (2000).
29. Rupanagudi, K.V. et al. Cathepsin S inhibition suppresses systemic lupus erythematosus and lupus nephritis because cathepsin S is essential for MHC class II-mediated CD4 T cell and B cell priming. Ann. Rheum. Dis. 74, 452–463 (2015).
30. Klein, L., Hinterberger, M., Wirnsberger, G. & Kyewski, B. Antigen presentation in the thymus for positive selection and central tolerance induction. Nat. Rev. Immunol. 9, 833–844 (2009).
31. Deng, Y. & Tsao, B.P. Genetic susceptibility to systemic lupus erythematosus in the genomic era. Nat. Rev. Rheumatol. 6, 683–692 (2010).
32. Raj, P. et al. Regulatory polymorphisms modulate the expression of HLA class II molecules and promote autoimmunity. eLife 5, e12089 (2016).
33. Yang, H., Rittner, H., Weyand, C.M. & Goronzy, J.J. Aberrations in the primary T-cell receptor repertoire as a predisposition for synovial inflammation in rheumatoid arthritis. J. Investig. Med. 47, 236–245 (1999).
34. Yang, H. et al. Hrd1-mediated BLIMP-1 ubiquitination promotes dendritic cell MHCII expression for CD4 T cell priming during inflammation. J. Exp. Med. 211, 2467–2479 (2014).
35. Honey, K. & Rudensky, A.Y. Lysosomal cysteine proteases regulate antigen presentation. Nat. Rev. Immunol. 3, 472–482 (2003).
36. Yang, H. et al. Cathepsin S is required for murine autoimmune myasthenia gravis pathogenesis. J. Immunol. 174, 1729–1737 (2005).
37. Tato, M. et al. Cathepsin S inhibition combines control of systemic and peripheral pathomechanisms of autoimmune tissue injury. Sci. Rep. 7, 2775 (2017).
38. Yu, D. et al. Roquin represses autoimmunity by limiting inducible T-cell co-stimulator messenger RNA. Nature 450, 299–303 (2007).
39. Kim, S.J. et al. Increased IL-12 inhibits B cells’ differentiation to germinal center cells and promotes differentiation to short-lived plasmablasts. J. Exp. Med. 205, 2437–2448 (2008).
40. Brocker, T. Survival of mature CD4 T lymphocytes is dependent on major histocompatibility complex class II-expressing dendritic cells. J. Exp. Med. 186, 1223–1232 (1997).
41. Goldrath, A.W. & Bevan, M.J. Selecting and maintaining a diverse T-cell repertoire. Nature 402, 255–262 (1999).
42. Rocha, B. & von Boehmer, H. Peripheral selection of the T cell repertoire. Science 251, 1225–1228 (1991).
A rt i c l e s
nature immunologydoi:10.1038/ni.3793
ONLINE METHODSMice. CKO mice (Prdm1fl/flCd11c-Cre+) and their control littermates (Prdm1fl/flCd11c-Cre−) mice on a C57BL/6 background were bred and main-tained in a specific pathogen-free facility at the Feinstein Institute for Medical Research. OT-II mice (B6.Cg-Tg (TcraTcrb) 425Cbn/J) were purchased from Jackson laboratory.
All the experiments conducted in this study strictly followed the guidance in the Guide for the Care and Use of Laboratory Animals of the National Institutes of Health. The protocol was approved by the committee on the Ethics of Animal Welfare of The Feinstein Institute for Medical Research (protocol number 2009-048). All the animals were euthanized at the end time point of experiments by CO2 instillation.
Sample size to achieve adequate power was chosen on the basis of our pre-vious studies with similar methods. We randomized the female or male mice from different cages and different time points to exclude cage or batch varia-tion. Experiments and data analysis was performed without aforementioned genotype or treatment information.
Preparation of PBMCs and blood DCs and in vitro differentiation of MO-DCs. The protocol for study of human samples was approved by the IRB of the Feinstein Institute for Medical Research (FIMR) (approval number 09-081A). Healthy carriers of the PRDM1 rs548234 risk allele and control carriers of the non-risk allele were identified from the Genotype and Phenotype (GAP) registry at the FIMR, and informed consent was obtained from all participants. Both cohorts consisted of hormonally active females under 55 years of age and were of various races and ethnicities. Participants consented to participation in the study before their participation. Total PBMCs were collected by Ficoll-Paque gradient centrifugation. In brief, whole blood or leukopack was diluted with HBSS (Life Technologies) and layered onto Ficoll (GE Healthcare Life Sciences). Cells were centrifuged at 750g for 20 min without a break at 20 °C. PBMCs were collected from the intermediate layer and were washed three times with HBSS.
To generate MO-DCs, CD14+ monocytes were purified by EasySep kit (Stem Cell Technologies) according to the manufacturer’s protocol. The purity of CD14+ cells was determined by flow cytometry with an LRSII (BD Biosciences). After purification, CD14+ monocytes were cultured with RPMI-1640 medium supplemented with 10% heat-inactivated FBS, 1% penicillin-streptomycin, 1% l-glutamine, 100 ng/ml of recombinant human granulocyte-macrophage colony-stimulating factor (GM-CSF) (Peprotech) and 100 ng/ml of recom-binant human IL-4 (Peprotech) for 7 d.
CTSS-inhibitor treatment. The protocol was adapted from a published study29 with modifications. In brief, 3-week-old female CKO mice were ran-domly assignedto receive either a medicated diet formulated by mixing of the CTSS inhibitor RO5461111 (provided by F. Hoffman-La Roche), 262.5 mg/kg chow) or standard diet (control) (n = 20 per group). When the mice reached 7–8 weeks of age (duration of inhibitor treatment was a minimum of 4 weeks), mice were killed and spleens were collected for analysis of the TFH cell TCR repertoire (n = 5 mice per group). Additional mice were killed at 6 months or 10 months of age to investigate the lupus-like phenotype (n = 10 mice per group) or lupus nephritis phenotype (n = 5 mice per group), respectively.
To confirm the CTSS inhibitor activity in vivo, accumulation of the p10 invariant chain was measured in total splenocytes by immunoblot analysis. Spleens were collected from control mice and RO5461111-treated mice and were lysed in RIPA buffer (Thermo Fisher Scientific) containing protease inhibitor (Roche). Total protein was transferred to a polyvinylidene fluoride (PVDF) membrane and the membrane was incubated with polyclonal antibody to CD74 (AF7478, R&D Systems). The membrane was developed with ECL (Thermo Fisher Scientific).
Antibodies and reagents. The following Taqman primers were purchased from Applied Biosystems: Mm00515580_m1 (Ctsc), Mm00515586_m1 (Ctsd), Mm00456010_m1 (Ctse), Mm00456011_m1 (Ctsg), Mm00484039_m1 (Ctsk), Mm00617413_m1 (Ctso), Mm00515599_m1 (Ctsw), Mm01255859_m1 (CtsS), Mm00515597_m1 (Ctsl), Mm00613524_m1 (March1), Mm00439211_m1 (H2-Aa), Mm00482914_m1 (Ciita), Mm00783707_s1 (H2-dmb2), Mm00511327_m1 (Zbtb46), Mm00658576_m1 (CD74), Mm00468476_m1 (H2-oa),
Mm01325350_m1 (Lgmn), Mm00434455_m1 (Itgam), Mm00438347_m1 (Cst3), Mm00499585_m1 (CD209b), Mm00516431_m1 (Irf4), Mm00477633_m1 (Bcl6), Mm00581355_s1 (Maf), Mm00479410_m1 (Batf), Mm00839502_m1 (Polr2a), and Mm03024075_m1 (Hprt). Light cycler 2× master mix was purchased from Roche. OVA protein and OVA peptide (amino acids 323–339) were purchased from Invivogen, and fluorescence labeled OVA protein was purchased from Molecular Probes.
For the ChIP assay, goat polyclonal antibody to Blimp-1 (sc-13206x, Santa Cruz) and goat control antibody (AB-108-C, R&D System) were purchased from Santa Cruz. For immunoblot analysis, anti-Blimp-1 (sc-13026x, Santa Cruz), anti-CTSS (ab18822, Abcam), anti-CD74 (AF7478, R&D Systems) and anti-actin (ab6276, Abcam) were used. Neutralizing antibody to IL-6 (MP5-20F3) and control antibody (eBRG1) were purchased from eBioscience. To detect intracellular cytokines, anti-IL-2 (JES6-5H4, BioLegend) and IL-21R-Fc (991-R2, R&D Systems) were purchased. For flow cytometry, antibodies were purchased from BioLegend (anti-TCRβ (H57-597), anti-CXCR5 (J252D4), anti-ICOS-1 (C398.4A), anti-CD8 (53-6.7), anti-CD11b (M1/70), anti-CD44 (IM7) and anti-CD62L (MEL-14)), eBioscience (anti-Bcl-6 (BCL-DWN), anti-CD4 (GK1.5), anti-PD-1 (J43), anti-B220 (RA3-6B2), anti-AA4.1 (AA4.1), anti-CD21 (7G6), anti-CD23 (B3B4), anti-CD11c (N418) and anti-MHC II (M5/114.15.2)) or BD Bioscience (anti-GL7 (GL7) and anti-CD138 (281-2)).
The CTSS inhibitor and CTSB inhibitor, used for in vitro inhibition assays, were purchased from Calbiochem.
Purification of TFH cells for TCR Vβ sequencing. Age- and sex-matched control and CKO mice or female CKO Il6+/− mice were kileed at 6–8 weeks of age, and spleens were collected for TFH cell purification. CD4+ TFH cells (defined as TCRβ+CD4+CXCR5+PD-1+ICOS-1+) were sorted on a FACSAria (BD Biosciences). Sorted TFH cells were snap-frozen in liquid nitrogen and kept at −80 °C until sequencing.
Amplification and analysis of the TFH cell TCR repertoire diversity. For eachflow-cytometry-sorted TFH cell population, the cells were treated with 1 ml of TRI reagent (Life Technologies) and total RNA was isolated according to the manufacturer’s protocol of the RNeasy Micro Kit (Qiagen). First-strand cDNA was generated from total RNA using a SuperScript RT II kit (Invitrogen) and oligo(dT) primer. The resulting cDNA was used as template for FastStart High Fidelity PCR amplification (Roche) using mouse-specific barcoded con-stant-region primer (5′-GCACTGATGTTCTGTGTGACAG-3′) and 23 Vβ-specific primers43. The PCR products were gel-purified to isolate the amplified TCR Vβ DNA, and total quantities were determined with a 2100 Bioanalyzer (Agilent). 200 ng of DNA per mouse was processed for Illumina MiSeq DNA sequencing according to the manufacturer’s protocol and sequenced, yielding 2 × 10⁵ to 5 × 10⁵ raw sequences per mouse.
All sequencing data were first processed using the sequence quality and signal filters of the Illumina MiSeq pipeline and then swere ubjected to bioin-formatics analysis that relied on homologies to conserved framework regions using the MiXCR software package. Vβ CDR3 sequences were then clustered using the CD-HIT software package with a 90% amino acid sequence similar-ity cut-off. Repertoire diversity for each mouse was determined by calculating the true Shannon diversity of three or more subsamples of 1 × 10⁵ sequences, and the results were averaged for each mouse and the diversity indices were normalized to the wild-type mice.
In vitro OT-II T cell activation with DCs. CD11chiMHCIIhi cDCs were sorted from spleens of age-matched female control or CKO mice (6–8 weeks of age) by FACSAria. cDCs were resuspended at 1 × 10⁶ cells per ml with recombinant mouse GM-CSF (20 ng/ml) and 100 µl (1 × 10⁵ cDCs) was plated in a 96-well flat-bottomed plate (Thermo Fisher Scientific). CD4+ T cells were sorted from lymph nodes of female OT-II mice and were mixed with cDCs at ratio of 1:10 (DC/T cell). For OVA-protein-derived antigen presentation, 10 µg/ml of OVA protein (InvivoGen) was added to cDCs, which were incubated overnight before T cell co-culture. OVA peptide (amino acids 323–339) (InvivoGen) (0.1–10 ng/ml) or hen egg lysozyme (10 µg/ml) (Sigma-Aldrich) was added to cDCs. CTSS inhibitor (1 nM) or CTSB inhibitor (10 nM) was added with OVA-protein incubation in certain experiments. To measure T cell proliferation, OT-II CD4+ T cells were labeled with 10 µM CFSE (Invitrogen).

nature immunology doi:10.1038/ni.3793
Transwell experiments were performed in 0.4-µm plates (Corning). cDCs purified from wild-type or CKO mice were plated on upper wells and CD4+ OT-II T cells were cultured with OVA-presenting wild-type DCs on the bottom wells. Purified DCs from wild-type or CKO mice were cultured with OVA protein for 6 h and were fixed with 0.001% glutaraldehyde for 30 s. Fixation was terminated by 0.2 M glycine treatment, followed by washing three times with PBS.
Measurement of CTSS activity. In vitro CTSS enzymatic activity was meas-ured by A fluorometric analysis kit (Abcam). DCs were purified by cell sorter, and AN equal number of DCs (1 × 10⁶) from wild-type or CKO mice were lysed in cell lysis buffer. An equal volume of reaction buffer was added into the cell lysis, and amino-4-trifluoromethyl coumarin (AFC)-labeled CTSS substrate peptide (Ac-VVR-AFC) (200 µM) was added, followed by incu-bated for 2 h at 37 °C. For a negative control, CTSS inhibitor was added to the substrate mixture, or a reaction mixture that does not contain cell lysate was prepared. After incubation, samples were read in a fluorometer with a 400-nm excitation and 505-nm emission. Change in CTSS activity was determined by comparison of the relative fluorescence units (RFU) to the level in the nega-tive control sample.
ChIP assay. 5 µg of polyclonal antibody to Blimp-1 (sc-13206, Santa Cruz Biotech) or naive goat IgG (AB-108-C, R&D System) were conjugated with 50 µl of protein G magnetic beads (Invitrogen) by overnight incuba-tion. CD11chiMHCIIhi cDCs were purified from the spleen of wild-type or CKO mice. Purified DCs (5 × 10⁶ to 10 × 106 cells per experiment) were cross-linked in 1% formaldehyde (final concentration) for 10 min at 20 °C. To quench cross-linking, 1.375 M glycine (100 µl/ml) was added, and cells were washed three times with ice-cold PBS. Cells were lysed in cell lysis buffer and subjected to sonication. Antibody-conjugated magnetic beads were incubated with sonicated DNA at 4 °C with rotation. The next day, unbound DNA was washed away and the antibody-bound complex was eluted in elution buffer. The protein and DNA complex was de-crosslinked at 65 °C overnight. DNA was further purified by RNase treatment and DNA cleanup using a PCR cleanup kit (QIAGEN). Purified DNA was used for PCR.
Kidney histology. Kidneys collected from (6-month-old) mice at the end of experiments were cut into two pieces longitudinally. One half was frozen with tissue freezing in Tissue-Tek O.C.T. compound medium (Fisher) and the other half was immediately fixed with 4% formaldehyde (Sigma-Aldrich) and kept in 70% alcohol at 4 °C. Frozen or fixed sections were sliced to 7 mm thickness and were stored until staining. To detect immunoglobulin deposition, frozen kidney sections were fixed with acetone (−20 °C for 5 min) and were blocked with blocking solution (2% BSA, 0.5% TritonX-100, 2% normal goat serum (Invitrogen) in PBS) for 1 h at 20 °C. Alexa Fluor 488-conjugated anti-mouse IgG (1010-30, SouthernBiotech) (1:200 in blocking solution) was incubated with tissue for 2 h at 20 °C. Tissues were washed with PBS three times and analyzed by microscope.
ELISA of antibody to double-stranded DNA and albumin. To measure the titers of antibodies t double-stranded DNA, CKO mice or CKO mice fed RO5461111-treaed chow were bled at 2 months, 4 months and 6 months of age. Mouse serum was prepared from blood and was frozen at −20 °C until assay. 96-well plates (Costar) were coated with 100 µg/ml of sonicated and filtered calf thymus DNA (Sigma-Aldrich). The plate was blocked with 3% FCS for 1 h at 20 °C, and diluted samples from experimental mice or positive control mice (6-month-old NZB/W F1 mice) were incubated for 2 h. The plate was washed and alkaline-phosphatase-conjugated anti-mouse IgG (1031-04, SourthernBiotech) was applied. The reaction was developed with p-nitrophenyl phosphate (Sigma-Aldrich). Absorbance was monitored at 405 nm.
Urine samples were collected from 6-month-old mice maintained in meta-bolic cages. Albumin concentrations in urine samples were measured by mouse albumin ELISA quantitation set (Bethyl Laboratories) following the manu-facturer’s protocol.
Luciferase assay. BM-DCs (2 × 10⁶ cells) were transfected with a wild-type or mutated Ctss promoter construct by Nucleofector kit (Lonza). Luciferase plasmid and Tk-Renilla luciferase plasmid was added to the cells at a 10:1 ratio. Relative light units were measured 6–12 h after transfection using Dual-Luciferase reporter assay system (Promega).
Transfection of siRNA and Blimp-1 expression vector. siRNA (SR420429) targeting Prdm1 was purchased from Origene, and 200 nM of each siRNA or control scrambled siRNA was used for each transfection. Prdm1 plasmid and control plasmid were purchased from Genecopoeia. siRNA or plasmid was mixed with DCs in Nucleofector solution and transfected by Amaxa electropo-ration (program Y-01). Transfected DCs were immediately transferred to culture medium (supplemented with GM-CSF) and were further cultured for 2 d.
Bio-Plex. Multiple cytokines were measured by Bio-Plex pro mouse cytokine standard 23-plex, group I and group III (Bio-Rad) according to the manufac-turer’s protocol. The assay was measured by the Bio-Plex suspension array system and the data were analyzed by Bio-Plex manager software.
Statistics. Statistical significance was calculated and determined by a non-parametric, Mann-Whitney test, and P values less than 0.05 were considered significant. No exclusion of sample was done.
Data availability. All TCR Vβ sequences of TFH cells sequences raw files that sup-port the findings of this study have been deposited at BioSample database (NCBI) under accession codes SAMN06927868, SAMN06927869, SAMN06927870, SAMN06927871, SAMN06927872, SAMN06927873, SAMN06927874, SAMN06927875, SAMN06927876 and SAMN06927877. Other data are avail-able from the corresponding author upon request. A Life Sciences Reporting Summary for this paper is available.
43. Ndifon, W. et al. Chromatin conformation governs T-cell receptor Jβ gene segment usage. Proc. Natl. Acad. Sci. USA 109, 15865–15870 (2012).

1
nature research | life sciences reporting summ
aryJune 2017
Corresponding Author: Betty Diamond
Date: June 14 2017
Life Sciences Reporting SummaryNature Research wishes to improve the reproducibility of the work we publish. This form is published with all life science papers and is intended to promote consistency and transparency in reporting. All life sciences submissions use this form; while some list items might not apply to an individual manuscript, all fields must be completed for clarity.
For further information on the points included in this form, see Reporting Life Sciences Research. For further information on Nature Research policies, including our data availability policy, see Authors & Referees and the Editorial Policy Checklist.
Experimental design1. Sample size
Describe how sample size was determined. Sample size to achieve adequate power was chosen based on our previous studies with similar methods. Described in material and method section (mice, page 17).
2. Data exclusions
Describe any data exclusions. No exclusion of sample was done.
3. Replication
Describe whether the experimental findings were reliably reproduced. All the experiment was repeated minimum twice and all attempts at replication were successful.
4. Randomization
Describe how samples/organisms/participants were allocated into experimental groups.
We randomized the mice from different cages and different time points to exclude cage or batch variation.
5. Blinding
Describe whether the investigators were blinded to group allocation during data collection and/or analysis.
Experiments and data analysis was performed without aforementioned genotype or treatment information.
Note: all studies involving animals and/or human research participants must disclose whether blinding and randomization were used.
6. Statistical parameters For all figures and tables that use statistical methods, confirm that the following items are present in relevant figure legends (or the Methods section if additional space is needed).
n/a Confirmed
The exact sample size (n) for each experimental group/condition, given as a discrete number and unit of measurement (animals, litters, cultures, etc.)
A description of how samples were collected, noting whether measurements were taken from distinct samples or whether the same sample was measured repeatedly.
A statement indicating how many times each experiment was replicated
The statistical test(s) used and whether they are one- or two-sided (note: only common tests should be described solely by name; more complex techniques should be described in the Methods section)
A description of any assumptions or corrections, such as an adjustment for multiple comparisons
The test results (e.g. p values) given as exact values whenever possible and with confidence intervals noted
A summary of the descriptive statistics, including central tendency (e.g. median, mean) and variation (e.g. standard deviation, interquartile range)
Clearly defined error bars
See the web collection on statistics for biologists for further resources and guidance.
2
nature research | life sciences reporting summ
aryJune 2017
SoftwarePolicy information about availability of computer code
7. Software
Describe the software used to analyze the data in this study. GraphPad Prism 5 was used for statistical analysis. FlowJo v.10.0.8 was used for flow cytometry analysis. MiXCR and CD-HIT software packages were used for sequencing. Bio-Plex manager software was used for cytokine analysis.
For all studies, we encourage code deposition in a community repository (e.g. GitHub). Authors must make computer code available to editors and reviewers upon request. The Nature Methods guidance for providing algorithms and software for publication may be useful for any submission.
Materials and reagentsPolicy information about availability of materials
8. Materials availability
Indicate whether there are restrictions on availability of unique materials or if these materials are only available for distribution by a for-profit company.
NGS data was deposited at BioProject under the accession numbers SAMN06927868-77. All other materials are available commercially as described. Cathepsin s inhibitor, RO5461111. RO5461111 is only available from Hoffman La-Roche.
9. Antibodies
Describe the antibodies used and how they were validated for use in the system under study (i.e. assay and species).
We used antibodies which were validated from published database (multiple publications from independent groups). anti-STAT3: 124H6, Cell Signaling anti-BLIMP-1:sc-13206, Santa Cruz anti-p10: cat#HAF016, R&D Systems anti-Actin: mAbcam8226, Abcam anti-mouse IgG AF488: Cat#1010-30, Sourthen Biotech anti-CXCR5: J252D4, Biolegend anti-PD1:EF12.2H7, Biolegend anti-CD4:GK1.5, BDPharmingen anti-TCRb: H57-597, BDPharmingen anti-CD11c:N418, eBioscience anti-CD8a:53-6.7, Biolegend anti-MHC II:M5/114.15.2, eBioscience anti-SiglecH:eBio440c, eBioscience anti-CD3: 17A2, Biolegend anti-CD44:IM7, Biolegend anti-CD62L: MEL-14, Biolegend anti-B220: RA3-6B2, eBioscience anti-GL7: Cat# 553666, BDPharmingen anti-CD138: 281-2, BDPharmingen anti-ICOS1: C398.4A, Biolegend anti-BCL6: BCL-DWN, eBioscience anti-IL-2: JES6-5H4, Biolegend IL-21R-Fc: Cat# 991-R2, R&D System anti-IL-6: MP5-20F3, eBioscience
10. Eukaryotic cell linesa. State the source of each eukaryotic cell line used. HEK293 purchased from ATCC
b. Describe the method of cell line authentication used. Authenticated by ATCC.
c. Report whether the cell lines were tested for mycoplasma contamination.
not tested since we used newly purchased cell line.
d. If any of the cell lines used in the paper are listed in the database of commonly misidentified cell lines maintained by ICLAC, provide a scientific rationale for their use.
No commonly misidentified cell line was used.
3
nature research | life sciences reporting summ
aryJune 2017
Animals and human research participantsPolicy information about studies involving animals; when reporting animal research, follow the ARRIVE guidelines
11. Description of research animalsProvide details on animals and/or animal-derived materials used in the study.
Blimp-1 flox/flox; Cre-Tg and IL-6 +/-; Blimp-1 flox/flox; Cre-Tg mice are on C57BL/6 genetic background, both female and male, from 6 weeks old through 8 month old. (page 17)
Policy information about studies involving human research participants
12. Description of human research participantsDescribe the covariate-relevant population characteristics of the human research participants.
IRB approval number is provided in Material and Method (page 17). Both female and male (hormonally active, age 55 and younger) individuals were included. Participants were genotyped and registered in the Genotype and Phenotype Registry at The Feinstein Institute for Medical Research. Any genotyped individuals with chronic inflammatory disorders, cancers or under hormonal therapy were excluded.
nature research | flow cytom
etry reporting summ
aryJune 2017
1
Corresponding Author: Betty Diamond
Date: June 14 2017
Flow Cytometry Reporting Summary Form fields will expand as needed. Please do not leave fields blank.
Data presentationFor all flow cytometry data, confirm that:
1. The axis labels state the marker and fluorochrome used (e.g. CD4-FITC).
2. The axis scales are clearly visible. Include numbers along axes only for bottom left plot of group (a 'group' is an analysis of identical markers).
3. All plots are contour plots with outliers or pseudocolor plots.
4. A numerical value for number of cells or percentage (with statistics) is provided.
Methodological details
5. Describe the sample preparation. For blood samples (Fig. 1C), mouse blood was obtained and PBMCs were prepared by Ficoll gradient centrifugation. For samples from spleen (Fig. 5A, Fig. 6B, Fig. 7A-B, and Supplementary Fig. 4), splenocytes were prepared by through nylon mash and RBCs were removed (RBC lysing buffer). In vitro stimulated cells (Fig. 2D and Fig. 4A) were collected after stimulation. All the staining was performed in immediately after collection in ice-cold staining buffer. Dead cells were excluded by live-dead staining.
6. Identify the instrument used for data collection. BD LSRII new (7-3-2-2)
7. Describe the software used to collect and analyze the flow cytometry data.
FACSDiva software was used for data collection and FlowJo software v.10.0.8 was used for analyses.
8. Describe the abundance of the relevant cell populations within post-sort fractions.
FACSAria instrument was used for cell sorting. Purity of post-sorted samples was 90-95% for all samples. Abundance of population is variable depending on samples; 50,000 for Fig 1C, 1-2 millions for Fig.2D, 0.1-0.2 millions of cells for Fig. 5B and Fig. 7D.
9. Describe the gating strategy used. All the samples was analyzed from live cell population except the case of intracellular staining (Fig. 4c). Positive and negative population was defined by isotype control staining. Specific gating strategies which were used: Fig.1C (from the live cells, lineage markers negative, and CD11chiMHCIIhi cells, Fig. 2B,D (from live cells, GFP-positive population was defined by null transfected GFP negative cells), Fig 4A (T alone without stimulation was defined as a positive population and CFSE-unlabelled T cells was used as a negative population), Fig. 4C (unstimulated T cells stained with IL-2 and IL-21 was one negative control and stimulated T cells stained with isotype controls was another negative control), Fig. 4D (DC cultured with unlabeled OVA was a negative control), Fig 5A (for BCL-6 intracellular staining, isotype control staining was a negative control, otherwise all other gating strategy is described in the figure), Fig. 6B (for B and T cell, lymphocyte population was

nature research | flow cytom
etry reporting summ
aryJune 2017
2
defined from FSC/SSC gating, otherwise specific gating strategies are described in the figure), Fig. 7A (cells were analyzed from lymphocyte gating defined by FSC/SSC gating), Fig. 7B-C (broad lymphocyte gating was applied to include plasmablast).
Tick this box to confirm that a figure exemplifying the gating strategy is provided in the Supplementary Information.