prb reports for the european commission - eurocontrol · prb advice to the commission in the...
TRANSCRIPT

PRB advice to the Commission in the setting of Union-wide performance targets for RP2
PRB advice to the Commission in the setting of Union-wide performance targets for RP2
Final Report
Edition date: 27/09/2013

COPYRIGHT
NOTICE AND
DISCLAIMER
© European Union, 2013
This report has been prepared for the European Commission by the Performance Review
Body of the Single European Sky, in its capacity as an advisory body to the European
Commission.
Reproduction is authorised provided the source is acknowledged. However, neither the
European Commission, nor any person acting on its behalf, may be held responsible for the
use which may be made of the information contained in this publication, or for any errors
which may appear, despite careful preparation and checking.

PRB advice to the Commission in the setting of Union-wide performance targets for RP2
Table of Contents 1 EXECUTIVE SUMMARY .................................................................................................................... 3
1.1 INTRODUCTION ............................................................................................................................................ 3 1.2 PROPOSED TARGETS ..................................................................................................................................... 3 1.3 TOTAL ECONOMIC COSTS ............................................................................................................................ 6
2 INTRODUCTION AND CONTEXT .................................................................................................... 8
2.1 THIS DOCUMENT .......................................................................................................................................... 8 2.2 THE PRB’S ROLE - WHAT IT DOES AND DOES NOT DO ................................................................................... 9 2.3 UNION-WIDE KEY PERFORMANCE INDICATORS FOR RP2 ............................................................................. 9 2.4 GEOGRAPHICAL SCOPE ................................................................................................................................. 9 2.5 TRAFFIC OUTLOOK ..................................................................................................................................... 10 2.6 THE PRB’S APPROACH FOR THE TARGET PROPOSALS ................................................................................. 10 2.7 THE STAKEHOLDERS CONSULTATION PROCESS .......................................................................................... 11
3 LEVEL OF AMBITION AND REALISM ......................................................................................... 13
3.1 GENERAL APPROACH .................................................................................................................................. 13 3.2 IMPROVEMENTS MADE IN RP1 ................................................................................................................... 14 3.3 OPPORTUNITIES FOR PERFORMANCE IMPROVEMENT IN RP2 AND RISKS ..................................................... 15 3.4 INTERDEPENDENCIES ................................................................................................................................. 19 3.5 TOTAL ECONOMIC COST (TEC) ................................................................................................................. 20
4 STAKEHOLDER CONSULTATION ................................................................................................ 23
4.1 SCOPE OF CONSULTATION .......................................................................................................................... 23 4.2 COMMENTS RECEIVED ................................................................................................................................ 23 4.3 STATISTICAL ANALYSIS .............................................................................................................................. 24 4.4 CLUSTERING OF THE COMMENTS ................................................................................................................ 24
5 SAFETY TARGET .............................................................................................................................. 25
5.1 PRB INITIAL PROPOSAL ............................................................................................................................. 25 5.2 STAKEHOLDERS’ COMMENTS ..................................................................................................................... 25 5.3 NEW ELEMENTS CONSIDERED BY THE PRB ................................................................................................ 25 5.4 PRB OPINION ............................................................................................................................................. 26 5.5 PRB RECOMMENDATIONS FOR RP2 UNION WIDE SAFETY TARGETS ......................................................... 29
6 RP2 UNION-WIDE ENVIRONMENT TARGET ............................................................................. 31
6.1 PRB INITIAL PROPOSAL ............................................................................................................................. 31 6.2 STAKEHOLDERS’ COMMENTS ..................................................................................................................... 31 6.3 NEW ELEMENTS CONSIDERED BY THE PRB ................................................................................................ 31 6.4 PRB OPINION ............................................................................................................................................. 31 6.5 PRB RECOMMENDATIONS FOR RP2 UNION WIDE ENVIRONMENT TARGETS .............................................. 32
7 RP2 UNION-WIDE CAPACITY TARGET ...................................................................................... 33
7.1 PRB INITIAL PROPOSAL ............................................................................................................................. 33 7.2 STAKEHOLDERS’ COMMENTS ..................................................................................................................... 33 7.3 NEW ELEMENTS CONSIDERED BY THE PRB ................................................................................................ 33 7.4 PRB OPINION ............................................................................................................................................. 33 7.5 PRB RECOMMENDATIONS FOR RP2 UNION WIDE CAPACITY TARGETS ..................................................... 35
8 RP2 UNION-WIDE COST EFFICIENCY TARGET ....................................................................... 36
8.1 PRB INITIAL PROPOSAL ............................................................................................................................. 36 8.2 STAKEHOLDERS’ COMMENTS ..................................................................................................................... 37 8.3 PRB OPINION ............................................................................................................................................. 39 8.4 NEW ELEMENTS CONSIDERED BY THE PRB ................................................................................................ 41 8.5 PRB RECOMMENDATIONS FOR RP2 UNION WIDE COST-EFFICIENCY TARGETS ......................................... 45
9 ADDITIONAL ELEMENTS ............................................................................................................... 53
9.1 ANSP GROUPING ....................................................................................................................................... 53

9.2 ALERT THRESHOLD .................................................................................................................................... 54 9.3 NEXT STEPS ................................................................................................................................................ 54
Table of Figures FIGURE 1-1: PROJECTED TEC (BASELINE TRAFFIC SCENARIO) ................................................................................ 7 FIGURE 1-2: IMPACT OF PROPOSED TARGETS ON TEC (BASELINE TRAFFIC SCENARIO) ........................................... 7 FIGURE 1-3: PROJECTED TEC PER FLIGHT ............................................................................................................... 7 FIGURE 2-1: GEOGRAPHICAL SCOPE FOR RP2 UNION-WIDE TARGETS ..................................................................... 9 FIGURE 3-1: HORIZONTAL EN-ROUTE FLIGHT EFFICIENCY (2009-2014) ................................................................ 14 FIGURE 3-2: EXPECTED IMPLEMENTATION OF FREE ROUTE AIRSPACE AT END OF RP1 .......................................... 15 FIGURE 3-3: ESTIMATED TEC – SES AREA, EN-ROUTE ONLY ............................................................................... 21 FIGURE 3-4: PROJECTED TEC (BASELINE TRAFFIC SCENARIO) .............................................................................. 21 FIGURE 3-5: IMPACT OF PROPOSED TARGETS ON TEC (BASELINE TRAFFIC SCENARIO) ......................................... 22 FIGURE 3-6: PROJECTED TEC PER FLIGHT ............................................................................................................. 22 FIGURE 3-7: BREAKDOWN OF TEC PER FLIGHT ..................................................................................................... 22 FIGURE 4-1: DISTRIBUTION OF RESPONDENTS ....................................................................................................... 23 FIGURE 5-1: 2012 EOSM SCORE FOR ANSPS ........................................................................................................ 27 FIGURE 8-1: ACTUAL AND PLANNED TRAFFIC COMPARED TO INFORMATION PROVIDED IN NPPS FOR RP1 ............ 42 FIGURE 8-2: 2012 ACTUAL COSTS COMPARED TO DETERMINED COSTS IN ADOPTED NPPS ..................................... 43 FIGURE 8-3: ACTUAL 2012 EN-ROUTE COSTS, RP1 DETERMINED COSTS AND STATES PLANS FOR 2015-2019 ....... 44 FIGURE 8-4: STARTING POINT FOR UNION-WIDE COST-EFFICIENCY TARGETS OVER RP2 ....................................... 46 FIGURE 8-5: STATES PROJECTIONS AND PRB PROPOSAL FOR EN-ROUTE COSTS REDUCTIONS OVER RP2 ............... 48 FIGURE 8-6: PROPOSED DUCS OVER RP2 COMPARED TO ACTUAL 2009 AND 2012 UNIT COSTS (€2009) ............... 49 FIGURE 9-1: PROCESS AND TIMING FOR PRODUCTION OF FAB PPS ....................................................................... 54
Table of Tables TABLE 1: PRB PROPOSED UNION-WIDE SAFETY TARGETS FOR RP2 ........................................................................ 4 TABLE 2: PRB PROPOSED UNION-WIDE ENVIRONMENT TARGETS FOR RP2 ............................................................. 5 TABLE 3: PRB PROPOSED UNION-WIDE CAPACITY TARGETS FOR RP2 .................................................................... 5 TABLE 4: PRB PROPOSED UNION-WIDE COST-EFFICIENCY TARGETS FOR RP2 ......................................................... 6 TABLE 5: TRAFFIC ASSUMPTIONS FOR UNION-WIDE ALERT THRESHOLDS (STATFOR FORECAST SEPT. 2013) ....... 6 TABLE 6: UNION-WIDE KPIS FOR RP2 ..................................................................................................................... 9 TABLE 7: EN ROUTE SERVICE UNIT FORECAST (STATFOR SEPTEMBER 2013) ..................................................... 10 TABLE 8: PROCESS TOWARDS ADOPTION OF UNION-WIDE TARGETS FOR RP2 ....................................................... 12 TABLE 9: INTERIM DEPLOYMENT PROGRAMME AND PILOT COMMON PROJECT .................................................... 17 TABLE 10: SUMMARY OF RESPONDENTS BY STAKEHOLDER TYPE .......................................................................... 24 TABLE 11: PRB CONSULTATION PROPOSAL - SAFETY ........................................................................................... 25 TABLE 12: SAFETY PROPOSED UNION-WIDE TARGETS FOR RP2 ............................................................................ 30 TABLE 13: PRB CONSULTATION PROPOSAL – ENVIRONMENT ............................................................................... 31 TABLE 14: ENVIRONMENT PROPOSED UNION-WIDE TARGETS FOR RP2 ................................................................. 32 TABLE 15: PRB CONSULTATION PROPOSAL – CAPACITY ....................................................................................... 33 TABLE 16: CAPACITY PROPOSED UNION-WIDE TARGETS FOR RP2 ........................................................................ 35 TABLE 17: PRB CONSULTATION PROPOSAL – COST EFFICIENCY ........................................................................... 36 TABLE 18: PRB PROPOSAL FOR EN-ROUTE COSTS REDUCTIONS OVER RP2 ........................................................... 47 TABLE 19: PROPOSED TREND IN DUCS OVER RP2 (€2009) ................................................................................... 49 TABLE 20: PROPOSED TREND IN EN-ROUTE DUCS OVER RP2, INCLUDING CROATIA AND ADJUSTMENTS (€2012) 50 TABLE 21: PROPOSED TREND IN EN-ROUTE DUCS OVER RP2 (€2009) .................................................................. 51 TABLE 22: PLANNED UNION-WIDE TERMINAL ANS COSTS OVER RP2 (STATES JUNE 2013 SUBMISSIONS) ........... 52 TABLE 23: ANSP COMPARATOR GROUPS .............................................................................................................. 53

PRB advice to the Commission in the setting of Union-wide performance targets for RP2
1 Executive Summary
1.1 Introduction
1.1.1 In accordance with the Single European Sky Performance Regulation (EU 390/2013), Union-
wide targets for the second Reference Period (RP2, 2015-2019) have to be set by end of 2013.
This document presented the Performance Review Body’s (PRB) proposals to this effect.
1.1.2 In making its proposals, the PRB applied the principles described in §2.6 below and carefully
considered and analysed:
The wider background and macro-economic conditions;
Historic trends in Air Navigation Services (ANS) performance within the European
Union (EU);
The latest air traffic forecasts;
Experience in the first year of Reference Period 1 (RP1);
Opportunities for further improvement in ANS performance and associated risks; and
Evidence of best practice both within the EU and elsewhere.
1.1.3 The PRB also engaged States, National Supervisory Authorities (NSAs) and stakeholders in
an extensive consultation process, involving document publication, questionnaires, public
workshops and forums as well as bilateral meetings. The interdependencies between Key
Performance Areas (KPAs) have also been considered by the PRB.
1.1.4 As a result of this process, the PRB first notes that initial results achieved in RP1 are in line
with targets adopted. This is encouraging and demonstrates that the Performance Scheme is
playing its intended role of supporting the delivery of the SES.
1.1.5 The PRB concludes that there remains scope for significant further performance
improvements during RP2 and beyond. The evolution of Air Navigation Services’ (ANS)
performance has to be assessed in a long-term context, and this report also considers the
prospects for later Reference Periods.
1.1.6 Opportunities for such improvements during RP2 and beyond include:
Efficiency gains in individual Air Navigation Service Providers (ANSPs), through e.g.
rigorous cost control;
Airspace improvements, through e.g. Europe-wide application of free routes;
More flexible management of capacity to match demand;
New Technology;
Rationalisation of and greater cooperation in service provision and oversight; and
The start of ANS restructuring through Functional Airspace Blocks (FABs) or otherwise.
1.1.7 These opportunities are supported by the SES tools, such as the Network Manager, FABs, the
Pilot Common Project and further SESAR Deployment, as well as EUROCONTROL’s
proposals on centralised services. These will all contribute towards achieving ambitious
targets.
1.1.8 While performance targets define the intended outcome, it is for FABs, States and ANSPs to
define their performance plans and decide how to reach the targets using these opportunities.
The SES regulations are based on the principle of subsidiarity. It is important that this
principle is applied in full.
1.2 Proposed targets
1.2.1 Table 1 to Table 4 summarise the PRB proposed Union-wide targets for RP2.

PRB advice to the Commission in the setting of Union-wide performance targets for RP2
4
SAFETY
Union-wide KPI EoSM: Effectiveness of Safety Management on States/NSAs
Baseline Projected value (2014):
Most but not all National Supervisory Authorities (NSAs)will have
achieved at least EoSM Level C in all Management Objectives (MOs).
Union-wide consultation range
for 2015-2019 All NSAs have achieved at least EoSM Level C in all MOs.
PRB final proposal for Union-
wide targets for RP2 All NSAs have achieved at least EoSM Level C in all Management
Objectives (MOs) in 2019.
Union-wide KPI EoSM: Effectiveness of Safety Management on Service Providers
Baseline Projected value (2014):
All ANSPs will have achieved EoSM Level C in all MOs.
Union-wide consultation range
for 2015-2019 All ANSPs have achieved EoSM Level D in all MOs.
PRB final proposal for Union-
wide targets for RP2 All ANSPs have achieved EoSM Level D in all Management
Objectives (MOs) in 2019
Union-wide KPI Severity Classification: Application of the RAT Methodology by
States
Baseline Projected value (2014):
It is not expected that all other investigation entities (e.g. CAAs/NSAs)
should be applying severity classification via the RAT methodology by
2015.
Union-wide consultation range
for 2015-2019 By the end of RP2, all NSAs/States should be reporting ATM Overall
using the RAT methodology for severity classification for almost all
reported occurrences (i.e. 99%).
PRB final proposal for Union-
wide targets for RP2 By the end of RP2 all Regulators (NSAs)/States should be
reporting ATM Overall using the RAT methodology of severity
classifications for almost all reported occurrences (i.e. 99%)
(separation minima infringements, runway incursions, and ATM
specific events) and provide relevant information about the cases
where ATM Overall using RAT methodology was not reported.
Union-wide KPI Severity Classification: Application of the RAT Methodology by
Service Providers
Baseline Projected value (2014):
It is expected that by the end of RP1, all ANSPs should be applying
severity classification via the RAT methodology.
Union-wide consultation range
for 2015-2019 By the end of RP2, all ANSPs should be reporting ATM Ground using
the RAT methodology for severity classification for all reported
occurrences (i.e. 100%).
PRB final proposal for Union-
wide targets for RP2 By the end of RP2, all ANSPs should be reporting ATM Ground
using the RAT methodology for severity classification for all (i.e.
100%) reported occurrences (separation minima infringements,
runway incursions, and ATM specific events).
Table 1: PRB proposed Union-wide safety targets for RP2

PRB advice to the Commission in the setting of Union-wide performance targets for RP2
5
ENVIRONMENT
Union-wide KPI KEP: The average horizontal en route flight efficiency of the last
filed flight plan
Baseline Value 2009: RP1 baseline, i.e. 5.42% (measured as the flight
extension in terms of proportion of the to the great circle distance).
RP1 Target (2014): 4.67%, i.e. -0.75% in respect to 2009 baseline.
Union-wide consultation
range for 2015-2019 4.1% to 4.4%.
PRB final proposal for
Union-wide targets for RP2 4.1% in 2019
Union-wide KPI KEA: The average horizontal en route flight efficiency of the
actual trajectory
Baseline N/A.
Union-wide consultation
range for 2015-2019 2.5% to 2.75%.
PRB final proposal for
Union-wide targets for RP2 2.6% in 2019
Table 2: PRB proposed Union-wide environment targets for RP2
CAPACITY
Union-wide KPI Average En-route ATFM delay
Actual performance Value 2012: 0.63 minutes per flight.
RP1 Target RP1 target (2014): 0.5 minutes per flight.
Union-wide consultation
range for 2015-2019 0.3 – 0.6 minutes per flight.
PRB final proposal for
Union-wide targets for RP2 0.5 minutes per flight in 2014-2019.
Table 3: PRB proposed Union-wide capacity targets for RP2
PRB advice to the Commission in the setting of Union-wide performance targets for RP2
6
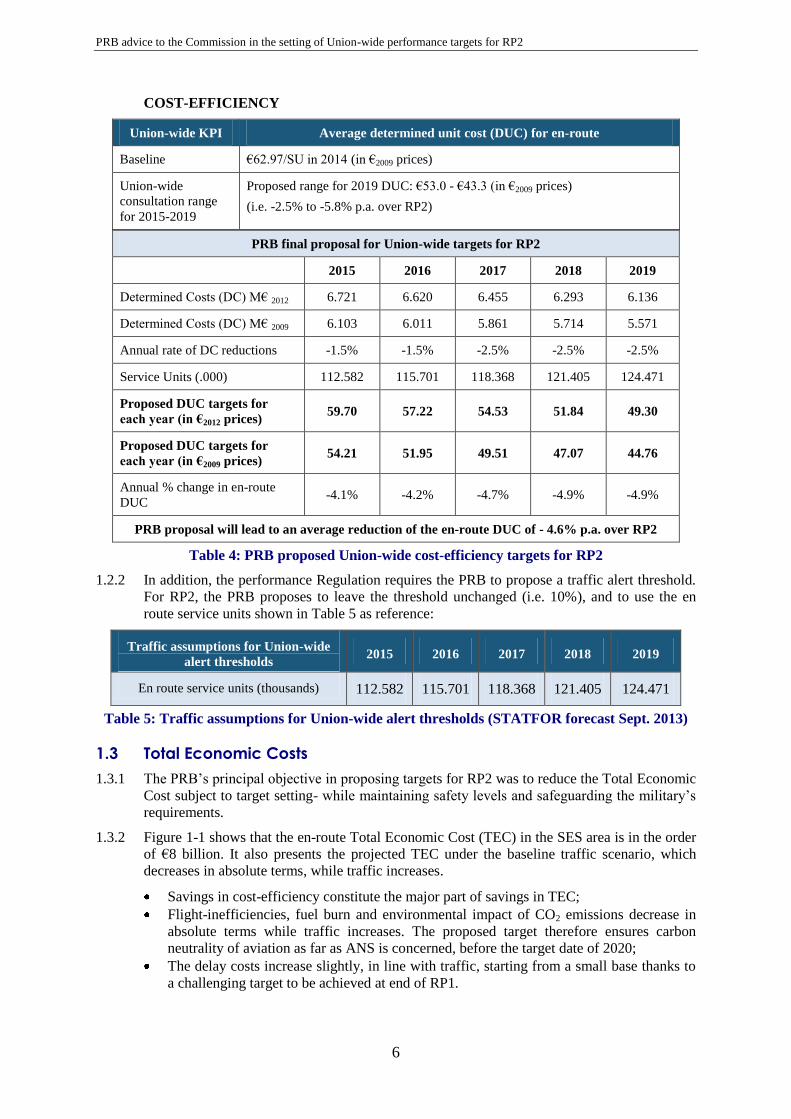
COST-EFFICIENCY
Union-wide KPI Average determined unit cost (DUC) for en-route
Baseline €62.97/SU in 2014 (in €2009 prices)
Union-wide
consultation range
for 2015-2019
Proposed range for 2019 DUC: €53.0 - €43.3 (in €2009 prices)
(i.e. -2.5% to -5.8% p.a. over RP2)
PRB final proposal for Union-wide targets for RP2
2015 2016 2017 2018 2019
Determined Costs (DC) M€ 2012 6.721 6.620 6.455 6.293 6.136
Determined Costs (DC) M€ 2009 6.103 6.011 5.861 5.714 5.571
Annual rate of DC reductions -1.5% -1.5% -2.5% -2.5% -2.5%
Service Units (.000) 112.582 115.701 118.368 121.405 124.471
Proposed DUC targets for
each year (in €2012 prices) 59.70 57.22 54.53 51.84 49.30
Proposed DUC targets for
each year (in €2009 prices) 54.21 51.95 49.51 47.07 44.76
Annual % change in en-route
DUC -4.1% -4.2% -4.7% -4.9% -4.9%
PRB proposal will lead to an average reduction of the en-route DUC of - 4.6% p.a. over RP2
Table 4: PRB proposed Union-wide cost-efficiency targets for RP2
1.2.2 In addition, the performance Regulation requires the PRB to propose a traffic alert threshold.
For RP2, the PRB proposes to leave the threshold unchanged (i.e. 10%), and to use the en
route service units shown in Table 5 as reference:
Traffic assumptions for Union-wide
alert thresholds 2015 2016 2017 2018 2019
En route service units (thousands) 112.582 115.701 118.368 121.405 124.471
Table 5: Traffic assumptions for Union-wide alert thresholds (STATFOR forecast Sept. 2013)
1.3 Total Economic Costs
1.3.1 The PRB’s principal objective in proposing targets for RP2 was to reduce the Total Economic
Cost subject to target setting- while maintaining safety levels and safeguarding the military’s
requirements.
1.3.2 Figure 1-1 shows that the en-route Total Economic Cost (TEC) in the SES area is in the order
of €8 billion. It also presents the projected TEC under the baseline traffic scenario, which
decreases in absolute terms, while traffic increases.
Savings in cost-efficiency constitute the major part of savings in TEC;
Flight-inefficiencies, fuel burn and environmental impact of CO2 emissions decrease in
absolute terms while traffic increases. The proposed target therefore ensures carbon
neutrality of aviation as far as ANS is concerned, before the target date of 2020;
The delay costs increase slightly, in line with traffic, starting from a small base thanks to
a challenging target to be achieved at end of RP1.

PRB advice to the Commission in the setting of Union-wide performance targets for RP2
7
Figure 1-1: Projected TEC (Baseline traffic scenario)
1.3.3 Figure 1-2 shows the large positive impact of proposed targets on Total Economic Cost over
the entire RP2 period, i.e. €7600M savings versus the 2012 performance baseline (some 21%
of TEC cumulated over RP2). This shows a major contribution of the performance scheme
towards achieving the objectives of the Single European Sky. These savings are sensitive to
traffic and would reduce to €5400M in the low-traffic scenario.
Figure 1-2: Impact of proposed targets on TEC (Baseline traffic scenario)
1.3.4 Figure 1-3 shows the impact of
proposed targets on total economic
cost per flight, which is of most
immediate relevance to civil
airspace users. The proposed
targets will result in strongly
decreasing TEC per flight in RP2.
There is a marked influence of
traffic growth on improvement.
Figure 1-3: Projected TEC per flight
5000
5500
6000
6500
7000
7500
8000
8500
9000
9500
20
15
20
16
20
17
20
18
20
19
Mill
ion
(€2
009)
Δ TEC
TEC (2012 performance
baseline)
TEC (Base traffic)
€7600 m
€600
€650
€700
€750
€800
€850
€900
20
11
20
12
20
13
20
14
20
15
20
16
20
17
20
18
20
19
€(2
00
9)
pe
r fl
igh
t
TEC/ft (Base Traffic) TEC/ft (Low traffic)

PRB advice to the Commission in the setting of Union-wide performance targets for RP2
8
2 Introduction and context
2.1 This document
2.1.1 By the end of 2013, the European Commission is required to adopt Union-wide (EU)
Performance targets for European Air Navigation Services (ANS) for the second reference
period (RP2 2015-2019) in accordance with the Single European Sky (SES) legislation, i.e.
the revised performance [Ref. i] and charging [Ref. ii] regulations, which were adopted by the
Commission on 9 May 2013.
2.1.2 The first reference period (RP1: 2012-2014) is currently underway. The process leading to the
adoption of Union-wide targets for RP2 is presented in Section 2.7 below.
2.1.3 This report sets out the recommended values and rationales for the Union-wide targets to be
adopted by the Commission for RP2 and includes description of target (ranges), the rationale
used to construct the targets, including a review of the assumptions made and stakeholder
comments received during consultation.
2.1.4 This report is organised in nine chapters:
Chapter 1 is the executive summary;
Chapter 2 presents the context;
Chapter 3 presents the rationale for the level of ambition and realism of the proposed
Union wide proposed targets and an impact analysis using the Total Economic Cost
concept;
Chapter 4 presents the main results and statistics from the stakeholder consultations;
Chapters 5 to 8 are dedicated to the individual performance areas. They describe:
- PRB’s initial proposals;
- a summary of the stakeholder consultation comments/responses as well as PRB’s
opinion;
- New elements and information which have been considered by the PRB in refining the
ranges presented in the consultation document [Ref. iii];
- PRB’s final proposals for the Union-wide targets.
Chapter 9 presents additional elements, some of them being mandatory such as ANSP
groups and Alert Threshold.
2.1.5 This Report includes:
Appendix A: “Union-wide targets for the second reference period of the Single European
Sky Performance Scheme” [Ref. iii], published on 17 May 2013, and its corrigendum.
Appendix B: “Union-wide target proposals – Summary of Response document”.
Appendix C: Reference values for capacity and flight efficiency targets prepared by the
Network Manager.
2.1.6 This report has been prepared by the Performance Review Body (PRB) of the SES.
EUROCONTROL, acting through its Performance Review Commission (PRC) supported by
the Performance Review Unit (PRU) which has been designated [Ref. iv] as the PRB to assist
the Commission in the implementation of the performance Scheme until mid-2015.

PRB advice to the Commission in the setting of Union-wide performance targets for RP2
9
2.2 The PRB’s role - what it does and does not do
2.2.1 The Performance Review Body’s (PRB) role is to advise the European Commission on the
setting of targets. The PRB has sought to set targets which are ambitious and challenging but
also realistic and achievable by States over a given time period.
2.2.2 The PRB does not prescribe actions. It is for States and ANSPs to determine how best to meet
the targets. Progress in achieving the targets will be carefully monitored through the PRB’s
annual monitoring report.
2.3 Union-wide Key Performance Indicators for RP2
2.3.1 The Key performance indicators to be used for Union-wide performance targets for RP2 are
defined in Annex I of the new performance Regulation [Ref. i]. They are summarised in
Table 6.
SAFETY Effectiveness of Safety Management (NEW).
Application of severity classification scheme based on the Risk Analysis
Tool (RAT) methodology (NEW).
ENVIRONMENT Horizontal flight efficiency:
o Using last filed flight plans
o Using radar data for the actual trajectory (NEW)
CAPACITY En route ATFM delay per flight.
COST-
EFFICIENCY
Determined Unit Cost for en route air navigation services.
Determined Unit Cost for terminal air navigation services (NEW, but not
before 2017, depending on a future Commission Decision .
Table 6: Union-wide KPIs for RP2
2.4 Geographical scope
2.4.1 Unless otherwise indicated, the
proposed Union-wide targets for
RP2 refer to ANS performance in
the airspace depicted in Figure 1.
2.4.2 It covers the airspace controlled by
the RP2 SES States in the ICAO
EUR and AFI regions. Therefore, it
covers the airspace controlled by
the 28 EU Member States as well
as the airspace controlled by
Norway and Switzerland (total 30
States) in the ICAO EUR region,
as well as the Canaries FIR
(Spain), Bodø FIR (Norway) and
the two oceanic transition areas
NOTA/SOTA (UK/IRL).
Figure 2-1: Geographical scope for RP2 Union-wide
targets

PRB advice to the Commission in the setting of Union-wide performance targets for RP2
10
2.4.3 The process of incorporation of Regulation 1070/2009 into EEA Agreement is on-going.
Once the process is concluded, Iceland and the Commission will examine the modalities of
cooperation between Iceland and PRB for RP2.
2.5 Traffic outlook
2.5.1 Traffic volume and distribution in time and space are key influencing factors for ANS
performance. Traffic forecasts are therefore key determinants in setting targets for ANS
performance.
2.5.2 It is clear that targets for RP2 will have to be set in a context of considerable uncertainty
about traffic levels. The performance Regulation includes an alert threshold currently set at
±10% for RP1; this alert threshold needs to be set for RP2 according to Article 10(4) of the
new performance Regulation [Ref. i]. Performance plans should be robust enough to
accommodate a range of traffic outcomes within the alert threshold.
2.5.3 In order to reflect the latest available information, Table 7 presents the final traffic data for
2012 (-1.4%), the respective traffic growth values from latest STATFOR medium term
forecast [Ref. v]. Data refer to EU States including Croatia, Norway and Switzerland..
En route traffic
forecast
(Thousands SUs)
2011A 2012A 2013P 2014P 2015P 2016P 2017P 2018P 2019P
%
2019/
2014
%
2019/
2014
CAGR
Baseline scenario 106,760 105,251 106,707 109,606 112,582 115,701 118,368 121,405 124,471 13.6%
% annual changes -1.4% 1.4% 2.7% 2.7% 2.8% 2.3% 2.6% 2.5% 2.6%
High scenario 106,760 105,251 107,084 111,697 116,136 120,603 124,680 129,191 133,351 19.4%
% annual changes -1.4% 1.7% 4.3% 4.0% 3.8% 3.4% 3.6% 3.2% 3.6%
Low scenario 106,760 105,251 106,327 107,439 108,541 110,196 111,436 112,884 114,305 6.4%
% annual changes -1.4% 1.0% 1.0% 1.0% 1.5% 1.1% 1.3% 1.3% 1.2%
A = Actual, P = Projection
Source: STATFOR Seven-Year Forecast September 2013
Table 7: En route Service Unit forecast (STATFOR September 2013)
2.5.4 Service Units (SUs) are forecast to increase by +16.6% between 2011 and 2019 in the base
case.
2.5.5 Under the base case, the average annual growth rate during 2014-2019 (+2.6%) is higher than
during 2009-2014 (+2.0%).
2.6 The PRB’s approach for the target proposals
2.6.1 In developing Union-wide targets for RP2, the PRB applied the following principles:
Primacy of Safety: ANS safety is ensured through the safety pillar of the SES II package
based on EASA rule making (compliance with regulations), and through performance
targets (performance beyond compliance). The PRB aims to contribute in continuously
improving the current level of Safety.
Independence: the PRB preserved its total independence from any internal or external
economic, corporate or political interests, including bias related to political, economic,
social, philosophical or ethical considerations. PRB advice is collegial. The principle of
independence applies equally to all members of the PRU and any person supporting the
PRU.
Robustness of evidence: the evidence presented is based on thorough and rigorous
analysis.

PRB advice to the Commission in the setting of Union-wide performance targets for RP2
11
Consultation and transparency: the PRB ran an extensive consultation programme to
ensure a maximum level of transparency and take account of all comments received in its
proposed Union-wide targets.
Consistency: the analysis is based on a consistent set of assumptions and traffic forecasts.
Ambition combined with realism: the PRB was careful in weighing the evidence and
balancing the diverging comments received, so that the targets are simultaneously
challenging, stretching boundaries, while being realistic and achievable. This delicate
balancing act involved the use of rigorous analysis and expert judgement.
Balance between KPAs: when proposing targets, due account was taken of the
interdependencies and trade-offs between different KPAs (Environment, Capacity and
Cost-efficiency) at a Union-wide level, on the understanding that Safety cannot be
compromised.
Balance over time: Performance targets should be set with a perspective longer than one
reference period, as change may generate costs in the short term and significantly
improved performance in the longer term.
Outcome-oriented targets: The PRB takes a view on outcomes, reflected in Union-wide
targets, and leaves it up to the FABs, States and Network Manager to decide how to
achieve them. Solutions-oriented targets, such as implementing common projects, are
taken into account in the target-setting phase, assessment of performance plans and also
in the monitoring phase to ensure that expenditure earmarked for investments is targeted
towards SESAR priorities, and in particular the Pilot Common Project, and then actually
applied.
2.7 The Stakeholders consultation process
2.7.1 In developing proposals for Union-wide targets, the PRB has sought stakeholders’ opinions
via a range of methods, including document publication, questionnaires and meetings, from
2012 to 2013. The main steps are described below.
First consultation on ranges for Union-wide targets for RP2
2.7.2 The process leading to the adoption of Union-wide targets for RP2 began with a PRB open
workshop on 6 February 2013, which was attended by some 230 stakeholder representatives.
In preparation for this workshop, the PRB circulated, on 25 January 2013, a document entitled
“EU wide targets for RP2: Indicative Performance Ranges for consultation” [Ref. vi].
Stakeholders were invited to submit their comments both at the workshop and afterwards in
writing. Details are available on the PRB website [Ref. vii]. The workshop was broadcast by
web streaming [Ref. viii].
Second consultation on Union-wide targets for RP2 (17 May-3 July 2013)
2.7.3 The PRB refined its target ranges for a second consultation document which reflected the
comments received by stakeholders to date (at the February stakeholder workshop, through
the questionnaire returned after the February workshop and through bilateral meetings.
2.7.4 The second consultation was performed through a Commission online questionnaire
conducted using “Your voice” [Ref. ix], which was open from 17 May until 3 July 2013. This
consultation period was intended to allow for stakeholders to give the maximum possible
input sufficiently early on in the process to provide a robust basis for adoption. A summary of
the comments received is provided in Chapter 4.

PRB advice to the Commission in the setting of Union-wide performance targets for RP2
12
Bilateral and multilateral meetings
2.7.5 During the process of preparation of Union-wide targets, the PRB held bilateral meetings with
stakeholders’ representatives at their request and answered a number of requests for
clarification.
2.7.6 The PRB is grateful for the constructive engagement of stakeholders. A detailed summary of
responses gathered during the consultation is provided in Appendix B and the impact of the
consultation on proposed targets is described in Chapter 4.
Drafting the final PRB report on Union-wide targets for RP2
2.7.7 The PRB considered different inputs when preparing this document. These inputs include, but
are not limited to:
Observed performance until summer 2013;
New data received, including the latest traffic forecasts from STATFOR;
Stakeholders’ answers to the second consultation described above;
Views expressed in bilateral consultations;
States’ annual monitoring reports for 2012;
States’ reporting tables with forecast cost-efficiency figures covering RP2 and final cost
data for 2012;
Pilot Common Project proposed by the SESAR JU.
EC consultation process on Union-wide targets for RP2
2.7.8 The process leading to the adoption of Union-wide targets for RP2 by end 2013 is now under
the auspices of the Commission and Single Sky Committee.
Summary of processes leading to the adoption of Union-wide targets for RP2
2.7.9 Table 8 summarises the processes leading to the adoption of Union-wide targets for RP2.
Phase 2013 Events
Consultation on
performance
target ranges
Jan-Feb.
First consultation on ranges for Union-wide targets for RP2,
including “EU wide targets for RP2: Indicative Performance
Ranges for consultation” published 25 January
Consultation on
performance
targets
17 May – 3 July Second consultation period on ranges published 17 May 2013
Early Sept. PRB report to the Commission on proposed Union-wide
targets for RP2 (this report)
EU decision
process
October Draft Commission Decision on Union-wide targets sent to SSC
Oct-Dec. Consultation led by the Commission (ICB, expert group, etc.)
22-23 October SSC meeting, addressing Union-wide targets for RP2
17-18 Dec. SSC meeting. Adoption of Union-wide targets for RP2
Table 8: Process towards adoption of Union-wide targets for RP2

PRB advice to the Commission in the setting of Union-wide performance targets for RP2
3 Level of ambition and realism
3.1 General approach
3.1.1 In making its proposals for European Union-wide targets for RP2, the PRB applied the
principles described in §2.6 above and carefully considered and analysed:
The wider background and macro-economic conditions;
Historic trends in ANS performance within the EU;
The latest air traffic forecasts;
Experience in the first year of RP1;
Opportunities for further improvement in ANS performance and associated risks;
Evidence of best practice both within the EU and elsewhere.
3.1.2 The PRB also engaged States, National Supervisory Authorities (NSAs) and stakeholders in
an extensive consultation processes, involving document publication, questionnaires, public
workshops and forums as well as bilateral meetings. The interdependencies between Key
Performance Areas (KPAs) have also been considered by the PRB.
3.1.3 As a result of this process, the PRB first notes with pleasure that initial results are being
achieved in Reference Period 1 (RP1), in line with targets adopted for RP1. This is very
encouraging and demonstrates that the Performance Scheme works, and fully plays its role in
delivering the SES. This is even more impressive as RP1 can be considered as a transitional
phase, thus further improvements are feasible. Improvements in 2012 are summarised in §3.2.
More details can be found in PRB’s first monitoring report addressing year 2012 [Ref. x].
3.1.4 The PRB also concludes that there is significant scope for further significant performance
improvements during RP2 and beyond. The evolution of air navigation services’ performance
has to be seen in a long-term context, and this report also considers the prospects for later
Reference Periods.
3.1.5 Opportunities for such improvements during RP2 and beyond include:
Efficiency gains in individual ANSPs, through e.g. rigorous cost control;
Airspace improvements, through e.g. Europe-wide application of free routes;
More flexible management of capacity to match demand;
New Technology;
Rationalisation of and greater cooperation in service provision and oversight;
The start of ANS restructuring through FABs or otherwise.
These opportunities are developed in §3.3.
3.1.6 These opportunities are supported by the SES tools, such as the Network Manager, FABs, the
Pilot Common Project and further SESAR Deployment, as well as EUROCONTROL’s
proposals on centralised services. These will all contribute towards achieving ambitious
targets.
3.1.7 While performance targets define the intended outcome, it is for FABs, States and ANSPs to
define their performance plans and decide how to reach the targets using these opportunities.
The SES regulations are based on the principles of subsidiarity. It is important that this
principle is applied in full.
3.1.8 The PRB aims at proposing Union-wide performance targets which it considers ambitious and
challenging - but realistic. Opportunities do bring risk with them – these risks will need to be
identified as the FAB Performance Plans are developed and then they must be managed. But
the PRB, after lengthy discussion and consultation, is persuaded that the targets can be
achieved and that they will substantially improve European air traffic management. The
evidence for the foregoing is outlined below, across all KPAs, and then detailed in the various
sections for each individual KPA.

PRB advice to the Commission in the setting of Union-wide performance targets for RP2
14
3.2 Improvements made in RP1
3.2.1 RP1 is a transitional period in the Performance Scheme with greater improvement expected in
RP2 and subsequent Reference Periods. Progress made so far in RP1 is noteworthy and good
results were achieved in 2012, even though traffic was significantly lower than planned in
2011. This helped States to meet the Capacity target but made the Cost-Efficiency target more
difficult to achieve.
3.2.2 Nevertheless, in 2012, States and ANSPs succeeded in reducing en route costs €206M (3.3%)
below the determined costs in the adopted Performance Plans. This is more than the reduction
in revenue arising from the new risk-sharing mechanism. States, therefore, were able to adjust
their costs as traffic reduced and to maintain margins overall.
3.2.3 Over RP1, the cost-efficiency target is due to generate significant savings against the
performance baseline of 2009.
3.2.4 In 2012, improvements in flight-efficiency were broadly in line with the performance profile
established by the Network Manager, aimed at reaching the target set for 2014 (a reduction of
0.75% in the horizontal flight extension KPI). This profile foresees a faster rate of
improvement in 2013-14 as illustrated in Figure 3-1.
Figure 3-1: Horizontal en-route flight efficiency (2009-2014)
3.2.5 By 2014, as part of the Network Strategy Plan (NSP), various steps of Free Route Operations
will have been implemented in at least 16 of the 64 European Area Control Centres, as shown
in Figure 3-2. This will mean a reduction of some 7.5 million nautical miles in real distances
flown, 45,000 tonnes less fuel burnt and 150,000 fewer tonnes of carbon dioxide emitted.
5.42%
4.67%
5.38%
5.18% 5.15%
4.0%
4.5%
5.0%
5.5%
Ho
rizo
nta
l E
n-r
ou
te E
xte
nsio
n
(% o
f G
CD
)
NM profile 5.42% 5.32% 5.22% 5.12% 4.92% 4.67%
Target 4.67%
Baseline 5.42%
Actual Profile 5.42% 5.38% 5.18% 5.15%
2009 2010 2011 2012 2013 2014

PRB advice to the Commission in the setting of Union-wide performance targets for RP2
15
Figure 3-2: Expected implementation of free route airspace at end of RP1
3.2.6 The capacity target for RP1 (0.5 minute per en-route ATFM delay per flight in 2014) is
ambitious, in recognition of the cost that delay creates for airspace users. The interim target
for 2012 (0.7 min/flight) was achieved (0.63 min/flight), resulting in the best delay levels ever
achieved. The Network Manager is working with ANSPs to ensure that the RP1 capacity
target, set for 2014, will be met.
3.2.7 Although the traffic figures were lower than expected, the Performance Scheme helped drive
the positive behaviours that contributed to the excellent capacity results.
3.2.8 Given that operational issues are to a large extent being addressed in RP1 - as was the original
intention, the PRB believes that the operational improvements delivered in RP1 should be
consolidated and maintained in RP2.
3.2.9 Finally, safety falls under the auspices of EASA and the NSAs; performance is monitored
under the performance scheme through safety indicators.
3.3 Opportunities for performance improvement in RP2 and risks
3.3.1 While a good start has been made in RP1, this is only a transitional period and significantly
more improvement can be achieved in RP2. This section highlights several opportunities to
further improve performance, so as to identify targets that are not only challenging, but also
achievable. Risks associated with opportunities also have to be considered and managed
carefully.
Efficiency gains in individual ANSPs
3.3.2 Firstly, progressive improvement in performance can be achieved by individual ANSPs
through efficiency gains, e.g. rigorous cost control, as in any industry. ANSPs have been
successful in doing so in the past, and have the capabilities to continue to do so.
Airspace improvements
3.3.3 Secondly, improvements in both airspace design and usage offer opportunities for significant
gains in Flight-efficiency and environmental impact during RP2. Positive results in RP1 can
be amplified in RP2 in several ways.
3.3.4 The Europe-wide application of Free Route Airspace (FRA) will reinforce individual
initiatives (see Figure 3-2) and enable significant further performance improvements to be

PRB advice to the Commission in the setting of Union-wide performance targets for RP2
16
achieved. In contrast with other modes of transport, changes to en-route airspace do not
require major infrastructure. Most associated performance improvements can be achieved
during RP2.
3.3.5 Additional opportunities to improve flight efficiency and capacity are expected from the
application of the Advanced FUA concept (AFUA) which is currently being developed.
3.3.6 Implementation of both FRA (Objective 3 the Network Strategy Strategic Plan) and AFUA
will be strongly supported by the Network Manager on the operational side.
3.3.7 The Pilot Common Project (PCP) is due to provide technical enablers for FRA (see AF#3 in
Table 9 below) and EUROCONTROL proposes Centralised Service #4 to optimise the
services associated with AFUA.
3.3.8 The PCP will also deliver benefits in Flight-efficiency and environmental impact in the
Terminal area. This is not subject to targets, but will be measured and will generate benefits
for users and the environment in RP2 (See the New Technology section below).
More flexible management of capacity to match demand
3.3.9 Thirdly, there is an essential opportunity to be seized in improving both capacity and cost-
efficiency through better matching of capacity with demand. Too little en-route capacity
generates high delay and too much capacity generates unnecessary costs.
3.3.10 Currently, there are many sectors with spare capacity (some 600 out of 700 en-route sectors)
and a few sectors with capacity shortages generating high delays. Better matching of capacity
with demand would lead to significant improvements in both Capacity and Cost-Efficiency.
3.3.11 In spite of a faster increase of average ATCO-hour productivity compared to other network
industries (Section 8.8 of Appendix A) in the period of 2002-2010, benchmarking indicates a
potential for further improvement in ATCO productivity. Better understanding of the
influencing factors (such as public service requirements,, H24 operations, density, night
restrictions, etc.) will assist to improve the understanding and management of this metric.
3.3.12 In recent years, some ANSPs have made significant efficiency gains through dynamic
management of sectors and staff rostering that is more closely tailored to demand. Adopting
best practices in capacity and human resource management in co-ordination with the Network
Manager represents a major opportunity to significantly improve both capacity and cost
efficiency. This has an impact on ATCO and en-route ATFM Delay costs, i.e. some €3B per
annum.
3.3.13 Moreover, airspace released by military stakeholders during periods of high civil demand
under the Advanced FUA concept (AFUA) would further help to improve capacity at minimal
cost.
3.3.14 In the longer-term, the implementation of advanced concepts such as Virtual Centres will
facilitate a shift in capacity also between Area Control Centres (ACCs). Extra training and
licensing would be necessary. For example, skyguide plans to combine both Zürich and
Geneva Centres into a Virtual Centre in RP2. This will allow them to improve efficiency by
combining operations at night and in many other ways.
3.3.15 Sectors should also be made easily reconfigurable - e.g. combining sectors together in light
traffic. This is already done by a number of ANSPs.
3.3.16 Common projects should include the corresponding technical enablers.
New technology
3.3.17 Fourthly, the deployment of new technology, in line with the ATM Master Plan, including the
Interim deployment programme (IDP), the Pilot Common Project (PCP) and other items
agreed through the new deployment governance arrangements, should also lead to faster and
stronger performance improvements - The Commission has clearly stated that deployment
should be performance-based. Corresponding opportunities and constraints must be taken into

PRB advice to the Commission in the setting of Union-wide performance targets for RP2
17
account in proposing performance targets. The adoption of corresponding interoperability
Regulations could facilitate the convergence of the different initiatives.
3.3.18 Table 9 gives a list of IDP and PCP tools that are designed for more efficient and safer
operations.
Interim Deployment Programme Pilot Common Project
1. Collaborative flight planning and
demand/capacity balancing
2. Airspace management improvements and
data sharing
3. Airport CDM
4. Air-Ground Data Link
5. Automated assistance to controllers for
seamless coordination, transfer and
dialogue
6. RNP approaches
7. CDO/CCO application
AF#1: Extended AMAN and PBN in high density
TMAs
AF#2: Airport integration and throughput
functionalities
AF#3: Flexible Airspace Management and Free
Route
AF#4: Network Collaborative Management (Flow
and NOP)
AF#5: iSWIM functionality
AF#6: Initial Trajectory Information Sharing (i4D)
Table 9: Interim Deployment Programme and Pilot Common Project
3.3.19 Implementation of the PCP is expected to have a positive impact on ANS performance
towards the end of RP2 and beyond. PRB analysis shows that some IDP elements and PCP
AF#3, 4 and 5 (see Table 9) will help to meet the performance targets proposed for capacity
and flight-efficiency in RP2. The deployment timing is therefore an important item to be
taken into account in setting targets for RP2.
3.3.20 Approximately half of the benefits from the PCP are expected in the terminal areas and at
airports, according to the PCP’s cost-benefit analysis. As this is not subject to target-setting in
RP2, these benefits will be in addition to those to be achieved under RP2 targets. This fact
highlights the complementary nature of SES tools - the Performance Scheme and SESAR
deployment - which all help to meet the broader SES objectives.
3.3.21 Several concepts will help optimising flight profiles from/into airports and airport throughput,
such as the Extended Arrival Manager (Extended AMAN), Point Merge, Airport
Collaborative Decision-Making (A-CDM), Continuous Descent Operations/Continuous
Climb Operations (CDO/CCO). The Pilot Common Project will help to deploy the technical
infrastructure, standardisation and procedures supporting these concepts where required
(AF#2: airport integration and throughput functionalities).
3.3.22 A large part of capital expenditure associated with the implementation of the PCP on the
ground will be borne during RP2. The PRB assumed in its report on target ranges for RP2
(published in January 2013) that capital expenditure corresponding to technology deployment
could be accommodated within current values in the order of €1 billion per annum. The PCP
Proposal indicates that the PCP should be deployed without any increase in total investment
costs. The PRB’s assumption is therefore confirmed and capital expenditure for deployment
of the PCP is included in the PRB’s proposal.
3.3.23 The PRB proposes a slower decrease in cost over the first two years of RP2, in order to allow
States and ANSPs time to plan for the greater reductions required in the later years of RP2.
This profiling also enables investment in the early years that are potentially required over
RP2. Capital expenditure on new infrastructure is vital to keep the ATM system running well,
but it can be shared and so optimised. Centralised services are one way to achieve this.

PRB advice to the Commission in the setting of Union-wide performance targets for RP2
18
Rationalisation of service provision and oversight
3.3.24 Another opportunity for major improvements in all performance areas is through
rationalisation of Air Navigation service provision and oversight. The current fragmentation
of the European ANS system is acknowledged as a weakness [Ref. xi] and results in
significantly lower performance than achievable in a true Single European Sky. States and
ANSPs working together can achieve much more than in isolation.
3.3.25 The main objective of FABs is to reduce the fragmentation of ANS and rationalise service
provision and oversight. FABs are progressing, but the performance benefits are slow in
materialising. To a large extent, ANSPs still tend to operate in silos, independently from
others, and there is limited cooperation between oversight authorities. This fragmentation
compounds inefficiency.
3.3.26 There is clear potential to strongly improve ANS performance in Europe through
rationalisation of service provision and oversight. It could be done in many ways, including:
Consolidation or sharing of oversight authority, which EASA rules should facilitate;
Consolidation or sharing of support services, such as administration, safety management,
procurement, infrastructure, maintenance, meteorological services, training and flight
calibration in a FAB or group of ANSPs;
Centralised services for services best provided at pan-European level, as proposed by
EUROCONTROL;
Consolidation of en-route facilities, such as merging some ACCs in one state or in several
- like NUAC;
Virtual centres, offering nearly the same operational and technical benefits as facility
consolidation, without the human and transition issues associated with relocation;
Liberalisation of CNS provision and of ATS at towers (as has been done in Germany,
Spain, Sweden and the United Kingdom).
3.3.27 The largest part of investment costs is related to software. The common procurement,
operation and maintenance of software-based systems offer opportunities for large savings
through scale effects. Moreover, it helps interoperability, the synchronisation of upgrades and
maintenance. Finally, it gives more buying power to ANSPs, which helps reducing
procurement costs.
3.3.28 Infrastructure, such as data-link and surveillance, can be optimised by the sharing of ground
stations in overlapping areas.
3.3.29 Defragmentation and rationalisation can be achieved through FABs or other forms of regional
co-operation. Some ANSPs already share the costs of system development, deployment and
upgrades. For example, six ANSPs are associated in COOPANS; one of them - the Irish
Aviation Authority - has stated that it has managed to reduce the costs of replacing its flight
data processing systems by 30% to date. Similar orders of magnitude can be expected
elsewhere.
3.3.30 The PRB considers that the combination of enforceable targets and incentives will give FABs
and States opportunities to significantly improve performance, in particular by encouraging
the rationalisation of service provision through FABs or otherwise.
3.3.31 The rules applying to SESAR deployment governance and any related EC funding should
encourage and possibly even mandate the rationalisation of technical services and
harmonisation of systems.
3.3.32 Finally, States can also collaborate on oversight matters.
3.3.33 It is important to start the rationalisation of service provision and oversight already in RP2 so
that initial performance benefits can accrue in RP2, and that full benefits materialise as early
as possible.

PRB advice to the Commission in the setting of Union-wide performance targets for RP2
19
The start of ANS restructuring
3.3.34 Finally, while some level of rationalisation can happen through collaborative arrangements,
deeper restructuring of ANS will be needed to fully achieve the benefits of ANS
rationalisation. This has already been done before in Europe: consider the airframe industry
and the changes it underwent in creating Airbus in a competitive environment.
3.3.35 The range and magnitude of performance improvements that can be achieved through
restructuring are massive - but they will take time to put into place and so will extend into
RP3 and beyond. It is however important to take a long term perspective on ANS
performance and establish now the basis upon which benefits can be delivered in RP3 and
beyond.
3.3.36 Restructuring should apply to ANSPs and oversight authorities over the next 10 - 15 years. Of
course, this will entail costs but provision has been made in Article 7 (4) of the Charging
Regulation for one-off restructuring costs.
3.3.37 ANS restructuring can take many forms. Any restructuring should be performance-driven,
well planned and managed, and involve all concerned parties. The SES fifth pillar could
provide the framework for addressing associated Human Capital issues at European level.
3.3.38 Restructuring would prepare the ground for major performance improvements beyond RP2. It
is not expected to have much impact on performance targets for RP2 as benefits would arise
mainly beyond RP2 and authorised one-off restructuring costs are outside the target setting
process.
3.4 Interdependencies
3.4.1 In proposing performance targets, it is also important to understand interdependencies
between KPAs, as performance improvements in one area could have negative consequences
in other areas. Dependencies with external factors such as traffic volume and complexity also
need to be considered.
Safety
3.4.2 Safety establishes mandatory requirements in ATM operations and is a KPA to which
assessments of all the other performance areas should be linked. It is the only KPA that is not
assessed in monetary values, using e.g. the Total economic cost concept (TEC, see § 3.5).
3.4.3 Today, Europe is assessed as being well above the minimum acceptable air safety levels, as
defined by EASA. However, within these boundaries, there is still room for improving safety
performance levels overall and hence specific safety targets are being set for RP2. These will
help the change management process by identifying and managing safety risks through
reporting and monitoring systems.
3.4.4 The PRB maintains that safety performance is about managing risk - and feels that safety
management systems, safety plans and safety cultures can still be significantly improved by
national Just Culture programmes, as well as by Community-wide initiatives and targets.
3.4.5 The PRB recognises that efforts will be required within most States and ANSPs during RP2 in
order to reach safety targets. Safety should continue to have primacy and should never be
compromised whilst trying to achieve a target in a different KPA.
3.4.6 Evidence show that implementation of Safety Management Systems comes at an affordable
price. Therefore, Safety targets, even if challenging for some, can be met without unduly
affecting cost-efficiency.
3.4.7 The PRB recognises that certain interdependencies between safety and other KPAs exist,
however firmly believes that the system is far from the state when these can have a negative
influence on the ability to achieve targets in RP2.

PRB advice to the Commission in the setting of Union-wide performance targets for RP2
20
Other KPAs
3.4.8 Providing greater capacity may entail extra costs, through investment in new technology and
procedures (e.g. RVSM) or extra staff. It may also involve reducing cost by deploying
ATCOs according to traffic demand. The interdependency between capacity and cost-
efficiency is relatively well understood. Optimum capacity is defined as when the marginal
cost of additional capacity equals the cost of additional delays. Optimum capacity is taken
into consideration by both the PRB in setting capacity targets and by the Network Manager.
3.4.9 There is some interdependency between en-route capacity and flight-efficiency: more
structured routes, such as one-way routes, offer more capacity but are less efficient from the
environmental and operational perspectives. This does not appear to be a hard constraint at
the moment, as a high level of flight-efficiency can be achieved with Free Route Airspace,
even in very dense en-route areas.
3.4.10 There is some interdependency between flight-efficiency and cost-efficiency. Sophisticated
flight planning systems take unit rates into account; they can plan longer but cheaper routes as
they fly round more expensive ANSPs. This wastes capacity already made available in the
States with higher costs - and drives up costs in those States which used to have lower costs,
as demand on non-traditional route structures increases. Behaviours induced by the
performance and charging regulations will need to be monitored and analysed further.
3.4.11 Complex interdependencies exist between ANS capacity and flight efficiency in terminal
areas, airport capacity and noise. At this stage, performance in these areas is subject to
measurement but not to target-setting. The Pilot Common Project and the European
Commission’s airport package - both of which will be introduced during RP2 - are expected
to tackle some of these issues, in a way that will be complementary to target-setting.
Dependencies with external factors
3.4.12 There are dependencies between all KPAs and external factors, such as traffic and
complexity.
3.4.13 Traffic volume is a key parameter of performance. It has a positive impact on cost-efficiency
as costs can be spread over a larger volume. But higher traffic requires higher capacity. The
traffic risk sharing mechanism offers additional revenue to ANSPs when traffic is higher than
planned within the alert threshold, which generally covers the marginal costs of additional
capacity.
3.4.14 Other external factors include traffic complexity, variability, etc. While these may have an
influence at local level, no significant influence is expected at aggregate EU level over RP2.
PRB conclusions on interdependencies as far as EU targets for RP2 are concerned
3.4.15 Flight efficiency and capacity will need to be understood and integrated in the users daily
operations plan, in order to get the full benefit of the Network Manager’s proposed measures
over RP2.
3.4.16 Overall, the PRB concludes that there are significant margins for improvement in all KPAs
during RP2 and that interdependencies between them do not form an insuperable barrier to
the setting of ambitious targets at EU level.
3.4.17 The same is not necessarily valid at local level. It is expected that greater clarity on local
interdependencies will be provided by FABs in their performance plans.
3.5 Total Economic Cost (TEC)
3.5.1 Over the years, the PRB has used the Total Economic Cost concept (see box below) to
quantify the ANS-related costs borne by airspace users, to identify opportunities for
improvements and their magnitude, and to obtain insights into the interdependencies.

PRB advice to the Commission in the setting of Union-wide performance targets for RP2
21
Total economic cost concept
Airspace users pay for route and
terminal charges, but also for
indirect costs caused by delay
and flight inefficiency. The three
added together make up the Total
Economic Cost (TEC).
Airborne equipment is not
included in the TEC computation
due to lack of precise
information, and would need to
be added to get a full picture of
ANS-related costs borne by
airspace users.
Figure 3-3: Estimated TEC – SES area, En-route only
3.5.2 The en-route TEC in the SES area is in order of 8 billion euro per annum, as shown in Figure
3-3, i.e. 40 billion euro over five years. This estimate is different from that published in
PRR 2012 (figure 2-28) [Ref. xii], as it covers a different scope (en-route vs. gate-to-gate;
SES area vs. EUROCONTROL area) and uses more precise models to compute flight-
efficiency values.
3.5.3 The PRB’s principal objective in proposing targets for RP2 was to reduce the Total Economic
Cost subject to target setting- while maintaining safety levels and safeguarding the military’s
requirements.
3.5.4 Figure 3-4 shows the projected TEC under the baseline traffic scenario. It decreases in
absolute terms while traffic increases.
- Savings in cost-efficiency constitute the major part of savings in TEC.
- Flight-inefficiencies, fuel burn and environmental impact of CO2 emissions decrease
in absolute terms while traffic increases. The proposed target therefore ensures carbon
neutrality of aviation as far as ANS is concerned, before the target date of 2020.
- The delay costs increase slightly, in line with traffic, starting from a small base thanks
to a challenging target to be achieved at end of RP1.
Figure 3-4: Projected TEC (Baseline traffic scenario)

PRB advice to the Commission in the setting of Union-wide performance targets for RP2
22
3.5.5 Figure 3-5 shows the large positive impact of proposed targets on Total Economic Cost over
the entire RP2 period, i.e. €7600M savings versus the 2012 performance baseline (some 21%
of TEC cumulated over RP2). This shows a major contribution of the performance scheme
towards achieving the objectives of the Single European Sky. These savings are sensitive to
traffic and would reduce to €5400M in the low-traffic scenario.
Figure 3-5: Impact of proposed targets on TEC (Baseline traffic scenario)
3.5.6 Figure 3-6 shows the impact of
proposed targets on total economic
cost per flight, which is of most
immediate relevance to civil airspace
users. The proposed targets will
result in strongly decreasing TEC
per flight in RP2. There is a marked
influence of traffic growth on
improvement.
Figure 3-6: Projected TEC per flight
3.5.7 Finally, Figure 3-7 shows the breakdown of actual/projected TEC per flight in the three KPAs
resulting from PRB’s proposed targets.
2012A 2014P 2019P
TEC per flight (€2009)
En route ATFM delay cost 50 40 40
Route extension cost (KEA) 119 115 98
En route cost profile 691 648 513
Total 860 803 651
Figure 3-7: Breakdown of TEC per flight
5000
5500
6000
6500
7000
7500
8000
8500
9000
9500
20
15
20
16
20
17
20
18
20
19
Mill
ion
(€2
009)
Δ TEC
TEC (2012 performance
baseline)
TEC (Base traffic)
€7600 m
€600
€650
€700
€750
€800
€850
€900
20
11
20
12
20
13
20
14
20
15
20
16
20
17
20
18
20
19
€(2
00
9)
pe
r fl
igh
t
TEC/ft (Base Traffic) TEC/ft (Low traffic)

PRB advice to the Commission in the setting of Union-wide performance targets for RP2
23
4 Stakeholder consultation
4.1 Scope of consultation
4.1.1 The public consultation document [Ref. iii] contained 16 questions covering Safety,
Environment, Capacity, Cost-efficiency and Union-wide targets and Alert thresholds. The
consultation was conducted through the European Commission’s ‘Your Voice’ web based
questionnaire. This document provides an analysis of the comments received and the PRB
responses to the comments. This analysis has informed the development of the PRB’s final
recommendations to the Commission.
4.1.2 A detailed consultation report “Union-wide target proposals - Consultation response
document” is attached to the Report as “Appendix B”.
4.2 Comments received
4.2.1 By 3 July 2013, the closing date, comments were received from 63 organisations and
individuals representing all aspects of the air transport industry. A full list of respondents is
provided in Table 10. The responses cover 24 States and 11 European or multinational
organisations. At least one response was received from each State, except: Malta, Cyprus,
Lithuania, Slovakia, Croatia and Iceland. The magnitude and quality of responses received
from all stakeholders provides a clear indication of the importance of the Union-wide targets.
4.2.2 EASA’s response was provided as free-form comments and is not included in the statistics
presented in the following chapters; the comments are, however, discussed in the relevant
sections.
4.2.3 Respondents were characterised by their industry sector. Figure 4-1 provides a breakdown of
responses by stakeholder type.
Figure 4-1: Distribution of respondents
4
5 1
16
16
4
11
11
1
3
Airport operator
Airline
Military
ANSP
NSA
Ministry
FAB - ANSP side
FAB - NSA side
Professional StaffAssociationsInternational organisation

PRB advice to the Commission in the setting of Union-wide performance targets for RP2
24
Stakeholder type Total Names of respondents
Airport operator 4 ADP, Dusseldorf Airport, Heathrow Airport, Swedavia
Airline 5 IATA and AEA, IACA, LOT, Ryanair, ERA
Military 1 Spanish Air Force
Air Navigation
Service Provider
(ANSP)
16 AENA, ANS CR, Austro Control, BULATSA, CANSO, EANS, ENAV,
EUMETNET, HungaroControl, IAA (ANSP), LFV, LGS, NATS, Nav
Portugal, Polish ANSA, ROMATSA
National
Supervisory
Authority (NSA)
16 AESA, Belgian CAA + Belgian NSA, Bundesaufsichtsamt für
Flugsicherung, CAA Czech Republic, CAA-Norway, Civil Aviation
Authority of Italy, DGCAA Bulgaria, Estonian CAA, Finnish NSA,
Hellenic ANSA, IAA (NSA), Polish CAA, Portuguese CAA, Romanian
CAA, The Danish Transport Authority, UK national authorities
Ministry 4 Federal Office of Civil Aviation Switzerland, French State,
Ministry of Infrastructure and Environment (Netherlands),
Ministry of Transport (Czech Republic)
FAB - ANSP side 1 FABEC ANSPs
FAB - NSA side 1 FABEC Financial & Performance Committee
Professional Staff
Associations
11 ACV TRANSCOM, European workers Transport Federation (ETF),
Finnish Air Traffic Controllers association, GATCO, IFATCA, IFATSEA,
Prospect Trade Union and PCS Trade Union, SINCTA, SwissATCA –
Swiss Air Traffic Controllers’ Association, USCA - Air Traffic Control
Officers Spanish Trade Union, ZZKRL (Polish ATC Union)
Int. organisation 1 EUROCONTROL
Other 3 Citizens
Table 10: Summary of respondents by stakeholder type
4.2.4 The following responses represented multiple organisations:
Airlines: IATA and AEA, IACA and ERA;
ANSPs: CANSO, EUMETNET and FABEC ANSPs (no individual responses);
National Authorities: Belgian CAA and NSA (under NSA), UK Authorities (CAA, DfT
and MoD) (under NSA), FABEC NSAs (additional individual responses included).
4.3 Statistical analysis
4.3.1 Most of the questions asked had a range of predefined answers (for example Yes, No, Other)
and a free-form comment. In order to analyse the comments, statistics are presented on the
level of each fixed response for each stakeholder group.
4.3.2 The PRB has considered the range of responses from each stakeholder group in order to
determine the nature of the feedback received. In particular the PRB note that the written
comments often indicate that stakeholders would have preferred an additional option. The
statistics are only presented to help readers understand the range of responses.
4.4 Clustering of the comments
4.4.1 When similar comments on proposed targets or methodology were received, they were put
into clusters and handled together. They are identified by a reference number, for instance
“ECO 01”, which is used in this Report for ease of reference and traceability.

PRB advice to the Commission in the setting of Union-wide performance targets for RP2
5 Safety target
5.1 PRB Initial Proposal
5.1.1 Table 11 contains the PRB initial proposed targets for the two Safety performance indicators
as contained in the Consultation Document (see Appendix A).
EoSM: Effectiveness of Safety Management of States/NSAs
Projected value (2014) Target (2019)
Most but not all NSAs will have achieved at least
EoSM Level C in all Management Objectives (MOs).
All NSAs have achieved at least EoSM Level C in all
MOs.
EoSM: Effectiveness of Safety Management of Service Providers
Projected value (2014) Target (2019)
All ANSPs will have achieved EoSM Level C in all
MOs.
All ANSPs have achieved EoSM Level D in all
MOs.
Severity Classification: Application of the RAT Methodology by States
Projected value (2014) Target (2019)
It is not expected that all other investigation entities
(e.g. CAAs/NSAs) should be applying severity
classification via the RAT methodology by 2015.
By the end of RP2, all NSAs/States should be
reporting ATM Overall using the RAT methodology
for severity classification for almost all reported
occurrences (i.e. 99%).
Severity Classification: Application of the RAT Methodology by Service Providers
Projected value (2014) Target (2019)
It is expected that by the end of RP1, all ANSPs
should be applying severity classification via the
RAT methodology.
By the end of RP2, all ANSPs should be reporting
ATM Ground using the RAT methodology for
severity classification for all reported occurrences
(i.e. 100%).
Table 11: PRB consultation proposal - Safety
5.2 Stakeholders’ comments
EoSM 01 Most stakeholders consider proposed EoSM target ambitious but achievable.
ANSPs suggest that a more granular approach to target setting for EoSM might
be needed.
EoSM 02 Some stakeholders are concerned with potential costs of requiring all ANSPs to
move to EoSM Level D for all MOs.
RAT 01 Stakeholders see the proposed RAT target as being too ambitious for NSAs.
RAT 02 Most stakeholders, however, support the ANSP target albeit with reservations
about the approach to ATM specific events.
5.3 New elements considered by the PRB
5.3.1 PRB considered that during the period following the stakeholder consultation and leading up
to the publication of this report that no further elements emerged which could have affected
the PRB analysis and/or suggested targets.

PRB advice to the Commission in the setting of Union-wide performance targets for RP2
26
5.4 PRB opinion
5.4.1 Based on the rationale provided in the consultation document and in reply to the stakeholders
comments described above, the PRB is of the opinion that:
EoSM 01
5.4.2 PRB considers the suggestion that a more granular approach to target setting for EoSM for
ANSPs might be required was a valid one. They asked EASA whether there is a need to
revise the proposed target. Several options were considered, including:
Setting target on EoSM score;
Introducing more focused targeting, concentrating on only MOs where a higher maturity
level is mostly desired to ensure an effective management of safety and going beyond
pure compliance;
Setting EoSM targets on Level C in EoSM with an overall EoSM score of 75 or 80 (out of
maximum 100).
5.4.3 The proposal to achieve level D in all MOs is indeed challenging. However, the PRB and
EASA feel that it is still achievable (as well as necessary) by the end of 2019. This is also the
opinion of the majority of stakeholders (who responded to the consultation questionnaire).
Some 80% of stakeholders supported the current PRB proposal for EoSM targets and either
fully or partially agree with the proposal (note that 13% have no opinion, so this percentage
would be even higher if that portion of stakeholders were to be excluded).
Note that a Maturity Level is assigned to each MO and is defined to be the lowest response (A
- E) in each MO. An overall Maturity Level for the NSA or ANSP is similarly defined to be the
lowest response to any MO. So, achieving level D in one MO assumes that the lowest response
of all questions within that MO is Level D.
5.4.4 The PRB’s view is that setting the target for EoSM on Level C only for ANSPs, might be not
challenging enough, as the majority of ANSPs (65%) were already on that level in 2012 (see
Figure 3 of RP2 Union-wide Targets Ranges for Stakeholders Consultation-May 2013). In
addition, simply setting targets merely on EoSM overall scores could hide the real problems
in an organisation’s safety management.
5.4.5 As is indicated in §5.4.14 in the target setting consultation proposal, it is indeed important to
look at the EoSM results both in terms of EoSM overall maturity score and in terms of
maturity levels. However, as EoSM Score gives only a high-level picture of the general status
of the organisation’s SMS, and it shows whether the ANSP is mostly managing performance
or it is still in the process of implementing the mandatory regulations and achieving the
minimum standards of maturity, it can hide the lack of effort and unimproved performance
levels in some of the most critical areas of safety management. Therefore, the PRB’s proposal
to set targets for EoSM on all MOs will avoid this significant smoothing effect, and it is
deemed more appropriate. Nevertheless, by combining the two, a more complete picture can
be built, so the PRB and EASA will continue to monitor EoSM overall scores in the future as
well.
5.4.6 Moreover, 2012 results show that already more than half of service providers are at or above
an EoSM score of 75, therefore, setting an Union-wide target for EoSM for ANSPs to reach
75 or 80 by end of 2019 seems not challenging enough, as Safety in the Performance Scheme
again can be seen as not being given sufficiently high priority.

PRB advice to the Commission in the setting of Union-wide performance targets for RP2
27
Figure 5-1: 2012 EoSM score for ANSPs
5.4.7 Indeed, the whole concept of SMS was introduced many years ago, before the introduction of
the Performance Scheme. One would assume that it would already have been implemented by
many, if not all, service providers in Europe. However, the fact that this is not the case raises
several issues. The PRB and EASA are of the view that improvements in safety management
are of highest importance: stakeholders need to make Safety their highest priority.
5.4.8 For this reason, the PRB and EASA are of the opinion that even though there is a possibility
that small number of ANSPs might not be able to reach Level D in all MOs by the end of
2019 it is important to set challenging targets in order to motivate all stakeholders to
consecrate additional effort into implementing safety management throughout the European
ATM system. This will in turn help in achieving, and maintaining the high level of safety - an
essential objective of both ATM and of the SES initiative.
5.4.9 Lastly, the PRB agrees that by basing targets on the lowest level achieved within MOs, the
full picture for either a FAB - or for the States that make up FABs - will not be reflected in
the target level achieved. Therefore, as also suggested in the Performance Regulation
390/2013, it is necessary and important to continue to monitor the individual Member States
scores so as to obtain an overall picture as well as the targeted minimum score.
EoSM 02
5.4.10 The PRB has taken into consideration the concern of some stakeholders about the potential
costs of requiring all ANSPs to move to EoSM Level D for all MOs. The PRB recognises that
material progress will be required within ANSPs during RP2 in order to reach Level D in all
MOs. However, it is of the opinion that safety should be the number one priority and that a
generally low perceived value of safety initiatives that clash with the predominantly
financially driven decision making processes in ANSPs should not be an impediment to safety
improvements in Europe.
5.4.11 The perception of some ANSPs that the PRB may have underestimated the cost and amount
of work required to move from Level C (or below) to Level D, is therefore deemed to be
unsupported, although the PRB acknowledges that substantial effort will be required by some
ANSPs - not only in the production of more formal SMS processes, but in embedding these
processes within the organisation. In establishing their plans for RP2, both Member States and
ANSPs must ensure the necessary high level of safety through adequate resources planning
and sufficient investment. This is clearly not negotiable.

PRB advice to the Commission in the setting of Union-wide performance targets for RP2
28
5.4.12 For this reason, the PRB and EASA are of opinion that target for EoSM for ANSPs to reach
Level D in all MOs by the end of 2019 is appropriate, although challenging. They consider
that this will allow for substantial improvements in both the implementation and performance
of safety management throughout the European ATM system. Performance targets are set
with a long term perspective, and although changes may generate costs in the short term, the
overall system will benefit from greatly improved performance in the longer term.
RAT 01
5.4.13 The PRB considers that a valid point was made by the stakeholders so it re-checked the
assumptions about the proposed severity classification (RAT) target, seen as challenging for
NSAs. After careful review, the PRB is of the view that some organisations will find the
target very challenging, due to factors such as: a lack of available resources for investigation
and risk assessment that are adequately trained; the absence of a strong reporting culture; or if
they do not have the embedded automated systems to enable easy reporting and analysis of
data. Moreover, EASA also considers this target very challenging, but fully supports the drive
towards improved and increased severity classification of occurrences.
5.4.14 The target is seen as challenging because many NSAs still lack sufficient resources, skills and
competence to ensure that all (or almost all) occurrences are classified. Furthermore, the
continuing increase in reporting levels may exacerbate the resourcing problem. There is a
clear need for dedicated resources that deal with the analysis and classification of the reported
occurrences, however, the experience of EASA Standardisation Directorate is that this has not
yet been implemented in many States.
5.4.15 Indeed, the main common European issue at the moment appears to be the lack of NSA
resources or the lack of efficient use of NSA resources. The PRB has already reported on the
imbalance of NSA resources across Europe in their assessment of the National Performance
Plans for RP1. To address this, the PRB and EASA during the review of the National
Performance Plans for RP1, have recommended to EUROCONTROL that it increases the
training and support that it provides to RAT users, focussing particularly on NSAs.
Furthermore, where small NSAs do not have sufficient resources, they should consider
creating working arrangements with their FAB partners to pool their resources and make the
process more efficient.
5.4.16 The PRB and EASA are of view that the proposed severity classification target for NSAs is
indeed very challenging however still achievable by the end of 2019, provided that they
receive adequate technical support on the use of the RAT methodology and pool resources
wherever necessary. The PRB agrees however, that the formula "for almost all reported
occurrences" leaves room to variation in interpretations and that indeed the clear guidance
materials are required to cover the data collection processes.
5.4.17 In addition to adequate resources, the application of the severity classification by NSAs
depends on the quality and timely availability of information from both the ANSPs and other
entities, including in some cases entities for which NSA has no oversight authority. It is
assumed that the reports received by NSAs from ANSPs should already contain ATM Ground
classification; however if this is not the case, or if input from other sources suggest that
severity was different to that assessed by the ANSP, NSA may need to perform a more in-
depth analysis of occurrence. The chain of reporting implies that NSAs may be powerless to
properly apply the severity classification and to meet the target, without simply resorting the
coding “D-not determined”. This will be counter-productive to the aim of both improving and
increasing severity classification of occurrences.
5.4.18 Although very similar, the severity classification schemes for operational and technical
occurrences are quite different in scope. Whilst the operational occurrences are classified
according to the severity of their effect on the safe operations of aircraft and occupants, the
severity of the technical occurrences (i.e. ATM specific events) is measured based on their
effect on the ability to provide safe Air Traffic Management Services. For this type of

PRB advice to the Commission in the setting of Union-wide performance targets for RP2
29
occurrence the ATM Ground score is identical to the ATM Overall. It is therefore expected
that Member States will be in the possession of all the data necessary to review the severity of
such reported occurrences.
5.4.19 Overall, as indicated in Consultation Document, during RP2, the application of the RAT
methodology could significantly increase provided that:
States/NSAs optimise use of resources and calculate the “ATM Overall score” whenever
it cannot be calculated by ANSPs, obtaining data from airspace users as required.
All Stakeholders establish an appropriate SMS interface and exchange data and expertise
to investigate specific occurrences.
5.4.20 Therefore, after careful examination of current evidence and consultation with EASA, the
PRB suggests that proposed severity classification (RAT) target for NSAs is, although very
challenging, highly required. The extensive and consistent use of standardised taxonomy and
RAT methodology will contribute to the quality, consistency and harmonisation of safety
reports and analysis on EU-level.
5.4.21 In addition, the PRB recommends that all Regulators (NSAs)/States should provide relevant
information about the cases where ATM Overall using RAT methodology was not reported.
This information should include whether the occurrence has an on-going investigation or
whether information has not yet been submitted to the NSA or awaits clarification.
5.4.22 The PRB acknowledges that the application of reporting of the severity classification using
the RAT methodology is not sufficiently well explained to the stakeholders and this may lead
to differing interpretations and expectations of the proposed future target and impending
resource requirements. As a result, both EASA and PRB will have to consider the best means
to provide support and guidance to the stakeholders in both achieving and reporting on this
safety target.
RAT 02
5.4.23 The PRB re-checked the severity classification target for ANSPs with regards to the
application of RAT methodology for ATM specific events. The PRB found that the margin of
uncertainty is within the tolerance so it sees no need to revise the proposed target.
5.4.24 Indeed, for ATM specific events it will be very important to obtain consensus on using the
scheme in a consistent way across all ANSPs in Europe. Nevertheless, the PRB and EASA
are of opinion that although the application of the RAT methodology for ATM specific events
will not be easily applied at the beginning, as there still might be some uncertainties with
application and definitions, they fully support its full implementation across Europe.
Implementation of the RAT methodology will, besides full harmonisation of severity
classification of occurrences, allow ANSPs across Europe to learn from each other in dealing
with events that occur with a very low frequency.
5.4.25 Overall, States will need to apply additional effort to enable further enhancements in
reporting and application of RAT methodology by seeking, planning and applying training on
this matter. Both the PRB and EASA are committed to work with stakeholders to provide
support and guidance in reporting of this safety indicator.
5.5 PRB recommendations for RP2 Union Wide Safety Targets
5.5.1 The PRB considers the proposed Safety RP2 targets challenging but achievable. Table 12
provides a snapshot of the proposed safety targets. Some of the elements considered by the
PRB as a basis in proposing the Safety RP2 targets are:
Results of the EoSM and severity classification monitoring;
On-going and planned pan-European activities for the optimisation and harmonisation of
the RAT methodology application;

PRB advice to the Commission in the setting of Union-wide performance targets for RP2
30
On-going and planned support and guidance by EUROCONTROL, PRB and EASA in
reporting severity classification safety indicator.
5.5.2 Considerations on the adequate level of ambition:
PRB considers Safety to be number one priority
KPI Target 2019
EoSM: Effectiveness of
Safety Management of
States/NSAs
All NSAs have achieved at least EoSM Level C in all MOs.
EoSM: Effectiveness of
Safety Management of
Service Providers
All ANSPs have achieved EoSM Level D in all MOs.
Severity Classification:
Application of the RAT
Methodology by States
By the end of RP2 all Regulators (NSAs)/States should be reporting ATM Overall
using the RAT methodology of severity classifications for almost all (i.e. 99%)
reported occurrences (separation minima infringements, runway incursions, and
ATM specific events) and provide relevant information about the cases where
ATM Overall using RAT methodology was not reported.
Severity Classification:
Application of the RAT
Methodology by Service
Providers
By the end of RP2, all ANSPs should be reporting ATM Ground using the RAT
methodology for severity classification for all (i.e. 100%) reported occurrences
(separation minima infringements, runway incursions, and ATM specific events).
Table 12: Safety proposed Union-wide targets for RP2

PRB advice to the Commission in the setting of Union-wide performance targets for RP2
6 RP2 Union-wide Environment target
6.1 PRB Initial Proposal
6.1.1 Table 13 contains the PRB initial proposed range for the Environment KPI targets as
contained in the Consultation Document (see Appendix A).
KEP: The average horizontal en route flight efficiency of the last filed flight plan
Value (2009) RP1 target (2014) Range (2019)
RP1 Baseline 4.67% 4.1%-4.4%
KEA: The average horizontal en route flight efficiency of the actual trajectory
Value (2009) RP1 target (2014) Range (2019)
N/A N/A 2.50%-2.75%
Table 13: PRB consultation proposal – Environment
6.2 Stakeholders’ comments
6.2.1 ENV 01 Many stakeholders indicated that the horizontal flight efficiency (HFE) metrics
failed to measure ANSPs’ behaviour as they are directly affected by other factors.
6.2.2 ENV 02 Many stakeholders indicated that the Environment KPA metrics are not yet
sufficiently mature. Many stakeholders felt that there is insufficient data to comment on the
KEA and KEP target proposals.
6.2.3 ENV 03 Some stakeholders point out the implementation of Free Route Airspace (FRA) is
indeed a key enabler of horizontal flight efficiency. However, some stakeholders point out
that those who have already achieved FRA will not have room for further improvement.
6.3 New elements considered by the PRB
6.3.1 There were no further elements emerging from the consultation which could affect the
suggested range of targets (the range proposed by the PRB is contained within the range of
targets suggested by the stakeholders -3.2% to 4.9% for KEP and 2.0% to 2.75% for KEA).
6.3.2 Daily KEA values have been computed for 2011 and 2012 and a few of them are below the
target proposed. This confirms that the proposed target, albeit challenging, is not impossible
to achieve.
6.4 PRB opinion
ENV 01
6.4.1 The PRB recognises that the indicators reflect the outcome of a complex system which
involves multiple processes and multiple actors. As a consequence collaboration and
engagement of different stakeholders is needed in order to reach the targets. Whilst is true for
example that the ANSP cannot impose a flight plan on an airspace user, it is also true that an
airspace user might not be able to file its preferred trajectory because of constraints imposed
by ANSPs. The PRB has also highlighted the important difference between KEP and KEA
which suggests there is room for improvement in the way the different constraints are
considered and the information is shared.
ENV 02
6.4.2 The horizontal flight efficiency indicator has been in existence and measured for several years
now. There is a long history available for what concerns the indicator based on the last filed

PRB advice to the Commission in the setting of Union-wide performance targets for RP2
32
flight plan (KEP), ). The KEA trends used to define the initial proposed range were linked to
the (mature) KEP trends through the offset between KEP and KEA.
ENV 03
6.4.3 The PRB proposes a target at the Union-wide level. The current level of achievement will be
part of the elements taken into account when considering the expected contribution of the
FABs to the overall level.
6.5 PRB recommendations for RP2 Union Wide Environment Targets
6.5.1 In establishing the targets, the PRB has taken into consideration:
The historical performance of the KEP indicator.
The current performance of the KEP and KEA indicators, in particular for what concerns
the offset between the two (used as basis to compute the KEA target).
Performance improvements achievable from the current airspace planning.
Performance improvements achievable through the widespread implementation of FRA.
The conformance with EU policy objectives on emissions.
Considerations on the adequate level of ambitions.
6.5.2 The gap between KEP and KEA should be closed by making KEP improve at a faster rate
than KEA.
6.5.3 In order to avoid the influence of outliers, it is proposed to discard the 10 best and worst days
(at Union-wide level) from the calculation of the annual value.
KPI Target 2019
KEP: The average horizontal en route flight efficiency of the last filed flight plan 4.1%
KEA: The average horizontal en route flight efficiency of the actual trajectory 2.6%
Table 14: Environment proposed Union-wide targets for RP2
6.5.4 PRB considers the proposed targets challenging but achievable.
6.5.5 When the Union-wide target is broken down to FAB level, the PRB recommends that due
consideration is given to the current level of achievement.
6.5.6 PRB recommends intermediate annual values to be set, both at FAB and Union-wide level.

PRB advice to the Commission in the setting of Union-wide performance targets for RP2
33
7 RP2 Union-wide Capacity target
7.1 PRB Initial Proposal
7.1.1 Table 15 contains the PRB initial proposed range for the Capacity KPI target as contained in
the Consultation Document (see Appendix A).
Minutes of en route ATFM delay per flight
Actual Performance (2012) RP1 target (2014) Range (2015-2019)
0.63 0.5 0.3-0.6
Table 15: PRB consultation proposal – Capacity
7.2 Stakeholders’ comments
Stakeholders’ comments, which were focussed on several areas, are addressed in this section.
7.2.1 CAP 01: Stakeholders’ comments revealed differences in interpretation of the legislation
regarding the indicator, the target setting and ‘exceptional events’.
7.2.2 CAP 02: Stakeholders had many comments about the existing ATFM delay causes (including
ANS controllable / attributable delay); about how delays are classified into the various
categories, and about the lack of transparency into the process for attributing delays.
7.2.3 CAP 03: Stakeholders queried the likely benefits to be gained through SESAR deployment in
RP2.
7.2.4 CAP 04: Stakeholders queried the link between Union-wide capacity targets and local
capacity targets especially regarding traffic levels, traffic complexity, and local capacity
management.
7.2.5 CAP 05: Stakeholders queried the specific relationship between the cost of additional
capacity and the cost of delay.
7.2.6 CAP 06: Stakeholders queried the relationship between capacity performance and cost
effectiveness.
7.2.7 CAP 07: Stakeholders queried the possibility of setting capacity targets according to traffic
levels, or using bands of capacity performance.
7.2.8 CAP 08: Stakeholders queried the ability to implement capacity enhancements within the
timeframe of RP2.
7.3 New elements considered by the PRB
7.3.1 PRB considered that during the period following the stakeholder consultation to the
publication of this report there were no further elements emerging which could have affected
the PRB analysis and / or suggested targets.
7.4 PRB opinion
CAP 01
7.4.1 The indicator, as defined in legislation, and the target setting include ALL causes of en route
ATFM delay. The legislation makes it clear that when the EACCC has been activated by the
Network Manager as a result of an abnormal reduction in ATM capacity, the delay associated
with such a capacity shortfall will not be considered in the capacity performance monitoring.
However, such delay shall be recorded and highlighted in the annual monitoring report of the
performance scheme.

PRB advice to the Commission in the setting of Union-wide performance targets for RP2
34
CAP 02
7.4.2 The PRB understands that ANSPs are not able to control all aspects of ATFM delay. The PRB
is also conscious of the limitations of today’s system for monitoring and attributing delays:
delays are often due to multiple factors rather than a single delay cause; the decision on the
attribution of delay is the responsibility of the local FMP asking for the regulation; there is no
auditing process for ensuring that delays are attributed in a consistent manner across the
network. The legislation defines the indicator as including ALL causes of ATFM delay. By
monitoring and targeting all delay causes, the improvement of one or more categories will see
an improvement in overall performance but the inconsistencies in particular delay attribution
will not have an effect on the performance scheme.
CAP 03
7.4.3 The PRB gave stakeholders examples of expected capacity improvements, including SESAR
related improvements, in the consultation document in order to show stakeholders that the
PRB had considered the possible capacity enhancements that may arise. The PRB does not
consider that the deployment of SESAR is a critical enabler in meeting the targeted capacity
performance, the PRB believes that more effective use of existing technology and processes,
such as Flexible Use of Airspace, can produce the required improvements at network level.
CAP 04
7.4.4 Although this consultation was specifically focussed on the setting of a Union-wide target for
capacity during RP2, the PRB is conscious that the delivery of Union-wide performance
depends entirely upon local capacity performance. The network is constructed of individual
traffic configurations within individual ATC sectors, within individual sector groups, within
individual ACCs, within individual FABs. The characteristics which apply in a specific case
do not apply across the network, and vice versa.
7.4.5 The PRB considers that the Network Manager, in consultation with the FABs, should break
down the Union-wide targets to FAB level.
7.4.6 Individual FABs should then, with the assistance and expertise of the Network Manager,
break down the FAB targets into local targets, based on the constraints and opportunities that
apply at local level.
CAP 05
7.4.7 As explained above, whilst the PRB considers that the relationship is valid at network level, it
has accepted that this will not always apply in specific cases. The PRB would suggest,
however, that the onus should be on an ANSP to show that all options for improving capacity
have been considered and judged unsuitable based on factual evidence, rather than a
preconception.
CAP 06
7.4.8 PRB considered that the same arguments provided for the relationship between the cost of
additional capacity and cost of delays (cfr. § 7.4.7 above) are also applicable to this query.
CAP 07
7.4.9 Since the legislation requires the capacity target to be set in terms of delay, and notified to
Member States in advance of the start of the reference period, it is impossible to set capacity
targets according to traffic levels. However, it is possible for individual FABs to consider the
differing traffic levels within the FAB and manage the required contribution from each ACC
or sector group accordingly.

PRB advice to the Commission in the setting of Union-wide performance targets for RP2
35
CAP 08
7.4.10 The performance scheme was established to improve the provision of air navigation services
to airspace users. The PRB has noted the tendency for ANSPs to reduce or postpone existing
capacity plans whilst providing a level of capacity that is inconsistent with the requisite effort
to meet the Union-wide capacity target, and then relying on the superior performance of other
ANSPs to counteract the shortcoming. Since capacity enhancements require a significant lead-
time to implement, the PRB is concerned about the strategy of some ANSPs that are not
implementing sufficient plans now, and wonders how they will be able to respond to any
future growth in traffic levels.
7.5 PRB recommendations for RP2 Union Wide Capacity Targets
7.5.1 Taking due consideration of the stakeholder feedback received as part of the consultation
process the PRB reviewed the target setting process, including the methodology, for capacity.
7.5.2 Following discussions with the Network Manager, the PRB recommends that the Network
Manager should be accountable for the Union-wide capacity performance, with individual
FABs being accountable for their respective FAB capacity performance.
7.5.3 The PRB recommends that the Union-wide target should be broken down to FAB level by the
Network Manager, in consultation with the FABs.
7.5.4 The PRB recommends that both the Union-wide targets and FAB targets should be binding for
each year of the reference period.
7.5.5 Table 16 below shows the proposed Union-wide en route Capacity target, which the PRB
considers challenging but achievable.
7.5.6 The PRB accepts the statement made by several stakeholders that capacity improvements take
time to be delivered and therefore strongly recommends that Member States, together with the
Network Manager, address existing capacity shortfalls and give sufficient priority to
implementing additional capacity in advance of traffic growth.
KPI Target 2015-2019
Minutes of en route ATFM delay per flight 0.5
Table 16: Capacity proposed Union-wide targets for RP2
7.5.7 In proposing this target, PRB considered the past experience. According to PRB analysis, 0.5
minutes of delay per flight is equivalent to more than 98% of flights not constrained by ATC,
and this is considered to be acceptable. The focus in this coming RP will need to be on those
flights which suffer lengthy delays. This issue is expected to be addressed in the Network
Manager’s Strategy and Operational Plans.

PRB advice to the Commission in the setting of Union-wide performance targets for RP2
36
8 RP2 Union-wide Cost Efficiency target
8.1 PRB Initial Proposal
8.1.1 The Consultation Document published in May 2013 presented the detailed analysis
undertaken to support the PRB’s initial proposed range for the Cost Efficiency KPI target. The
analysis included consideration of:
Historical trends in the ATM industry;
The cost structure for ANS provision;
A comparison against continental US;
Intra-ANSPs group benchmarking;
Econometric benchmarking; and
Cross-industry productivity trends.
8.1.2 In the May 2013 Consultation Document, the PRB described the methodology used to
determine the starting point for the cost-efficiency Union-wide targets for RP2. In particular,
the PRB considered that the starting point shall refer to the year 2014 (last year of RP1). The
starting point shall be expressed in terms of en-route costs and then converted into unit costs
using the latest STATFOR traffic forecasts. The PRB also considered that the starting point
shall reflect the results of the traffic risk sharing mechanism and therefore possible cost
reduction measures implemented by the SES States over RP1 in response to the lower traffic
growth than planned.
8.1.3 The PRB proposed using a starting point based on the determined costs (DCs) underlying the
Union-wide target adopted by the EC (€6,179M). The PRB considered that this amount which
is some €127M lower than the determined costs provided in the adopted NPPs (€6,306M)
allowed reflecting the impact of potential cost reduction measures on States costs in 2014 and
also to maintain the EC original level of ambition for RP1.
8.1.4 Based on the results arising from the technical evidences and considering that the Performance
Scheme in RP2 should bring significant improvements in cost-efficiency performance, the
PRB proposed reductions in total en-route determined costs ranging from -1.0% p.a. to -3.0%
p.a. between 2014 and 2019 (see Table 17 below).
Determined Unit Cost for en route air navigation services (€2009)
En-route ANS costs (2009) Determined costs from EC
Decision (2014)
Range proposed by the PRB (for
the year 2019)
€6,248M €6,179M
€5,876M - €5,306M
(-1.0% to -3.0% p.a. compared to
the determined costs arising from
the EC Decision in 2014)
Table 17: PRB consultation proposal – Cost Efficiency
8.1.5 The PRB computed that, considering STATFOR February 2013 SUs forecasts, this would
lead to reducing the en-route Determined Unit Costs (DUC) by -2.5% p.a. to -5.8% p.a.
between 2014 and 2019.

PRB advice to the Commission in the setting of Union-wide performance targets for RP2
37
8.2 Stakeholders’ comments
8.2.1 In the following section we summarise the stakeholders’ comments received during the
consultation under the key questions and themes:
Technical evidence:
ECO 01 Stakeholders showed greatest support for use of historic data and intra-ANSP
benchmarking; the least support was for econometric and productivity analysis.
Stakeholders expressed mixed views on US-Europe comparison.
8.2.2 There was greatest support for use of historic data and intra-ANSP benchmarking and least
support for econometric and productivity analysis. Views the US-Europe comparison were
along stakeholder lines:
For the airspace users (IATA, AEA, IACA, ERA, LOT and Ryanair), the US-Europe
analysis is of high relevance. They consider that the EU/US comparison “is the best
available basis for setting targets” even if it is not at “the efficiency frontier”;
For the ANSPs, NSAs and States, the US-Europe analysis is of low relevance. They
state that the two systems and networks are not comparable for regulatory, social,
cultural and legal reasons.
8.2.3 A number of Airports suggested comparisons with other ANSPs outside Europe, and ANSPs
argued that over the period examined Europe had performed comparatively better than the US,
by closing the gap. Some ANSPs and NSAs argued that projected future performance was
also important for the PRB to take into consideration.
8.2.4 On the evidence based on the ANSP benchmarking, an ANSP (NAV Portugal) criticised the
size of groups (as being too small) leading to results which are not robust. Aena viewed the
general evidence presented as not robust enough to set targets.
Importance of historic trends:
ECO 02 Stakeholders showed majority support for analysing historical trends, however many
noted that one-off events and/or local circumstances should be taken into account, as well
as performance in RP1.
8.2.5 There was some support from all stakeholder types for analysing historic trends and noting
that trends can be useful for future. However one-off events (NSA), local circumstances and
legacy changes that have already taken place need to be considered (ANSPs). Some believe
volatility in the business means looking at history is not useful. A limited number of
NSAs/ANSPs stated that step changes from FABs and SESAR mean these trends need to be
amended. Most airline respondents believe history reflects the cost recovery mechanism so is
not relevant in a performance regime environment. PANSA stated that the analysis needed to
recognise that some States did not make enough effort in RP1.
Influence of co-operation initiatives:
ECO 03 Stakeholders had mixed views on the potential for co-operation initiatives, with FAB
performance to date and lack of political will cited as constraints.
Most stakeholders believe that co-operation improvements will not materialise until the
end of RP2.
8.2.6 Some ANSPs and NSAs believe co-operation initiatives are possible in medium term
(procurement, training, operational solutions – Free Route Airspace). Some Airlines are
sceptical, highlighting the lack of benefits from FABs, and the realisation of restructuring
PRB advice to the Commission in the setting of Union-wide performance targets for RP2
38
costs that need to be taken into account. Some ANSPs believe a lack of political will
constrains likely benefits. NATS identified different sources of co-operation benefits such as
common approaches to AIS provision, FDP procurement and programme management for
example when introducing Free Route Airspace.
8.2.7 Most States and ANSPs respondents believe that any improvements will only materialise in
the long-run towards the end of RP2 or RP3.
Support costs provide the greatest opportunities for improvement:
ECO 04 Stakeholders suggested a spectrum of sources for cost improvement opportunities, with
the most common support being for support cost, ATCO (and training) cost areas.
A number of stakeholders stated that the source of cost reduction opportunities is a
decision that should be left to the State/FAB.
8.2.8 Airlines and the Eurocontrol Agency agree that support costs provide the greatest scope for
improvement. However in addition, some Airlines and two ANSPs consider ATCO costs (and
training costs) need to be addressed, linked to findings from the US-Europe comparison.
Some view savings need to come from a spectrum of sources (NSAs and ANSPs
representative), including investments and cost of capital (Airlines), separation of services (an
airline), and centralised services (Eurocontrol Agency). A number of ANSPs and NSAs view
this as a micro-management issue that is not for the PRB and should be left to the State/FAB.
Capital expenditure programme will remain around €1 Billion per annum:
ECO 05 Stakeholders agreed on the need for capex rationalisation and the importance of linkage
to the SESAR timetable.
Some stakeholders noted that the delay of capex in RP1 may have implications in RP2.
8.2.9 Stakeholders agree that there are opportunities for rationalisation and that the outcome
depends on the SESAR deployment programme timetable. Some ANSPs, NSAs and staff
representatives assess that widespread postponement of capex in RP1 may have implications
for catch-up in RP2. Airlines and UK Authorities consider a programme of much smaller scale
is needed. A number of ANSPs, and CANSO linked the level of capex to the agreed SESAR
outcome.
Total cost basis of targets:
ECO 06 Stakeholders generally accept that splitting total costs from the traffic-determined unit
costs is sensible, although there is disagreement about the level of ambition proposed.
The importance and potential unpredictability of traffic forecasts was widely noted.
8.2.10 There was some recognition from ANSPs, Airlines and NSAs that basing the analysis on
reductions in total costs rather than DUCs is sensible. The importance of traffic forecasts,
largely outside ANSP control was emphasised, and some ANSPs raised the point that the
interaction between total costs and traffic needs to be recognised by the PRB.
8.2.11 Some Airlines were concerned that traffic will be underestimated when setting the targets,
while the unpredictability, variability of traffic is a consideration which might lead to
increased risk premium according to some ANSPs, NSAs and staff representatives
respondents.

PRB advice to the Commission in the setting of Union-wide performance targets for RP2
39
Proposed range:
ECO 07 Stakeholder comments on the proposed range were aligned within stakeholder groups,
with ANSPs and NSAs generally preferring the lower end of the range and airspace users
the higher end.
8.2.12 Responses were clearly based on stakeholder groups, with ANSPs and NSAs generally
proposing the bottom value of the range (en-route DUC reduction of -2.5% p.a.) and Airlines
heading to the top of the range (en-route DUC reduction of -5.8% p.a.). A number of ANSPs
said that the proposed level of ambition was too high and that some of the initiatives which
could be implemented to achieve this level of costs reduction could lead to significant
restructuring costs over the period.
8.2.13 Some staff organisations proposed a freeze in the current DUC, while some ANSPs and staff
representatives suggested a freezing of the total cost base. It was recognised that the final
traffic projections should influence the final level of ambition of the targets.
8.2.14 The starting point proposed was criticised by Airline trade associations which consider that
the proposed starting point of costs underlying the RP2 Union-wide target should be adjusted
for cost efficiencies achieved in 2012.
8.2.15 CANSO proposed that the starting point should be the aggregate of local cost efficiency
targets for 2014 in the revised and approved Performance Plans, and adjusted to reflect the
latest STATFOR traffic forecasts.
8.2.16 Finally, two ANSPs emphasised the need to recognise the local specificities which affect the
starting point of particular States (e.g. level of traffic in 2014 compared to planned) as these
impact on the contribution of the local/FAB cost-efficiency target to the Union-wide target.
Terminal Air Navigation Services (TANS):
ECO 08 Stakeholders generally supported setting TANS targets at local level, although there was
some dissent (suggesting no targets or monitoring only).
A number of NSAs and ANSPs considered the data required to set terminal targets is not
mature enough.
8.2.17 There was some support for the PRB approach as some analysis based on gate-to-gate ANS.
Some Airlines respondents and one State respondent support the application of the same
targets as set for the en-route segment, as it avoids incentives for changing allocation of costs.
A number of NSAs, ANSPs and Staff representative respondents viewed that Terminal Air
Navigation Services (TANS) should be left to local targets. A number of ANSPs viewed that
local targets should be retained until the 2015 consultation and 2017 implementation
contained in the legislation and that the indicative target goes against better regulation
principles.
8.2.18 A number of NSAs and ANSPs considered that the data was not mature enough, or that the
traffic forecasts were not reliable enough and terminal area definition were not mature enough
to set targets.
8.3 PRB opinion
8.3.1 This section provides the PRB’s high level response to Stakeholders views, categorised under
the same key themes as presented above in Section 4.2 above .
ECO 01 – Technical evidence
8.3.2 In the May document, the PRB presented the results of a range of evidence which provides a
robust basis for setting Union-wide targets. This analysis showed that there is a potential
scope for improving cost-efficiency and reducing unit costs in a range of -10% to -40%.
PRB advice to the Commission in the setting of Union-wide performance targets for RP2
40
Achieving significant unit costs reductions, in particular the upper bound of the range (-40%)
requires a step change approach and genuine costs reductions. However the PRB also
recognised the need to balance these over time to avoid unnecessary disruption and too high
risks to service delivery.
8.3.3 The May document also recognised some of the advantages and limitations of the different
approaches identified by stakeholders. This has led to the PRB placing greater emphasis on
intra-ANSP and US-Europe comparisons which are based on data and analysis which have
been refined over a ten-year period. The PRB still considers that the US-Europe comparison is
relevant for assessing the potential scope for cost-efficiency improvement over the long run.
8.3.4 The PRB has carefully considered the size of ANSPs groupings trying to balance on the one
hand the relevance of the ANSPs within a groups to ensure ”like-with-like” comparison and
on the other hand the number of ANSPs to infer the potential scope for improvement.
ECO 02 – Importance of historic trends
8.3.5 As discussed below, the PRB has taken full account of the latest historic data and traffic and
cost projections when proposing its Union-wide targets. The ability during 2012 of States and
their ANSPs to control and reduce costs, described in paragraph 8.4.5 below, in response to
reduced traffic demonstrates the effectiveness of the incentives provided by the Charging
Scheme regulation and that there is flexibility to adapt to prevailing circumstances in the
industry.
8.3.6 At the same time the PRB is mindful that RP1 was considered as a transition RP and that in
the subsequent RPs greater cost-efficiency improvements should be achieved as part of the
High Level Goals of the SES. In the May 2013 consultation document, the PRB considered
that in addition to expected rigorous cost reductions; in particular in the area of support costs,
there is scope for a 'step change' improvement in the cost-efficiency performance of European
ANS. For example:
The US-Europe comparison shows that SES unit costs are still 39% higher; and
The benchmarking showed that if all ANSPs improve to the average in their group there
is a potential unit costs reduction of 3.6% whereas if all improve to the level of the
ANSP which has the lowest unit costs in the comparator group an improvement of
11.3% would be achieved.
ECO 03 – Influence of co-operation initiatives
8.3.7 The PRB assesses that based on the tools/mechanisms provided by the legislation and also
based on some evidence (e.g. current technological alliances) there are real opportunities for
cost efficiency improvements through genuine and effective co-operation initiatives, which
will be determined by FABs, States and ANSPs ambition and willingness to change. It also
recognises that these changes will at times lead to up front restructuring costs meaning that net
benefit take some time to materialise. This is reflected in the proposed profile for RP2 targets
(see below).
ECO 04 – Support costs
8.3.8 The PRB recognises that it is for FABs, States and their ANSPs to determine their own cost
efficiency improvements. The purpose of the analysis conducted is to demonstrate potential
and provide suggestions of possible areas for improvement on a Union-wide basis,
considering that support costs account for some 70% of ANSPs costs. It is not for the PRB to
micro-manage the operations and the business.
ECO 05 – Capital expenditure
8.3.9 The PRB has taken into account the latest information provided by the SESAR Joint
Undertaking, on the Pilot Common Project as well as the slowdown in traffic during the early
part of RP1 when considering that across SES States €1 billion remains a very reasonable total
value for capex per annum.

PRB advice to the Commission in the setting of Union-wide performance targets for RP2
41
ECO 06 – Total costs basis
8.3.10 The PRB recognises the importance of the interaction between total costs and traffic forecasts
when setting the Union-wide DUC target. However, while traffic is expected to increase, in
RP2 there remains opportunity for genuine cost reductions (optimising cost structures,
reducing inefficiencies) in order to achieve the SES goals and its expected performance
improvements.
ECO 07 – Proposed range
8.3.11 The PRB has taken stakeholder views into consideration in proposing its targets for the en-
route DUC, outlined in more detail below. The PRB recognises the need for such targets to be
both realistic and ambitious.
8.3.12 The PRB recognises that the Union-wide starting point to set the target is a key issue and that
several options can be considered. The PRB is mindful that the planned traffic in 2014 will not
materialise at Union-wide level and that States/ANSPs are expected to collectively decrease
their cost-bases compared to those arising from the NPPs, as demonstrated by States/ANSPs
behaviour in 2012. The PRB is conscious that this element needs to be taken into account.
Further details on the setting of the starting point for RP2 Union-wide cost-efficiency targets
are provided in Section 8.5 below.
8.3.13 The PRB is mindful that local circumstances and specificities need to be accounted for as part
of the assessment of the local/FAB contribution to the Union-wide target that will be carried
out by the PRB in the Summer 2014.
ECO 08 – Terminal Air Navigation Services
8.3.14 The PRB will continue to collect data and monitor developments in TANS (and how it is
developing compared to the en-route segment) ahead of compiling advice to the European
Commission in 2015, as determined by legislation. At that time the decision on the
implementation of Union-wide TANS DUC targets will be made.
8.3.15 Local targets will be set according to legislation from the start of RP2, on the basis of the
determined costs method and associated risk sharing arrangements as provided for in the
Charging Scheme Regulation.
8.4 New elements considered by the PRB
8.4.1 Since the proposed targets were published in May, the following new evidence has become
available:
September 2013 STATFOR traffic forecasts;
Actual 2012 en-route costs;
Planned en-route costs for the period 2015-19, submitted by SES States in June 2013;
Input from Stakeholders Consultation; and
Impact of the SESAR JU’s proposal for a Pilot Common Project (PCP).
September 2013 STATFOR traffic forecasts
8.4.2 In 2012, the actual traffic measured in terms of SUs was -4.5% lower than planned by the
States in their RP1 performance plans. According to the traffic risk sharing mechanism which
is embedded in the charging regulation, this difference resulted in a net loss of revenues for
the States/ANSPs amounting to some -€145M in 2012.
8.4.3 According to the September 2013 STATFOR forecasts, traffic volumes are expected to be
substantially lower than planned by the States in their NPPs for 2013 (-5.8%) and 2014
(-6.2%) (see Figure 8-1). If these traffic forecasts materialise, States/ANSPs actual en-route
costs in 2014 would have to be €173M lower than the determined costs in the adopted NPPs in
order to compensate for the losses in en-route revenues.

PRB advice to the Commission in the setting of Union-wide performance targets for RP2
42
Figure 8-1: Actual and planned traffic compared to information provided in NPPs for RP1
8.4.4 The traffic forecasts issued by STATFOR in September 2013 are more optimistic than those
released in February 2013 and reflected in the Consultation Document. Indeed, while
according to September forecasts the number of SUs is expected to slightly increase in 2013
(+1.4%), the February forecasts planned for a decrease of -0.8%. On the other hand, the traffic
growth planned between 2014 and 2019 (+2.6% p.a.) in STATFOR September forecasts is
slightly lower than that provided in February (+3.0% p.a.). Further detail is provided in
§ 2.4.3.
Actual 2012 en-route costs
8.4.5 Across the SES States, actual 2012 en-route costs (€6,053M) were slightly higher than in 2011
(+1.3%) but substantially lower (-€205.6M or -3.3%) than the determined costs reported in the
adopted NPPs (€6,258M). In a context of lower traffic than expected (-4.5%), most of the SES
States were in a position to revise their en-route cost-base downwards, overall by more than
the loss of revenue, and therefore could avoid financial losses. Many of them could even
maintain the profit margin determined ex-ante in their NPP through the cost of capital despite
losses in en-route revenues. This is a noteworthy achievement which indicates that the
financial incentives embedded within the charging scheme already provided some results for
the first year of RP1.
8.4.6 The PRB carried out a preliminary analysis to identify the main drivers underlying the
substantial difference between actual and determined costs observed in 2012 (€205.6M). Not
surprisingly, this analysis suggests that most of the cost savings achieved in 2012 relate to
lower other operating costs (-€107.0M or -7.1%) and depreciation costs (-€62.1M or -7.9%) as
shown in Figure 8-2 below. These are costs categories which show a certain degree of
downwards flexibility in the short to medium-term. The lower other operating costs mainly
reflect lower maintenance and energy costs and lower costs arising from the renegotiation of
contractual arrangements with suppliers. On the other hand, the lower depreciation costs in
2012 are mainly due to the postponement of capital expenditures (capex) to future years.
Actual staff costs are -€37.5M (-1.0%) lower than planned, this difference is mainly due to a
lower number of actual staff than planned (especially support staff in the corporate and
administrative areas).
90
100
110
120
130
2009 2010 2011 2012 2013 2014
Ac
tua
l T
SU
/ T
SU
Fo
rec
as
t v
s. N
PP
TS
U (T
SU
s
mil
lio
ns
)
TSUs baseline (STATFOR Sept. 2013) TSUs High and Low (STATFOR Sept. 2013)
NPP TSUs (+/- 10% threshold) Actual TSUs
According to STATFORbase case, 2014 traffic is expected to be -6.2% lower than planned in the NPPs for RP1

PRB advice to the Commission in the setting of Union-wide performance targets for RP2
43
Figure 8-2: 2012 actual costs compared to determined costs in adopted NPPs
8.4.7 The PRB considered that the savings achieved on the staff costs and other operating costs
(€144.4M or some 70% of the total savings) are mostly associated with structural measures
which are expected to generate benefits during the remainder of RP1.
8.4.8 Given that in 2013 and 2014 actual traffic is expected to be significantly lower than planned in
the adopted NPPs (-5.8% and -6.2% according to STATFOR base case forecasts), SES States
will have a clear incentive to continue the efforts made in 2012 to revise their determined
costs downwards until the end of RP1.
SES States planned en-route costs for 2015-2019 (June 2013 data submissions)
8.4.9 In June 2013, SES States provided planned en-route costs data for the period 2015-2019.
Figure 8-3 below indicates that for all the SES States as a whole, 2015 en-route costs
(€6,138M) are expected to be -€168M (or -2.7%) lower than the determined costs provided for
the year 2014 in the adopted NPPs (€6,306M). This is a clear indication that in a context of
lower traffic than expected, SES States plan to continue the cost reduction/containment
measures implemented in 2012 in order to compensate for the losses in en-route revenues
expected for 2013 and 2014.
8.4.10 Figure 7 shows that, at Union-wide level, 2015 en-route costs are planned to be +1.4% higher
than 2012 actual costs (€6,053M). This difference is mainly due to the fact that for Germany
2015 en-route costs are +13.6% higher than 2012 actuals. Germany, which represents some
15% of the Union-wide en-route costs, indicated that the preliminary planned en-route costs
profile provided in June 2013 would be revised downwards to reflect the cost-containment
measures that will be implemented by the German ATSP (DFS) over the 2015-2019 period.
The PRB computes that if Germany planned en-route costs in 2015 are in the same order of
magnitude as actual 2012 costs, then at Union-wide level the en-route costs planned for 2015
would be close to 2012 actuals (€6,053M) and significantly lower than the determined costs
provided in the adopted NPPs (€6,306M).

PRB advice to the Commission in the setting of Union-wide performance targets for RP2
44
Figure 8-3: Actual 2012 en-route costs, RP1 determined costs and States plans for 2015-2019
8.4.11 Figure 8-3 also indicates that States plan for flat en-route cost-bases over the 2015-2019
period (+0.03% p.a.). This significantly contrasts with the range of determined costs reduction
that was considered by the PRB in the May 2013 Consultation Document (-1.0% p.a. to -3.0%
p.a.). This suggests that States have not yet taken into account the need for a step change in
cost-efficiency performance over RP2.
8.4.12 The questionnaire which was part of the Stakeholder Consultation process in May-July 2013
comprised a specific question relating to the level of ambition for the RP2 Union-wide targets,
and in particular on the range of en-route costs reductions proposed by the PRB.
8.4.13 Airspace users mainly considered that the range proposed by the PRB was not ambitious
enough. On the other hand, most States/ANSPs consider that the ranges of en-route costs
reduction considered by the PRB over RP2 are too ambitious. This is consistent with the
planned en-route costs data provided in June 2013 which shows a flat profile over the 2015-
2019 period (see Figure 8-3 above). The PRB notes that the feedback received from the
Stakeholders Consultation did not include clear and detailed information on the level of
restructuring costs that would be required to support an ambitious en-route costs reduction
profile over RP2.
8.4.14 On the other hand, three ANSPs (EANS, LGS and NATS) considered that the range of
determined costs reduction proposed by the PRB over RP2 (-1.0% p.a. to -3.0% p.a.) is
acceptable even if very challenging. It is noteworthy that NATS already planned for en-route
costs reductions over the 2015-2019 period (-1.3% p.a.). Similarly, the UK National
authorities indicated that the PRB proposal was acceptable and fully supported.
Impact of the Pilot Common Project
8.4.15 In July 2013, the PRB has been informed about the SESAR JU’s proposal to the EC on the
content of a Pilot Common Project (PCP) [Ref. xiii].
8.4.16 The PRB understands that for RP2, the main benefits arising from the implementation of this
project are mainly relating to operational improvements in en-route flight-efficiency
(environment KPI) and terminal operations. This high level analysis indicates that overall the
benefits of in terms of cost-efficiency improvements are negligible for RP2.
8.4.17 The PRB also understands the magnitude of the capex associated with the PCP is around
€150M per year over the 2014-2030 period. The PRB considers that the investments needed
for this PCP can be absorbed within the current capex envelope (circa €1B per year), and that
the PCP should not be an excuse for increasing the capex planned over RP2.

PRB advice to the Commission in the setting of Union-wide performance targets for RP2
45
8.5 PRB recommendations for RP2 Union Wide Cost-Efficiency Targets
8.5.1 The new information described in Section 8.4 above has been taken into account by the PRB
when preparing its final proposal on Union-wide cost-efficiency targets for RP2.
8.5.2 The PRB considers that the choice of starting point and the level of ambition are closely
related and should form a consistent proposal to maintain continuity of strong incentives and
level of effort from RP1 to RP2, to allow for greater efforts in the second part of RP2 and to
allow airspace users to benefit early in RP2 from cost reductions achieved in RP1.
Starting point (expressed in terms of en-route costs)
8.5.3 In the May 2013 Consultation Document, the PRB proposed using a starting point based on
the DCs underlying the Union-wide target adopted by the EC (€6,179M). The PRB also
signalled that the starting point should reflect the results of the traffic risk sharing mechanism
duly taking into account the 2012 outturn.
8.5.4 The following three options have been considered by the PRB to set the starting point in 2014
for RP2 Union-wide cost-efficiency targets (see Figure 8-4 below):
Option 1: the starting point is based on the 2014 determined costs underlying the
Union-wide target adopted by the EC (€6,179M).
Option 2: the starting point is the States’/ANSPs’ aggregated determined costs for 2014
in the adopted Performance Plans, reduced by the expected losses in en-route revenues
for 2014. As detailed in §8.4.3 above, based on STATFOR base case forecasts and
according to the traffic risk sharing arrangements, the lower traffic than planned in 2014
would result in potential losses in en-route revenues of €173M for the SES
States/ANSPs. If this situation materialises, States’/ANSPs’ actual en-route costs in
2014 would have to be €173M lower than the determined costs in the adopted NPPs to
compensate for the losses in revenues. Therefore, according to Option 2, the starting
point for RP2 would be €6,133M (i.e. €6,306M - €173M).
Option 3: the starting point is the States’/ANSPs’ aggregated determined costs for 2014
reduced by the actual savings observed in 2012 (i.e. €206M). According to Option 3,
the starting point for RP2 would be €6,101M (i.e. €6,306M - €206M).
8.5.5 In the light of the new elements available, it was decided not to retain Option 1 (€6,179M).
Option 1 is the highest starting point amongst the three options. Based on the 2012 outturn, it
is highly likely that in 2014 States/ANSPs will be in a position to significantly revise
downwards the cost-bases compared to the NPPs and to offset the decrease in revenues
resulting from the traffic risk-sharing arrangements. Thus, the actual 2014 en-route costs are
likely to be lower than those considered under Option 1. In this context, using a starting point
of €6,179M would, all else being equal, translate into a higher total determined cost base to be
charged to airspace users in the first years of RP2 than in Options 2 and 3. The PRB does not
consider this would be justified.
8.5.6 Similarly, it was also decided not to retain Option 3 (€6,101M) which would explicitly assume
that the totality of the observed savings in 2012 (€206M) could also be achieved in 2014. The
2012 States monitoring analysis indicates that around 1/3 of the savings could be related to the
postponement of costs and about 2/3 relating to structural measures which are expected to be
sustained throughout RP1. In addition, Option 3, by considering higher cost reductions
(€206M) than those which could be needed to offset the expected losses in revenues in 2014
(€173M), could reduce the opportunity for States/ANSPs to have lower costs than planned
already in the first years of RP2 and hence to be in good shape to start RP2.
8.5.7 The PRB therefore proposes Option 2 for setting the starting point for RP2 Union-wide targets
based on the following points:
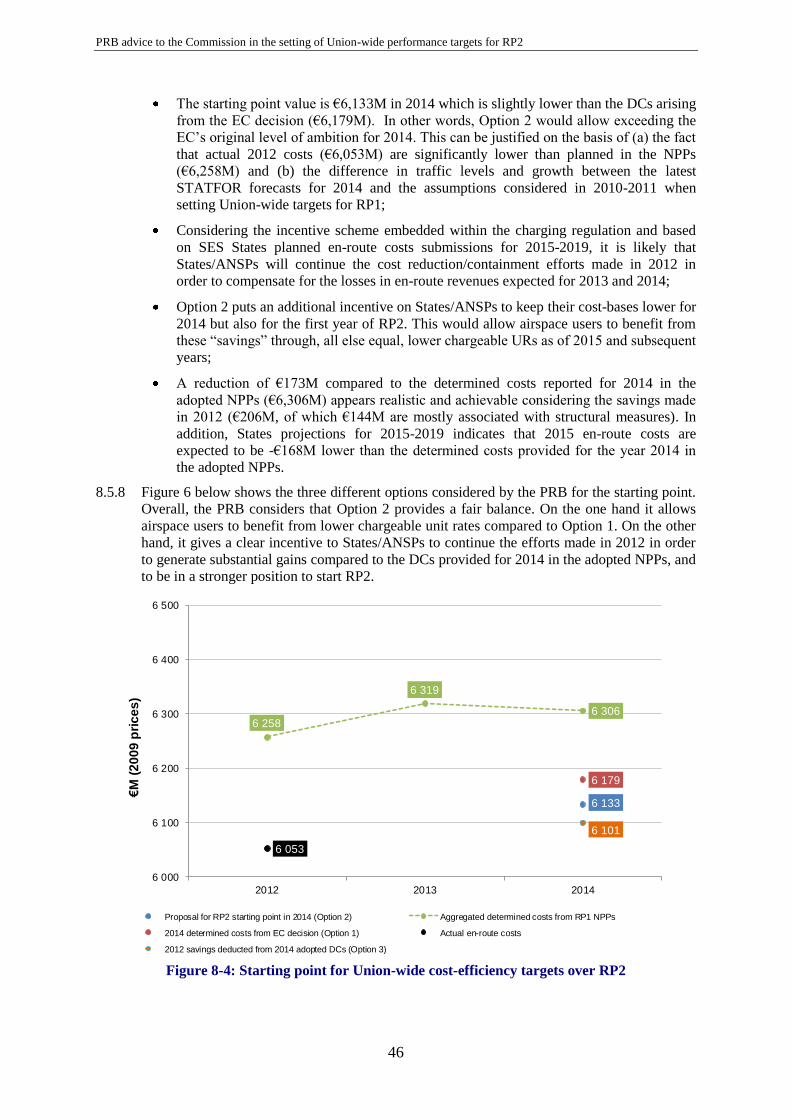
PRB advice to the Commission in the setting of Union-wide performance targets for RP2
46
The starting point value is €6,133M in 2014 which is slightly lower than the DCs arising
from the EC decision (€6,179M). In other words, Option 2 would allow exceeding the
EC’s original level of ambition for 2014. This can be justified on the basis of (a) the fact
that actual 2012 costs (€6,053M) are significantly lower than planned in the NPPs
(€6,258M) and (b) the difference in traffic levels and growth between the latest
STATFOR forecasts for 2014 and the assumptions considered in 2010-2011 when
setting Union-wide targets for RP1;
Considering the incentive scheme embedded within the charging regulation and based
on SES States planned en-route costs submissions for 2015-2019, it is likely that
States/ANSPs will continue the cost reduction/containment efforts made in 2012 in
order to compensate for the losses in en-route revenues expected for 2013 and 2014;
Option 2 puts an additional incentive on States/ANSPs to keep their cost-bases lower for
2014 but also for the first year of RP2. This would allow airspace users to benefit from
these “savings” through, all else equal, lower chargeable URs as of 2015 and subsequent
years;
A reduction of €173M compared to the determined costs reported for 2014 in the
adopted NPPs (€6,306M) appears realistic and achievable considering the savings made
in 2012 (€206M, of which €144M are mostly associated with structural measures). In
addition, States projections for 2015-2019 indicates that 2015 en-route costs are
expected to be -€168M lower than the determined costs provided for the year 2014 in
the adopted NPPs.
8.5.8 Figure 6 below shows the three different options considered by the PRB for the starting point.
Overall, the PRB considers that Option 2 provides a fair balance. On the one hand it allows
airspace users to benefit from lower chargeable unit rates compared to Option 1. On the other
hand, it gives a clear incentive to States/ANSPs to continue the efforts made in 2012 in order
to generate substantial gains compared to the DCs provided for 2014 in the adopted NPPs, and
to be in a stronger position to start RP2.
Figure 8-4: Starting point for Union-wide cost-efficiency targets over RP2
6 133
6 258
6 319
6 306
6 179
6 053
6 101
6 000
6 100
6 200
6 300
6 400
6 500
2012 2013 2014
€M
(2
00
9 p
ric
es
)
Proposal for RP2 starting point in 2014 (Option 2) Aggregated determined costs from RP1 NPPs
2014 determined costs from EC decision (Option 1) Actual en-route costs
2012 savings deducted from 2014 adopted DCs (Option 3)

PRB advice to the Commission in the setting of Union-wide performance targets for RP2
47
Level of ambition expected for RP2 in terms of en-route costs reductions
8.5.9 In the Consultation Document released in May 2013, the PRB considered three scenarios with
en-route determined costs reductions ranging from -1.0% p.a. to -3.0% p.a. between 2014 and
2019 (with an intermediate scenario of -2.0% p.a.).
8.5.10 The PRB has decided to discard the scenario focusing on the -3.0% annual reduction of en-
route costs over the five years of RP2. The PRB considers that this very ambitious scenario
may be associated with high delivery risks. Indeed, implementing such en-route costs
reductions would require significant action to be carried out across all the different cost
components of the various ANS services for all SES States. This may lead to substantial
restructuring costs which might not be outbalanced by proper benefits.
8.5.11 As part of the Stakeholders Consultation process, airspace users indicated that it was
important to ensure the provision of an adequate level of capacity in a context of traffic
growth over RP2 (+2.6% p.a. between 2014 and 2019 according to STATFOR base case
scenario, Sept. 2013). It is therefore important to strike a good balance between challenging
and ambitious cost reductions while also ensuring an adequate level of quality of service
performance.
8.5.12 Considering the new elements described in Section 8.4 above, the PRB proposes for RP2 en-
route costs reductions of -1.5% p.a. for 2015-2016 and -2.5% p.a. for 2017-2019 as illustrated
in Table 18 below. This non-linear profile is an explicit recognition that the effort required at
the beginning of RP2 is less demanding to gradually allow for required changes and
adjustments, but that a greater level of effort is expected in the second part of RP2 when all
the different SES mechanisms and instruments should bring benefits.
8.5.13 These annual reductions are equivalent to an average decrease of -2.1% p.a. over 2014-2019,
and would imply removing some €618M from en-route cost-bases. This is in the same order
of magnitude as the intermediate scenario identified in the May 2013 Consultation Document
(-2.0% p.a. over 2014-2019).
Table 18: PRB proposal for en-route costs reductions over RP2
8.5.14 The PRB proposal for the rate of en-route costs reduction over RP2 is based on the following
points:
The PRB proposal for RP2 (-2.1% p.a.) is a step change compared to RP1 in terms of
level of ambition (which for recall was a slight increase in determined costs over 2012-
2014). On the other, lower restructuring costs should be required than in the more
ambitious scenario (i.e., -3.0% p.a. over the five years of RP2), while still generating
substantial gains for airspace users as shown in Figure 8-5 below).
It should be noted that achieving a -2.1% p.a. reduction over RP2, would lead to
determined costs amounting to €5,515M in 2019 which would be:
o -12% lower than in 2009 (i.e. a -1.2% annual decrease on average over a 10 years
period which includes RP1 and RP2); and,
o -9% lower than in 2012 (i.e. a -1.3% annual decrease on average over a 7 years
period).
Starting Point based on Option 2 2014 2015 2016 2017 2018 2019%2019/2014
CAGR
Determined costs (€M) 6 133 6 041 5 950 5 802 5 657 5 515 -2.1%
Annual rate of determined costs reductions -1.5% -1.5% -2.5% -2.5% -2.5%
Changes compared to starting point (M€2009) -92.0 -182.6 -331.4 -476.4 -617.8

PRB advice to the Commission in the setting of Union-wide performance targets for RP2
48
Figure 8-5: States projections and PRB proposal for en-route costs reductions over RP2
A -2.1% annual reduction in en-route costs from the starting point in 2014 would allow
converging towards the SES High Level Goals (HLGs) around 2030 (assuming an
average +2.6% p.a. traffic increase). This is more ambitious than the original assumption
underlying the HLGs which was based on the fact that the decreases in unit costs would
be achieved through increases in traffic while the cost bases would remain constant. The
PRB considers that this higher level of ambition is in line with the expectations
associated with RP2 (step change compared to RP1) and that it would contribute to
substantially increase the competitiveness of the European aviation system.
The modulation of the rate of en-route costs reduction over the period (-1.5% p.a. for
2015-2016 and -2.5% p.a. for 2017-2019) should allow States/ANSPs to gradually adjust
the en-route cost-bases downwards and give time to plan for more substantial cost
reductions in the last 3 years of the RP. In particular, the lower rates of costs reduction in
2015 and 2016 (-1.5% p.a.) could allow them to make investments that would be
potentially required over RP2.
According to the traffic risk sharing arrangements, airspace users will bear a significant
part of the losses in en-route revenues arising from the substantially lower traffic than
planned in 2013 and 2014 (losses which would generate under-recoveries for
States/ANSPs to be recovered through higher user charges in RP2). A -1.5% annual
reduction of en-route costs in 2015 and 2016 would allow reducing the impact of these
under-recoveries on the URs charged to airspace users in the first years of RP2.
The PRB considers that an average reduction in en-route costs of -2.1% p.a. over RP2 is
ambitious but achievable. It makes a start on reducing the cost-efficiency gap (see above)
and is a balanced approach taking account of what could be realistically expected
considering the mechanisms and instruments available to States/ANSPs within the SES
package (e.g. restructuring costs, common projects, etc.). In addition, in the June 2013
submissions, five States (including two of the largest) planned for a reduction in en-route
costs greater than -1.0% p.a. between 2015 and 2019 (Bulgaria (-2.4% p.a.), Spain Cont.
(-1.4% p.a.), the UK (-1.3% p.a.), Slovenia (-1.3% p.a.) and Denmark (-1.3% p.a.)).
Furthermore, as identified in §8.4.14 above, during the Stakeholders Consultation
process three ANSPs (including NATS) considered that the range of determined costs
reduction proposed by the PRB over RP2 is acceptable even if very challenging.
6 133
5 515
6 179
6 306
5 000
5 250
5 500
5 750
6 000
6 250
6 500
2009A 2010A 2011A 2012 2013 2014 2015 2016 2017 2018 2019
RP1 (2012-2014) RP2 (2015-2019)
€M
(2
00
9 p
ric
es
)
Actual en-route costs PRB proposal for RP2 determined costs
2014 determined costs from EC decision Aggregated determined costs from RP1 NPPs
States preliminary en-route costs projections for 2015-2019
Based on aggregated NPPs for RP1, en-route costs were expected to remain fairly constant
between 2009 and 2014.
The proposed RP2 starting point is lower than the costs
arising from the EC decision which are in turn lower than the aggregated determined costs from adopted NPPs. The proposed trend is -1.5%
p.a. for 2015-16, and -2.5%
p.a. for 2017-19, equivalent to an average reduction of -2.1% p.a. over RP2.
Actual 2012 costs (€6,053M) are €206M
lower than in the NPPs.
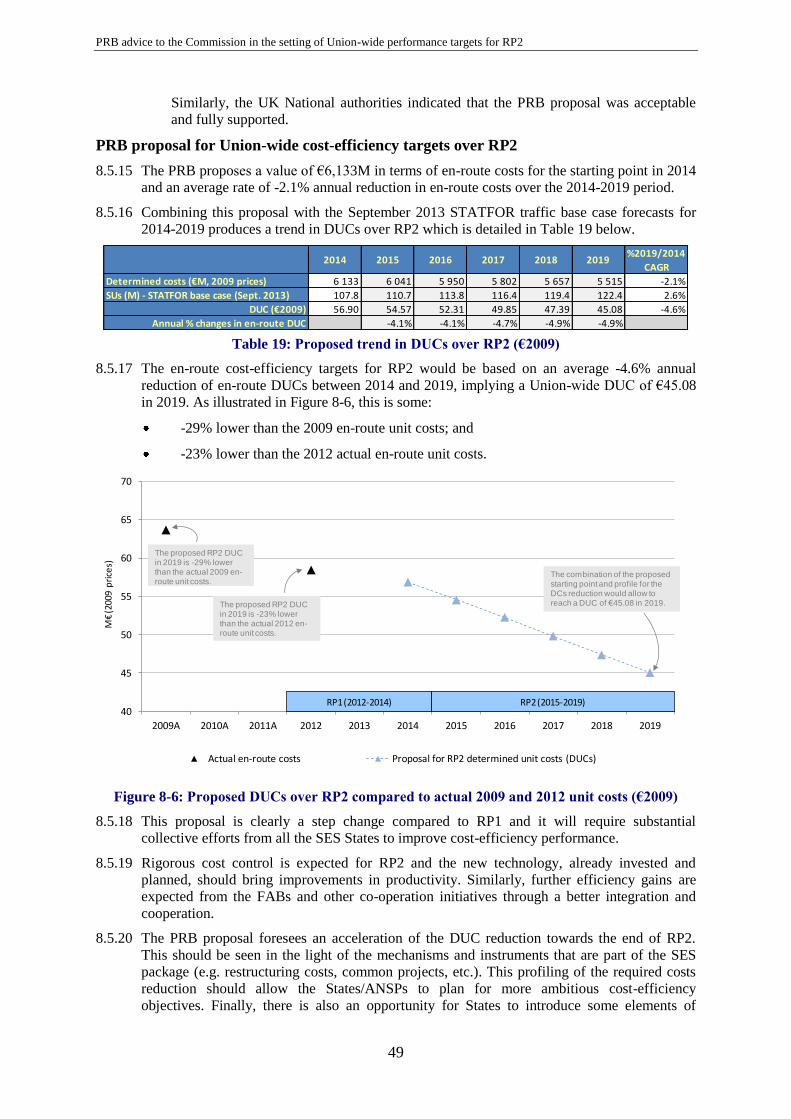
PRB advice to the Commission in the setting of Union-wide performance targets for RP2
49
Similarly, the UK National authorities indicated that the PRB proposal was acceptable
and fully supported.
PRB proposal for Union-wide cost-efficiency targets over RP2
8.5.15 The PRB proposes a value of €6,133M in terms of en-route costs for the starting point in 2014
and an average rate of -2.1% annual reduction in en-route costs over the 2014-2019 period.
8.5.16 Combining this proposal with the September 2013 STATFOR traffic base case forecasts for
2014-2019 produces a trend in DUCs over RP2 which is detailed in Table 19 below.
Table 19: Proposed trend in DUCs over RP2 (€2009)
8.5.17 The en-route cost-efficiency targets for RP2 would be based on an average -4.6% annual
reduction of en-route DUCs between 2014 and 2019, implying a Union-wide DUC of €45.08
in 2019. As illustrated in Figure 8-6, this is some:
-29% lower than the 2009 en-route unit costs; and
-23% lower than the 2012 actual en-route unit costs.
Figure 8-6: Proposed DUCs over RP2 compared to actual 2009 and 2012 unit costs (€2009)
8.5.18 This proposal is clearly a step change compared to RP1 and it will require substantial
collective efforts from all the SES States to improve cost-efficiency performance.
8.5.19 Rigorous cost control is expected for RP2 and the new technology, already invested and
planned, should bring improvements in productivity. Similarly, further efficiency gains are
expected from the FABs and other co-operation initiatives through a better integration and
cooperation.
8.5.20 The PRB proposal foresees an acceleration of the DUC reduction towards the end of RP2.
This should be seen in the light of the mechanisms and instruments that are part of the SES
package (e.g. restructuring costs, common projects, etc.). This profiling of the required costs
reduction should allow the States/ANSPs to plan for more ambitious cost-efficiency
objectives. Finally, there is also an opportunity for States to introduce some elements of
2014 2015 2016 2017 2018 2019%2019/2014
CAGR
Determined costs (€M, 2009 prices) 6 133 6 041 5 950 5 802 5 657 5 515 -2.1%
SUs (M) - STATFOR base case (Sept. 2013) 107.8 110.7 113.8 116.4 119.4 122.4 2.6%
DUC (€2009) 56.90 54.57 52.31 49.85 47.39 45.08 -4.6%
Annual % changes in en-route DUC -4.1% -4.1% -4.7% -4.9% -4.9%
40
45
50
55
60
65
70
2009A 2010A 2011A 2012 2013 2014 2015 2016 2017 2018 2019
M€
(200
9 p
rice
s)
Actual en-route costs Proposal for RP2 determined unit costs (DUCs)
RP1 (2012-2014) RP2 (2015-2019)
The proposed RP2 DUC in 2019 is -23% lower than the actual 2012 en-route unit costs.
The proposed RP2 DUC in 2019 is -29% lower than the actual 2009 en-route unit costs.
The combination of the proposed starting point and profile for the DCs reduction would allow to reach a DUC of €45.08 in 2019.

PRB advice to the Commission in the setting of Union-wide performance targets for RP2
50
competition in the provision of ANS (e.g. market conditions for TANS and for ancillary
services) in order to achieve further cost-efficiency gains.
8.5.21 The PRB is mindful that it is important to keep a long term vision of the cost-efficiency
improvements that are required for the European ANS system. Reducing the en-route DUCs
by an average of -4.6% p.a. is a significant contribution to converge towards the SES High
Level Goals (HLGs) by 2030. The PRB considers that this proposal is realistic and achievable
given current economic and operational context. In view of setting the level of ambition for
RP3, it will be important to consolidate the pace of improvement achieved over RP2 but also
to duly account for the operational requirements and economic context that will prevail in five
years from now.
PRB proposal for Union-wide cost-efficiency targets for RP2 considering addition of
Croatia and minor technical adjustments
8.5.22 When setting the Union-wide cost-efficiency targets for RP2 some adjustments need to be
ensured.
8.5.23 First, according to Annex II of the new Common Charging Scheme regulation (391/2013),
SES States shall report in their NPP for RP2 DCs expressed in real terms and in 2012 prices.
Therefore, for consistency purposes, the DCs provided in Table 19 above have to be converted
into Euros 2012. This adjustment has been reflected in Table 20 below.
8.5.24 Second, the information provided in Table 19 above also needs to be slightly amended to
reflect:
(a) The accession of Croatia to the European Union on the 1st July 2013; and
(b) Minor adjustments relating to the reporting of the costs of exempted VFR flights
following the amendment of the charging and performance Regulations.
8.5.25 Croatia which was not part of the Union-wide target setting process for RP1 will prepare a
National/FAB Performance Plan for RP2. For consistency purposes, Croatia planned 2014 en-
route costs (some €73M in 2012 prices) and SUs forecasts for the 2014-2019 should be taken
into account for setting Union-wide cost-efficiency targets for RP2. These adjustments have
been reflected accordingly in Table 20 below.
8.5.26 The provisions of the Common Charging Scheme (1796/2006) and Performance Scheme
(691/2010) regulations applicable for RP1 established the calculation of the cost-efficiency
KPI (DUR) taking into account total en-route DCs before deduction of the costs for services to
exempted VFR flights. This methodology has been amended in the new Common Charging
Scheme and Performance Scheme regulations (390/2013 and 391/2013, respectively)
published in May 2013 in the OJ of the European Union. These new regulations foresee that
the cost-efficiency KPI (DUC) is computed taking into account the total DCs after deduction
of the costs for services to exempted VFR flights. For consistency purposes, in Table 20
below, the costs for services to exempted VFR flights planned in the NPPs for 2014 (some
€9M in 2012 prices) are deducted from the starting point.
Table 20: Proposed trend in en-route DUCs over RP2, including Croatia and adjustments
(€2012)
2014 2015 2016 2017 2018 2019%2019/2014
CAGR
Determined costs (€M, 2009 prices excl. Croatia & VFR adjustment) 6 133 6 041 5 950 5 802 5 657 5 515 -2.1%
Determined costs (€M, 2012 prices excl. Croatia & VFR adjustment) 6 759
Croatia en-route costs (€M, 2012 prices) 73
Minus adjustment for exempted VFR costs (€M, 2012 prices) 9
Determined costs (€M, 2012 prices incl. Croatia and VFR adjustment) 6 823 6 721 6 620 6 455 6 293 6 136 -2.1%
SUs (M) - STATFOR base case (Sept. 2013) including Croatia 109.6 112.6 115.7 118.4 121.4 124.5 2.6%
DUC (€2012) 62.25 59.70 57.22 54.53 51.84 49.30 -4.6%
Annual % changes in en-route DUC -4.1% -4.2% -4.7% -4.9% -4.9%

PRB advice to the Commission in the setting of Union-wide performance targets for RP2
51
8.5.27 Table 20 indicates that after the inclusion of Croatia, the conversion to Euros 2012 and the
adjustments relating to the costs of exempted VFR flights, the starting point in 2014 amounts
to €6,823M. Based on en-route costs reductions of -1.5% p.a. for 2015-2016 and -2.5% p.a.
for 2017-2019, the DCs would amount to €6,136M in 2019.
8.5.28 Taking into account the September 2013 STATFOR traffic base case forecasts for 2014-2019,
the en-route cost-efficiency targets for RP2 would be based on an average -4.6% annual
reduction of en-route DUCs between 2014 and 2019, implying a Union-wide DUC of €49.30
in 2019, expressed in €2012.
8.5.29 For the sake of completeness, Table 21 below shows the proposed trend in en-route DUC over
RP2 (including Croatia and VFR costs adjustments) expressed in €2009 rather than in €2012
as in Table 20.
Table 21: Proposed trend in en-route DUCs over RP2 (€2009)
PRB proposal for a “notional” Union-wide terminal ANS cost-efficiency target for RP2
8.5.30 Terminal ANS costs represent approximately 20% of total gate-to-gate ANS costs and cover
the cost of ANS services provided to traffic taking-off and landing at airports in the EU 27
States plus Norway and Switzerland. At present, an estimated 5% of all gate-to-gate ANS
costs (approximately 25% of terminal ANS costs) fall outside the scope of the terminal ANS
cost-efficiency target setting. These are exempted either because they are incurred at airports
that do not reach the 70 000 IFR air transport movements threshold or because the respective
States consider they meet an assessment of “market conditions” in line with the charging
Regulation requirements. When dealing with terminal ANS, the PRB is mindful of the
“proportionality” and “subsidiarity” principles.
8.5.31 While States have to set local Terminal ANS DUC for RP2 (2015-2019), no Union-wide
terminal ANS cost-efficiency target has to be set in 2013. However, the revised performance
Regulation foresees that a Union-wide terminal ANS DUC target could be set from 2017
onwards, subject to a Commission Decision to be taken in 2015, based on RP1 monitoring. In
this context, the PRB suggests to propose a “notional” Union-wide target for Terminal ANS
in order to provide a signal to stakeholders in view of preparing the performance plans for
RP2.
8.5.32 The PRB acknowledges that there are a number of technical issues which make it difficult to
set meaningful Union-wide terminal cost-efficiency targets. In particular, the PRB notes the
following issues:
The significant differences across Member States in the size of terminal charging zones
(both in terms of number of airports and in the level and type of traffic handled).
There is no consistent methodology applied across the States to determine Terminal
Navigation Service Units (TNSUs). Due to the differences in the formula used by the
States, and scope in the data they have reported, it is not possible to calculate Union-wide
trends in TNSUs and Union-wide trends in terminal ANS unit costs or unit rates for RP1
(2012-2014). In addition, States have stated that the costs and traffic (TNSU) data
recorded before 2012 shall be treated with caution as these were not comparable, as not
regulated.
2014 2015 2016 2017 2018 2019%2019/2014
CAGR
Determined costs (€M, 2009 prices excl. Croatia & VFR adjustment) 6 133 6 041 5 950 5 802 5 657 5 515 -2.1%
Croatia en-route costs (€M, 2009 prices) 70
Minus adjustment for exempted VFR costs (€M, 2009 prices) 8
Determined costs (€M, 2009 prices incl. Croatia and VFR adjustment) 6 196 6 103 6 011 5 861 5 714 5 571 -2.1%
SUs (M) - STATFOR base case (Sept. 2013) including Croatia 109.6 112.6 115.7 118.4 121.4 124.5 2.6%
DUC (€2009) 56.53 54.21 51.95 49.51 47.07 44.76 -4.6%
Annual % changes in en-route DUC -4.1% -4.2% -4.7% -4.9% -4.9%

PRB advice to the Commission in the setting of Union-wide performance targets for RP2
52
Despite the existence of principles and guidance material for the establishment of the en-
route cost base, there are substantial differences in the allocation of costs into en-route
and terminal ANS across SES States. Caution is therefore needed when comparing the
level of terminal ANS costs across States since in some cases, lower or higher costs may
purely reflect cost-allocation differences.
The operational scope of the ANS provided at and around airports, as well as the use and
ownership of terminal related assets also differs across States. Caution is therefore
needed when comparing the level of terminal ANS costs across States since in some
cases, lower costs may reflect the fact that some terminal ANS assets are not owned by
the ANSP but by the airport authority or simply that the scope of operational services
provided is different.
8.5.33 All these elements require caution and greater understanding and future analysis in order to
set meaningful Union-wide terminal cost-efficiency targets.
8.5.34 The PRB notes from the information provided in the national performance plans that the
Terminal ANS costs are expected to remain fairly constant at Union-wide level over RP1. In
addition, Table 22 below shows that based on latest forecast data provided in June 2013 by
States, terminal ANS costs are also planned to remain fairly constant over RP2.
Table 22: Planned Union-wide Terminal ANS costs over RP2 (States June 2013 submissions)
8.5.35 On the basis of current understanding and notwithstanding the limitations identified in
§8.5.32, the PRB considers that the lower bound of the “notional” Union-wide cost-efficiency
target for terminal ANS could be a flat line profile over the period 2015-2019. This would be
in line with the preliminary overall Union-wide terminal ANS determined costs submitted by
Member States in June 2013. On the other hand, it is expected that performance
improvements in en-route ANS positively affect terminal ANS performance, considering the
joint costs shared between the two services. For this reason, the upper bound of the “notional”
Union-wide terminal cost-efficiency target could be to reduce terminal ANS costs at the same
pace as for en-route ANS.
2015 2016 2017 2018 2019
Terminal DC (€2012) 1 535 500 425 1 540 899 103 1 542 250 244 1 549 170 622 1 549 164 983
Annual % change 0.4% 0.1% 0.4% 0.0%
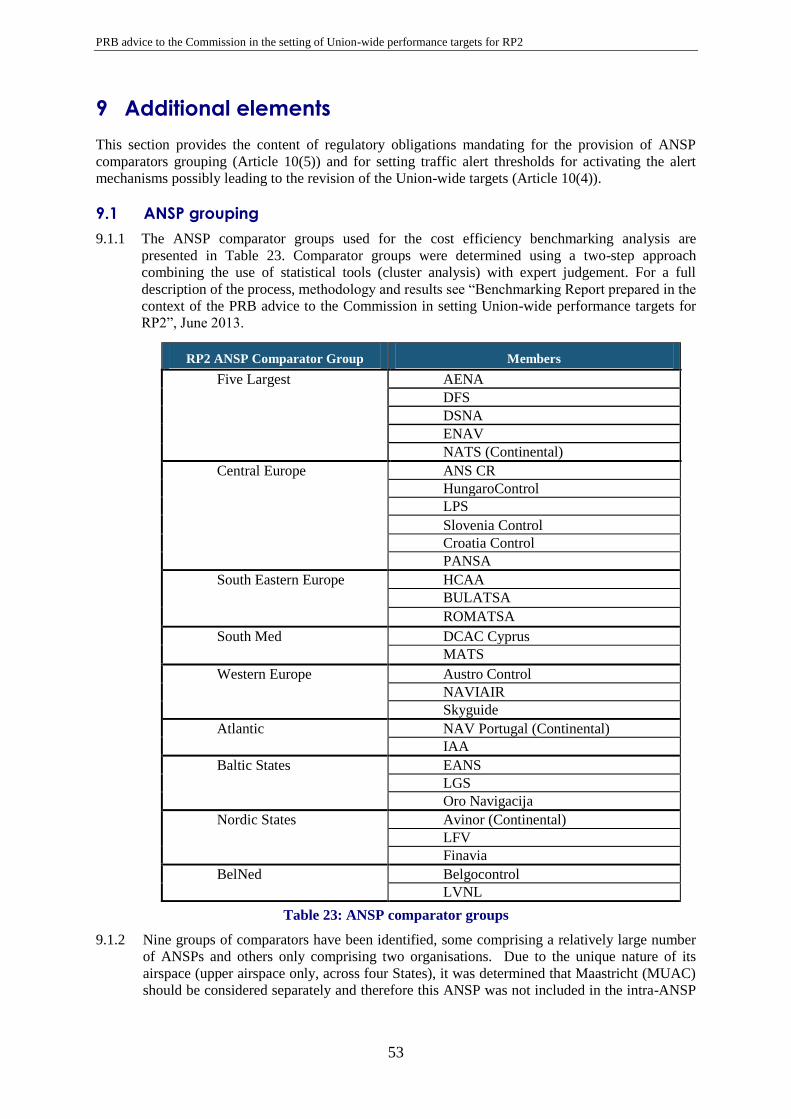
PRB advice to the Commission in the setting of Union-wide performance targets for RP2
53
9 Additional elements
This section provides the content of regulatory obligations mandating for the provision of ANSP
comparators grouping (Article 10(5)) and for setting traffic alert thresholds for activating the alert
mechanisms possibly leading to the revision of the Union-wide targets (Article 10(4)).
9.1 ANSP grouping
9.1.1 The ANSP comparator groups used for the cost efficiency benchmarking analysis are
presented in Table 23. Comparator groups were determined using a two-step approach
combining the use of statistical tools (cluster analysis) with expert judgement. For a full
description of the process, methodology and results see “Benchmarking Report prepared in the
context of the PRB advice to the Commission in setting Union-wide performance targets for
RP2”, June 2013.
RP2 ANSP Comparator Group Members
Five Largest AENA
DFS
DSNA
ENAV
NATS (Continental)
Central Europe ANS CR
HungaroControl
LPS
Slovenia Control
Croatia Control
PANSA
South Eastern Europe HCAA
BULATSA
ROMATSA
South Med DCAC Cyprus
MATS
Western Europe Austro Control
NAVIAIR
Skyguide
Atlantic NAV Portugal (Continental)
IAA
Baltic States EANS
LGS
Oro Navigacija
Nordic States Avinor (Continental)
LFV
Finavia
BelNed Belgocontrol
LVNL
Table 23: ANSP comparator groups
9.1.2 Nine groups of comparators have been identified, some comprising a relatively large number
of ANSPs and others only comprising two organisations. Due to the unique nature of its
airspace (upper airspace only, across four States), it was determined that Maastricht (MUAC)
should be considered separately and therefore this ANSP was not included in the intra-ANSP

PRB advice to the Commission in the setting of Union-wide performance targets for RP2
54
group benchmarking analysis. It should be noted that the names of these groups have been
chosen for mnemonic purposes only.
9.2 Alert Threshold
9.2.1 Article 10(4) of the revised performance Regulation contains provisions for the establishment
of alert thresholds, within which targets and the risk sharing mechanism apply, and beyond
which performance targets may be revised in accordance with the process set out in the
Regulations.
9.2.2 PRB understands that threshold definition is linked with the reliability of the traffic forecast,
as pointed out by one stakeholder (AESA) during the consultation.
9.2.3 PRB considers that the alert threshold currently set at ±10% by the EC for RP1 should be also
confirmed for RP2 and invites NSAs to make sure that performance plans are robust enough
to accommodate a range of traffic outcomes within the alert threshold.
9.2.4 The PRB will monitor the actual performance at Union-wide and State level compared to the
alert thresholds set for RP2.
9.3 Next steps
The EC process
9.3.1 As explained in details in Section 2.7 above, the process of Union wide target setting is from
the date of submission of this Report in the hands of the Commission which will present its
proposal to the Single Sky Committee. PRB will nevertheless assist the Commission until
the end of the setting process as requested.
FAB Performance Plans and proposed guidance to NSAs.
9.3.2 As for RP1, PRB will actively support NSAs through the performance working group of the
NSA Coordination Platform.
9.3.3 At its next meeting
on 24 October 2013,
the PRB will present
for discussion a
proposed draft
template for FAB
Performance plans
as well as a short
document
summarizing the
proposed PRB
methodology for the
assessment of
performance plans in
July 2014.
9.3.4 Figure 9-1 illustrates
the process and the
timing for the
production of the
FAB Performance
Plans.
Figure 9-1: Process and timing for production of FAB PPs

PRB advice to the Commission in the setting of Union-wide performance targets for RP2
55
References
i Regulation (EU) No 390/2013 of 3 May 2013 laying down a performance scheme for air navigation services and
network functions:
http://eur-lex.europa.eu/LexUriServ/LexUriServ.do?uri=OJ:L:2013:128:0001:0030:EN:PDF
ii Regulation (EU) No 391/2013 of 3 May 2013 laying down a common charging scheme for air navigation services:
http://eur-lex.europa.eu/LexUriServ/LexUriServ.do?uri=OJ:L:2013:128:0031:0058:EN:PDF
iii PRB consultation report “Union-wide Targets for the 2nd Reference Period of the Single European Sky Performance
Scheme” published on 17 May 2013: http://ec.europa.eu/transport/media/consultations/doc/2013-07-03-
sesrp2/report.pdf
iv Commission Decision of 29.7.2010 on the designation of the Performance Review Body of the Single European Sky:
http://www.eurocontrol.int/sites/default/files/content/documents/single-sky/pru/about-us/designation-prb.pdf
v Eurocontrol Seven-year IFR flight movements and Service Units Forecast, STATFOR, Edition September 2013:
http://www.eurocontrol.int/articles/statistics-and-forecasts
vi PRB consultation report “EU-wide Targets for RP2: Indicative Performance Ranges for Consultation” published on
February 2012: http://www.eurocontrol.int/sites/default/files/content/documents/single-sky/pru/performance-
targets/2013-02-25-rp2-eu-targets-report-1.pdf
vii PRB website on the preparation of RP2:
http://www.eurocontrol.int/articles/ses-performance-scheme-reference-period-2-2015-2019
viii PRB open workshop on 6 February 2013:
http://scic.ec.europa.eu/streaming/index.php?es=2&sessionno=685ac8cadc1be5ac98da9556bc1c8d9e
ix Public stakeholder consultation on Union-wide targets for the second reference period:
http://ec.europa.eu/transport/media/consultations/2013-07-03-sesrp2_en.htm
x RP1 report, the final draft annual monitoring report for 2012 (Volume 1 overview report):
http://publish.eurocontrol.int/sites/default/files/content/documents/single-sky/pru/news-related/2013-19-
13_prb_monitoring_report_2012_volume_1-_european_overview_and_prb_recommendations.pdf .
xi PRC report on Fragmentation, EUROCONTROL, 2006, http://www.eurocontrol.int/documents/impact-
fragmentation-european-atmcns
xii Performance Review Report (PRR 2012), EUROCONTROL, 2013,
http://www.eurocontrol.int/documents/performance-review-report-prr-2012
xiii Proposal on the content of a pilot common project, SESAR Joint Undertaking, 6 May 2013, Edition 1.0