practice-based quality improvement session 2 pcfdp november 12, 2010 stephanie berkson, mpa sally...
TRANSCRIPT

Practice-based Quality Improvement
Session 2
PCFDPNovember 12, 2010
Stephanie Berkson, MPA Sally Kraft, MD, MPH

Session Objectives
1. Understand the basic model of improvement: FOCUS PDCA
2. Be able to lead an improvement team through each step in FOCUS
3. Be able to write a specific AIM statement

Imperatives for Change
Unexplained Variation in Quality and CostsDartmouth Atlas for Health Care http://www.dartmouthatlas.org/
Medical errors
2000 IOM To Err is Human: 98,000 lives lost/year due to medical errors
High costs17% of GDP
2005 IOM Building a Better Delivery System: 30-40 cents of every health care dollar is spent on waste (overuse, underuse, misuse)

Imperatives for Change
Poor outcomes
US spends over twice as much per capita on health as compared to other industrialized nations but ranks last in number of preventable deaths
Disparities2002: Life expectancy at birth for a white male = 75 years, for a black male = 69 years. Even when correcting for education and income, African Americans have worse health outcomes compared to white Americans.
Uninsured15 % uninsured, 30% underinsured

Goals for Improving the US Healthcare System
The Triple Aim
1. Improve the patient care experience (quality of care, access, coordination)
2. Improve the health of the population
3. Lower costs without causing harm

Goals for Improving the Quality of Healthcare
STEEEP
Safety
Timeliness
Equity
Efficiency
Effectiveness
Patient- and family-centeredness
2001 IOM Crossing the Quality Chasm

Focus on Process Improvement
Exercise:
At each table, identify 3 health care processes that you do exactly the same every single time you perform the activity.

Improving Quality:Focus on Process
Example: Drawing blood cultures
Despite the fact that you are drawing blood cultures on different patients in different settings, you always draw cultures the same way.
Structure Process Outcome

Dimensions of CareStructure:
The capacity to provide care reflected in the quantity, type, and qualifications of individuals and facilities.
Good structure does not guarantee high quality
Examples: Physician certification, nurse-to-bed ratio
Process:
What is done when providing care. Appropriateness (doing the right thing) and skillfulness
Example: inserting a central line, screening all eligible patients for breast cancer
Outcome:
Effects of health care on a patient’s health status and satisfaction

Eliminating Central Line Infections in Michigan
Pronovost NEJM 2006; 355: 2725

30.0%
40.0%
50.0%
60.0%
70.0%
80.0%
90.0%
100.0%
% Pts w/ Up-to-Date A1C Testing
UW Health Pilot Sites Wave 1 MDs
Pilot Site Go-Live w/ Steps 1&2 Wave 1 MDs Go-
Live w/ Steps 1&2

Standard use of EHR Tools
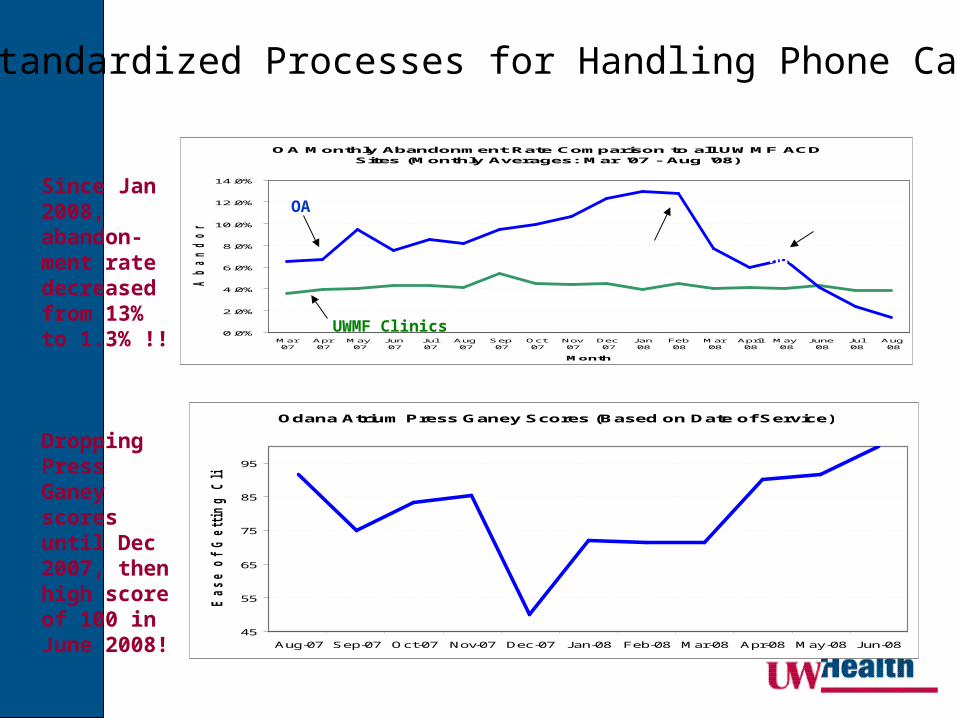
Since Jan 2008, abandon-ment rate decreased from 13% to 1.3% !!
Dropping Press Ganey scores until Dec 2007, then high score of 100 in June 2008!
OA Monthly Abandonment Rate Comparison to all UWMF ACD Sites (Monthly Averages: Mar '07 - Aug '08)
0.0%
2.0%
4.0%
6.0%
8.0%
10.0%
12.0%
14.0%
Mar'07
Apr'07
May'07
Jun'07
Jul'07
Aug'07
Sep'07
Oct'07
Nov'07
Dec'07
Jan'08
Feb'08
Mar'08
April'08
May'08
June'08
Jul'08
Aug'08
Month
Ab
an
do
nm
en
t R
ate
OA
UWMF Clinics
Phase IPhase II
Odana Atrium Press Ganey Scores (Based on Date of Service)
45
55
65
75
85
95
Aug-07 Sep-07 Oct-07 Nov-07 Dec-07 Jan-08 Feb-08 Mar-08 Apr-08 May-08 Jun-08
Ease o
f G
ett
ing
Cli
nic
on
Ph
on
e
Standardized Processes for Handling Phone Calls

Basic Model for Improvement
What are we trying to fix?
How will we know if we have improved?
What changes can we make that will lead to improvement?

Basic Model for Improvement What are we trying to fix?
FOCUS (Find a problem, Organize the improvement team, Clarify the current situation, Understand the causes of variation and poor
quality, Select solutions to test)
How will we know if we have improved?
DATA
What changes can we make that will lead to improvement?
PDCA(Plan-Do-Check-Act)

Find a Process to Improve
1. Review performance data
2. Ask your clinic team
3. Ask your patients
4. Evaluate your practice, the 5 P’s1. Know your purpose
2. Know your patients
3. Know your professionals
4. Know your processes
5. Know your patterns

Process Works well
Not a problem
Small problem
Real problem
Totally broken
Not applicable
to practice
Working on it
Source of patient
complaint
Pre-Visit
Patient calls; messaging, triage
Scheduling appointments; appointment availability
Standardized set of information gathered prior to new patient visit
Information provided for new patients to orient to practice
Core Ambulatory Practice Process AssessmentName:____________________________________ Date: ____________________
Rate each of the following practice support processes by placing a checkmark under the heading that most closely matches your understanding of the process for your clinic. Also mark it if the process is a source of patient complaints.
Practice Process Assessment: A Tool to Understand Your Processes
Full template is provided in your handouts

Global AimAfter assessing your practice and
reviewing performance data, identify what aspect of the practice you will improve.
Exercise: You are reviewing your practice assessment and organizational performance data on telephone performance at your clinic. Write a global aim statement using the template provided.

ProcessWorks Well
Not a problem
Small Problem
Real Problem
Totally Broken
NA to Practice or Does
Not ExistWorking
On It
Source of Patient
complaint
Between Visit Between VisitUsing My Chart and e-mail communication 1 11 11 7 0 11 1 3
Post-hospital, ER, Urgent Care discharge coordination (e.g. scheduling first medical appointment post hospital discharge)
4 10 20 5 0 2 0 0
RN telephone triage processes7 17 12 3 3 1 3 3
Message handling and timely telephone follow up (clinical and non-clinical)
2 17 17 2 0 3 1 0
*Monitoring and improving clinical processes and outcomes 0 6 16 9 0 3 6 2
Care management and coordination (e.g. preventive care reminders, using evidence based protocols, etc.)
0 5 21 10 1 2 5 1

20
Phone abandonment rates were higher than organizational goal (3 - 5%)
Average abandonment rates June 2007 to Dec 2007:
10% - Clinic4% - Organi-
zation
Low patient and provider satisfaction with Communications Center performance
OA Monthly Abandonment Rate Comparison to all UWMF Automatic Call Distribution (ACD) Sites
(Monthly Averages: Mar - Dec '07)
0.0%
2.0%
4.0%
6.0%
8.0%
10.0%
12.0%
14.0%
Mar '07 Apr '07 May '07 Jun '07 Jul '07 Aug '07 Sep '07 Oct '07 Nov '07 Dec '07
Month
Ab
an
do
nm
en
t R
ate
OA
UWMF Clinics
OA Monthly Call VolumesMar - Dec '07
12000
13000
14000
15000
16000
17000
18000
19000
Mar-07 Apr-07 May-07 Jun-07 Jul-07 Aug-07 Sep-07 Oct-07 Nov-07 Dec-07
Call Volume
Mo
nth
OA
Opened new OA neighborhood
Opened new OA neighborhood

Overall Theme “Global Aim Statement”
Create a project-wide aim or purpose statement that will help keep your focus clear and work productive
I/We aim to improve ________________________________________________________________ [NAME THE PROCESS]
In _______________________________________________________________________________
[CLINIC LOCATION IN WHICH THE PROCESS IS EMBEDDED] The process begins with: ____________________________________________________________
[NAME WHERE THE PROCESS BEGINS] The process ends with: ______________________________________________________________
[NAME WHERE THE PROCESS ENDS] By working on the process, we expect [LIST BENEFITS]: ___________________________________________________________________________________ ___________________________________________________________________________________ ___________________________________________________________________________________ It is important we work on this now because [LIST IMPERATIVES]: ___________________________________________________________________________________ ___________________________________________________________________________________

Organize a Team
1. Include the people who do the work on the improvement team
2. Challenges in working with a team
3. Running effective team meetings
4. Stakeholders v. team members

Effective Meetings1. Running an effective meeting is a skill and
requires practice and hard work
2. Tips for success:• Prepare: create an agenda, state the objectives
for the meeting
• Make sure the right people are included
• Assign roles: Facilitator, Time keeper, Recorder
• Clearly state “next steps” and assign accountability
• Evaluate the meeting
Stakeholder Analysis
Used by the change team to create an enrollment and involvement strategy for each group
Analysis providesWho is affected
How they are affected
How critical they are in the process
Who should be contacted
24

Stakeholder Analysis
25

Clarify the Current SituationUnderstand the Causes of
Variation and Poor Performance
1. Work with the entire improvement team
2. Use brainstorming techniques to understand the current state and uncover reasons for defects
3. Collect data to improve your understanding of the current situation
4. Review the literature, identify best practices

Brainstorming
Cause & Effect DiagramWhat is it?
Identifies the “drivers” of the end product
Why would you use it?Shows all activities that contribute to the end
product
Places activities into “buckets” to help focus your improvement work
When would you use it? At the beginning, when you have an end
product you want to improve

Effect/Issue/Problem
Tools/Technology Organization
Environment
Project XXXXXX Cause and Effect DiagramA.K.A. Fishbone or Ishikawa Diagram
General Cause 1
Contributing Cause 2
Contributing Cause 1
Person
General Cause 2
Tasks
Causes EffectOther

30
Phone abandonment rates were higher than organizational goal (3 - 5%)
Average abandonment rates June 2007 to Dec 2007:
10% - Clinic4% - Organi-
zation
Low patient and provider satisfaction with Communications Center performance
OA Monthly Abandonment Rate Comparison to all UWMF Automatic Call Distribution (ACD) Sites
(Monthly Averages: Mar - Dec '07)
0.0%
2.0%
4.0%
6.0%
8.0%
10.0%
12.0%
14.0%
Mar '07 Apr '07 May '07 Jun '07 Jul '07 Aug '07 Sep '07 Oct '07 Nov '07 Dec '07
Month
Ab
an
do
nm
en
t R
ate
OA
UWMF Clinics
OA Monthly Call VolumesMar - Dec '07
12000
13000
14000
15000
16000
17000
18000
19000
Mar-07 Apr-07 May-07 Jun-07 Jul-07 Aug-07 Sep-07 Oct-07 Nov-07 Dec-07
Call Volume
Mo
nth
OA
Opened new OA neighborhood
Opened new OA neighborhood
Create a Cause and EffectDiagram to Explain this Poor Performance

Data Collection to Clarify and Understand the Problem
1. External sources of data are typically not appropriate or readily available
2. Internally collected data is ideal for improvement work
• Qualitative data
• Quantitative data
3. Data needs to be valid, feasible, and consistent
Exercise: create a data collection sheet to identify the causes of the high phone abandonment rate at the clinic

Non-Clinical Data Collected Validation
368 372300
379
31
442
281
37 26
43
7
9
78
166
0
100
200
300
400
500
600
Tu
esd
ay
We
dn
esd
ay
Th
urs
da
y
Frid
ay
Sa
turd
ay
Mo
nd
ay
Tu
esd
ay
Day
# o
f C
alls
Not Recorded
Total "Tallied" Calls
1
Overall Abandonment Rate Summary
9%10%
6% 7%
3%
17%
11%10%
0%2%4%6%8%
10%12%14%16%18%
Tues
day
1/22
Wed
nesd
ay1/
23
Thur
sday
1/24
Frid
ay 1
/25
Satu
rday
1/26
Mon
day
1/28
Tues
day
1/29
Ove
rall
4

Symp-tomatic
Other Refills Labs/Results
Gen Info Appt Sched Referral Re-lated
FYI NH/
Hospice
0
20
40
60
80
100
120
140
160
180
0
0.1
0.2
0.3
0.4
0.5
0.6
0.7
0.8
0.9
1
154 151
123
71
5751
34
20
OA Clinical Call Types (3/28 - 3/31, 77% total calls captured)
Call Types
# O
f C
alls
% C
on
trib
utio
n

175; 5%51; 1%
3520; 94%
Overall Call Summary
Sched II Calls
Repeat Sched II Calls
All Other Calls

Process Map Basics
DefinitionIllustration of steps in a process using symbols and arrows
PurposeUnderstand existing processes Identify non-value added steps Clarify complex processesIdentify improvement opportunitiesGenerate alignment and agreementTrain new staff
Patient Arrives at Clinic
Patient checks in at Registration
Patient checks out at Reception
Provider consults with Patient
Patient checks in at Reception
Patient Leaves Clinic

Anyone calls Odana Atrium
OA Telephone Call Routing Process Map
Is call Clinical (CL) or Non-Clinical (NCL)?
Caller enters CL Queue
Caller enters NCL Queue
Receptionist answers call
Can Receptionist resolve call?
Call is resolved
Is call Clinical?
Is call for specific
provider?
NCLCL
No
No
Yes
CL Staff (MA) answers call
Call is transferred to CL Queue
Yes
Can CL Staff resolve call?
Is provider in?Call routed and
resolved by provider
Yes
Yes
Message left for Provider Call Back
No
Call routed/xferred as needed
No
Call is resolved
Call is transferred to Care Manager
(RN)
No
Yes
Can Care Manager (RN) resolve call?
Call is resolved Yes
No
Call routed to DOD or provider as
needed
Call routed to Dr’s Hotline
Is call from patient or Health Care
Representative?
Health Care Representative
Patient

Select Solutions to Test 1. Select one specific solution to test that:
• addresses a cause of the problem• is within the scope of control of your team• has key stakeholders’ support
2. Develop a SMART aim statementSpecific
Measurable
Agreed upon and actionable
Relevant
Time-bound
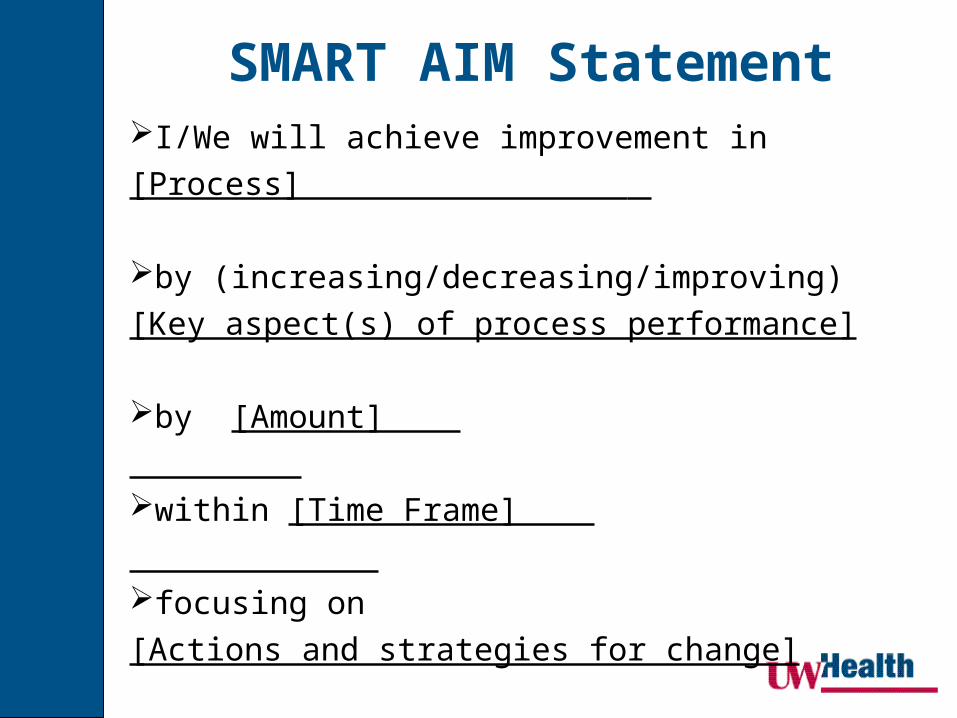
I/We will achieve improvement in
[Process]
by (increasing/decreasing/improving)
[Key aspect(s) of process performance]
by [Amount]
within [Time Frame]
focusing on
[Actions and strategies for change]
SMART AIM Statement
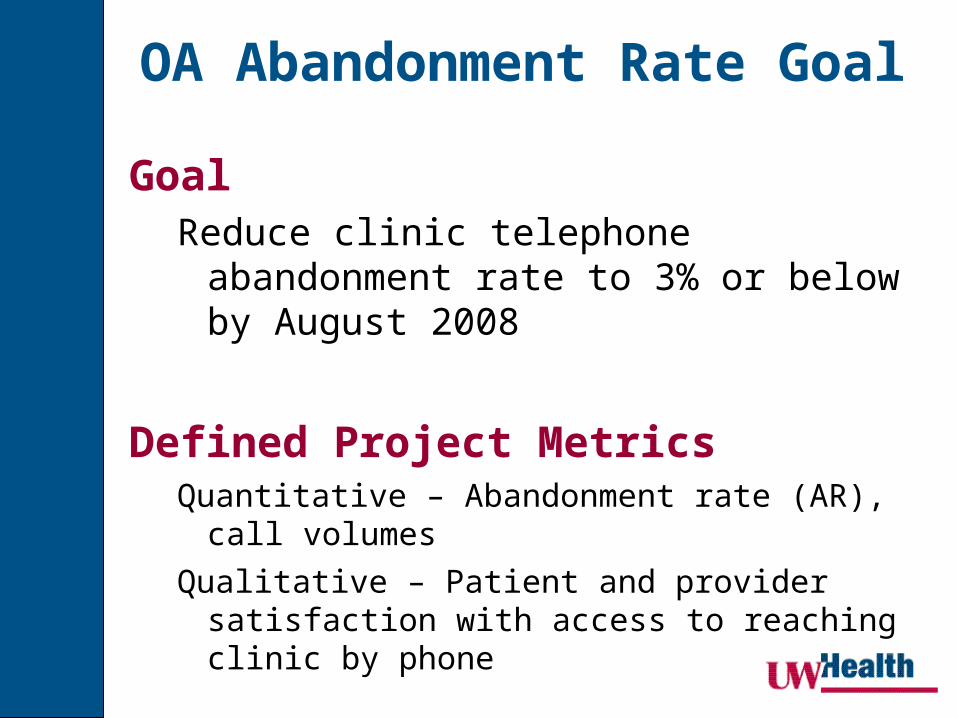
GoalReduce clinic telephone abandonment rate
to 3% or below by August 2008
Defined Project MetricsQuantitative – Abandonment rate (AR), call volumes
Qualitative – Patient and provider satisfaction with access to reaching clinic by phone
OA Abandonment Rate Goal


QI foundation: Plan-Do-Check-Act

We’ll focus on applying the PDCA process in Session 3.
Skills we will practice at the Jan session:
1. Developing and implementing an action plan
2. Collecting improvement data; measuring processes and outcomes
3. Assessing strategies for sustaining improvements