p.r. shukla indian institute of management ahmedabad, india€¦ · gujarat madhya pradesh haryana...
TRANSCRIPT

Low Carbon Roadmap for India(with case study of Ahmedabad City)
P.R. ShuklaIndian Institute of ManagementAhmedabad, India
Presented in The 16th AIM International WorkshopNational Institute for Environment Studies, Tsukuba, Japan February 19-21, 2011

Indian Institute of Management, Ahmedabad, India
India NCCAP (June, 2008) - PMO
National Climate Change Action Plan - 8 National Missions1. Solar Energy: Targets by 2022
• 20 GW Grid Power + 2 GW Off-Grid Power• 20 million Solar lighting system to replace 1 billion Liters of of Kerosene/yr (2.5 MT CO2/yr)
2. Enhanced energy efficiency • Avoided capacity of 19000 MW by 2014-15
3. Sustainable habitat• Green and Energy Efficient • Comprehensive approach to manage water, wastewater and solid waste
4. Water Sector • 20% water use efficiency improvement
5. Sustaining the Himalayan eco-system
6. A “Green India” • 20 Mil. Ha afforestation by 2020; Forest cover from 23 to 33% in long-run
7. Sustainable agriculture • Promotion of Micro Irrigation in 40 Mil. ha
8. Strategic knowledge for climate change

Indian Institute of Management, Ahmedabad, India
Copenhagen & Cancun: Commitments & Actions
Domestic Actions• Carbon tax on coal to fund clean energy
– US $1/ton on domestic & imported coal; fund to be used for Clean Energy
• Enhanced Energy Efficiency measures – Mandate to reduce specific energy consumption; – Energy savings certificates & trading– Energy efficiency ratings mandatory for 4 key appliances from Jan 2010– Reduction of 6 GW of electricity demand through mass distribution of CFLs
• Renewable Energy Push– Capital Subsidies and/or Preferential Feed-in Tariff– Renewable Energy Certificates Market
• Mission on sustainable habitat– Energy efficiency in residential, commercial and urban transportation– Managing water, wastewater and solid waste with recycling, reuse and energy creation
• 20 to 25% Emissions Intensity Reduction from 2005 to 2020 (1.5 to 1.9% decoupling)• Per Capita Emissions Below OECD Average (for ever)• MRV/ICA of Domestic Actions (India’s Proposal at Cancun)
Indian Institute of Management, Ahmedabad, India
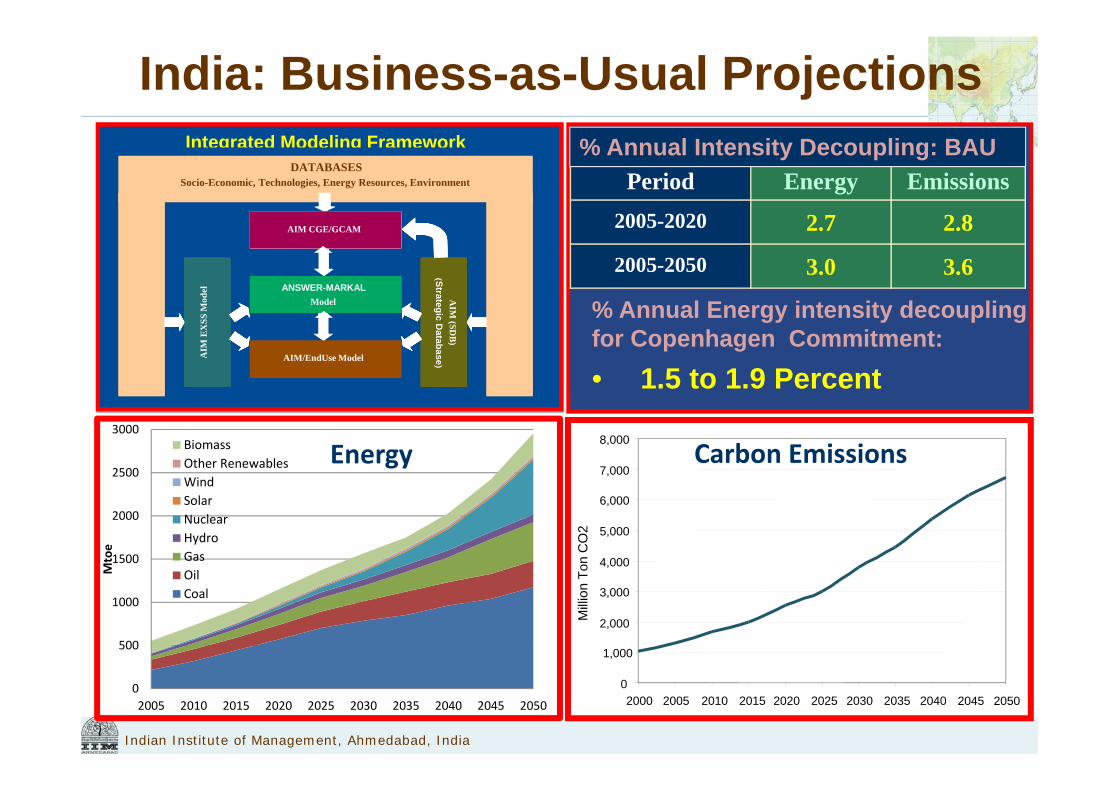
India: Business-as-Usual Projections
Energy Carbon Emissions
0
1,000
2,000
3,000
4,000
5,000
6,000
7,000
8,000
2000 2005 2010 2015 2020 2025 2030 2035 2040 2045 2050
Mill
ion
Ton
CO
2
0
500
1000
1500
2000
2500
3000
2005 2010 2015 2020 2025 2030 2035 2040 2045 2050
Mtoe
BiomassOther RenewablesWindSolarNuclearHydroGasOilCoal
Period Energy Emissions2005-2020 2.7 2.8
2005-2050 3.0 3.6
% Annual Intensity Decoupling: BAU
% Annual Energy intensity decoupling for Copenhagen Commitment:
• 1.5 to 1.9 Percent
Integrated Modeling FrameworkDATABASES
-Socio - Economic, Technologies, Energy Resources, Environmental Constrai nts
AIM CGE Model
ANSWER -MARKALModel
AIM SNAPSHOT ModelEnd
Use
Dem
and
Mod
el
AIM
Strategic Database
(SDB
)
AIM SNAPSHOT ModelEnd
Use
Dem
and
Mod
el
AIM
Strategic Database
(SDB
)
Socio-Economic, Technologies, Energy Resources, Environment
AIM CGE/GCAM
ANSWER-MARKALModel
AIM/EndUse ModelAIM
EX
SS M
odel
AIM
(SDB
)(Strategic D
atabase)
DATABASES

Indian Institute of Management, Ahmedabad, India
2OC Stabilization: Mitigation Alternatives Conventional Approach: transition with conventional path and carbon price
• High Carbon Price• Climate Focused Technology Push• Top-down/Supply-side actions
Sustainability Approach: aligning climate and sustainable development actions
• Low Carbon Price• Bottom-up/Demand-side actions• Behavioural change• Diverse Technology portfolio
Technology Co-operation Areas• Energy Efficiency• Wind/Solar/Biomass/Small Hydro• Nuclear/Low Carbon Infrastructure
Technology Co-operation Areas• Transport Infrastructure Technologies• 3R, Material Substitutes, Renewable Energy• Process Technologies• Urban Planning, Behavioral Changes
0
2,000
4,000
6,000
8,000
2000 2010 2020 2030 2040 2050
Mill
ion
Ton
CO
2
Water-Energy
Reduced Consumption
Recycling
Material Substitutions
Device Efficiency
Renewable Energy
Infrastructure
Fuel Switch
Residual Emissions
0
2,000
4,000
6,000
8,000
2000 2010 2020 2030 2040 2050
Mill
ion
Ton
CO
2
Water-Energy & others
Infrastructure
Device Efficiency
Nuclear
Renewable Energy
Fossil Fuel Switch
Residual Emissions

Indian Institute of Management, Ahmedabad, India
Linking Global Best Practices with National Policies
• Avoid Lock-ins (Infrastructure) Transport Energy
• Co-benefits Energy Security Air Quality Water Security Social Value of Carbon
Sustainability Scenario
Transport Transitions

Indian Institute of Management, Ahmedabad, India
Passenger Transport Infrastructure
0%10%20%30%40%50%60%70%80%90%
100%
2005 2010 2015 2020 2025 2030 2035 2040 2045 2050
Air
Train
Bus
Car
3W
2W
SS: Shares of passenger transport infrastructure
0
5000
10000
15000
20000
25000
30000
2005 2010 2015 2020 2025 2030 2035 2040 2045 2050
AirTrainBusCar3W2W
SS: Total passenger movement by infrastructure type (Bn Pkm)
BAU

Indian Institute of Management, Ahmedabad, India8
Freight Transport Infrastructure
Freight movement by transport infrastructure type (Bn Tkm)
0%
10%
20%
30%
40%
50%
60%
70%
80%
90%
100%
2005 2010 2015 2020 2025 2030 2035 2040 2045 2050
3W
LCV
HCV
Train
Ship
Sectoral shares in freight transport infrastructure (%)
0
1000
2000
3000
4000
5000
6000
7000
2005 2010 2015 2020 2025 2030 2035 2040 2045 2050
3W
LCV
HCV
Train
Ship
BAUIndustrial CorridorsCoal by Wire
Haryana Dadri
J. N Port
Rajasthan
Maharashtra
GujaratMadhya Pradesh
Haryana
Uttar Pradesh
Major TownsProposed Freight CorridorAssumed Corridors
Kandla
Kochi
Mangalore
Vizag
Marmagoa

Indian Institute of Management, Ahmedabad, India9
Energy Infrastructure
Power sector infrastructure capacity additions (Gwatt)
Refining infrastructure capacity requirements (MMTPA)LNG Infrastructure capacity requirements (MMTPA)
0
200
400
600
800
1000
1200
1400
1600
1800
2000 2005 2010 2015 2020 2025 2030 2035 2040 2045 2050
Biomass Wind
Waste Heat Solar
Oil Nuclear
Hydro Geothermal
Gas/ Naptha Coal
0
50
100
150
200
250
300
350
400
2005 2010 2015 2020 2025 2030 2035 2040 2045 2050
Current Capacity
BAU Oil Use
450‐C Oil Use
450‐S Oil Use
0
50
100
150
200
250
300
350
2005 2010 2015 2020 2025 2030 2035 2040 2045 2050
450‐C Gas Imports
450‐S Gas Imports
Current Capacity
BAU Gas Imports
• Replace and Reduce Fossil Use Coal LNG Petroleum
• Shift to Low Carbon Electricity Nuclear Renewable CCS (End-of-Pipe)

Indian Institute of Management, Ahmedabad, India
Low Carbon City Planning: Co-benefitsAhmedabad City: Pop. In 2010 - 5.5. Million
Co-benefits: Transport Transitions
0102030405060708090
100
2005 2035 BaU 2035 LCS 2050 BaU 2050 LCS
2WTrainBusLarge Passenger VehicleCar & 3 W
Per Capita CO2 Emissions (Ton)
2.16
5.63
3.13
8.15
2.16
2005 2035 BAU 2035 LCS 2050 BaU 2050 LCS
163.99
223.199255.704
148.974 169.25
0
100
200
300
2005 2035 2050
Base WECC
Co-benefits: Water per capita (ML/million)

Indian Institute of Management, Ahmedabad, India
Energy - Water decoupling (PJ/BCM)
Water Demand (BCM)
Co-benefits: Energy-Water Nexus
0
200
400
600
800
1000
1200
1400
2000 2025 2025 CC 2025 Sus 2050 2050 CC 2050 Sus
Domestic Industry (incl power) Agriculture
Red: 27.0%Red:24.0%
591 1006 953 732 9371237 1184
Water - CO2 decoupling (mt-CO2/BCM)
Co-benefits: Increase in Hydro (PJ)
1.24
1.59
2.23
1.57
2.12
1.441.61
2000 2025 2050
Base Conventional Sustainability
0.384 0.380 0.3640.3750.3510.350
0.280
2005 2025 2050Base Conventional Sustainability
4.8%
27.3%
0
10000
20000
BAU BAU LCS: Sus BAU
2005 2020 2035 2050
Fossil
Nuclear
Large Hydro
Other Renewables
LCS: Sus BAU LCS: Sus

Indian Institute of Management, Ahmedabad, India
Co-benefits and Social Value of Carbon
0
2
4
6
8
10
12
14
2000 2010 2020 2030 2040 2050
Mill
ion
tSO
2 Base Case
Sustainability Scenario
ConventionalScenario
Co-benefits: SO2 Emissions
0
2
4
6
8
10
12
14
0
1000
2000
3000
4000
5000
6000
7000
100 200 400 800 1600
Emissions and Income
SO2 Emissions in BAU
CO2 Emissions in BAU
LCS (SD) CO2 Emissions
CO
2 Em
issi
ons
(Mill
ion
Ton
)
SO2
Emis
sion
s (M
illio
n To
n)
GDP Per Capita 2000 = 100
Co benefits: Energy Security
0
400
800
1,200
1,600
Coal Oil Gas Nuclear Hydro Renewable
Prim
ary
Ene
rgy
Dem
and
(Mto
e) Base 2825 LCS_CT 2945 LCS_SS 2207
2010 2020 2030 2040 20500
40
80
120
160
200
BAU
LCS : Conventional Scenario
LCS : Sustainability Scenario
Social Value of Carbon
(US
$ pe
r ton
of C
O2)

Indian Institute of Management, Ahmedabad, India
Modeling• Modeling coordinated Bottom-up Actions under Top-down
Vision and Policies• Integrated Multi-model Systems – aligning Development
and Climate Actions in a unified framework
LCS Roadmap• Linking Low Carbon Actions and Development Targets
– For 2020: Include climate commitments into BAU Assessment– For Long-term: Avoid technology and policy lock-ins into high
emissions path
• ‘Paradigm Shift towards ‘Co-benefits’ and ‘Co-operation’: – Co-benefits reduces welfare losses– Deliver LCS at Low Carbon Price
Conclusions