powerpoint presentation · 2020-02-25 · rounding. due to rounding, numbers presented throughout...
TRANSCRIPT


In General. This disclaimer applies to this document and any oral comments of any person presenting it. This document, taken together with any such oral comments, is
referred to herein as the “Presentation”. This document has been prepared by Pirelli & C. S.p.A. (“Pirelli” or the “Company” and, together with its subsidiaries the “Group”).
The Presentation is being furnished to you for information purposes only and for use in presentations of the results and strategies of the Group.
No distribution of this Presentation. This Presentation is being furnished to you solely for your information and may not be reproduced, in whole or in part, or redistributed
to any other individual or legal entity.
Forward-looking statement. “Forward-looking statements” (which expression shall include opinions, predictions or expectations about any future event) that may be
contained in the Presentation are based on a variety of estimates and assumptions by the Group, including, among others, estimates of future operating results, the value of
assets and market conditions. These estimates and assumptions are inherently uncertain and are subject to numerous business, industry, market, regulatory, geo-political,
competitive and financial risks that are outside of the Group’s control. There can be no assurance that the assumptions made in connection with the forward-looking
statements will prove accurate, and actual results may differ materially. The inclusion of the forward-looking statements herein should not be regarded as an indication that
the Group considers the forward-looking statements to be a reliable prediction of future events and the forward-looking statements should not be relied upon as such. Neither
the Group nor any of its representatives has made or makes any representation to any person regarding the forward-looking statements and none of them intends to update
or otherwise revise the forward-looking statements to reflect circumstances existing after the date when made or to reflect the occurrence of future events, even in the event
that any or all of the assumptions underlying the forward-looking statements are later shown to be in error.
No update. The information and opinions in this Presentation is provided to you as of the dates indicated and the Group does not undertake to update the information
contained in this Presentation and/or any opinions expressed relating thereto after its presentation, even in the event that the information becomes materially inaccurate,
except as otherwise required by applicable laws.
Verbal explanation. This Presentation has to be accompanied by a verbal explanation. A simple reading of this Presentation without the appropriate verbal explanation could
give rise to a partial or incorrect understanding.
No offer to purchase or sell securities. The information, statements and opinions contained in this Presentation are for information purposes only and do not constitute a
public offer under any applicable legislation or an offer to sell or solicitation of an offer to purchase or subscribe for securities or financial instruments or any advice or
recommendation with respect to such securities or other financial instruments. None of the securities referred to herein have been, or will be, registered under the U.S.
Securities Act of 1933, as amended, or the securities laws of any state or other jurisdiction of the United States or in Australia, Canada or Japan or any other jurisdiction
where such an offer or solicitation would be unlawful (the “Other Countries”), and there will be no public offer of any such securities in the United States. This Presentation
does not constitute or form a part of any offer or solicitation to purchase or subscribe for securities in the United States or the Other Countries.
DISCLAIMER (1/2)

Rounding. Due to rounding, numbers presented throughout this Presentation may not add up precisely to the totals provided and percentages may not precisely reflect the
absolute figures.
The data contained in this presentation are preliminary in nature and refer to the date hereof and, therefore, may be subject to further variations. Please note that
these preliminary data are subject to review by the independent auditors that still have to complete their necessary analysis in order to release their report. The
2019 final results will be approved by the Board of Directors scheduled on the 2nd of March 2020 and will be disclosed to the market according to, and in the
terms set for by, the applicable laws and regulations.
Neither the Company nor any member of the Group nor any of its or their respective representatives, directors, employees or agents accept any liability whatsoever in
connection with this Presentation or any of its contents or in relation to any loss arising from its use or from any reliance placed upon it.
Francesco Tanzi, the manager in charge of preparing the corporate accounting documents, declares that, pursuant to art. 154-bis, paragraph 2, of the Legislative Decree no.
58 of February 24, 1998, the accounting information contained herein correspond to document results, books and accounting records.
***
Non-IFRS and Other Performance Measures
This Presentation contains certain items as part of the financial disclosure which are not defined under IFRS. Accordingly, these items do not have standardized meanings
and may not be directly comparable to similarly-titled items adopted by other entities.
Pirelli management has identified a number of “Alternative Performance Indicators” (“APIs”). These APIs (i) are derived from historical results of Pirelli & C. S.p.A. and are not
intended to be indicative of future performance, (ii) are non-IFRS financial measures and, although derived from the Financial Statements, are unaudited and (iii) are not an
alternative to financial measures prepared in accordance with IFRS.
The APIs presented herein include EBIT, EBIT margin, EBITDA, EBITDA margin.
In addition, this Presentation includes certain measures that have been adjusted by us to present operating and financial performance net of any non-recurring events and
non-core events. The adjusted indicators are EBITDA adjusted, EBITDA margin adjusted, EBITDA adjusted without start-up costs, EBITDA margin adjusted without start-up
costs, EBIT adjusted, EBIT margin adjusted, EBIT adjusted without start-up costs, EBIT margin adjusted without start-up costs.
In order to facilitate the understanding of our financial position and financial performance, this Presentation contains other performance measures, such as CapEx (Capital
Expenditures) or Investments in property, plant & equipment, Operating working capital related to continuing operations, Net Financial (liquidity) / debt Position, Net financial
(liquidity)/debt position without IFRS 16, Operating net cash flow, Net cash flow and Net cash flow before dividends.
These measures are not indicative of our historical operating results, nor are they meant to be predictive of future results.
These measures are used by our management to monitor the underlying performance of our business and operations. Similarly entitled non-IFRS financial measures reported
by other companies may not be calculated in an identical manner, consequently our measures may not be consistent with similar measures used by other companies.
Therefore, investors should not place undue reliance on this data.
DISCLAIMER (2/2)

AGENDA
PIRELLI EVOLUTION TO DATE & STRATEGIC DIRECTION
PIRELLI STRATEGY DEPLOYMENT: PILLAR 1 – COST COMPETITIVENESS
2019 FINANCIAL REVIEW AND 2020-2022 TARGETS IN DETAIL
APPENDIX
PIRELLI STRATEGY DEPLOYMENT: PILLAR 2 - COMMERCIAL DEVELOPMENT
2020-2022 SCENARIO
PIRELLI STRATEGY DEPLOYMENT: PILLAR 3 – TECHNOLOGY-BASED INNOVATION
PIRELLI EVOLUTION TO DATE & STRATEGIC DIRECTION
1
EVOLUTION TO DATE
IMPLICATIONS FROM 2020-2022 SCENARIO
STRATEGIC GUIDELINES & KEY 2020-2022 PROGRAMS
2020-2022 TARGETS AND ENABLERS
2025 VISION
1
2
3
4
5

PIRELLI HAS SUCCESSFULLY PURSUED A UNIQUE CONSUMER
POSITIONING AND BUSINESS MODEL FOCUSED ON HIGH VALUE
1. source German Product List (Pricat) @ Jan 2020; 2. Car Dealer, Tier 1
Wholesalers, Pirelli Retail, channels over which we exercise a greater control2
BUSINESS MODEL
1 2 3 4 5
Strong Relationship with
Most demanding OEMs
Cutting-edge
Technology
Iconic
Brand
Selective
Distribution
Low-Cost High-Tech
Production Footprint
Widest Marked
Homologated
Portfolio
Long-Term
Demand Visibility
Robust Pull-through
Demand
Low-Cost
High-Tech
Footprint
High Value
Go-to-Market
1,090 items1 in ≥18”,
~3x avg. Tier 1 Peers
Up to 10 Years
Replacement visibility
>80% Pull-through
Rate in 2019
80% Capacity in 2019
in Low-Cost Countries
>2/3 of Volumes
through H.V. Channels2
• Premium and Prestige Car drivers fitting ≥18”
• Focus on 3 H.V. Regions: Europe, USA and APac
HIGH VALUE (H.V.)
COMPETITIVE BARRIERS
• Standard presence reduction
• Trimming low profitability range
STANDARD (STD)

1. Implicit IPO
PIRELLI FORECASTS AND VOLUME PERFORMANCES
IN ≥18” PROVED CORRECT
3
2019 IPO1
PREMIUM & PRESTIGE (million cars)
≥18” CAR TYRE MARKET (million tyres)
≥18” CAR TYRE VOLUMES (million tyres)
Challenging pricing environment
on ≥18” non-specialties due to O.E. crisis
OEMs portfolio diversification
(new N. America and APac contracts in 2H 2019)
Price protection in ≥18” Specialties
(~50% of H.V. sales)
>
13 12
~ 255 ~ 255
~ 30 ~ 30
2019A
HIGH VALUE
CAR PROD.
~ 150 > 150CAR PARC
>
>
PIRELLI COUNTERMEASURES
UNFORESEEN EVENT
1. Evolution
to Date

1. Implicit IPO
…WHILE RAPID DECREASE ON ≤17" WAS NOT FULLY FORESEEN
4
Short-Term cost-cutting actions, leading to more
structural savings in 2020-22 plan
2018
Weaker Synergic car production caused unsaturation
and competitive pressure
-10 o/w -1 on
Specialties ≤17"
STANDARD
STANDARD CAR PRODUCTION (million cars)
≤17” CAR TYRE MARKET (million cars)
≤17" CAR TYRE VOLUMES (million tyres)
2019 IPO1 2019A
~ 86 ~ 77
-100 (o/w 62% O.E.)
~ 1,400 ~ 1,300
44 34
PIRELLI COUNTERMEASURES
UNFORESEEN EVENTS
>
>
>
>South America economic crisis resulting in severe
Standard Tyre demand contraction since 2H (-12% Repl.
Car ≤17” market in 2H2018; -5.8% in 1H2019)
EMEA and Russia more radical reduction with respect to
the IPO plan (second brands and lower rim-sizes pruning)>
>
Faster standard volume reduction than previously
planned, especially in EU, keeping a socially
responsible approach; footprint conversion (Italy)
Footprint rationalization (Brazil)
2019
1. Evolution
to Date

IPO1 VS ACTUAL
1. Implicit IPO
MORE GENERALLY, GAP IN STANDARD VOLUMES
EXPLAINING KEY VARIANCE WITH IPO PLAN
5
6.4
5.3ACT
IPO
1.16
0.92ACT
IPO
0.58
IPO
ACT
0.73
Revenues
Adjusted Ebit
€ billion
~ -0.08 net of
China JV invest.
-1.1
-0.15
2019
2017
-0.24
0.40
0.33
IPO
ACT
Net Cash Flowbefore dividends
-0.07
Cumulated
Net Cash Flowbefore dividends
Δ
Positive P/Mix gap vs. Raw Material, almost in line with IPO-0.04 bln
ForEx (-2 CAGR vs -1% IPO, USD devaluation)-0.1 bln
Price/mix (+6% CAGR vs +8% IPO, due to lower prices, driven by lower R. Mat growth
and O.E. price pressures)-0.3 bln
mainly Standard vol. cut (-9 million pcs) & lower Spec. ≤17” (-1 million pcs)-0.7 bln
mainly STD vol. cut & lower Spec. ≤17”-0.30 bln
Lower operating performance contribution-0.24 bln
Lower cumulated EBIT-0.30 bln
Short-term cost-cutting to limit volume decline impact+0.10 bln
Capex optimization to face weaker market demand+0.11 bln
Better Working Capital & lower Taxes+0.06 bln
Capex optimization +0.15 bln
0 bln China JV Investment (€65 million) compensated by D Work. Cap. & lower Taxes
2019
1. Evolution
to Date

TOP-OF-THE-INDUSTRY ESG RATINGS PIRELLI DISTINCTIVE FACTORS
PIRELLI ESG LEADERSHIP ACKNOWLEDGED BY THE MARKET
1. e.g. ISO 20400, ISO 26000, AA1000, ISO 37001, etc.6
Global Compact
LEAD company 2019
Sector top rating
Global Sector Leader in the S&P
Dow Jones Sustainability Indexes
Awarded sector Gold Class 2020
in S&P Sustainability Yearbook
Comprehensive corporate positioning on key global
sustainability challenges, beyond materiality
A-List in Carbon
Disclosure Project 2019
>
>
>
>
Management model complying with most demanding
ESG standards1
ESG targets are:
― Group wide
― Tangible
― Challenging and realistic
― Competitive deadlines
Complete and transparent Reporting
1. Evolution
to Date

EVOLUTION TO DATE SUM UP
7
KEEP PRUNING LOW RIM STANDARD
PURSUE HIGH VALUE APPROACH…
…WITH A HIGHER O.E. / HOMOLOGATION SELECTIVITY
ACCELERATE STRUCTURAL COST COMPETITIVENESS PROGRAM
LOWER CAPEX INTENSITY IN NEW PLAN AS H.V. CAPACITY ALREADY IN PLACE
LEVERAGE ON SUSTAINABLE APPROACH TO GAIN COMPETITIVE ADVANTAGE BY ANTICIPATING FUTURE CHALLENGES
1. Evolution
to Date

PIRELLI EVOLUTION TO DATE & STRATEGIC DIRECTION
8
EVOLUTION TO DATE
IMPLICATIONS FROM 2020-2022 SCENARIO
STRATEGIC GUIDELINES & KEY 2020-2022 PROGRAMS
2020-2022 TARGETS AND ENABLERS
2025 VISION
1
2
3
4
5

1. Category includes Car Sharing, Ride-Hailing, Rental Fleets, Private and Company
Leasing Cars; 2. EVs include BEV (Battery Electric Vehciles) and PHEV (Plug-in Electric
Vehicles)
NO MAJOR DISCONTINUITY IN «HIGH-END» MOBILITY
IN THE NEXT 36 MONTHS
9
2015 2018
10.7
2020 2022
9.6
11.5
12.2
+4%
+4%
+3%
2018
89%
9%7%
93%
10.711%
91%
2015
11.5
2020
Shared &
Services1
15%
85%
2022
Private
Ownership
9.6
12.2Car Global Miles Driven (billion) by ownership model
202220202015 2018
272340
399465+8%
+8%+8%
1%
5%
11%
20%
2015 2018 2020 2022
% EV on Global Parc n.a. 1% 2% 5%
Car Global Miles Driven (billion)
Global # of Households with > $75k annual Income % EV2 Penetration on Global Premium production
MILES DRIVEN GROWING CONSTANTLY PRIVATE CAR STILL DOMINANT
«HIGH-END» CONSUMERS GROWING ELECTRIC CARS GROWING SHARE (PREMIUM)
2. Implications from
2020-2022 scenario

Source: Company elaborations based on third party and associations of tyre
producers car market data; minor restatements on past data may occur
RESILIENT GROWTH OF HIGH VALUE TYRE DEMAND
10
256
94%
2021E
242
93%
2019A2018A
93% 94%
2020E
94%
2022E
Other regions
EU, N. America, APac
272~305
+6% +6%
2022E
94%
2018A 2019A
94% 94%
12
2020E 2021E
94%94%
Other regions
EU, N. America, APac
1212 ~13
-2% +2%
2019A 2020E
87%
2018A
87%
~180
87%87%
2021E
87%
2022E
Other regions
EU, N. America, APac
148 156 164
+5% +5%
9.4%
9.3%
CAGR
16A-19A
~6%
~6%
CAGR
19A-22E
5.7%
5.8%
CAGR
16A-19A
~5%
~5%
CAGR
19A-22E
1.2%
1.3%
CAGR
16A-19A
~2%
~2%
CAGR
19A-22E
(million vehicles)
PRESTIGE &
PREMIUM CAR PARC
(million vehicles)
PRESTIGE & PREMIUM
CAR PRODUCTION
≥18” O.E. + REPLACEMENT
TYRE MARKET(million tyres)
2. Implications from
2020-2022 scenario
Source: Company elaborations based on third party and associations of tyre producers
for car market data; Company elaborations and estimates based on public
announcements and third party data for Car Capacity data; for 2019-2022 period
assuming all new capacity installed is ≥18” and deployment according to latest available
public announcements (possible slowdowns in capacity deployment not included in
figures)
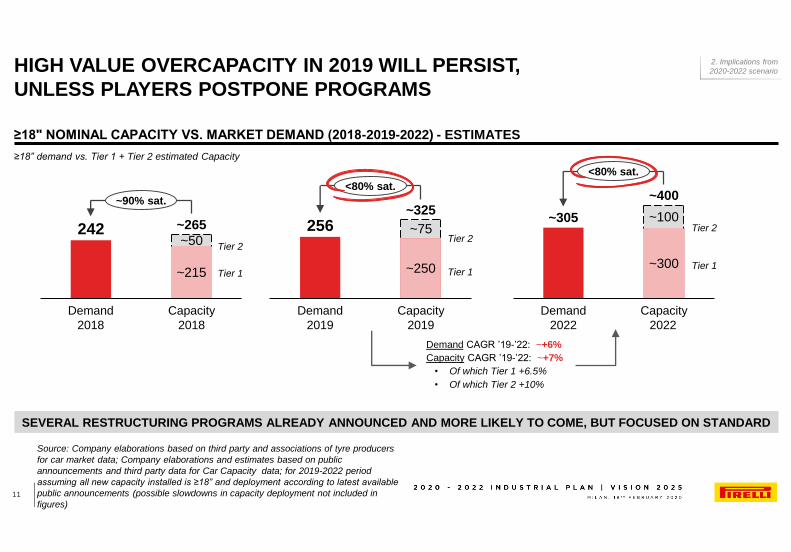
HIGH VALUE OVERCAPACITY IN 2019 WILL PERSIST,
UNLESS PLAYERS POSTPONE PROGRAMS
11
256
Demand
2019
Capacity
2019
~325
~75
~250
<80% sat.
Capacity
2022
~300
Demand
2022
~100~305
~400
<80% sat.
≥18” demand vs. Tier 1 + Tier 2 estimated Capacity
Demand CAGR ’19-’22: ~+6%
Capacity CAGR ’19-’22: ~+7%
• Of which Tier 1 +6.5%
• Of which Tier 2 +10%
Tier 1
Tier 2
Tier 1
Tier 2242
Capacity
2018
Demand
2018
~50
~215
~265
~90% sat.
Tier 1
Tier 2
SEVERAL RESTRUCTURING PROGRAMS ALREADY ANNOUNCED AND MORE LIKELY TO COME, BUT FOCUSED ON STANDARD
≥18" NOMINAL CAPACITY VS. MARKET DEMAND (2018-2019-2022) - ESTIMATES
2. Implications from
2020-2022 scenario

TECHNOLOGY & BRAND CAN LIMIT PRICE PRESSURE
IN HIGH VALUE
12
Source: Pirelli Survey on CRM contacts (2019)
NOISE CANCELLING SEAL INSIDE
~+20%
~+10%~+15%
Specialty Non-Specialty
RUNFLAT
TECHNOLOGY FOR EVs ANOTHER KEY COMPETITIVE BARRIER
Product choice factor analysis 2019, Premium target (EU) % replies
“important” and “very important” (scale 1-5)€ Sell-out price for tyre, same Product Line, Specialty vs. non-Specialty
TECHNOLOGIES (E.G. RUNFLAT, PNCS,
SEAL INSIDE) WITH HIGHER ADDED VALUE
PREMIUM CONSUMERS MAINLY LOOK
FOR PRODUCT PERFORMANCE, BRAND AND SAFETY
80%
35%
Performance
Brand
Safety
Design
Price
2. Implications from
2020-2022 scenario

Source: Company elaborations based on third party and associations of tyre
producers car market data; minor restatements on past data may occur
17" THE ONLY SEGMENT GROWING IN STANDARD
13
~78
88%EU, N. America, APac 89%
2018A
89%
2021E2019A
89%
2020E
88%
2022E
Other regions
82 77 75
-6% -2%
76%
2018A 2022E
76% 76% 76%
2019A 2021E2020E
76%
Other regions
1.305
EU, N. America, APac
1.235 1.269 ~1,370
+3% +3%
~3%
~2.5%
CAGR
19A-22E
3.4%
3.5%
CAGR
16A-19E
~0.5%
<0.5%
CAGR
19A-22E
-2.0%
-2.6%
CAGR
16A-19E
80%81%
2019A2018A
79%
2020E
=17”
2021E 2022E
79% 79%
~1,300
≤16”
1,352 1,315 1,295
-3% -2%
(million vehicles)
SYNERGIC CAR
PARC
(million vehicles)
SYNERGIC CAR
PRODUCTION
≤17” O.E. + REPLACEMENT
TYRE MARKET(million tyres)
-0.3%
>1%
CAGR
19A-22E
-0.8%
-0.6%
3.4%
CAGR
16A-19E
-1.5%
2. Implications from
2020-2022 scenario

Source: Company elaborations based on third party and associations of tyre
producers car market data; minor restatements on past data may occur
MARKET DEMAND CONTINUOUSLY REPOSITIONING TOWARDS
HIGH END SEGMENTS
14
86%
11%10%
236
11%
82%
5%9%
2016A
7%
83%
2019A
7%
82%
2020E
8%
2022E
≥18”
17”
≤16”
246255
247
17”
1,299
64%
17%
14%
18%
69%
2016A
18%
18%
2022E
≥18”
≤16”
1,326 1,320 1,354
18%
2019A
62%
21%
2020E
61%
19%
STANDARD REGIONS
(ALL OTHER REGIONS)
(million tyres)
(million tyres)
H.V. REGIONS
(EU, NA, APAC)
6.6%
0.2%
1.3%
9.8%
>3%
~0.5%
>1%
>5%
CAGR
16A-19A
CAGR
19A-22E
3.1%
-1.9%
0.7%
9.3%
>1%
<-1%
>0.5%
>6%
CAGR
16A-19A
CAGR
19A-22E
2. Implications from
2020-2022 scenario

15
Pursue High value approach…
…With a higher O.E. / homologation selectivity
Keep pruning low-rim Standard
Accelerate structural Cost
Competitiveness Program
H.V. capacity already in place:
low CapEx-intensity in New Plan
RESILIENT HIGH VALUE DEMAND
OVERCAPACITY/PRICE PRESSURE
INNOVATION AND BRAND LEADERS
CAN LIMIT COMPETITIVE PRESSURE
STANDARD 17” IS A GROWING MARKET WITH
DOUBLE-DIGIT REPLACEMENT PROFITABILITYLeverage on Sustainable approach to gain
competitive advantage
EVOLUTION TO DATE 2020-2022 SCENARIO IMPLICATIONS
>
>
>
>
2. Implications from
2020-2022 scenario
1. Evolution
to Date

PIRELLI EVOLUTION TO DATE & STRATEGIC DIRECTION
16
EVOLUTION TO DATE
IMPLICATIONS FROM 2020-2022 SCENARIO
STRATEGIC GUIDELINES & KEY 2020-2022 PROGRAMS
2020-2022 TARGETS AND ENABLERS
2025 VISION
1
2
3
4
5

STRATEGIC GUIDELINES 2020-2022
17
REPOSITION IN STANDARD, WITH LOW-COST SOURCES IN LATAM & RUSSIA
HIGH VALUE IS PIRELLI’S “TRUE NORTH”
─ Sustainability-driven innovation
─ Brand
─ Structural cost competitiveness
─ Speedy capture of opportunities through data-rich insights
RAISE COMPETITIVE BARRIERS FASTER:
3. Strategic guidelines &
key 2020-2022 programs

BUSINESS MODEL STRENGTHENED THROUGH 3 KEY MAJOR
PROGRAMS, BACKED BY A MORE CONTAINED INVESTMENT
18
HIGHER FREE CASH FLOW GENERATION
Contained Investment Program
COST
COMPETITIVENESSCOMMERCIAL
DEVELOPMENT
TECHNOLOGY-BASED
INNOVATION
3. Strategic guidelines &
key 2020-2022 programs

1. Net of inflation
01. COST COMPETITIVENESS: 2 WAVES, REACHING
~510M€ EFFICIENCY IMPROVEMENT GROSS OF INFLATION
19
Gross impact Gross impact
Total ’20-’22
Manufacturing
Product Cost
Organization
SG&A
~ €180 mln
~ 2.5 %
~ €330 mln
~ 4.0 %
~ 4.0 % ~ 7.5 %
~ €110 mln ~ €180 mln
~ €510 mlnTotal Gross Impact
as % of 2019 cost baseline ~ 6.5 %
~ 11.5 %as % of 2019 cost baseline
~ €290 mlnTotal Net Impact1
WAVE 2 – 2021-2022
~ 28%
~ 28%
~ 12%
~ 18%
~ 36%
~ 33%
Weight on
Wave 1
Weight on
Wave 2
WAVE 1 - 2020
3. Strategic guidelines &
key 2020-2022 programs
~ 22%
~ 22%

02. COMMERCIAL DEVELOPMENT
20
2019 A
2022 E
~64M
~69M
≤17” ≥18”
~+9Min ≥18"
~-4Min ≤17"
Time-to-Market
reduction
78% Specialties and
≥19" Non-Specialty
Slight erosion on
O.E.; high-teens
lifecycle profitability
Flattish,
Slight erosion
17” Growth through
Product Renewal
Replacement Push-Through
O.E.: selective growths
(Integrated Lifecycle Profitability)
Replacement Pull-Through >Product &
Manufacturing
Cost Reduction
VOLUME VARIANCE (CAR) KEY PROGRAMS PRICE POLICY COST IMPROVEMENTS
≤16” Pruning low-rim sizes
& second brands
Major Cost reduction:
Footprint (Bollate)
Low Cost Plants
(Kirov, Campinas)
Efficiency
>
>
>
>
3. Strategic guidelines &
key 2020-2022 programs

APPROACH
NEW
TECHNOLOGIES
DEVELOPMENT &
ENGINEERING
PRODUCT
03. TECHNOLOGY-BASED INNOVATION:
ACCELERATING PRODUCT INNOVATION
21
Fast-pace product renewal
• H.V. homologated product families renewed, with Specialties available
in most of the new Product Lines
• 15 push-through lines, regionalized
• Reduced time-to-market
• Modularity & Commonality Virtualization in Design & Testing
• ELECT EV “Marked” portfolio
• Entering the second stage of Cyber Innovation
New Development & Engineering approach, derived from F1 & Motorsport data driven experience
Working in parallel on Medium-term opportunities
~+40% New Product Lines
in ’20-’22 vs. ’17-’19
-30% development time
>1/3 2020-2022
homologations
projects on EVs
Product roadmap led by an eco & safe design approach from cradle to grave
• Significant increase in the use of renewable and recycled materials, and decrease of fossils
• Max technological trade-off between low environmental impact and safety performances
• Consumer portfolio accompanying the transition towards smart and micro-mobility
• Supply chain co-operating in the development of high added value solutions, resilient in ESG risk management
3. Strategic guidelines &
key 2020-2022 programs

HIGH TECH AND ECO-EFFICIENT MANUFACTURING FOOTPRINT
22
Full High Value Capacity H.V. / Std. Capacity
PIRELLI MANUFACTURING FOOTPRINT:
HIGH-TECH & ECO-EFFICIENT
> 9 Car Fully High Value, of which 6 new / robotized
> Bollate Plant converted to Premium Velo
2 Production Hubs in Low Cost Countries serving
closer High Value markets: LatAm for N. America and
Russia for Europe
>
IN 2022 18 PLANTS (~82% LOW COST COUNTRY)
> 100% renewable electricity worldwide by 2025
> Group Carbon Neutrality by 2030
> Commitment to the Science Based Target initiative,
in alignment with our CO2 emissions reduced strategy
> Excellence in water management
> Zero waste to landfill
AN INDUSTRIAL ENVIRONMENTAL
FOOTPRINT SUBSTANTIALLY REDUCING
Velo
Moto
3. Strategic guidelines &
key 2020-2022 programs

ALREADY REACHED OPTIMAL CAPACITY IN HIGH VALUE,
LEADING TO A CONTAINED INVESTMENT PLAN
23
2020-2022 INVESTMENT PROJECTS HIGHLIGHTS
• Focus on Specialties and mix/quality improvement
• Ongoing Restructuring Plan (Italy & Brazil) 2017-2019A
2020-2022A
H.V. Capacity
(increase + conversion)
Tech upgrade &
productivity
improv.
Maintenance
& others Total
€1.3 bln
€0.9 bln
Capacity ≥18” Capacity ≤17”
22
(29%)
38
(54%)
33
(46%)
2016 A
27
(35%)
612
50
(65%)
2019 A
3 5
53
(71%)
2022 E
7177 75
• 10 increase
• 2 conversion
HIGH VALUE CAPACITY CONSISTENT WITH DEMAND
• H.V. Capacity already increased strongly in 2017-2019
(Europe, China and Mexico)
• 2020-2022 further H.V. Capacity mainly from Conversion
STANDARD CAPACITY REDUCTION: -11m pcs in 6 years
mainly in EMEA & LatAm. Saturation ~90% in 2022 (70% in
2019)
CAR CAPACITY
CAPEX PLAN
million pcs
3. Strategic guidelines &
key 2020-2022 programs

ALWAYS IN TOP 3 POSITIONS
IN KEY MARKETS
MOVING EFFORTS DOWN
THE CONSUMER JOURNEY
1. Considering several parameters: Top-of-Mind Brand, Brand Awareness, Brand
Consideration and Brand Conversion (Top Choice)
REINFORCING OUR ICONIC BRAND FOR PREMIUM CONSUMERS
24
35%41%
22%
27%
42%32%
2019 A
Conversion
2022 E
Awareness
Consideration
2019 Pirelli Brand Tracking Premium Consumers1 Pirelli Global Brand Investments in Consumer
Journey funnel, 2019 and 2022
Sponsorships
Focus
on US
1
2 3
BRAND INITIATIVES RELEVANT
FOR PREMIUM CONSUMERS
1
2 3
1
2 3
1
2 3
3. Strategic guidelines &
key 2020-2022 programs
PIRELLI EVOLUTION TO DATE & STRATEGIC DIRECTION
25
EVOLUTION TO DATE
IMPLICATIONS FROM 2020-2022 SCENARIO
STRATEGIC GUIDELINES & KEY 2020-2022 PROGRAMS
2020-2022 TARGETS AND ENABLERS
2025 VISION
1
2
3
4
5

€ billion
2020-2022 TARGETS
1. Assuming average 40% dividend pay-out on consolidated net income in the 2020-
22 Industrial Plan26
CapEx
Net Cash Flow bef. Dividends
Net Sales
cum. ’20-’22
~0.9
2022 E
~2.5
cum. ’20-’22
~1.5
~5.8
2019 A
0.39
3.5
0.33
5.3
~0.3
2020 E
~3.3
~0.4
~5.4
o/w
~0.5 in ’21
~0.6 in ’22
adj. EBIT 0.9 ~ flat YoY
18% ÷ 19%margin 17.2%
vs. cum
‘17-’19 ~1.3
Net Financial Position (IFRS 16)1
4. 2020-2022 Targets
and Enablers

1. Eco-Safety Performance products, previously named “green performance
products”, identify car tyres that Pirelli produces throughout the world and that fall
only under rolling resistance and wet grip classes A, B, C according to the labeling
parameters set by European legislation
PIRELLI REMUNERATION SYSTEM ALLIGNED WITH
INDUSTRIAL PLAN
27
COMPENSATION MIX FOR KEY MANAGEMENT
• No more than 50% of Total Annual Direct Compensation on reaching all objectives at
target level
FIXED COMPONENT
• Cash incentive based on key Financial objectives (Group Adj. Ebit, Net Income, Net Cash
Flow before dividends) and Sustainability (Eco-Safety Performance1 Revenues)
• On/off condition: Group Net Cash Flow before dividends
• 25% deferred to the next year
SHORT-TERM INCENTIVE (1/3 of total variable compensation)
• Cash plan based on 3 key objectives: Relative TSR vs. Tier1 peers; 2020-22 Cumulated
Group Net Cash Flow before dividends; on-going inclusion in Sustainability Indices
(Dow Jones Sustainability World Index ATX Auto Component sector, CDP scoring)
• Rolling plan: every year starting a new 3-year period
• Payment in 2023 and at the end of each 3-year vesting period
LONG-TERM INCENTIVE PLAN 2020-22 (2/3 of total variable compensation)
ALL VARIABLE COMPONENTS ARE CAPPED
NON-COMPETITIVE AGREEMENT
CLAW-BACK CLAUSES KEY MANAGEMENT
IN BOTH MBO AND LTI PLANS
REMUNERATION STRUCTURE to be approved by the Shareholders’ Meeting (June 18, 2020)
4. 2020-2022 Targets
and Enablers

GOVERNANCE CONFIRMED BY RENEWED
SHAREHOLDERS’ AGREEMENT
28
Pirelli Technological
know-how never be
transferred unless
approved by 90% of
Pirelli shareholders
Pirelli By-Laws shall be
inspired by
international best
practices
Focus on Diversity value:
gender, age, seniority, nationality,
educational background and
work-experience
Board made of highly qualified
Members with a suitable mix of
skills.
Independent directors shall be
the majority of the Board
The partnership acknowledges: (i) Pirelli is a company
specialised in high quality and technology products, (ii)
loyalty, professional skills and expertise of the
management, key factor for the Company success and
business growth
Leading role of Marco Tronchetti Provera in the
designation of his successor
Pirelli headquarters
shall remain in Milan
(Italy) unless approved
by 90% of Pirelli
shareholdersTransactions with related
parties to be governed by best
International practices with a
key role of the Committee for
Related Parties Transactions
Pivotal role of the top management to maintain quality
standards, to preserve and value Pirelli industrial
legacy
One-fifth of the Board
shall be appointed by
minority shareholders
Pirelli Chief Executive Officer to lead top management
and ensure Pirelli business culture continuity
Pirelli Recruiting, Career Plans and incentive schemes
to match management and shareholders interests.
Incentive plan targets consistent with Pirelli Strategic
Plan, and in line with the best practices for listed
Companies (e.g.: TSR, sustainability)
BY-LAWS BOARD OF DIRECTORS SHAREHOLDERS AGREEMENT
Internal committees in line with
the best practices, with
independent directors having a
key role.
4. 2020-2022 Targets
and Enablers
PIRELLI EVOLUTION TO DATE & STRATEGIC DIRECTION
29
EVOLUTION TO DATE
IMPLICATIONS FROM 2020-2022 SCENARIO
STRATEGIC GUIDELINES & KEY 2020-2022 PROGRAMS
2020-2022 TARGETS AND ENABLERS
2025 VISION
1
2
3
4
5

10.711%
2015
7%
93%
9%
89%91%
2018 2020
15%
85%
2022
>20%
<80%
2025
Shared &
Services1
Private
Ownership
9.6
11.512.2
13.3
1%5%
11%
20%
~30%
20182015 2020 2022 2025202020182015 2022 2025
272340
399465
577+8%
+8%+8%
+7%
1. Category includes Car Sharing, Ride-Hailing, Rental Fleets, Private and Company
Leasing Cars; 2. EVs include BEV (Battery Electric Vehciles) and PHEV (Plug-in
Electric Vehicles)
KEY DYNAMICS IN 2025
30
10.7
202520182015
13.3
2020 2022
9.6
11.512.2
+4%+4%
+3%+3%
Car Global Miles Driven (billion)
n.a.% EV on Global Parc 1% 2% 5% 9%
MILES DRIVEN KEEP GROWING CONSTANTLY
Car Global Miles Driven (billion) by ownership model
SHARED & SERVICES GETTING RELEVANT
Global # of Households with > $75k annual Income
«HIGH-END» CONSUMERS KEEP GROWING
% EV2 Penetration on Global Premium & Prestige production
ELECTRIC CARS RELEVANT
ALSO IN REPLACEMENT
5. 2025 Vision

Note: “Connected” refers to cars with mobile data connection (e.g. 2G, 3G, LTE),
which might be provided by either embedded car systems or car hardware paired with
external devices (e.g. smartphone), “Electric” refers to BEV / PHEV
Source: company analysis on consulting and investment banks research reports
CAR TRENDS ‘2020-’2025: SOLUTIONS FOR ELECTRIC & CONNECTED
31
PRODUCTION PARC
~11%2020E
~30%2025E
~2%
~9%
ELECTRIC
Prestige & Premium
CONNECTED
Prestige & Premium
• First phase of technology Development and testing
in F2/Motorsport completed
• Entered an industrialization phase, with Premium
O.E. Partners and an open ecosystem of Partners
in Semiconductors, Manufacturers and Tyre makers
~71%2020E
~all2025E
~30%
~52%
• O.E. Partnership with top-end OEMs and start-up
innovators over 1/3 of O.E. Homologations
pipeline
• ELECT: Distinctive Marking Strategy to ensure BEV
tyre Replacement with tyre designed for BEVs
PIRELLI SOLUTIONSMARKET PENETRATION (%) IN PRESTIGE & PREMIUM
5. 2025 Vision

CORONAVIRUS DISEASE (COVID-19) – PREVENTION AND READINESS
32
• Travels to and from China are blocked and all travels to APAC are
discouraged.
• APAC expatriates were returned to their homeland together with their
families.
• All personnel coming back from China cannot return to workplace
before 15 days after the day of arrival.
• A 24/7 hotline with specialized medical support is available.
• Continuous monitoring of the disease evolution in direct connection with
national and international Organizations.
• Availability of prevention and emergency kits (e.g. masks, hand
sanitizer dispensers, increased cleaning frequency of workplaces).
• Sanitizing and disease prevention training for all employees.
GROUP MEASURES FOCUS CHINA
• Body temperature checks applied to all people entering Pirelli facilities.
• In addition, employees are checked twice during their shift.
• All employees must wear approved masks (provided by Pirelli).
• All incoming trucks are disinfected before entering the factories.
• The workplaces are disinfected every 3 hours.
• First aid rescue team linked with authorized hospitals has been established.
• All employees receive regular pay.
• Smart-working is encouraged.
• 5 Million RMB donated to Coronavirus Relief Efforts
through the Yanzhou Charity Federation of Jining city,
Shandong Province.
• 90,000 N95 masks, 350,000 general medical masks,
500 thermometers, and 86,000 gloves sent directly to
China from Italy, Germany, Mexico, Argentina.
SUPPORT TO CHINA PREVENTION CONSTANT MONITORING
ALL OTHER COUNTRIES
• Adopt all Group measures.
• Availability of prevention and emergency kits.
• Continuous monitoring of specific Country’s disease evolution.
5. 2025 Vision

CORONAVIRUS DISEASE (COVID-19)
– PRELIMINARY SENSITIVITY ANALYSIS
33
PIRELLI IN CHINA
2019 Total Capacity: ~14 million car pcs, 1.4 million Moto pcs
% of Export: ~25% mainly within Apac
CHINA CONTRIBUTION:
• Temporary closure of 2 plants;
Yanzhou is running at low capacity utilization
• Shanghai office (APAC HQ) closed. Region managed by Tokyo and
Singapore offices.
• No delays in export and flows guaranteed today. Alternative flows
identified and available. No problems world wide for Chinese
components and Raw Material with alternative sources already
activated.
• In 1Q lower business seasonality (New Chinese Year);
• Current February Sales Volume -80% vs normal business activity; March
projection in recovery to -30% vs normal business activity.
• Impact of ~ -€30 million on 1Q adj. EBIT, expected to be offset during
the year (easing raw mat and pricing pressure with lower overseas
supply)
• Should the emergency be extended to 2Q, an update will be provided with
1Q results in May, on both impacts and additional countermeasures
Full High Value Capacity High Value/ Standard Capacity
CURRENT SITUATION
ESTIMATED IMPACT
Shenzhou Car (JV) –Shandong province
Jiaozuo Car –Henan province
Yanzhou Car / Moto –Shandong province
• ~12% Group Sales
• High teens weight on Group Adj EBIT
5. 2025 Vision
AGENDA
PIRELLI EVOLUTION TO DATE & STRATEGIC DIRECTION
PIRELLI STRATEGY DEPLOYMENT: PILLAR 1 – COST COMPETITIVENESS
2019 FINANCIAL REVIEW AND 2020-2022 TARGETS IN DETAIL
APPENDIX
PIRELLI STRATEGY DEPLOYMENT: PILLAR 2 - COMMERCIAL DEVELOPMENT
2020-2022 SCENARIO
PIRELLI STRATEGY DEPLOYMENT: PILLAR 3 – TECHNOLOGY-BASED INNOVATION

BUSINESS MODEL STRENGTHENED THROUGH 3 KEY PROGRAMS, BACKED
BY A MORE CONTAINED INVESTMENT
34
HIGHER FREE CASH FLOW GENERATION
Contained Investment Program
COST
COMPETITIVENESSCOMMERCIAL
DEVELOPMENT
TECHNOLOGY BASED
INNOVATION

WAVE 1 - 2020
• Smart Manufacturing
• Quality enhancement
• Footprint optimization
• Flexible factory
• Product range management
• Specification optimization
• Purchasing cost optimization
• Modularity
• Design speed
Gross impact
• Organization streamlining
• Pay for performance
• New Skills development
• Belt-tightening on spending
• Marketing effort optimization • Logistic optimization
1. Net of inflation
01. COST COMPETITIVENESS: 2 WAVES, REACHING ~510 M€ EFFICIENCY
IMPROVEMENT GROSS OF INFLATION
35
~ 510 M€
WAVE 2 – 2021-2022
Manufacturing
Product Cost ~ 160 M€
Organization
SG&A
Total Gross Impact
as % of 2019 cost baseline
focusing also on:
~ 6.5 %
~ 160 M€
~ 100 M€
~ 90 M€
~ 110 M€
~ 120 M€
~ 60 M€
~ 40 M€
~ 180 M€
~ 2.5 %
~ 330 M€
~ 4.0 %
~ 11.5 %as % of 2019 cost baseline ~ 4.0 % ~ 7.5 %
~ 290 M€Total Net Impact1 ~ 110 M€ ~ 180 M€
• Digital Processes and
Organization transformation
Gross impactfocusing on:
~ 50 M€
~ 40 M€
~ 40 M€
~ 50 M€
Gross impact
>
>
>
>

PRODUCT COST BENEFITS BY WAVE€ million
▬ LT agreements with strategic suppliers powered
by shared tech roadmaps
▬ Rationalization of supplier portfolio
PRODUCT COST PILLARS – PLAN 2020-2022
36
PRODUCT
RANGE
MANAGEMENT
▬ Value based product portfolio
▬ Push lines design to value
MODULAR
APPROACH TO
TYRE DESIGN
SPECIFICATION
OPTIMIZATION
PROCUREMENT
OPTIMIZATION
~160
Gross benefits
~110
~50
Wave 221/22
Wave 12020
>
▬ Activities on the existing and future product range
to maximize performance and reduce product cost:
• Tyre structure simplification
• Weight reduction
▬ Material portfolio de-complexity with rationalization
of semi-finished components
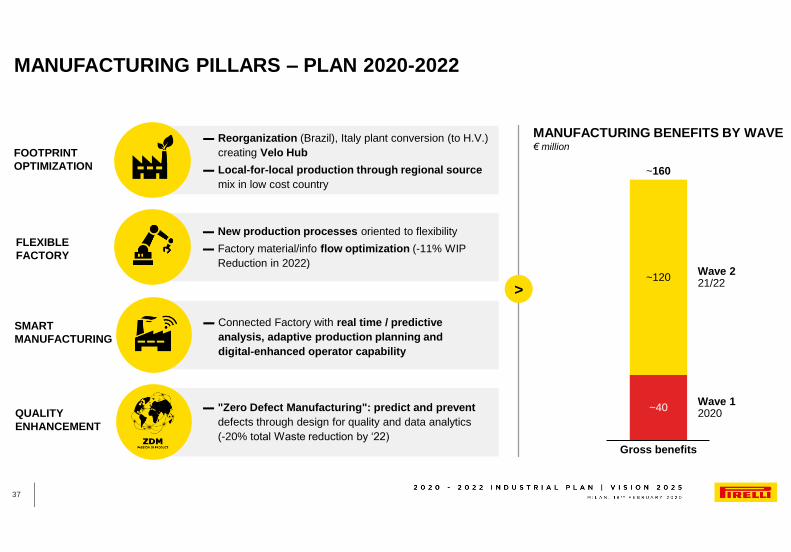
▬ Reorganization (Brazil), Italy plant conversion (to H.V.)
creating Velo Hub
▬ Local-for-local production through regional source
mix in low cost country
FLEXIBLE
FACTORY
SMART
MANUFACTURING
QUALITY
ENHANCEMENT
FOOTPRINT
OPTIMIZATION
Wave 221/22
~120
~160
Gross benefits
~40Wave 12020
MANUFACTURING PILLARS – PLAN 2020-2022
37
▬ New production processes oriented to flexibility
▬ Factory material/info flow optimization (-11% WIP
Reduction in 2022)
▬ Connected Factory with real time / predictive
analysis, adaptive production planning and
digital-enhanced operator capability
▬ "Zero Defect Manufacturing": predict and prevent
defects through design for quality and data analytics
(-20% total Waste reduction by ‘22)
MANUFACTURING BENEFITS BY WAVE€ million
>

SG&A PILLARS – PLAN 2020-2022
38
MARKETING
& SALES
GENERAL &
ADMINISTRATIVE
LOGISTICS
▬ Logistic network redesign
▬ Distribution optimization through a service level
segmentation
Gross benefits
~60
~40
Wave 221/22
Wave 12020
~100▬ Reduce effort in awareness initiatives in the consumer
journey, favoring conversion actions
▬ Advanced digital marketing tools reducing customer
acquisition cost
▬ Structural belt-tightening on professional services,
travel, HQ overheads and Service Level
Agreements across regions
SG&A BENEFITS BY WAVE€ million
>

Wave 12020
Wave 221/22
Gross benefits
~50
~40
~90
ORGANIZATION PILLARS – PLAN 2020-2022
39
ORGANIZATION BENEFITS BY WAVE€ million
>
ORGANIZATION
STREAMLINING
NEW SKILLS
DEVELOPMENT
PAY FOR
PERFORMANCE
▬ Enhancement of the incentive schemes
effectiveness, increasing the weight of the variable
remuneration on the total compensation
▬ Business processes reengineering supported by new
ways of working enabled by the digital transformation
▬ Changing the mix of the available capabilities through
reskilling program and development
of digital skills

40

AGENDA
PIRELLI EVOLUTION TO DATE & STRATEGIC DIRECTION
PIRELLI STRATEGY DEPLOYMENT: PILLAR 1 – COST COMPETITIVENESS
2019 FINANCIAL REVIEW AND 2020-2022 TARGETS IN DETAIL
APPENDIX
PIRELLI STRATEGY DEPLOYMENT: PILLAR 2 - COMMERCIAL DEVELOPMENT
2020-2022 SCENARIO
PIRELLI STRATEGY DEPLOYMENT: PILLAR 3 – TECHNOLOGY-BASED INNOVATION

CAR SALES IN DOWNTURN CYCLE, HOWEVER CARS FITTING ≥18” TYRES
GROWING AT HIGHER RATE
41
89
430
2022E
312323 309
2016A
364
108
2019A
111
2020E
434453420
122
-1.7% 0.3%
≥18 ≤17
11.5
2022E2016A
12.6
81.6 76.8
11.9
2019A
75.1
12.1
88.7
2020E
78.0
90.793.1 87.2
-1.6% 0.7%
Prestige & PremiumSynergic
+1.2%
-2.0%
CAGR
16A-19A
CAGR
19A-22A
~+2%
~+0.5%
+6.4% +4.3%
WORLD CAR PRODUCTION WORLD O.E. TYRE MARKET
million vehicles million tyres
CAGR
16A-19A
CAGR
19A-22A
-3.9% -1.1%

Source: IHS november 2019, Company elaborations based on third party and
associations of tyre producers market data
HIGH VALUE REPLACEMENT TYRE MARKET:
RESILIENT ALSO IN A MORE DIFFICULT SCENARIO
42
106148 160 184
1,146
991986
1,082
975 992
1,1411,175
1.8%1.0%
153 1611764
3130
1,148
1,4691,426
1,5554
1,3741,269
41,281
1,305
3.6%
2.9%
WORLD CAR PARC
million vehicles million tyres
CAGR
16A-19A
CAGR
19A-22A
PremiumSynergic Prestige≥18" ≤17"
+0.6% -0.1%
+5.7%
+3.4%
~+4.9%
~+2.5%
2022E2016A 2019A 2020E 2022E2016A 2019A 2020E
WORLD REPLACEMENT TYRE MARKET
CAGR
16A-19A
CAGR
19A-22A
+11.7% +7.5%

KEY DRIVERS OF GLOBAL HIGH VALUE MARKET GROWTH
43
Confirmed
NEWSynergic
“Premiumization”
Car Platform
modularity
Adding new
specialties
SUV further
segmentation
Electric
and Connected
acceleration
Autonomous and
Sharing slow down
Penetration of
Premium &
Prestige cars
Increase in number
of homologations
Growing demand
for specialties
Rising penetration
of SUVs
New Car
technologies
1 2 3 4 5
Source: IHS and Company elaborations based on third party and associations of tyre
producers car market data, restated vs. Nov.17 estimates (wider perimeter), minor
restatements on past data may occur;
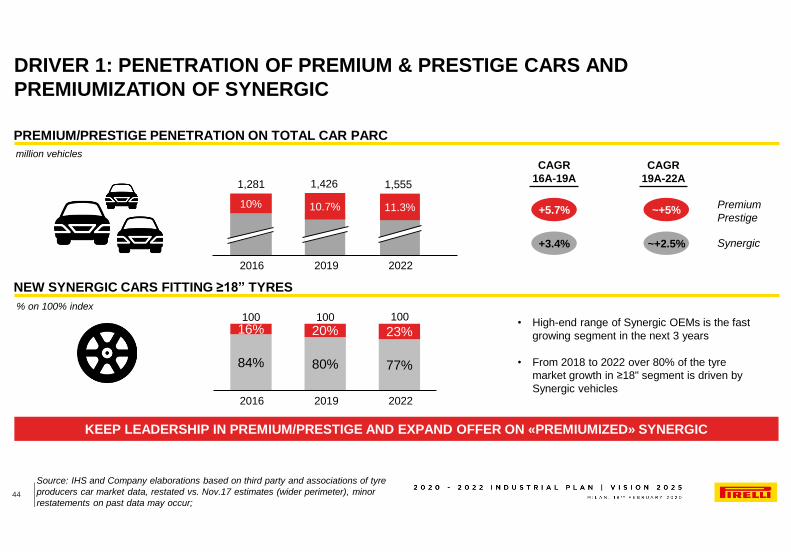
DRIVER 1: PENETRATION OF PREMIUM & PRESTIGE CARS AND
PREMIUMIZATION OF SYNERGIC
44
• High-end range of Synergic OEMs is the fast
growing segment in the next 3 years
• From 2018 to 2022 over 80% of the tyre
market growth in ≥18" segment is driven by
Synergic vehicles
Premium
Prestige
Synergic
+5.7%
+3.4%
~+5%
~+2.5%
KEEP LEADERSHIP IN PREMIUM/PRESTIGE AND EXPAND OFFER ON «PREMIUMIZED» SYNERGIC
10% 10.7% 11.3%
1,281 1,426 1,555
84% 80% 77%
16% 20% 23%
2016 2019 2022
100100 100
PREMIUM/PRESTIGE PENETRATION ON TOTAL CAR PARC
2016 2019 2022
NEW SYNERGIC CARS FITTING ≥18” TYRES
CAGR
16A-19A
CAGR
19A-22A
million vehicles
% on 100% index

SELECTED HOMOLOGATION PORTFOLIO TARGETING NEW TRENDS
Number of Models by OEM1
Source: IHS Markit @ July 2019 & Pirelli Alternative Propulsion @ June 2019,
Company elaborations based on third party data relative o car market and on data of
local associations of tyre producers;
Note: If a car model has both the tradition and BEV version, it is counted as double
DRIVER 2: INCREASING NUMBER OF CAR MODELS PER BRAND
45
Summer 18” 235/60R18standard
SEASONALITY RIM
19”235/55R19
255/50R19standard
235/55R19
255/50R19self sealing
20”235/50R20
255/45R20self sealing
21”235/45R21
255/40R21self sealing
All Season
SPECIALTY ROOT
19”235/55R19
255/50R19self sealing
20”235/50R20
255/45R20standard
Winter 19”235/55R19
255/50R19self sealing
1214
17
5
15
24 25
5
21
27
31
6
19
29 29
9
2730 30
10
11 142 5 2
10
3
10
5
Range coverage
optional
Volkswagen MEB ID 4
Audi PPE Q4 E-Tron
optional
Skoda MEB Vision E
ADDING ELECTRIC PLATFORM
TO EXISTING ONES…
…AT THE SAME TIME EXPLOITING PLATFORM MODULARITY AND
TYRE HOMOLOGATION SYNERGIES
2010 202020182015 2022
20202018 202220152010BEV models
ICE models

REINFORCING LEADERSHIP ON SPECIALTIES ADDRESSING SPECIFIC CUSTOMER SEGMENTS
DRIVER 3: GROWING DEMAND FOR SPECIALTIES
46
NOISE CANCELLING SYSTEMTM
Sp
ecia
ltie
sN
ew
fro
nti
er
RUNFLAT
SEAL INSIDETM
RACING TYRES
COLLECTION TYRES
CYBER TYRE
PIRELLI ELECT
Leader
New Tech
Development
PRODUCTS CONSUMER FOCUS AND NEEDS SEGMENTATION

76%64%
24%36%
~50%
~50%
Source: IHS Markit January 2020; analyzed the last two X3 and 3-Series programs
DRIVER 4: RISING SUV AND CUV PENETRATION
47
-2.0%
-1.4%
11.9%
7.4%
Avg Fitment 19"
≈ 60% of the car parc is 18up
Avg Fitment 17"
≈ 30% of the car parc is 18up
CAR C
CAR D
SUV D
SUV C
2022201820142012 20222016 2018 20202014
3 Series
X3
CAGR
2012-2022
WORLD CAR REGISTRATIONS: SUVS AND
CUVS ARE REPLACING SEDANS
EXAMPLE: 3-SERIES AND X3 WORLD CAR
REGISTRATIONS
5 NEW SUV LINE LAUNCHED IN 2016-2019, 10 FORESEEN IN 2020-2022

1. Figures refers to autonomous driving levels 4, 5
Note: Connected” refers to cars with mobile data connection (e.g. 2G, 3G, LTE),
which might be provided by either embedded car systems or car hardware paired with
external devices (e.g. smartphone), “Electric” refers to BEV / PHEV
All data refers to Prestige & Premium cars;
Source: company analysis on consulting and investment banks research reports
DRIVER 5: ELECTRIC AND CONNECTED CARS THE KEY TRENDS
48
MARKET PENETRATION (%)
IN PRESTIGE & PREMIUM
REGISTRATION
~all2025E
PARC
2025E ~30% 9%
~52%
2025E n.m. 4%
2025E n.m. n.m.
ELECTRIC
CONNECTED
AUTONOMOUS1
SHARED
LONG-TERM TRENDS
R&D and Innovation projects activated
Higher
load
Lower
Rolling R.Higher
grip
Lower
noise
• O.E. Partnership with Top-end
OEMs and start-up innovators
• Distinctive Marking Strategy to
ensure BEV Tyre Replacement
with tyre designed for BEVs
• Monitoring and interaction
with car connected devices
• Integrated real-time analysis
of tyres and car
performance
• Launched a connected In-Tyre
solution for track amateur drivers
• Working with confidential OEM
partners on in-tyre Homologated
sensors
PIRELLI SOLUTIONSTYRE MARKET NEEDS

49

AGENDA
PIRELLI EVOLUTION TO DATE & STRATEGIC DIRECTION
PIRELLI STRATEGY DEPLOYMENT: PILLAR 1 – COST COMPETITIVENESS
2019 FINANCIAL REVIEW AND 2020-2022 TARGETS IN DETAIL
APPENDIX
PIRELLI STRATEGY DEPLOYMENT: PILLAR 2 - COMMERCIAL DEVELOPMENT
2020-2022 SCENARIO
PIRELLI STRATEGY DEPLOYMENT: PILLAR 3 – TECHNOLOGY-BASED INNOVATION
Source: Company elaborations based on third party and associations of tyre
producers car market data
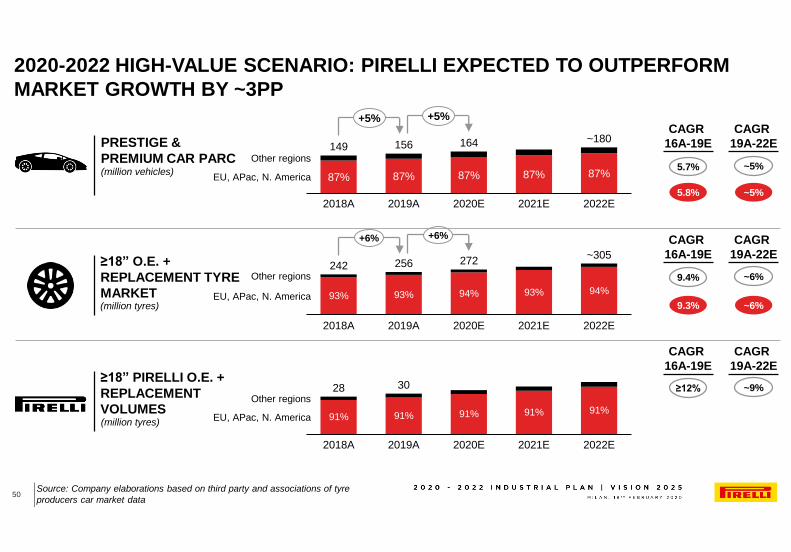
2020-2022 HIGH-VALUE SCENARIO: PIRELLI EXPECTED TO OUTPERFORM
MARKET GROWTH BY ~3PP
50
91%
2018A
91%91% 91%
2019A 2020E 2021E
91%
2022E
Other regions
EU, APac, N. America
28 30
2020E
87%
156
87%EU, APac, N. America
2018A 2019A
87% 87%
2021E
87%
2022E
Other regions149 164 ~180
+5% +5%
5.7%
5.8%
CAGR
16A-19E
~5%
~5%
CAGR
19A-22E
94% 93%
2020E2018A
93% 93%
2019A 2021E
94%
2022E
Other regions
EU, APac, N. America
242 256 272~305
+6% +6%
(million vehicles)
PRESTIGE &
PREMIUM CAR PARC
≥18” PIRELLI O.E. +
REPLACEMENT
VOLUMES(million tyres)
(million tyres)
≥18” O.E. +
REPLACEMENT TYRE
MARKET
9.4%
9.3%
~6%
~6%
≥12% ~9%
CAGR
16A-19E
CAGR
19A-22E
CAGR
16A-19E
CAGR
19A-22E

TOP LINE GROWTH KEY DRIVERS
51
1
Expand in the H.V. Synergic Replacement, covering emerging market and consumer needs
through new products
Reinforce leadership in the H.V. Premium Replacement driven by our core business model
based on O.E. pull-through and enhanced with analytics and big-data
2
3Consolidate leadership in Premium and Prestige O.E., being more selective on higher rims
and new powertrain vehicles
Expand and diversify O.E. customer base to improve our penetration in USA and China
4Plan a consistent landing point on Standard, strongly reducing in H.V. regions
and improving in price/mix

PULLTHROUGH IS PIRELLI'S CONSOLIDATED BUSINESS MODEL
52
Year
Car Registrations O.E. Volumes Repl. Volumes O.E. + Repl. Volumes
• Keep the leadership in the
Premium segment focusing on
technologically advanced products:
Marked tyres, Specialties, EV tyres
• Leverage on geo-localized
analytical coverage to further
improve Pull-Through rate on cars
fitting Pirelli tyres (~80% today)
• Exploit market data analytics to
enable salesforce transformation
towards a customer consultancy
approach
0 1 2 3 4 5 6 7 8 9 10
O.E. + Repl. volumes
O.E. volumes
Replacement volumes
3
2
4
1
Pull-through rate
>80%>

PAST HOMOLOGATIONS ARE GENERATING A GROWING POTENTIAL
IN THE PLAN HORIZON
53
2014 20192015 2016 2017 2018 2020 2021 2022
~10%
2014 2015 2016 20182017 2019 20212020 2022
>10%
≥18” REPLACEMENT
TYRE MARKET
+7.5%
≥18” REPLACEMENT TYRE
MARKET FITTING PIRELLI
288 324 421 447
≥18” PIRELLI SALES @ O.E.
NEW HOMOLOGATIONS ≥18”
3
2
4
1
CAGR
19A-22E

Number of marked IP codes vs. premium competitors
Source: German Product List (Pricat) @ January 2020
PIRELLI HAS AN UNDISPUTED LEADERSHIP ON PREMIUM AND
PRESTIGE MARKED TYRES IN THE ≥18” ARENA
54
600
476
355
266233
1,090
+82% +128% +208% +310% +368%
o/w ≥18”# of O.E.-marked items
Δ vs. Pirelli
PRESTIGE
PREMIUM ≥ 18"
3
2
4
1
OF WHICH SOLE SUPPLIER

STRONG RELATIONSHIP WITH OEMS ALLOWS TO ENHANCE
GO-TO-MARKET EFFECTIVENESS, THROUGH BIG DATA AND
ADVANCED ANALYTICS
55
Homologations
Pirelli proprietary
Early identification of O.E. project targets
based on potential growth
Car parc analysis to identify replacement
pull-through potential
Maximize coverage in location with
concentrated homologated potential
OEM’S
Projects
Geo-marketing
Car Parc
Car Registrations
Car
Productions
Market Data
POS Data
DATA
LAKE
>20B
LINES
3
2
4
1
BIG DATA TO COMBINE COUNTLESS DATA SOURCES CUSTOMER CENTRIC PREDICTIVE CAPABILITIES
>

TOOL AVAILABLE IN OUR SALESFORCE.COM PLATFORM
TAKE “PULL-THROUGH STRATEGY” TO A NEW “PRECISION LEVEL”
US: 5.0M EU: 15.9M
CN: 4.6M
Premium car parc: 160 million cars
Mercedes
32.4M
Mercedes-EU car parc:
15.9 million cars
E-Class
2.17M
Mercedes E-Class GERMANY:
713K cars
MY 2016
138K
764
From Car Parc to
Tyre Potential
400
19"
1,164 tyres
ST: 3088 BE: 7,080
1010 2020
16
UK: 240 K
ITA: 186K
GER: 713KMercedes E-Class (MY 2016)
BERLIN: 7,080 cars
3
2
4
1
MU:3,197
56
>
>
>

Safety in every drivingcondition
Known and highquality brand
High mileage tyre
Confortable driveProduct with eco-friendly materials
Value for moneyproduct
Original Spare partsjust like the original
equipment
Premium Synergic
EXPANDING HIGH VALUE BOUNDARIES USING BIG DATA TO IDENTIFY
HIGH-END SYNERGIC CONSUMER NEEDS
57
In particular in US
In particular in ChinaIn particular in Europe
3
2
4
1

THROUGH A DEDICATED PRODUCTS PORTFOLIO WITH EXPECTED
DOUBLE-DIGIT PROFITABILITY
58
HIGH TECHNOLOGICAL
CONTENT
EFFICIENT PRODUCTION
PROCESSECO-FRIENDLY
APPROACH
FOCUS ON REGIONAL NEEDS
new lines
3
2
4
1
DESIGNED TO ADDRESS SAFETY,
PERFORMANCE & MILEAGE
15

Pirelli retail
29%
2020 E
11%
17%
29%
2018 A
12% 12%
25% 25%
34%
2022 E
Car dealer
Tier 1
Other
channels
2
Expand presence in the
H.V. Synergic Replacement• Complete range to be competitive
across all channels, and mainly to retail
1
Reinforce leadership in the
H.V. Premium Replacement
• Strong presence in car-dealers
through leadership in
homologations
• Redesign presence on major
Tier 1 distributors
• Long-standing agreements
with Fleets
• Solid double digit growth on
Top 5 Tier 1 players in US
• Established share in tyre
manufacturers JVs
• Strong presence in car-dealers
through leadership in homologations
• Established retail network in Tier 1
cities, expanding in Tier 2 cities
• Exploiting e-commerce channel
3
2
4
1
• Continuous focus on car dealers and
high-end retails
Sources: Pirelli Trade Marketing (February 2020)
THE DISTRIBUTION NETWORK WILL COHERENTLY SUPPORT THE
REPLACEMENT REGIONAL STRATEGY
59
Number of POS ~16,000 ~18,000 ~20,000

• Geographical expansion in
APAC and NA, also with
“premiumizing” Synergic
customers
2020-22 ORIGINAL EQUIPMENT: FOLLOWING OUR CUSTOMERS
GLOBALLY, EXPANDING THE CUSTOMER BASE
60
Current customers2019 customer base New customers 2022 customer base
100
109
2-3
6-7
Index:
• Consolidate the
relationships strengthening
our technological
leadership
• GROWTH IN THE
ELECTRIC NEW COMERS
• FOCUS ON ELECTRIC
PLATFORMS
3
2
4
1
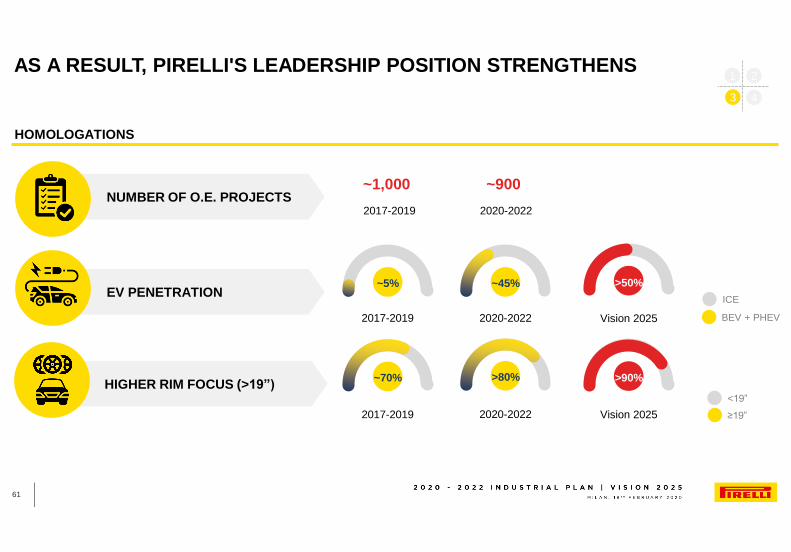
AS A RESULT, PIRELLI'S LEADERSHIP POSITION STRENGTHENS
61
~70%
2017-2019
>80%
2020-2022
>90%
<19”
≥19”
BEV + PHEV
ICE
~5%
2017-2019
~45%
2020-2022
>50%
Vision 2025
Vision 2025
~1,000
2017-2019 2020-2022
EV PENETRATION
HIGHER RIM FOCUS (>19”)
~900NUMBER OF O.E. PROJECTS
3
2
4
1
HOMOLOGATIONS

STANDARD: CAR TYRE REDUCTION PLAN CONTINUES,
AT A LOWER PACE
62
-0.6%
Market Standard CAGR 16-19
-0.3%
CAGR 19-22
-9.0%
Pirelli CAGR 16-19
~-4%
CAGR 19-22
% of Volume by Region Cluster
STANDARD REGIONS
≥18"
≤17"
TOTAL STANDARD
3
2
4
1
% of Standard on Total
LANDING POINT @ 2022
Volume
Net Sales
68%
48%
2016
53%
35%
2019
43%
30%
2022
82
18
62
3879
21
71
29
Europe, Nafta, APac
86
14
Market
48
5294
7 14
86 92
8 19
81
Other Regions
95
5 7
93
Market Market Market Market Market
H.V. REGIONS
2019 20222016 2019 20222016
% of Volume by Region Cluster

THREE KEY LEVERS TO MAXIMIZE VALUE
63
PRODUCT MIX
IMPROVEMENT
INDUSTRIAL
FOOTPRINT
OPTIMIZATION
BETTER
PRICE POINT
▬ Reduction strategy coherent with price protection
▬ Focus on segments less exposed to Tier 2 and Tier 3 competition
▬ Mix shift towards 17” (~+1.5 million, in line with market growth)
▬ Exit from 13” and second brands (except in LatAm and Russia)
▬ Focus on more profitable segments (SUV, All Season)
▬ Competitive sourcing (Kirov, Campinas, Jiaozuo)
▬ Industrial mission re-focus (Bollate)
▬ Efficiency programs across the board
EBIT MARGIN FROM
SINGLE TO DOUBLE
DIGIT>

64
AGENDA
PIRELLI EVOLUTION TO DATE & STRATEGIC DIRECTION
PIRELLI STRATEGY DEPLOYMENT: PILLAR 1 – COST COMPETITIVENESS
2019 FINANCIAL REVIEW AND 2020-2022 TARGETS IN DETAIL
APPENDIX
PIRELLI STRATEGY DEPLOYMENT: PILLAR 2 - COMMERCIAL DEVELOPMENT
2020-2022 SCENARIO
PIRELLI STRATEGY DEPLOYMENT: PILLAR 3 – TECHNOLOGY-BASED INNOVATION

INNOVATION AND PRODUCT DEVELOPMENT STRATEGIC PILLARS
65
20201. ACCELERATED PRODUCT INNOVATION 2025
• Product roadmap 2020 – 2022
• Innovation for 360° sustainability
• Product cost
• Product modularity
• Design speed
2. COST COMPETITIVENESS
• Material innovation
• Technology innovation
PLAN 2020-2022 VISION 2025
2021 2022
3. INNOVATION FOCUS ON
SUSTAINABLE MOBILITY
1. Accelerated
product innovation

ACCELERATED PRODUCT ROADMAP IN 2020-2022,
WITH 20 NEW LINES
66
5
PULL LINES
2020-2022
PRODUCT ROADMAP
15
PUSH LINES
14lines
2017 - 2019
20lines
2020 - 2022
>40% acceleration
4 9 1412
Higher Rim Focus (>19”)
• Strengthen O.E. leadership
(~2x homologation vs. best competitor)
• Focus on High Mix for Selective O.E.
• Wide and deep product range
• Specialties
• Growing all-season lines
• Support regional lines (5 USA, 3 APAC)
• Focus on Safety & Mileage (USA)
• Focus on Safety & Comfort (APAC)
• Focus Safety & Eco Labels (EU)
1. Accelerated
product innovation
>
INNOVATION SPEED
SELECTIVE O.E. APPROACH
SPECIALTIES
>

PRODUCTS LAUNCHED IN PLAN WILL BE
"SUSTAINABILITY-DRIVEN"
67
Safety performance
• Wet grip
• Driving stability
• Extended mobility
Sustainable performance
• Rolling resistance
• Noise emission
• Wear efficiency
Sustainable Materials
• Recycle material
• Renewable material
• Fossil base material
reduction
Sustainable Product
lifecycle
• Wear rate reduction
• Weight reduction
Sustainable production
• Production process
CO2 footprint reduction
Competitiveness
• Design for value
• Modularity approach:
product
standardization
Design Speed
• Tyre modelling
• Virtual
Performance
Simulation
SOCIAL SUSTAINABILITY CUSTOMER
BUSINESS COMPANY
ECO-SUSTAINABILITY ENVIRONMENT
1. Accelerated
product innovation

PRODUCT COST COMPETITIVENESS BASED ON NEW DESIGN
PRINCIPLES
PRODUCT
COMPETITIVENESS
2020 - 2022
Modular approach tyre design
• Material portfolio decomplexity
• Semi-finished components rationalization
Supporting Waste reduction and
manufacturing Productivity increase
Specification optimization
• Tyre structure simplification
• Tyre weight reduction
Product range management
• Value based product portfolio
• Push lines design to value
FULL POTENTIAL
IN 2025
-10%Product
Cost(~160 M€)
2020 2021 2022
Modularity and design to value
Design to cost
Procurement Optimization
• LT agreements with strategic suppliers
• Rationalization of supplier portfolio
68
2. Cost
Competitiveness

PRODUCT COST COMPETITIVENESS BASED ON NEW DESIGN
PRINCIPLES
PRODUCT
COMPETITIVENESS
2020 - 2022
Supporting Waste reduction and
manufacturing Productivity increase
Specification optimization
• Tyre structure simplification
• Tyre weight reduction
Product range management
• Value based product portfolio
• Push lines design to value
FULL POTENTIAL
IN 2025
-10%Product
Cost(~160 M€)
2020 2021 2022
Modularity and design to value
Design to cost
Procurement Optimization
• LT agreements with strategic suppliers
• Rationalization of supplier portfolio
69
Modular approach tyre design
• Material portfolio decomplexity
• Semi-finished components rationalization
Modular approach tyre design
• Material portfolio decomplexity
• Semi-finished components rationalization
2. Cost
Competitiveness
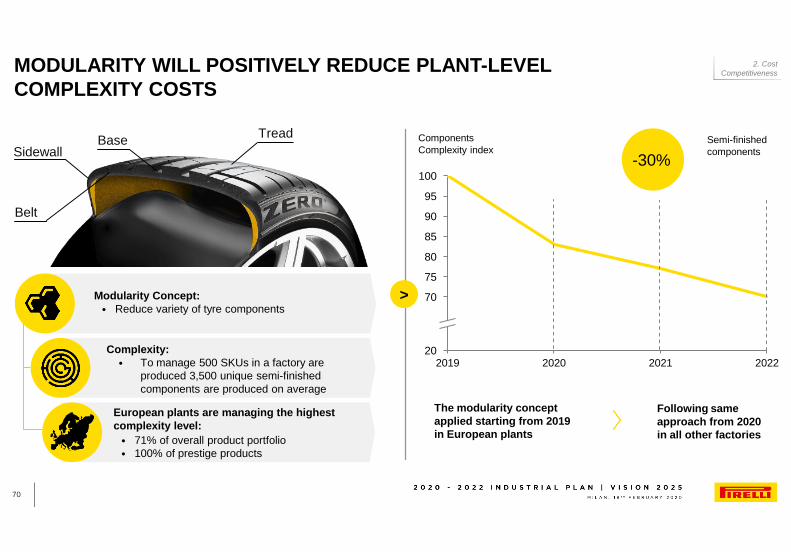
2019 2020 2021 2022
70
20
75
80
85
90
95
100
Components
Complexity index
MODULARITY WILL POSITIVELY REDUCE PLANT-LEVEL
COMPLEXITY COSTS
70
Following same
approach from 2020
in all other factories
Modularity Concept:
• Reduce variety of tyre components
European plants are managing the highest
complexity level:
• 71% of overall product portfolio
• 100% of prestige products
Complexity:
• To manage 500 SKUs in a factory are
produced 3,500 unique semi-finished
components are produced on average
Semi-finished
components
TreadBase
Sidewall
Belt
>
The modularity concept
applied starting from 2019
in European plants
-30%
2. Cost
Competitiveness

TYRE PROPERTIES
VEHICLE PERFORMANCE
SIMULATION
TYRE MODELLING
FULL VIRTUAL PRODUCT DEVELOPMENT TO IMPROVE
TIME-TO-MARKET AND REDUCE COSTS
Virtual modelling & Parametric design
• Material performance prediction
• New design guidelines for modularity
• Performance linked with product cost
Virtual tyre test
• Tyre performance prediction
• Virtual prototype iteration
Performance prediction simulator
• Virtual spec tuning for specific car models
• Virtual outdoor test iteration
• Strong partnership with car makers
(co-design)
-30%
-20%
TIME TO MARKET
PROTOTYPE COSTS
71
DEVELOPMENT PHASE DESCRIPTION
>
2. Cost
Competitiveness

*Science Based Target Initiative commitment
DESIGN FOR SUSTAINABILITY: ACCELERATING THE
INTRODUCTION OF NEW AND INNOVATIVE "GREEN INGREDIENTS"
72
23% 33% 43%62%
7%
15%15%
13%
61%50% 40%
20%
vision 2030
(new product
lines)
predecessor
Cint. P7 blue
target 2025
(new product
lines)
new Cint. P7
blue 2021
1%2%
4%
11%
Fossil-BasedRecycled MaterialRenewable Sources Metal
> 60%RENEWABLE
MATERIALS
RECYCLED
MATERIAL
> 2x
Wear rate reduction
>15%
Weight reduction
>10%
Product eco &
safety-design
• Recycled materials increase
• Renewable materials increase
• Fossil-based materials reductionRAW MATERIALS
• Materials & Natural resource efficiency
• Process environmental targets (SBTI)*
• Group carbon neutrality by 2030MANUFACTURING
• Rolling resistance reduction
• Weight & Wear rate reduction
• Wet grip further increaseUSE
END OF LIFE
• Chemical recycling using innovative
process to ensure the quality of
secondary raw materials for closed loop
TARGET ON NEW PRODUCT LINES
3. Innovation focus on
sustainable mobility
Circular
economy

BEVs AND PHEVS
HOMOLOGATIONS (TILL 2019)
BEVs AND PHEVS
PROJECTS (CURRENTLY ONGOING,
~400 FORESEEN BY 20-22)74 286
• Battery Range Extension
• Higher Vehicle Mass
• Higher Torque
• Higher Comfort
• Ultra Low Rolling Resistance
• High Load Capacity
• Braking & Traction Grip with
Improved Wear Rate
• Low Air born and Solid born Rolling
Noise
10% reduced RR 2% Extended Battery Range
(WLTP Cycle = Only Straight Running)
Improve RR in Real Driving Conditions
(RR in Cornering up to 5 times higher)
Specific tyre shape to optimize
aerodynamic Interaction with Vehicle
TECHNOLOGY INNOVATION: SPECIFIC TECHNOLOGIES DEVELOPED
TO MEET NEW “EV” REQUIREMENTS
73
PLAN 2020-2022
>
3. Innovation focus on
sustainable mobility

CYBER ENTERING NEW PHASE
74
IN A CONNECTED FUTURE, TYRE INTELLIGENCE IS THE ONLY ONE
SOURCED DIRECTLY FROM ROAD SURFACE
CYBER IS AN ACTIVE ELEMENT OF CONNECTIVITY
IT WILL ENHANCE DRIVER SAFETY, VEHICLE CONTROL, LIFECYCLE EMISSION REDUCTION
• Technology stabilization
• Tested in F2 and Motorsport
• 2 Joint-Development prospects with Prestige O.E.
1ST PHASE:
TECHNOLOGICAL DEVELOPMENT
2ND PHASE:
INDUSTRIALISATION IN AN “OPEN” PARTNERSHIP
• Scaling up with Global Partners
– Semiconductors
– Production and Supply Chain
• Developing solutions with large-scale Premium O.E.
• Creating Connected ecosystem with other Tyre Makers
3. Innovation focus on
sustainable mobility

Design for
competitiveness
Design for
sustainability
Modularity
Design Speed
Specialties
New product
concepts
Sustainable
Product life-cycle
Sustainable
mobility
75

AGENDA
PIRELLI EVOLUTION TO DATE & STRATEGIC DIRECTION
PIRELLI STRATEGY DEPLOYMENT: PILLAR 1 – COST COMPETITIVENESS
2019 FINANCIAL REVIEW AND 2020-2022 TARGETS IN DETAIL
APPENDIX
PIRELLI STRATEGY DEPLOYMENT: PILLAR 2 - COMMERCIAL DEVELOPMENT
2020-2022 SCENARIO
PIRELLI STRATEGY DEPLOYMENT: PILLAR 3 – TECHNOLOGY-BASED INNOVATION
2019 FINANCIAL REVIEW AND 2020-2022 TARGETS IN DETAIL
76
2019 FINANCIAL REVIEW
2020-22 TARGETS IN DETAILS
1
2
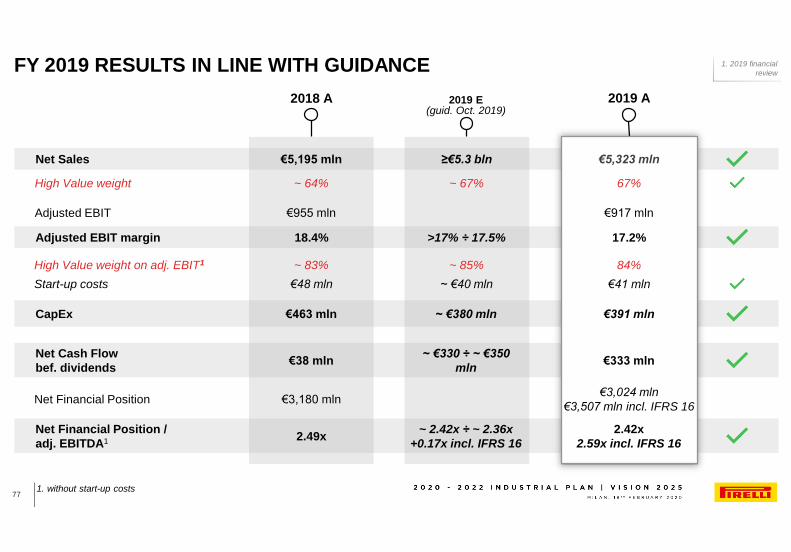
FY 2019 RESULTS IN LINE WITH GUIDANCE
1. without start-up costs77
Net Sales
High Value weight
Adjusted EBIT margin
High Value weight on adj. EBIT1
Start-up costs
CapEx
Net Financial Position /
adj. EBITDA1
Net Cash Flow
bef. dividends
Adjusted EBIT
Net Financial Position
~ 64%
18.4%
~ 83%
€5,195 mln
€48 mln
2018 A
€463 mln
2.49x
€38 mln
€955 mln
€3,180 mln
17.2%
67%
2019 A
84%
€5,323 mln
€41 mln
€391 mln
2.42x
2.59x incl. IFRS 16
€333 mln
€917 mln
€3,024 mln
€3,507 mln incl. IFRS 16
1. 2019 financial
review
2019 E (guid. Oct. 2019)
>17% ÷ 17.5%
≥€5.3 bln
~ 67%
~ 85%
~ €40 mln
~ €380 mln
~ 2.42x ÷ ~ 2.36x
+0.17x incl. IFRS 16
~ €330 ÷ ~ €350
mln

+4.2%
FY 2019 NET SALES BRIDGE
216
Net Sales
FY’18
-101
Volumes Price/Mix
14
FX Net Sales
FY’19
5,194
5,323
-9.7%
+6.4%
+8.0%
-2.0% +0.3% +2.5% +2.2%
78
High Value
Car ≥18”
o/w Organic
1H ‘19-13.9% +1.4%+3.9%
+5.5%
+0.9%-5.0% +6.4% -0.5%O.E. -3.4%
Repl. +13.1%
4Q ‘19-0.7%+7.8%
+8.7%
+1.4% +2.0%+1.5% +0.5% -0.6%O.E. +15.3%
Repl. +3.5%
2H ‘19 -4.8%+9.0%
+10.7% +3.0%+4.0%+1.0% +2.0% 1.0%O.E. +14.4%
Repl. +8.0%
O.E. +4.9%
Repl. +10.5%
mainly negative
channel mix
Standard
1. 2019 financial
review
€ million

PRICE/MIX DRIVERS AND DYNAMICS IN 2019 AND 2020
79
Channel Mix
Segment Mix
Micro-mix
Price
-8.8%
+10.2%
+
1H’20 E1H’19 A
4.2%
2.0%
2H’19 A FY’19 A FY’20 E2H’20 E
6.4%
3.0%
+3.9%
-13.9%Standard Volumes Δ YoY low single-digit volume reduction
++ ++ +++6.4%
-9.7%
++ +- = + +
+~+8%
~-6%
High Value growing high single-digitHigh Value Volumes Δ YoY
++
~slightly negative, with pressure
from the O.E. channel
+ + + +
----= -• O.E. price renegotiation
• Repl: on Standard &
on 18" non specialties
stronger Repl.
sales
(Car ≥18" Repl.
+13% vs. -3% O.E.)
stronger O.E. sales
(Car ≥18" Repl. +8%
vs. +14% O.E.)
still impacted by O.E.
sales (rollover of
new contracts)
channels
rebalance
+
(H.V. vs. Standard)
1. 2019 financial
review

123
70 (26)
2018
(77)
Price/mix
(45)
(67)
Other
input costs
Other FX 2019D&A2
917
(25)
Start-up
costs1
6
Efficiencies
2
Volume
955
Raw Mat.
FY2019 ADJUSTED EBIT PERFORMANCE
1. Digital transformation, Cyber, Velo; 2. net of FX impact; 3. other costs related to
High Value development80
internal levers ∑ +104
external levers ∑ -142
18.4% 17.2%margin
▬ cost-cutting
▬ unabsorbed fixed costs
▬ other3
+50
-20
-56
1. 2019 financial
review
€ million

391
440
177
500
Lease
obligations at
transition date
CapEx DividendsNFP FY’18
excl. IFRS 16
-1,221
EBITDA
adjusted
NFP FY’19
incl. IFRS 16
-17
NFP FY’19
excl. IFRS 16
Other1∆ WC & other
57
IFRS 16
C.F. Impact
3,1803,024
3,507
FY 2019 CASH FLOW AND NET FINANCIAL POSITION
1. Taxes, Interests, Financial activities and others; 2. Without start-up costs81
2.49 x 2.42 xNFP /
adj. EBITDA2
Op. CF: +773 (+383 in FY’18)
NCF bef. dividends: +333 (+978 in 4Q’19)
2.59 x
Net Cash Flow: +156 (+978 in 4Q’19)
Main working capital dynamics in 2019
▬ Inventories back to normalized level: 20.5% on sales (21.7% in 2018);
Inventory volume reduction -7% YoY (-23% on Standard and +5% on High Value, to ensure the high service level)
▬ Trade receivables: 12% on sales (stable YoY)
▬ Trade payables: 30% on Sales (~-1pp YoY)
1. 2019 financial
review
€ million

2019 FINANCIAL REVIEW AND 2020-2022 TARGETS IN DETAIL
82
2019 FINANCIAL REVIEW
2020-22 TARGETS IN DETAILS
1
2
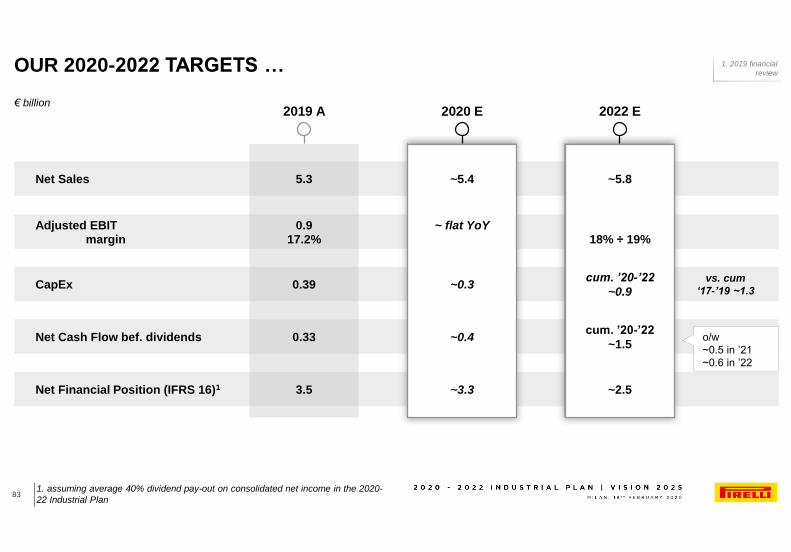
OUR 2020-2022 TARGETS …
1. assuming average 40% dividend pay-out on consolidated net income in the 2020-
22 Industrial Plan83
Net Sales
Adjusted EBIT
CapEx
Net Financial Position (IFRS 16)1
Net Cash Flow bef. dividends
0.9
5.3
2019 A
0.39
3.5
0.33
17.2%
vs. cum
‘17-’19 ~1.3
o/w
~0.5 in ’21
~0.6 in ’22
€ billion2020 E
~5.4
~0.3
~3.3
~0.4
~ flat YoY
~5.8
cum. ’20-’22
~0.9
~2.5
cum. ’20-’22
~1.5
18% ÷ 19%
2022 E
margin
1. 2019 financial
review

€ billion
2020-2022 REVENUES TREND
84
Volumes
2019 A
67%
33%
2020 E
73%69%
27%
5.3
31%
2022 E
~5.4 ~5.8
Price/mix
Forex
+4.2%
+0.3%
-2.0%
~ +3%
~ -2%
~ 0% ÷ +1%
High Value +6.4% ~ +8%
Standard -9.7% ~ -6%
~ +3%
~ -2%
~ +1.5% ÷ +2%
~ +8%
~ -5%
CAGR 19-22
High Value
Standard
Lower contribution from
standard reduction
CAGR ‘19-’22
~ +3%
~ +6%
~ -4%
𝚫’19 -’20
~ +2%
~ +6%
~ -6%
2. 2020-22 targets
in details
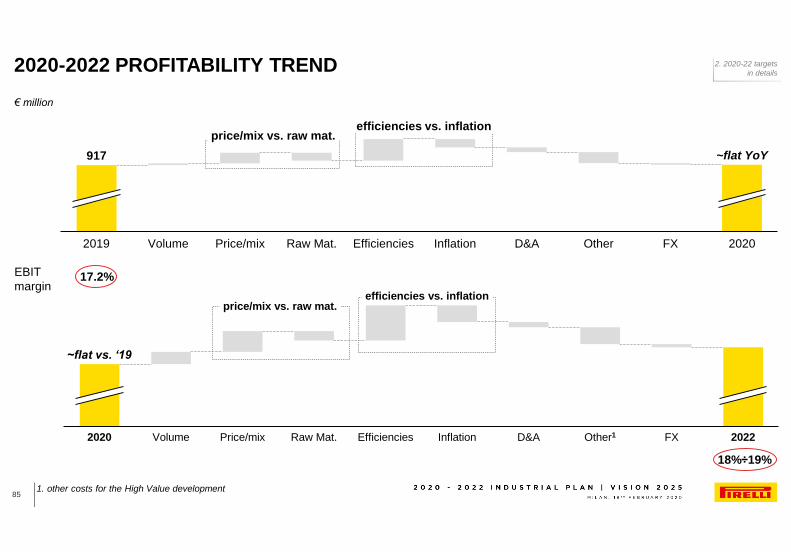
Volume2019
917
Price/mix Raw Mat.
~flat YoY
Efficiencies Inflation D&A Other FX 2020
€ million
2020-2022 PROFITABILITY TREND
1. other costs for the High Value development85
Price/mixVolume Other12020 Raw Mat. Efficiencies Inflation
~flat vs. ‘19
D&A FX 2022
price/mix vs. raw mat.efficiencies vs. inflation
price/mix vs. raw mat.efficiencies vs. inflation
EBIT
margin17.2%
18%÷19%
2. 2020-22 targets
in details

€ million
1. Including interests rates, hedging costs, hyperinflation
FINANCIAL AND FISCAL MANAGEMENT
86
26%
2020E-22E2019E
25%-27%
2019A
~217
2020E-22E
~185
FINANCIAL INCOME & EXPENSES1
2020-2022E TAX RATE
Reduction of the exposure to high-yield
currencies>
> Option to extend the maturity of current
credit lines
> 100% new strategic funding will be Green
or linked to our Sustainability targets
>
> Tax rate guidance includes a “prudential”
estimate of the Italian Patent Box renewal
benefit
Expected weighted average consolidated
tax rate in line with 2019 actual tax rate
on avg.
per year
2. 2020-22 targets
in details

1. Operating Cash Flow: adj. EBITDA – CapEx – Δ working capital; 2. (EBITDA –
CapEx) / EBITDA 3. assuming average 40% dividend pay-out on consolidated net
income in the 2020-22 Industrial Plan
2020-22 NET CASH FLOW (BEFORE DIVIDENDS) TREND
87
FCF
conversion2
CapEx /
D&A
Δ int. /
taxes /
other
2019 A Δ op. C.F.Δ op. C.F.1
~0.5
Δ int. /
taxes /
other
Δ op. C.F.2020 E 2021 E Δ int. /
taxes /
other
2022 E
0.3
~0.4
~0.6
+ Δ CapEx
▬ Δ W.C.
+ Δ int. / taxes
▬ Δ restr. /
non-rec.
+ Δ adj.
EBITDA
+ Δ W.C.
+ Δ restr. /
non-rec.
+ Δ adj.
EBITDA
CapEx already at optimal level
68%
1.3x 0.9x 0.85x 0.8x
76% 78% 79%
2020-22 N.C.F.
~1.5 cum., o/w:
~0.5
for dividends3
~1.0
for Debt
reduction
MAIN COMPONENTS
+ Positive
- Negative
2. 2020-22 targets
in details
€ billion

Raw Materials 33% on Sales
Natural Rubber TSR20
($ / tonne)
Brent Oil
($ / barrel)
Butadiene Europe
(€ / tonne)
Commodities – avg. Quotation
2019 A
1,407
64.0
824
2020 E
~1,480
~64
~860
€ million
2020E-2022E RAW MATERIAL GUIDANCE
1. Including fees88
2021 E
~1,495
~64
~880
2022 E
~1,565
~64
~920
Commodities – avg. cost of goods sold
2019 A
1,381
67.0
937
2020 E
~1,430
~63
~820
2021 E
~1,500
~64
~885
2022 E
~1,545
~64
~910
Adj. EBIT impact
Raw Mat.1
FX only
TOTAL
+18
-85
-67
~flat
~-65
~-65
~-30
~-15
~-45
~-30
~-10
~-40
Breakdown
FY 2019 Abased on
purch costs
13% Natural Rubber
27% Synthetic Rubber
10% Carbon Black23% Chemicals
17% Textiles
10% Steel Reinf.
2. 2020-22 targets
in details
~1,480
~64
~860
2021 E
~1,495
~64
~880
2022 E
~1,565
~64
~920

2019 A 2020 E
Main average exchange rates
EUR / USD 1.12 1.12
USD / BRL 3.95 4.07
EUR / GBP 0.88 0.90
EUR / RUB 72.4 73.0
USD / CNY 6.9 7.05
/
/
/
/
/
TOT. IMPACT ON SALES
∆ YoY(vs. EUR)
+3%
+2%
0%
+1%
+3%
2020E-2022E FOREX GUIDANCE
~-2%
2021 E
1.14
4.21
0.88
75.0
7.06
∆ YoY(vs. EUR)
+5%
+2%
+2%
+3%
-3%
~-2%
2022 E
1.18
4.26
0.86
77.0
6.95
∆ YoY(vs. EUR)
+5%
+2%
+4%
+3%
-2%
~-2%
Breakdown
FY 2019 Abased on
currency
37% EUR
18% USD12% CNY
11% BRL
3% RUB.
13% other
6% GBP
89
2. 2020-22 targets
in details

90

AGENDA
PIRELLI EVOLUTION TO DATE & STRATEGIC DIRECTION
PIRELLI STRATEGY DEPLOYMENT: PILLAR 1 – COST COMPETITIVENESS
2019 FINANCIAL REVIEW AND 2020-2022 TARGETS IN DETAIL
APPENDIX
PIRELLI STRATEGY DEPLOYMENT: PILLAR 2 - COMMERCIAL DEVELOPMENT
2020-2022 SCENARIO
PIRELLI STRATEGY DEPLOYMENT: PILLAR 3 – TECHNOLOGY-BASED INNOVATION

91

APPENDIX
92
GOVERNANCE
SUSTAINABILITY STRATEGY & TARGETS
FINANCIALS
1
2
3

GOVERNANCE CONFIRMED BY RENEWED
SHAREHOLDERS’ AGREEMENT
93
Pirelli Technological
know-how never be
transferred unless
approved by 90% of
Pirelli shareholders
Pirelli By-Laws shall be
inspired by
international best
practices
Focus on Diversity value:
gender, age, seniority, nationality,
educational background and
work-experience
Board made of highly qualified
Members with a suitable mix of
skills.
Independent directors shall be
the majority of the Board
The partnership acknowledges: (i) Pirelli is a company
specialised in high quality and technology products, (ii)
loyalty, professional skills and expertise of the
management, key factor for the Company success and
business growth
Leading role of Marco Tronchetti Provera in the
designation of his successor
Pirelli headquarters
shall remain in Milan
(Italy) unless approved
by 90% of Pirelli
shareholdersTransactions with related
parties to be governed by best
International practices with a
key role of the Committee for
Related Parties Transactions
Pivotal role of the top management to maintain quality
standards, to preserve and value Pirelli industrial
legacy
One-fifth of the Board
shall be appointed by
minority shareholders
Pirelli Chief Executive Officer to lead top management
and ensure Pirelli business culture continuity
Pirelli Recruiting, Career Plans and incentive schemes
to match management and shareholders interests.
Incentive plan targets consistent with Pirelli Strategic
Plan, and in line with the best practices for listed
Companies (e.g.: TSR, sustainability)
BY-LAWS BOARD OF DIRECTORS SHAREHOLDERS AGREEMENT
Internal committees in line with
the best practices, with
independent directors having a
key role.

Source: NASDAQ, Libro soci Pirelli at December 2019
1. On September 2019 Camfin SpA has underwritten, with primary financial institutions,
financial instruments denominated “Call Spread”, maturing on September 2022, with 48,9
million Pirelli shares underlying equal to approximately 5% of the Pirelli’s share capital.
By virtue of the acquisition of these financial instruments, Camfin has the right to buy
Pirelli shares at a predetermined price and increase its stake in Pirelli’s share capital
from 10.1% up to approximately 15%
2. Tacticum Investment S.A (formerly Long-Term Investments Luxembourg S.A.): stake
transferred to a third party, subject to a "Repurchase Agreement". Such third party
committed to transfer back to LTI, when due, the ownership of the same number of Pirelli
stocks and to do everything is in its power to exercise the right to vote, subject to the
transaction, according to the voting instructions given by LTI each time.
PIRELLI SHAREHOLDER STRUCTURE
94
3.50%
Camfin SpA1
Marco Polo
International
Italy Srl
Retail Investors
LTI2
Institutional
Investors
Free Float
38.14%
37%
34%
26% North America
3% Rest of World
Rest of Europe
U.K.
INSTITUTIONAL INVESTORS
BREAKDOWN
6.24%10.10%
45.52%
34.64%

1. Eco-Safety Performance products, previously named “green performance
products”, identify car tyres that Pirelli produces throughout the world and that fall
only under rolling resistance and wet grip classes A, B, C according to the labeling
parameters set by European legislation
PIRELLI REMUNERATION SYSTEM ALLIGNED WITH INDUSTRIAL PLAN
95
COMPENSATION MIX FOR KEY MANAGEMENT
• No more than 50% of Total Annual Direct Compensation on reaching all objectives at
target level
FIXED COMPONENT
• Cash incentive based on key Financial objectives (Group Adj. EBIT, Net Income, Net
Cash Flow before dividends) and Sustainability (Eco-Safety Performance1 Revenues)
• On/off condition: Group Net Cash Flow before dividends
• 25% deferred to the next year
SHORT-TERM INCENTIVE (1/3 of total variable compensation)
• Cash plan based on 3 key objectives: Relative TSR vs. Tier 1 peers; 2020-22 Cumulated
Group Net Cash Flow before dividends; on-going inclusion in Sustainability Indices
(Dow Jones Sustainability World Index ATX Auto Component sector, CDP scoring)
• Rolling plan: every year starting a new 3-year period
• Payment in 2023 and at the end of each 3-year vesting period
LONG-TERM INCENTIVE PLAN 2020-22 (2/3 of total variable compensation)
ALL VARIABLE COMPONENTS ARE CAPPED
NON-COMPETITIVE AGREEMENT
CLAW-BACK CLAUSES KEY MANAGEMENT
IN BOTH MBO AND LTI PLANS
REMUNERATION STRUCTURE to be approved by the Shareholders’ Meeting (June 18, 2020)

OBJECTIVE WEIGHT
Group Adjusted EBIT 40%
Group Net Cash Flow1 30%
Net Income 20%
Green performance Revenues 10%
1 Before dividends
SHORT TERM INCENTIVE PLAN OBJECTIVES
96
On/off condition: Group Net Cash Flow before dividends
25% of the bonus deferred to the next year and relevant payment subject to the achieving of the STI
objectives of the following years, with a reward mechanism in case of achievement of the objectives at least at
the target level.
Bonus at target level defined as percentage of base salary; pay-out cap is 2,5x bonus at target level,
entry level pay-out is 0.75x bonus at target level.
>
>
>
>

OBJECTIVE WEIGHT VALUE AT TARGET
Relative TSR 40%Pirelli performance aligned to the average of the peers’ performance
– Tier 1 (Nokian, Michelin, Continental, Good Year, Bridgestone).
Group Cash Flow1 40%2020-2022 cumulated Pirelli Cash Flow consistent with the Industrial
Plan
Sustainability Index 20%
• Pirelli ranking in Dow Jones Sustainability World Index ATX Auto
Component sector (weight 10%);
• Pirelli ranking in CDP ranking /weight 10%)
1 Before dividends
2020-2022 LONG-TERM INCENTIVE PLAN HIGHLIGHTS
97
Cash, long-term incentive plan aligned with the 2020-2022 Industrial Plan>
>
>
>
Rolling plan, with 3 objectives with different weights>
Rolling plan: every year starting a new three-years period, with relevant targets
Bonus at target level defined as percentage of base salary; pay-out cap is 2,6-2,9 bonus at target level,
entry level pay-out is 0.75x bonus at target level.

APPENDIX
98
GOVERNANCE
SUSTAINABILITY STRATEGY & TARGETS
FINANCIALS
1
2
3

1. Attested by third party. 2. Using Global Reporting Initiative (GRI –Standards),
Comprehensive option; principles of integrated reporting contained in the Framework
of the International Integrated Reporting Council (IIRC),
Assurance Engagements, ISAE 3000 – Assurance Engagement on GHG ISAE 3000;
PIRELLI INTEGRATED MODEL
99
ISO 9001
IATF 16949
ISO/IEC 17025
ISO 14001
ISO 14040
ISO 14064
OHSAS 18001/ISO45001
Standard SA8000® (Reference Std)
Group Sustainability
and Future Mobility
Country Sustainability Managers
(CEOs)
Sustainability
Steering
Committee
ISO 37001
ISO 204001
Competitive scenario analysis:
Economic - Environmental
Social - Governance
Growth Opportunities
Productivity
Risk Governance
Board of Directors
Governance Environmental
performance
Economic
performance
Strategy
Social
performance
Board Committee
MULTI-STAKEHOLDER APPROACH
Quality
Environment
Labour and Social
Purchasing
Anti-Bribery
1 1
Governance Management systems Planning Reporting2
Return on capital Group integrated Annual Report

>
PIRELLI ESG LEADERSHIP ACKNOWLEDGED BY THE MARKET
KPIs1
KEY FIGURES & ACHIEVEMENTS 2019
100
Car tyres Avg. rolling resistance reduction
Specific energy consumption reduction
Waste recovered
Accident frequency index reduction
Electricity from renewable sources4
Specific CO2 emissions reduction
Average training days per capita
Specific water withdrawal reduction
Eco-Safety Performance revenues2
-18%(vs.2009)
-13.1%(vs.2009)
97%
-83%(vs.2009)
>41%
-10.8%(vs.2009)
>7 days
-70%(vs.2009)
55.8%63.3% on H.V.3
2019
Pirelli also included in:
Pirelli distinctive factors
Comprehensive corporate positioning
on key global sustainability challenges,
beyond materiality
Management model complying with
most demanding ESG standards6
ESG targets are:
• Group wide
• Tangible
• Challenging and realistic
• Set to be reached within
competitive deadlines
Complete and transparent Reporting
1. Preliminary unaudited data; 2. Figure is obtained by weighing the value of sales of Eco-Safety
Performance car tyres on the total value of sales of Group car tyres; Eco-Safety Performance products,
previously named “Green Performance Products”, identify car tyres that Pirelli produces throughout
the world and that fall only under rolling resistance and wet grip classes A, B, C according to the labeling
parameters set by European legislation; 3. Focus on HIGH VALUE products including RIM18+ and
«specialties» (Run-Flat, PNCS, Seal Inside with rim ≤17”); 4. Internal assessment based on data from the
International Energy Agency (IEA) taking into account the Pirelli geographical distribution;
5. Score 2019: 85 vs sector average of 36; 6. e.g. ISO 20400, ISO 26000, AA1000, ISO 37001, etc.
Top-of-the-industry ESG ratings
Global Compact LEAD
company 2019
A-List in CDP Climate
Change 2019
Sector top rating
Global Sector Leader in
the S&P Dow Jones
Sustainability Indices5
Awarded sector Gold Class
2020 in S&P Sustainability
Yearbook
>
>
>

GLOBAL SCENARIOS @2025-2030
101
Automation,
Robotics, Artificial
Intelligence
Technological breakthroughs
• Population reaching 8.3 bln. in 2030
(7.7 bln. in ‘19)
• @2030: Urban 5,1 bln., extra-urban 3,2 bln
Demographic growth and urbanization
• Smart cities
• Future Mobility
• Manufacturing productivity gain
• Aging pressure
• Competition on talents
• Social inequality rising
Future of work
Cybersecurity
Cyberattacks may cost up to
several trillions dollars by 2030
if not properly tackled
Climate change
• Flooding, weather emergencies,
displaced people impacting businesses,
governments and economies
• Stress on natural resources
OPPORTUNITIES & CHALLENGES MUST MATCH THE GLOBAL JOURNEY TOWARDS UN SDGS

Impact on 11 UN Sustainable Development Goals>
INDUSTRIAL PLAN SUSTAINABILITY LEVERS
102
STRATEGY & TARGETS @2022-2025-2030:
Are embedded into Pirelli High Value & Pure Consumer strategy>
Replace previous 2017-2020 Sustainability Plan with selected targets to 2025>

Avg. total
tyres CAR
(vs. 2015)
@2022 @2025
Rolling
Resistance-10% -14%
Weight -25% -30%
Wear rate -12% -18%
Noise -4% -4%
Wet grip +7% +9%
Process By 2025 By 2030
Renewable electricity100%
Worldwide
Absolute CO2
emissions
-25%
vs 2015
Group
Carbon
Neutrality
Specific Energy
consumption
-10%
vs 2019
Specific Water withdrawal-43%
vs 2015
Waste recovery (towards
zero waste to landfill)98%
Accident frequency index ≤ 0.1
1. Major scope 3 emissions in product LCA (excl. use phase); 2. Renewable Natural
Resources are natural resources that, after exploitation, can return to their previous stock
levels by natural processes of growth or replenishment. (source: OECD glossary
definition at https://stats.oecd.org/glossary/detail.asp?ID=2290 );
3. Excluding recycled metals.
PRODUCT SUSTAINABILITY STRATEGY 2022/2025/2030
103
RAW MATERIALS END OF LIFE
On new
product lines @2025 @2030
Renewable Mat.2 >40% >60%
Recycled Mat. >3%3 >7%3
Fossil based Mat. <40% <30%
Renewable & recycled
Materials increase
Rolling resistance reduction
Weight reduction
Noise reduction
Wear efficiency
Safety performances increase
Chemical recycling based on
innovative process to ensure the
quality of secondary raw
materials for closed loop use
CIRCULAR ECONOMY (closed loop)
PRODUCT ECO-SAFETY DESIGN
Raw materials
suppliers1 @2025
Absolute CO2 emissions -8.6%
vs.2018
Fossil based materials reduction
Committed to Science Based Target initiative (SBTi) & to Carbon Neutrality
Raw materials
& natural resources efficiency
Industrial hygiene & HS protection
Towards Carbon Neutrality
USEMANUFACTURING
Raw mat. CO2 absolute emissions
reduction

MATERIALS INNOVATION
1. Renewable Natural Resources are natural resources that, after exploitation, can return to their
previous stock levels by natural processes of growth or replenishment. (source: OECD glossary
definition at https://stats.oecd.org/glossary/detail.asp?ID=2290 ); 2. Excluding recycled metals.104
By 2025, on new product lines: > 40% of renewable materials
> 3% of recycled materials2
< 40% of fossil based materials
By 2030, on new product lines:> 60% of renewable materials
> 7% recycled materials2
< 30% fossil based materials
STRATEGY ACTING ON TARGETS
Anticipating the impact of regulation through actions on Materials associated with Health concerns
in cooperation with R&D, HSE, Procurement, Quality and Suppliers.
1%2%
4%
7%
15%15%
13%
11%
33%
61%
23%
predecessor
Cint. P7 blue
50%
new Cint. P7
blue 2021
43%
40%
target 2025 (new
product lines)
62%
20%
vision 2030 (new
product lines)
Renewable Sources Fossil basedRecycled Material Metals
>
>Bio-Chemicals>
Bio-Fillers>
Polymers>
Recycled Materials>
Example of Materials evolution to date
(Cint. P7) and towards new lines
Focusing on:
• Increase Renewable1
Materials
• Increase Recycled
Materials
• Decrease Fossil Based
Materials
• Quickly Anticipating
Market Requirements
Reinforcements>

ECO-SAFETY PERFORMANCE INNOVATION
105
@2022 @2025
Rolling Resistance -10% -14%
Weight -25% -30%
Wear rate -12% -18%
Noise -4% -4%
Wet grip +7% +9%
@2022 @2025
Rolling Resistance -15% -20%
Wet grip +21% +25%
Mileage +4% +13%
@2022 @2025
Rolling Resistance -25% -25%
Wet grip +10% +15%
Braking +5% +10%
CAR- AVG. TOTAL GAMMA (VS. 2015) MOTO- AVG. RADIAL TYRES (VS. 2015)
VELO- AVG. TOTAL TYRES (VS. 2017)
Less CO2 emissions
Better living environment
Higher safety
Less impact on natural resources
Less rolling resistance
Less noise
Better grip
Less weight

ECO-SAFETY PRODUCT INNOVATION
1. Pirelli Noise Cancelling System106
NEW AND DISRUPTIVE FEATURES ON:
• Rolling resistance
• Noise
• High load capacity
• Grip
• Connectivity
• Recyclability
• From Formula 1 experience
• Development time for new tyres reduced by 30%
• Number of physical prototypes drastically reduced
• Rapid remodeling
• Maximization of co-development efficiency with car manufacturers
RUNFLATSafe & extended mobility
SEAL INSIDE TM
Safe & extended mobility
PNCS TM1 APPLICATION Noise reduction
ELECT TM
Pirelli package for electric vehicles
CYBER TYRE SYSTEM Smart and connected mobility
5G ready
2001
2020
PIONEERING THE CONSUMER SPECIALTIES BUSINESS
ENABLED BY NEW SIMULATOR
SHORT TERM DEVELOPMENT ROADMAP TO ACCELERATE
CONSUMERS TRANSITION TO FUTURE MOBILITY

1. Eco-Safety Performance products, previously named “Green Performance products”, identify car
tyres that Pirelli produces throughout the world and that fall only under rolling resistance and wet grip
classes A, B, C according to the labeling parameters set by European legislation. 2. Figure is obtained
by weighing the value of sales of Eco-Safety Performance car tyres on the total value of sales of Group
car tyres;
3. Focus on HIGH VALUE products including RIM18+ and «specialties» (Run-Flat, PNCS, Seal Inside
with rim ≤ 17).
ECO-SAFETY PERFORMANCE1 REVENUES
107
Eco-safety
performance
revenues2 on
total Car
tyres
revenues
• Criteria to categorize the Eco-Safety Performance products: Rolling Resistance and Wet Grip that falls only in A, B, C classes
• Figure calculated by applying the EU-label regulation to all car tyres sold worldwide
33%
56%
71%
20192015 2022
+23pp
+15pp
42%
63%
78%
2015 20222019
+21pp
+15pp
Eco-safety
performance
revenues2
Focus on
High Value
products3

1. Targets adopted by companies to reduce greenhouse gas (GHG) emissions are
considered “science-based” if they are in line with what the latest climate science
says is necessary to meet the goals of the Paris Agreement – to limit global warming
to well-below 2°C above pre-industrial levels and pursue efforts to limit warming to
1.5°C.
ECO-EFFICIENCY: TOWARDS GROUP CARBON NEUTRALITY
108
Committed to the Science Based Target initiative (SBTi)1
- 10% specific energy consumption by 2025 vs. 2019
100% renewable electricity by 2025
Group CARBON NEUTRALITY by 2030
- 25% absolute CO2 emissions by 2025 vs. 2015

ECO-EFFICIENCY: WATER, WASTE
1. Timing depends on the market offer of the proper alternatives to SUP directly impacting
the production process quality. 109
100%
65%57%
2019 20252015
-43%
92% 97% 98%
2015 20252019
+6pp
Excellence in water management:Towards zero waste to landfill vision
Single Use Plastic Free
• All Group premises: elimination of Single Use Plastic by 2021
• Production Process: progressive1 elimination of Single Use Plastic
in the respect of production processes quality preservation
Reduce, Reuse, Recover, Recycle, Replenish (5R Principles)
98% OF WASTE SENT TO RECOVERY BY 2025
- 43% SPECIFIC WATER WITHDRAWAL BY
2025 VS 2015

1. Science, Technology, Engineering, Mathematics
2. Applied to the generality of Group top management and executives.
HUMAN CAPITAL
110
People safety & welfareA diverse and
engaged workplace
Availability of digital
& new competences
Adaptiveness to respond
to changes and capture value
THROUGH
Accident frequency index reduction: ≤ 0.15 by 2022, ≤ 0.1 by 2025
Upskilling and reskilling of new digital competences
STEM1 talent attraction and innovative recruitment marketing solutions
New smart and horizontal ways of working and open collaborations
Sound integration of ESG targets into Short and Long Term Incentives2
ORGANIZATION PREPAREDNESS TO EMBRACE FUTURE SCENARIOS ENSURING:
>
>
>
>
>

▬100% coverage of high ESG risk suppliers
▬checklist derived from SA8000®,
sustainability contractual obligations, local
law
ONSITE THIRD-PARTY AUDIT
▬ESG assessment questionnaire
▬Third party on-site audit (raw material and
High Value Added suppliers)
▬Cobalt & conflict minerals assessment
Sustainability Clause
CONTRACTUAL STAGESELECTION + QUALIFICATION ESG2
Full compliance of Purchasing Model with ISO 20400 provisions attested1
1. Third Party Opinion released in February 2018 by SGS Italy S.p.A; 2. ESG:
environmental, social, governance; 3. Major scope 3 emissions in product LCA (excl.
use phase); 4. Natural Rubber
SUPPLY CHAIN SUSTAINABILITY
111
A MORE EFFICIENT AND SUSTAINABLE SUPPLY CHAIN THANKS TO
Pirelli advanced digitalized management systems to
monitor and manage suppliers’ compliance>
Supply chain economic, social, environmental and loss
prevention risks fully embedded in Pirelli Enterprise Risk
Management >
Joint Development partnerships with third competence
centers for innovative eco & safe materials >
Pirelli target to reduce raw material suppliers3 CO2
absolute emissions by 8.6% in 2025 vs 2018>
Pirelli 2019-2021 Sustainable Natural Rubber Roadmap:
ON-SITE Engagement, risk mapping and mitigation
As of the beginning of 2020:
• 100% of Pirelli purchased NR4 volumes come from
suppliers trained on Pirelli Sustainable Natural Rubber
Policy
• 95% of Pirelli purchased NR4 volumes come from
suppliers which confidentially have shared information on
sourcing areas
• 100% of Pirelli purchased NR4 volumes come from
suppliers that defined a roadmap in line with Pirelli
Sustainable Natural Rubber Policy
>

A BUSINESS ENABLER TO SECURE CORPORATE OPERATIONS AND DELIVERY OF WELL-PROTECTED BUSINESS
SERVICES AND QUALITY PRODUCTS TO PIRELLI CUSTOMERS
SOUND CYBER SECURITY PROGRAM
1.Operational Technology and Internet of Things112
Cyber Threat Hunting
Enhanced Rights Management Program
External Threat Protection (Dark Web)
Cyber Deception
Risk-Based Vulnerability Management
Supply Chain Security
OT & IoT1 Threat Detection (Industry 4.0)
Cyber Security for Connected Cars
Main pillars

ADVOCACY AND COMMITMENT FOR ROAD SAFETY
113
Pirelli is Global Partner of the FIA Action for Road Safety Campaign
Goal: educate road users on the importance of respecting key road safety rules
Actions: promotion of the FIA 'Golden Rules' for road safety through all Pirelli networks
Pirelli is Donor and Member of the Advisory Board of the United Nations Road Safety Trust Fund
Goal: provide aid to United Nations’ Member States to significantly:
• reduce the number of deaths and injuries caused by traffic accidents
• reduce the economic losses resulting from such accidents
Actions: concrete projects within the Global Plan of the Decade of Action for Road Safety, to improve:
• road safety management capacities
• safety of road infrastructures and broader transport networks
• safety of vehicles
• road users’ behavior
• post-crash care

APPENDIX
114
GOVERNANCE
SUSTAINABILITY STRATEGY & TARGETS
FINANCIALS
1
2
3
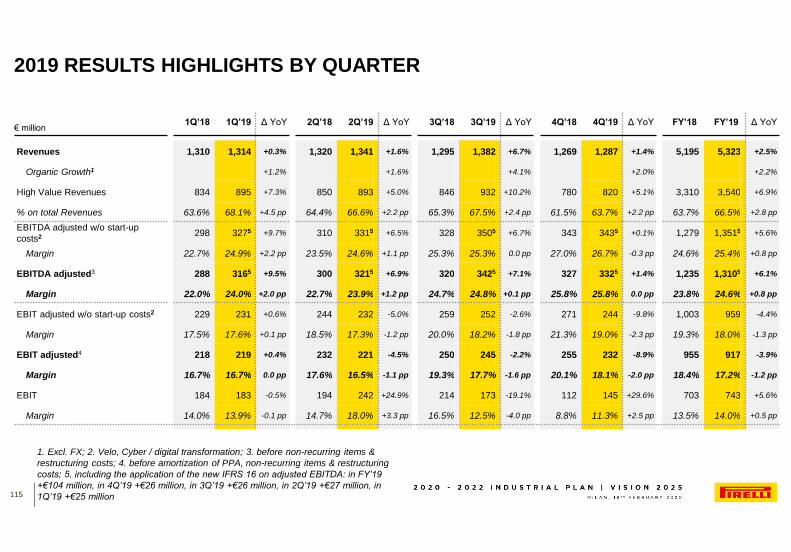
1Q’18 1Q’19 Δ YoY 2Q’18 2Q’19 Δ YoY 3Q’18 3Q’19 Δ YoY 4Q’18 4Q’19 Δ YoY FY’18 FY’19 Δ YoY
Revenues 1,310 1,314 +0.3% 1,320 1,341 +1.6% 1,295 1,382 +6.7% 1,269 1,287 +1.4% 5,195 5,323 +2.5%
Organic Growth1 +1.2% +1.6% +4.1% +2.0% +2.2%
High Value Revenues 834 895 +7.3% 850 893 +5.0% 846 932 +10.2% 780 820 +5.1% 3,310 3,540 +6.9%
% on total Revenues 63.6% 68.1% +4.5 pp 64.4% 66.6% +2.2 pp 65.3% 67.5% +2.4 pp 61.5% 63.7% +2.2 pp 63.7% 66.5% +2.8 pp
EBITDA adjusted w/o start-up
costs2 298 3275 +9.7% 310 3315 +6.5% 328 3505 +6.7% 343 3435 +0.1% 1,279 1,3515 +5.6%
Margin 22.7% 24.9% +2.2 pp 23.5% 24.6% +1.1 pp 25.3% 25.3% 0.0 pp 27.0% 26.7% -0.3 pp 24.6% 25.4% +0.8 pp
EBITDA adjusted3 288 3165 +9.5% 300 3215 +6.9% 320 3425 +7.1% 327 3325 +1.4% 1,235 1,3105 +6.1%
Margin 22.0% 24.0% +2.0 pp 22.7% 23.9% +1.2 pp 24.7% 24.8% +0.1 pp 25.8% 25.8% 0.0 pp 23.8% 24.6% +0.8 pp
EBIT adjusted w/o start-up costs2 229 231 +0.6% 244 232 -5.0% 259 252 -2.6% 271 244 -9.8% 1,003 959 -4.4%
Margin 17.5% 17.6% +0.1 pp 18.5% 17.3% -1.2 pp 20.0% 18.2% -1.8 pp 21.3% 19.0% -2.3 pp 19.3% 18.0% -1.3 pp
EBIT adjusted4 218 219 +0.4% 232 221 -4.5% 250 245 -2.2% 255 232 -8.9% 955 917 -3.9%
Margin 16.7% 16.7% 0.0 pp 17.6% 16.5% -1.1 pp 19.3% 17.7% -1.6 pp 20.1% 18.1% -2.0 pp 18.4% 17.2% -1.2 pp
EBIT 184 183 -0.5% 194 242 +24.9% 214 173 -19.1% 112 145 +29.6% 703 743 +5.6%
Margin 14.0% 13.9% -0.1 pp 14.7% 18.0% +3.3 pp 16.5% 12.5% -4.0 pp 8.8% 11.3% +2.5 pp 13.5% 14.0% +0.5 pp
€ million
1. Excl. FX; 2. Velo, Cyber / digital transformation; 3. before non-recurring items &
restructuring costs; 4. before amortization of PPA, non-recurring items & restructuring
costs; 5. including the application of the new IFRS 16 on adjusted EBITDA: in FY’19
+€104 million, in 4Q’19 +€26 million, in 3Q’19 +€26 million, in 2Q’19 +€27 million, in
1Q’19 +€25 million
2019 RESULTS HIGHLIGHTS BY QUARTER
115

KEY CAR MARKET TRENDS: EMEA
Source: Pirelli tyre market estimates based on main data provider for the Region;
historical market data may be subject to restatement116
O.E.
Replacement
Total (O.E.+Repl.)
O.E.
Total (O.E.+Repl.)
4Q’18 FY’18 1Q’19 3Q’19 4Q'19
Replacement
Market trend
∆% YoY2Q’19 FY’19
-5
3
-6
5
-1
-13 -4
-11 -12 -6 -7 -9
00
17 12 11 9 11 12 11
1
0 -3 -3 -2 -2 -3
7 8 6 2
9 7 6
-2 -1 -5 -5 -2 -3 -4
-11 -3
-9 -10 -3 -6 -7
3 1
-2 -2 -1 -1 -1
-1 -3 -4 -1 -2 -3
0
≥18”
≤17"
To
tal
Car
mark
et
New
Pre
miu
m &
Sta
nd
ard

2
-1 -4 -3 -1 -9
-4
KEY CAR MARKET TRENDS: NORTH AMERICA
Source: Pirelli tyre market estimates based on main data provider for the Region;
historical market data may be subject to restatement; 1. N. America Replacement
includes imports
117
O.E.
Replacement
Total (O.E.+Repl.)
O.E.
Total (O.E.+Repl.)
4Q’18 FY’18 1Q’19 3Q’19 4Q'19
Replacement1
2Q’19 FY’19
To
tal
Car
mark
et
New
Pre
miu
m &
Sta
nd
ard 5 6 4 5
-2
2
-1 -5 -7 -9 -7 -16
-9 0
13 13 11 9 11 8 10 6
1 4
-2 -1 -5 -1
11 10 7 7 9 5 7 5 2
-3 -2 -7
-3 0
7 4 6
1 2
-2
1
6 3 4 1
-3
0
0
≥18”
≤17"
Market trend
∆% YoY

-8 -1
-6 -11 -6 -4 -7
KEY CAR MARKET TRENDS: ASIA PACIFIC
Source: Pirelli tyre market estimates based on main data provider for the Region;
historical market data may be subject to restatement118
O.E.
Replacement
Total (O.E.+Repl.)
O.E.
Total (O.E.+Repl.)
4Q’18 FY’18 1Q’19 3Q’19 4Q'19
Replacement
2Q’19 FY’19
To
tal
Car
mark
et
New
Pre
miu
m &
Sta
nd
ard
14 17
-1 -4
3 3 1
-11 -5 -8 -12
-7 -5 -8
9 11 10 11 14 9 11
1 1 2 4 4 0 3
13 15
2 1 7 5 4
-4 -1 -2 -2 -2 -1
0
1 1 3 5 5 1 3
-3
0
-1 -2
1
-1 -1
≥18”
≤17"
Market trend
∆% YoY

16 12 8 7 6
-9
3
KEY CAR MARKET TRENDS: RUSSIA & NORDICS / SOUTH AMERICA
Source: Pirelli tyre market estimates based on main data provider for the Region;
historical market data may be subject to restatement119
O.E.
Replacement
Total (O.E.+Repl.)
O.E.
Total (O.E.+Repl.)
4Q’18 FY’18 1Q’19 3Q’19 4Q'19
Replacement
2Q’19 FY’19
Ru
ssia
& N
ord
ics
So
uth
Am
eri
ca
8 7
-10 -2
1
-5 -4
9 8
-8 -1
1
-6 -3
-3
6
-4 -1 -4 -3 -3
-14 -7 -8
-3 -6
4
-3
-12 -4 -7
-2 -6
3
-3
Market trend
∆% YoY

Synth. Rubber
26%
(-1ppYoY)
RAW MATERIAL COSTS TREND AND MIX
Source: Natural Rubber -> Sicom; Brent -> www.oilnergy.com
Main raw materials price trend
25
35
45
55
65
75
85
0.75
1.00
1.25
1.50
1.75
2.00
2.25
J F M A M J J A S O N D J F M A M J J A S O N D J F M A M J J A S O N D J F M A M J J A S O N D
$ / kg $ / barrelBrent Oil (in $ / barrel)
Natural Rubber (in $ / kg)
Textiles
17%
(0pp YoY)
Steel Reinf.
10%
(0pp YoY)
Natural Rubber
13%
(0pp YoY)
33%
raw mat. costs
on sales
Carbon Black
12%
(+2ppYoY)
Chemicals
22%
(-1pp YoY)
FY 2019 mix (based on purchasing cost)
45.0 ; -16% YoY
1.378 ; +1% YoY
54.8 ; +22% YoY
1.651 ; +20% YoY
71.5 ; +31% YoY
1.365 ; -17% YoY
2016 2017 2018
yearly avg. ; Δ YoY
2019
64.2 ; -10% YoY
1.406 ; +3% YoY
120
