powerful analyzing and evaluating of measured data - homepage: iba …€¦ · · 2018-04-26the...
TRANSCRIPT
ibaAnalyzer-ReportgeneratorAutomatic generation of individual reports
ibaAnalyzer-DBThe database interface for ibaAnalyzer
ibaDatCoordinatorData management automation
Powerful Analyzing and Evaluating of Measured Data
ibaAnalyzer Powerful analyzing and evaluating of measured data
ibaDatManagerThe fast overview of all iba data
ibaDatManager Situation DetectionFinding similar process situations
Software
ibaAnalyzer-InSpectraDetailed offl ine vibration analysis
iba AG
The Expert for Measurementand Automation Systems
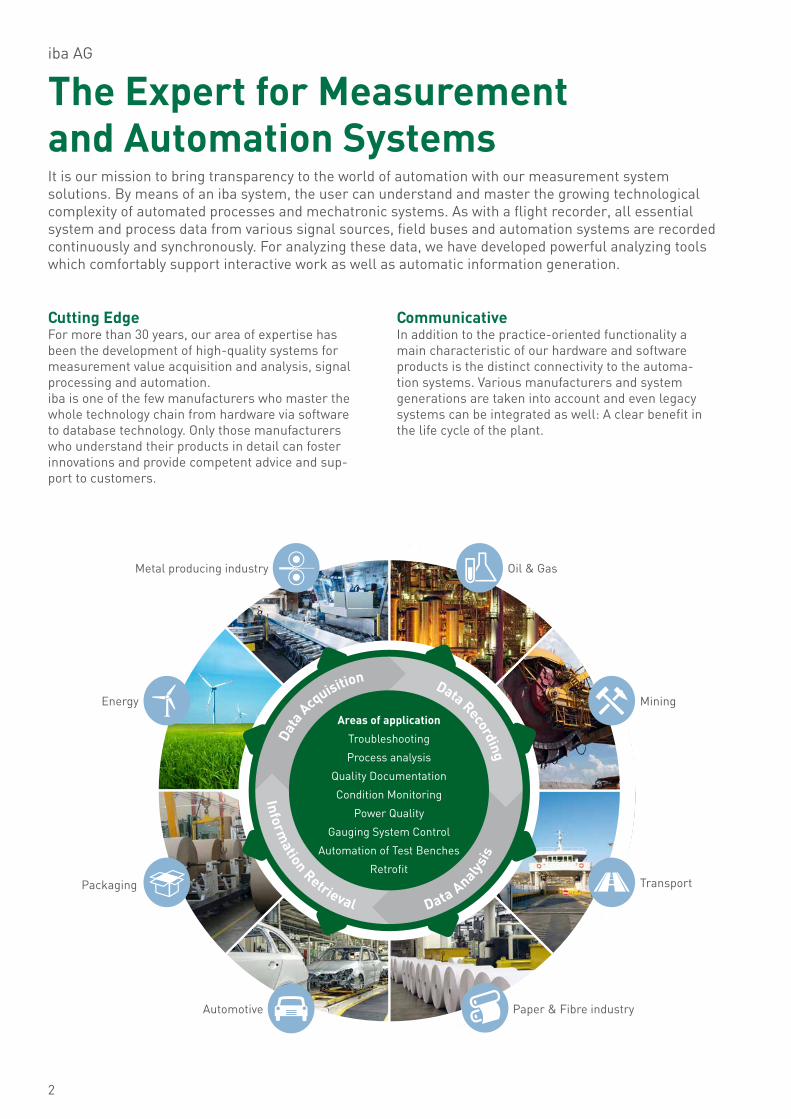
Cutting EdgeFor more than 30 years, our area of expertise hasbeen the development of high-quality systems formeasurement value acquisition and analysis, signalprocessing and automation.iba is one of the few manufacturers who master thewhole technology chain from hardware via softwareto database technology. Only those manufacturerswho understand their products in detail can fosterinnovations and provide competent advice and sup-port to customers.
CommunicativeIn addition to the practice-oriented functionality amain characteristic of our hardware and softwareproducts is the distinct connectivity to the automa-tion systems. Various manufacturers and systemgenerations are taken into account and even legacysystems can be integrated as well: A clear benefit inthe life cycle of the plant.
It is our mission to bring transparency to the world of automation with our measurement systemsolutions. By means of an iba system, the user can understand and master the growing technologicalcomplexity of automated processes and mechatronic systems. As with a flight recorder, all essentialsystem and process data from various signal sources, field buses and automation systems are recorded continuously and synchronously. For analyzing these data, we have developed powerful analyzing tools which comfortably support interactive work as well as automatic information generation.
Automotive Paper & Fibre industry
TransportPackaging
Metal producing industry Oil & Gas
Energy Mining
Areas of application
Troubleshooting
Process analysis
Quality Documentation
Condition Monitoring
Power Quality
Gauging System Control
Automation of Test Benches
Retrofit
Data
Acquisition Data Recording
Information
Retrieval DataAnaly
sis
2
3
Derive information
Analyzedata
HD
LongTerm Long-term trends
Interactive analysis
Data extraction to the database
Report
Reports
Alarm
ibaAnalyzer
ibaAnalyzer
remote
Recorddata
Acquiredata
analog/digital
Bus
Video / HMI
MES
ibaBM
ibaPADU
ibaNet
RequestPLC
ibaLink
ibaPDA
Ethe
rnet
HD
ibaFOB
.dat
3
ibaAnalyzerPowerful analyzing and evaluating of measured data .................. 4
ibaAnalyzer-DBDatabase interface for ibaAnalyzer ................................ 12
ibaAnalyzer-InSpectraDetailed offl ine vibration analysis .................................... 9
ibaDatCoordinatorData management automation ....................................... 16
ibaDatManagerThe fast overview of all iba data ..................................... 18
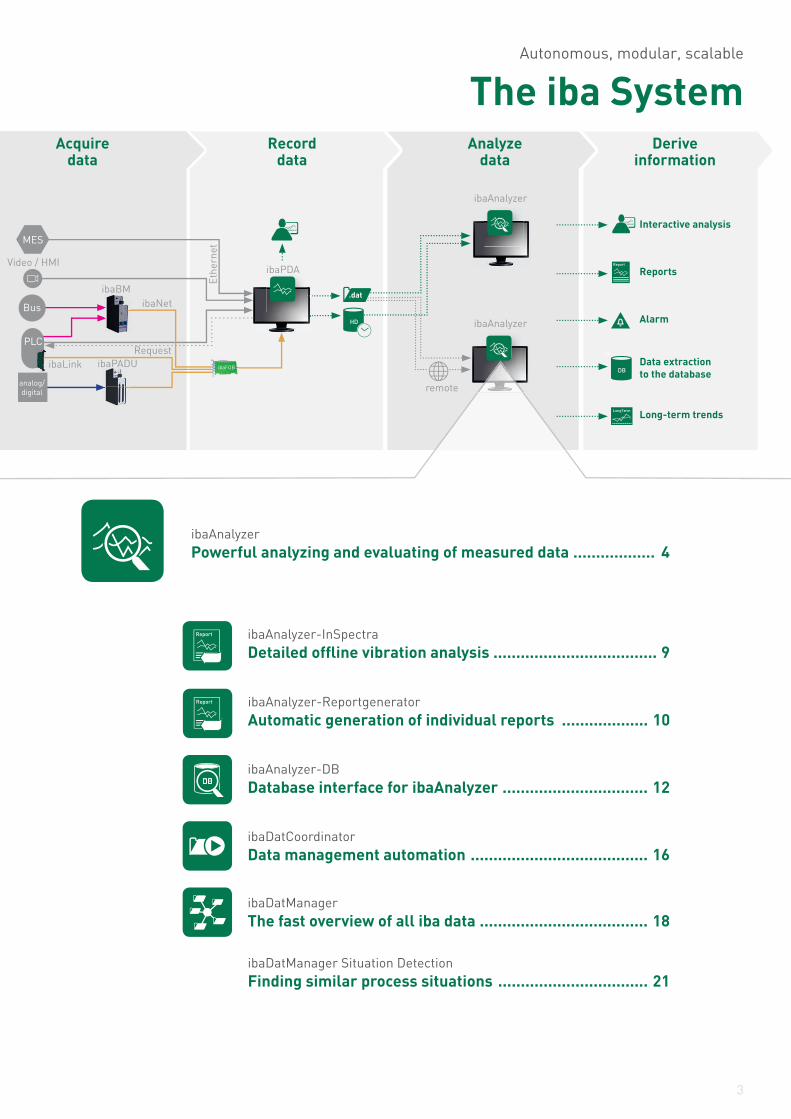
Autonomous, modular, scalable
The iba System
ibaDatManager Situation DetectionFinding similar process situations ................................. 21
ibaAnalyzer-ReportgeneratorAutomatic generation of individual reports ................... 10

4
ibaAnalyzer is characterized by broad functionalities for analyzing and evaluating. The application offers an intuitive operation along with the complex scope of functions. The license for editing measurement fi les which have been generated with the iba system, is for free.
Flexible, powerful, free of Charge Within the iba system, ibaAnalyzer is the key ele-ment in the fi eld of data analysis. ibaAnalyzer is a very powerful tool for analyzing measurement data effi ciently and without generating additional costs and deriving information from the analyses. The license for ibaAnalyzer is free of charge for analyzing data which have been acquired with iba systems like ibaPDA, ibaQDR or ibaLogic and were saved in the dat format as well as for data that have been record-ed with ibaHD-Server. ibaAnalyzer offers a wide range of analyzing fea-tures. Analysis procedures can be created f exibly and adapted individually, in a way that different users get the right analysis for their special purpos-es, e.g. for analyzing failures but also for doing long-term analyses for evaluating and optimizing pro-cesses.
The wide-ranging analysis features comprise the au-tomatic computing of specifi c characteristic values and statistical values, but also product related quali-ty data that can be used for a superordinated quality management system. Moreover, by means of power-ful mathematical and technological functions signals can be combined, calculated or set into relation to the raw values. Another feature of ibaAnalyzer is its outstanding ef-fi ciency. Recurring analysis procedures can be auto-mated in an easy way and hence relieve the user of routine work. With the integrated Reportgenerator, reports can be generated automatically which offer individually defi ned contents and layouts. For further information about the Reportgenerator, please see page 10.
In brief �Comprehensive online and off ine analysis � Intuitive user interface with Smart Docking windows and Drag & Drop function �Combination of data coming from various measurement processes or data sources �Powerful mathematical and technological functions for manipulating, combining, calculating and generating signals �Powerful graphical digital fi ter designer � Analyzing in the frequency range (FFT) �Reuse of analyses � Versatile markers for measurement of signals �Macro functions for protecting know-how
ibaAnalyzer offers numerous functions for analyzing iba measurement data and and deriving information from these data. In combination with ibaDatCoordinator, various procedures can be executed automatically.
The powerful analysis software
ibaAnalyzer

5
Analyzing Measurement Data Data can be analyzed either online during the mea-surement procedure or independently (off ine). If the measurement files are stored on a data server in the network, several interested users have access to these files and can analyze them according to their special needs. For this purpose, within one company, ibaAnalyzer can be copied and installed as often as needed, for any authorized user can analyze the da-ta under electrical, mechanical or technological as-pects. The data can be forwarded via e-mail to spe-cialists who can analyze these data at any place and any time.
Intuitive Use, comprehensive DisplayThe graphical user interface of the application can be used easily and intuitively. All partial windows and tabs can be positioned freely and docked on using drag & drop. The files and signal channels are managed in a comprehensive way due to a graphi-cal surface. On the screen, any number of signals can be displayed. For this purpose, depending on the requirements several signals can be put on a scale or each signal can be assigned to an own scale. For seeing details, the view can be zoomed up to individ-ual measurement points only by dragging with the mouse. For a better overview, you can assign a dif-
ferent color to every graph. Often, the paths of ana-log signals are compared to sequences of digital sig-nals for the user can better understand the process events. In ibaAnalyzer, both signal types can be com-bined without any problems. Text information that is stored in the measurement file can be displayed in relation to the measurement file or to an individual signal.
Signal-oriented Analysis In the signal paths, signal values and distances be-tween signals can be measured using two markers. Hence, length and time segments can be determined clearly. The current values are displayed in a com-prehensive way in a table.Also statistical information like maximum, mini-mum, average value and standard deviation are available at a simple mouse click. The values are al-ways calculated for a segment of the curve which can be set fast and freely using the cursor. For accentuating certain events in the signal path, ibaAnalyzer offers additional markers, which are displayed when predefined conditions have been fulfilled. This way, e.g. a marker can be displayed where for the first time a limit value has been ex-ceeded.
All partial windows like signal tree, signal strips, value ta-bles, search dialog etc. can be positioned freely.
By means of markers, the signal paths can be measured in an easy and fast way.
Signal tables with statistical values or FFT results (main frequency, harmonics)
6
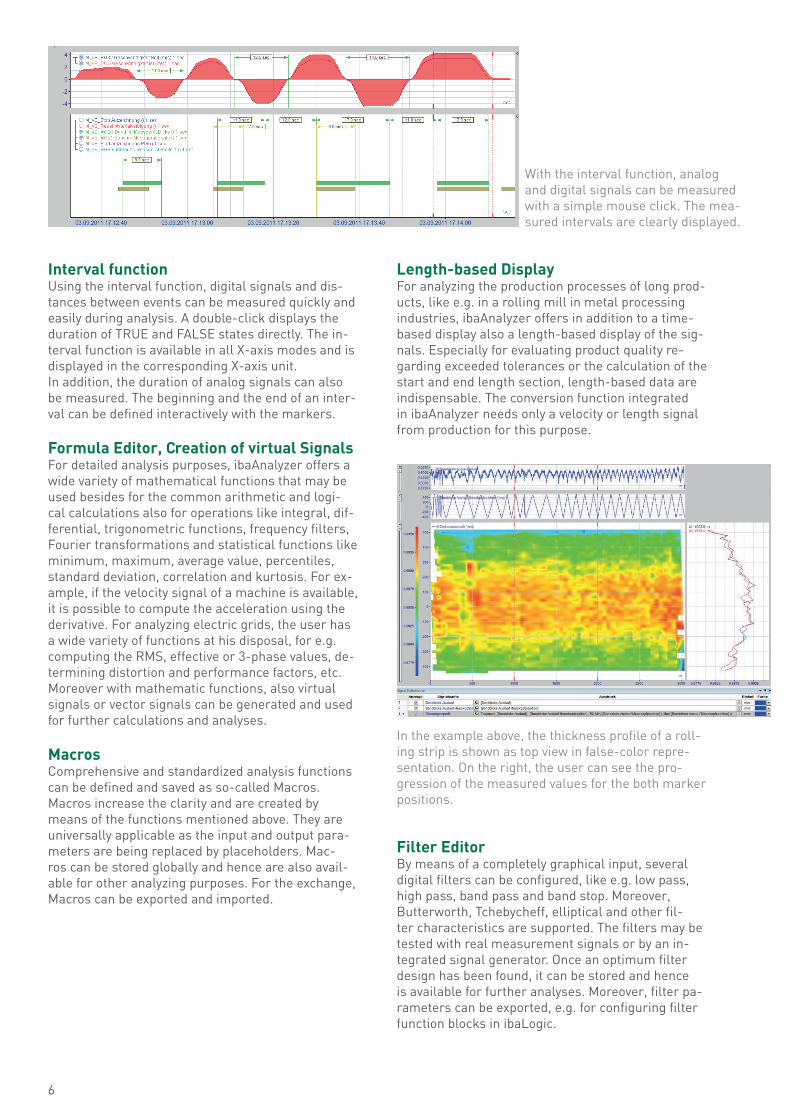
Interval functionUsing the interval function, digital signals and dis-tances between events can be measured quickly and easily during analysis. A double-click displays the duration of TRUE and FALSE states directly. The in-terval function is available in all X-axis modes and is displayed in the corresponding X-axis unit. In addition, the duration of analog signals can also be measured. The beginning and the end of an inter-val can be defi ned interactively with the markers.
Formula Editor, Creation of virtual Signals For detailed analysis purposes, ibaAnalyzer offers a wide variety of mathematical functions that may be used besides for the common arithmetic and logi-cal calculations also for operations like integral, dif-ferential, trigonometric functions, frequency fi lters, Fourier transformations and statistical functions like minimum, maximum, average value, percentiles, standard deviation, correlation and kurtosis. For ex-ample, if the velocity signal of a machine is available, it is possible to compute the acceleration using the derivative. For analyzing electric grids, the user has a wide variety of functions at his disposal, for e.g. computing the RMS, effective or 3-phase values, de-termining distortion and performance factors, etc. Moreover with mathematic functions, also virtual signals or vector signals can be generated and used for further calculations and analyses.
Macros Comprehensive and standardized analysis functions can be defi ned and saved as so-called Macros. Macros increase the clarity and are created by means of the functions mentioned above. They are universally applicable as the input and output para-meters are being replaced by placeholders. Mac-ros can be stored globally and hence are also avail-able for other analyzing purposes. For the exchange, Macros can be exported and imported.
Length-based Display For analyzing the production processes of long prod-ucts, like e.g. in a rolling mill in metal processing industries, ibaAnalyzer offers in addition to a time-based display also a length-based display of the sig-nals. Especially for evaluating product quality re-garding exceeded tolerances or the calculation of the start and end length section, length-based data are indispensable. The conversion function integrated in ibaAnalyzer needs only a velocity or length signal from production for this purpose.
Filter Editor By means of a completely graphical input, several digital fi lters can be confi gured, like e.g. low pass, high pass, band pass and band stop. Moreover, Butterworth, Tchebycheff, elliptical and other fi l-ter characteristics are supported. The fi lters may be tested with real measurement signals or by an in-tegrated signal generator. Once an optimum fi lter design has been found, it can be stored and hence is available for further analyses. Moreover, fi lter pa-rameters can be exported, e.g. for confi guring fi lter function blocks in ibaLogic.
In the example above, the thickness profile of a roll-ing strip is shown as top view in false-color repre-sentation. On the right, the user can see the pro-gression of the measured values for the both marker positions.
With the interval function, analog and digital signals can be measured with a simple mouse click. The mea-sured intervals are clearly displayed.
7
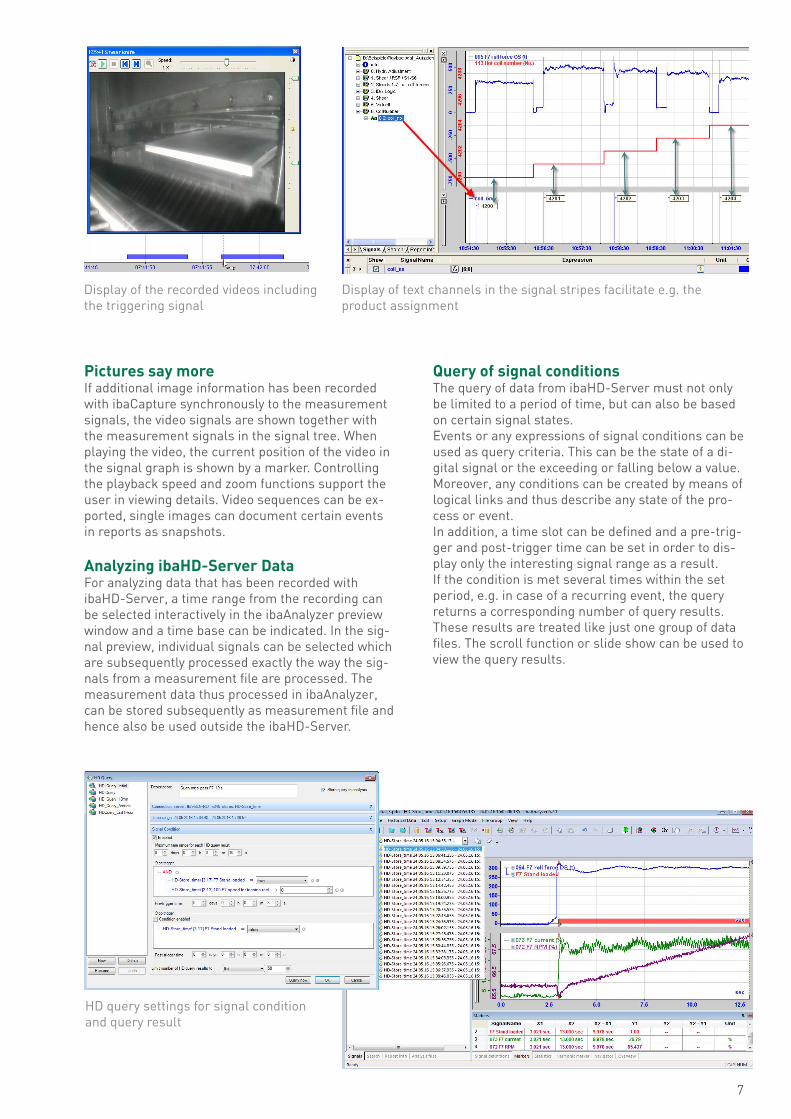
Pictures say more If additional image information has been recorded with ibaCapture synchronously to the measurement signals, the video signals are shown together with the measurement signals in the signal tree. When playing the video, the current position of the video in the signal graph is shown by a marker. Controlling the playback speed and zoom functions support the user in viewing details. Video sequences can be ex-ported, single images can document certain events in reports as snapshots.
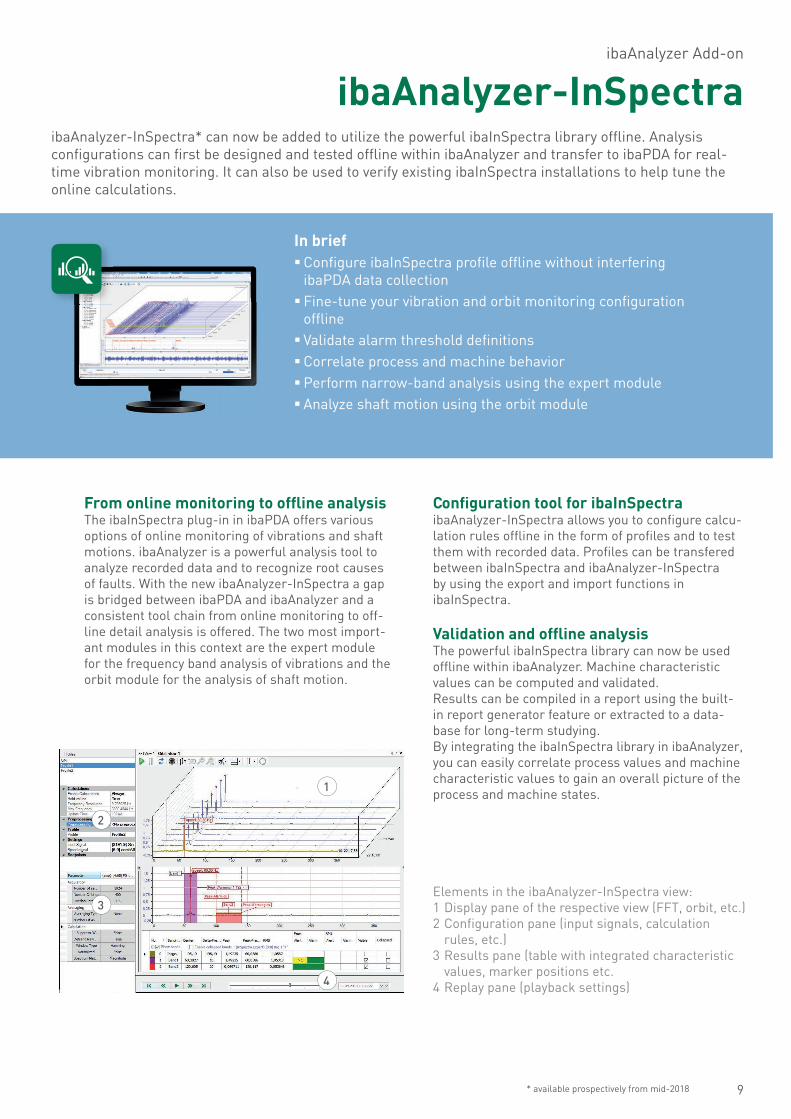
Analyzing ibaHD-Server DataFor analyzing data that has been recorded with ibaHD-Server, a time range from the recording can be selected interactively in the ibaAnalyzer preview window and a time base can be indicated. In the sig-nal preview, individual signals can be selected which are subsequently processed exactly the way the sig-nals from a measurement file are processed. The meas urement data thus processed in ibaAnalyzer, can be stored subsequently as measurement file and hence also be used outside the ibaHD-Server.
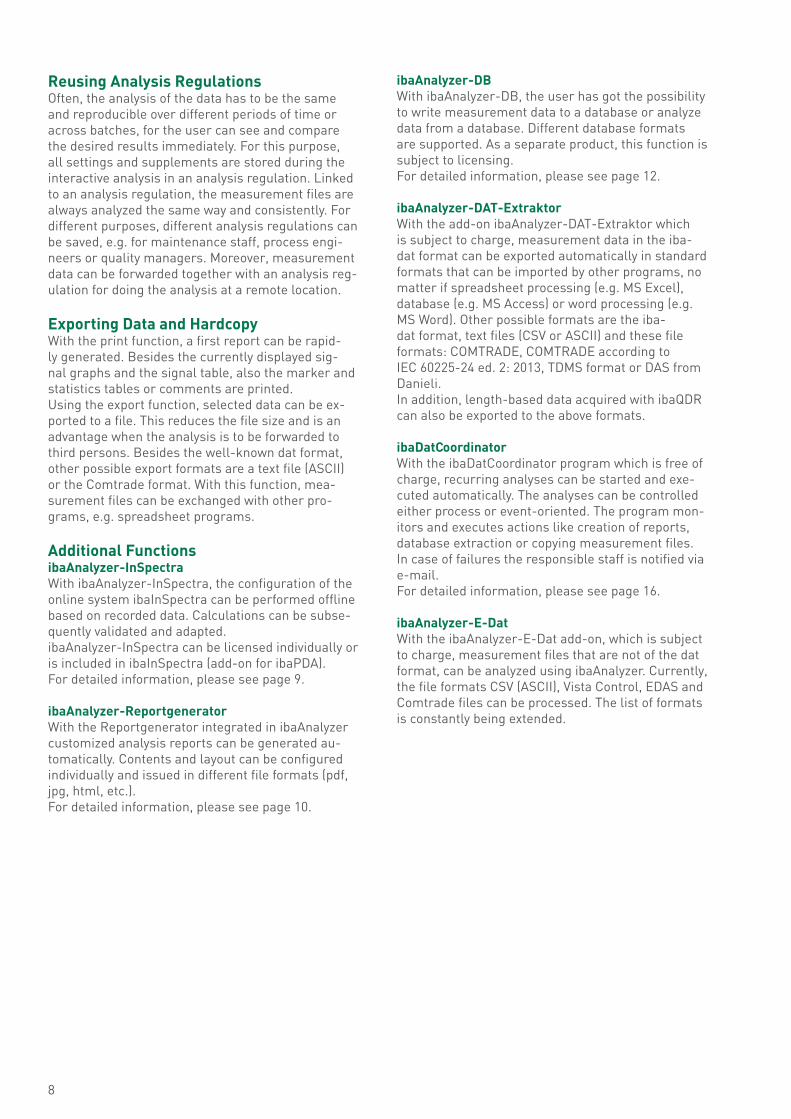
Query of signal conditionsThe query of data from ibaHD-Server must not only be limited to a period of time, but can also be based on certain signal states. Events or any expressions of signal conditions can be used as query criteria. This can be the state of a di-gital signal or the exceeding or falling below a value. Moreover, any conditions can be created by means of logical links and thus describe any state of the pro-cess or event. In addition, a time slot can be defined and a pre-trig-ger and post-trigger time can be set in order to dis-play only the interesting signal range as a result. If the condition is met several times within the set period, e.g. in case of a recurring event, the query returns a corresponding number of query results. These results are treated like just one group of data files. The scroll function or slide show can be used to view the query results.
Display of the recorded videos including the triggering signal
Display of text channels in the signal stripes facilitate e.g. the product assignment
HD query settings for signal condition and query result
8
Reusing Analysis Regulations Often, the analysis of the data has to be the same and reproducible over different periods of time or across batches, for the user can see and compare the desired results immediately. For this purpose, all settings and supplements are stored during the interactive analysis in an analysis regulation. Linked to an analysis regulation, the measurement files are always analyzed the same way and consistently. For different purposes, different analysis regulations can be saved, e.g. for maintenance staff, process engi-neers or quality managers. Moreover, measurement data can be forwarded together with an analysis reg-ulation for doing the analysis at a remote location.
Exporting Data and Hardcopy With the print function, a first report can be rapid-ly generated. Besides the currently displayed sig-nal graphs and the signal table, also the marker and statistics tables or comments are printed.Using the export function, selected data can be ex-ported to a file. This reduces the file size and is an advantage when the analysis is to be forwarded to third persons. Besides the well-known dat format, other possible export formats are a text file (ASCII) or the Comtrade format. With this function, mea-surement files can be exchanged with other pro-grams, e.g. spreadsheet programs.
Additional Functions ibaAnalyzer-InSpectraWith ibaAnalyzer-InSpectra, the configuration of the online system ibaInSpectra can be performed offine based on recorded data. Calculations can be subse-quently validated and adapted. ibaAnalyzer-InSpectra can be licensed individually or is included in ibaInSpectra (add-on for ibaPDA).For detailed information, please see page 9.
ibaAnalyzer-Reportgenerator With the Reportgenerator integrated in ibaAnalyzer customized analysis reports can be generated au-tomatically. Contents and layout can be configured individually and issued in different file formats (pdf, jpg, html, etc.). For detailed information, please see page 10.
ibaAnalyzer-DB With ibaAnalyzer-DB, the user has got the possibility to write measurement data to a database or analyze data from a database. Different database formats are supported. As a separate product, this function is subject to licensing. For detailed information, please see page 12.
ibaAnalyzer-DAT-Extraktor With the add-on ibaAnalyzer-DAT-Extraktor which is subject to charge, measurement data in the iba-dat format can be exported automatically in standard formats that can be imported by other programs, no matter if spreadsheet processing (e.g. MS Excel), database (e.g. MS Access) or word processing (e.g. MS Word). Other possible formats are the iba-dat format, text files (CSV or ASCII) and these file formats: COMTRADE, COMTRADE according to IEC 60225-24 ed. 2: 2013, TDMS format or DAS from Danieli. In addition, length-based data acquired with ibaQDR can also be exported to the above formats.
ibaDatCoordinator With the ibaDatCoordinator program which is free of charge, recurring analyses can be started and exe-cuted automatically. The analyses can be controlled either process or event-oriented. The program mon-itors and executes actions like creation of reports, database extraction or copying measurement files. In case of failures the responsible staff is notified via e-mail. For detailed information, please see page 16.
ibaAnalyzer-E-Dat With the ibaAnalyzer-E-Dat add-on, which is subject to charge, measurement files that are not of the dat format, can be analyzed using ibaAnalyzer. Currently, the file formats CSV (ASCII), Vista Control, EDAS and Comtrade files can be processed. The list of formats is constantly being extended.
9
From online monitoring to offl ine analysisThe ibaInSpectra plug-in in ibaPDA offers various options of online monitoring of vibrations and shaft motions. ibaAnalyzer is a powerful analysis tool to analyze recorded data and to recognize root causes of faults. With the new ibaAnalyzer- InSpectra a gap is bridged between ibaPDA and ibaAnalyzer and a consistent tool chain from online monitoring to off-line detail analysis is offered. The two most import-ant modules in this context are the expert module for the frequency band analysis of vibrations and the orbit module for the analysis of shaft motion.
Confi guration tool for ibaInSpectraibaAnalyzer-InSpectra allows you to confi gure calcu-lation rules off ine in the form of profi les and to test them with recorded data. Profi les can be transfered between ibaInSpectra and ibaAnalyzer-InSpectra by using the export and import functions in ibaInSpectra.
Validation and offl ine analysisThe powerful ibaInSpectra library can now be used off ine within ibaAnalyzer. Machine characteristic values can be computed and validated. Results can be compiled in a report using the built-in report generator feature or extracted to a data-base for long-term studying. By integrating the ibaInSpectra library in ibaAnalyzer, you can easily correlate process values and machine characteristic values to gain an overall picture of the process and machine states.
ibaAnalyzer Add-on
ibaAnalyzer-InSpectraibaAnalyzer-InSpectra* can now be added to utilize the powerful ibaInSpectra library off ine. Analysis confi gurations can fi rst be designed and tested off ine within ibaAnalyzer and transfer to ibaPDA for real-time vibration monitoring. It can also be used to verify existing ibaInSpectra installations to help tune the online calculations.
In brief �Confi gure ibaInSpectra profi le off ine without interfering ibaPDA data collection � Fine-tune your vibration and orbit monitoring confi guration off ine � Validate alarm threshold defi nitions �Correlate process and machine behavior �Perform narrow-band analysis using the expert module � Analyze shaft motion using the orbit module
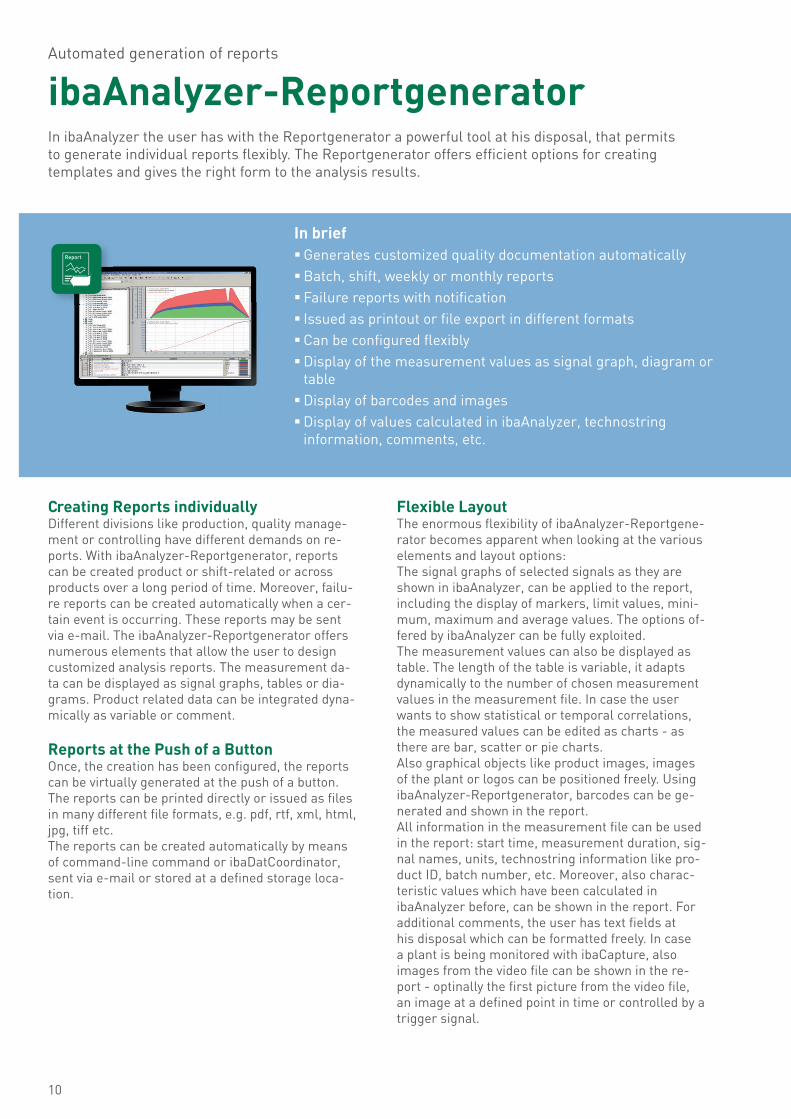
Elements in the ibaAnalyzer-InSpectra view:1 Display pane of the respective view (FFT, orbit, etc.)2 Configuration pane (input signals, calculation
rules, etc.)3 Results pane (table with integrated characteristic
values, marker positions etc.4 Replay pane (playback settings)
1
2
3
4
* available prospectively from mid-2018
10
In brief �Generates customized quality documentation automatically �Batch, shift, weekly or monthly reports � Failure reports with notifi cation � Issued as printout or fi le export in different formats �Can be confi gured f exibly �Display of the measurement values as signal graph, diagram or table �Display of barcodes and images �Display of values calculated in ibaAnalyzer, technostring information, comments, etc.
Creating Reports individually Different divisions like production, quality manage-ment or controlling have different demands on re-ports. With ibaAnalyzer-Reportgenerator, reports can be created product or shift-related or across products over a long period of time. Moreover, failu-re reports can be created automatically when a cer-tain event is occurring. These reports may be sent via e-mail. The ibaAnalyzer-Reportgenerator offers numerous elements that allow the user to design customized analysis reports. The measurement da-ta can be displayed as signal graphs, tables or dia-grams. Product related data can be integrated dyna-mically as variable or comment.
Reports at the Push of a Button Once, the creation has been confi gured, the reports can be virtually generated at the push of a button. The reports can be printed directly or issued as fi les in many different fi le formats, e.g. pdf, rtf, xml, html, jpg, tiff etc. The reports can be created automatically by means of command-line command or ibaDatCoordinator, sent via e-mail or stored at a defi ned storage loca-tion.
Flexible Layout The enormous f exibility of ibaAnalyzer-Reportgene-rator becomes apparent when looking at the various elements and layout options: The signal graphs of selected signals as they are shown in ibaAnalyzer, can be applied to the report, including the display of markers, limit values, mini-mum, maximum and average values. The options of-fered by ibaAnalyzer can be fully exploited. The measurement values can also be displayed as table. The length of the table is variable, it adapts dynamically to the number of chosen measurement values in the measurement fi le. In case the user wants to show statistical or temporal correlations, the measured values can be edited as charts - as there are bar, scatter or pie charts. Also graphical objects like product images, images of the plant or logos can be positioned freely. Using ibaAnalyzer-Reportgenerator, barcodes can be ge-nerated and shown in the report. All information in the measurement fi le can be used in the report: start time, measurement duration, sig-nal names, units, technostring information like pro-duct ID, batch number, etc. Moreover, also charac-teristic values which have been calculated in ibaAnalyzer before, can be shown in the report. For additional comments, the user has text fi elds at his disposal which can be formatted freely. In case a plant is being monitored with ibaCapture, also images from the video fi le can be shown in the re-port - optinally the fi rst picture from the video fi le, an image at a defi ned point in time or controlled by a trigger signal.
Automated generation of reports
ibaAnalyzer-ReportgeneratorIn ibaAnalyzer the user has with the Reportgenerator a powerful tool at his disposal, that permits to generate individual reports f exibly. The Reportgenerator offers effi cient options for creating templates and gives the right form to the analysis results.
11
Application Examples
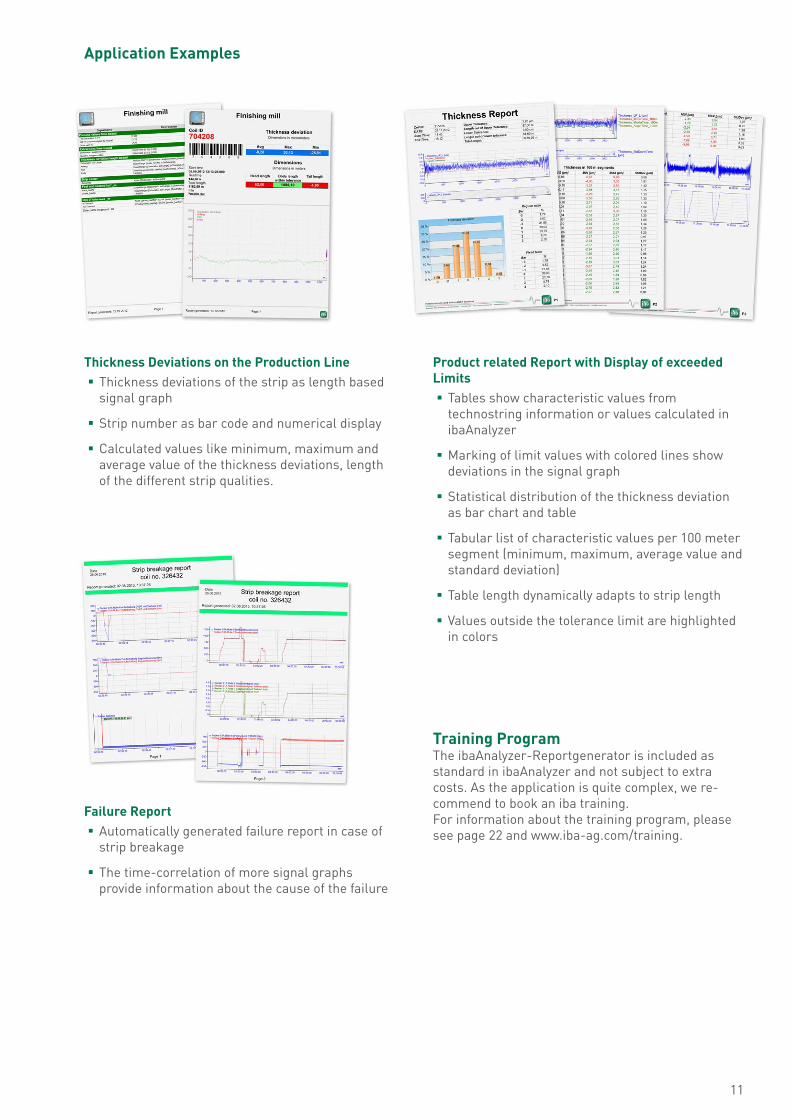
Thickness Deviations on the Production Line � Thickness deviations of the strip as length based signal graph
� Strip number as bar code and numerical display
� Calculated values like minimum, maximum and average value of the thickness deviations, length of the different strip qualities.
Product related Report with Display of exceeded Limits
� Tables show characteristic values from technostring information or values calculated in ibaAnalyzer
� Marking of limit values with colored lines show deviations in the signal graph
� Statistical distribution of the thickness deviation as bar chart and table
� Tabular list of characteristic values per 100 meter segment (minimum, maximum, average value and standard deviation)
� Table length dynamically adapts to strip length
� Values outside the tolerance limit are highlighted in colors
Failure Report � Automatically generated failure report in case of strip breakage
� The time-correlation of more signal graphs provide information about the cause of the failure
Training Program The ibaAnalyzer-Reportgenerator is included as standard in ibaAnalyzer and not subject to extra costs. As the application is quite complex, we re-commend to book an iba training. For information about the training program, please see page 22 and www.iba-ag.com/training.
12
ibaAnalyzer Add-on
ibaAnalyzer-DBibaAnalyzer-DB, the database interface for ibaAnalyzer, allows for further aggregating the measured data length or time related and storing them along with the calculated characteristic values in databases.
In brief �Database extraction via ODBC/OLE DB provider � Integration of basic process data into the production and quality management � Transparent and comprehensible calculation and extraction of quality data and characteristic values (KPI) from high-resolution raw data into databases �Using ibaAnalyzer and ibaAnalyzer-Reportgenerator based on database queries � Answering process-related questions by database analysis � Flexible Drill-Down to raw data
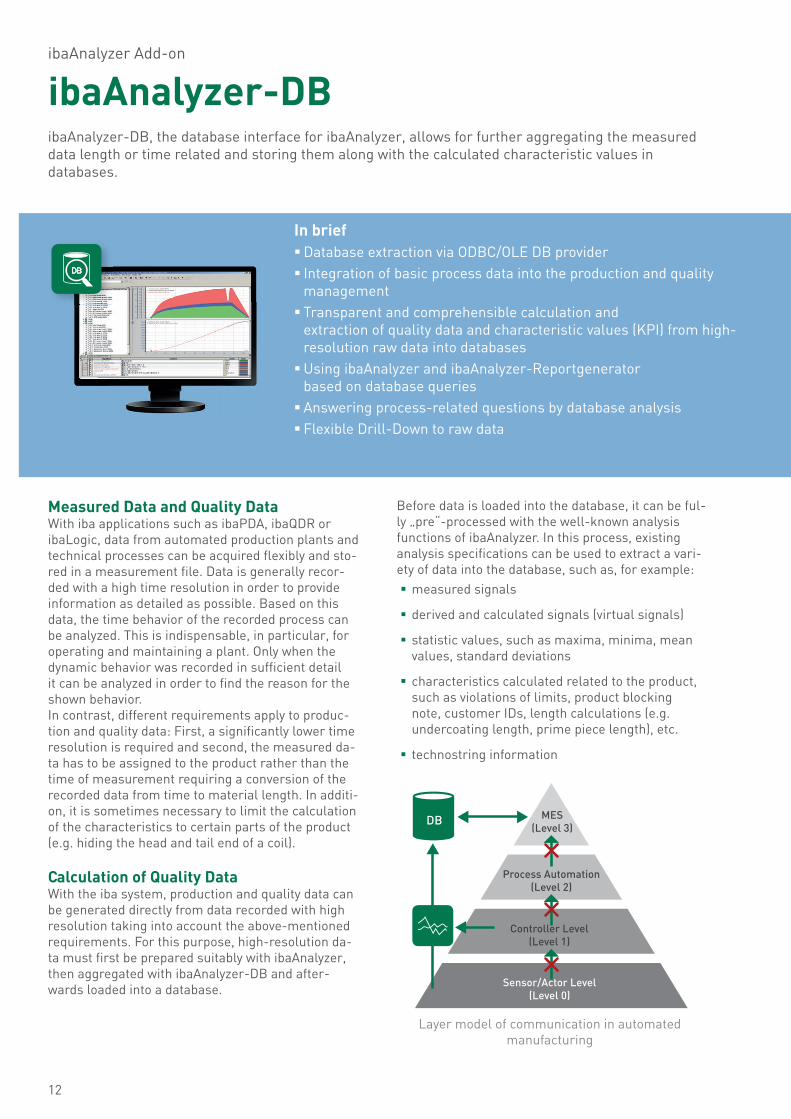
Measured Data and Quality DataWith iba applications such as ibaPDA, ibaQDR or ibaLogic, data from automated production plants and technical processes can be acquired f exibly and sto-red in a measurement fi le. Data is generally recor-ded with a high time resolution in order to provide information as detailed as possible. Based on this data, the time behavior of the recorded process can be analyzed. This is indispensable, in particular, for operating and maintaining a plant. Only when the dynamic behavior was recorded in suffi cient detail it can be analyzed in order to fi nd the reason for the shown behavior.In contrast, different requirements apply to produc-tion and quality data: First, a signifi cantly lower time resolution is required and second, the measured da-ta has to be assigned to the product rather than the time of measurement requiring a conversion of the recorded data from time to material length. In additi-on, it is some times necessary to limit the calculation of the characteristics to certain parts of the product (e.g. hiding the head and tail end of a coil).
Calculation of Quality DataWith the iba system, production and quality data can be generated directly from data recorded with high resolution taking into account the above-mentioned requirements. For this purpose, high-resolution da-ta must fi rst be prepared suitably with ibaAnalyzer, then aggregated with ibaAnalyzer-DB and after-wards loaded into a database.
Before data is loaded into the database, it can be ful-ly „pre“-processed with the well-known analysis func tions of ibaAnalyzer. In this process, existing analysis specifi cations can be used to extract a vari-ety of data into the database, such as, for example:
� measured signals
� derived and calculated signals (virtual signals)
� statistic values, such as maxima, minima, mean values, standard deviations
� characteristics calculated related to the product, such as violations of limits, product blocking note, customer IDs, length calculations (e.g. undercoating length, prime piece length), etc.
� technostring information
MES(Level 3)
Process Automation(Level 2)
Controller Level(Level 1)
Sensor/Actor Level(Level 0)
Layer model of communication in automated manufacturing
13
All values available in an analysis specifi cation (pdo fi le) can also be written into the database. Thus, cha-racteristic values required for later analysis can be calculated from the raw data with ibaAnalyzer-DB already before data is loaded into the database. On the basis of these values, the database can be searched and the evaluation can be focused accor-dingly. This is how the iba system allows the extrac-tion of quality data from high-resolution production data. The classic layer model of communication in automated manufacturing (see fi gure at the bottom left) is consciously not adhered to in order to boast the following advantages:
� versatile connectivity
� fast data acquisition
� data pre-processing right after generation
� calculation of KPIs direct at the source
� source of KPI data is known and traceable
� Drill Down to raw data possible
� f exibility in case of changes - if different or more data have to be extracted into the database, only the confi guration but not the communication interfaces between the individual levels need to be adapted.
Standard Interface for DatabasesibaAnalyzer-DB uses the standard interfaces OLE DB and ODBC for communication with the databases. Based on this concept, ibaAnalyzer can work with many different data bases, such as, for example:
� Microsoft SQL Server
� Oracle
� IBM DB2 UDB
� MySQL
� PostgreSQL
� Microsoft Access
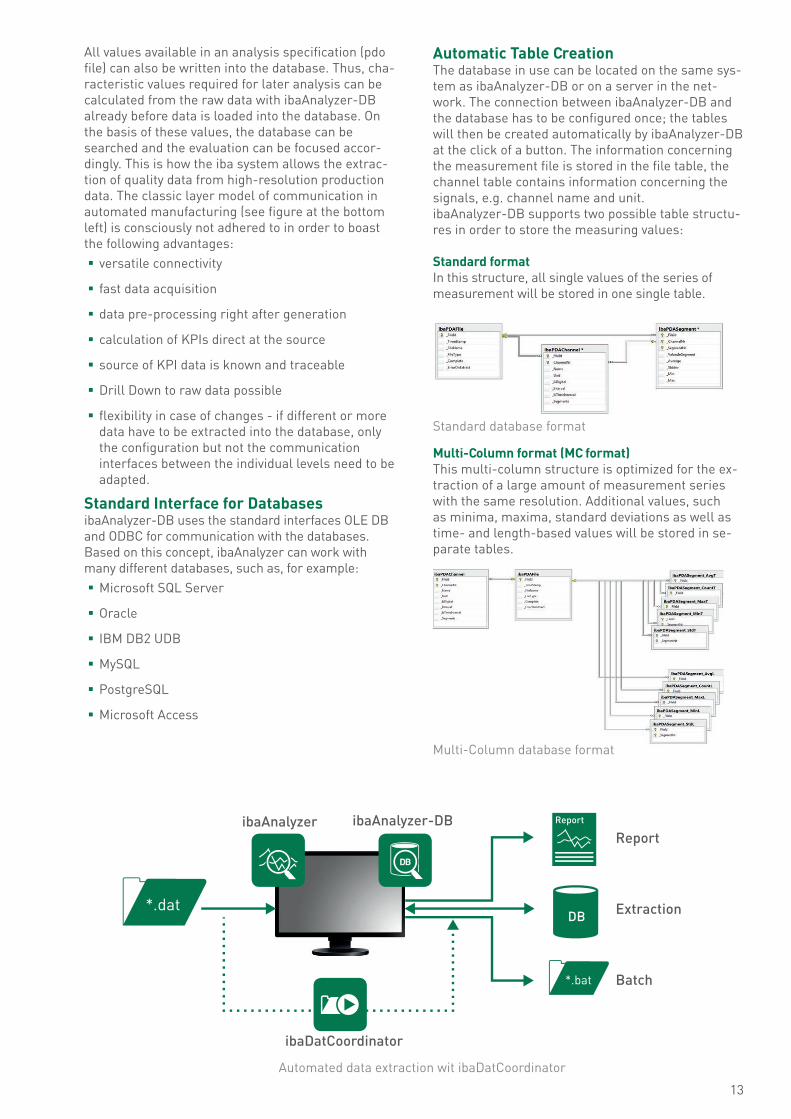
Automatic Table CreationThe database in use can be located on the same sys-tem as ibaAnalyzer-DB or on a server in the net-work. The connection between ibaAnalyzer-DB and the database has to be confi gured once; the tables will then be created automatically by ibaAnalyzer-DB at the click of a button. The information concerning the measurement fi le is stored in the fi le table, the channel table contains information concerning the signals, e.g. channel name and unit.ibaAnalyzer-DB supports two possible table structu-res in order to store the measuring values:
Standard formatIn this structure, all single values of the series of meas urement will be stored in one single table.
Multi-Column format (MC format)This multi-column structure is optimized for the ex-traction of a large amount of measurement series with the same resolution. Additional values, such as minima, maxima, standard deviations as well as time- and length-based values will be stored in se-parate tables.
ibaDatCoordinator
ibaAnalyzer
*.dat
*.bat Batch
Report
Extraction
ibaAnalyzer-DB
Automated data extraction wit ibaDatCoordinator
Standard database format
Multi-Column database format
14
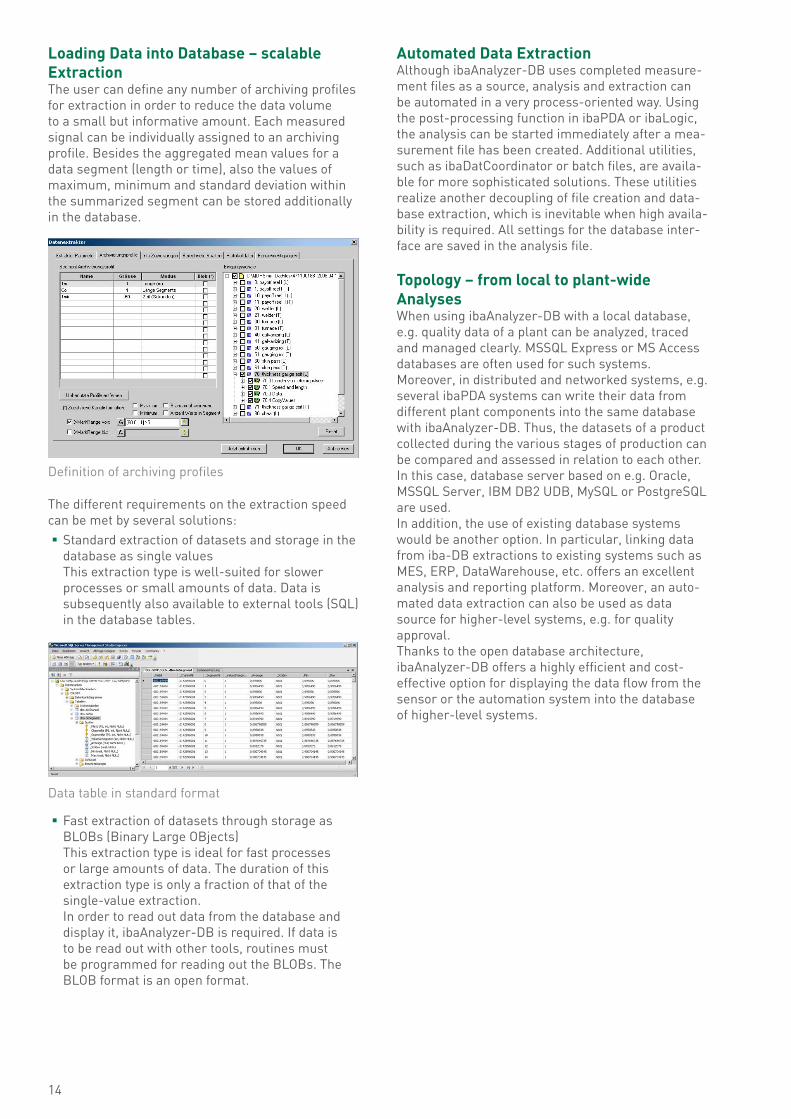
Loading Data into Database – scalable Extraction The user can define any number of archiving profiles for extraction in order to reduce the data volume to a small but informative amount. Each measured signal can be individually assigned to an archiving profile. Besides the aggregated mean values for a data segment (length or time), also the values of maximum, minimum and standard deviation within the summarized segment can be stored additionally in the database.
The different requirements on the extraction speed can be met by several solutions:
� Standard extraction of datasets and storage in the database as single values This extraction type is well-suited for slower processes or small amounts of data. Data is subsequently also available to external tools (SQL) in the database tables.
� Fast extraction of datasets through storage as BLOBs (Binary Large OBjects) This extraction type is ideal for fast processes or large amounts of data. The duration of this extraction type is only a fraction of that of the single-value extraction. In order to read out data from the database and display it, ibaAnalyzer-DB is required. If data is to be read out with other tools, routines must be programmed for reading out the BLOBs. The BLOB format is an open format.
Automated Data Extraction Although ibaAnalyzer-DB uses completed measure-ment files as a source, analysis and extraction can be automated in a very process-oriented way. Using the post-processing function in ibaPDA or ibaLogic, the analysis can be started immediately after a mea-surement file has been created. Additional utilities, such as ibaDatCoordinator or batch files, are availa-ble for more sophisticated solutions. These utilities realize another decoupling of file creation and data-base extraction, which is inevitable when high availa-bility is required. All settings for the database inter-face are saved in the analysis file.
Topology – from local to plant-wide AnalysesWhen using ibaAnalyzer-DB with a local database, e.g. quality data of a plant can be analyzed, traced and managed clearly. MSSQL Express or MS Access databases are often used for such systems. Moreover, in distributed and networked systems, e.g. several ibaPDA systems can write their data from different plant components into the same database with ibaAnalyzer-DB. Thus, the datasets of a product collected during the various stages of production can be compared and assessed in relation to each other. In this case, database server based on e.g. Oracle, MSSQL Server, IBM DB2 UDB, MySQL or PostgreSQL are used. In addition, the use of existing database systems would be another option. In particular, linking data from iba-DB extractions to existing systems such as MES, ERP, DataWarehouse, etc. offers an excellent analysis and reporting platform. Moreover, an auto-mated data extraction can also be used as data source for higher-level systems, e.g. for quality approval.Thanks to the open database architecture, ibaAnalyzer-DB offers a highly efficient and cost- effective option for displaying the data fow from the sensor or the automation system into the database of higher-level systems.
Definition of archiving profiles
Data table in standard format

15
Database QueryThe standard query wizard of ibaAnalyzer-DB assists the user during database query or in searching for specific data using different criteria. Queries can be saved for later use and managed with ibaAnalyzer.
More sophisticated queries can be defined directly in SQL statements, whereas saved queries from the Query Builder serve as templates.
A separate dialog is available for trend queries. Here, any time series (DB tables or views) can be used. One column each for date and time is a prere-quisite for the query results to be displayed properly.
Database AnalysisThe read data can be viewed and analyzed in used way with ibaAnalyzer-DB. It is particularly interest-ing to note that analyses can also be carried out di-rectly on the basis of the prepared characteristic values of the database. Thus, long-term analyses, analyses of working days or shifts but also trend analyses are possible.
For navigation in trend queries, ibaAnalyzer offers an overview option for long-term recordings. As the reference to the raw data (iba measurement file) is also stored in the database, a Drill Down from the overview to high-resolution raw data is possible.Of course, all analyses and data available in ibaAnalyzer can also be used for reporting. So, the report generator integrated in ibaAnalyzer can be configured and operated with the database-based analysis just as with the analysis based on the mea-surement files only.Using the iba applications ibaDatCoordinator and ibaAnalyzer-Reportgenerator in combination with ibaAnalyzer-DB, a very efficient, fexible and always transparent information and reporting system can be implemented from measurement files.
Query wizard
Long-term analysis in ibaAnalyzer
Trend overview
Trend queries
SQL queries
16
ibaAnalyzer Add-on
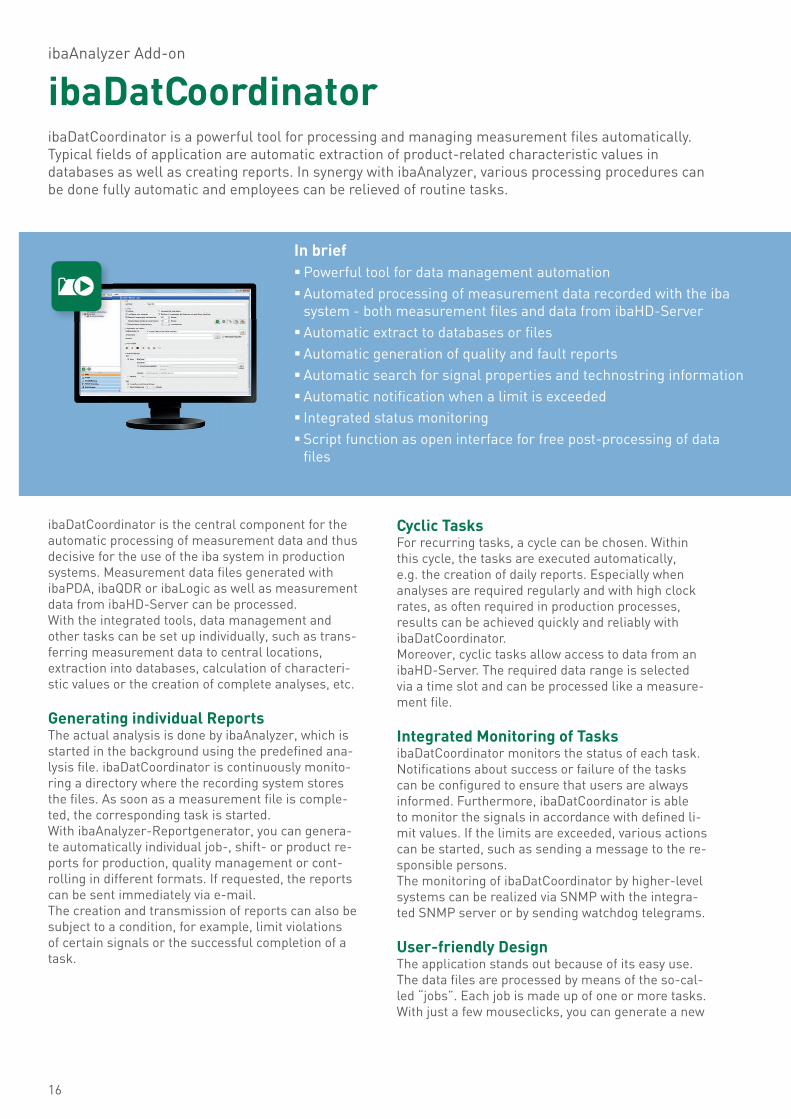
ibaDatCoordinator ibaDatCoordinator is a powerful tool for processing and managing measurement fi les automatically. Typical fi elds of application are automatic extraction of product-related characteristic values in databases as well as creating reports. In synergy with ibaAnalyzer, various processing procedures can be done fully automatic and employees can be relieved of routine tasks.
In brief �Powerful tool for data management automation � Automated processing of measurement data recorded with the iba system - both measurement fi les and data from ibaHD-Server � Automatic extract to databases or fi les � Automatic generation of quality and fault reports � Automatic search for signal properties and technostring information � Automatic notifi cation when a limit is exceeded � Integrated status monitoring � Script function as open interface for free post-processing of data fi les
ibaDatCoordinator is the central component for the automatic processing of measurement data and thus decisive for the use of the iba system in production systems. Measurement data fi les generated with ibaPDA, ibaQDR or ibaLogic as well as measurement data from ibaHD-Server can be processed. With the integrated tools, data management and other tasks can be set up individually, such as trans-ferring measurement data to central locations, extraction into databases, calculation of characteri-stic values or the creation of complete analyses, etc.
Generating individual ReportsThe actual analysis is done by ibaAnalyzer, which is started in the background using the predefi ned ana-lysis fi le. ibaDatCoordinator is continuously monito-ring a directory where the recording system stores the fi les. As soon as a measurement fi le is comple-ted, the corresponding task is started.With ibaAnalyzer-Reportgenerator, you can genera-te automatically individual job-, shift- or product re-ports for production, quality management or cont-rolling in different formats. If requested, the reports can be sent immediately via e-mail. The creation and transmission of reports can also be subject to a condition, for example, limit violations of certain signals or the successful completion of a task.
Cyclic Tasks For recurring tasks, a cycle can be chosen. Within this cycle, the tasks are executed automatically, e.g. the creation of daily reports. Especially when analyses are required regularly and with high clock rates, as often required in production processes, results can be achieved quickly and reliably with ibaDatCoordinator. Moreover, cyclic tasks allow access to data from an ibaHD-Server. The required data range is selected via a time slot and can be processed like a measure-ment fi le.
Integrated Monitoring of Tasks ibaDatCoordinator monitors the status of each task. Notifi cations about success or failure of the tasks can be confi gured to ensure that users are always informed. Furthermore, ibaDatCoordinator is able to monitor the signals in accordance with defi ned li-mit values. If the limits are exceeded, various actions can be started, such as sending a message to the re-sponsible persons.The monitoring of ibaDatCoordinator by higher-level systems can be realized via SNMP with the integra-ted SNMP server or by sending watchdog telegrams.
User-friendly DesignThe application stands out because of its easy use. The data fi les are processed by means of the so-cal-led “jobs”. Each job is made up of one or more tasks. With just a few mouseclicks, you can generate a new
17
job and the related tasks. The sequence of tasks can be easily changed or dragged from one job to ano-ther using drag & drop.
Customized InstallationibaDatCoordinator can be used as a stand-alone program or installed as client and server. The cli-ent-server principle allows distributed, decentrali-zed servers in the network to be confi gured from a central location.
The different Tasks: Copy TaskBy means of a copy task, you can copy data fi les on a fi le server or move them. For reducing the load of the ibaPDA server, the data fi les can be deleted as soon as they have been copied successfully (clean-up strategy).
Report TaskThe report task allows you to create reports auto-matically. The report can either be sent to a printer or generated as a fi le in different fi le types. The fol-lowing fi le types can be generated: pdf, htm, mhtml, txt, xls, rtf, tif, emf, jpg, bmp, xml. A report can also be sent as e-mail.
Extract TaskAn extract task can extract data from a data fi le to-wards a database or another data format. This way, also third party systems have got access to the mea-sured data. Also data from an ibaHD-Server can be extracted to a measurement fi le.
Script TaskThe script task can be used to run a self-created script. The scripts supported by ibaDatCoordinator are all scripts that run under the standard Windows command shell, e.g. batch fi les (*.bat), Visual Basicscripts (*.vbs) or Java scripts (*.js). This task offers an open interface for a free process ing of measured data.
Condition Task A condition task can be used to control the exe cution of the following tasks. A condition can be defi ned di-rectly from the signals available in the measurement fi le or from a value calculated by ibaAnalyzer. This way, “outliers” can be subsequently found or mea-sured data of specifi c product groups can be com-bined. The data fi les can then be copied in a separate sub-directory or a report based on this data can be generated.
Pause TaskThe pause task allows the delayed execution of an update task.
Update Data TaskAn update data task can add info fi elds into a meas-urement fi le or rename the measurement fi le based on data available in a database. This can be a meas-ured value delivered by another system, e.g. weight.A special license is necessary for the update data task. Splitter TaskWith the splitter task, a measurement fi le can be split into several measurement fi les with shorter time ranges, containing the same signals.
ibaHD ImportWith the ibaHD import task, measurement fi les can be imported into an HD store of an ibaHD-Server.
S7 WriterWith the S7 writer task it is possible to extract or cal-culate data from a measurement fi le and write this data in data blocks (DB) within an S7 PLC. A special license is necessary for the S7 writer task.
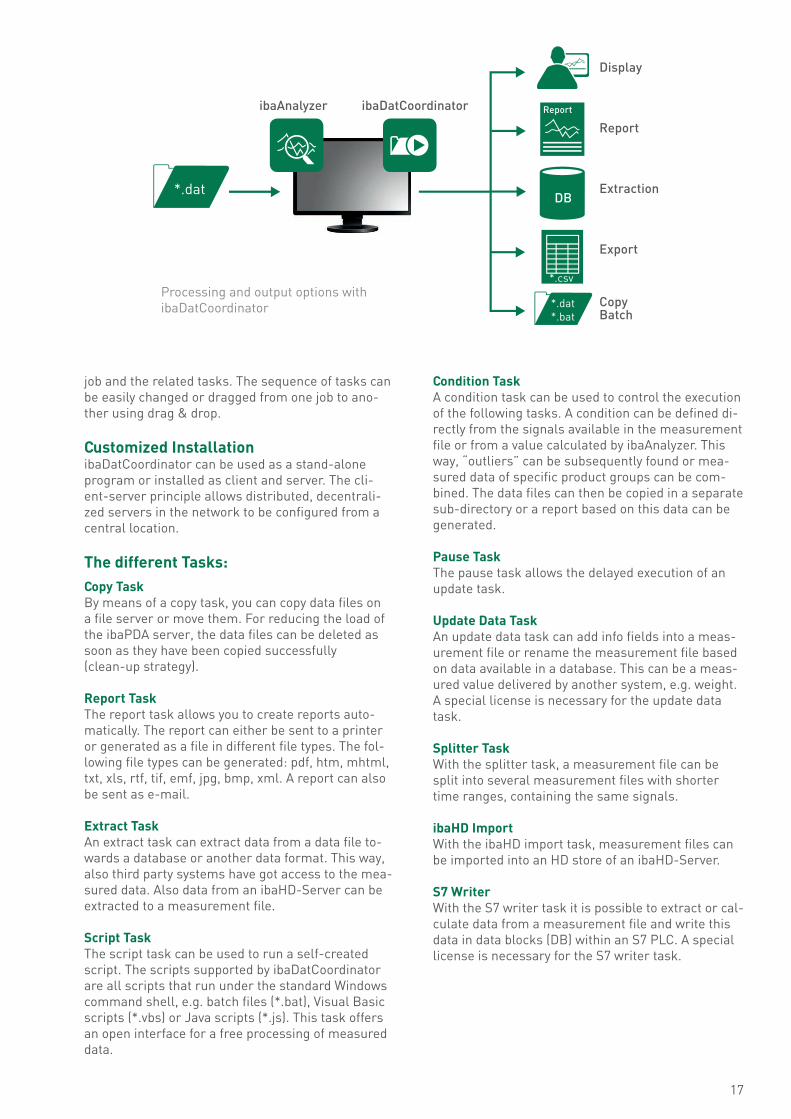
ibaDatCoordinatoribaAnalyzer
*.dat
*.dat*.bat
CopyBatch
Display
Report
Extraction
Export
*.csvProcessing and output options with ibaDatCoordinator
18
Fast access to all data in the network In large plants, often several ibaPDA systems ac-quire process and quality data at different locations across the whole production process and generate a vast number of measurement fi les on different stor-age locations. On the one hand, ibaDatManager gives the user a comprehensive overview of all measurement fi les and permits fi nding certain data by means of various search functions. On the other hand, ibaDatManager makes it easy to perform long-term analyses across measurement fi les. To retrieve fi les, the user neither needs to know the exact storage location of the requested fi le nor the access identifi cation. Finding measuring fi les by using ibaDatManager is made effi cient by selecting key information like pro-duct ID, production date or quality values, e. g. when measured values or quality parameters have excee-ded a limit value. The result of the selection are fi les
displayed at a clearly structured table. The fi les can be opened directly in ibaAnalyzer with a precon-fi gured analysis.
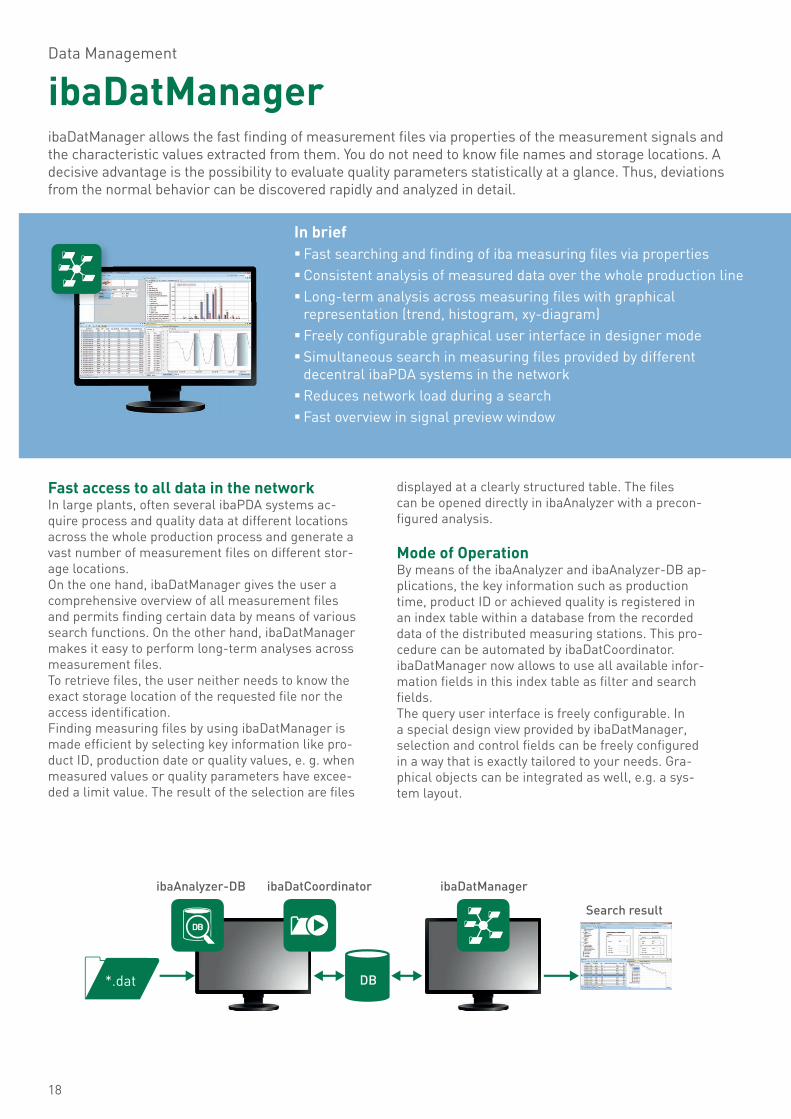
Mode of OperationBy means of the ibaAnalyzer and ibaAnalyzer-DB ap-plications, the key information such as production time, product ID or achieved quality is registered in an index table within a database from the recorded data of the distributed measuring stations. This pro-cedure can be automated by ibaDatCoordinator. ibaDatManager now allows to use all available infor-mation fi elds in this index table as fi lter and search fi elds. The query user interface is freely confi gurable. In a special design view provided by ibaDatManager, selection and control fi elds can be freely confi gured in a way that is exactly tailored to your needs. Gra-phical objects can be integrated as well, e.g. a sys-tem layout.
Data Management
ibaDatManageribaDatManager allows the fast fi nding of measurement fi les via properties of the measurement signals and the characteristic values extracted from them. You do not need to know fi le names and storage locations. A decisive advantage is the possibility to evaluate quality parameters statistically at a glance. Thus, deviations from the normal behavior can be discovered rapidly and analyzed in detail.
In brief � Fast searching and fi nding of iba measuring fi les via properties �Consistent analysis of measured data over the whole production line � Long-term analysis across measuring fi les with graphical representation (trend, histogram, xy-diagram) � Freely confi gurable graphical user interface in designer mode � Simultaneous search in measuring fi les provided by different decentral ibaPDA systems in the network �Reduces network load during a search � Fast overview in signal preview window
ibaDatCoordinatoribaAnalyzer-DB
*.dat
ibaDatManager
Search result
19
Individual LayoutIn general, ibaDatManager distinguishes clearly bet-ween administrator and user: In ibaDatManager, the administrator has access to a variety of design tools, like display and selection elements or calender fun-ctions, that can be combined freely and linked to the information fi elds in the database. The user only has to click on the desired query opti-on for immediately getting a list of iba measuring fi -les matching the search criteria. For a clear overview, multiple user profi les can be created, which allow all views or only process-spe-cifi c views, e.g. for quality, maintenance or product analysis.
A practical Example In a hot rolling mill, distributed meas uring systems acquire process data in the furnace section, at the press and the roughing mill, at the fi nishing mill and at the coiler. If you need the process data of a strip number over the whole production line, you do not need to search in each measuring system any more. With ibaDatManager, you have got a central instru-ment at your hands, that allows you to fi lter the data for strip numbers or to defi ne time periods for the search.
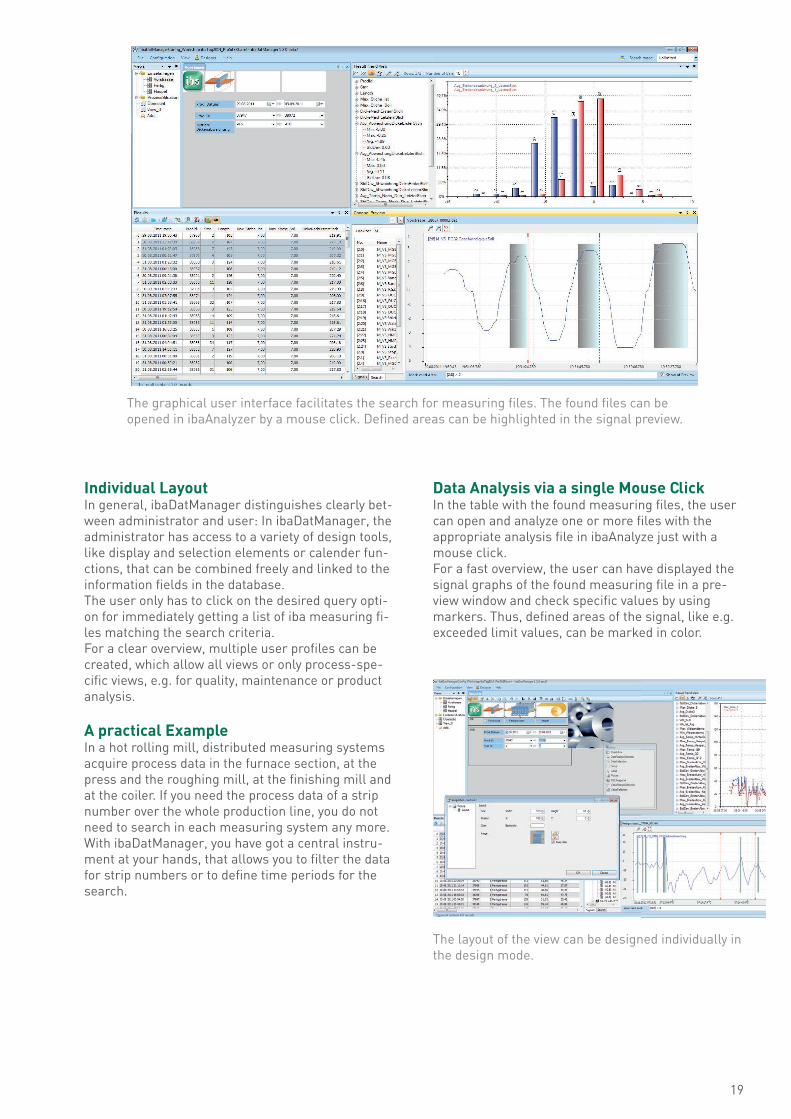
Data Analysis via a single Mouse ClickIn the table with the found measuring fi les, the user can open and analyze one or more fi les with the appropriate analysis fi le in ibaAnalyze just with a mouse click. For a fast overview, the user can have displayed the signal graphs of the found meas uring fi le in a pre-view window and check specifi c values by using markers. Thus, defi ned areas of the signal, like e.g. exceeded limit values, can be marked in color.
The layout of the view can be designed individually in the design mode.
The graphical user interface facilitates the search for measuring files. The found files can be opened in ibaAnalyzer by a mouse click. Defined areas can be highlighted in the signal preview.
20
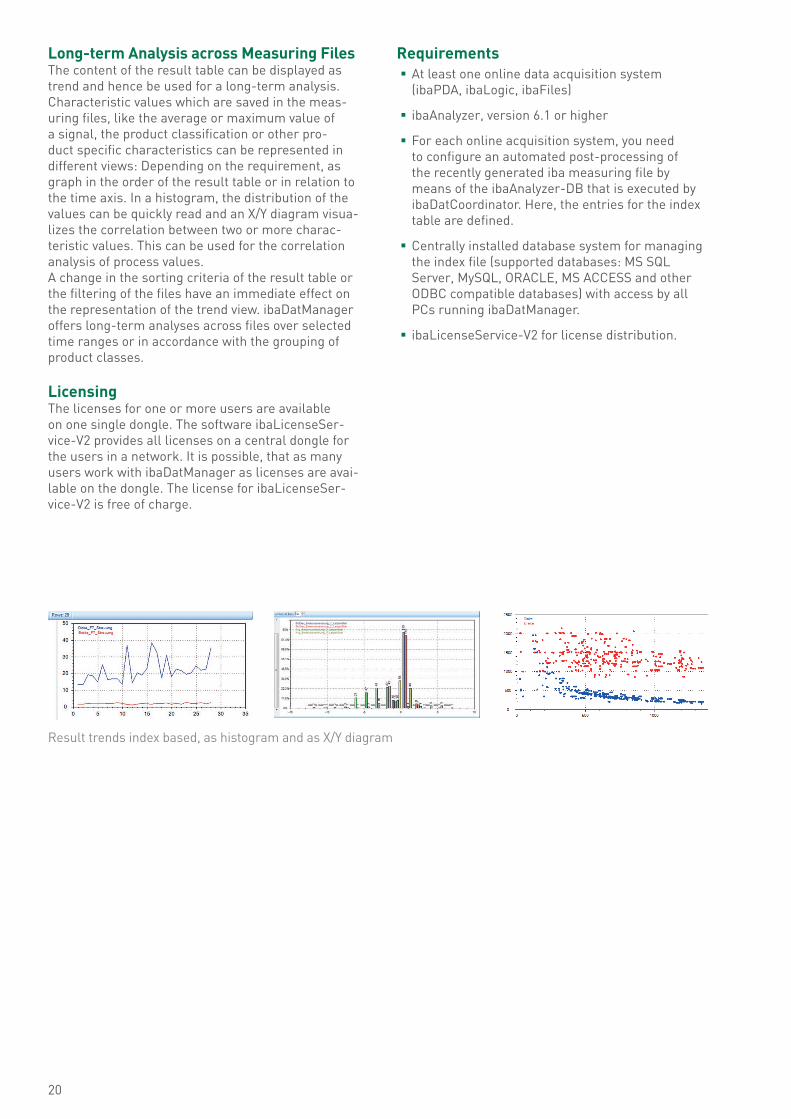
Result trends index based, as histogram and as X/Y diagram
Long-term Analysis across Measuring FilesThe content of the result table can be displayed as trend and hence be used for a long-term analysis. Characteristic values which are saved in the meas-uring fi les, like the average or maximum value of a signal, the product classifi cation or other pro-duct specifi c characteristics can be represented in different views: Depending on the requirement, as graph in the order of the result table or in relation to the time axis. In a histogram, the distribution of the values can be quickly read and an X/Y diagram visua-lizes the correlation between two or more charac-teristic values. This can be used for the correlation analysis of process val ues. A change in the sorting criteria of the result table or the fi ltering of the fi les have an immediate effect on the representation of the trend view. ibaDatManager offers long-term analyses across fi les over select ed time ranges or in accordance with the grouping of product classes.
LicensingThe licenses for one or more users are available on one single dongle. The software ibaLicenseSer-vice-V2 provides all licenses on a central dongle for the users in a network. It is possible, that as many users work with ibaDatManager as licenses are avai-lable on the dongle. The license for ibaLicenseSer-vice-V2 is free of charge.
Requirements � At least one online data acquisition system (ibaPDA, ibaLogic, ibaFiles)
� ibaAnalyzer, version 6.1 or higher
� For each online acquisition system, you need to confi gure an automated post-processing of the recently generated iba measuring fi le by means of the ibaAnalyzer-DB that is exe cuted by ibaDatCoordinator. Here, the entries for the index table are defi ned.
� Centrally installed database system for managing the index fi le (supported databases: MS SQL Server, MySQL, ORACLE, MS ACCESS and other ODBC compatible databases) with access by all PCs running ibaDatManager.
� ibaLicenseService-V2 for license distribution.
21
In some cases, the deviations in the production pro-cess or in the process behavior cannot be descri-bed only by numerical values, like e.g. exceeded li-mits or deviations from measurable quality parame-ters. Some malfunctions or errors rather appear in a characteristic curve shape in one or more signals that deviates from the normal behavior. For analy-zing such disturbances, the user does not only need to know if these disturbances have appeared before, but also when exactly and how frequently. ibaDatManager Situation Detection searches sig-nals for defi ned patterns and displays „similar situa-tions“. The search can be done across data fi les or in several signals in parallel.
Procedure Initially, the deviating signal range is defi ned as search pattern - either simply by two markers in the signal preview or by tracing the curve with points. Search patterns can be stored in a library and then be used anytime. Moreover, several signal patterns can be combined in various signals. If the user does not want to search all data fi les, he can pre-select fi les with ibaDatManager, e.g. by li-miting the time range or depending on technological criteria like batch number or set-point values, etc.
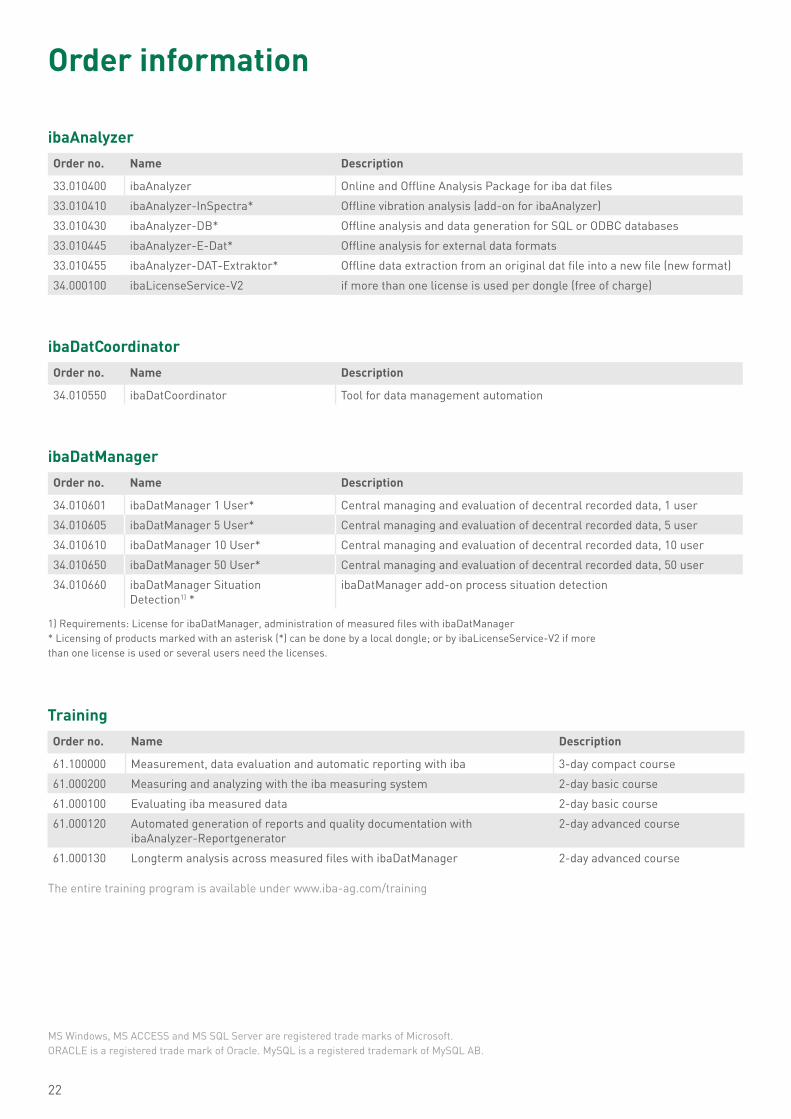
Displaying the matches The found situations are displayed in a table as a list of matches including the time stamp and the reached level of similarity. In the signal preview, si-milar situations are marked with colors in the signal trend. As the search pattern is displayed above the found similar situations, the user can see immedia-tely how substantially the matches deviate from the search pattern. The level of the allowed similarity can be changed using the slider. This way, the found situations can be limited to the essential ones.
Detecting correlations The frequency of the found similar situations, their interval, the occurence of certain events during the same period of time - all this delivers valuable infor-mation for a better understanding of processes and hence for improving them.
Process Situation Detection
ibaDatManager Situation DetectionWith ibaDatManager Situation Detection, similar process situations can be found rapidly by means of characteristic signal trends. Thus, recurring deviations in the process can be analyzed in detail.
In brief � Searching similar process situations in any signal in one or more data fi les � Simple defi ntion of search patterns �Creating a library for search patterns � Searching simultaneously for similar patterns in one or more signals �Comprehensive overwiew of the found similar situations in a table and signal preview with colored markings � Interactive limitation of similar situations by means of search and similarity parameters
Displaying the matches in a table and signal preview
22
ibaAnalyzer
Order no. Name Description
33.010400 ibaAnalyzer Online and Offine Analysis Package for iba dat files
33.010410 ibaAnalyzer-InSpectra* Offine vibration analysis (add-on for ibaAnalyzer)
33.010430 ibaAnalyzer-DB* Offine analysis and data generation for SQL or ODBC databases
33.010445 ibaAnalyzer-E-Dat* Offine analysis for external data formats
33.010455 ibaAnalyzer-DAT-Extraktor* Offine data extraction from an original dat file into a new file (new format)
34.000100 ibaLicenseService-V2 if more than one license is used per dongle (free of charge)
Order information
ibaDatCoordinator
Order no. Name Description
34.010550 ibaDatCoordinator Tool for data management automation
Order no. Name Description
34.010601 ibaDatManager 1 User* Central managing and evaluation of decentral recorded data, 1 user
34.010605 ibaDatManager 5 User* Central managing and evaluation of decentral recorded data, 5 user
34.010610 ibaDatManager 10 User* Central managing and evaluation of decentral recorded data, 10 user
34.010650 ibaDatManager 50 User* Central managing and evaluation of decentral recorded data, 50 user
34.010660 ibaDatManager SituationDetection1) *
ibaDatManager add-on process situation detection
ibaDatManager
Order no. Name Description
61.100000 Measurement, data evaluation and automatic reporting with iba 3-day compact course
61.000200 Measuring and analyzing with the iba measuring system 2-day basic course
61.000100 Evaluating iba measured data 2-day basic course
61.000120 Automated generation of reports and quality documentation with ibaAnalyzer-Reportgenerator
2-day advanced course
61.000130 Longterm analysis across measured files with ibaDatManager 2-day advanced course
Training
MS Windows, MS ACCESS and MS SQL Server are registered trade marks of Microsoft. ORACLE is a registered trade mark of Oracle. MySQL is a registered trademark of MySQL AB.
The entire training program is available under www.iba-ag.com/training
1) Requirements: License for ibaDatManager, administration of measured files with ibaDatManager* Licensing of products marked with an asterisk (*) can be done by a local dongle; or by ibaLicenseService-V2 if more than one license is used or several users need the licenses.

23
Brochure_ibaAnalyzePostprocess_v1.2_en 04/2018 Technical changes reserved
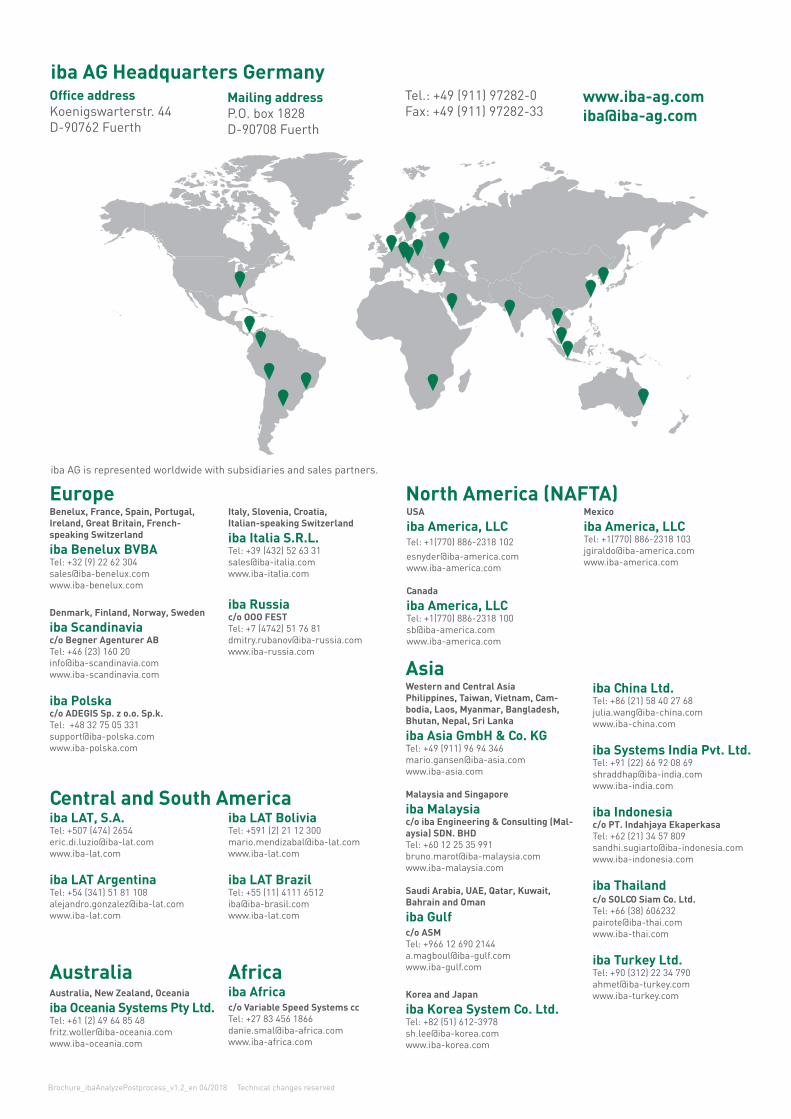
iba AG Headquarters Germany
Europe
Asia
Central and South America
Australia Africa
North America (NAFTA)
Office addressKoenigswarterstr. 44D-90762 Fuerth
Mailing addressP.O. box 1828D-90708 Fuerth
Tel.: +49 (911) 97282-0Fax: +49 (911) 97282-33
Benelux, France, Spain, Portugal, Ireland, Great Britain, French-speaking Switzerland
iba Benelux BVBATel: +32 (9) 22 62 [email protected]
Denmark, Finland, Norway, Sweden
iba Scandinaviac/o Begner Agenturer ABTel: +46 (23) 160 [email protected]
iba Polskac/o ADEGIS Sp. z o.o. Sp.k.Tel: +48 32 75 05 [email protected]
Italy, Slovenia, Croatia, Italian-speaking Switzerland
iba Italia S.R.L.Tel: +39 (432) 52 63 [email protected]
iba Russiac/o OOO FESTTel: +7 (4742) 51 76 [email protected]
Western and Central AsiaPhilippines, Taiwan, Vietnam, Cam-bodia, Laos, Myanmar, Bangladesh, Bhutan, Nepal, Sri Lanka
iba Asia GmbH & Co. KGTel: +49 (911) 96 94 [email protected]
Malaysia and Singapore
iba Malaysiac/o iba Engineering & Consulting (Mal-aysia) SDN. BHDTel: +60 12 25 35 [email protected]
Saudi Arabia, UAE, Qatar, Kuwait, Bahrain and Oman
iba Gulf c/o ASMTel: +966 12 690 [email protected]
Korea and Japan
iba Korea System Co. Ltd.Tel: +82 (51) [email protected]
iba China Ltd.Tel: +86 (21) 58 40 27 [email protected]
iba Systems India Pvt. Ltd.Tel: +91 (22) 66 92 08 [email protected] www.iba-india.com
iba Indonesiac/o PT. Indahjaya EkaperkasaTel: +62 (21) 34 57 [email protected]
iba Thailandc/o SOLCO Siam Co. Ltd.Tel: +66 (38) [email protected]
iba Turkey Ltd.Tel: +90 (312) 22 34 [email protected]
iba LAT, S.A.Tel: +507 (474) [email protected]
iba LAT ArgentinaTel: +54 (341) 51 81 [email protected]
iba LAT BoliviaTel: +591 (2) 21 12 [email protected]
iba LAT BrazilTel: +55 (11) 4111 [email protected]
Australia, New Zealand, Oceania
iba Oceania Systems Pty Ltd.Tel: +61 (2) 49 64 85 [email protected]
iba Africac/o Variable Speed Systems ccTel: +27 83 456 [email protected]
USA
iba America, LLC Tel: +1(770) 886-2318 102 [email protected] www.iba-america.com
Canada
iba America, LLCTel: +1(770) 886-2318 [email protected]
Mexico
iba America, LLCTel: +1(770) 886-2318 [email protected]
iba AG is represented worldwide with subsidiaries and sales partners.