power quality fundamentals: the electric environment mark
TRANSCRIPT
Power Quality Fundamentals: The Electric Environment
Mark Stephens, PEManagerIndustrial Studies Electric Power Research Institute 942 Corridor Park Blvd Knoxville, Tennessee 37932 Phone 865.218.8022 [email protected]

Defining Power Quality
3© 2009 Electric Power Research Institute, Inc. All rights reserved.
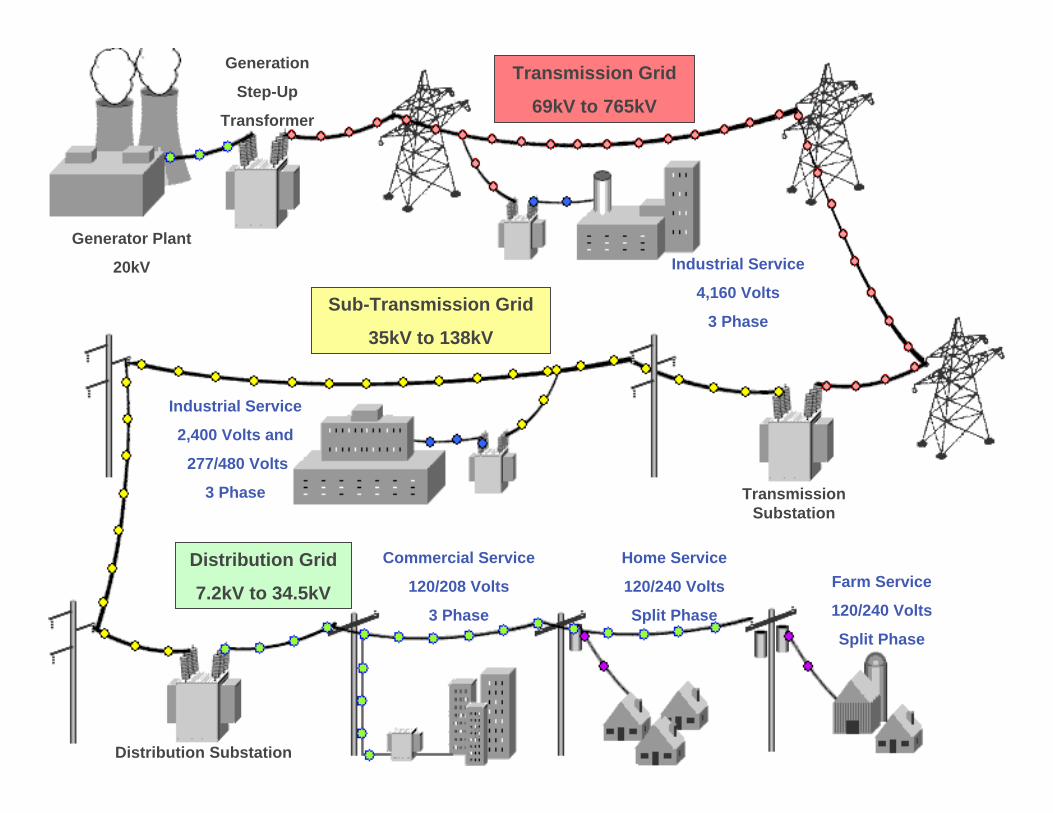
Transmission Substation
Farm Service
120/240 Volts
Split Phase
Home Service
120/240 Volts
Split Phase
Commercial Service
120/208 Volts
3 Phase
Distribution Substation
Distribution Grid
7.2kV to 34.5kV
Industrial Service
2,400 Volts and
277/480 Volts
3 Phase
Sub-Transmission Grid
35kV to 138kV
Industrial Service
4,160 Volts
3 Phase
Transmission Grid
69kV to 765kV
Generation
Step-Up
Transformer
Generator Plant
20kV

4© 2009 Electric Power Research Institute, Inc. All rights reserved.
IEEE-1159
5© 2009 Electric Power Research Institute, Inc. All rights reserved.
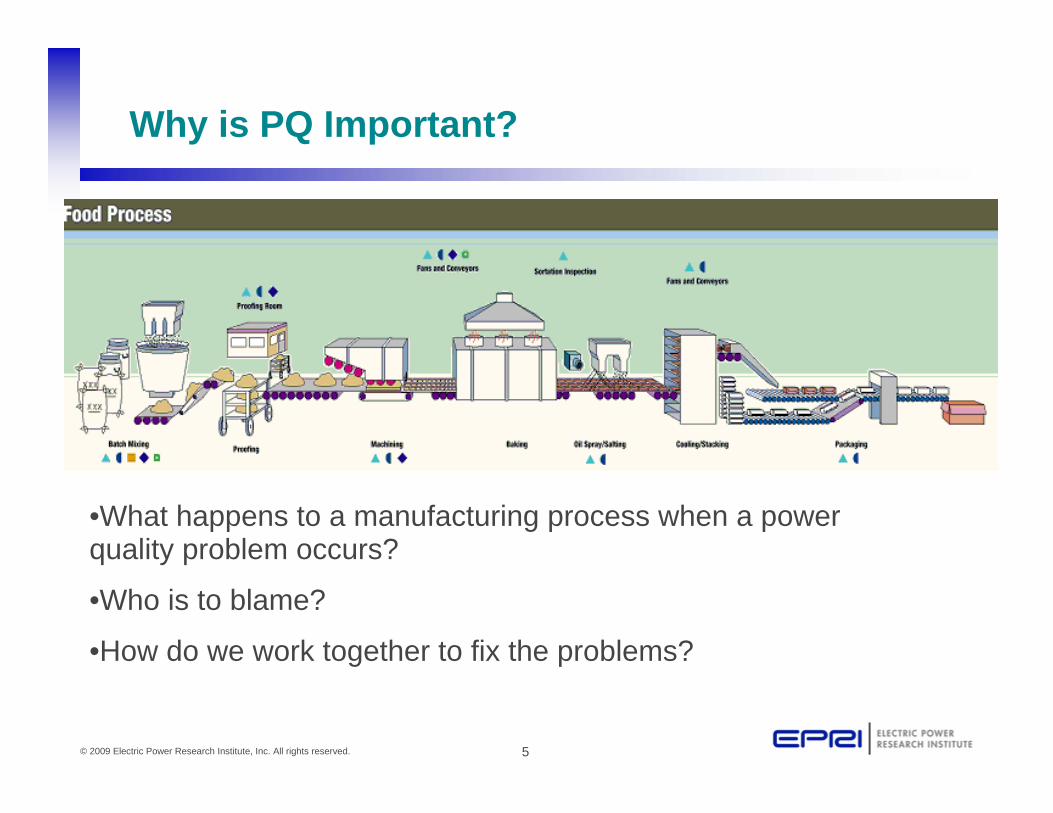
Why is PQ Important?
•What happens to a manufacturing process when a power quality problem occurs?
•Who is to blame?
•How do we work together to fix the problems?
6© 2009 Electric Power Research Institute, Inc. All rights reserved.
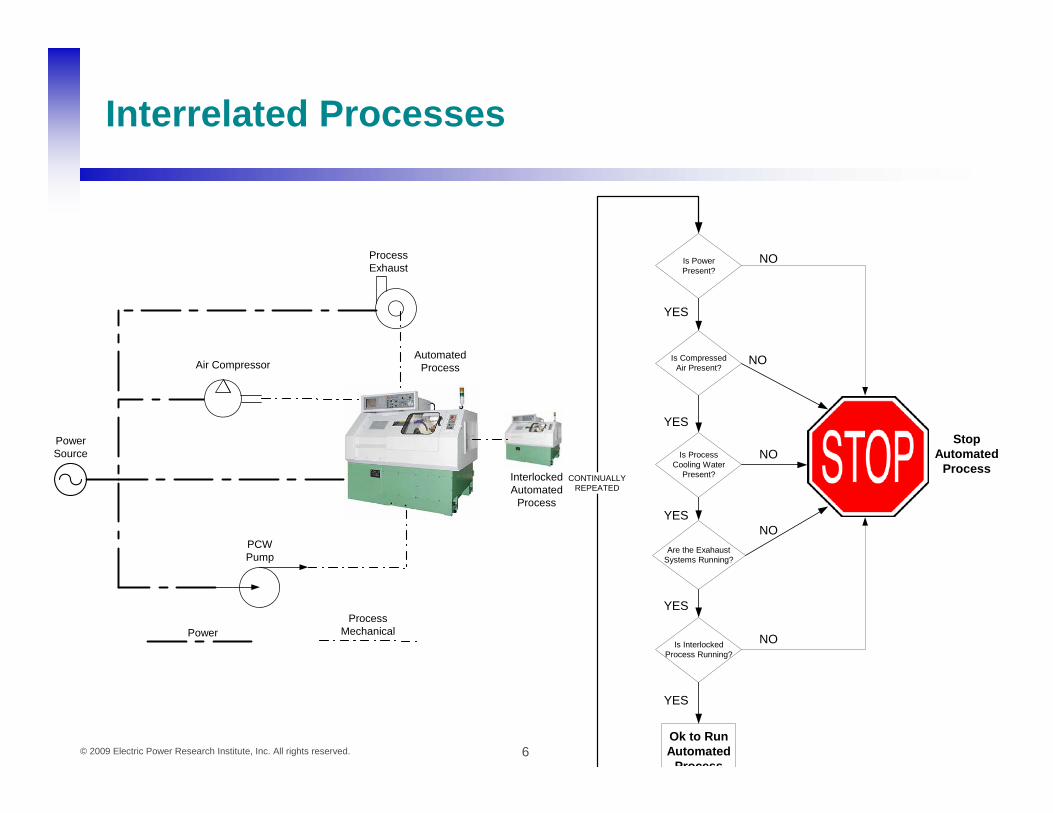
Interrelated Processes
Air Compressor
PowerSource
ProcessExhaust
PCWPump
PowerProcess
Mechanical
AutomatedProcess
InterlockedAutomated
Process
Is CompressedAir Present?
Is ProcessCooling Water
Present?
Are the ExahaustSystems Running?
Is PowerPresent?
Is InterlockedProcess Running?
Ok to RunAutomated
Process
CONTINUALLYREPEATED
StopAutomated
Process
NO
YES
NO
NO
NO
NO
YES
YES
YES
YES

7© 2009 Electric Power Research Institute, Inc. All rights reserved.
What’ the Cost of Power Quality Problems?
Lets Take a Guess!Rank these from most expensive per event to
least….
• Paper• Food and Beverage• Automotive• Plastics• Semiconductor
8© 2009 Electric Power Research Institute, Inc. All rights reserved.
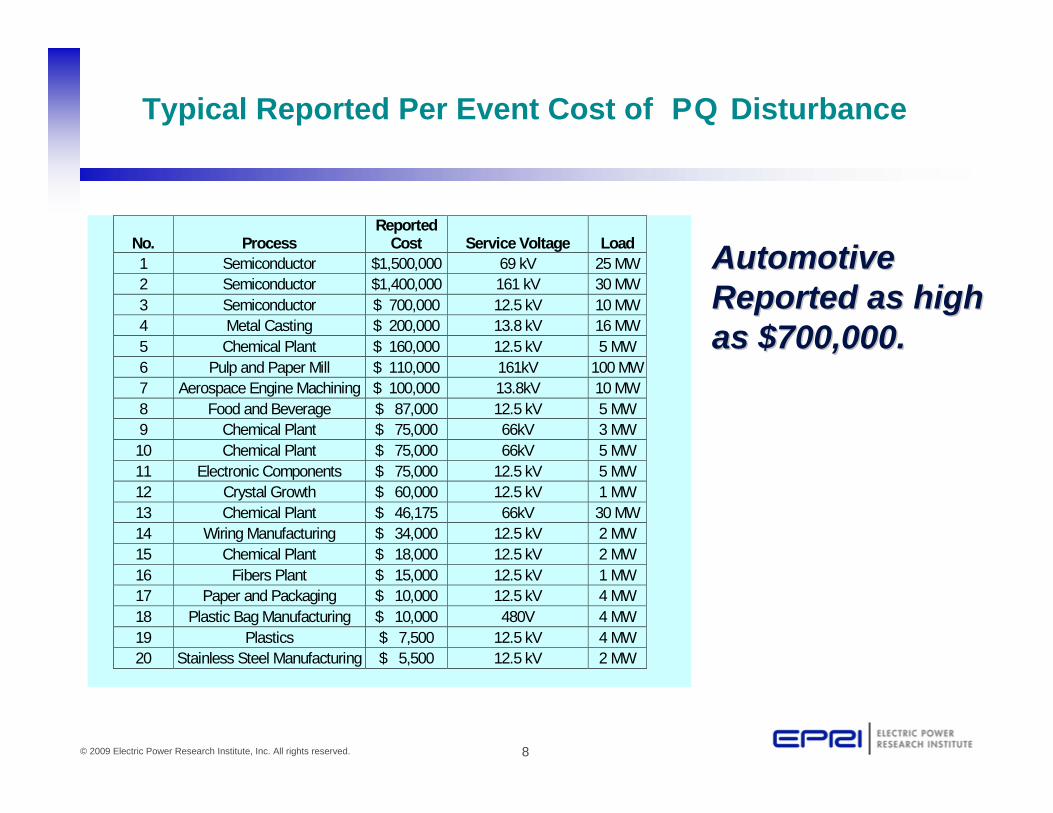
Typical Reported Per Event Cost of PQ Disturbance
No. Process Reported
Cost Service Voltage Load 1 Semiconductor $1,500,000 69 kV 25 MW 2 Semiconductor $1,400,000 161 kV 30 MW 3 Semiconductor $ 700,000 12.5 kV 10 MW 4 Metal Casting $ 200,000 13.8 kV 16 MW 5 Chemical Plant $ 160,000 12.5 kV 5 MW 6 Pulp and Paper Mill $ 110,000 161kV 100 MW 7 Aerospace Engine Machining $ 100,000 13.8kV 10 MW 8 Food and Beverage $ 87,000 12.5 kV 5 MW 9 Chemical Plant $ 75,000 66kV 3 MW 10 Chemical Plant $ 75,000 66kV 5 MW 11 Electronic Components $ 75,000 12.5 kV 5 MW 12 Crystal Growth $ 60,000 12.5 kV 1 MW 13 Chemical Plant $ 46,175 66kV 30 MW 14 Wiring Manufacturing $ 34,000 12.5 kV 2 MW 15 Chemical Plant $ 18,000 12.5 kV 2 MW 16 Fibers Plant $ 15,000 12.5 kV 1 MW 17 Paper and Packaging $ 10,000 12.5 kV 4 MW 18 Plastic Bag Manufacturing $ 10,000 480V 4 MW 19 Plastics $ 7,500 12.5 kV 4 MW 20 Stainless Steel Manufacturing $ 5,500 12.5 kV 2 MW
Automotive Automotive Reported as high Reported as high as $700,000.as $700,000.

9© 2009 Electric Power Research Institute, Inc. All rights reserved.
Power Quality Terms
• Outage (Interruption)• Momentary Interruption• Voltage Sag• Voltage Swell• Impulsive Transient• Oscillatory Transient• Steady State Voltage Variation
(over/under)• Single-Phasing• Voltage Imbalance• Voltage Harmonics
• Terms to Avoid• Blinks• Blips• Brownout• Blackout• Dips• Spikes• Dirty Power• Glitches
10© 2009 Electric Power Research Institute, Inc. All rights reserved.
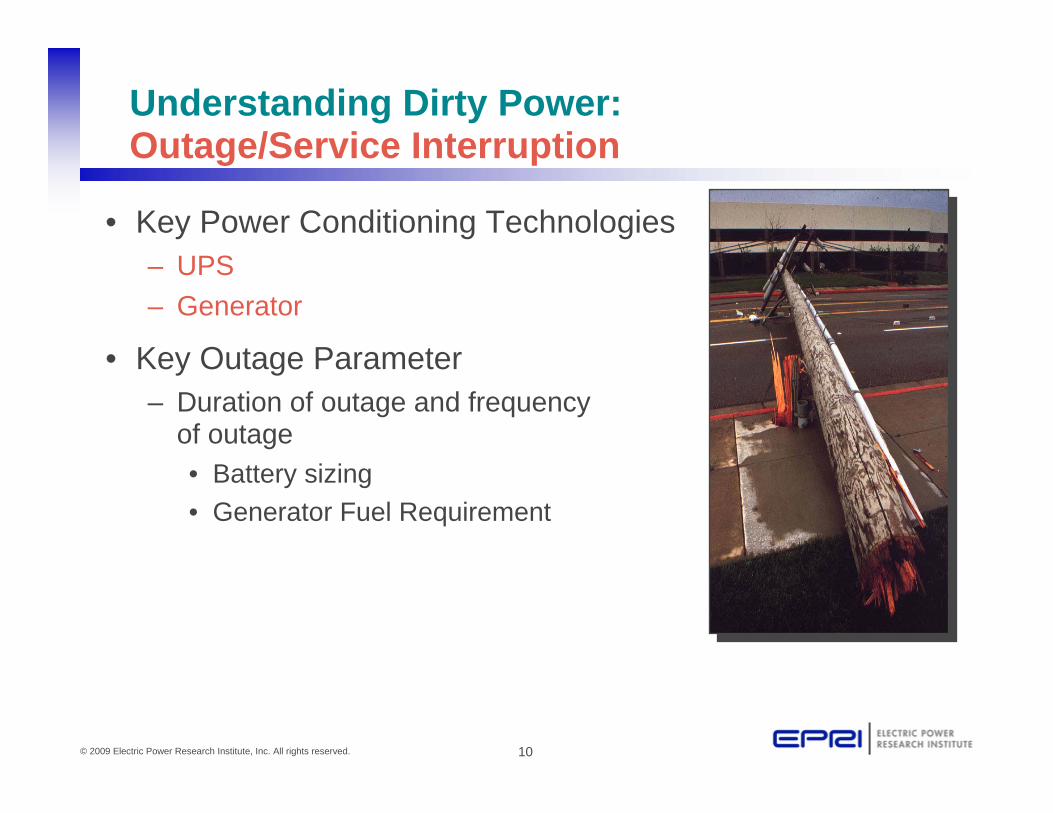
Understanding Dirty Power: Outage/Service Interruption
• Key Power Conditioning Technologies– UPS – Generator
• Key Outage Parameter– Duration of outage and frequency
of outage• Battery sizing• Generator Fuel Requirement

11© 2009 Electric Power Research Institute, Inc. All rights reserved.
Understanding Dirty Power: Voltage Sag/Swell
• Key Power Conditioning Technologies– UPS – Capacitor Based UPS
– Dip Proofing Inverter
– Constant Voltage Transformer (CVT)– Dynamic Sag Corrector
• Key Parameter– Duration milliseconds to seconds– Voltage 10%-90% of nominal (Sag)– Voltage 110%-170% of nominal (Swell)
• Most voltage swells are 120-130% of nominal
Voltage swell Voltage sag

12© 2009 Electric Power Research Institute, Inc. All rights reserved.
Voltage (%)
Yearly Sag and
Interruption Rate
FrequencyCumulativeFrequency
0 to 10 4.56 9.19% 9.19%10 to 20 0.48 1.08% 10.27%30 to 30 0.72 1.53% 11.80%30 to 40 1.56 3.08% 14.88%40 to 50 2.04 4.11% 18.99%50 to 60 3.12 6.23% 25.22%60 to 70 5.16 10.42% 35.64%70 to 80 9.6 19.39% 55.03%80 to 90 22.08 44.98% 100.00%
How Common are Sags and Interruptions?
Results of Three years Power Quality Monitoring at 277Power Distribution Sites in U.S. (EPRI DPQ Study)
Key result: For every 1 momentary interruption a customer will see 8 voltage sags
13© 2009 Electric Power Research Institute, Inc. All rights reserved.
Reliability/Power Quality Myth 1
• Those annoying Sags, “brown-outs” and interruptions are due to insufficient utility capacity– especially when it occurs during peak summer
periods– perception strong in mature or rapidly developing
service areas– miss-information can add confusion
14© 2009 Electric Power Research Institute, Inc. All rights reserved.
Reliability/Power Quality Reality 1
• Those annoying Sags and interruptions are most likely due to distribution faults and short circuits– interruptions (0 to 10% of nominal volts)
• momentary in duration (up to 5 minutes duration)• sustained or extended duration (> than 5 min.)
– voltage sags (10-90% of nominal volts)• resulting from fault clearing on parallel or “sister”
circuits
15© 2009 Electric Power Research Institute, Inc. All rights reserved.
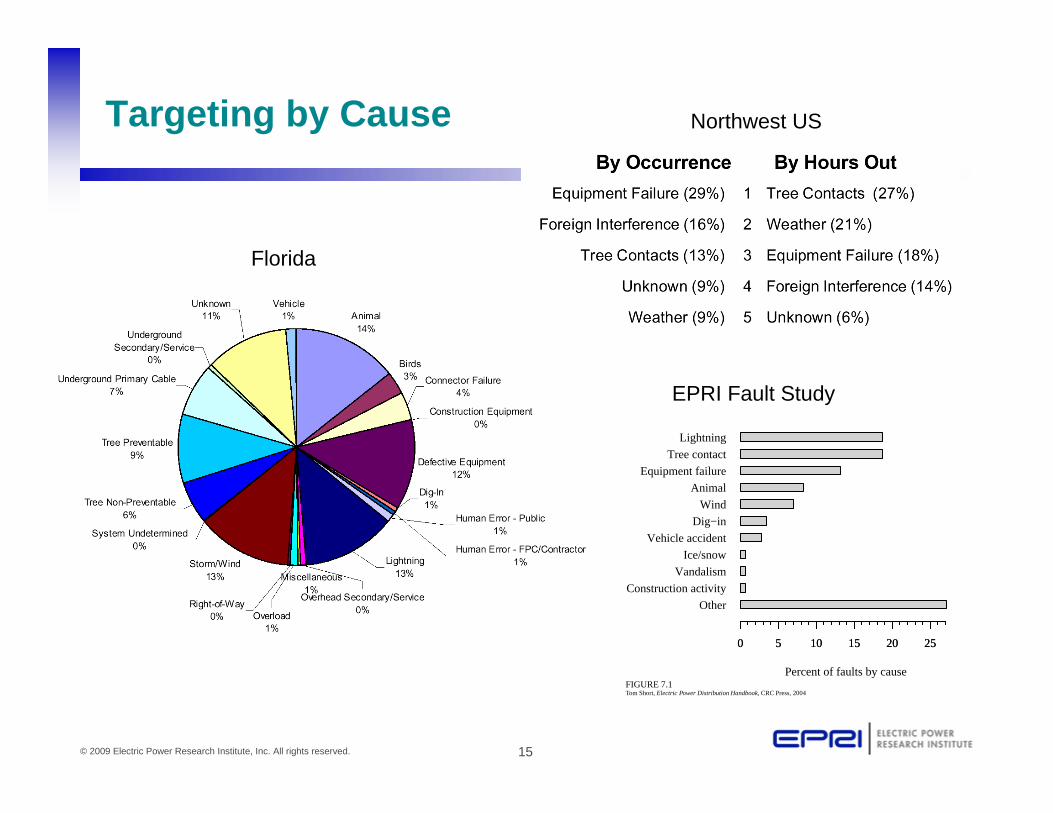
Targeting by Cause
Florida
Northwest US
EPRI Fault Study
Other
Construction activity
Vandalism
Ice/snow
Vehicle accident
Dig−in
Wind
Animal
Equipment failure
Tree contact
Lightning
0 5 10 15 20 25
Percent of faults by cause
0 5 10 15 20 25
FIGURE 7.1Tom Short, Electric Power Distribution Handbook, CRC Press, 2004

16© 2009 Electric Power Research Institute, Inc. All rights reserved.
Effects of Voltage Sags
• Lights may or may not flicker
• Equipment shutdown or malfunction
• Can result in production downtime an/or product loss
-1
-0.5
0
0.5
1
0 1 2 3 4 5 6 7 8
Duration (4 Cycle)
Magnitude (50% of nominal)
(MagDur)

17© 2009 Electric Power Research Institute, Inc. All rights reserved.
Outage or Sag ?
SagSag
OutageFault
Utility Substation
Customer ACustomer ACustomer BCustomer B
Customer CCustomer C

18© 2009 Electric Power Research Institute, Inc. All rights reserved.
Voltage Sags - How Many Phases “sag”?
One Phase68%
Two Phases19%
Three Phases
13%
Source: EPRI Distribution Power Quality Study
19© 2009 Electric Power Research Institute, Inc. All rights reserved.
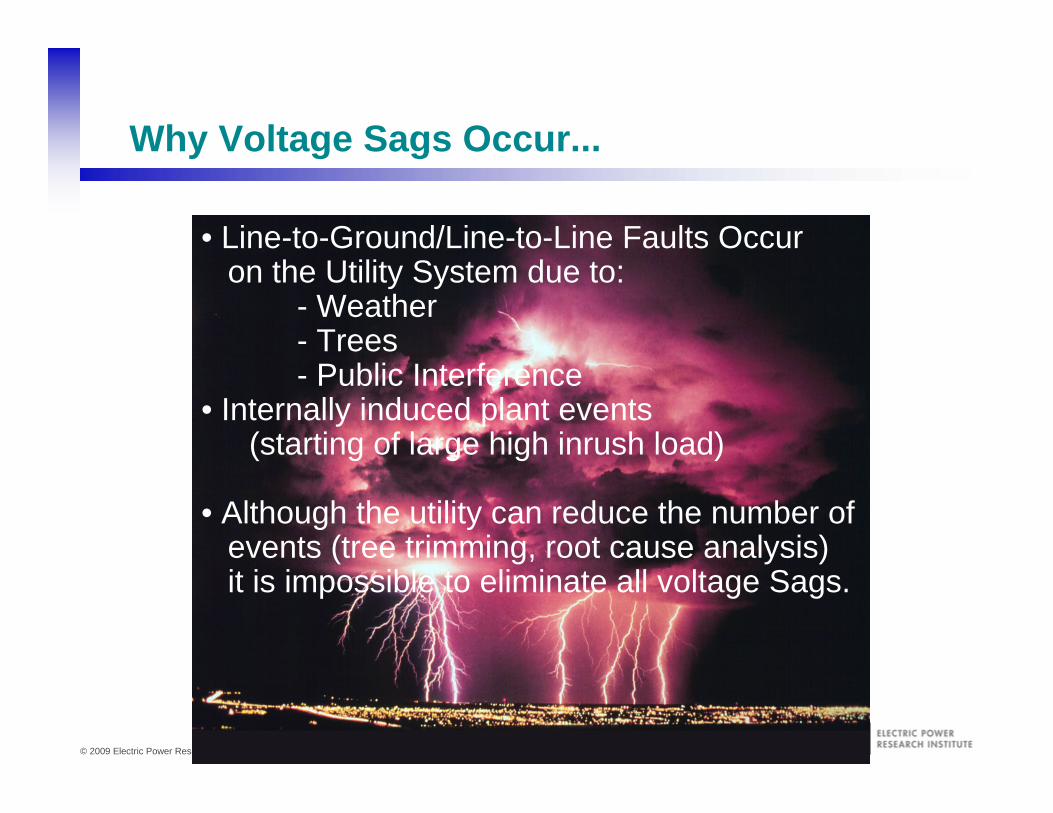
Why Voltage Sags Occur...
• Line-to-Ground/Line-to-Line Faults Occuron the Utility System due to:
- Weather- Trees- Public Interference
• Internally induced plant events (starting of large high inrush load)
• Although the utility can reduce the number ofevents (tree trimming, root cause analysis)it is impossible to eliminate all voltage Sags.

20© 2009 Electric Power Research Institute, Inc. All rights reserved.
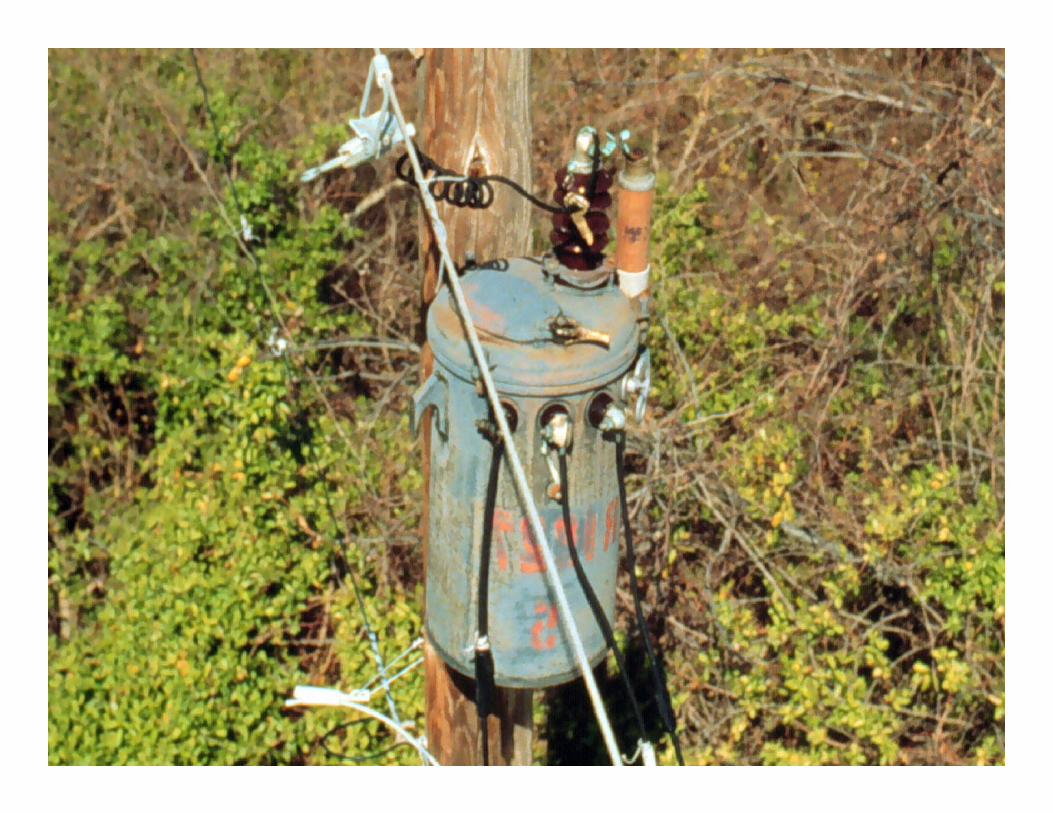
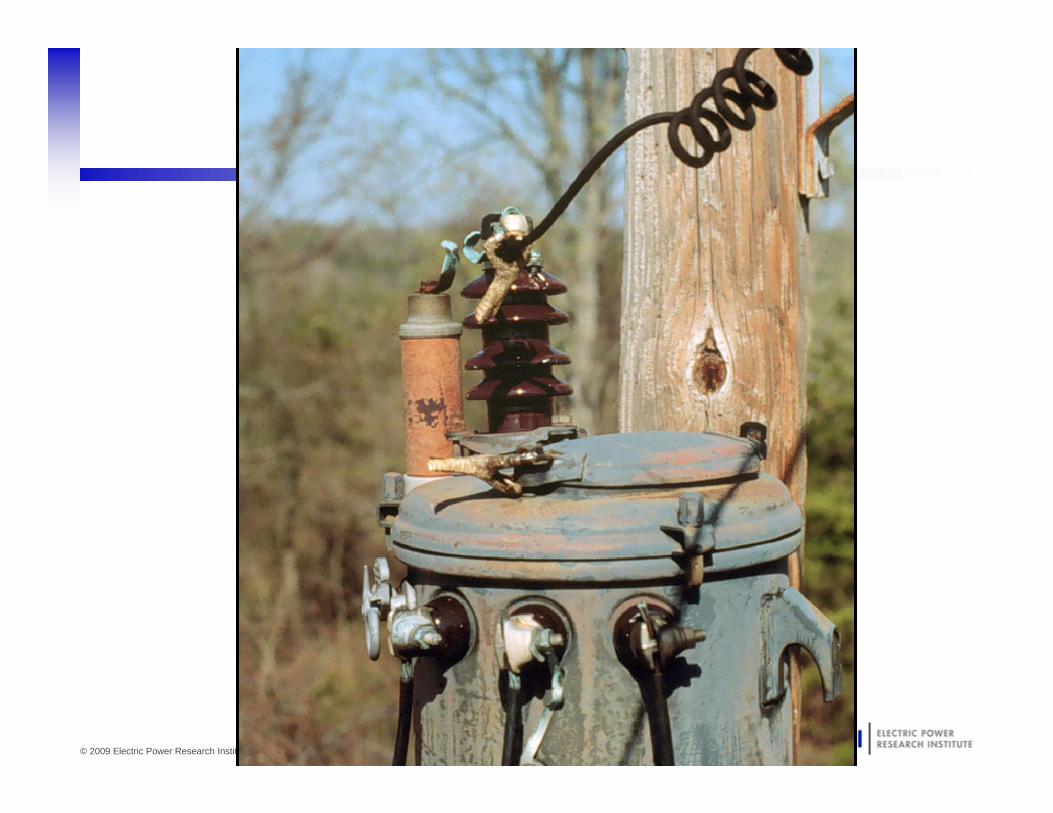
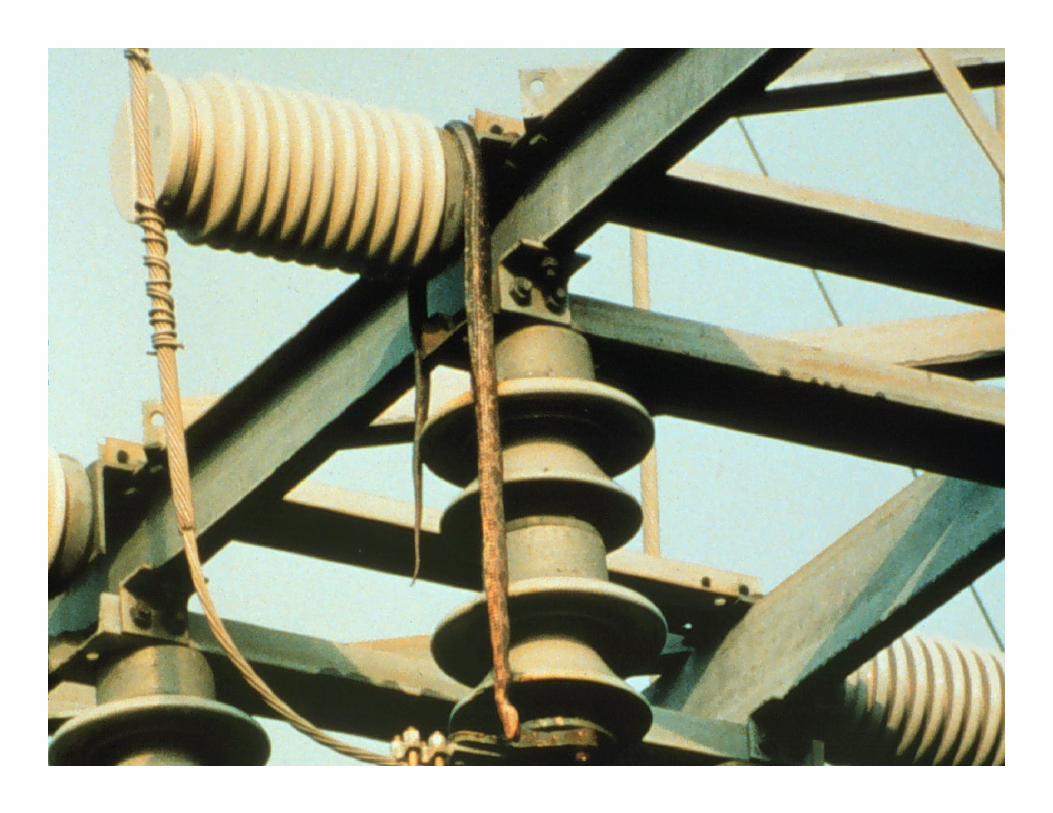
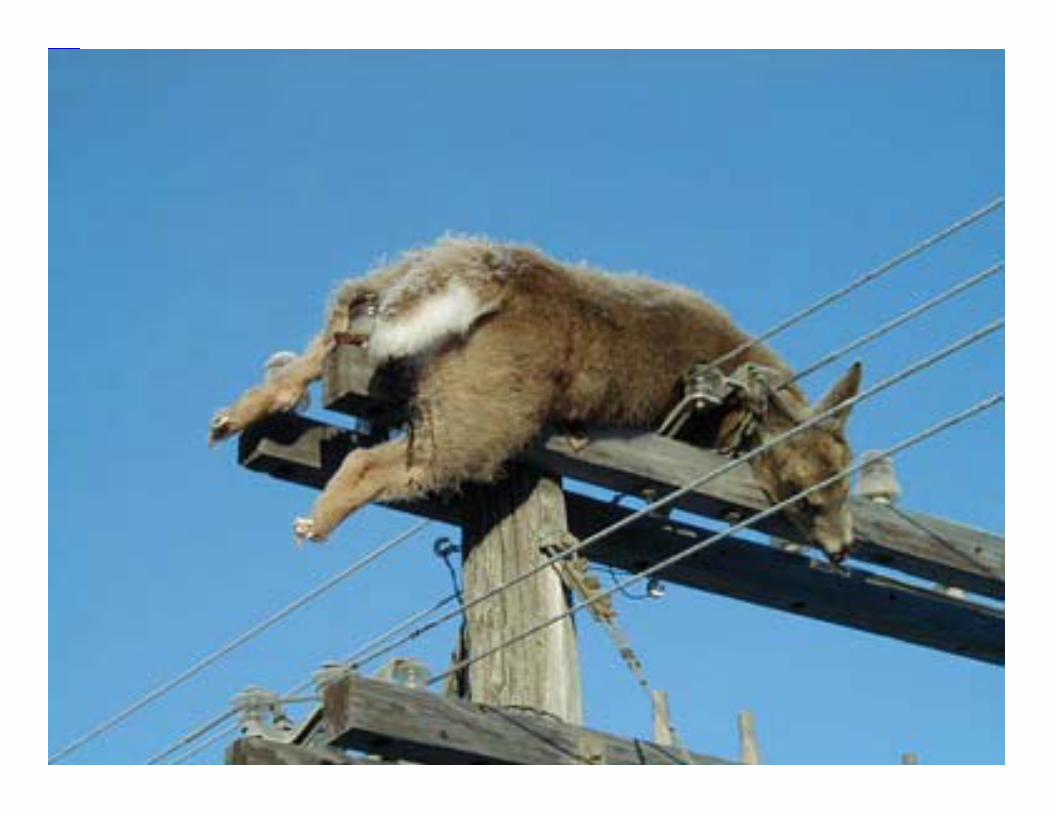
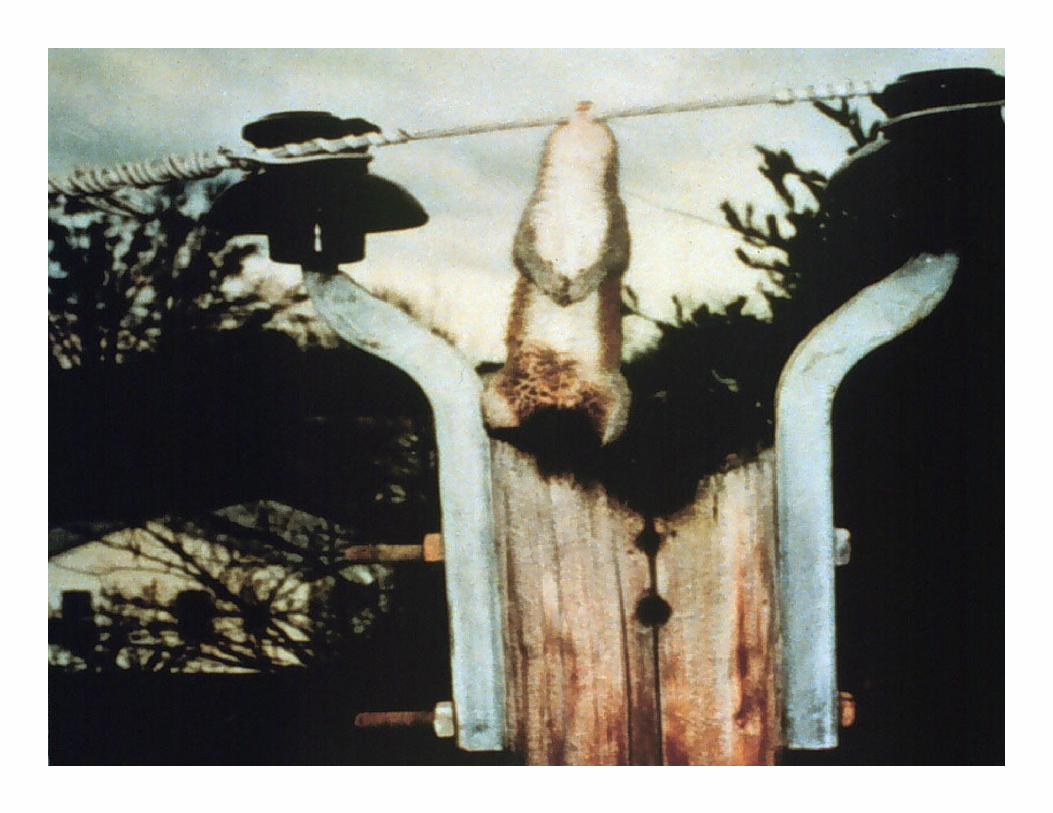
Cause of Voltage Sags
Faults
21© 2009 Electric Power Research Institute, Inc. All rights reserved.

22© 2009 Electric Power Research Institute, Inc. All rights reserved.
23© 2009 Electric Power Research Institute, Inc. All rights reserved.
24© 2009 Electric Power Research Institute, Inc. All rights reserved.
25© 2009 Electric Power Research Institute, Inc. All rights reserved.
26© 2009 Electric Power Research Institute, Inc. All rights reserved.
27© 2009 Electric Power Research Institute, Inc. All rights reserved.
28© 2009 Electric Power Research Institute, Inc. All rights reserved.
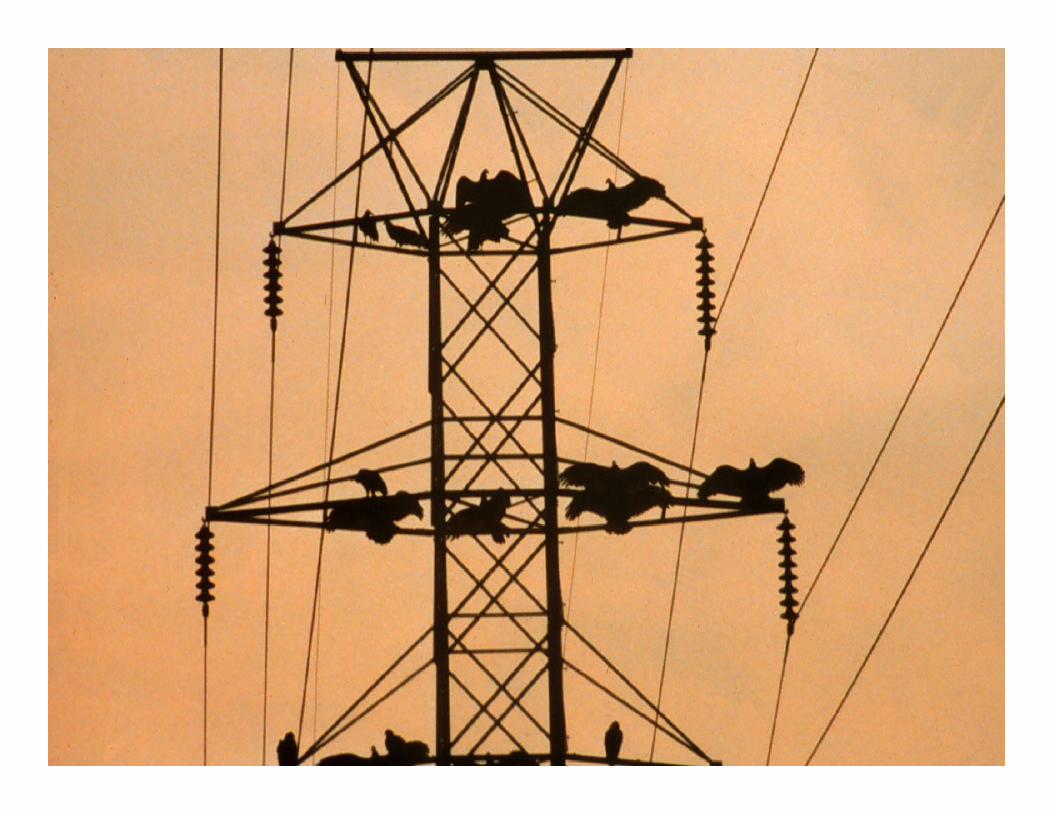
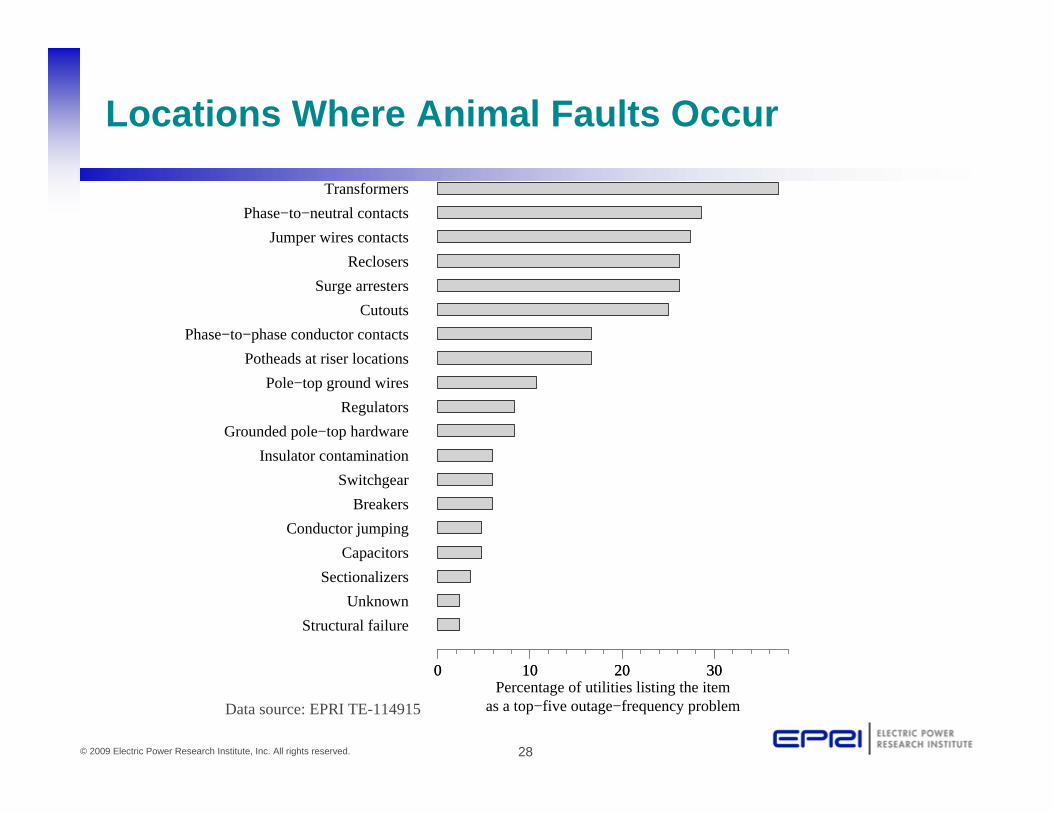
Locations Where Animal Faults Occur
Structural failure
Unknown
Sectionalizers
Capacitors
Conductor jumping
Breakers
Switchgear
Insulator contamination
Grounded pole−top hardware
Regulators
Pole−top ground wires
Potheads at riser locations
Phase−to−phase conductor contacts
Cutouts
Surge arresters
Reclosers
Jumper wires contacts
Phase−to−neutral contacts
Transformers
0 10 20 30Percentage of utilities listing the item
as a top−five outage−frequency problem
0 10 20 30
Data source: EPRI TE-114915

29© 2009 Electric Power Research Institute, Inc. All rights reserved.
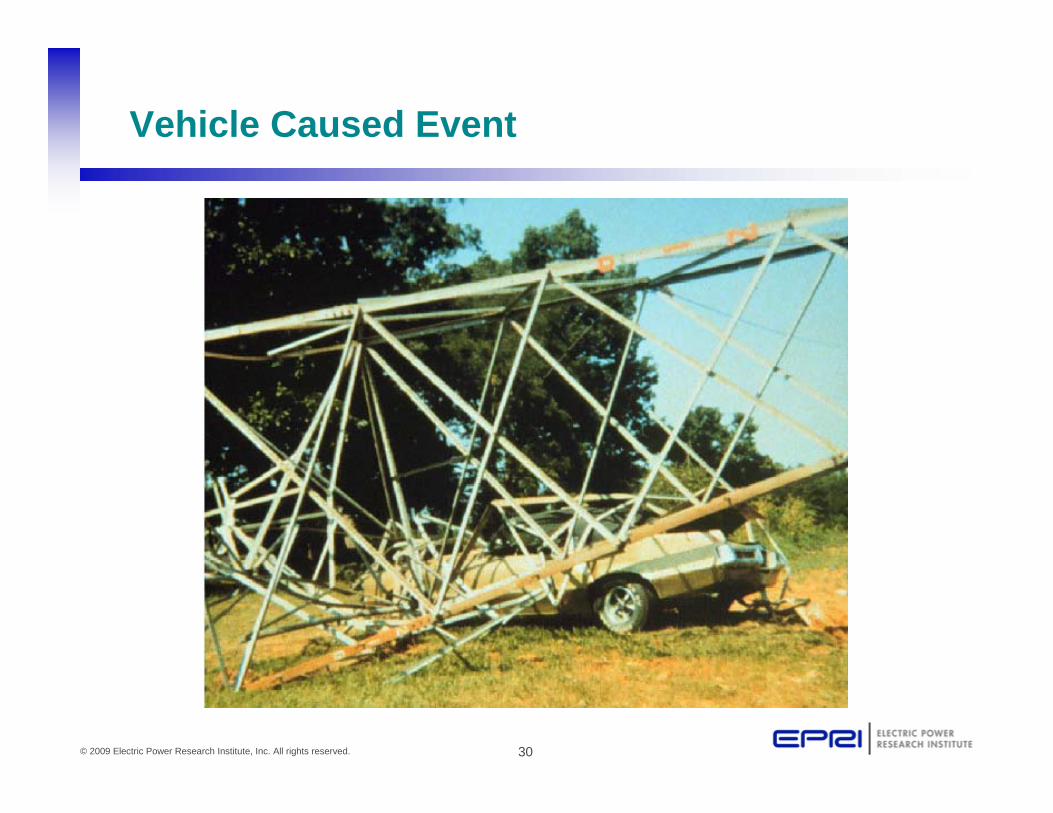
Vehicle Caused Event
30© 2009 Electric Power Research Institute, Inc. All rights reserved.
Vehicle Caused Event

31© 2009 Electric Power Research Institute, Inc. All rights reserved.
Storm, Lightning and Wind Caused Outages
32© 2009 Electric Power Research Institute, Inc. All rights reserved.
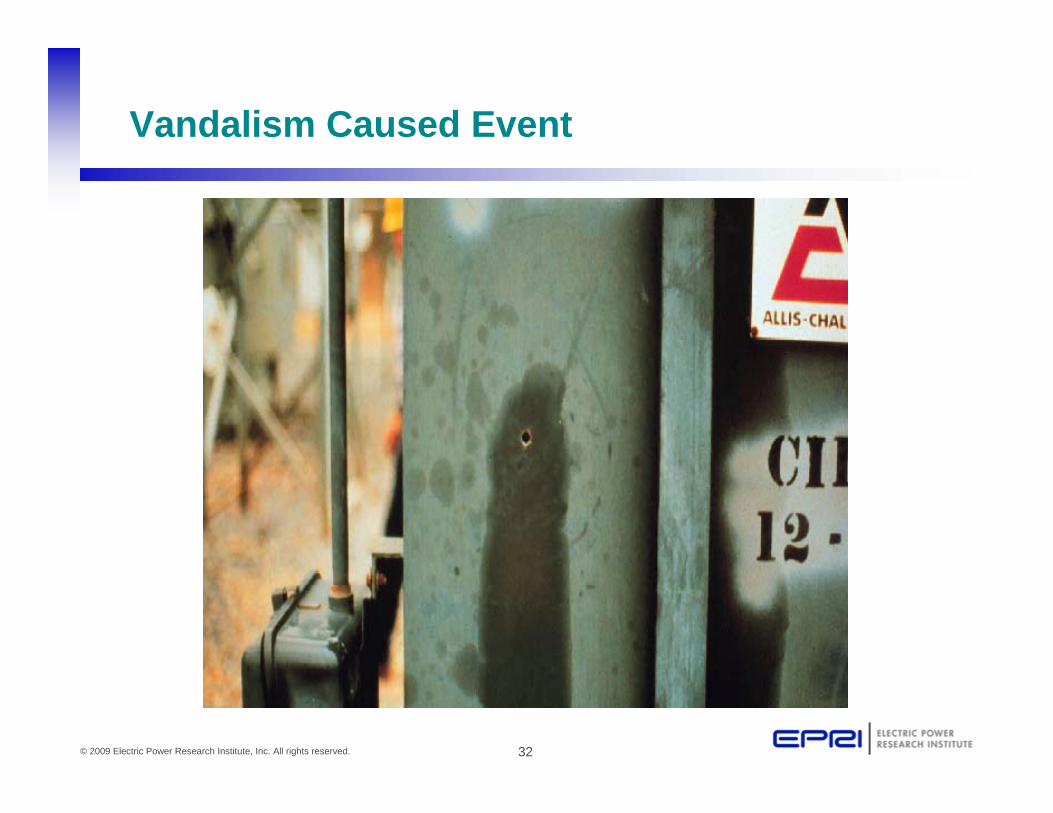
Vandalism Caused Event

33© 2009 Electric Power Research Institute, Inc. All rights reserved.
Reliability/Power Quality Myth 2
• Utility reliability is getting worse– customers claim never having as many problems in the
past– did not have these problems somewhere else– customer peer comparison may drive belief that reliability
to their site has worsened– overall belief that cost cutting, down-sizing, and other
initiatives can have a negative effect

34© 2009 Electric Power Research Institute, Inc. All rights reserved.
Reliability/Power Quality Reality 2
• Electric power has been and will be into the foreseeable future an analog technology– vs. the major advantages which digital technologies have
fostered as a whole
• However at the same time, industry expectations continue to rise– automation, just in time processes, reduced manpower,
tighter margins, global economy

35© 2009 Electric Power Research Institute, Inc. All rights reserved.
Voltage Sags Come In All Shapes & Sizes
• Lights may or may not flicker
• Tools shutdown or malfunction
• Can result in production downtime an/or product loss
-1
-0.5
0
0.5
1
0 1 2 3 4 5 6 7 8
Duration (4 Cycle)
Magnitude (50% of nominal)

36© 2009 Electric Power Research Institute, Inc. All rights reserved.
150.0V
75.0V
0.0V105.83 ms/div0.00ns 2.12sec
RMS Sag Disturbance PQPager/3100 PQNode
Circuit Foil, USA 01/13/2003 10:18:27.00 AM
Three Phase Delta
1V2V3V
37© 2009 Electric Power Research Institute, Inc. All rights reserved.
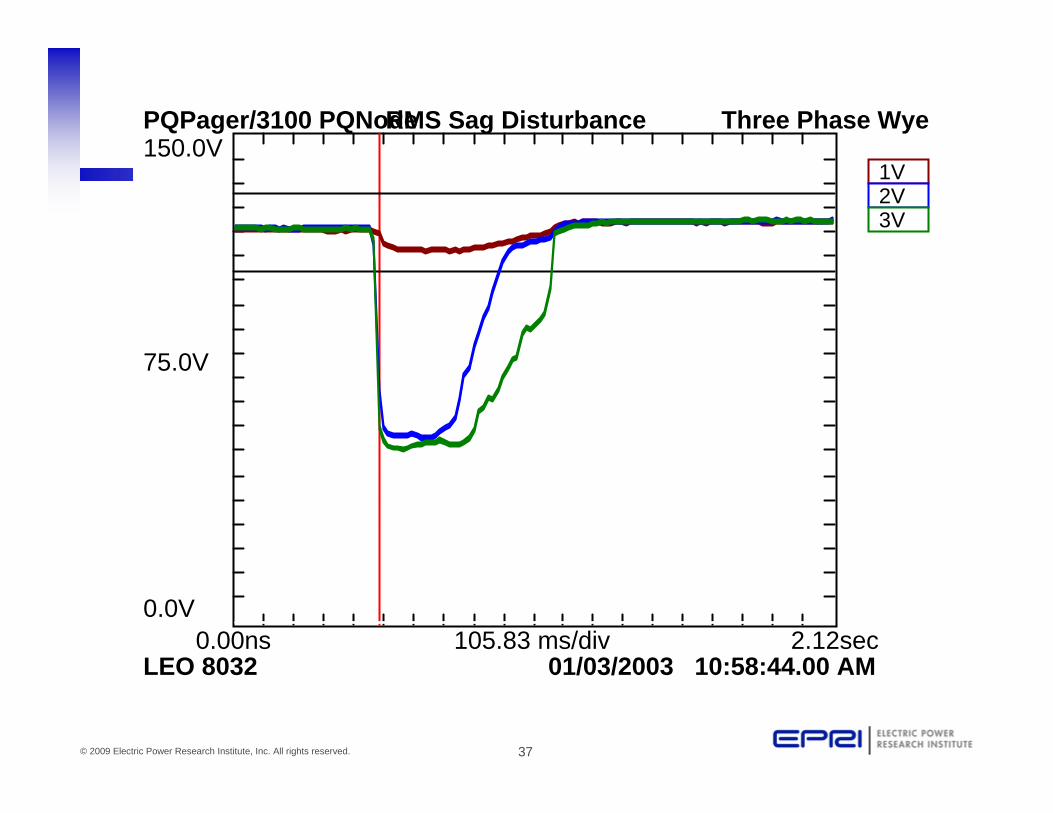
150.0V
75.0V
0.0V105.83 ms/div0.00ns 2.12sec
RMS Sag Disturbance PQPager/3100 PQNode
LEO 8032 01/03/2003 10:58:44.00 AM
Three Phase Wye
1V2V3V

38© 2009 Electric Power Research Institute, Inc. All rights reserved.
150.0V
75.0V
0.0V105.83 ms/div0.00ns 2.12sec
RMS Sag Disturbance PQPager/3100 PQNode
LEO 8032 02/04/2003 10:39:28.00 AM
Three Phase Wye
1V2V3V

39© 2009 Electric Power Research Institute, Inc. All rights reserved.
200.0V
100.0V
0.0V105.83 ms/div0.00ns 2.12sec
RMS Sag Disturbance PQPager/3100 PQNode
LEO 8032 04/29/2003 06:55:20.00 AM
Three Phase Wye
1V2V3V
40© 2009 Electric Power Research Institute, Inc. All rights reserved.
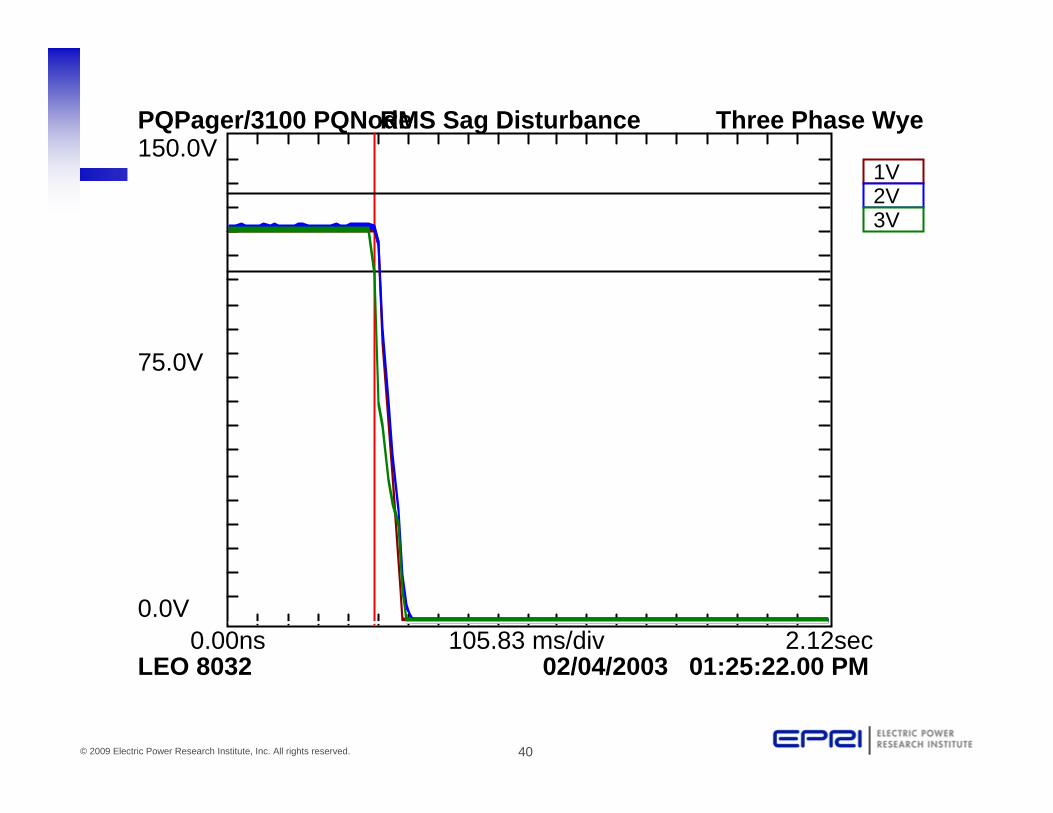
150.0V
75.0V
0.0V105.83 ms/div0.00ns 2.12sec
RMS Sag Disturbance PQPager/3100 PQNode
LEO 8032 02/04/2003 01:25:22.00 PM
Three Phase Wye
1V2V3V

41© 2009 Electric Power Research Institute, Inc. All rights reserved.
SARFI
• System Average RMS (Variation) Frequency Index
• Typically normalized to per site/per year data
T
ix N
NSARFI ∑=
42© 2009 Electric Power Research Institute, Inc. All rights reserved.
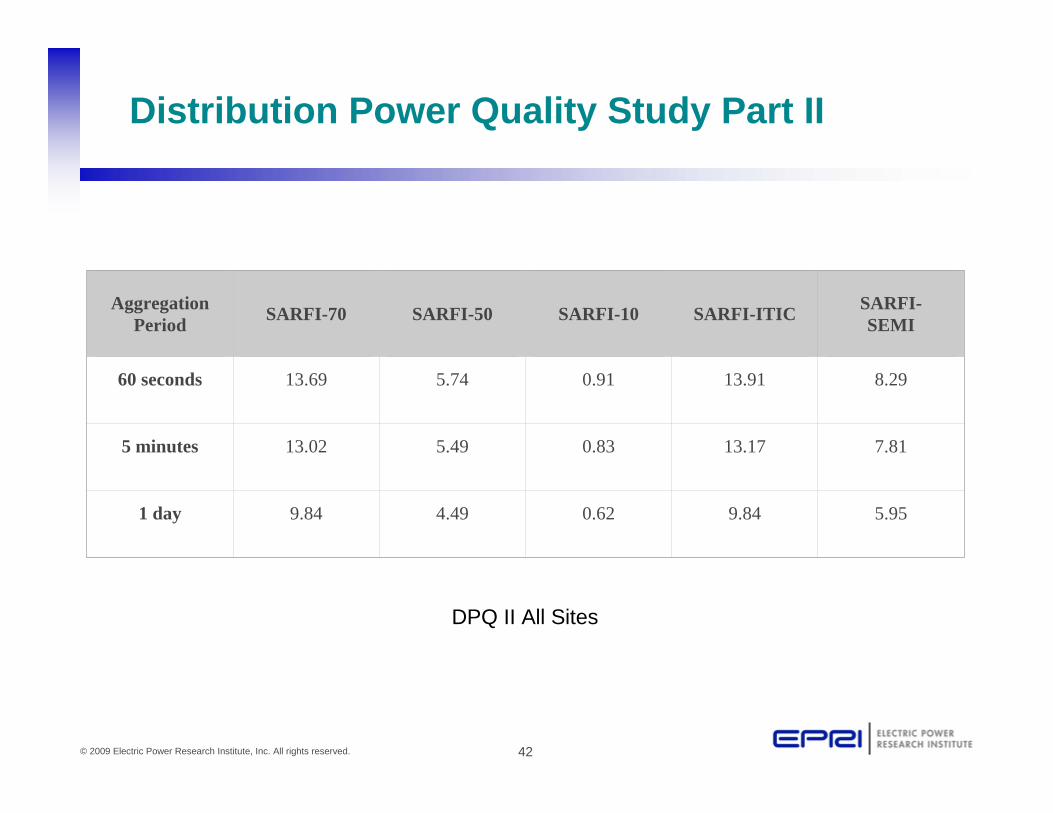
Distribution Power Quality Study Part II
AggregationPeriod SARFI-70 SARFI-50 SARFI-10 SARFI-ITIC SARFI-
SEMI
60 seconds 13.69 5.74 0.91 13.91 8.29
5 minutes 13.02 5.49 0.83 13.17 7.81
1 day 9.84 4.49 0.62 9.84 5.95
DPQ II All Sites

43© 2009 Electric Power Research Institute, Inc. All rights reserved.
DPQ II ResultsIEEE 1346 Contour Chart Format
½ to
1 c
yc
2 cy
c
3 cy
c
4 cy
c
5 cy
c
6 cy
c
10 c
yc
20 c
yc
30 c
yc
1 se
c
2 se
c
5 se
c
10 s
ec
30 s
ec
60 s
ec
120
sec
510152025303540455055606570758085
Sag Coordination ChartAll-Sites, One-Minute Aggregate Window
36-3834-3632-3430-3228-3026-2824-2622-2420-2218-2016-1814-1612-1410-128-106-84-62-40-2
VoltageMagnitude (%)
DurationEvents perSite per Year

44© 2009 Electric Power Research Institute, Inc. All rights reserved.
Duration Voltage (%) 1 cyc 2 cyc 3 cyc 4 cyc 5 cyc 6 to 10
cyc 10 to 20
cyc 20 cyc to 0.5 sec
0.5 to 1 sec
1 to 2 sec 2 to 5 sec > 5 sec > 5 sec 10 to 30 sec
0.5 to 1 min
1 to 2 min
0 to 10 4.0% 14.9% 26.6% 36.4% 43.0% 61.0% 81.0% 86.0% 90.0% 92.8% 93.7% 96.9% 98.9% 99.2% 99.2% 100.0% 10 to 20 4.0% 14.9% 26.5% 36.3% 43.0% 60.5% 80.6% 85.8% 89.7% 92.2% 93.6% 95.6% 98.6% 99.0% 99.2% 99.3% 20 to 30 4.0% 14.9% 26.5% 36.2% 42.9% 60.0% 79.9% 85.6% 89.6% 92.0% 93.5% 95.5% 98.6% 99.0% 99.2% 99.3% 30 to 40 4.0% 14.8% 26.3% 36.1% 42.7% 59.5% 79.1% 85.4% 89.4% 91.8% 93.5% 95.5% 98.5% 99.0% 99.2% 99.3% 40 to 50 4.0% 14.7% 26.0% 35.8% 42.5% 58.7% 77.9% 85.1% 89.1% 91.6% 93.4% 95.5% 98.5% 99.0% 99.2% 99.3% 50 to 60 3.9% 14.3% 25.4% 35.3% 41.9% 57.0% 76.0% 84.5% 88.6% 91.4% 93.3% 95.3% 98.3% 99.0% 99.2% 99.3% 60 to 70 3.6% 13.3% 23.8% 34.5% 41.1% 54.8% 73.8% 83.9% 88.1% 91.2% 93.2% 95.0% 98.0% 98.9% 99.2% 99.3% 70 to 80 2.9% 10.7% 21.4% 32.9% 40.2% 52.2% 71.6% 83.4% 87.4% 90.8% 93.1% 94.5% 97.6% 98.9% 99.2% 99.3% 80 to 85 1.5% 6.6% 17.5% 29.7% 38.4% 47.3% 65.2% 82.0% 86.5% 90.4% 92.9% 94.1% 97.2% 98.9% 99.2% 99.3%
DPQ II ResultsEquipment Design Guidance
Based on DPQII data, a piece of equipment would ride through 76% of all events in one year if it could withstand a 50% for 20 cycles.
Based on DPQII data, a piece of equipment would ride through 76% of all events in one year if it could withstand a 50% for 20 cycles.
45© 2009 Electric Power Research Institute, Inc. All rights reserved.
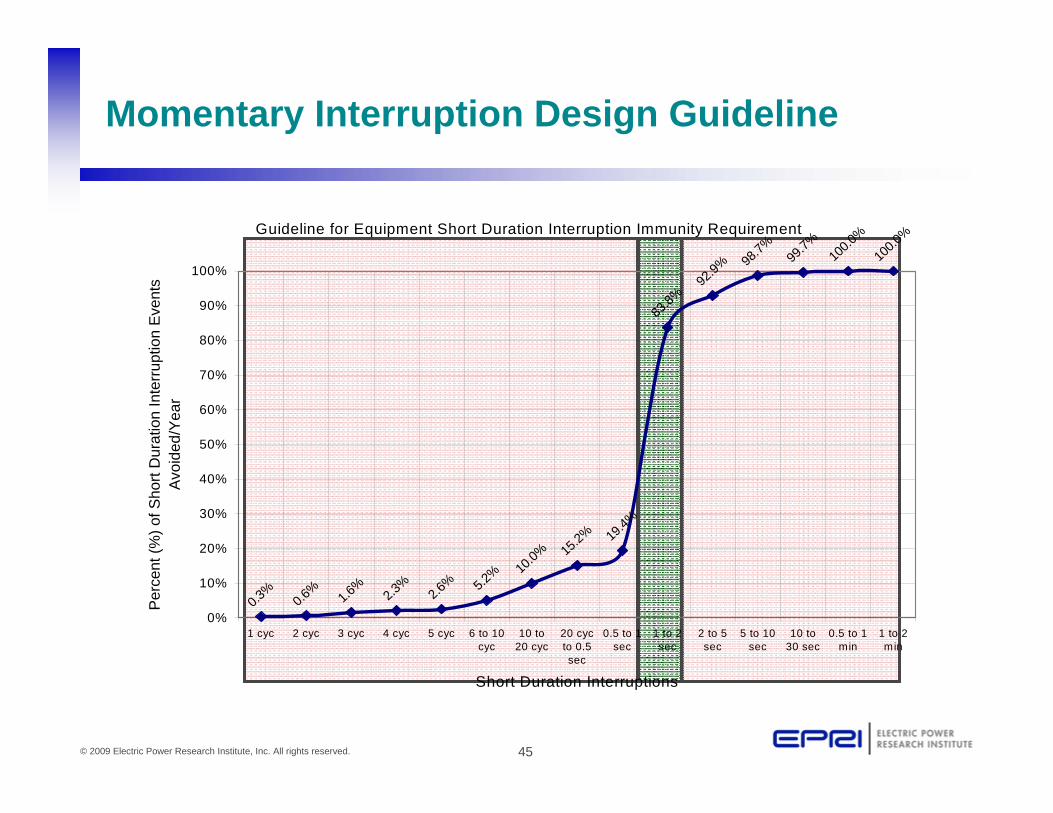
Guideline for Equipment Short Duration Interruption Immunity Requirement
0.3%
0.6%
1.6%
2.3%
2.6% 5.2
% 10.0% 15
.2% 19.4%
83.8%
92.9%
98.7% 99
.7%10
0.0%
100.0
%
0%
10%
20%
30%
40%
50%
60%
70%
80%
90%
100%
1 cyc 2 cyc 3 cyc 4 cyc 5 cyc 6 to 10cyc
10 to20 cyc
20 cycto 0.5sec
0.5 to 1sec
1 to 2sec
2 to 5sec
5 to 10sec
10 to30 sec
0.5 to 1min
1 to 2min
Short Duration Interruptions
Per
cent
(%) o
f Sho
rt D
urat
ion
Inte
rrup
tion
Eve
nts
Avo
ided
/Yea
r
Momentary Interruption Design Guideline

46© 2009 Electric Power Research Institute, Inc. All rights reserved.
Plant in Industrial Park Fed from Distribution System In South
0102030405060708090
100
0 5 10 15 20 25 30 35 40 45 50 55 60
Duration (Cycles)
%Vn
omin
al
SEMI F47 ITIC %Vnom

47© 2009 Electric Power Research Institute, Inc. All rights reserved.
Overlay of PQ Data with Equipment Susceptibility
0102030405060708090
100
0 5 10 15 20 25 30 35 40 45 50 55 60
Duration (Cycles)
%Vn
omin
al
%Vnom PLC with AC PS Ice Cube Relays AC Digital Inputs
48© 2009 Electric Power Research Institute, Inc. All rights reserved.
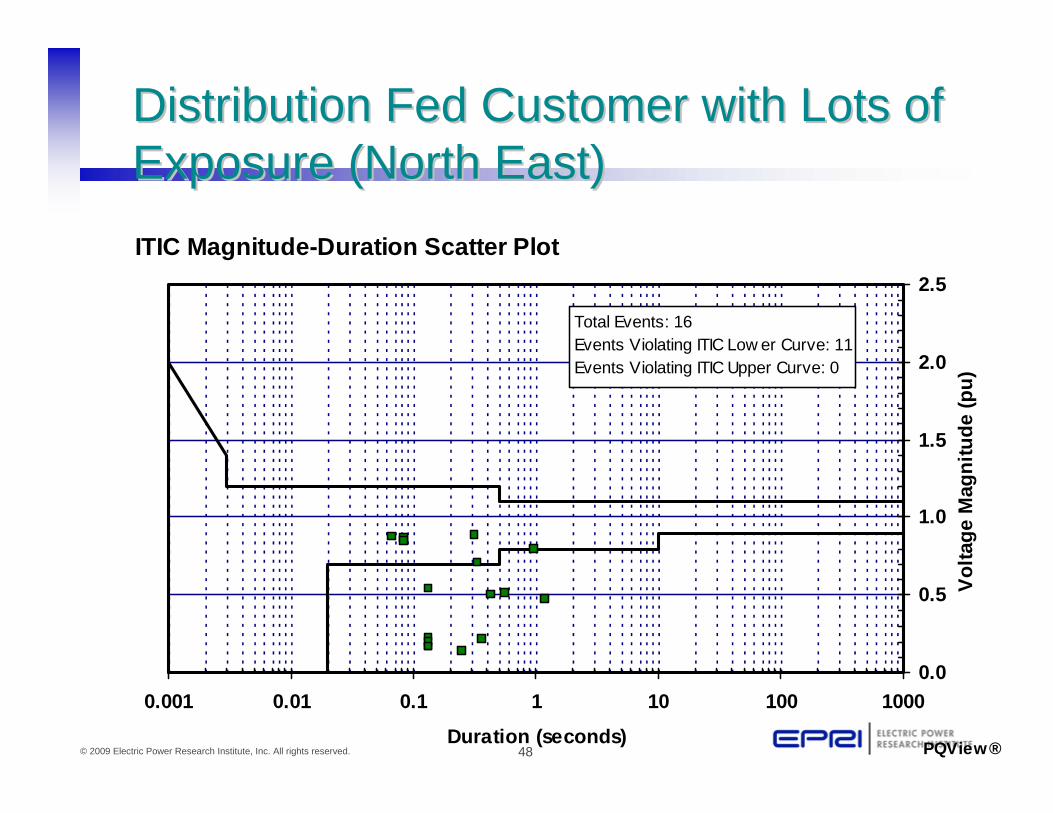
Total Events: 16Events Violating ITIC Low er Curve: 11Events Violating ITIC Upper Curve: 0
0.0
0.5
1.0
1.5
2.0
2.5
0.001 0.01 0.1 1 10 100 1000
Duration (seconds)
Vol
tage
Mag
nitu
de (p
u)
ITIC Magnitude-Duration Scatter Plot
PQView®
Distribution Fed Customer with Lots of Distribution Fed Customer with Lots of Exposure (North East)Exposure (North East)
49© 2009 Electric Power Research Institute, Inc. All rights reserved.
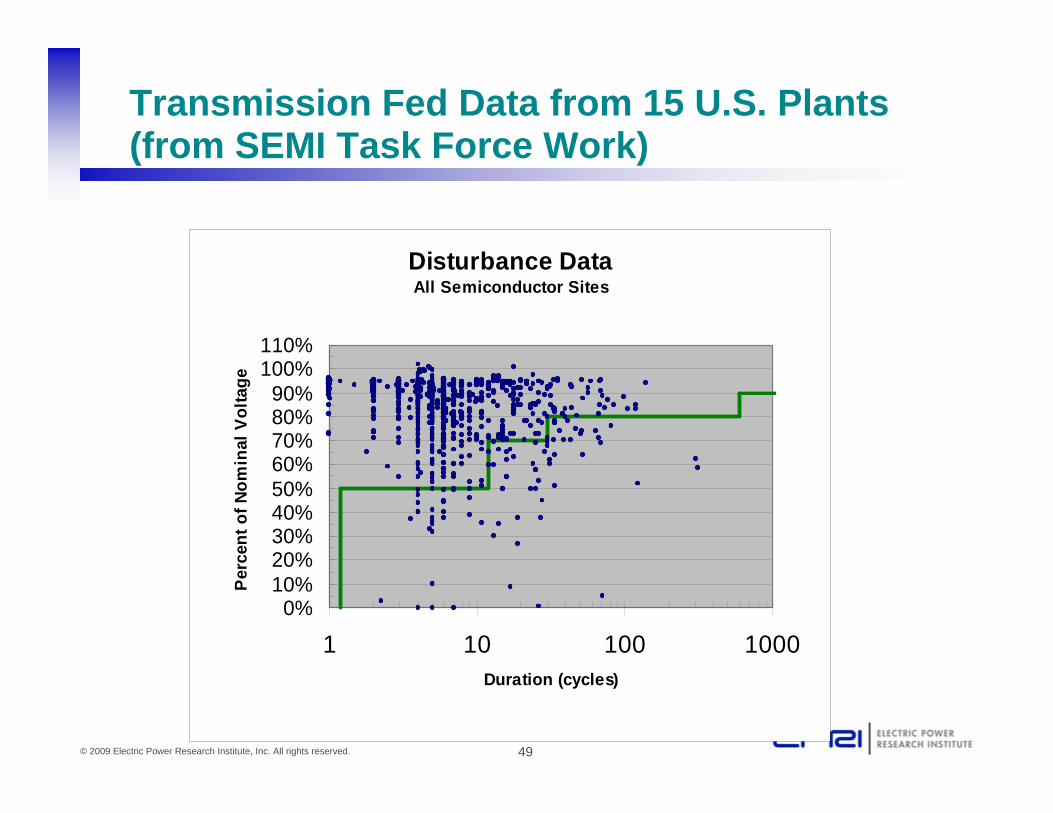
Transmission Fed Data from 15 U.S. Plants(from SEMI Task Force Work)
Disturbance DataAll Semiconductor Sites
0%10%20%30%40%50%60%70%80%90%
100%110%
1 10 100 1000Duration (cycles)
Perc
ent o
f Nom
inal
Vol
tage

50© 2009 Electric Power Research Institute, Inc. All rights reserved.
Duration of Events From Transmission
Source: SEMI Power Quality and Equipment Ride-Through Task Force
InternalTask Force Report: SEMI9804
51© 2009 Electric Power Research Institute, Inc. All rights reserved.
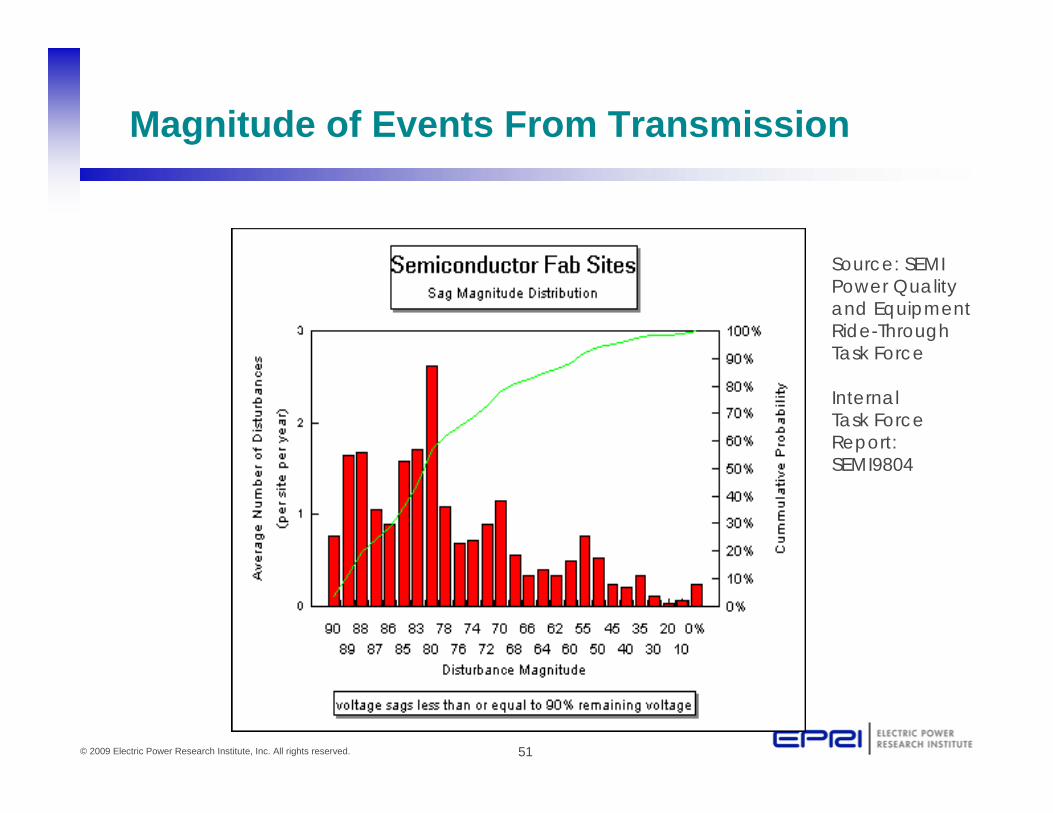
Magnitude of Events From Transmission
Source: SEMI Power Quality and Equipment Ride-Through Task Force
InternalTask Force Report: SEMI9804

52© 2009 Electric Power Research Institute, Inc. All rights reserved.
Conclusions
• Perfect Power Quality is not attainable.
• The Voltage Sag is the most common power quality problem effecting industrial customers.
• The majority of these events are mostly short in duration (less than 200ms) Sagging from from 10% to 50%.
• EPRI studies show that most events are severe on a single-phase only on utility side.
• Power Quality data indicates that SEMI F47 compliant equipment will lead to fewer process upsets and equipment shutdowns.