power division, mpemr - home page - gsep generation company of bangladesh (egcb) ashugonj power...
TRANSCRIPT
8-10 September 2009
Power Division, MPEMRPower Division, MPEMR

Present Structure of Power Sector
Generation Bangladesh Power Development Board (BPDB) Electricity generation Company of Bangladesh
(EGCB) Ashugonj Power Station Company Limited
(APSCL) North West Power Generation Company
Limited (NWPGC) IPPs
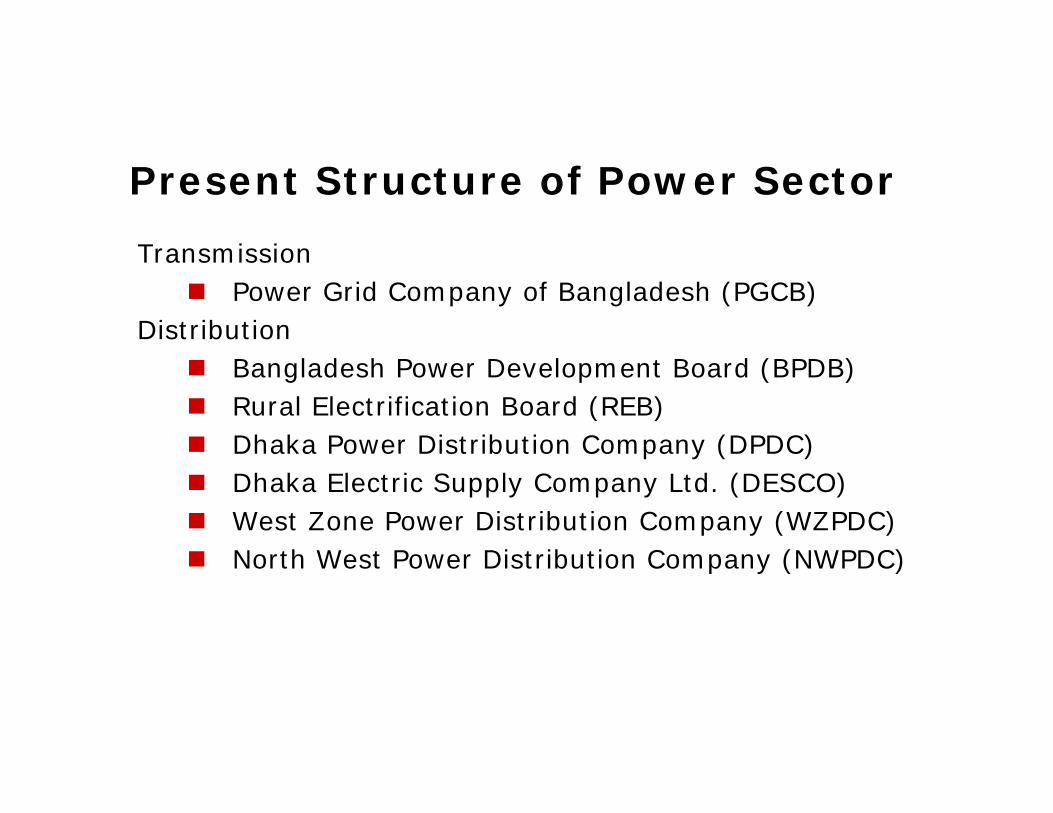
Present Structure of Power Sector
Transmission Power Grid Company of Bangladesh (PGCB)
Distribution Bangladesh Power Development Board (BPDB) Rural Electrification Board (REB) Dhaka Power Distribution Company (DPDC) Dhaka Electric Supply Company Ltd. (DESCO) West Zone Power Distribution Company (WZPDC) North West Power Distribution Company (NWPDC)

Installed capacity by owner basis and fuel basis for FY 2009
GAS83.4%
HYDRO4.0%
FO4.9%
DIESEL3.3%
COAL4.4%
GAS HYDRO FO DIESEL COAL
TOTAL INSTALLED CAPACITY 5719 MW
INSTALLED CAPACITY
PUBLIC 66.66%
PRIVATE33.34%
PUBLIC PRIVATE
TOTAL INSTALLED CAPACITY -5719 MW
INSTALLED CAPACITY
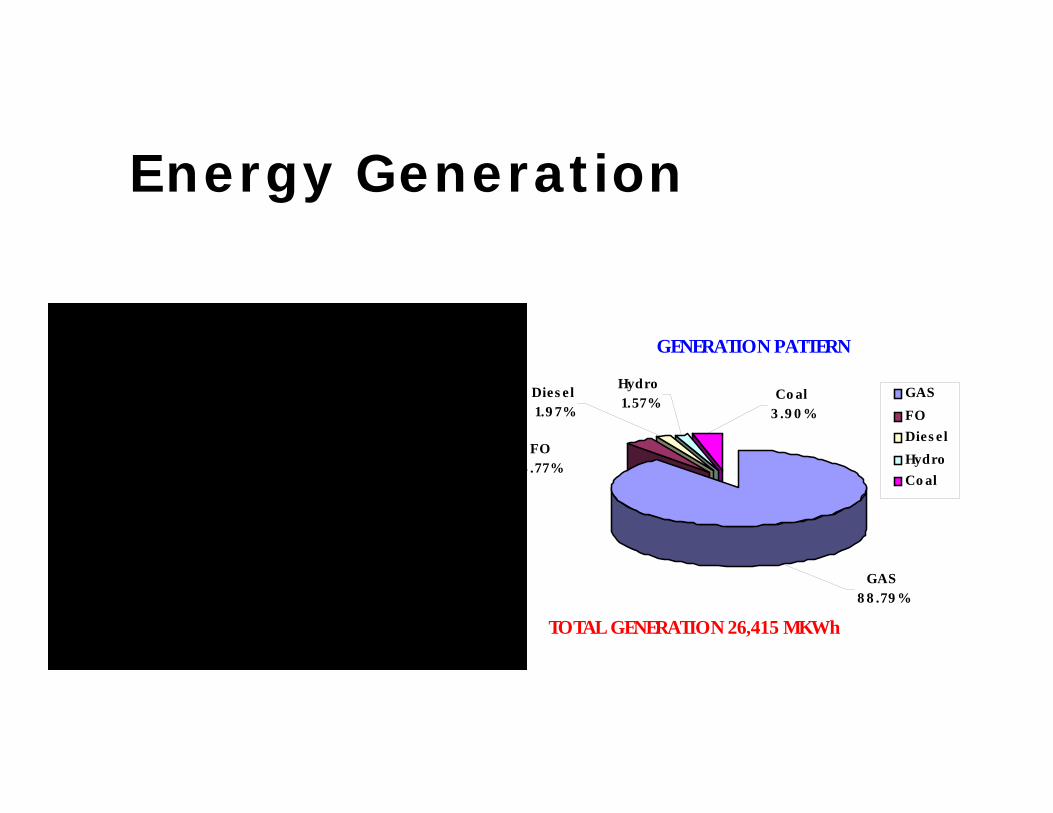
Energy Generation
GAS8 8 .79 %
Co al3 .9 0 %
Hydro1.57%
Dies el1.9 7%
FO3 .77%
GASFODies elHydroCo al
TOTAL GENERATION 26,415 MKWh
GENERATION PATTERN
PUBLIC58.49%
PRIVATE41.51%
PUBLIC
PRIVATE
TOTAL GENERATION 26415 MKWh
GENERATION PATTERN
Vision
- To make electricity available for all. - To ensure reliable and quality supply of electricity. - To provide electricity at a reasonable price.

Policy Objectives-Bringing entire country under electricity service by 2021. -Power sector financially viable able to facilitate economic growth. -Increasing the sectors efficiency.-Making the sector commercial. -Improving the reliability and quality of electricity supply. -Using coal, liquid fuel etc. as the primary fuel. -Increasing private sector participation to mobilize finance. -Increasing renewable energy such as solar, wind, micro-hydro, bio-mass etc.-Ensuring reasonable and affordable price for electricity by pursuing least cost options. -Promoting competition among various entities.
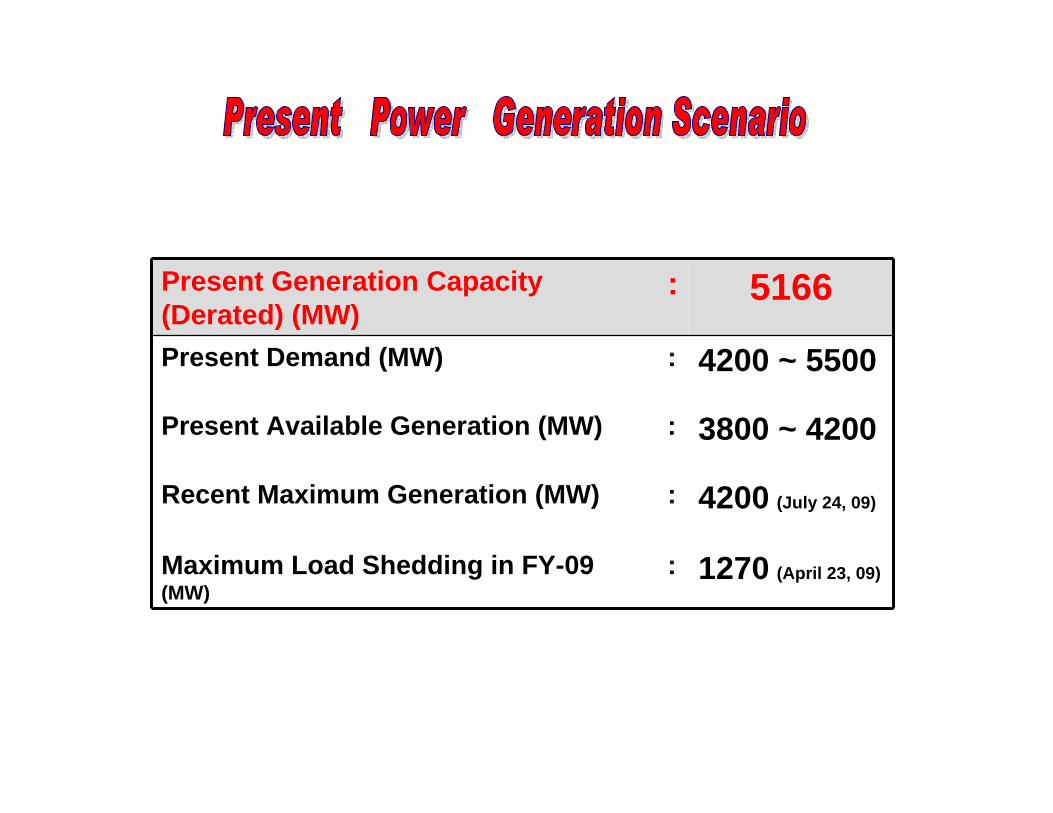
Present Generation Capacity (Derated) (MW)
: 5166
Present Demand (MW) : 4200 ~ 5500
Present Available Generation (MW) : 3800 ~ 4200
Recent Maximum Generation (MW) : 4200 (July 24, 09)
Maximum Load Shedding in FY-09 (MW)
: 1270 (April 23, 09)

Electricity Growth : 7.2 % in 2008 7.5 % Av. since 1990
Total Consumer : 11 Million (FY 2008)
Transmission Line : 8000 km Distribution Line : 2,56,000 km Distribution Loss : 14.7 % (FY 2008)
Per Capita Generation : 175 kWh / annum (FY 2008)
Access to Electricity : 45 % (FY 2008)
Key StatisticsKey Statistics

AshuganjAshuganj -- 724 MW724 MW
GhorasalGhorasal -- 950 MW950 MW
RaujanRaujan & & SikolbahaSikolbaha -- 508 MW508 MW
KaptaiKaptai -- 230 MW230 MW
BheramaraBheramara -- 60 MW60 MW
BaghabariBaghabari -- 261 MW261 MW
HaripurHaripur -- 569 MW569 MW
ShahjibazarShahjibazar & & FenchuganjFenchuganj-- 217 MW217 MW
Khulna Khulna -- 270 MW270 MW
SiddhirganjSiddhirganj -- 210MW210MW
MymensinghMymensingh -- 210 MW210 MW
BarapukuriaBarapukuria -- 250 MW250 MW
Barisal Barisal -- 440 MW0 MW
TongiTongi -- 105 MW105 MW

Public Sector : 480 MW Private Sector : 272 MW
Subtotal : 752 MW (Commissioning expected by Dec 2009)
UNDER CONSTRUCTION
Public Sector : 900 MW Private Sector : 450 MW
Subtotal : 1350 MW (Commissioning expected by FY11-FY13)
UNDER PROCUREMENT PROCESS
COMMITTED
Public Sector : 995 MW Private Sector : 450 MW
Subtotal : 1445 MW (Commissioning expected by FY13-FY14)
Total : 3547 MW
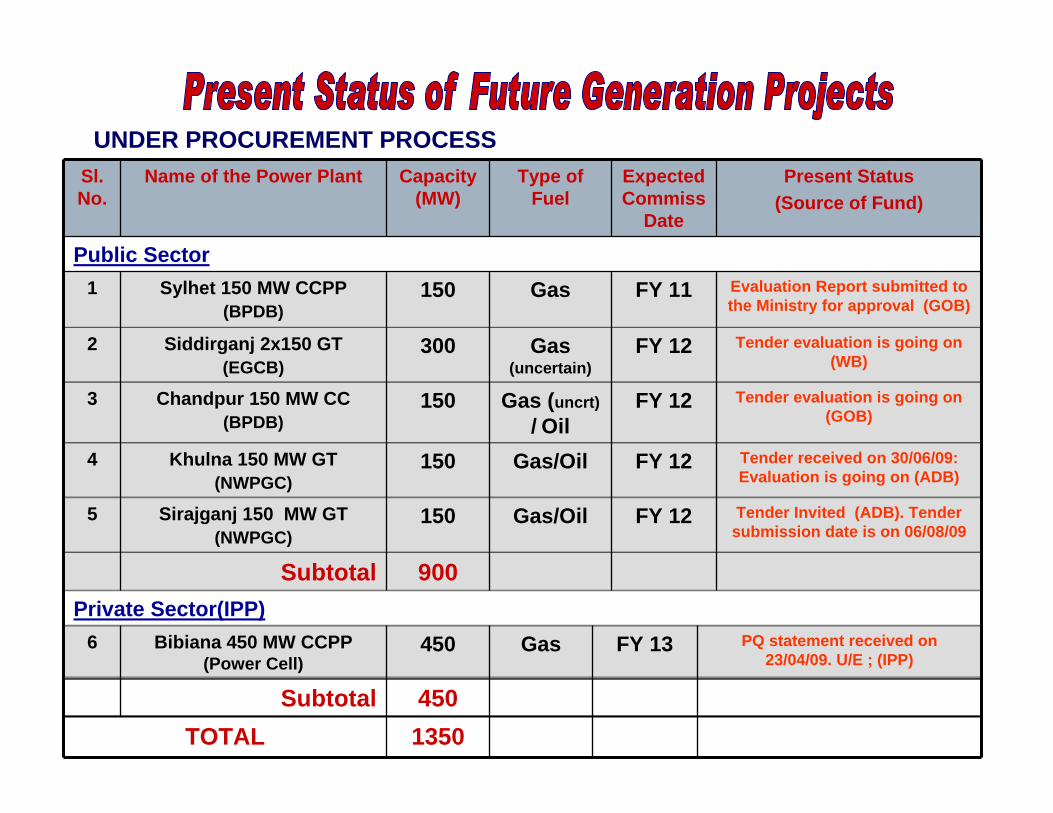
Sl. No.
Name of the Power Plant Capacity (MW)
Type of Fuel
Expected Commiss
Date
Present Status(Source of Fund)
Public Sector1 Sylhet 150 MW CCPP
(BPDB)150 Gas FY 11 Evaluation Report submitted to
the Ministry for approval (GOB)
2 Siddirganj 2x150 GT(EGCB)
300 Gas (uncertain)
FY 12 Tender evaluation is going on (WB)
3 Chandpur 150 MW CC(BPDB)
150 Gas (uncrt) / Oil
FY 12 Tender evaluation is going on (GOB)
4 Khulna 150 MW GT(NWPGC)
150 Gas/Oil FY 12 Tender received on 30/06/09: Evaluation is going on (ADB)
5 Sirajganj 150 MW GT(NWPGC)
150 Gas/Oil FY 12 Tender Invited (ADB). Tender submission date is on 06/08/09
Subtotal 900Private Sector(IPP)
6 Bibiana 450 MW CCPP(Power Cell)
450 Gas FY 13 PQ statement received on 23/04/09. U/E ; (IPP)
Subtotal 450TOTAL 1350
UNDER PROCUREMENT PROCESS

Sl. No.
Name of the Power Plant Capacity (MW)
Type of Fuel
Expected Commis. Date
Present Status(Source of Fund)
Public Sector1 Bhola 150 MW CCPP
(BPDB)150 Gas FY 13 Feasibility Study will
start soon; (IDB)
2 Barapukuria 125 MW Coal (3rd Unit) (BPDB)
125 Coal FY 13 Under Process; (GOB)PDPP in Planning Comm.
3 Haripur 360 MW CCPP(EGCB)
360 Gas (uncertain)
FY 14 Loan Agreement signed. Doc Under Preparation;
(JICA)
4 Bheramara 360 MW CCPP(NWPGC)
360 Gas (uncertain)
FY 14 Feasibility Completed. LA yet to be signed; (JICA)
Subtotal 995Private Sector (IPP)
5 Serajganj 450 MW CCPP/ 500 MW Coal (Power Cell)
450 Gas (uncrt) / Coal
FY 13 PQ Invitation soon ;(IPP)
Subtotal 450TOTAL 1445
COMMITTED
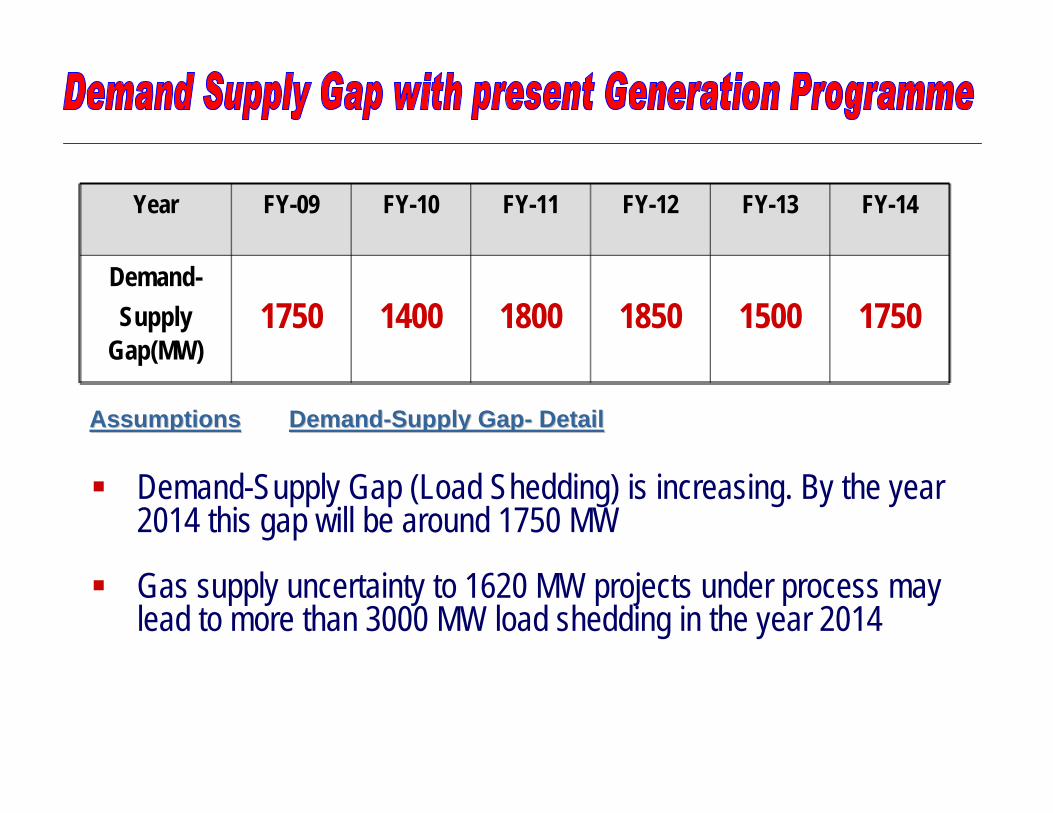
Year FY-09 FY-10 FY-11 FY-12 FY-13 FY-14
Demand-Supply
Gap(MW)1750 1400 1800 1850 1500 1750
Demand-Supply Gap (Load Shedding) is increasing. By the year 2014 this gap will be around 1750 MW
Gas supply uncertainty to 1620 MW projects under process may lead to more than 3000 MW load shedding in the year 2014
AssumptionsAssumptions DemandDemand--Supply GapSupply Gap-- DetailDetail
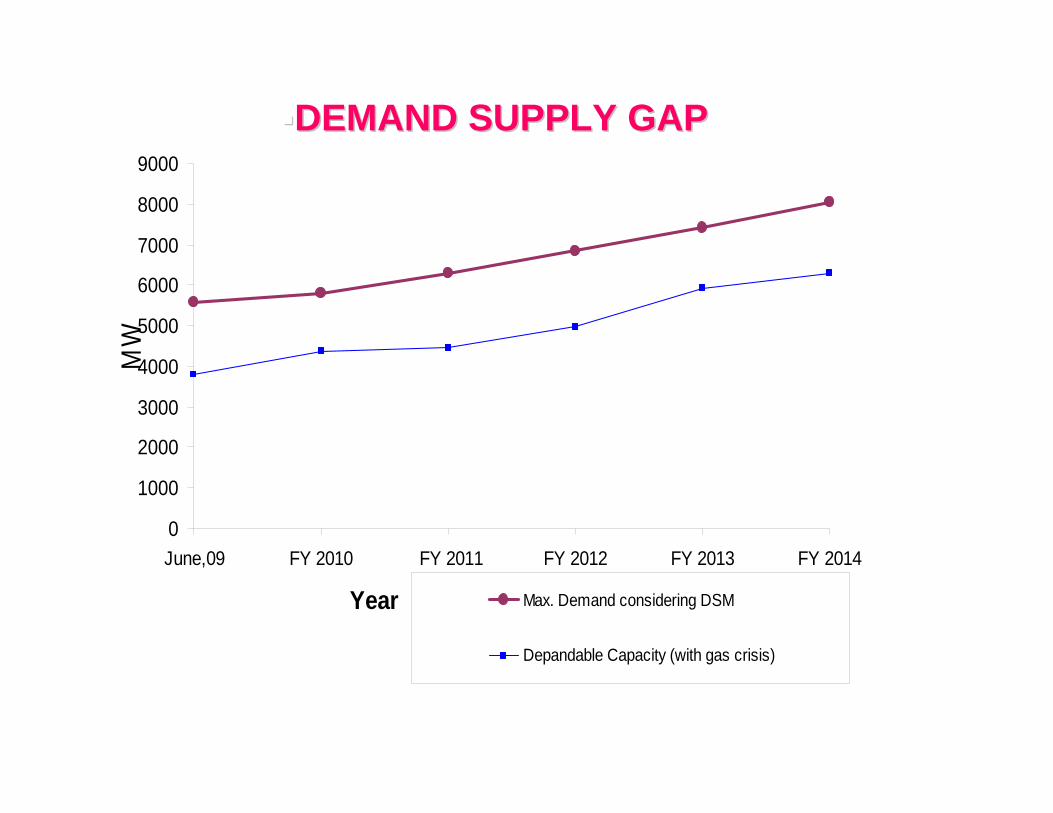
DEMAND SUPPLY GAPDEMAND SUPPLY GAP
0
1000
2000
3000
4000
5000
6000
7000
8000
9000
June,09 FY 2010 FY 2011 FY 2012 FY 2013 FY 2014
Year
MW
Max. Demand considering DSM
Depandable Capacity (with gas crisis)
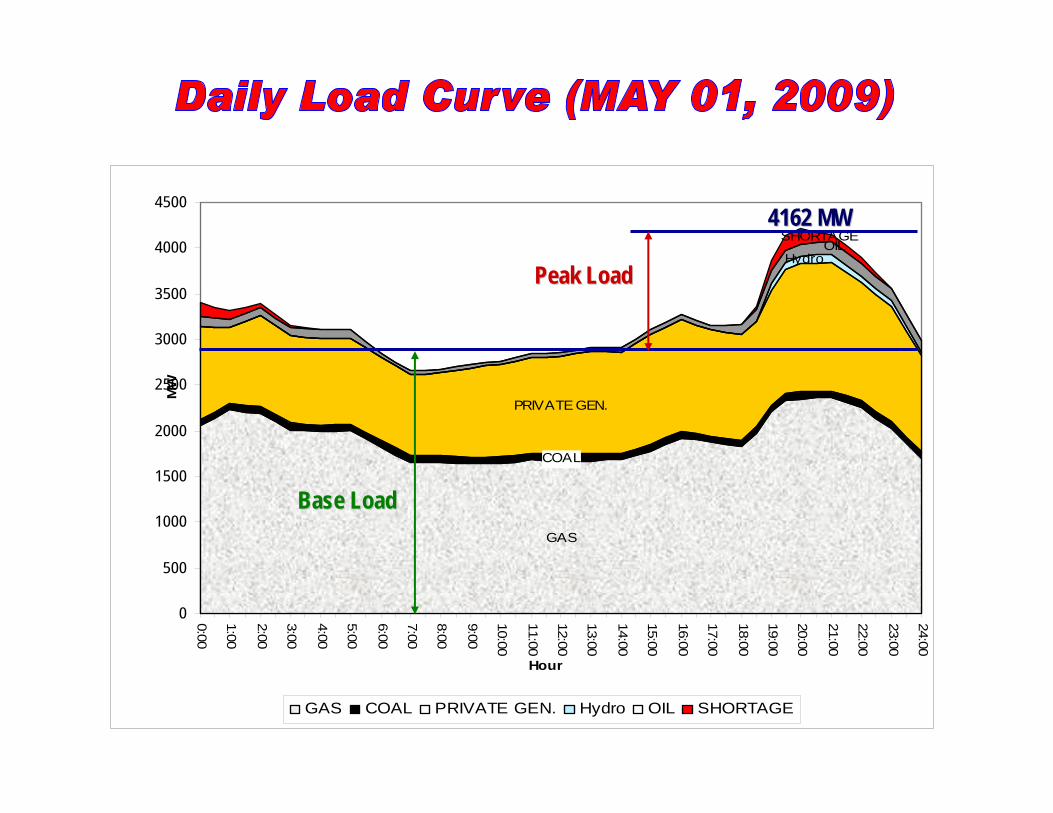
GAS
COAL
PRIVATE GEN.
HydroOIL
SHORTAGE
0
500
1000
1500
2000
2500
3000
3500
4000
4500
0:00
1:00
2:00
3:00
4:00
5:00
6:00
7:00
8:00
9:00
10:00
11:00
12:00
13:00
14:00
15:00
16:00
17:00
18:00
19:00
20:00
21:00
22:00
23:00
24:00
Hour
MW
GAS COAL PRIVATE GEN. Hydro OIL SHORTAGE
4162 MW4162 MW
Peak LoadPeak Load
Base LoadBase Load

Immediate: 6-12 Months- Rental Plants: 500-1500 MW- Per unit cost: Tk 10 (FO) / Tk 16 (Diesel)
Short term: 18-24 Months- Peaking Plants: 800 MW - Per unit cost: Tk 8
Medium term: 4-5 years- Base plants: 4X500 MW Coal- Per unit cost: Tk 3.5
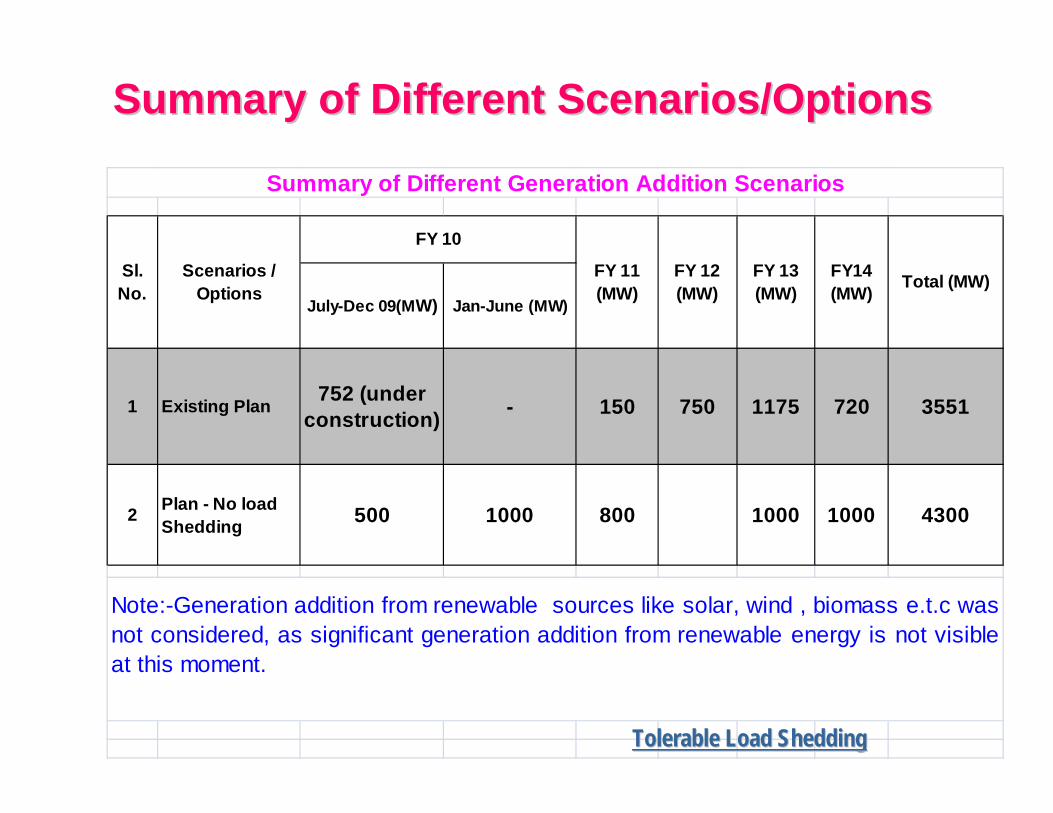
Summary of Different Scenarios/OptionsSummary of Different Scenarios/Options
July-Dec 09(MW) Jan-June (MW)
1 Existing Plan 752 (under construction) - 150 750 1175 720 3551
2 Plan - No load Shedding 500 1000 800 1000 1000 4300
Note:-Generation addition from renewable sources like solar, wind , biomass e.t.c wasnot considered, as significant generation addition from renewable energy is not visibleat this moment.
FY 13 (MW)
FY14 (MW) Total (MW)
Summary of Different Generation Addition Scenarios
Scenarios / Options
FY 10
Sl. No.
FY 11 (MW)
FY 12 (MW)
Tolerable Load SheddingTolerable Load Shedding

Renewable Energy Policy (2008)- 5 % of total generation by 2015 : 450 MW- 10 % of total generation by 2020 : 1600 MW
Hydro: small hydro potential exists; limited scope
Wind: At least 200 MW wind by 2013
Solar: Existing Capacity: 15 MW – 20 MW- Need at least 80 – 100 MW by 2013- Still high cost ; off grid solution; may compete with oil
Renewable will help in mitigating balance deficit

Fuel cost of HFO ‘Rental’ : 50 % cheaper than HSD
Per unit cost of HFO ‘Rental’: 35 % cheaper than HSD
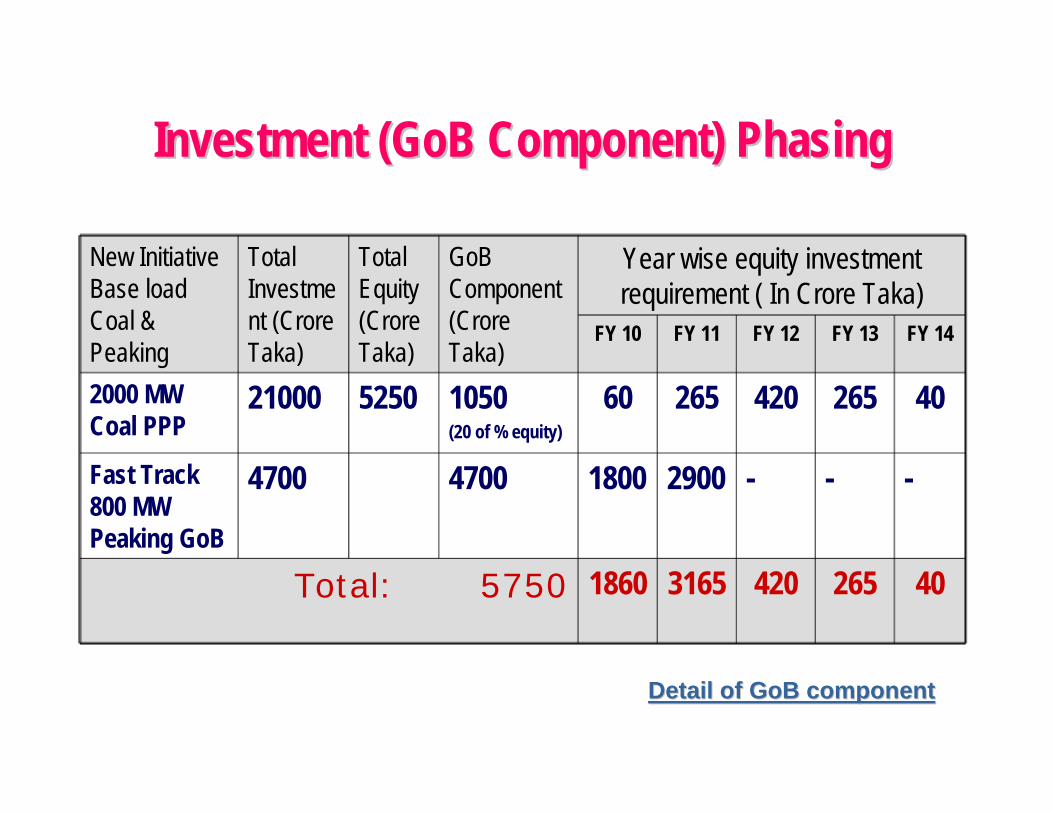
New Initiative Base load Coal & Peaking
Total Investment (CroreTaka)
Total Equity (CroreTaka)
GoBComponent (CroreTaka)
Year wise equity investment requirement ( In Crore Taka)
FY 10 FY 11 FY 12 FY 13 FY 14
2000 MW Coal PPP
21000 5250 1050 (20 of % equity)
60 265 420 265 40
Fast Track 800 MW Peaking GoB
4700 4700 1800 2900 - - -
Total: 5750 1860 3165 420 265 40
Investment (Investment (GoBGoB Component) PhasingComponent) Phasing
Detail of Detail of GoBGoB componentcomponent
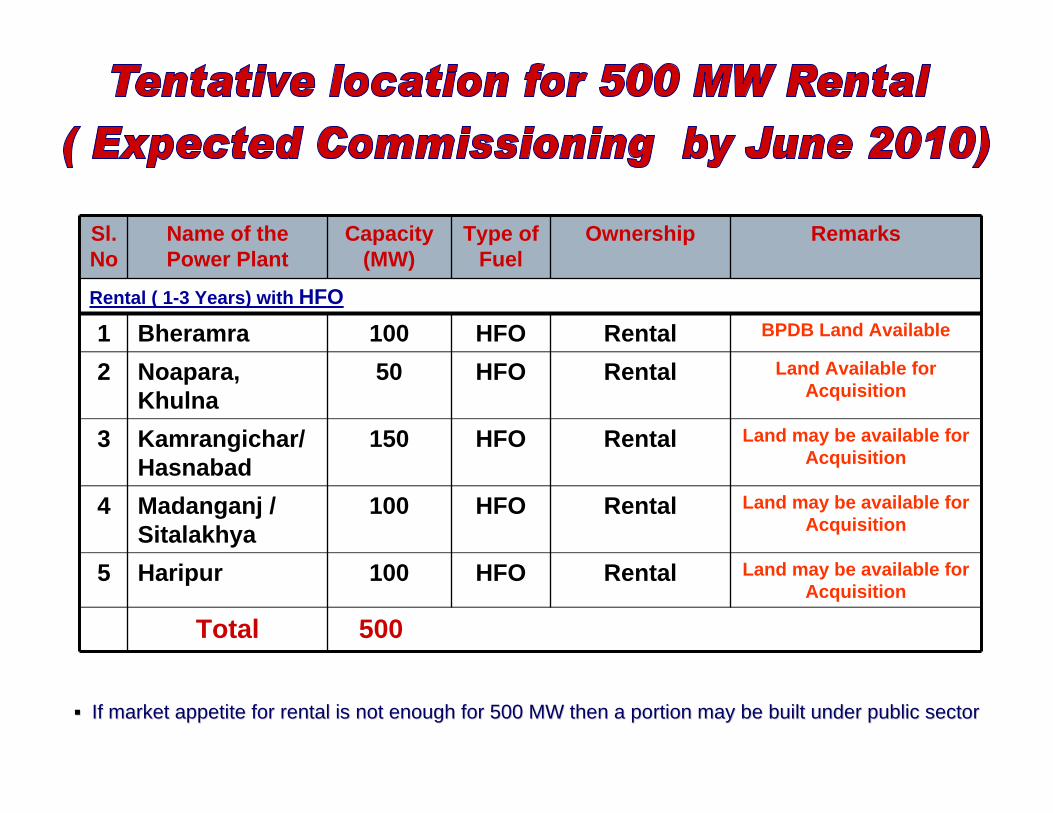
Sl. No
Name of the Power Plant
Capacity (MW)
Type of Fuel
Ownership Remarks
Rental ( 1-3 Years) with HFO
1 Bheramra 100 HFO Rental BPDB Land Available
2 Noapara, Khulna
50 HFO Rental Land Available for Acquisition
3 Kamrangichar/ Hasnabad
150 HFO Rental Land may be available for Acquisition
4 Madanganj / Sitalakhya
100 HFO Rental Land may be available for Acquisition
5 Haripur 100 HFO Rental Land may be available for Acquisition
Total 500
If market appetite for rental is not enough for 500 MW then a poIf market appetite for rental is not enough for 500 MW then a portion may be built under public sectorrtion may be built under public sector

Sl. No.
Name of the Power Plant Capacity (MW)
Type of Fuel
Ownership Remarks
Peaking 800 MW (Public Sector)
1 Katakhali, Rajshahi 100 HFO BPDB BPDB Land Available
2 Dohazari, Chittgong 100 HFO BPDB BPDB Land Available
3 Thakurgaon 50 HFO BPDB BPDB Land Available
4 Cox’s Bazar 50 HFO BPDB BPDB Land Available
5 Gopalganj 50 HFO BPDB Land Available for Acquisition
6 Faridpur 50 HFO BPDB Land Available for Acquisition
7 Nawgaon 50 HFO BPDB Land Available for Acquisition
8 Bera/Baghabari 50 HFO Rental Land Available for Acquisition
9 Khulna South 100 HFO BPDB Land Available for Acquisition
10 Ashuganj / Ghorasal 200 Gas/Oil BPDB BPDB Land Available
Total 800 MW
Considering gas supply situation, 200 MW gas based Peaking PlaConsidering gas supply situation, 200 MW gas based Peaking Plant be considered in nt be considered in SylhetSylhet Mixed fuel (Gas/FO) based 400 Combined Cycle be considered at Mixed fuel (Gas/FO) based 400 Combined Cycle be considered at SirajganjSirajganj/ / MeghnaghatMeghnaghat
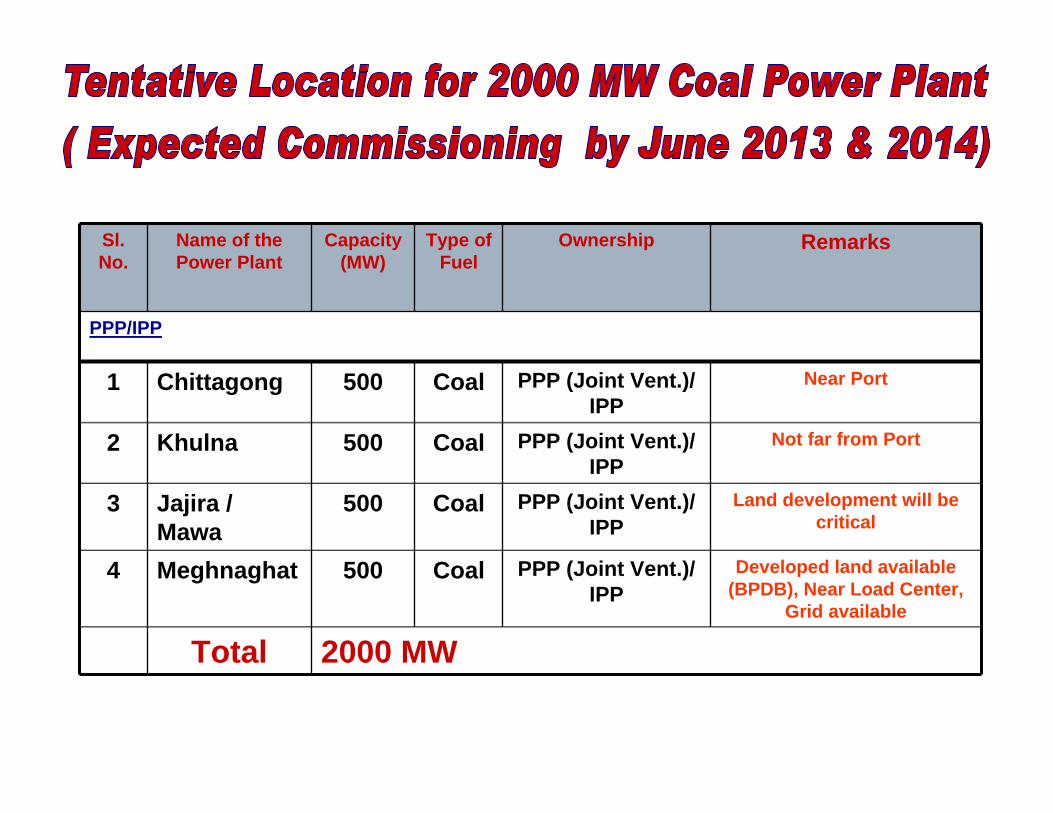
Sl. No.
Name of the Power Plant
Capacity (MW)
Type of Fuel
Ownership Remarks
PPP/IPP
1 Chittagong 500 Coal PPP (Joint Vent.)/ IPP
Near Port
2 Khulna 500 Coal PPP (Joint Vent.)/ IPP
Not far from Port
3 Jajira / Mawa
500 Coal PPP (Joint Vent.)/ IPP
Land development will be critical
4 Meghnaghat 500 Coal PPP (Joint Vent.)/ IPP
Developed land available (BPDB), Near Load Center,
Grid available
Total 2000 MW
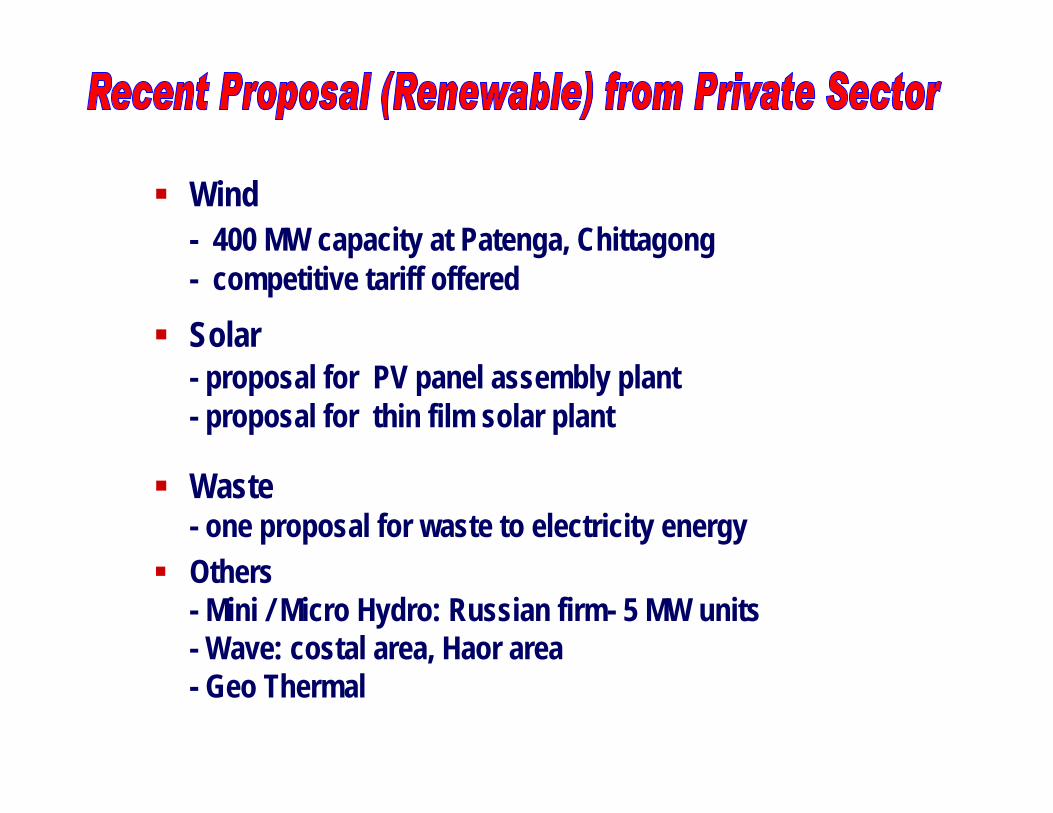
Wind- 400 MW capacity at Patenga, Chittagong - competitive tariff offered
Solar- proposal for PV panel assembly plant- proposal for thin film solar plant
Waste- one proposal for waste to electricity energy
Others- Mini / Micro Hydro: Russian firm- 5 MW units- Wave: costal area, Haor area- Geo Thermal

Tripura, India- Import offer from Tripura 740 MW Gas Power Plant
West Bengal, India- 250 / 500 MW from Bahrampur, West Bengal
Assam, India- Hydro Power from North East India
Bhutan- Hydro Power though SAARC Grid

Estimated Total Investment Cost ( During 5 Year)Estimated Total Investment Cost ( During 5 Year)
Generation : 30,000 Crore Taka (US$ 428 M)
Transmission : 4,000 Crore Taka (US$ 57M)
Distribution : 7,000 Crore Taka (US$ 100M)
Total : 41,000 Crore Taka (US$ 585M)
Balanced expansion and up gradation of Transmission and Distribution with Generation Expansion Plan will improve overall power supply situation and thereby help economic and social development of the country
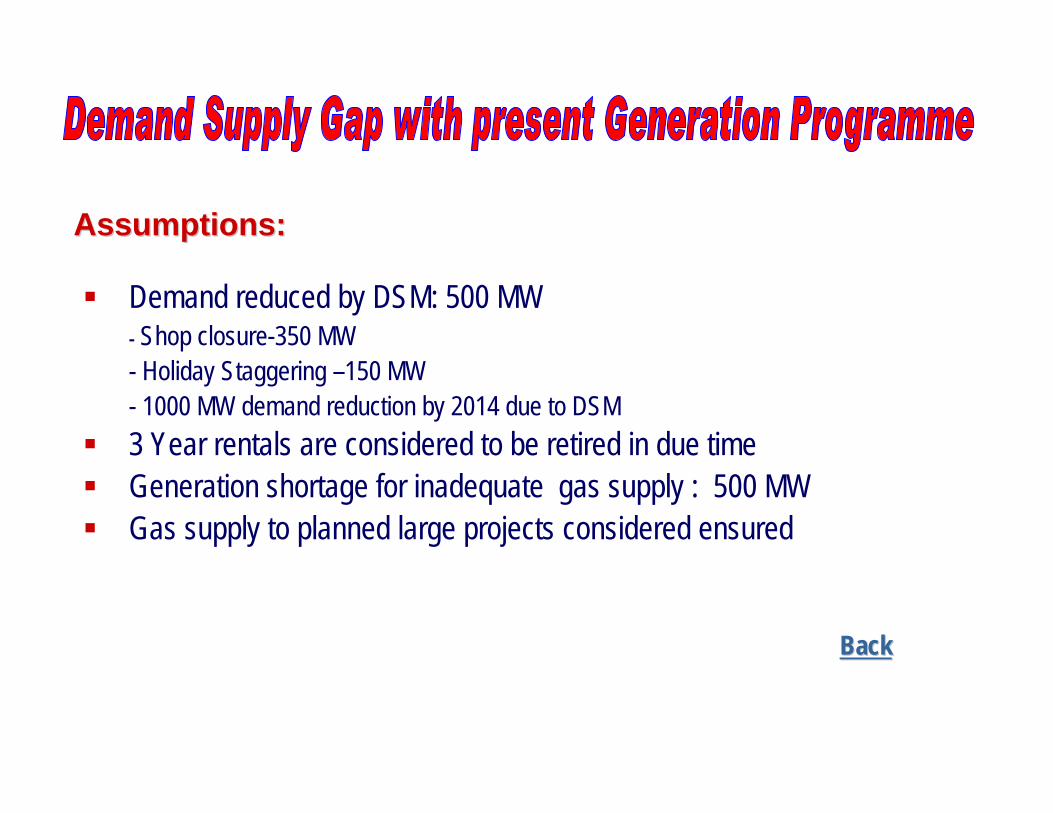
Assumptions:Assumptions:
Demand reduced by DSM: 500 MW- Shop closure-350 MW- Holiday Staggering –150 MW- 1000 MW demand reduction by 2014 due to DSM
3 Year rentals are considered to be retired in due time Generation shortage for inadequate gas supply : 500 MW Gas supply to planned large projects considered ensured
BackBack
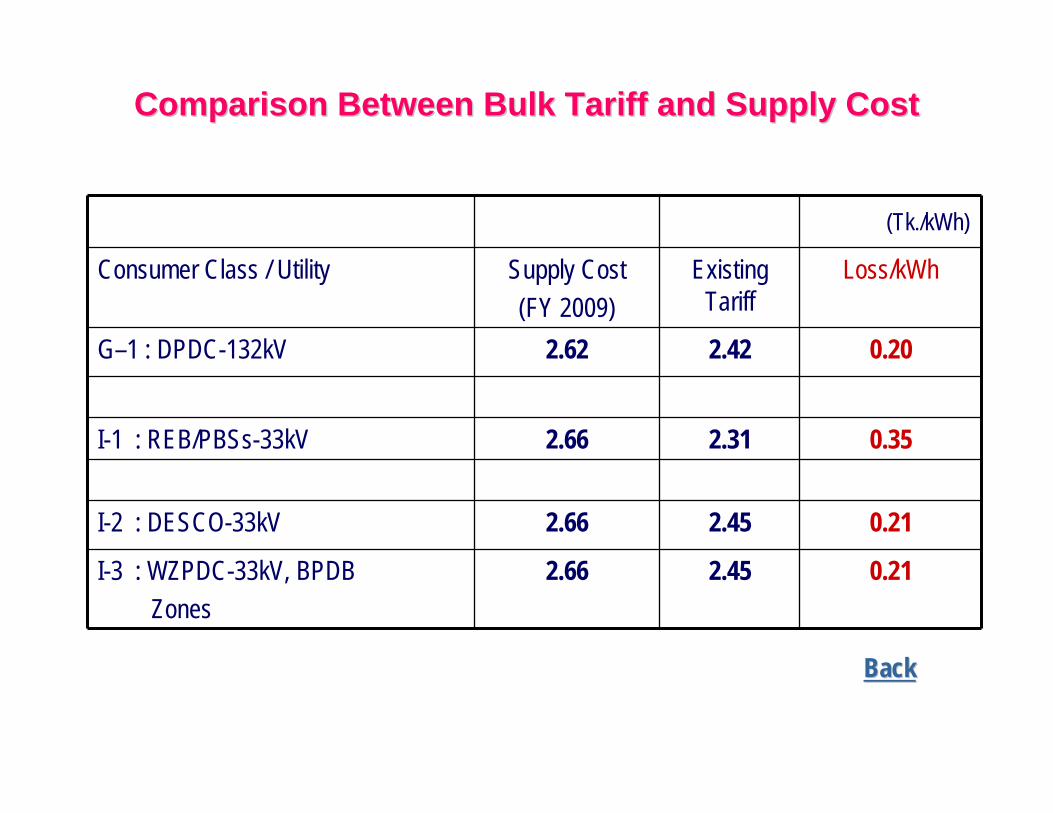
Comparison Between Bulk Tariff and Supply CostComparison Between Bulk Tariff and Supply Cost
Consumer Class / Utility Supply Cost (FY 2009)
Existing Tariff
Loss/kWh
G–1 : DPDC-132kV 2.62 2.42 0.20
I-1 : REB/PBSs-33kV 2.66 2.31 0.35
I-2 : DESCO-33kV 2.66 2.45 0.21
I-3 : WZPDC-33kV, BPDB Zones
2.66 2.45 0.21
(Tk./kWh)
BackBack

Strategies & Constraints and Possibilities of the Power Sector Strategy
-To diversify the use of primary fuel such as gas, coal, liquid fuel etc. will be used for power generation. -To have provision for dual fuel in power plants whereas possible. -To increase power generation through renewable sources e.g solar, wind, Micro hydro etc.-To implement nuclear fuel based power plant.-To finance power generation projects through Public –-Private Partnership (PPP), GOB funding, IPP etc. To increase the sector efficiency, the reform measures will be implemented.

Challenges:
-To install adequate generation, transmission and distribution facilities to meet the demand reliably-To augment and diversify of fuel supply- Reduce dependancy on fast deplting gas-To secure adequate financing for power system expansion-To improve efficiency in the performance of the utilities and set adequate tariff to recover costs -To make the utilities financially viable


OPPORTUNITIES
Fast growing economy(6% GDP in 2008)
Lucrative incentive package: 100% investment and income repatriation
Huge potential for Solar Upcoming 2000 MW coal fired power
plant in the process..

Key actions required
Promote investment friendly environment
Create transparent bidding process Gas excavation initiative National energy policy Enhance renewable policy
Key actors involved
Ministry of Power Parliament Sub-Committee Domestic Private Banks Foreign financiers
Timeline:
Enact Energy Policy by Dec 2009 Arrange meeting with stakeholders by Dec 2009

Areas where assistance needed
Expert power project evaluation High level Government engagement Creation of a ministry of Renewable
Resources
Key contact
M.Mosharraf Hossain Bhuyian ndcAddl. Secretary: Economic Relations
Division..MoF Bangladesh

Thanks again!!
Bhutan Presentation

Background
Development Philosophy of ‘Gross National Happiness’ Bhutan has a population of approx 6,30,000 people with an
area of 38394 sq. km and follows Gross National Happiness (GNH) as its Development Policy
One of the four pillars of GNH is ‘Sustainable and Equitable Economic Development’.
Energy Sector plays a major role in Economic Development of Bhutan.
Hydropower/Green Energy is the main source of energy, with an installed capacity of 1500 MW and a target to install 10, 000 MWby 2020.
Another pillar of GNH is ‘Conservation of the Environment’ and Bhutan is focusing mainly on Green Energy

Endorsement of the Minutes of the 1st Board Audit Committee Meeting of BPC held on 7th August, 2008.
Rural Electrification Highlights1. CDM Project at Chendebji The e7 funded the 70 kW Chendebji Clean Development
Mechanism (CDM) Micro Hydropower Project in Bhutan in 2005 in order to contribute to the sustainable development of the un-electrified village and lighting up around 50 Households, a Health Unit and a school in Chendebji village. E7 facilitated the purchase of rice cookers and water boilers for each household in the village.
2. The project is handed over to the Local Community 3. Distribution of CFL light bulbs in Bumthang and Trongsa towns
by the power utility corporation.

Current Obstacles and Challenges
1. Financial Capacity No financial and execution capacity to carry out the major
projects (to achieve the target of 10, 000 MW by 2020). Require approx. 12 billion dollars but adequate fund not
available locally Projects are mainly executed bilaterally with India.
2. Sustainable Rural Electrification RE goal of providing electricity to all by 2013 Due to geographical conditions, it is too expensive and cost of
electrification per Household is approx. USD 5000.

Current Obstacles and Challenges
Transportation of heavy equipment (transformers) to remote sites
Tariff not sustainable for Rural Electrification- no affordability Rural Electrification in Bhutan not attractive to private
investors but could be attractive to e8, ADB since it would givea high ERR.
No Policies or laws for RE. Huge investment into the RE by the Power Utility (BPC) which
would be difficult gain back due to subsidized domestic tariffs. Therefore, not sustainable to BPC.
Subsidy element not very clear Huge costs involved in maintaining the large transmission
structure

Current Obstacles and Challenges
The national policy of preserving the environment also acts a constraint while carrying out RE.
Off-Grid energy (Solar) not preferred by consumers.3. Revenue from hydro export to India is nullified by the
expenditure in fossil fuel import. Huge dependence on fossil fuel import.
4. Deforestation due to RE works5. Threat of Glacial Lake Outburst Flood (GLOF) due to global
warming

Opportunities
Rural Electrification1. Positive Socio-economic Impact after completion of RE works2. Off-grid opportunities by Mini, Micro hydro and Solar energy3. CDM and Environment conservation4. Poverty alleviation in terms of improved health , education,
flourishing cottage industries. Remote villages will open up to tourism.
5. Encourage and promote Clean Industries (Tourism, ICT, Data Centers)
Hydro Sector1. Balance of Payment

Action Required
1. Draft Renewable Energy Policy to be adopted2. Energy Sector Policy to be adopted3. Feed-in tariff for off-grid to be adopted to encourage off-grid
opportunities4. Subsidy element to be phased out5. Capacity building at all levels (Village community, BPC, DOE)6. Protection of catchment area and GLOF

Timeline1. 40, 000 HHs to be electrified by 20132. Additional 10, 000 MW by 20203. Energy Policy by December 20094. Economic Development Policy by December 20095. Revised FDI policy for Indirect Investment by June 20106. Renewable Energy Policy - ?7. Subsidy phase out by 20138. Provide employment for 10, 000 Bhutanese over the next 12
years9. Maintain GDP rate at 8%-9%.10. Poverty alleviation- reduce to 27% by 201311. Diversification to Wind and Solar Energy – Plan to be put up by
2013

Timeline12. Completion of the East-West National Grid by 2012
Areas where Assistance is needed:1. Financing for RE2. Capacity Building-HR and technical, at different levels3. Setting up micro and mini hydro and off-grid projects4. Diversification into Renewable Energy such as Solar and
Wind

THANK YOU
Development of Geothermal Power Plan in Indonesia
Bangkok, 10 September2009

1
ELECTRICITY PROVISION STATUSELECTRICITY PROVISION STATUSELECTRICITY PROVISION STATUS
Electrification ratio: 65.1% and rural electrified ratio 92.2% Composition of primary energy for power generation
utilization:Geothermal
3%
Coal39%
Oil30%
Hydro8%
Gas20%
Electricity System: Interconnected system: Java-Madura-Bali and
Sumatera Island The rest is still isolated system
Growth rate of demand for electricity: 6.9% p.aand 9.2% p.a (projection for up to 2027)
Total installed capacity 30. 504 MW :PLN25.315 83%
IPP4.269 14%
PPU920 3%
MW MW
MW
2
0
100
200
300
400
500
600
700
800
900
Year
TWh
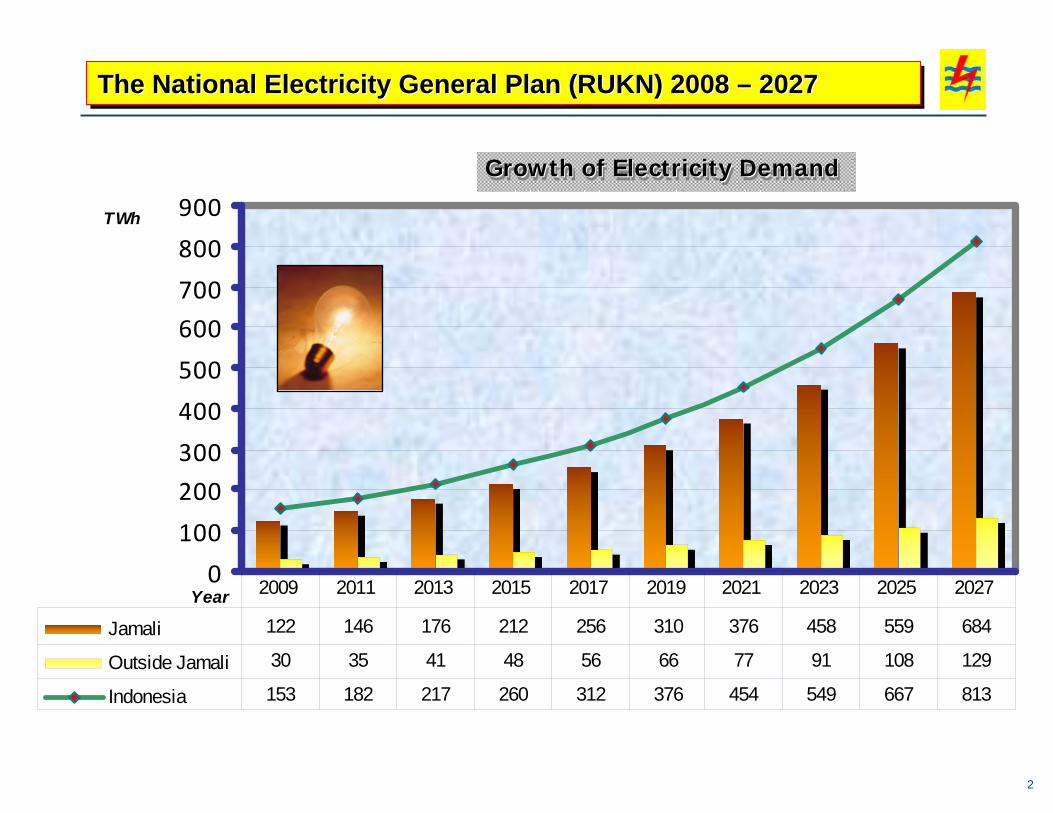
Jamali 122 146 176 212 256 310 376 458 559 684
Outside Jamali 30 35 41 48 56 66 77 91 108 129
Indonesia 153 182 217 260 312 376 454 549 667 813
2009 2011 2013 2015 2017 2019 2021 2023 2025 2027
Growth of Electricity DemandGrowth of Electricity DemandGrowth of Electricity Demand
The National Electricity General Plan (RUKN) 2008 – 2027The National Electricity General Plan (RUKN) 2008 The National Electricity General Plan (RUKN) 2008 –– 20272027
3
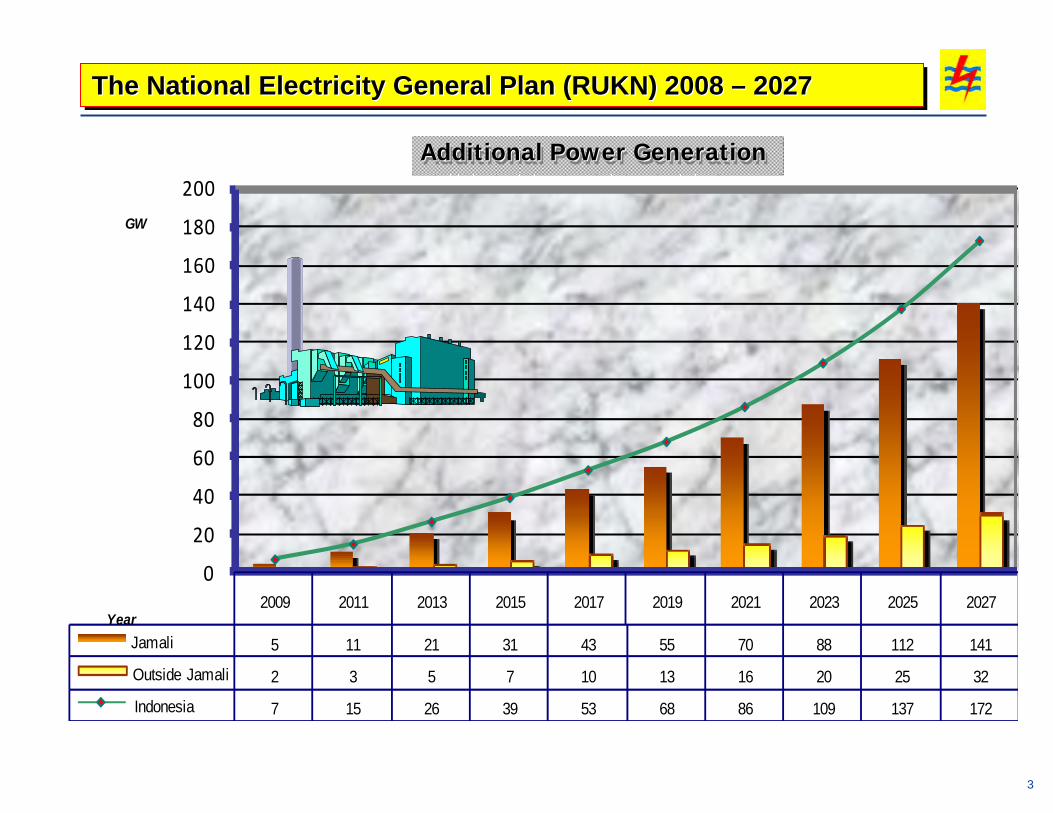
2009 2011 2013 2015 2017 2019 2021 2023 2025 2027
Jamali 5 11 21 31 43 55 70 88 112 141
Outside Jamali 2 3 5 7 10 13 16 20 25 32
Indonesia 7 15 26 39 53 68 86 109 137 172
0
20
40
60
80
100
120
140
160
180
200GW
Year
Additional Power GenerationAdditional Power GenerationAdditional Power Generation
The National Electricity General Plan (RUKN) 2008 – 2027The National Electricity General Plan (RUKN) 2008 The National Electricity General Plan (RUKN) 2008 –– 20272027

4
Fuel mix composition:
Action Plan Outline
Our target is to achieve 100% electrification ratio in 2020 and decrease cost of production
4
Increase of renewable power plant
Increase of coal-steam power plant
Reduce oil power plant
2007 2018
12% 18%
40 % 63 %
34 % 2 %
Change the fuel mix composition
Why Renewable is important ?1.Clean – green energy2.Resistance to the volatility of other global fuel price such as oil, natural gas and coal.3.Long term contract fuel supply.4.Indonesia has abundant resource of geothermal, which has not been exploited. The exploited Geothermal is 3% of total potencial geothermal energy. (27.140 MW)

5
We need of 7% to 9% electricity growth to boost the economic growth of 6% to 7%
Current Obstacles and challenges
It needs financial investment of about US$ 10 billions yearly.
Current Conditions in 2008, 40% of Company’s revenue was from Government Subsidies, meanwhile
Average of Retail Tariff is US$ 6.60 cent per kWh and the production cost is US$ 12 cents per kWh
due to huge CAPEX requirement, government is to invite the private sector to participate in electricity development.
Strong support and commitment from stake holder to boost the Renewable power project, especially Geothermal Power plant.

6
Central and Local GovernmentGovernment actives to promote the utilization of Geothermal Project, that can not be
exported.
Key Actors to be involved in Geothermal Power
Creditor and investor,There are many available fund for green power such as multilateral or bilateral fund.
PLNTo maximize the cheap and stable of energy price.
Private Many flexibilities and incentives are given from government such as Taxes
reduction (VAT) during constriction and government guarantee.

7
The development program of geothermal projects have been planned by Government with 4733 MW. The capacity of 4078 MW is allocated for IPP project until 2014 in the 2nd Phase of Fast Tract Program.
Timeline of Geothermal Development
The investment is estimated around USD 10 Billion or USD 2 Billion per annum.

8
Technical assistance on :
- Pricing Geothermal
- Risk assessments of geothermal project
- Financial Scheme which can attractive for IPP
Area where assistance is needed
Capacity building on Regulatory body:
- Central Government
- Regional Government
All the Technical assistance and capacity building is needed in year 2010

9
Thank you

1
Action Plan Outline for
Pakistan
E8E8--GEFGEF--UNDESAUNDESA--UNESCAPUNESCAPFinancing Sustainable ElectrificationFinancing Sustainable Electrification
South and SouthSouth and South--East Asia DialoguesEast Asia DialoguesBangkok, Thailand, September 8Bangkok, Thailand, September 8--10 200910 2009
September 10, 2009

2
Pakistan Power SectorPakistan Power Sector
MINISTRY OF WATER & POWER
WAPDA PEPCO PPIB
GOVERNMENT OF PAKISTAN
MegaDams
Water Projects
GENCOsGeneration Companies
DISCOsDistributionCompanies
NTDCNational Transmission & Dispatch Company
CHASHNUPP KANUPP
NEPRAPakistan AtomicEnergy
Commission
AEDB IPPsSPPsCPPs
PRIVATE SECTOR
KESC2
3
1. Private Power & Infrastructure Board2. Small Power Producer3. Captive Power Producer
1
3
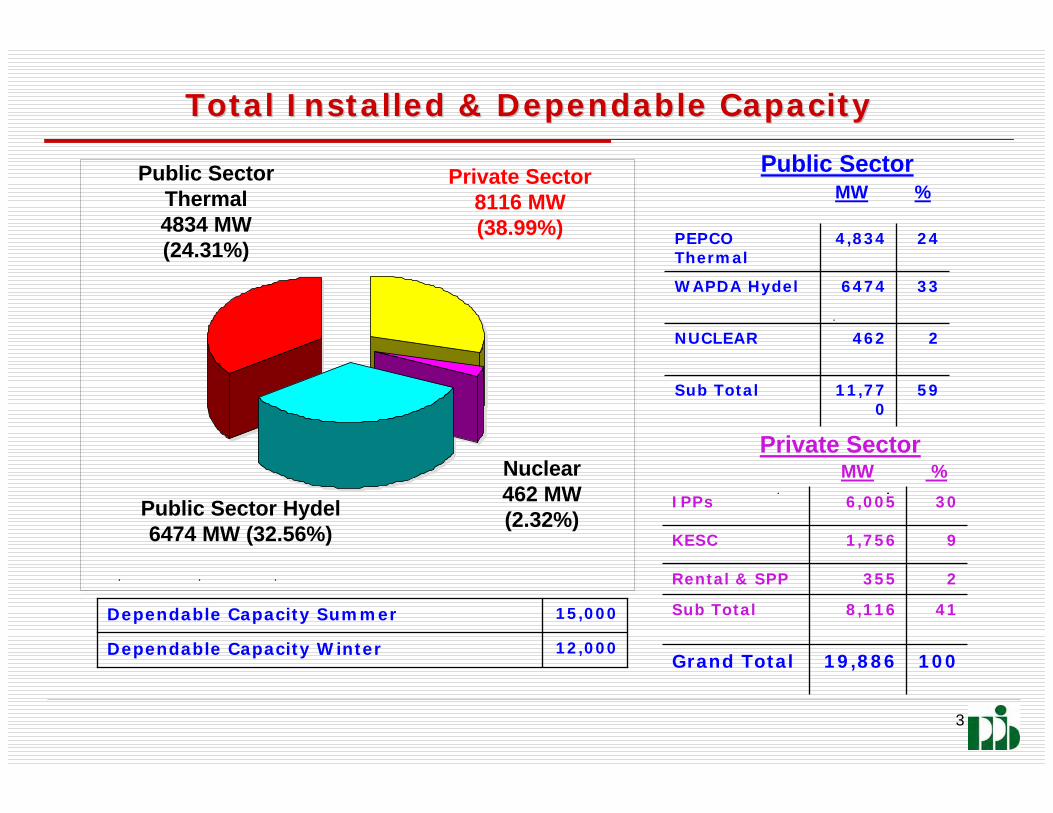
Private Sector8116 MW(38.99%)
Public SectorThermal4834 MW(24.31%)
Public Sector Hydel6474 MW (32.56%)
Nuclear462 MW(2.32%)
Total Installed & Dependable CapacityTotal Installed & Dependable Capacity
10019,886Grand Total
418,116Sub Total
2355Rental & SPP
91,756KESC
306,005IPPs
5911,770
Sub Total
2462NUCLEAR
336474WAPDA Hydel
244,834PEPCO Thermal
Public Sector
Private Sector
MW %
MW %
12,000Dependable Capacity Winter
15,000Dependable Capacity Summer

4
Peak Demand vs. Installed Capacity (2010 Peak Demand vs. Installed Capacity (2010 -- 2015)2015)
20000
30000
2009-10 2010-11 2011-12 2012-13 2013-14 2014-15
Years
MW
Peak DemandInstalled Capacity
21,840 M W
24,793 M W
27,002 M W
30,309 M W30,836 M W
32,636M W
24,474 M W
26,520 M W
28,683 M W
30,944 M W
33,394 M W
36,217 M W

5
Power Sector OverviewPower Sector Overview
Historically, Water & Power Development Authority (WAPDA), and Karachi Electric Supply Company (KESC), were fully-owned by GOP and served the entire country
KESC was privatised in 2005 by selling 74% interest of the Government to a consortium of private investors
WAPDA and KESC systems are interconnected through 500 KV and 220KV transmission lines for power interchange
National Electric Power Regulatory Authority (NEPRA) was established in 1997 as a statutory, independent regulatory body with power and functions to grant licenses, determine tariffs, prescribe rules, procedures, standards etc.
Pakistan Electric Power Company (PEPC0) was established in 1992 to carry forward reforms in the power sector
As a result, 4 Generation Companies (GENCOs), 1 National Transmission & Dispatch Company (NTDC) and 9 Distribution Companies (DISCOs) were formed
6
Power Sector Overview Power Sector Overview (contd..)(contd..)
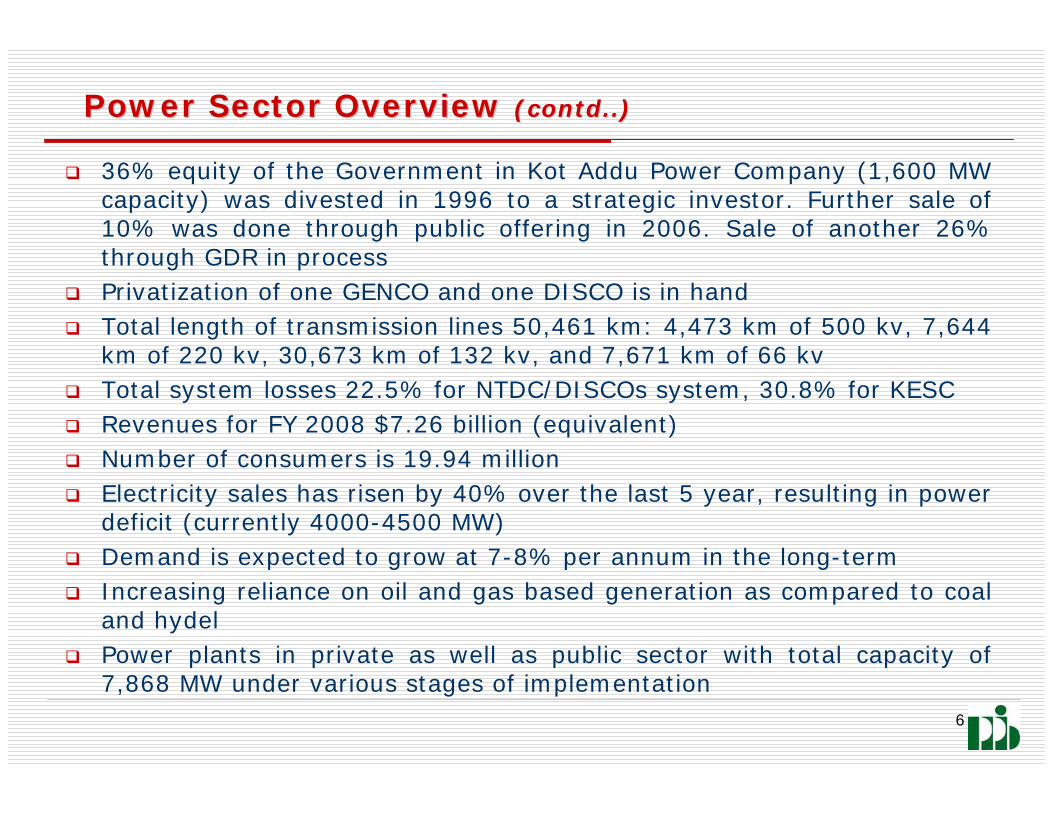
36% equity of the Government in Kot Addu Power Company (1,600 MW capacity) was divested in 1996 to a strategic investor. Further sale of 10% was done through public offering in 2006. Sale of another 26% through GDR in process
Privatization of one GENCO and one DISCO is in hand Total length of transmission lines 50,461 km: 4,473 km of 500 kv, 7,644
km of 220 kv, 30,673 km of 132 kv, and 7,671 km of 66 kv Total system losses 22.5% for NTDC/DISCOs system, 30.8% for KESC Revenues for FY 2008 $7.26 billion (equivalent) Number of consumers is 19.94 million Electricity sales has risen by 40% over the last 5 year, resulting in power
deficit (currently 4000-4500 MW) Demand is expected to grow at 7-8% per annum in the long-term Increasing reliance on oil and gas based generation as compared to coal
and hydel Power plants in private as well as public sector with total capacity of
7,868 MW under various stages of implementation
7
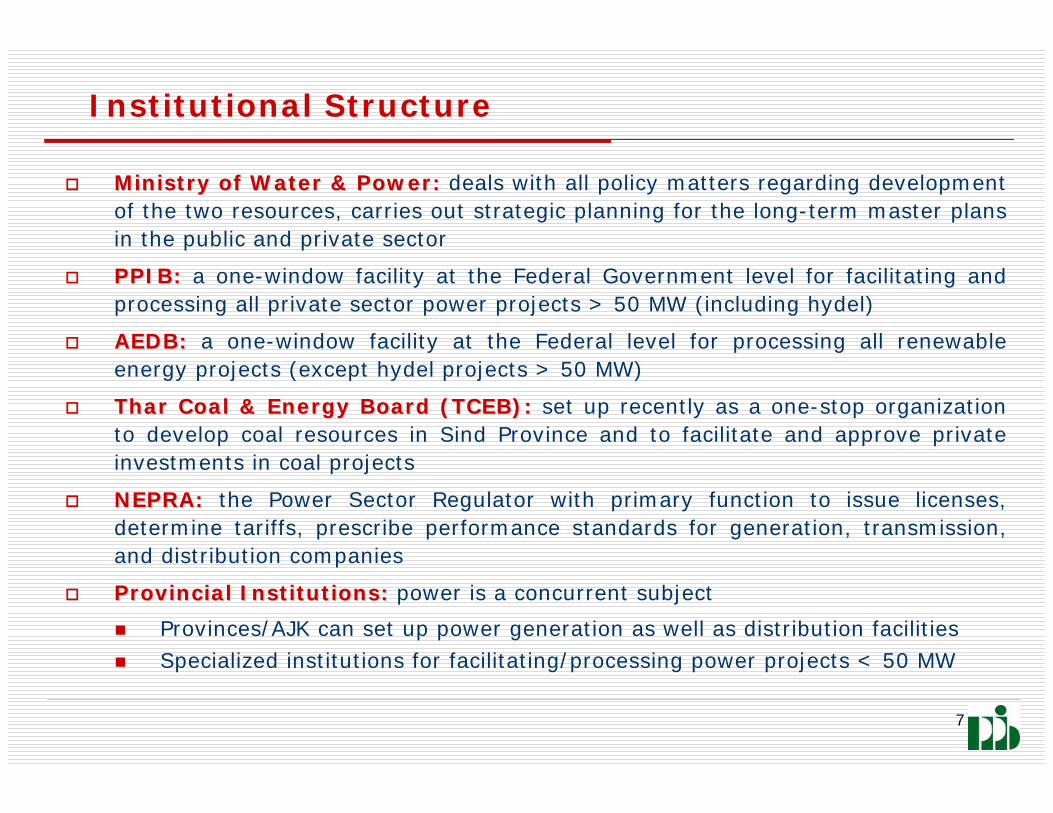
Ministry of Water & Power: Ministry of Water & Power: deals with all policy matters regarding development of the two resources, carries out strategic planning for the long-term master plans in the public and private sector
PPIB:PPIB: a one-window facility at the Federal Government level for facilitating and processing all private sector power projects > 50 MW (including hydel)
AEDB:AEDB: a one-window facility at the Federal level for processing all renewable energy projects (except hydel projects > 50 MW)
TharThar Coal & Energy Board (TCEB):Coal & Energy Board (TCEB): set up recently as a one-stop organization to develop coal resources in Sind Province and to facilitate and approve private investments in coal projects
NEPRA:NEPRA: the Power Sector Regulator with primary function to issue licenses, determine tariffs, prescribe performance standards for generation, transmission, and distribution companies
Provincial Institutions:Provincial Institutions: power is a concurrent subject
Provinces/AJK can set up power generation as well as distribution facilities Specialized institutions for facilitating/processing power projects < 50 MW
Institutional Structure
8
LendersLenders
PPIB PowerPowerPurchaserPurchaser
SponsorsSponsorsInvestorsInvestors ConsultantsConsultants
SindSind Coal Coal Authority / othersAuthority / others
GOPGOP(Ministries / Divisions)(Ministries / Divisions)
Fuel SupplierFuel Supplier(e.g. OGDC, SSGC)(e.g. OGDC, SSGC)
Provinces/Provinces/AJKAJK
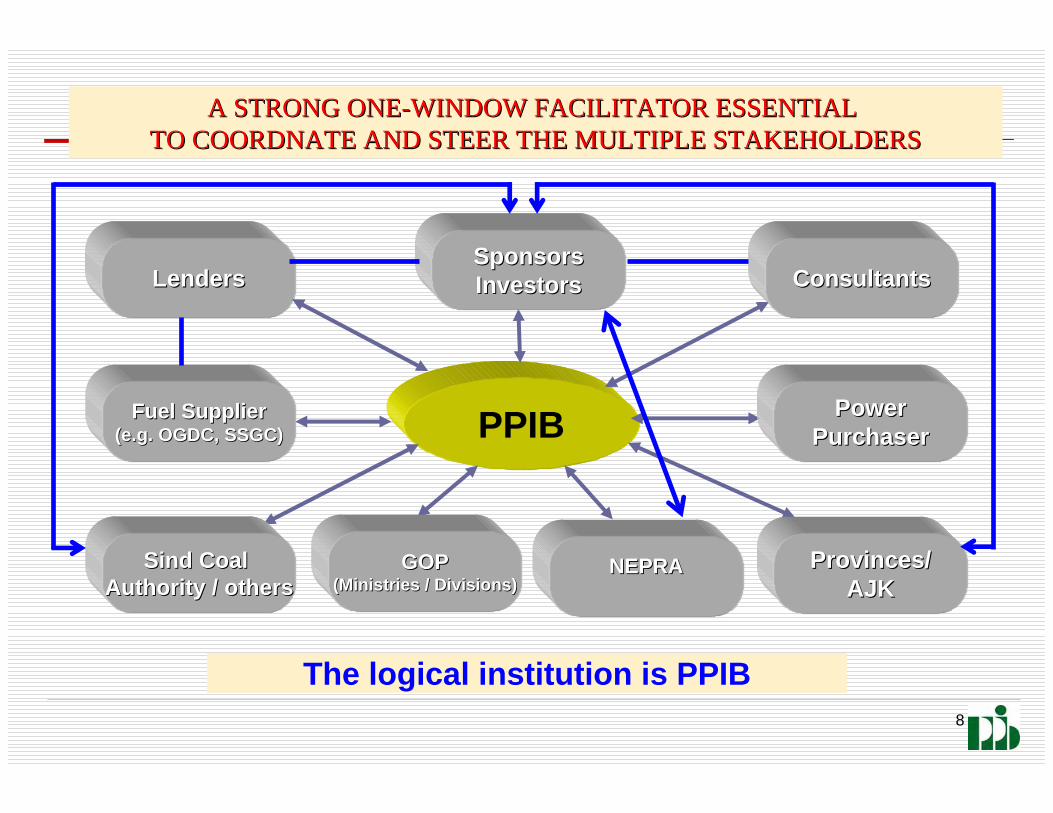
A STRONG ONEA STRONG ONE--WINDOW FACILITATOR ESSENTIAL WINDOW FACILITATOR ESSENTIAL TO COORDNATE AND STEER THE MULTIPLE STAKEHOLDERSTO COORDNATE AND STEER THE MULTIPLE STAKEHOLDERS
The logical institution is PPIB
NEPRANEPRA

9
Established in 1994 as a oneEstablished in 1994 as a one--window facilitator to promote private window facilitator to promote private investment in power sectorinvestment in power sector
15 new projects commissioned with total capacity of 4300 MW duri15 new projects commissioned with total capacity of 4300 MW during 90sng 90s
Succeeded in attracting US$ 4.5 Billion of FDI & elimination of Succeeded in attracting US$ 4.5 Billion of FDI & elimination of load sheddingload shedding
Attracted worldAttracted world--leading energy players to Pakistanleading energy players to Pakistan’’s Private Power Sectors Private Power Sector
Successfully negotiated, executed and administered longSuccessfully negotiated, executed and administered long--term concession term concession agreements such as IA, PPA and agreements such as IA, PPA and FSAsFSAs with with IPPsIPPs
Bulk of financing was foreign through multiBulk of financing was foreign through multi--lateral lending agencieslateral lending agencies
2002 Power Policy for Power Generation Projects:2002 Power Policy for Power Generation Projects:
Contracts signed for 2500 MW with Commissioning Dates till 2010 Contracts signed for 2500 MW with Commissioning Dates till 2010
Financial Close achieved for 12 thermal projects: Total CapacityFinancial Close achieved for 12 thermal projects: Total Capacity 2400 MW, 2400 MW, Approx. Investment US$ 2.5 BillionApprox. Investment US$ 2.5 Billion
Bulk of Financing has been provided by local banksBulk of Financing has been provided by local banks
Private Power & Infrastructure Board (PPIB)Private Power & Infrastructure Board (PPIB)
10
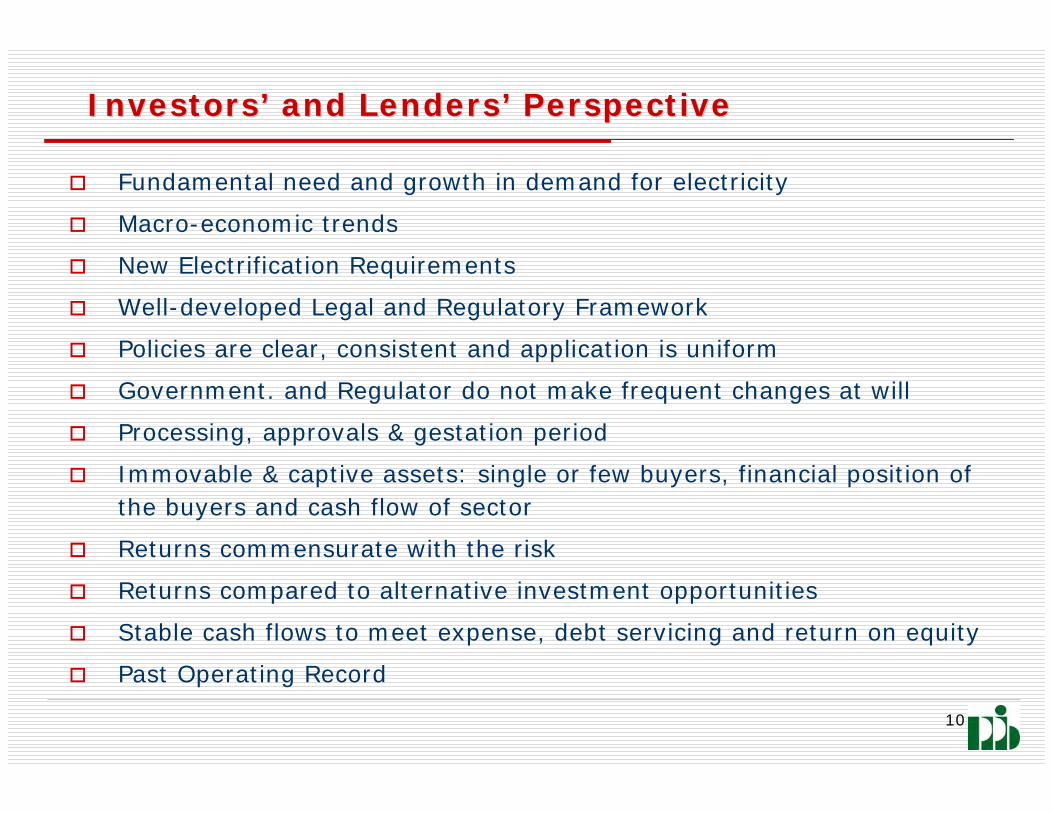
Fundamental need and growth in demand for electricity
Macro-economic trends
New Electrification Requirements
Well-developed Legal and Regulatory Framework
Policies are clear, consistent and application is uniform
Government. and Regulator do not make frequent changes at will
Processing, approvals & gestation period
Immovable & captive assets: single or few buyers, financial position of the buyers and cash flow of sector
Returns commensurate with the risk
Returns compared to alternative investment opportunities
Stable cash flows to meet expense, debt servicing and return on equity
Past Operating Record
InvestorsInvestors’’ and Lendersand Lenders’’ PerspectivePerspective
11
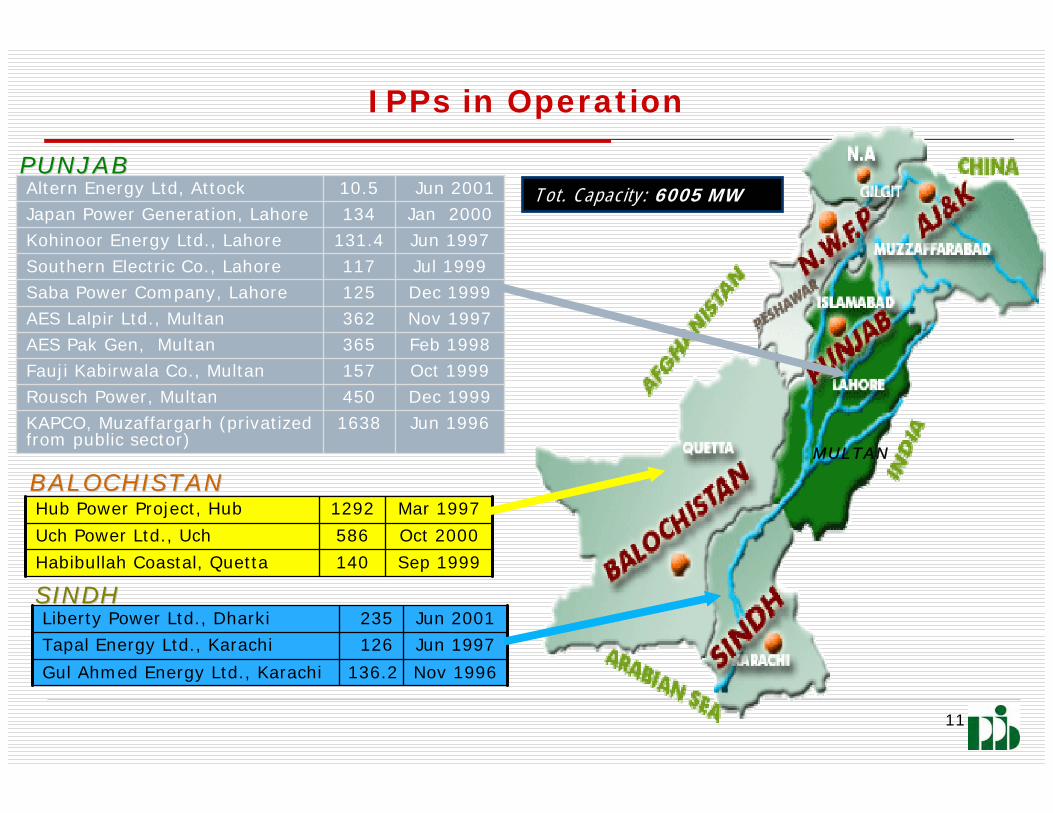
IPPs in Operation
Jun 19961638KAPCO, Muzaffargarh (privatized from public sector)
Dec 1999450Rousch Power, MultanOct 1999157Fauji Kabirwala Co., MultanFeb 1998365AES Pak Gen, MultanNov 1997362AES Lalpir Ltd., Multan
Jun 200110.5Altern Energy Ltd, Attock
Dec 1999125Saba Power Company, LahoreJul 1999117Southern Electric Co., LahoreJun 1997131.4Kohinoor Energy Ltd., LahoreJan 2000134Japan Power Generation, Lahore
Mar 19971292Hub Power Project, Hub
Sep 1999140Habibullah Coastal, Quetta
Oct 2000586Uch Power Ltd., Uch
Nov 1996136.2Gul Ahmed Energy Ltd., Karachi
Jun 1997126Tapal Energy Ltd., Karachi
Jun 2001235Liberty Power Ltd., Dharki
MULTAN
PUNJABPUNJAB
BALOCHISTANBALOCHISTAN
SINDHSINDH
Tot. Capacity: 6005 MW

12
InvestorInvestor--Friendly PolicyFriendly Policy

13
Fiscal ConcessionsFiscal Concessions
5% concessionary Import Duty on plant & equipment not manufactur5% concessionary Import Duty on plant & equipment not manufactured ed
locallylocally
No levy of sales tax on such plant, machinery and equipmentNo levy of sales tax on such plant, machinery and equipment
Inflation indexation on O&M costsInflation indexation on O&M costs
Tariff adjustments for variation in currency exchange ratesTariff adjustments for variation in currency exchange rates
Exemption from corporate income tax, turnover tax and withholdinExemption from corporate income tax, turnover tax and withholding tax g tax
Government ensures conversion of Pak Rupee & remittance of foreiGovernment ensures conversion of Pak Rupee & remittance of foreign gn
exchange for projectexchange for project--related paymentsrelated payments

14
GOP guarantees obligations of power purchaser and provincesGOP guarantees obligations of power purchaser and provinces
Capacity Payments to cover fixed costs including debt servicing Capacity Payments to cover fixed costs including debt servicing and return and return
on equity, independent of project dispatchon equity, independent of project dispatch
Power Purchaser will bear hydrological risk for hydropower projePower Purchaser will bear hydrological risk for hydropower projectscts
Continuity of Payments in case of Political Force MajeureContinuity of Payments in case of Political Force Majeure
PassPass--through of additional taxes or costs incurred due to change in lthrough of additional taxes or costs incurred due to change in lawaw
Tariff adjustment for changes in interest rates benchmarks (LIBOTariff adjustment for changes in interest rates benchmarks (LIBOR/KIBOR)R/KIBOR)
Payment of compensation in case of termination due to GOP defaulPayment of compensation in case of termination due to GOP default t
Balanced risk profile for investors, lenders & government agenciBalanced risk profile for investors, lenders & government agencieses
Payments SecurityPayments Security

15
Commercial Structure for IPPsCommercial Structure for IPPs
LongLong--Term Security Package including Implementation and Power Term Security Package including Implementation and Power Purchase Agreements and Water Usage license (for Purchase Agreements and Water Usage license (for HydelHydel Projects)Projects)
MultiMulti--year / longyear / long--term tariff term tariff –– Approved by RegulatorApproved by Regulator
Reasonable Return on Equity allowed by Regulator Reasonable Return on Equity allowed by Regulator –– 15% in US$15% in US$
Up to 50 years Concession Period for Hydel PlantsUp to 50 years Concession Period for Hydel Plants
100% foreign ownership allowed100% foreign ownership allowed
Minimum 20% equity contribution requirementsMinimum 20% equity contribution requirements
Sponsor can divest equity after six yearsSponsor can divest equity after six years
‘‘HydelHydel’’ projects on BOOT basisprojects on BOOT basis
‘‘ThermalThermal’’ projects on BOO basisprojects on BOO basis
Power Purchaser will be responsible for power transmission facilPower Purchaser will be responsible for power transmission facilitiesities
16
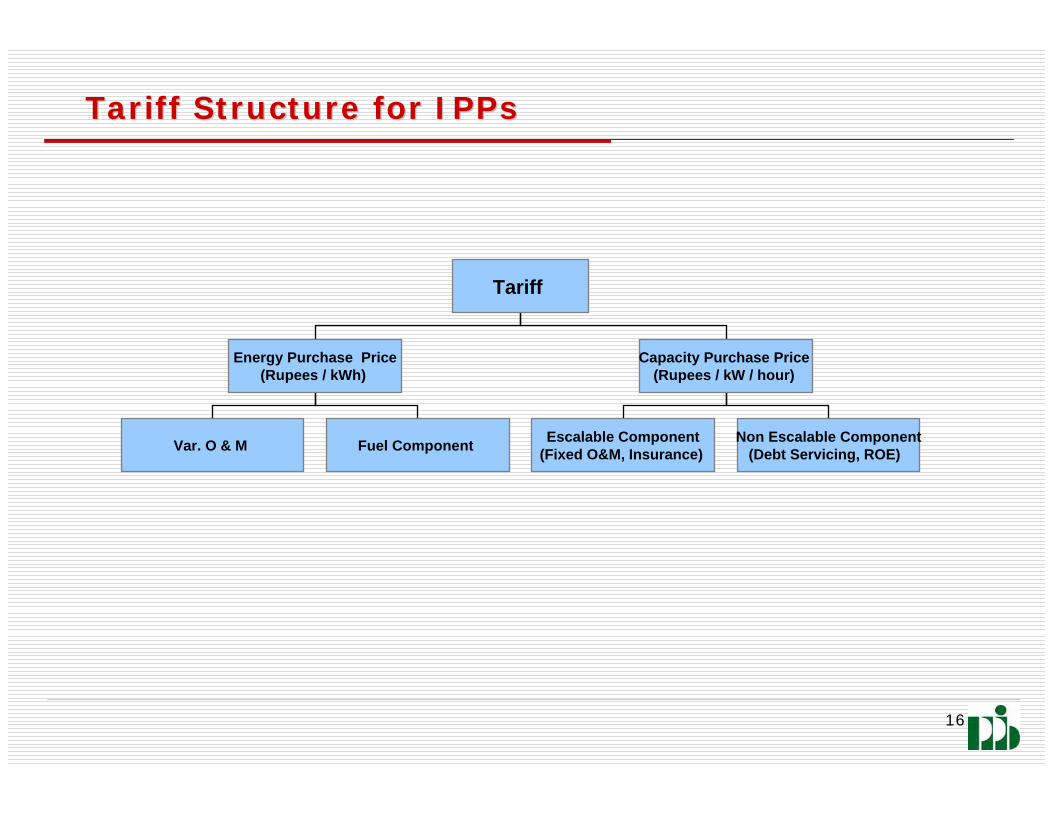
Tariff Structure for IPPs Tariff Structure for IPPs
Tariff
Energy Purchase Price(Rupees / kWh)
Capacity Purchase Price (Rupees / kW / hour)
Var. O & M Fuel Component Escalable Component(Fixed O&M, Insurance)
Non Escalable Component(Debt Servicing, ROE)
17
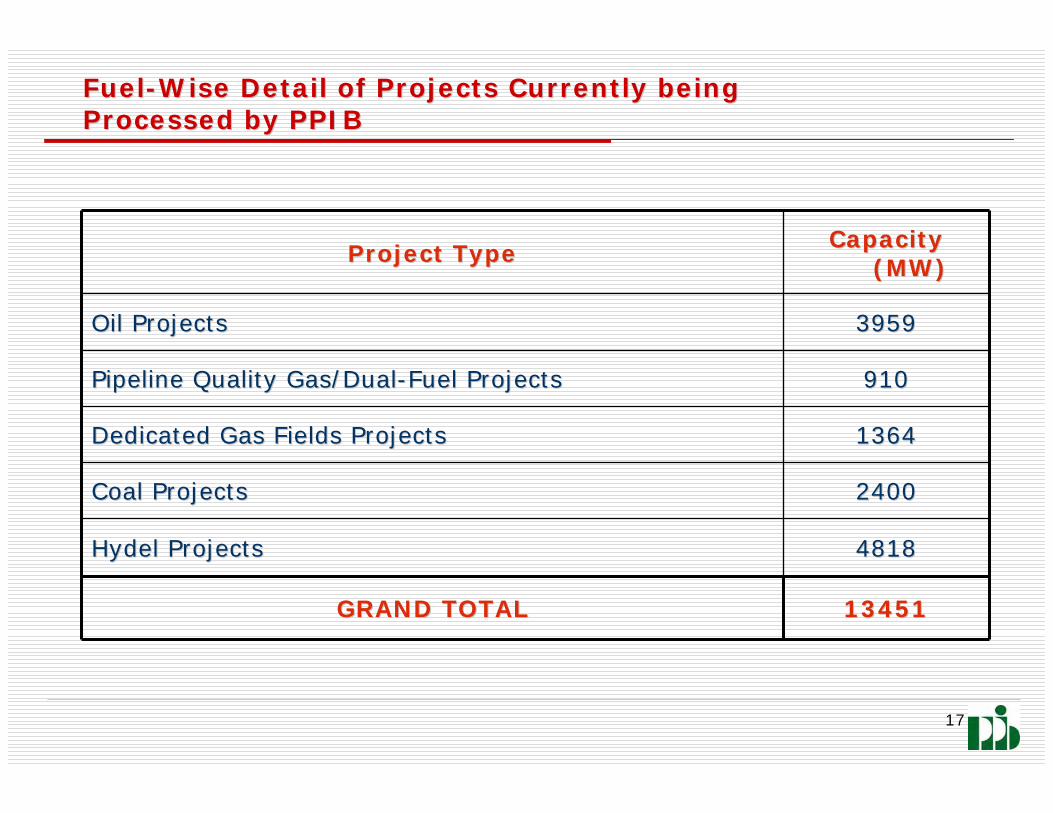
FuelFuel--Wise Detail of Projects Currently being Wise Detail of Projects Currently being Processed by PPIBProcessed by PPIB
1345113451GRAND TOTALGRAND TOTAL
48184818HydelHydel ProjectsProjects
24002400Coal ProjectsCoal Projects
13641364Dedicated Gas Fields ProjectsDedicated Gas Fields Projects
910910Pipeline Quality Gas/DualPipeline Quality Gas/Dual--Fuel ProjectsFuel Projects
39593959Oil ProjectsOil Projects
Capacity Capacity (MW)(MW)Project TypeProject Type
18
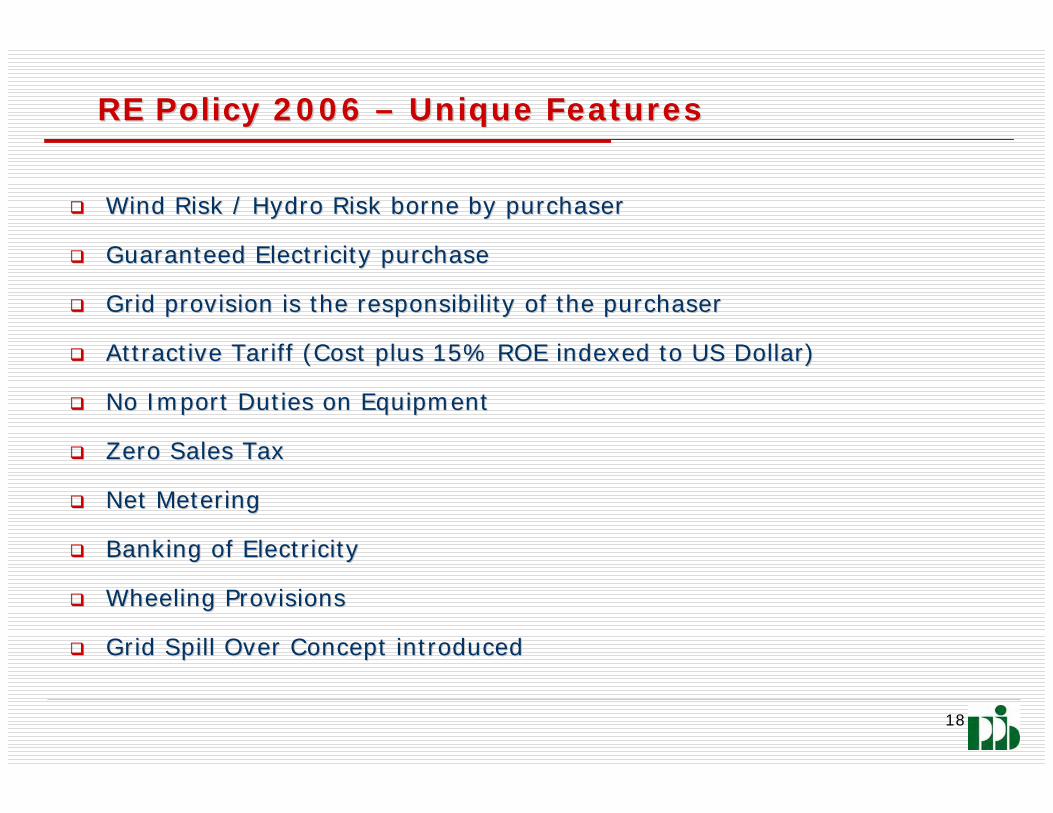
RE Policy 2006 RE Policy 2006 –– Unique FeaturesUnique Features
Wind Risk / Hydro Risk borne by purchaserWind Risk / Hydro Risk borne by purchaser
Guaranteed Electricity purchaseGuaranteed Electricity purchase
Grid provision is the responsibility of the purchaserGrid provision is the responsibility of the purchaser
Attractive Tariff (Cost plus 15% ROE indexed to US Dollar)Attractive Tariff (Cost plus 15% ROE indexed to US Dollar)
No Import Duties on EquipmentNo Import Duties on Equipment
Zero Sales TaxZero Sales Tax
Net MeteringNet Metering
Banking of ElectricityBanking of Electricity
Wheeling ProvisionsWheeling Provisions
Grid Spill Over Concept introducedGrid Spill Over Concept introduced
19
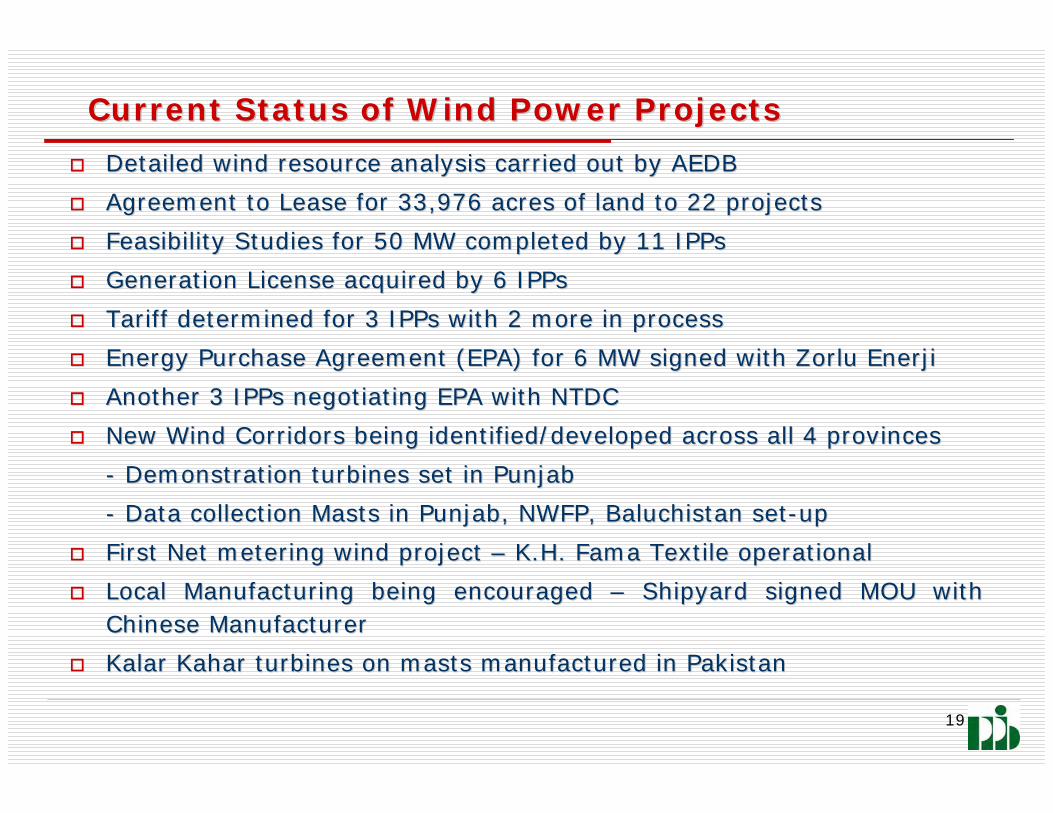
Current Status of Wind Power ProjectsCurrent Status of Wind Power Projects
Detailed wind resource analysis carried out by AEDBDetailed wind resource analysis carried out by AEDB
Agreement to Lease for 33,976 acres of land to 22 projectsAgreement to Lease for 33,976 acres of land to 22 projects
Feasibility Studies for 50 MW completed by 11 Feasibility Studies for 50 MW completed by 11 IPPsIPPs
Generation License acquired by 6 Generation License acquired by 6 IPPsIPPs
Tariff determined for 3 Tariff determined for 3 IPPsIPPs with 2 more in process with 2 more in process
Energy Purchase Agreement (EPA) for 6 MW signed with Energy Purchase Agreement (EPA) for 6 MW signed with ZorluZorlu EnerjiEnerji
Another 3 Another 3 IPPsIPPs negotiating EPA with NTDCnegotiating EPA with NTDC
New Wind Corridors being identified/developed across all 4 proviNew Wind Corridors being identified/developed across all 4 provincesnces
-- Demonstration turbines set in PunjabDemonstration turbines set in Punjab
-- Data collection Masts in Punjab, NWFP, Baluchistan setData collection Masts in Punjab, NWFP, Baluchistan set--upup
First Net metering wind project First Net metering wind project –– K.H. K.H. FamaFama Textile operational Textile operational
Local Manufacturing being encouraged Local Manufacturing being encouraged –– Shipyard signed MOU with Shipyard signed MOU with Chinese ManufacturerChinese Manufacturer
KalarKalar KaharKahar turbines on masts manufactured in Pakistanturbines on masts manufactured in Pakistan

20
Current Status of Small HydelsCurrent Status of Small Hydels
10 10 HydelHydel plants (110 MW) in public sector to become operational in 2012 plants (110 MW) in public sector to become operational in 2012 with ADB Funding (Punjabwith ADB Funding (Punjab--5, NWFP 5, NWFP --5 & NA5 & NA--2)2)
Detailed feasibility for 12 Detailed feasibility for 12 HydelHydel plants (187 MW) prepared and under plants (187 MW) prepared and under reviewreview
Tariff application for 40 MW project at C.J. Link Tail, Punjab fTariff application for 40 MW project at C.J. Link Tail, Punjab filed with iled with NEPRANEPRA
First First HydelHydel PPA (1 MW) signed between PESCO and Blue Star EnergyPPA (1 MW) signed between PESCO and Blue Star Energy
Feasibility Studies for additional 43 Small Feasibility Studies for additional 43 Small HydelHydel plants being initiated with plants being initiated with assistance from GTZ and ADBassistance from GTZ and ADB
102 micro 102 micro hydelhydel projects (15 MW) initiated in NA with AKF / UNDPprojects (15 MW) initiated in NA with AKF / UNDP--GEF GEF collaborationcollaboration

21
Regulatory FrameworkRegulatory Framework
National Electric Power Regulatory Authority (NEPRA) establishedNational Electric Power Regulatory Authority (NEPRA) established in 1997 as in 1997 as an independent an independent ““regulatory bodyregulatory body”” empowered to grant licenses, determine empowered to grant licenses, determine tariffs, prescribe rules/procedures/standards for Generation / Ttariffs, prescribe rules/procedures/standards for Generation / T&D entities&D entities
In performing its various functions, NEPRA endeavors to maintainIn performing its various functions, NEPRA endeavors to maintain a balance a balance between the interests of consumers and power companiesbetween the interests of consumers and power companies
Tariff Rules, Standard Grid Code, Generation/Distribution LicensTariff Rules, Standard Grid Code, Generation/Distribution Licensing Rules, ing Rules, Performance Standards for Generation / T&D Performance Standards for Generation / T&D –– already in placealready in place
UniformUniform Accounting StandardsAccounting Standards developed for power companiesdeveloped for power companies
NEPRA is setting tariff for power generation plants (including NEPRA is setting tariff for power generation plants (including IPPsIPPs), ), transmission and distribution companiestransmission and distribution companies
ConsumerConsumer--end tariffs are determined by NEPRA, while end tariffs are determined by NEPRA, while GoPGoP notifies these notifies these tariffs keeping provision of subsidies by the government tariffs keeping provision of subsidies by the government
Tariff Determination MechanismTariff Determination Mechanism for Hydropower projects has been developed for Hydropower projects has been developed for reducing risk and uncertainties for private investorsfor reducing risk and uncertainties for private investors

22
Sector Governance and AchievementsSector Governance and Achievements
Government commitment and consistent Policies to encourage privaGovernment commitment and consistent Policies to encourage private te
sector led growth of economy in all sectorssector led growth of economy in all sectors
Pakistan Pakistan –– today an established destination for private investments in today an established destination for private investments in
power sectorpower sector
Approximately 40% generation capacity in private sectorApproximately 40% generation capacity in private sector
Major international power companies currently operating in PakisMajor international power companies currently operating in Pakistantan
Reform of power sector through restructuring /deregulation /privReform of power sector through restructuring /deregulation /privatization atization
is well underwayis well underway
1638 MW KAPCO Power Plant privatized in 19961638 MW KAPCO Power Plant privatized in 1996
23
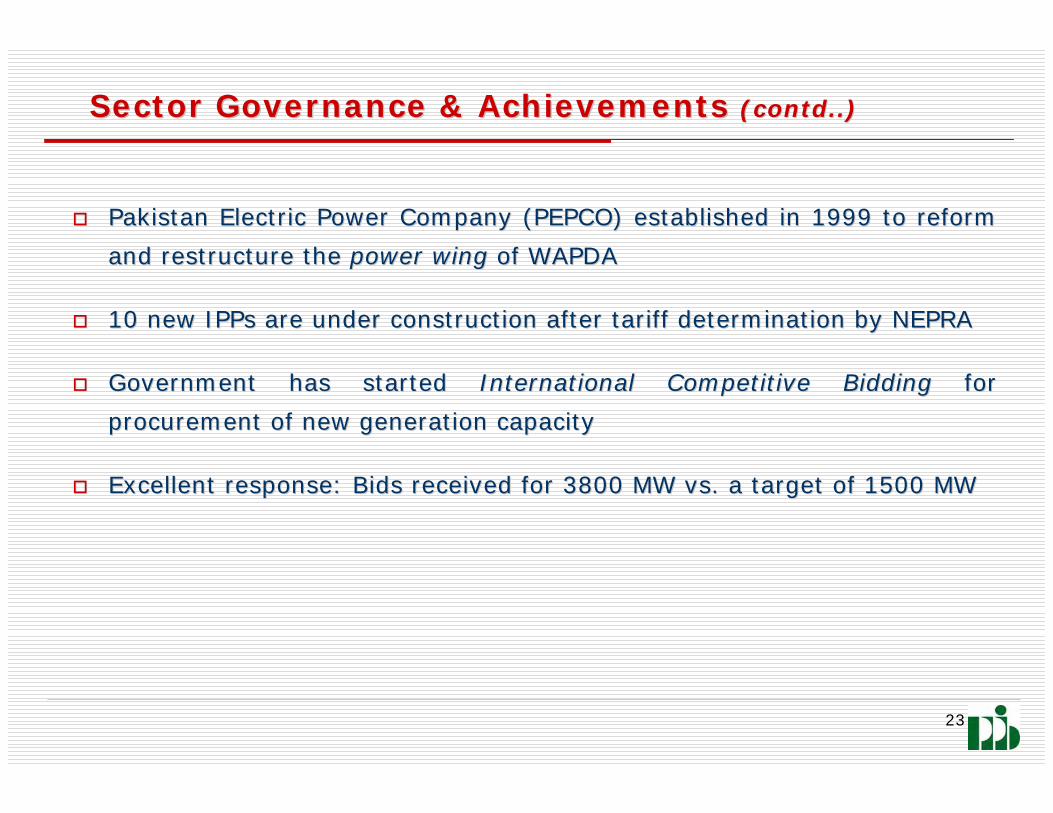
Sector Governance & Achievements Sector Governance & Achievements (contd..)(contd..)
Pakistan Electric Power Company (PEPCO) established in 1999 to rPakistan Electric Power Company (PEPCO) established in 1999 to reform eform
and restructure the and restructure the power wingpower wing of WAPDAof WAPDA
10 new 10 new IPPsIPPs are under construction after tariff determination by NEPRAare under construction after tariff determination by NEPRA
Government has started Government has started International Competitive BiddingInternational Competitive Bidding for for
procurement of new generation capacityprocurement of new generation capacity
Excellent response: Bids received for 3800 MW vs. a target of 15Excellent response: Bids received for 3800 MW vs. a target of 1500 MW00 MW
24
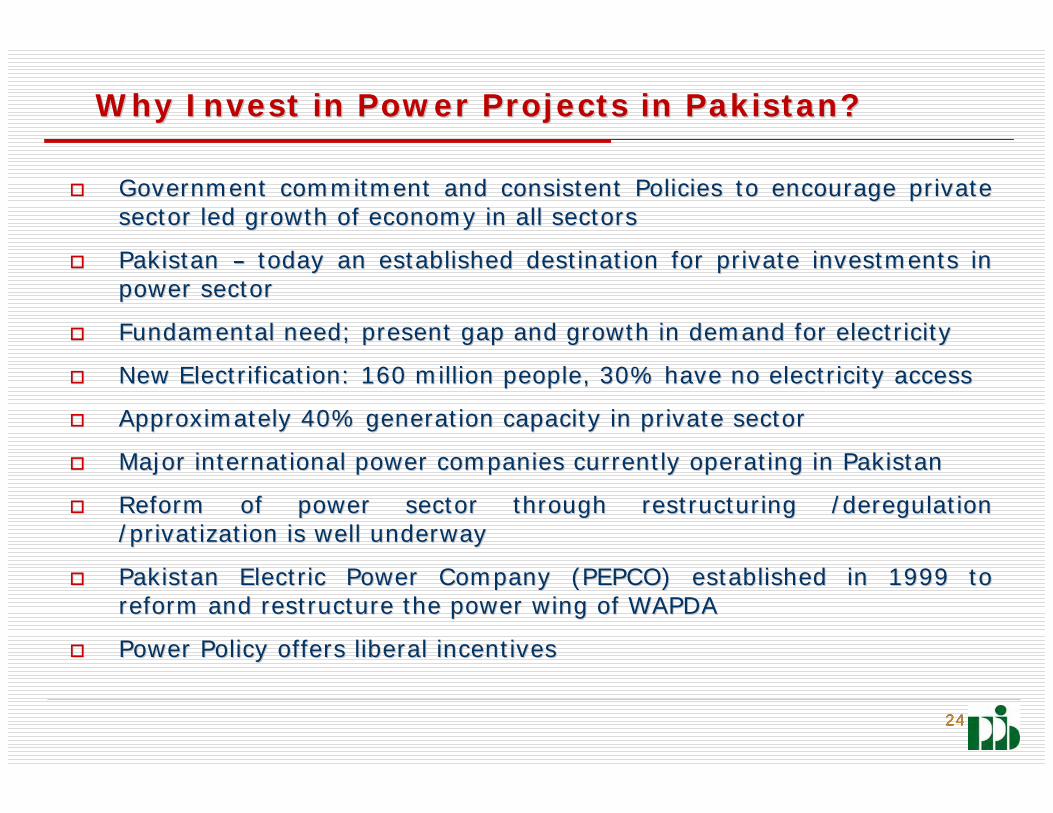
Why Invest in Power Projects in Pakistan?Why Invest in Power Projects in Pakistan?
Government commitment and consistent Policies to encourage privaGovernment commitment and consistent Policies to encourage private te sector led growth of economy in all sectorssector led growth of economy in all sectors
Pakistan Pakistan –– today an established destination for private investments in today an established destination for private investments in power sectorpower sector
Fundamental need; present gap and growth in demand for electriciFundamental need; present gap and growth in demand for electricityty
New Electrification: 160 million people, 30% have no electricityNew Electrification: 160 million people, 30% have no electricity accessaccess
Approximately 40% generation capacity in private sectorApproximately 40% generation capacity in private sector
Major international power companies currently operating in PakisMajor international power companies currently operating in Pakistantan
Reform of power sector through restructuring /deregulation Reform of power sector through restructuring /deregulation /privatization is well underway/privatization is well underway
Pakistan Electric Power Company (PEPCO) established in 1999 to Pakistan Electric Power Company (PEPCO) established in 1999 to reform and restructure the power wing of WAPDAreform and restructure the power wing of WAPDA
Power Policy offers liberal incentivesPower Policy offers liberal incentives
24
2525
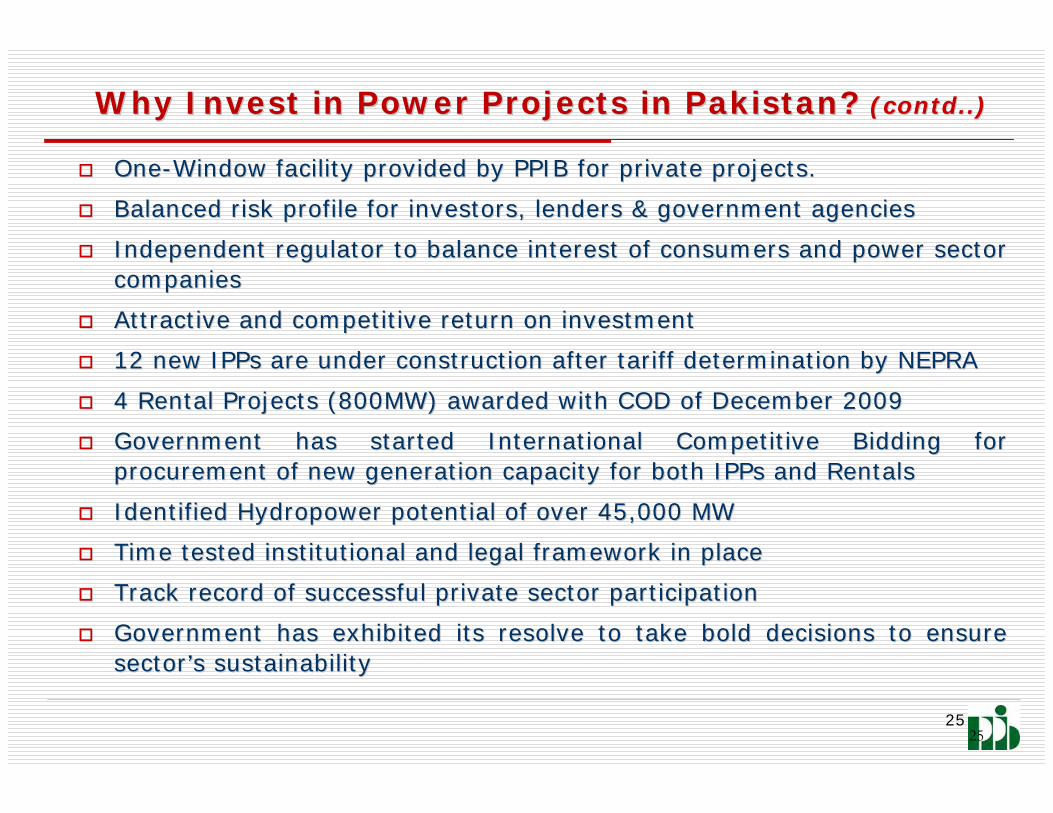
OneOne--Window facility provided by PPIB for private projects.Window facility provided by PPIB for private projects.
Balanced risk profile for investors, lenders & government agenciBalanced risk profile for investors, lenders & government agencieses
Independent regulator to balance interest of consumers and powerIndependent regulator to balance interest of consumers and power sector sector companiescompanies
Attractive and competitive return on investmentAttractive and competitive return on investment
12 new 12 new IPPsIPPs are under construction after tariff determination by NEPRAare under construction after tariff determination by NEPRA
4 Rental Projects (800MW) awarded with COD of December 20094 Rental Projects (800MW) awarded with COD of December 2009
Government has started International Competitive Bidding for Government has started International Competitive Bidding for procurement of new generation capacity for both procurement of new generation capacity for both IPPsIPPs and Rentalsand Rentals
Identified Hydropower potential of over 45,000 MWIdentified Hydropower potential of over 45,000 MW
Time tested institutional and legal framework in placeTime tested institutional and legal framework in place
Track record of successful private sector participationTrack record of successful private sector participation
Government has exhibited its resolve to take bold decisions to eGovernment has exhibited its resolve to take bold decisions to ensure nsure sectorsector’’s sustainabilitys sustainability
Why Invest in Power Projects in Pakistan? Why Invest in Power Projects in Pakistan? (contd..)(contd..)
26
THATTA
LARKANA SUKHAR
KHAIRPUR
DADU
THAR
SHIKARPURGHOTKI
HYDRABAD
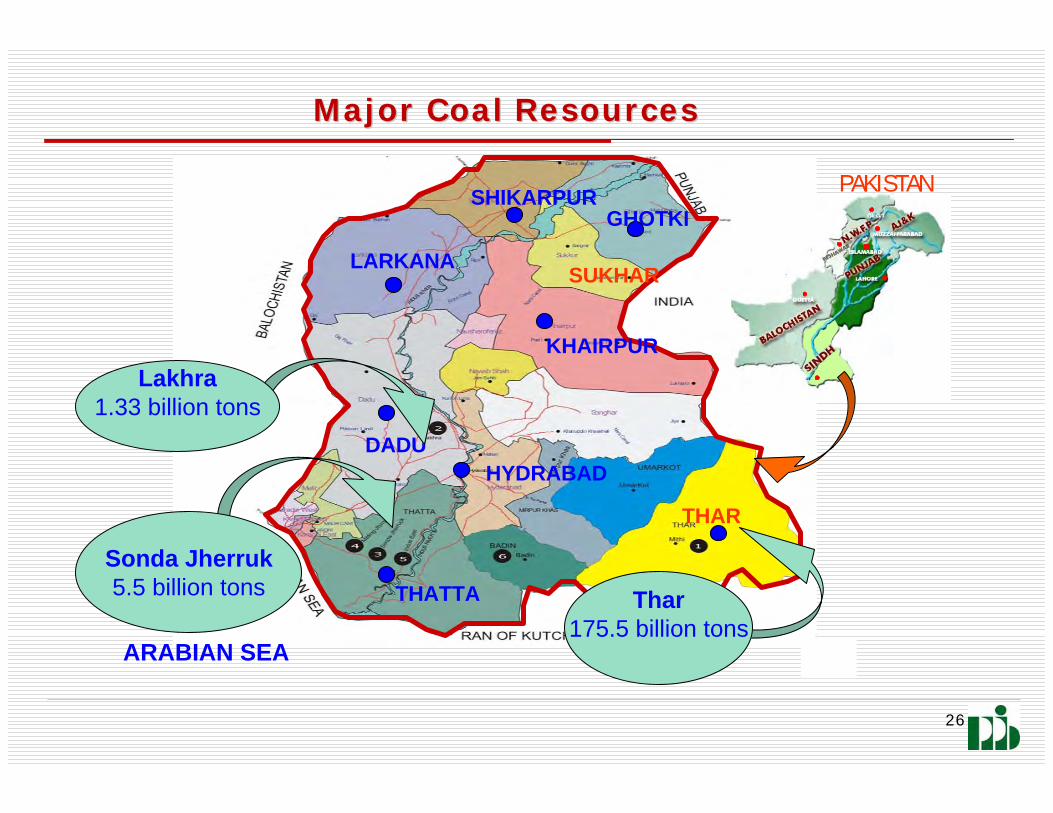
Major Coal ResourcesMajor Coal Resources
Lakhra1.33 billion tons
Sonda Jherruk5.5 billion tons Thar
175.5 billion tonsARABIAN SEA
PAKISTAN

27
Demand supply gap of 2,500-3,500 MW to be bridged immediately
Average generation expansion of around 2000 MW/year for next few years (growth rate 8+% p.a.) in addition to meeting the current gap
Investment of US$ 2.5-3 Billion per year for the next 8-10 years
1-2 large multipurpose Hydropower projects are needed for both irrigation and power needs with investment of over US$ 2 Billion each
1.5-2 Billion per year for transmission & distribution network expansion
Fast depleting gas resources – New generation on oil which is very expensive, Optimal fuel-mix to be worked out due to increasing oil prices
Maximum use of local hydropower resources – identified potential of 45,000 MW only 6,000 MW exploited so far
Reduction in Transmission & Distribution losses (present 23%)
Huge Government subsidies – US$ 2.2 Billion provided to utility companies to overcome gap in revenues
Current Obstacles and ChallengesCurrent Obstacles and Challenges
28
Measures to Overcome the ChallengesMeasures to Overcome the Challenges
A well defined, investor friendly, transparent & consistent PoliA well defined, investor friendly, transparent & consistent Policy for private power cy for private power
investorsinvestors
Agreements are standardized and available upfront on PPIB websitAgreements are standardized and available upfront on PPIB websitee
Regulator determines tariff allowing attractive return on investRegulator determines tariff allowing attractive return on investmentsments
12 thermal 12 thermal IPPsIPPs (over 2400 MW) achieved financial close & construction start (over 2400 MW) achieved financial close & construction start ––
commissioning during 2009 and 2010commissioning during 2009 and 2010
Rental power projects have been contractedRental power projects have been contracted
Two thermal projects in public sector initiated one on gas & othTwo thermal projects in public sector initiated one on gas & other on oiler on oil
11 out of 12 11 out of 12 IPPsIPPs financed by local banks by loans over US$ 2 financed by local banks by loans over US$ 2 BlnBln
First hydro IPP of 84 MW to achieve financial close in couple ofFirst hydro IPP of 84 MW to achieve financial close in couple of monthsmonths
Small to medium sized hydro Small to medium sized hydro IPPsIPPs of 4,800 MW in processof 4,800 MW in process
29
Alternate/Renewable Energy TargetsAlternate/Renewable Energy Targets
Pakistan is among 60 countries adopting Alternate Energy TargetsPakistan is among 60 countries adopting Alternate Energy Targets
Targets for Renewable resources:Targets for Renewable resources:
Development of wind and solar energy to meet at least 5% of totaDevelopment of wind and solar energy to meet at least 5% of total l
installed capacity through RE resources by 2030installed capacity through RE resources by 2030
Development and deployment of solar products like solar lights, Development and deployment of solar products like solar lights, solar solar
fans, solar cooker, solar geyser etc. through private sectorfans, solar cooker, solar geyser etc. through private sector
Development & implementation of policies to encourage selfDevelopment & implementation of policies to encourage self--
generation by domestic sector through REgeneration by domestic sector through RE
5% replacement of annual Diesel consumption with Biodiesel by 205% replacement of annual Diesel consumption with Biodiesel by 2015 15
and 10% by year 2025and 10% by year 2025
Remote Village Electrification Remote Village Electrification –– for areas inaccessible to Gridfor areas inaccessible to Grid

3030
Opportunities for Private Sector ParticipationOpportunities for Private Sector Participation
Development of small/medium/mega Hydropower projects Development of small/medium/mega Hydropower projects –– so far only so far only
around 6,000 MW tapped from an estimated potential of 45,000 MWaround 6,000 MW tapped from an estimated potential of 45,000 MW
Development of indigenous coal resources for power generation Development of indigenous coal resources for power generation –– TharThar
Coal Reserve estimated at about 175 billion ton is still untappeCoal Reserve estimated at about 175 billion ton is still untappedd
Home solar system manufacturing and supplies Privatization Home solar system manufacturing and supplies Privatization
opportunities in generation and distributionopportunities in generation and distribution
Augmentation of transmission/distribution infrastructureAugmentation of transmission/distribution infrastructure
Rental Plants for meeting short to mediumRental Plants for meeting short to medium--term demandterm demand
PublicPublic--Private Partnership for large and complex projectsPrivate Partnership for large and complex projects
O&M and EPC contractors / Consultants and AdvisorsO&M and EPC contractors / Consultants and Advisors
31
Key Actions Required and TimelineKey Actions Required and Timeline
Immediate addition in generation capacity - Immediate
Improvement in power sector performance and reduction in losses -Process should start immediately
A comprehensive and economically feasible Rural electrification strategy - Immediate
Pakistan has numerous identified Micro Hydro sites. Development of a framework and implementation with participation of local community -Immediate
Development and use of solar products like solar home systems, solar lights, solar fans, solar cooker, solar water heater, etc. with support of private sector - Immediate
Local market can not meet huge financing requirements – Support by Multilateral institutions, Export Credit Agencies, etc. Loans for extended tenures (15-25 years) will help to keep tariff of high capital cost oriented hydro power projects to reasonable level - Immediate

32
Areas where assistance is needed
Performance audit of power sector to evaluate shortcoming and suggest
improvements
Rural electrification strategy/policy for the country
Pakistan has numerous identified Micro Hydro sites. Development of a
framework and their implementation with participation of local community
Development and use of solar products like solar home systems, solar
lights, solar fans, solar cooker, solar water heater, etc. with support of
private sector
Local market can not meet huge financing requirements – Support by
Multilateral institutions, Export Credit Agencies through debt & equity
financing, Guarantees etc. Loans for extended tenures (15-25 years) will
help to keep tariff of high capital cost oriented hydro power projects to
reasonable level

33
Key Actors Involved
Ministry of Water & Power
Private Power & Infrastructure Board (PPIB)
Alternate Energy Development Board (AEDB)
Pakistan Electric Power Company (PEPCO)

34
Country Action Plan Summary
Performance AuditDevelopment of Strategy/PlanDevelopment of Strategy/PlanManufacturing / financing to share cost
Work already underwayStudy immediately
Immediate
Study Immediate
Immdiate
Ministry of Water & Power
PPIB
AEDB
Pakistan Electric Power Company
Expand Generation Capacity Implement measuresImplement Strategy
Prepare & Implement Plan
Supply on subsidisedrates to encourage
Rental Plants, IPPs
System Performance AuditRural Electrification StrategyMicro Hydro Policy & Plan
Manufacturing & Supply of systems / Products
Generation CapacityShortageHigh System LossesNo objective Rural Electrification StrategyLittle work on Micro HydrosNo use of Solar Resources
Areas of Assistance
TimelineKey Actors to be involved
Key Actions Required / Objectives
OpportunitiesCurrent Obstacles & Cahallenges
35
THANK YOU

36
FUELFUEL--WISE DETAIL OF PROJECTS CURRENTLYWISE DETAIL OF PROJECTS CURRENTLYBEING PROCESSED BY PPIBBEING PROCESSED BY PPIB
Feb-1081Eminabad, GujranwalaGulf Rental Project8
Jan-1064Lahore Sheikhupura Road, LESCOPremier Energy Rental Power Project7
Dec-09170Near Batapur Grid, LESCORuba Energy Rental Project6
Dec-09220Near Manga-Raiwind Road, LESCOReshma Power Rental Project5
Dec-09230Korangi, KarachiWalters Power Rental Project4
Nov-09249Mauripur, KarachiKarkey Rental Project3
Sep-09200Near LahoreNishat Power Project2
Jul-09225Sheikhupura, PunjabSheikhupura (Atlas) Power Project1
OILOIL
Expected CODExpected CODCapacity Capacity (MW)(MW)LocationLocationProjectProjectS. No.S. No.

37
FUELFUEL--WISE DETAIL OF PROJECTS CURRENTLYWISE DETAIL OF PROJECTS CURRENTLYBEING PROCESSED BY PPIBBEING PROCESSED BY PPIB
Dec-12150Shahpur, Near SargodhaShahpur Power Project20
Mar-12627Near Bhikki, PunjabEngro Power Generation18
Mar-12171Near Jhang, PunjabSaba Power GenerationNear Jhang, Punjab19
Dec-11200FaisalabadShahkot (Leading) Power Project17
3959Sub Total (Oil)
Expected COD
Capacity (MW)LocationProjectS. No.
Jun-11200GujranwalaGujranwala (Gulistan) Project16
Mar-11172Gujranwala-Lahore Road, PunjabReshma Power Generation15
Dec-10200FaisalabadLiberty Power Tech Project14
Mar-10200Near LahoreNishat Chunian Power Project13
Mar-10220Narowal, PunjabHUBCO-Narowal Project12
Feb-1074Kamoki, Gujranwala, GEPCOTapal Rental Power Project11
Feb-1085Sialkot, GEPCO AreaSialkot Rental Power Project10
Feb-10221Gojra, near FaisalabadIndependent Power Rental Project9
38
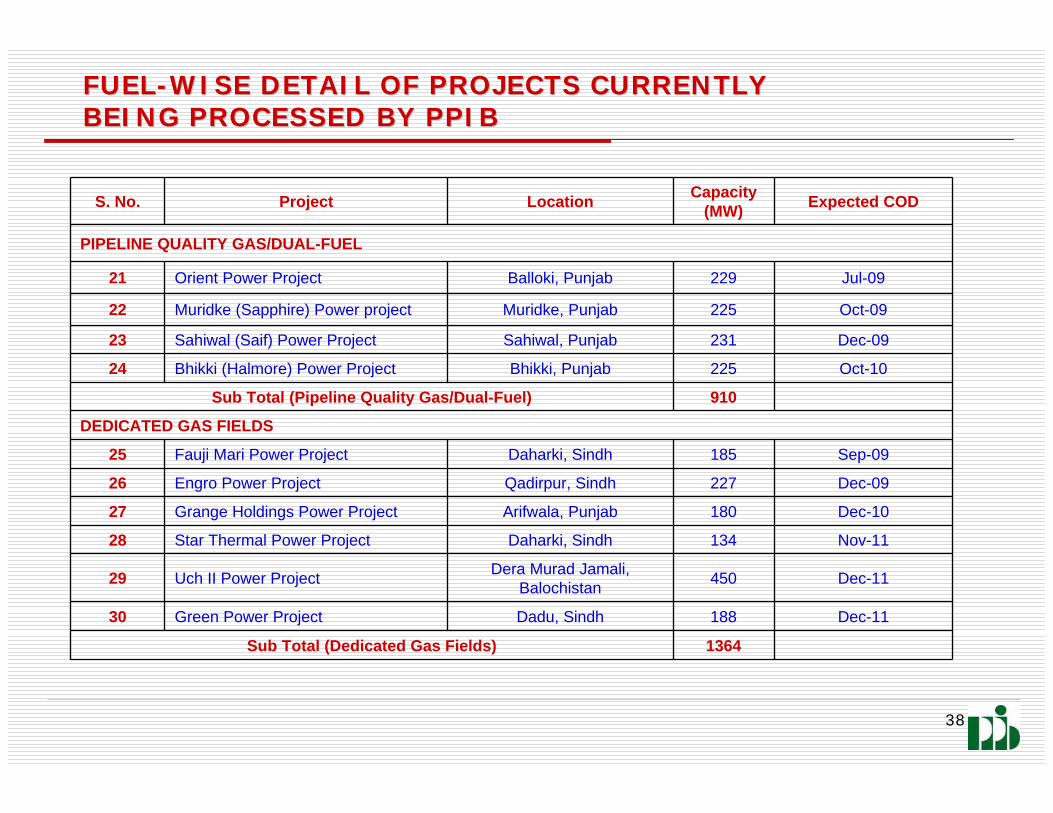
FUELFUEL--WISE DETAIL OF PROJECTS CURRENTLYWISE DETAIL OF PROJECTS CURRENTLYBEING PROCESSED BY PPIBBEING PROCESSED BY PPIB
Expected CODCapacity (MW)LocationProjectS. No.
PIPELINE QUALITY GAS/DUAL-FUEL
1364Sub Total (Dedicated Gas Fields)
Dec-11188Dadu, SindhGreen Power Project30
Dec-11450Dera Murad Jamali, BalochistanUch II Power Project29
Nov-11134Daharki, SindhStar Thermal Power Project28
Dec-10180Arifwala, PunjabGrange Holdings Power Project27
Dec-09227Qadirpur, SindhEngro Power Project26
Sep-09185Daharki, SindhFauji Mari Power Project25
DEDICATED GAS FIELDS
910Sub Total (Pipeline Quality Gas/Dual-Fuel)
Oct-10225Bhikki, PunjabBhikki (Halmore) Power Project24
Dec-09231Sahiwal, PunjabSahiwal (Saif) Power Project23
Oct-09225Muridke, PunjabMuridke (Sapphire) Power project22
Jul-09229Balloki, PunjabOrient Power Project21

39
FUELFUEL--WISE DETAIL OF PROJECTS CURRENTLYWISE DETAIL OF PROJECTS CURRENTLYBEING PROCESSED BY PPIBBEING PROCESSED BY PPIB
Expected CODExpected COD
Nov-14150Muzaffarabad AJKPatrind Hydropower Project4040
Jun-14101Near Kalam, NWFPGabral-Kalam Hydropower Project3838
Oct-14240Kotli, AJKKarot Hydel Project3939
Capacity Capacity (MW)(MW)LocationLocationProjectProjectS. No.S. No.
COALCOAL
Nov-14100Gulpur, AJKGulpur Hydro Power project4141
Jun-14100Kotli, AJKKotli Hydel Project3737
Dec-13157Swat, NWFPMadian Hydropower Project3636
Dec-1384Swat, NWFPMatiltan Hydro Power Project3535
Jun-13132Near Mangla, AJKRajdhani Hydro Power Project3434
Dec-1284Near Mangla, AJKNew Bong Escape Hydel Project3333
HYDELHYDEL
24002400Sub Total (Coal)Sub Total (Coal)
Jun-131200Gadani Near KarachiMitsui Imported Coal Project3232
Jun-131200Gadani Near KarachiAES Imported Coal Project3131

40
FUELFUEL--WISE DETAIL OF PROJECTS CURRENTLYWISE DETAIL OF PROJECTS CURRENTLYBEING PROCESSED BY PPIBBEING PROCESSED BY PPIB
Expected CODCapacity (MW)LocationProjectS. No.
13451GRAND TOTAL
4818Sub Total (Hydel)
Jul-161100Kohala, AJKKohala Hydropower Project52
Apr-16840Mansehra, NWFPSuki Kinari Hydropower Project51
Jan-16548Kohistan, NWFPKaigah Hydel Project50
Jun-15102Chitral, NWFPShushgai Zhendoli Hydel Project49
Jun-15127Chitral, NWFPShogosin Hyderopower Project48
Jun-15139Muzaffarabad, AJKChakothi-Hattian Project47
Jan-15197Swat, NWFPKalam-Asrit Hydel Project46
Jan-15215Near Kalam, NWFPAsrit-Kedam Hydel Project45
Dec-14222Sudhnoti, AJKAzad Patan Hydel Project44
Dec-1465Kotli, AJKSehra Hydel Project43
Dec-14115Dir, NWFPSharmai Hydropower Project42

41
Year-wise Capacity Addition by IPPS (2009 - 2016)
27732013
10932014
7802015
13451GRAND TOTAL
24882016
10322012
13442011
15502010
23912009
Capacity (MW)YEAR

Atty. Atty. RovielRoviel V. V. MasiganMasiganAttorney III, Legal Service,Attorney III, Legal Service,
Energy Regulatory Commission (ERC)Energy Regulatory Commission (ERC)
Mr. Ramon C. Mr. Ramon C. AbayaAbayaChairman, Chairman, CagayanCagayan Electric Power and Light Electric Power and Light
Company, Incorporated (CEPALCO)Company, Incorporated (CEPALCO)
Financing Sustainable Financing Sustainable Electrification in the PhilippinesElectrification in the Philippines
(Action Plan)(Action Plan)

Action Plan Outline:Action Plan Outline:
Current ChallengesOpportunitiesKey Actions RequiredKey Actors to be InvolvedTimelineAreas Where Assistance Needed

Current ChallengesCurrent Challenges
• Full implementation of the Electric Power Industry Reform Act of 2001 (EPIRA)– Open Access– Sale and Transfer of Subtransmission Assets
• Full implementation of the Renewable Energy Act of 2008– Promulgation of the Implementing Rules and
Regulations (IRR) – Creation of the National Renewable Energy Board
(NREB)– Creation of the Renewable Energy Management
Bureau (REMB)– Determination of the Feed-In Tariff System (FITS)
Opportunities Opportunities
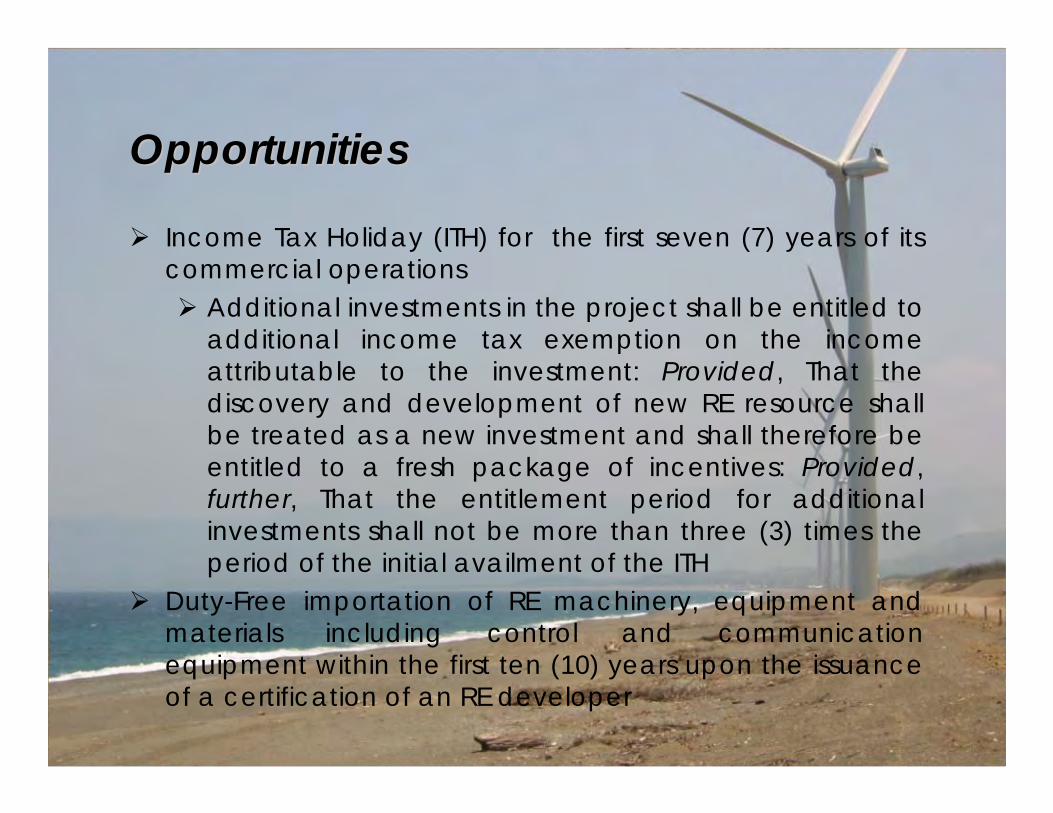
Income Tax Holiday (ITH) for the first seven (7) years of its commercial operations Additional investments in the project shall be entitled to
additional income tax exemption on the income attributable to the investment: Provided, That the discovery and development of new RE resource shall be treated as a new investment and shall therefore be entitled to a fresh package of incentives: Provided, further, That the entitlement period for additional investments shall not be more than three (3) times the period of the initial availment of the ITH
Duty-Free importation of RE machinery, equipment and materials including control and communication equipment within the first ten (10) years upon the issuance of a certification of an RE developer
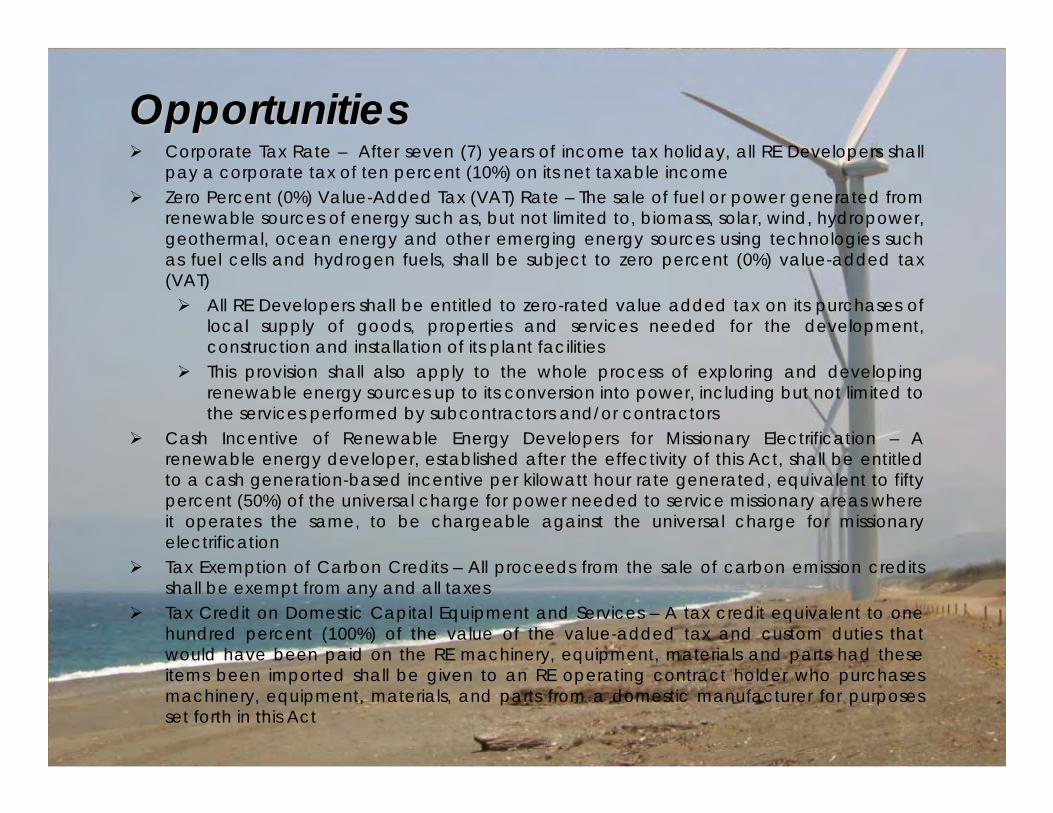
OpportunitiesOpportunities Corporate Tax Rate – After seven (7) years of income tax holiday, all RE Developers shall
pay a corporate tax of ten percent (10%) on its net taxable income Zero Percent (0%) Value-Added Tax (VAT) Rate – The sale of fuel or power generated from
renewable sources of energy such as, but not limited to, biomass, solar, wind, hydropower, geothermal, ocean energy and other emerging energy sources using technologies such as fuel cells and hydrogen fuels, shall be subject to zero percent (0%) value-added tax (VAT) All RE Developers shall be entitled to zero-rated value added tax on its purchases of
local supply of goods, properties and services needed for the development, construction and installation of its plant facilities
This provision shall also apply to the whole process of exploring and developing renewable energy sources up to its conversion into power, including but not limited to the services performed by subcontractors and/or contractors
Cash Incentive of Renewable Energy Developers for Missionary Electrification – A renewable energy developer, established after the effectivity of this Act, shall be entitled to a cash generation-based incentive per kilowatt hour rate generated, equivalent to fifty percent (50%) of the universal charge for power needed to service missionary areas where it operates the same, to be chargeable against the universal charge for missionary electrification
Tax Exemption of Carbon Credits – All proceeds from the sale of carbon emission credits shall be exempt from any and all taxes
Tax Credit on Domestic Capital Equipment and Services – A tax credit equivalent to one hundred percent (100%) of the value of the value-added tax and custom duties that would have been paid on the RE machinery, equipment, materials and parts had these items been imported shall be given to an RE operating contract holder who purchases machinery, equipment, materials, and parts from a domestic manufacturer for purposes set forth in this Act

OpportunitiesOpportunities
The government share on existing and new RE development projects shall be equal to one percent (1%) of the gross income of RE resource developers resulting from the sale of renewable energy produced and such other income incidental to and arising from the renewable energy generation, transmission, and sale of electric power except for indigenous geothermal energy, which shall be at one and a half percent (1.5%) of gross income To further promote the development of RE projects, the government
waives its share from the proceeds of micro-scale projects for communal purposes and non-commercial operations, which are not greater than one hundred (100) kilowatts

Key Actions Required Key Actions Required
Funding Development Bank of the Philippines (DBP) Land Bank of the Philippines (LBP) Philippine Export-Import Bank Other Government Financial Institutions (GFIs)
The foregoing shall, in accordance with and to the extent allowed by the enabling provisions of their respective charters or applicable laws, provide preferential financial packages for the development, utilization and commercialization of RE projects as duly recommended and endorsed by the DOE
Information dissemination for foreign investors

Key Actors to be Involved Key Actors to be Involved Board of Investments (BOI) Department of Energy (DOE) Department of Environment and Natural Resources (DENR) Department of Finance (DOF) Department of Science and Technology (DOST) Department of Trade and Industry (DTI) Distribution Utilities (DUs) Energy Regulatory Commission (ERC) Generation Companies National Power Corporation (NPC) National Transmission Corporation (TRANSCO) National Grid Corporation of the Philippines (NGCP) – concessionaire of
TRANSCO Philippine Electricity Market Corporation (PEMC) Philippine National Oil Company (PNOC) Renewable Energy Developers Investors
TEPCO KANSAI CLP Alstom GE

TimelineTimeline Creation of NREB
January 2010 Creation of REMB
January 2010 Formulation of Feed-In Tariffs System
2010 Open Access
2011 Full Implementation of the RE Act
2013

Areas Where Assistance Needed Areas Where Assistance Needed Funding from Foreign Financial Institutions
World Bank ADB
Information Dissemination Formulation of attractable Feed-In Tariffs
UNDESA

Thank You!Thank You!

e8-G
EF-U
ND
ESA
-UN
ESC
AP
Fina
ncin
g Su
stai
nabl
e El
ectr
ifica
tion
HC
B In
itiat
ive
Sout
h-Ea
st A
sia
Dia
logu
es, S
epte
mbe
r 8-
10, 2
009,
Ban
gkok
, Tha
iland
e8-GEF-UNDESA-UNESCAP Financing Sustainable Electrification
South-East Asia DialoguesBangkok, Thailand, September 10, 2009
Country Action Plan
Sri Lanka

e8-G
EF-U
ND
ESA
-UN
ESC
AP
Fina
ncin
g Su
stai
nabl
e El
ectr
ifica
tion
HC
B In
itiat
ive
Sout
h-Ea
st A
sia
Dia
logu
es, S
epte
mbe
r 8-
10, 2
009,
Ban
gkok
, Tha
iland
ACTION PLAN OUTLINE TO ATTRACT INVESTMENTS
1. Policy Elements 2. Obstacles 3. Challenges 4. Opportunities 5. Key Action Required 6. Key Actors to be involved7. Time Line 8. Areas where assistance needed 9. Country Action Plan Summary

e8-G
EF-U
ND
ESA
-UN
ESC
AP
Fina
ncin
g Su
stai
nabl
e El
ectr
ifica
tion
HC
B In
itiat
ive
Sout
h-Ea
st A
sia
Dia
logu
es, S
epte
mbe
r 8-
10, 2
009,
Ban
gkok
, Tha
iland
Country Outlook
• Population 20Mn (2008)• Area 65610km2
• Installed Capacity 2656MW (2008)– Thermal 1298 MW– Hydro 1205 MW– Mini Hydro 138 MW– Bio Mass 12 MW– Wind 3 MW
• Electrification level 82% (2008)• Electricity consumers 4Mn • Total Generation 9,815 GWh• System losses 15.5%

e8-G
EF-U
ND
ESA
-UN
ESC
AP
Fina
ncin
g Su
stai
nabl
e El
ectr
ifica
tion
HC
B In
itiat
ive
Sout
h-Ea
st A
sia
Dia
logu
es, S
epte
mbe
r 8-
10, 2
009,
Ban
gkok
, Tha
iland
1. Policy Elements
• Provide basic energy needs to all • Ensure energy security • Promote energy efficiency and conservation • Promoting indigenous resources • Adopting appropriate pricing policy • Enhancing energy sector management capacity • Consumer protection and ensuring level playing fields • Enhance quality of energy services • Protection from adverse environmental impacts of
energy facility

e8-G
EF-U
ND
ESA
-UN
ESC
AP
Fina
ncin
g Su
stai
nabl
e El
ectr
ifica
tion
HC
B In
itiat
ive
Sout
h-Ea
st A
sia
Dia
logu
es, S
epte
mbe
r 8-
10, 2
009,
Ban
gkok
, Tha
iland
2. Current Obstacles
• Project feasibility is time taking • Extended project approval process • Some EIA Clearances-time consuming & mitigatory
actions demanded prior to project implementation• Procurement guidelines• Time consuming PPA negotiation• Sovereign Guarantees – feasible / unfeasible • Stringent bank due diligence • Lack of proposals by the IPPs• Lack of capacity for Public Private Partnerships

e8-G
EF-U
ND
ESA
-UN
ESC
AP
Fina
ncin
g Su
stai
nabl
e El
ectr
ifica
tion
HC
B In
itiat
ive
Sout
h-Ea
st A
sia
Dia
logu
es, S
epte
mbe
r 8-
10, 2
009,
Ban
gkok
, Tha
iland
3. Challenges
• Country Risk – perception differences among investment parties
• High finance cost • Inadequate Infrastructure for most of the
potential renewable project • Micro & Macro economic issues (high inflation;
$/LKR parity, high cost of labor)• Electricity at affordable tariff• Limited hydro resources & non availability of
fossil fuel • System Losses and inefficiency

e8-G
EF-U
ND
ESA
-UN
ESC
AP
Fina
ncin
g Su
stai
nabl
e El
ectr
ifica
tion
HC
B In
itiat
ive
Sout
h-Ea
st A
sia
Dia
logu
es, S
epte
mbe
r 8-
10, 2
009,
Ban
gkok
, Tha
iland
4. Opportunities
• Increasing power demand 7-8% annually • Low cost funding • Favorable renewable energy policy - 10% of net
generation by 2015• Huge wind, solar and biomass potential • Technology base Feed in Tariff system • Increase efficiency & rehabilitation of existing old
plants • Transforming power system into low cost power
generation methods • Well established BOI for encouraging investments • Political stability and government will

e8-G
EF-U
ND
ESA
-UN
ESC
AP
Fina
ncin
g Su
stai
nabl
e El
ectr
ifica
tion
HC
B In
itiat
ive
Sout
h-Ea
st A
sia
Dia
logu
es, S
epte
mbe
r 8-
10, 2
009,
Ban
gkok
, Tha
iland
5. Key Actions Required
• Build low cost power plants and add renewable energy resource to the grid
• Grid enhancement & augmentation • Improvement in other infrastructure to attract investors • Ease the project approval process • Expedite EIA / Approval processes • System improvements and minimizing losses• Strengthen the capacity of PPP Unit through the BOI
by 2010

e8-G
EF-U
ND
ESA
-UN
ESC
AP
Fina
ncin
g Su
stai
nabl
e El
ectr
ifica
tion
HC
B In
itiat
ive
Sout
h-Ea
st A
sia
Dia
logu
es, S
epte
mbe
r 8-
10, 2
009,
Ban
gkok
, Tha
iland
6. Key Actors to be Involved
• Government organizations • Utility companies • Financial institutions • Power producers • Public

e8-G
EF-U
ND
ESA
-UN
ESC
AP
Fina
ncin
g Su
stai
nabl
e El
ectr
ifica
tion
HC
B In
itiat
ive
Sout
h-Ea
st A
sia
Dia
logu
es, S
epte
mbe
r 8-
10, 2
009,
Ban
gkok
, Tha
iland
7. Timeline
• Coal Power by 2011 • Grid enhancement by 2012 • Infrastructure development – immediately • Specific time frame for project development • Specific time frame to EIA / Approvals • Immediate action on system loss and inefficiency
e8-G
EF-U
ND
ESA
-UN
ESC
AP
Fina
ncin
g Su
stai
nabl
e El
ectr
ifica
tion
HC
B In
itiat
ive
Sout
h-Ea
st A
sia
Dia
logu
es, S
epte
mbe
r 8-
10, 2
009,
Ban
gkok
, Tha
iland
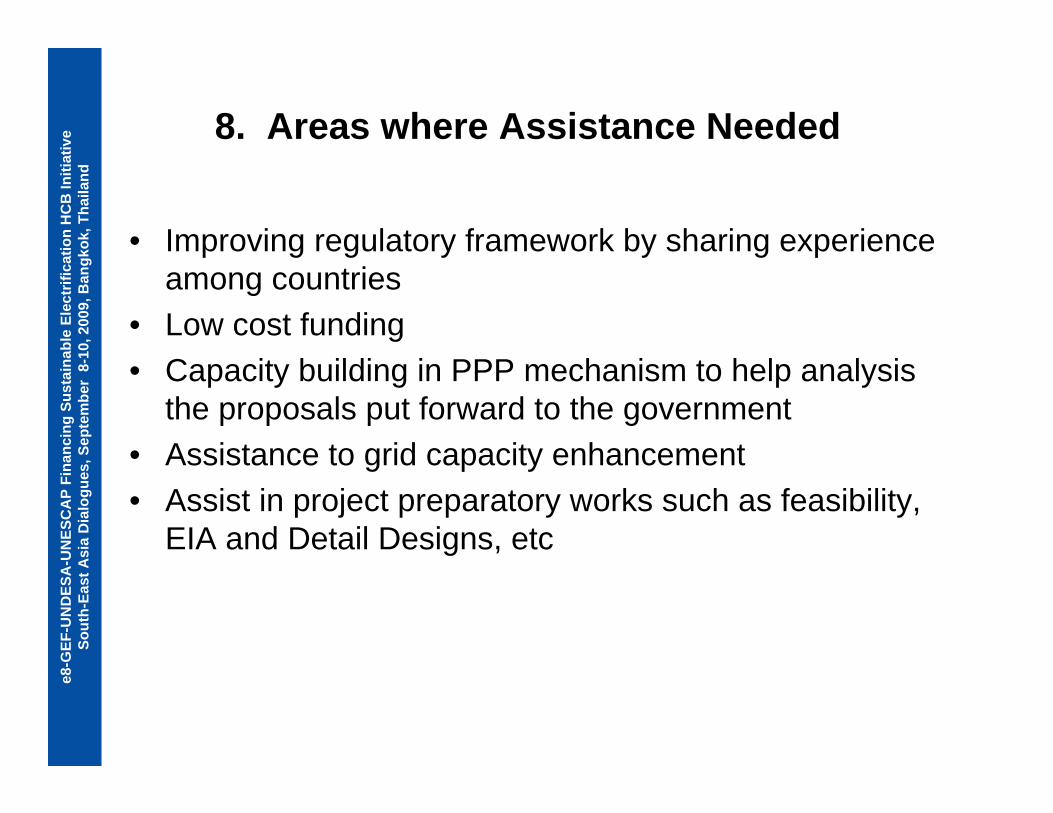
8. Areas where Assistance Needed
• Improving regulatory framework by sharing experience among countries
• Low cost funding • Capacity building in PPP mechanism to help analysis
the proposals put forward to the government• Assistance to grid capacity enhancement • Assist in project preparatory works such as feasibility,
EIA and Detail Designs, etc

e8-G
EF-U
ND
ESA
-UN
ESC
AP
Fina
ncin
g Su
stai
nabl
e El
ectr
ifica
tion
HC
B In
itiat
ive
Sout
h-Ea
st A
sia
Dia
logu
es, S
epte
mbe
r 8-
10, 2
009,
Ban
gkok
, Tha
iland
9. Country Action Plan Summary
•Build low cost power plants and add renewable energy resource to the grid •Grid enhancement & augmentation •Improvement in other infrastructure to attract investors •Ease the project approval process •Expedite EIA / Approval processes •System improvements and minimizing losses•Strengthen the capacity of PPP Unit through the BOI by 2010
Key Actions Required/Objectives
•Improving regulatory framework by sharing experience among countries •Low cost funding •Capacity building in PPP mechanism to help analysis the proposals put forward to the government•Assistance to grid capacity enhancement •Assist in Project preparatory works such as feasibility, EIA and Detail Design etc
•Coal Power by 2011 •Grid enhancement by 2012 •Infrastructure development –immediately •Specific time frame for project development •Specific time frame to EIA / Approvals •Immediate action on system loss
and inefficiency
Government organizations Utility companies Financial institutions Power producers
Public
•Increasing power demand 7-8% annually •Opportunities for low cost funding •Policy on renewable resources - 10% by 2015 about 450MW •Reduce system losses •Increase efficiency & rehabilitation of existing old plants •Transforming power system into low cost power generation methods •Eliminate grid constraints •Harness renewable resource •Political stability and government will
•Project feasibility is time taking •Extended project approval process •Some EIA Clearances-time consuming & demand mitigatoryactions prior to implementation•Procurement guidelines•Time consuming PPA negotiation•Sovereign Guarantees –feasible / unfeasible •Stringent bank due diligence •Lack of proposals by the IPPs•Lack of guidelines for PPP
Areas of Assistance
TimelineKey Actors to be
Involved
OpportunitiesCurrent obstacles
and challenges
e8-G
EF-U
ND
ESA
-UN
ESC
AP
Fina
ncin
g Su
stai
nabl
e El
ectr
ifica
tion
HC
B In
itiat
ive
Sout
h-Ea
st A
sia
Dia
logu
es, S
epte
mbe
r 8-
10, 2
009,
Ban
gkok
, Tha
iland
Focal Point Contact InformationName/Title:
Mr. Rajapakse PremalalChief Accountant Ministry of Power & Energy
Sri Lanka Email:
Tel: +94 112 687360Fax: +94 112 687360

1
E8-GEF-UNDSA-UNESCAPFinancing Sustainable Electrification
THAILAND Action plan-Proposes Outline

2
Enhanced Single Buyer (ESB) ModelEnhanced Single Buyer (ESB) Model
EGATGen.
EGATEGATGen.Gen.
EGAT Transmission
System Operator (SO) Single Buyer (SB)
EGAT TransmissionEGAT Transmission
System Operator (SO) Single Buyer (SB)System Operator (SO) Single Buyer (SB)
ForeignPower
Purchase
ForeignForeignPower Power
PurchasePurchaseSPPSPPSPP
PEAPEAPEA
DirectCustomer
DirectDirectCustomerCustomer
End UserEnd UserEnd User
MEAMEAMEA
Regulator
IPPIPP
VSPPVSPPVSPP
33
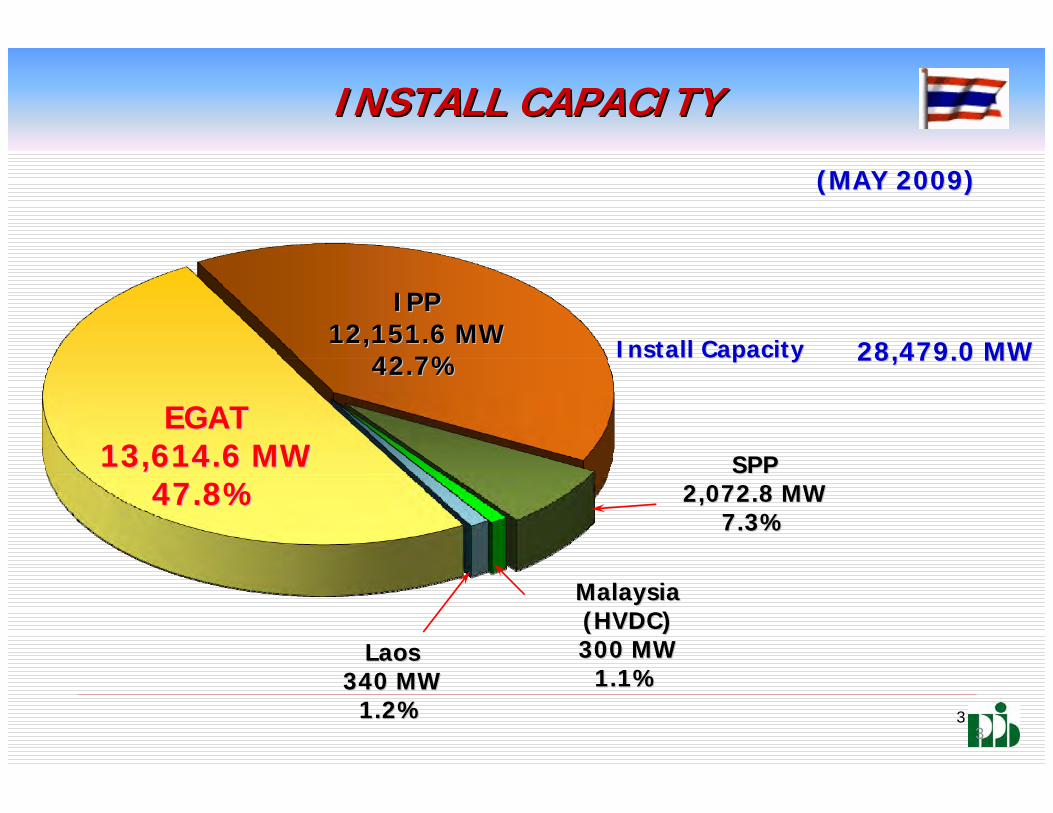
EGATEGAT13,614.6 MW13,614.6 MW
47.8%47.8%
IPPIPP12,151.6 MW12,151.6 MW
42.7%42.7%
SPPSPP22,,072.8 MW072.8 MW
7.3%7.3%
Malaysia Malaysia (HVDC)(HVDC)300300 MWMW
11..11%%LaosLaos
340340 MWMW11..22%%
Install CapacityInstall Capacity 28,479.028,479.0 MWMW
((MAYMAY 22009009))
INSTALL CAPACITYINSTALL CAPACITY
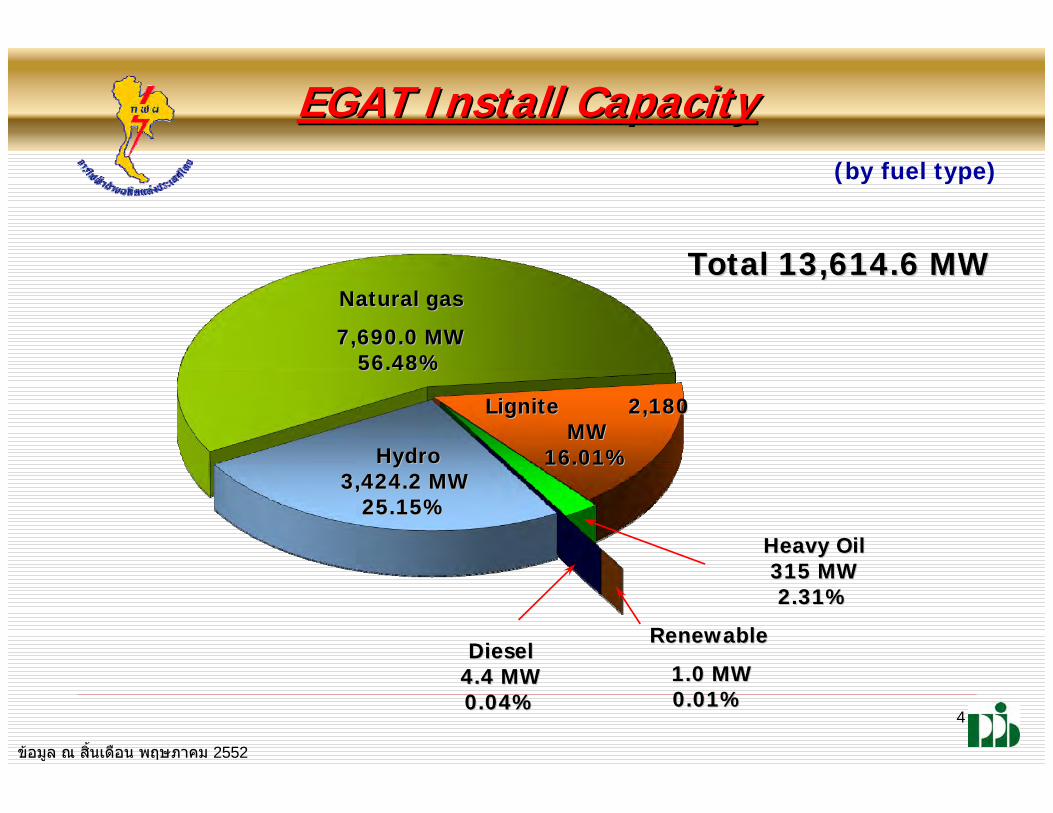
4
EGAT Install CapacityEGAT Install Capacity(by fuel type)
Natural gasNatural gas
77,,690690..00 MWMW56.4856.48%%
Lignite Lignite 22,,180180MWMW
1616..0101%%HydroHydro33,,424424..22 MWMW
2525..1515%%
RenewableRenewable
1.01.0 MWMW00..0101%%
DieselDiesel4.44.4 MWMW00..0404%%
TotalTotal 1313,,614.6614.6 MWMW
Heavy OilHeavy Oil315315 MWMW22..3131%%
ขอมล ณ สนเดอน พฤษภาคม 2552
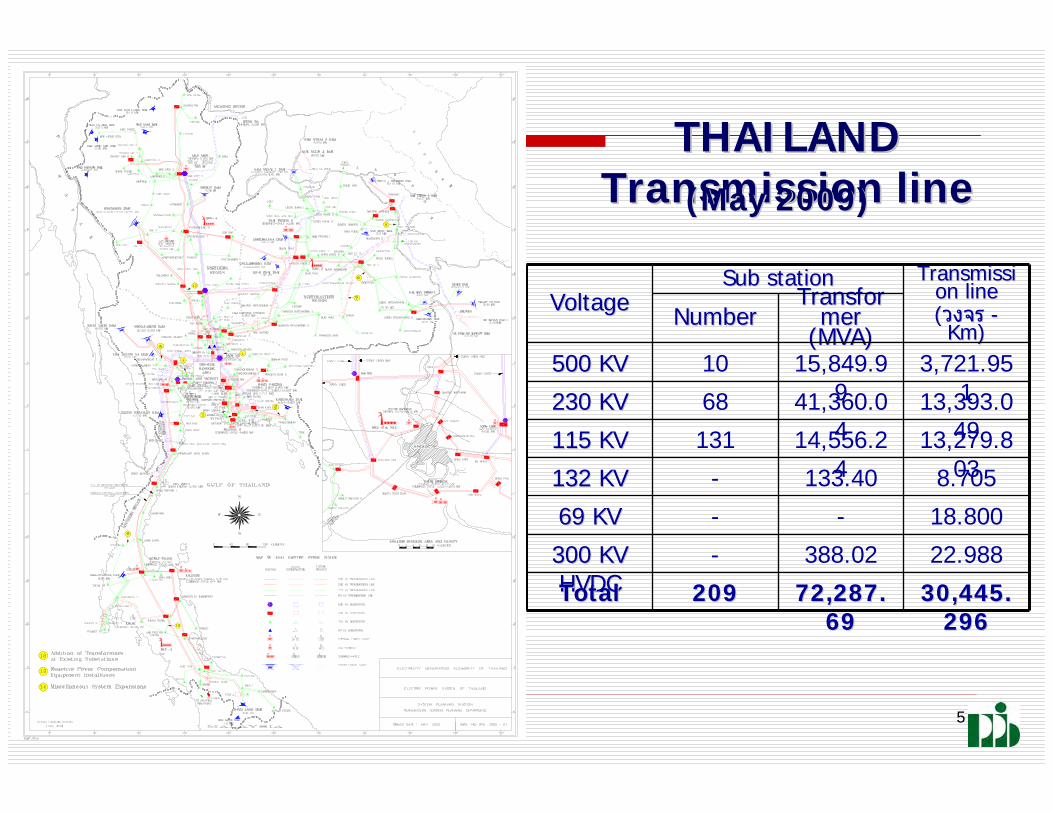
5
THAILAND THAILAND Transmission lineTransmission line((May 2009May 2009))
VoltageVoltageSub stationSub station TransmissiTransmissi
on lineon line((วงจรวงจร --KmKm))
NumberNumberTransforTransfor
mer mer (MVA)(MVA)
500500 KVKV 10 15,849.99
3,721.951230 KV230 KV 68 41,360.0
413,393.0
49115 KV115 KV 131 14,556.24
13,279.803132 KV132 KV - 133.40 8.705
69 KV69 KV - - 18.800
300 KV 300 KV HVDCHVDC
- 388.02 22.988
TotalTotal 209209 72,287.72,287.6969
30,445.30,445.296296

6
Government policy
Reduce imported energy 460,000 million baht Activate renewable energy investment 382,240
billion baht Reduce CO2 emission 42 million tons/year
In 2022

7
Thailand action plan outline
Renewable energy for electricity 5,608 MW
Renewable energy for electricity 4,191 MW
Renewable energy for electricity 3,273 MW
Long term(2017-2022)
Mid term (2012-2016)
Short term (2008-2011)
Target20 Percent of energy replace with renewable in 2022
8 8
- To be a model for renewable energy develop- Reduce CO2 emission (in electricity industry)- To encourage Thailand Renewable industry- For research and development in Renewable
Objectives
EGAT Renewable Energy planEGAT Renewable Energy plan

9 9
Target
EGAT Renewable Energy planEGAT Renewable Energy plan
- To surplus Renewable from 1.29 MW to over
- Reduce CO2 emission (in electricity industry) 57,000 tons/year- Reduce imported energy 80 ktoe/year (crude oil 68.8 billion liters)
Results

1010
Energy type Total Installed capacity
- Solar 820.43KW
- Wind 170 KW
- Geothermal 300 KW
RENEWABLE ENEYGY INSTALL CAPACITY
EGAT Renewable Energy planEGAT Renewable Energy plan
(December 2008)
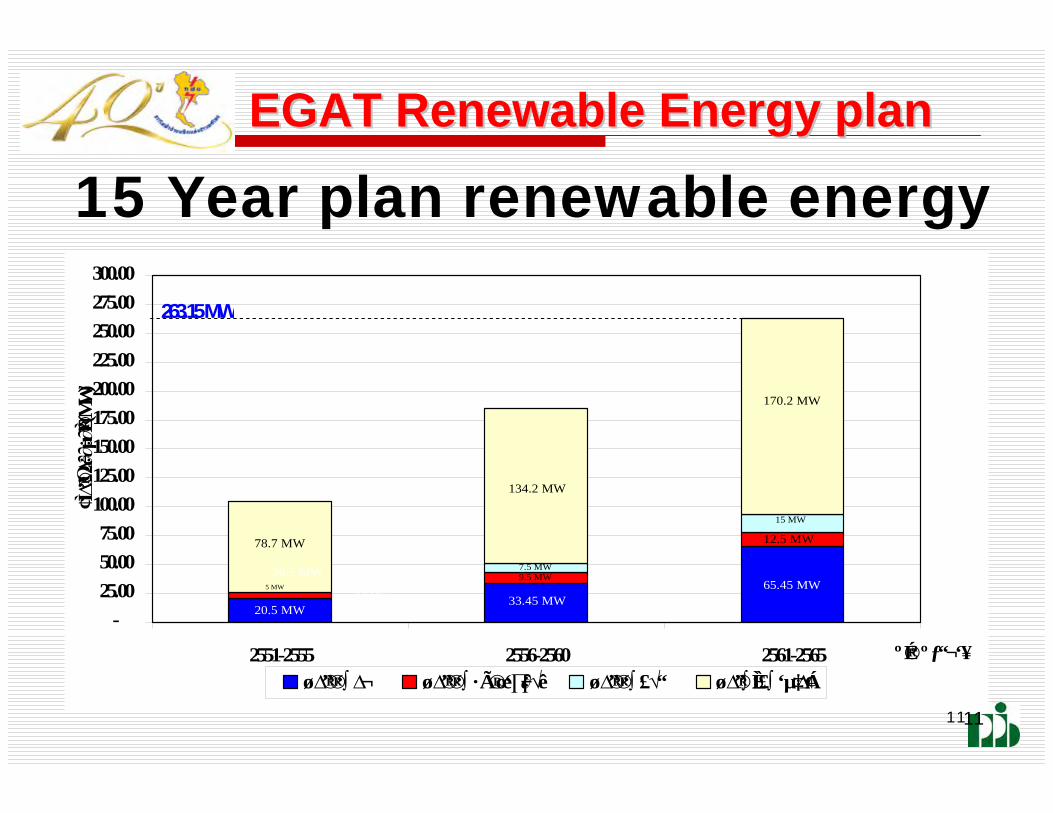
1111
15 Year plan renewable energy
-25.0050.0075.00
100.00125.00150.00175.00200.00225.00250.00275.00300.00
2551-2555 2556-2560 2561-2565 ºÉ®ª ºƒ“¬‘¥
¢Ì‘∆”®Ω∆
÷∂∂÷µ∂
”È® (MW
)
ø∆”®®‘∫ ∆¬ ø∆”®®‘∫ ·Ã®œ‘∏÷∂√ê ø∆”®®‘∫ £√“ ø∆”®∫ÈÌ‘£∫ ‘µ‡∆Á¢
5 MW9.5 MW4.9 MW 65.45 MW
26.5 MW
78.7 MW
170.2 MW
134.2 MW
5 MW9.5 MW
12.5 MW
4.9 MW33.45 MW
263.15 MW
5 MW
20.5 MW
7.5 MW
15 MW
9.5 MW
EGAT Renewable Energy planEGAT Renewable Energy plan

1212
EGAT invest. Portion(MW) (% )
Wind power 65.45 800 8.18%Solar Power 12.50 500 2.50%Bio mass 15.00 160 9.38%M ini Hydro 170.20 324 52.53%Summary 263.15 1,784 14.75%
Energy souce Ministry of Energy Plan (MW)
EGAT Renewable Energy planEGAT Renewable Energy plan

1313
คดจาก Adder ทจะตองจายให (Baht/kWh) ตามชนดของพ
Adder for Renewable Energy Adder for Renewable Energy

14
Regional cooperation
HAPUA Working committee Laos, Malaysia Electric power purchase MOU for Electric power purchase with Burma

15
Current obstacles and Challenges
Fuel mixes (70% natural gas) Site for construction new power plant
(Protesting from rural people) Renewable energies are depended on
Natural situation (Reliability)

16
Opportunities
Joint venture with IPP SPP or VSPP producer
17
Key Actions required
Make the Rural area (around selected site) Trusted
Renewable energy Technology
18
Focal Point Contact Information
Mr. Somchai ChudokmaiAssistant Governor-Policy EGAT
e-mail : [email protected] 662-4363011 Fax 662-4363095
Thailand, September 2009Thailand, September 2009

100.0015,76321TOTAL
33.355,25712HYDRO
%P (MW)No PPsTYPE
9.801,5453COAL
4.156542OIL&DIESEL
20.703,2634CCGT
32,005,044NAIPP&BOT
INSTALLED CAPACITY
33%
11%21%3%
32%
Hydro Coa l&oil-fire d Ga s t urbine Die se l IP P &BOT
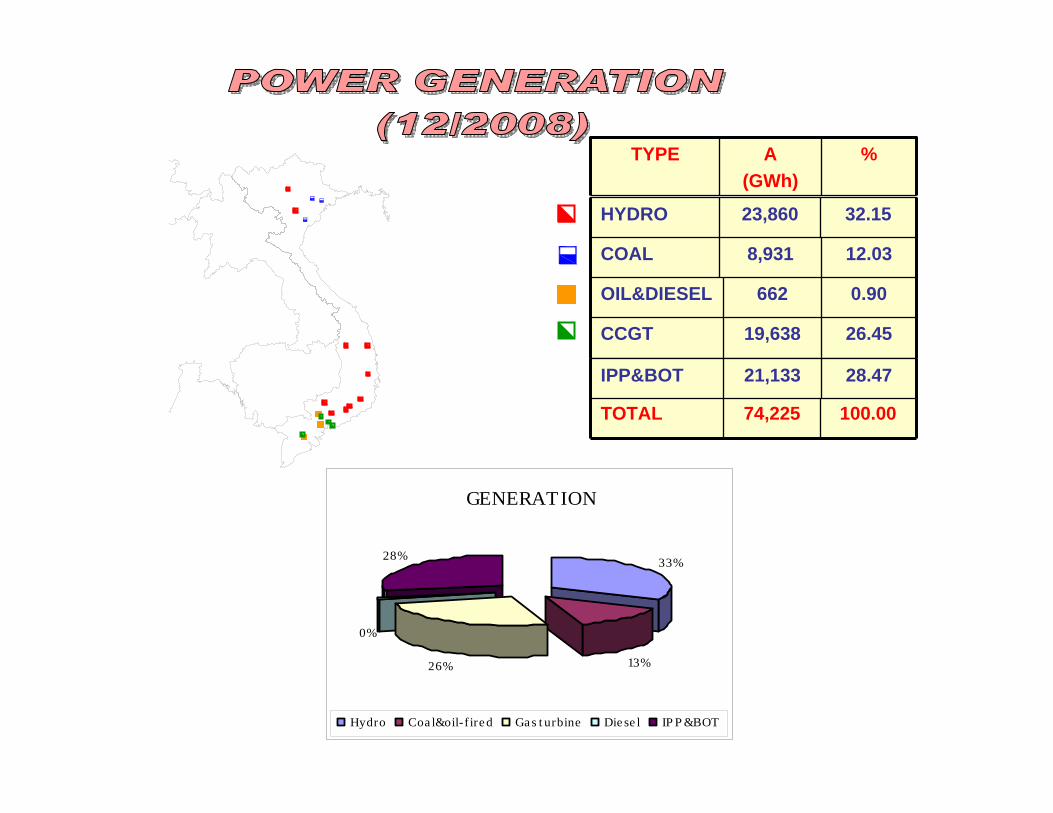
100.0074,225TOTAL
32.1523,860HYDRO
%A(GWh)
TYPE
12.038,931COAL
0.90 662OIL&DIESEL
26.4519,638CCGT
28.4721,133IPP&BOT
GENERATION
33%
13%26%
0%
28%
Hydro Coa l&oil-f ire d Ga s t urbine Die se l IP P &BOT
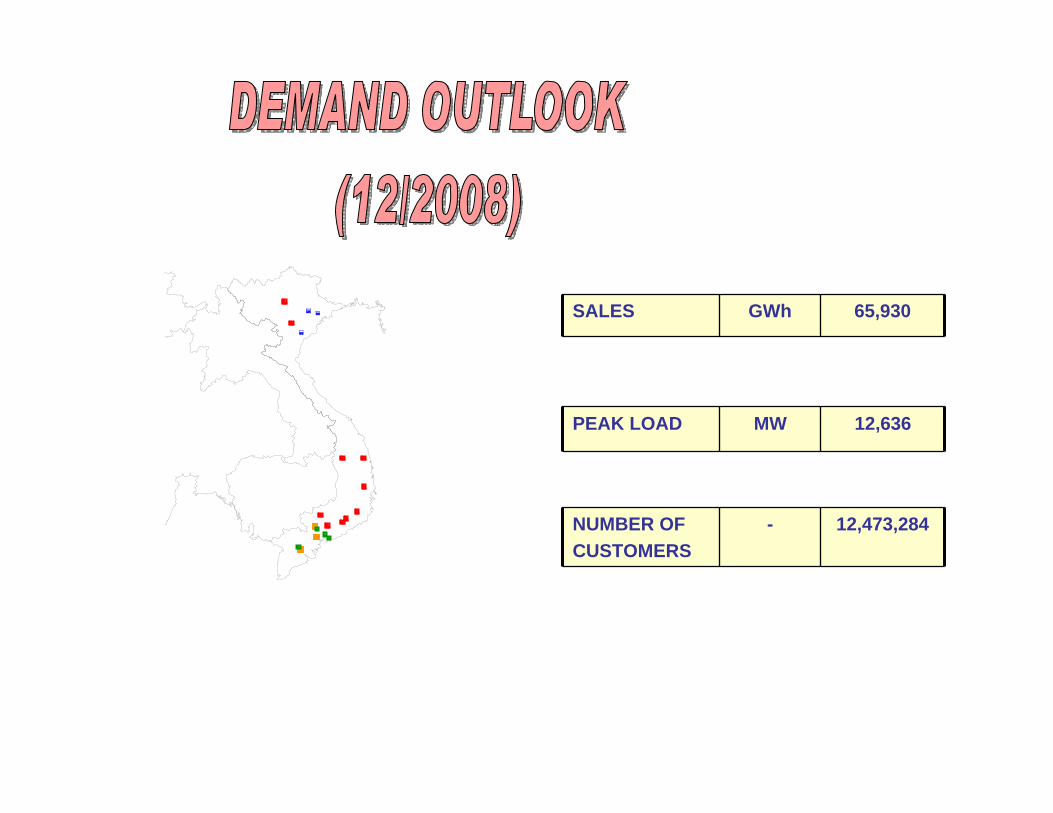
65,930GWhSALES
12,636MWPEAK LOAD
12,473,284-NUMBER OFCUSTOMERS

NATIONAL POWER DEVELOPMENT MASTER PLAN 6 (PDP 6)
PERIOD 2006 – 2015, EXTENTION TO 2025

Point of view and Objectives in power planning
• Power development is to meet electricity demand well enough
• Ensuring the construction of hydro plants with multiple objectives by regulated schedule
• Developing gas-fired thermal plants reasonably and efficiently
• Enhancing the construction of coal-fired thermal plants • Developing small hydro plants and renewable energy for
far regions, highland, boundary and islands areas

• Ensuring national energy security• Developing power centers in suitable areas of country is
to increase electricity supply reliability and reduce transmission loss,…
• Taking into consideration of using new technology and satisfying environmental criteria
• Diversifying investment schemes in distribution network and generation sources;
• Studying Nuclear Power Plant development• …..
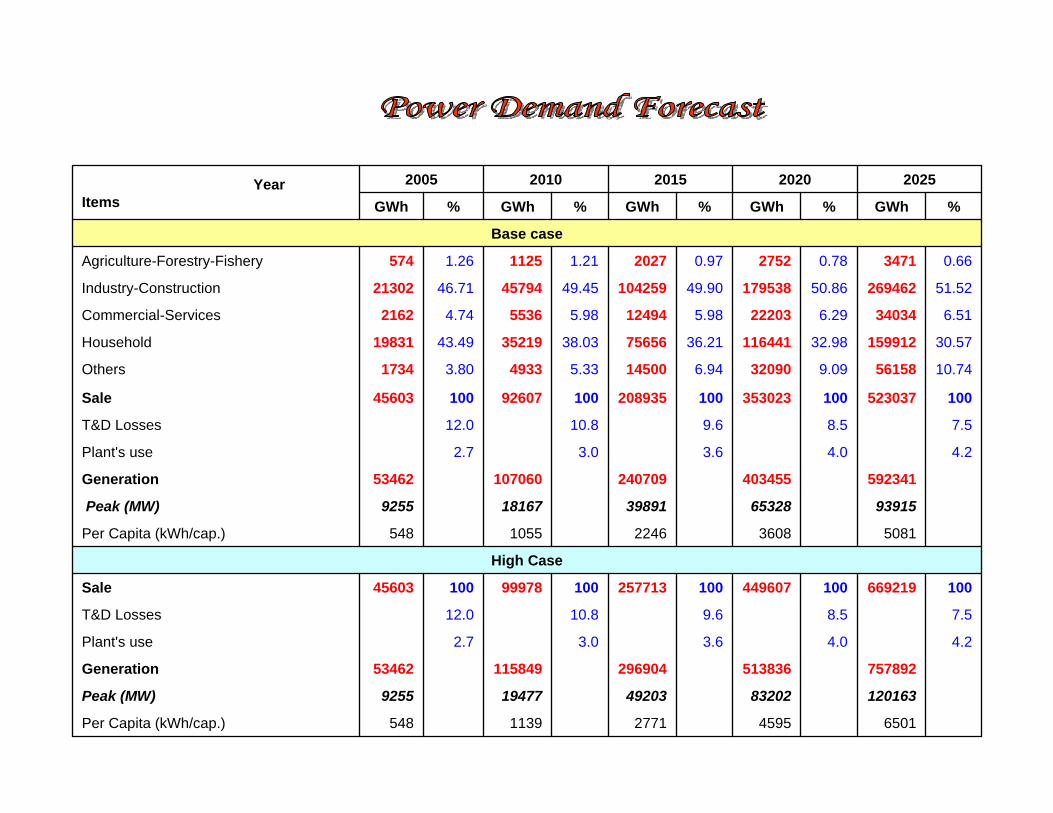
6501459527711139548Per Capita (kWh/cap.)
1201638320249203194779255Peak (MW)
75789251383629690411584953462Generation
4.24.03.63.02.7Plant's use
7.58.59.610.812.0T&D Losses
1006692191004496071002577131009997810045603Sale
High Case
5081360822461055548Per Capita (kWh/cap.)
939156532839891181679255Peak (MW)
59234140345524070910706053462Generation
4.24.03.63.02.7Plant's use
7.58.59.610.812.0T&D Losses
1005230371003530231002089351009260710045603Sale
10.74561589.09320906.94145005.3349333.801734Others
30.5715991232.9811644136.217565638.033521943.4919831Household
6.51340346.29222035.98124945.9855364.742162Commercial-Services
51.5226946250.8617953849.9010425949.454579446.7121302Industry-Construction
0.6634710.7827520.9720271.2111251.26574Agriculture-Forestry-Fishery
Base case
%GWh%GWh%GWh%GWh%GWh
20252020201520102005Year Items

Electricity production 107 TWh 257 TWhPmax whole country: 18167 MW 39891 MWTotal installed capacity: 25199 MW 52583 MWIn which: Hydropower ~ 9027MW (35.8%); 16282 (31.0%)
Oil and gas TPPs: ~ 8485MW (33.7%);11210 (21.3%)
Coal TPPs: ~ 6275MW (24.9%); 21550 (41.0%)
Imported: ~ 968MW ( 3.8%): 2117 ( 4.0%)
Renewable power ~ 444MW ( 1.8%)1424 (2.7%)

Electricity production 403 TWh 592 TWhPmax whole country: 65328 MW 93914 MWTotal installed capacity: 83221 MW 118571 MWIn which: Hydropower ~ 19445MW (23.4%); 21845 (18.4%)
Oil and gas TPPs: ~ 17210MW (20.7%);19460 (16.4%)
Coal TPPs: ~ 35750MW (43.0%); 61150 (51.6%)
Renewable power ~ 2774MW ( 3.3%);3824 ( 3.2% )
Imported: ~ 7042MW ( 8.5%) 7292 ( 6.1%)
Nuclear power: ~ 1000MW ( 1.2%) 5000 (4.2%)
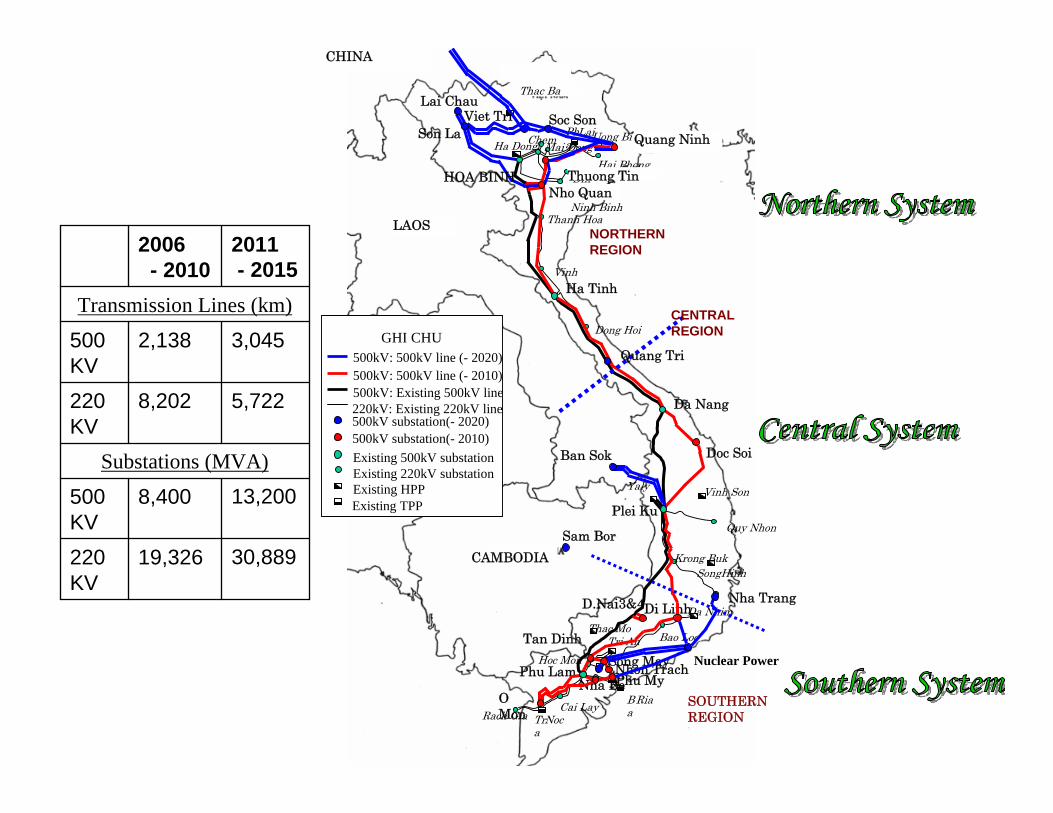
Pha
LaiUong Bi
Hai Phong
Ninh BinhThanh Hoa
ChemHa Dong
Ha TinhVinh
Dong Hoi
Yaly Vinh SonPlei Ku
Quy Nhon
SongHinh
Thac MoDa Nhim
Bao LocTri An
Ba
RiaTra
NocRach GiaCai Lay
Phu Lam
THAILAND
LAOS NORTHERN REGION
CHINA
CAMBODIA Krong Buk
Dinh
Mai Dong
Hoc Mon
GHI CHU
500kV: Existing 500kV line220kV: Existing 220kV line
Existing 500kV substationExisting 220kV substationExisting HPPExisting TPP
Nho Quan
Di Linh
Phu MyNha Be
Thuong Tin
Quang Ninh
D.Nai3&4
Nhon TrachSong May
500kV: 500kV line (- 2010)
500kV substation(- 2010)
500kV: 500kV line (- 2020)
500kV substation(- 2020)
Son LaSoc Son
Nha Trang
Nuclear Power
Ban Sok
SOUTHERN REGION
CENTRAL REGION
Lai Chau
HOA BINH
Viet Tri
Quang Tri
Da Nang
Doc Soi
Sam Bor
Tan Dinh
O Mon
Thac Ba
13,2008,400500 KV
30,88919,326220 KV
5,7228,202220 KV
3,0452,138500 KV
Substations (MVA)
Transmission Lines (km)
2011- 2015
2006- 2010

National Power Generation Development Plan for the period 2006-2015,
with outlook to 2025

The demand growth rate: the planned growth rate of 17% (GDP was 8.5%). In fact, that of 2008 was 11.2%(GDP was 6.18%) and that of 2009 is estimated of 9.4%(GDP be 5.0%).
The commission schedules of power generation projects: the completion of projects delayed half to one year.
The differences to the planned targets of PDP 6

The formation of Nation Power Transmission Corporation (NPT) under Vietnam Electricity. Transmission charge was applied
Electricity tariff was increased by 8.9% since March 01 2009
220 kV Interconnection to Takeo –Phnom Penh (Cambodia) was energized
Updates on the power sector
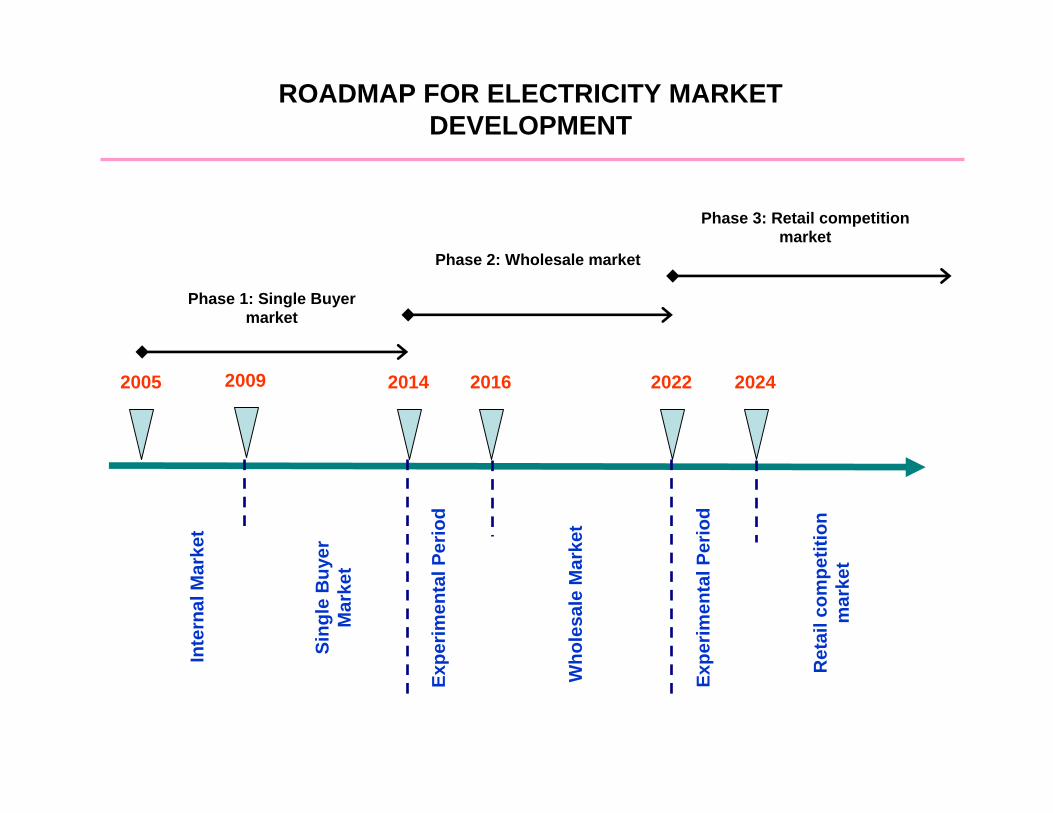
ROADMAP FOR ELECTRICITY MARKET DEVELOPMENT
2005 2009 2014 2016 2022 2024
Phase 1: Single Buyer market
Phase 3: Retail competition market
Inte
rnal
Mar
ket
Sing
le B
uyer
M
arke
t
Who
lesa
le M
arke
t
Ret
ail c
ompe
titio
n m
arke
t
Phase 2: Wholesale market
Expe
rimen
tal P
erio
d
Expe
rimen
tal P
erio
d

Current Obstacles and Challenges
- PPA is not adequate to attract investors.
- Fuel supply infrastructure.
- Lacking of investment for power projects development, especially to transmission line projects.

Opportunities
- Electrical demand increased at high rate has created opportunities for investors.
- Political situation is stable.
- The Government has supported investors in developing power projects in terms of low tax, low interest loan, …..

Key Actions Required
1. Issuing regulations for electrical market operation.
2. Approving strategy and planning on renewable energy development.
3. Approving Decree on promoting the utilization and development of renewable energy.

Time line
Up to 2010: Key actions mentioned in the previous slide should be completed.
In the period 2010-2015: should implement other relevant regulations to support sustainable energy sector development.

Areas where Assistance Needed
- Capacity building for staff at relevant levels concerned implementing power projects.
- Foreign loan with long term and low interest rate to buy appropriate technology with reasonable price.
- Cooperation and collaboration between G8 and Vietnam in the near future.