poverty self-sufficiency - act rochester poverty and financial...poverty and self-sufficiency 3 list...
TRANSCRIPT

Poverty and Self-Sufficiencyin the Nine-County Greater Rochester Area
SEPTEMBER 2016
SPECIAL UPDATE

POVERTY AND SELF-SUFFICIENCY 2
Prepared for: Rochester Area Community Foundation and ACT Rochester
500 East Avenue
Rochester, NY 14607
585.271.4100
www.racf.org
www.ACTRochester.org
Prepared by: Funded by:
Strategic Community Intervention, LLC Ralph C. Wilson, Jr. Foundation
William A. Johnson, Jr. Founder and CEO Fund for Smart Strategy at
Edward J. Doherty, Project Manager and Editor Rochester Area Community
Cam Hebda, Researcher and Writer Foundation
POVERTY AND SELF-SUFFICIENCY 3
List of Charts, Tables, and Maps
Section Chart # Chart Title Page #
Introduction Table A Comparison of Self-Sufficiency Standard
and Federal Poverty Level 9
Table B Poor, Near Poor and Self-Sufficient 10
Section 2 Chart 1 Our Region’s Poor – Numbers and Rates 12
Chart 2 Poverty Rates by Age 12
Chart 3 Poor People by Age 12
Chart 4 Poverty Rate Comparisons – 9-County Region,
New York State, United States 13
Chart 5 Poverty by Race and Ethnicity 13
Chart 6 Poverty and Family Structure 15
Section 3 Chart 7 Poverty Rate by County 16
Chart 8 Poverty Rate and Poor People by County 16
Chart 9 City-Suburb Poverty Rates 17
Chart 10 Poverty Rate and Poor People by
City-Suburban Location 18
Chart 11 Poverty Rates by Geographic Area 18
Chart 12 Poverty in Our Region’s Cities 19
Chart 13 Poverty Rates by Jurisdiction Type 19
Chart 14 Population and Poverty Rates by
Jurisdiction Type 20
Chart 15 Poverty in Selected Villages 21
Map 9-County Region 22
Section 4 Chart 16 Top 10 Highest City Poverty Rates
(among the Top 75 Metropolitan Areas) 23
Chart 17 Poverty Rates for Cities Rochester’s Size 24
Chart 18 Comparative Poverty Rates 25
Chart 19 Number of City of Rochester Census Tracts
with Poverty of 40% or More 26
Chart 20 Self-Sufficiency for Monroe County –
City and Suburbs 27
Section 5 Chart 21 Rochester’s Rank Among Comparably
Sized Cities for Selected Characteristics 28

POVERTY AND SELF-SUFFICIENCY 4
Table of Contents
Section Section Title Page #
Executive Summary Executive Summary 5
Introduction Introduction 7 A. Background 7 B. Understanding Poverty 8 C. Poverty and Self-Sufficiency 8
Sidebar: A Conversation with 3,000 Friends 8
Section 1 Overview 11
Section 2 Who Are Our Poor? 11 A. Poverty and Age 11 B. Poverty and Race/Ethnicity 13 C. Poverty and Families 14
Section 3 Where Do Our Poor Live? 15 A. Poverty by County 16 B. Poverty and Geographic Location 17 C. Poverty and Cities 19 D. Poverty and Towns 19 E. Poverty and Villages 20
Section 4 The Concentration of Poverty 22 A. Rochester’s Poverty among the Nation’s Cities 23 B. Rochester’s Poverty among Comparably Sized Cities 24 C. Neighborhoods of Extreme Poverty 25 D. Poverty and Self-Sufficiency 26
Section 5 Benchmarking Update 28
Section 6 Understanding and Action 29 A. Understanding and Action 29 B. New York State Initiatives 30 C. Rochester Monroe Anti-Poverty Initiative 31 D. City of Rochester, Office of Innovation 32 E. Roc the Future 33 F. Pathways to Prosperity 33 G. Connected Communities 33 H. Other Efforts 34
Section 7 Conclusion 34
End Notes 35 APPENDIX A Poverty Data for all Regional Municipalities 38
APPENDIX B Metro and Principal City Poverty Rates: Top 75 U.S. Metropolitan Areas 43
APPENDIX C Poverty, Near Poverty, and Self-Sufficiency Rates by County 45
APPENDIX D Federal Poverty Level for 2016 46

POVERTY AND SELF-SUFFICIENCY 5
Executive Summary
Two previous reports of Rochester Area Community Foundation and ACT Rochester (in 2013 and 2015) have helped our community focus on the related issues of poverty and the concentration of poverty in our region. Since publication of these reports, little change has occurred in the numbers, but noteworthy changes have transpired in our community’s readiness to act.
A. A Look at the Numbers Updating the data, we find that:
Poverty continues to grow in our 9-county region. The most current regional poverty rate is 14.3% (up from 13.2% noted in the first report). The region is now home to more than 167,600 people living below the federal poverty level.
Poverty within the City of Rochester continues to be extraordinary, with a rate of 33.8% (up from 31.1% in the first report).
Rochester continues to be the 5th poorest city in the United States, among the top 75 metropolitan areas.
Compared with cities its size, Rochester now ranks:
o 2nd in overall poverty (33.8%);
o 1st in child poverty (52.5%);
o 1st in the rate of extreme poverty (below half the federal poverty level – 16.4%);
o 1st in poverty rate for female-headed families in general and for female-headed families with children; (49% and 59.9% respectively); and
o 2nd in poverty among individuals with less than a high school education (44%).
About 47% of the City of Rochester’s people living in poverty are the women and children of female-headed households. The children of these families account for 81% of the City of Rochester’s childhood poverty.
African Americans and Latinos are more than three times likelier to be poor than those identifying as non-Latino white, a deeply disturbing and persistent disparity in our region.
Updated analysis by the Brookings Institution found that Rochester has the nation’s 3rd highest concentration of poor people living in extremely poor neighborhoods (census tracts). This ranking is the same as that cited in the first report, but

POVERTY AND SELF-SUFFICIENCY 6
Brookings reports that the number of such Rochester neighborhoods has grown from 27 to 37.
An estimate prepared for this report found that about 24% of our region’s residents who are above the federal poverty level have incomes that are too low to be considered self-sufficient. For the City of Rochester, that estimate is about 31%, which added to those living below the federal poverty level, yields the reality that about one third of all City of Rochester residents can be considered self-sufficient.
B. The Community Organizes
These findings are daunting. Yet, the community response to our
poverty reality has been bold and unprecedented.
The centerpiece of our community response is the Rochester
Monroe Anti-Poverty Initiative (RMAPI), which has established
bold goals for reducing our poverty both in Rochester and Monroe
County:
15% reduction in 5 years;
30% reduction in 10 years; and
50% reduction in 15 years.
This report describes the efforts of six initiatives to align their work
and coordinate their programs in combating poverty in greater
Rochester (Section 6). These initiatives involve hundreds of
residents collaborating together as professionals and volunteers.
They also involve strong efforts to engage low-income residents in
their work.
New York State Initiatives
Rochester-Monroe Anti-Poverty Initiative (RMAPI)
City of Rochester, Mayor’s Office of Innovation and Strategic
Initiatives
ROC the Future
Pathways to Prosperity
Connected Communities
Certainly the community has made a strong start.

POVERTY AND SELF-SUFFICIENCY 7
Introduction A. Background
Rochester Area Community Foundation and ACT Rochester have enhanced community awareness of the complex challenges of poverty and the concentration of poverty in this region (“Region” includes the following nine counties: Genesee, Livingston, Monroe, Ontario, Orleans, Seneca, Wayne, Wyoming, and Yates). Through their educational work, these allied organizations have helped inform the community of the depth of Rochester’s poverty and the exceptional character of our region’s concentration of those in poverty. Among the organizations’ educational awareness activities was publication of two important studies.1 The first, “Poverty and the
Concentration of Poverty in the Nine-County Greater Rochester Area,” was released in December of 2013. This report “served as a wake-up call”2 by exploring the breadth and depth of regional poverty and the extraordinary concentration of poverty. It also explored the implications of poverty on individuals and our community, and offered observations on how our community developed such a strong concentration of its poor population. The second report, “Benchmarking Rochester’s Poverty,” was issued in January of 2015. It updated key data from the 2013 report and added a deeper benchmarking analysis of cities in comparably sized U.S. metropolitan areas. Among other sobering findings, the 2015 report revealed Rochester as the first U.S. city its size with more than half its children living in poverty. This current report has three principal goals:
To update key elements from both previous studies, including poverty data for all the counties, towns and villages in the region, relying primarily on the latest U.S. Census data;
To highlight the financial stress that exists in our community by differentiating between poverty and self-sufficiency; and
To chronicle and summarize efforts of the greater Rochester community to understand and act upon our crisis.
It is important to state from the onset that this study is not an evaluation of community efforts, including the Rochester Monroe Anti-Poverty Initiative (RMAPI). Most of the data used in this examination is from the U.S. Census, American Community Survey for 2010-14, reflecting data that is substantially from a time
POVERTY AND SELF-SUFFICIENCY 8
before RMAPI began its work. Moreover, our poverty crisis emerged gradually over decades. It will require complex, long-term work to overcome. It is hoped that this report will continue to build community awareness, and will add to our collective understanding in ways that support action.
B. Understanding Poverty For some, poverty is about statistics and sociological theory. For others it is about the real life experience of living in poverty, an experience characterized as much by a loss of hope as a want of material things. The 2013 report included the stories of Shynetta, Mercy, and Adam - not real names, but real people! Each person’s story was unique, but collectively they showed how health problems, abusive relationships, loss of employment, and life’s misfortunes can combine to drive whole families into poverty, and conspire to keep them from overcoming it. While data is an incomplete way of understanding poverty, we are compelled to know the data, and to attempt to understand the meaning behind the data. The most common and statistically reliable method of measuring poverty is to use the federal poverty level. The value of the federal poverty level data is that it is tracked uniformly and updated annually by the U.S. Census. It is good data for comparisons, among communities and over time.
Most of the data used in this report is from the U.S. Census,
American Community Survey (ACS) for 2010-14. The ACS
conducts ongoing surveys in the community and releases
the data annually, reflecting the most recent year and a five-
year average. The five year average is considered the most
accurate because using the longer-term information reduces
the statistical margin of error. The two previous Rochester
Area Community Foundation/ACT Rochester reports utilized
the five-year average ACS. This report does also.
C. Poverty and Financial Self-Sufficiency
One of the frequent questions asked about the federal
poverty level is: Does it measure the income needed for
individuals and families to be financially self-sufficient? The
answer is a resounding no!
A Conversation With 3,000 Friends
As part of the effort to promote
awareness of our poverty,
numerous forums, panels, and
community discussions have
taken place over the past three
years. One such program was
a series of more than 60 “road
show” presentations made by
Ed Doherty, retired vice
president of the Community
Foundation and principal
researcher and author of the
2013 and 2015 reports. Here,
Ed shares some of his
observations from these
sessions.
► Enormous interest exists
among the general public, both
in the City and the suburbs.
More than 3,000 residents
came out on snowy evenings
and sunny Saturdays to learn
the facts and realities of our
poverty.
► The data is not a big
surprise to those who are poor
or who work with the poor. But
many others expressed shock!
► Most residents view our
teeming poverty as an affront
to our civic pride. The most
common question is: How did
this happen?
POVERTY AND SELF-SUFFICIENCY 9
Developed in 1963, the federal poverty level is based on a
subjective assumption of the relationship between the cost of
food and other basic needs.3 It is updated annually for
general inflation, but it bears no relationship to the actual
needs of individuals or families. Simply stated, the federal
poverty level does not measure financial self-sufficiency.
Financial self-sufficiency is generally defined as the level of
income needed by individuals or families to meet basic needs
without external subsidy. This income level is not regularly
measured, though useful periodic studies have been
performed. One notable effort was “The Self-Sufficiency
Standard for New York, 2010.” 4 This report developed a Self-
Sufficiency Standard for each county, using the actual costs
of food, housing, transportation, health care, child care,
taxes, and several other items of basic need.
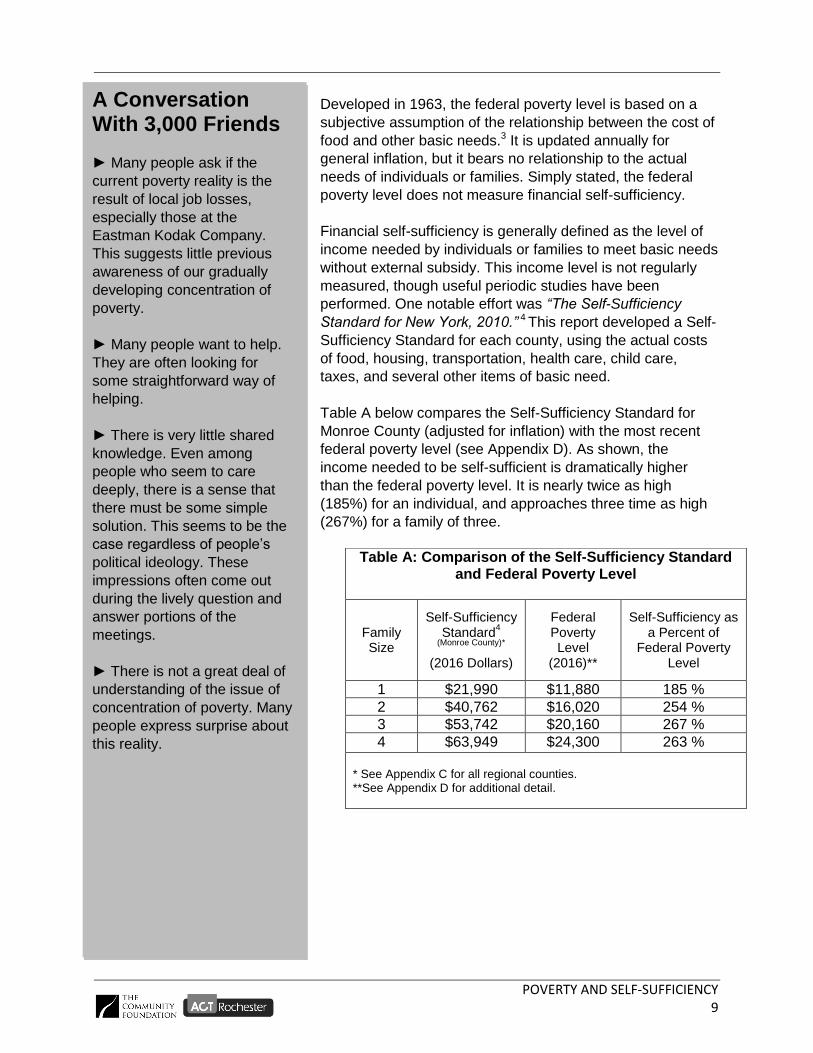
Table A below compares the Self-Sufficiency Standard for
Monroe County (adjusted for inflation) with the most recent
federal poverty level (see Appendix D). As shown, the
income needed to be self-sufficient is dramatically higher
than the federal poverty level. It is nearly twice as high
(185%) for an individual, and approaches three time as high
(267%) for a family of three.
Table A: Comparison of the Self-Sufficiency Standard and Federal Poverty Level
Family Size
Self-Sufficiency Standard
4
(Monroe County)*
(2016 Dollars)
Federal Poverty Level
(2016)**
Self-Sufficiency as a Percent of
Federal Poverty Level
1 $21,990 $11,880 185 %
2 $40,762 $16,020 254 %
3 $53,742 $20,160 267 %
4 $63,949 $24,300 263 %
* See Appendix C for all regional counties. **See Appendix D for additional detail.
A Conversation With 3,000 Friends
► Many people ask if the
current poverty reality is the
result of local job losses,
especially those at the
Eastman Kodak Company.
This suggests little previous
awareness of our gradually
developing concentration of
poverty.
► Many people want to help.
They are often looking for
some straightforward way of
helping.
► There is very little shared
knowledge. Even among
people who seem to care
deeply, there is a sense that
there must be some simple
solution. This seems to be the
case regardless of people’s
political ideology. These
impressions often come out
during the lively question and
answer portions of the
meetings.
► There is not a great deal of
understanding of the issue of
concentration of poverty. Many
people express surprise about
this reality.

POVERTY AND SELF-SUFFICIENCY 10
Although the U.S. Census doesn’t track self-sufficiency
data, fairly accurate estimates can be developed using
income and family data. Using such an estimate5, Table B
shows that nearly 38% of people in the nine-county region
have incomes that are not self-sufficient - 14.3% who are
below the federal poverty level and an additional 23.4%
described here as “near poor” (above the poverty level but
below the Self-Sufficiency Standard). Data for Monroe
County is very similar to that of the region.
We will see later (Section 4) that self-sufficiency data for the
City of Rochester provides additional evidence of the extent
to which poverty (and near poverty) in our region is highly
concentrated.
Table B: Poor, Near Poor and Self-Sufficient
62.3% 61.2%
23.4% 23.4%
14.3% 15.4%
0.0%
10.0%
20.0%
30.0%
40.0%
50.0%
60.0%
70.0%
80.0%
90.0%
100.0%
9-County Region Monroe County
Self-Sufficient Near Poor Poor
Poor: Below the federal poverty level
Near Poor: Above the federal poverty level, but below the Self-
Sufficiency Standard – see end note #4
Self Sufficient: Above the Self-Sufficiency Standard
Source: Estimate calculated for this report – see end note #5
A Conversation With 3,000 Friends
► People are often skeptical
about local efforts to confront
our poverty. Those who are
most positive tend to be those
who have the most information.
People frequently express an
interest in getting regular
updates.
► People often express
frustration over their perception
of a lack of action and lack of
leadership.
► The largest portion of
participants were from faith
groups (1,153) followed closely
by academic groups (1,092).
Business, government and
non-profit organizations
combined for the next largest
portion (464) and civic and
general public audiences
account for the remaining
portion (420).
► Many of the faith and
academic groups have
continued their involvement
with the issue of poverty,
including some that have
formed coalitions and other
organizations to continue their
involvement.

POVERTY AND SELF-SUFFICIENCY 11
The major point of this discussion of poverty and self-sufficiency is to caution the reader that data in this report tends to understate the degree of financial stress that exists in describing poverty and people living in poverty. There are a significant number of people in our region who are above the federal poverty level, but are not financially self-sufficient. The data based on the federal poverty level is the best available for comparisons, but does not reflect the degree to which individuals and families struggle to be self-sufficient.
Section 1: Overview The latest Census data enumerates 167,603 individuals living
below the federal poverty level in our 9-county region. This is an
increase of nearly 7,000 people in just three years. While a few
counties experienced small declines (Genesee, Wyoming, Yates),
all others saw an increase in the total number of people living in
poverty.
Using the federal poverty level, 14.3% of our region’s population is
classified as living in poverty, an increase from the 13.2% mark
noted in the 2013 Report. During the same time period, the
national poverty rate increased from 14.3% to 15.6%, and the
New York State rate increased from 14.5% to 15.6%.
Section 2: Who Are Our Poor? A. Poverty and Age
The highest poverty rate in the region is among children under
age 18 (Charts 1 & 2). For the 9-county region as a whole, 21.1%
of our children live below the federal poverty level (Chart 1,
column F). The childhood poverty rate varies considerably across
the region, ranging from 13.6% in Ontario County to 24.3% in
Yates County. For Monroe County, the childhood poverty rate is
23.3%, significantly influenced by the 52.5% childhood poverty
rate in the City of Rochester.
While the poverty rate is greatest among children, adults (age 18
to 64) account for the largest population group and the largest
number of people living in poverty (Chart 3).

POVERTY AND SELF-SUFFICIENCY 12
Chart 1: Our Region’s Poor – Numbers and Rates
Column
A
Column
B Column
C Column
D Column
E Column
F
Age
Total
Population
By Age
Percent of
Total
Population
Poor
People by
Age
Percent of
Total Poor
Population
Percent of
Population
that is Poor (poverty rate)
Under 18 264,352 21.7% 54,901 32.8% 21.1%
18 to 64 770,757 63.2% 100,237 59.8% 13.6%
65 or above 184,082 15.1% 12,465 7.4% 7.1%
Total 1,219,191 100.0% 167,603 100.0% 14.3%
Source: U.S. Census Bureau – American Community Survey (2010-14).
Percentages were calculated for this report.
Chart 2: Poverty Rates by Age Chart 3: Poor People by Age
Source (Charts 2 & 3): U.S. Census Bureau – American Community Survey (2010-14).
Since the 2013 Report, the overall population of the region
increased by a very small amount (2,035 people) and a miniscule
percentage (only 0.17 of a percent). The poverty rate of children
increased (from 18.7% to 21.1%), and children’s share of the poor
population increased correspondingly (from 31.9% to 32.8%). The
poverty rate for seniors declined (from 7.8 % to 7.1%) and the
seniors’ share of the poor population went down a full percentage
point (from 8.4% to 7.4%).
32.8%
59.8%
7.4%
Children Adults Senior Adults
21.1%
13.6%
7.1%
0.0%
5.0%
10.0%
15.0%
20.0%
25.0%
Children Adults Seniors
Poverty Rates

POVERTY AND SELF-SUFFICIENCY 13
Chart 4: Poverty Rate Comparisons – 9-County Region, New York State, United States
Source: U.S. Census Bureau – American Community Survey (2010-14).
As shown in Chart 4, the poverty rates in our region are slightly
lower than the national and NY State levels for most age groups.
Seniors in our area have a notably lower poverty rate than their
national and statewide counterparts.
B. Poverty and Race/Ethnicity
African Americans and Latinos are more than three times likelier
to be poor than those identifying as non-Latino white, a deeply
disturbing and persistent disparity in our region. Members of these
groups are more than three times likely to be poor than those
identified as white (Chart 5). And, African Americans and Latinos
in our region are considerably more likely to be poor than people
in the same racial and ethnic groups elsewhere in the U.S. or in
New York State.
Chart 5: Poverty by Race and Ethnicity
Location All Whites African
American Latino Asian
9-County Region 14.3% 10.6% 36.2% 34.3% 19.4%
United States 15.6% 12.8% 27.3% 24.8% 12.7%
NY State 15.6% 11.3% 23.5% 25.9% 18.4%
NY State without NYC 11.8% 9.6% 24.0% 19.4% 13.4%
Source: U.S. Census Bureau – American Community Survey (2010-14).
21.1%
13.6%
7.1%
14.3%
22.1%
14.3%
11.4%
15.6%
21.9%
14.6%
9.4%
15.6%
0.0%
5.0%
10.0%
15.0%
20.0%
25.0%
Children Adults Seniors All
9-County Region NY State US

POVERTY AND SELF-SUFFICIENCY 14
The overall poverty rate of our region increased slightly over the
past 3 years, and it increased slightly for every ethnic group. The
disparity between whites and both African Americans and Latinos
continues to be dramatic, and actually widened very slightly over
the past three years.
The nexus of poverty and race is a profoundly important issue for
our region. It is hard to see how serious amelioration of our
poverty circumstance is possible without a mature understanding
of this issue. ACT Rochester has tracked data that shows the
breadth and depth of racial and ethnic disparities (in addition to
poverty) in our area.6 This data shows that racial and ethnic
disparities are prevalent throughout the life cycle of people of
color, including infant mortality, academic outcomes, income, and
homeownership. It also shows that disparities among racial and
ethnic groups are larger in our region than in the nation as a whole
or statewide in New York.
C. Poverty and Families
As described in Chart 6, family matters. Overall, the region’s
families have a poverty rate of 10.2%. Married couple families
have a much lower poverty rate than the average (3.6%), while
female-headed families have a dramatically higher poverty rate
(31.9%), and female-headed families with children experience an
even higher rate of poverty (42.5%). This pattern is evident in
every county, as well as the City of Rochester.
For the City of Rochester, the poverty rate for female-headed
families with children under 18 is nearly 60%. While the City is
home to only 17% of the total region’s population, it is the
residence of 36% of the female-headed households with children
under age 18. There are 15,333 female-headed families with
children under the age of 18. Given a poverty rate of 59.9% and
an average family size of 3.5 for these families, this group
comprises approximately 32,100 individuals, which accounts for
47% of all people living in poverty within the City of Rochester.
The children of these families represent 81% of all poor children in
Rochester, or slightly over 21,000 children.
Obviously, these findings suggest that strategies to ameliorate
poverty among this sub-group could be critical.

POVERTY AND SELF-SUFFICIENCY 15
Section 3: Where Do Our Poor Live? People live in poverty in every county, city, town, and village in our region. This section of the report will explore the geography of regional poverty by examining the incidence of poverty by physical area and types of governmental jurisdiction. Our community is not unique in that poor populations tends to exist in relatively small areas, especially in cities. As further described in Section 4 of this report, that concentration is exceptional when compared to other communities. While the City of Rochester is home to the largest population of people in poverty (68,222), a majority of the region’s poor population (nearly 60%) live outside of Rochester.
Chart 6: Poverty and Family Structure
Poverty Rates for Families with Different Characteristics
Column A Column B Column C Column D Column E Column F
County, Region, or
City
All
Families
Families
with
Children
under 18
Families of
Married
Couples
Female Headed
Families
- No Husband
Present*
Female Headed
Families
- No Husband
Present with
Children under 18*
Monroe** 11.2% 19.8% 3.4% 33.2% 44.5%
Genesee 9.1% 16.4% 5.2% 28.8% 43.1%
Livingston 9.9% 17.8% 4.0% 33.8% 39.3%
Ontario 6.6% 12.4% 2.5% 23.2% 32.0%
Orleans 12.8% 21.9% 6.6% 33.9% 42.7%
Seneca 8.5% 14.5% 4.3% 30.0% 39.5%
Wayne 8.3% 14.8% 2.8% 30.9% 40.8%
Wyoming 6.9% 13.3% 3.0% 26.4% 36.0%
Yates 10.3% 19.5% 5.0% 29.9% 33.9%
Regional Total 10.2% 18.2% 3.6% 31.9% 42.5%
Rochester (city) 31.0% 46.6% 11.6% 49.0% 59.9%
Source: U.S. Census Bureau – American Community Survey (2010-14).
* This grouping includes single, divorced, widowed, and married women with no husband present.
** Data for Monroe County includes the city of Rochester; city data is shown separately at the bottom
for analysis purposes.

POVERTY AND SELF-SUFFICIENCY 16
A. Poverty by County Significant numbers of poor people live in every county in our region. Charts 7 and 8 below illustrate rates and the number of people living in poverty for each county. Orleans County now has the area’s highest poverty rate at 15.5%, with Monroe and Yates close at 15.4%. Monroe County, of course, is home to the largest portion of the region’s poor population (67%) and the largest number of people living in poverty (111,713). Wyoming and Ontario Counties have the lowest rates of poverty at 10.2% and 10.4% respectively.
Chart 7: Poverty Rate by County
Source: U.S. Census Bureau – American Community Survey (2010-14).
Chart 8: Poverty Rate and Poor People by County
County Poverty
Rate
Number of
Poor People
Percent of Region’s
Poor People
Orleans 15.5% 6,127 3.7%
Monroe 15.4% 111,713 66.7%
Yates 15.4% 3,706 2.2%
Livingston 14.7% 8,644 5.1%
Seneca 13.0% 4,175 2.5%
Genesee 12.6% 7,441 4.4%
Wayne 11.9% 10,926 6.5%
Ontario 10.4% 11,010 6.6%
Wyoming 10.2% 3,861 2.3%
Region Total 14.3% 167,603 100.0%
Rochester (city)* 33.8% 66,222 40.7% Source: U.S. Census Bureau – American Community Survey (2010-14).
Percentages were calculated for this report.
* Data for all counties include cities within the county; city of Rochester data is shown separately at the bottom of
this chart for information purposes.

POVERTY AND SELF-SUFFICIENCY 17
Since the 2013 Report, the regional poverty rate increased by 1.1
percentage points (13.2% to 14.3%). Every county experienced an
increase in the rate of poverty, except Yates which was
unchanged. Orleans recorded the largest increase (3.4
percentage points). Monroe, Livingston, and Seneca counties all
realized increases of 1 or more percentage points.
B. Poverty and Geographic Location
Charts 9-11 examine poverty by geographic areas within our
region. We see that the City of Rochester has a much higher
poverty rate than suburban Monroe County or the surrounding
eight counties (Chart 9), but still, the majority of the region’s poor
people live outside the City of Rochester (Chart 10). Chart 11
takes a sharper look at the areas outside of Rochester and shows
that poverty in Monroe County’s suburbs is lower than the more
rural surrounding counties. This chart also looks at east-west
locations and reveals only minor variations.
The lower poverty rates of adjacent counties (adjacent to Monroe
County) compared with non-adjacent counties is driven by a more
suburban character of some of the close-in towns among the
adjacent counties. This is illustrated in Wayne County, where the
three western towns that border Monroe County all have single-
digit poverty rates, and a combined poverty rate of 5%. The
combined poverty rate of the remaining Wayne County towns is
15%.
Chart 9: City-Suburb Poverty Rates
Source: U.S. Census Bureau - American Community Survey (2010-14).
Percentage for Suburban Monroe and Surrounding Counties were calculated for this report.
33.8%
8.3%
12.5%
Rochester Suburban Monroe Surrounding Counties

POVERTY AND SELF-SUFFICIENCY 18
Chart 10: Poverty Rate and Poor People by
City-Suburban Location
Column A Column B Column C Column D
Location Poverty
Rate
Number of
Poor People
Percent of Region’s
Poor People
City of Rochester 33.8% 68,222 40.7%
Suburban Monroe County 8.3% 43,491 26.0%
Surrounding Counties 12.5% 55,890 33.3%
Total Region 14.3% 167,603 100%
Source: U.S. Census Bureau – American Community Survey (2010-14).
Percentages were calculated for this report.
Overall, our region’s poor population grew by 4.3% from the data
used in the 2013 Report. As shown in the table below, this growth
in the number of people living in poverty was quite uniform among
the geographic areas.
2013 Report (ACS 2007-11)
This Report (ACS 2010-14)
Change % Change
Poor Populations: City of Rochester
65,486 68,222 2,736 4.2%
Suburban Monroe
41,700 43,491 1,791 4.3%
Surrounding Counties
53,513 55,890 2,377 4.4%
Total Region 160,699 167,603 6,904 4.3%
Chart 11: Poverty Rates by Geographic Area
Note Monroe West: 10 towns west of the Genesee River; Monroe East: 10 towns east of the Genesee River
Adjacent West: Orleans, Genesee; Adjacent East: Livingston, Ontario, Wayne;
Non-adjacent: Seneca, Wyoming, Yates.
Source: U.S. Census Bureau - American Community Survey (2010-14). Percentages were calculated for this report.

POVERTY AND SELF-SUFFICIENCY 19
Comparing the geographic distribution of poverty with the 2013 report, it can be seen that the overall regional poverty rate has gone up, and so has the rate for each geographic area, but the relative shares for each sub-region have remained substantially the same.
C. Poverty and Cities
In addition to Rochester, the 9-county region has three other cities. Each city has a poverty rate that is higher than its respective county. All, except Canandaigua, have poverty rates higher than the regional total. Combined with Rochester, these cities account for 20% of the region’s overall population, but 45% of the people living in poverty.
D. Poverty and Towns Nearly two-thirds of regional residents live in town areas outside of villages. These are the areas of lowest poverty. In aggregate, these areas (sometimes called unincorporated areas) have a poverty rate of 8.6%, dramatically lower than the region-wide rate of 14.3%.
Chart 13: Poverty Rates by Jurisdiction Type
Source: U.S. Census Bureau - American Community Survey (2010-14). Percentages were calculated for this report.
* Tonawanda Indian Reservation in Genesee County
Chart 12: Poverty in Our Region’s Cities
City* County* Poverty
Rate Population
Number of
Poor People
Percent of
Total County
Population
Percent of
County Poor
Population
Batavia Genesee 22.2% 15,274 3,274 25.6% 44.0%
Canandaigua Ontario 13.3% 10,532 1,368 9.7% 12.4%
Geneva Ontario 25.2% 13,202 2,738 12.1% 24.9%
Rochester Monroe 33.8% 210,461 68,222 28.1% 61.1%
Source: U.S. Census Bureau – American Community Survey (2010-14). Percentages were calculated for this report.
* The data for these cities is part of the data for the respective counties as presented elsewhere in this report. This
data is shown here separately for analysis.
33.8%
20.6% 16.7%
8.6%
18.2%
0.0%
5.0%
10.0%
15.0%
20.0%
25.0%
30.0%
35.0%
40.0%
Rochester Other Cities Villages Towns - Outside ofVillages
IndianReservation*

POVERTY AND SELF-SUFFICIENCY 20
Chart 14: Population and Poverty Rates by Jurisdiction Type
Type of Jurisdiction Number of
Jurisdictions Population
Percent of
Regional
Population
Poverty Rate
City of Rochester 1 210,461 17.3% 33.8%
Other Cities 3 39,008 3.2% 20.6%
Villages 60 154,831 12.7% 16.7%
Towns (outside villages) 126 814,891 66.8% 8.6%
American Indian Reservation 1 543 Less than .1% 18.2%
Total Region 1,219,191 100% 14.3%
Source: U.S. Census Bureau – American Community Survey (2010-14). Jurisdiction types, populations, and
poverty rates were compiled by the author from Census data.
An increase in the poverty rate in the town areas (from 6.6% to 8.6% when compared with the 2013 Report) is primarily a reflection of the overall increase in poverty in our country and region, although the dissolution of two villages (Seneca Falls in Seneca County and Pike in Wyoming County) contributes slightly to this increase.
E. Poverty and Villages
Our region’s villages vary considerably in size, with populations ranging from as little as 228 (Gainesville in Wyoming County) to more than 9,000 (Newark in Wayne County). Similarly, villages vary in character, with some serving as urban centers and others as suburban communities. Generally, villages have higher-than-average poverty rates. 32 of 51 villages outside of Monroe County have poverty rates in excess of the 9-county mark of 14.3%. However, only two of Monroe County’s nine villages are in the same circumstance, reflecting the more suburban character of these close-in villages. In aggregate, our region’s villages are home to nearly 155,000 people and have a composite poverty rate of 16.7%. A few villages have extremely high poverty rates, such as Geneseo at 46.5%. There are 19 villages with relatively low single-digit poverty rates (seven of these are in Monroe County).
Geneseo’s extremely high rate of poverty calls for more study. In the 2013 Report, it was suggested that the Village’s high poverty rate might be an artifact of being a college town, citing a relatively low childhood poverty rate as possible evidence of this conclusion. However, the updated American Community Survey data for 2010-14 lists Geneseo’s childhood poverty at 31%, ten percentage points higher than the regional average. This could reflect a more pervasive poverty problem than previously indicated. This is further complicated by a number of data anomalies observed relative to Geneseo.7 Further study should be undertaken.

POVERTY AND SELF-SUFFICIENCY 21
Chart 15 (above) lists poverty data for 16 villages from throughout the 9-county region. These 16 villages account for 55% of the total population of all villages and 60% of the poor population of all villages. The 16 villages in Chart 15 above are the same jurisdictions highlighted in the 2013 Report, except that Seneca Falls (which is no longer a village) has been deleted. Because of the small population base for most villages, they can (and do) show some significant poverty rate changes. Twelve of the villages had poverty rate increases since the 2013 Report, while four had decreases. Noteworthy among those with increases are: Webster in Monroe County (15.7% to 27.5%); Waterloo in Seneca County (7.9% to 13.8%), Warsaw in Wyoming County (8.7% to 16.9%); and the Wayne County Villages of Palmyra and Newark (from 15.2% to 20.8% and 15.0% to 20.2% respectively). The villages of LeRoy (Genesee County) and Hilton and Fairport (Monroe County) showed noteworthy declines in their poverty rates. The nine villages shown with yellow highlighting have poverty rates in excess of 20%. In the 2013 Report, only five of the selected villages were at that threshold.
Chart 15: Poverty in Selected Villages
Village County Poverty
Rate Population
Number of Poor People
Percent of Total County Population
Percent of County Poor Population
Medina Orleans 20.5% 5,962 1,171 14.0% 19.1%
Albion Orleans 26.8% 5,799 1,513 13.6% 24.7%
Warsaw Wyoming 16.9% 3,591 572 8.6% 14.8%
Le Roy Genesee 7.6% 4,348 319 7.3% 4.3%
Geneseo Livingston 46.5% 8,043 2,207 12.4% 25.5%
Dansville Livingston 21.5% 4,618 991 7.1% 11.5%
Clifton Springs Ontario 13.8% 2,293 293 2.1% 2.7%
Victor Ontario 5.6% 2,798 156 2.6% 1.4%
Newark Wayne 20.2% 9,019 1,803 9.7% 16.5%
Palmyra Wayne 20.8% 3,473 721 3.7% 6.6%
Waterloo Seneca 13.8% 5,178 661 14.7% 15.8%
Penn Yan Yates 24.1% 5,011 1,129 19.8% 30.5%
Fairport Monroe 3.4% 5,364 184 0.7% 0.2%
Webster Monroe 27.5% 5,528 1,501 0.7% 1.3%
Hilton Monroe 1.9% 5,954 116 0.8% 0.1%
Brockport Monroe 25.1% 8,398 1,440 1.1% 1.3%
Source: U.S. Census Bureau – American Community Survey (2010-14). Percentages were calculated for this report.

POVERTY AND SELF-SUFFICIENCY 22
See Appendix A for the poverty rates of all 60 villages in our
region.
Section 4: The Concentration of Poverty
For many decades, America’s cities have been home to disproportionate shares of people living in poverty. An array of public policies, social preferences, and market-driven choices have resulted in metropolitan development patterns that are characterized by class and race separation.8 While most cities, especially older Northeast and Midwest ones, have long struggled with these forces, it appears that the degree of residential segregation is stronger in Rochester.9 The resulting concentration
Data Note: For many of the analyses and charts in this section, it was
necessary to use the Census Bureau’s Metropolitan Statistical Areas
(MSAs) in order to get valid comparisons with other metro areas. For the
Rochester metro, the MSA includes only six of the nine counties included
in the earlier sections of this report. The counties of Genesee, Wyoming,
and Seneca are not included in the analysis in this section.
Map: 9-County Region (Courtesy of Genesee Transportation Council)

POVERTY AND SELF-SUFFICIENCY 23
of poverty, while typical in pattern to many other cities, is extraordinary in degree. Rochester is home to nearly 41% of the 9-county poor population, and 61% of Monroe County’s poor. These levels of concentration have not changed from those described in the 2013 Report.
A. Rochester’s Poverty among the Nation’s Cities More than ⅓ of all City of Rochester residents live below the federal poverty level - 68,222 residents in total. This poverty rate places Rochester as the 5th poorest city among the nation’s top 75 metropolitan areas (Chart 16). This ranking is unchanged from that cited in the 2013 Report. Rochester’s poverty rate is nearly 10 percentage points above the mid-point of the top 75 metro areas (24.1%), but only 6 percentage points lower than America’s poorest city (Detroit).
Chart 16: Top 10 Highest City Poverty Rates (Among the Top 75 U.S. Metropolitan Areas)
Rank City Poverty Rate
1 Detroit 39.8%
2 Cleveland 35.9%
3 Dayton 35.3%
4 Hartford 34.4%
5 Rochester 33.8%
6 Birmingham 31.0%
7 Buffalo 30.9%
8 Cincinnati 30.9%
9 Miami 29.9%
10 Providence 29.7% Source: U.S. Census Bureau – American Community Survey (2010-14)
See Appendix B for a full listing of the top 75 U.S. metro areas
with their populations and poverty rates.

POVERTY AND SELF-SUFFICIENCY 24
B. Rochester’s Poverty among Comparably Sized Cities
To get a more focused view of Rochester’s poverty, it is useful to compare with cities of comparable size. This report looks at the principal cities in all metropolitan areas whose populations are within 200,000 of Rochester’s (plus or minus). Among this group, Rochester ranks as the 2nd poorest city (Chart 17), the same ranking noted in the 2013 Report.
Chart 17: Poverty Rates for Cities of Rochester’s Size*
Rank City Poverty Rate
1 Hartford 34.4%
2 Rochester 33.8%
3 Birmingham 31.0%
4 Buffalo 30.9%
5 Fresno 30.6%
6 New Orleans 27.7%
7 Grand Rapids 26.7%
8 Richmond 25.5%
9 Tucson 25.1%
10 Bridgeport 23.6%
Mid-point of range 22.1%
11 Worcester 22.0%
12 Salt Lake City 20.9%
13 Bakersfield 20.2%
14 Tulsa 20.0%
15 Albuquerque 18.5%
16 Louisville 18.4%
17 Oklahoma City 18.2%
18 Raleigh 16.3%
19 Honolulu 9.8% * Principal cities in all metro areas within 200,000 population (+/-) of Rochester. Source: U.S. Census Bureau – American Community Survey (2010-14)
The City of Rochester’s high poverty level is especially remarkable considering that the region as a whole has a lower-than-average poverty rate. Chart 18 illustrates this point.

POVERTY AND SELF-SUFFICIENCY 25
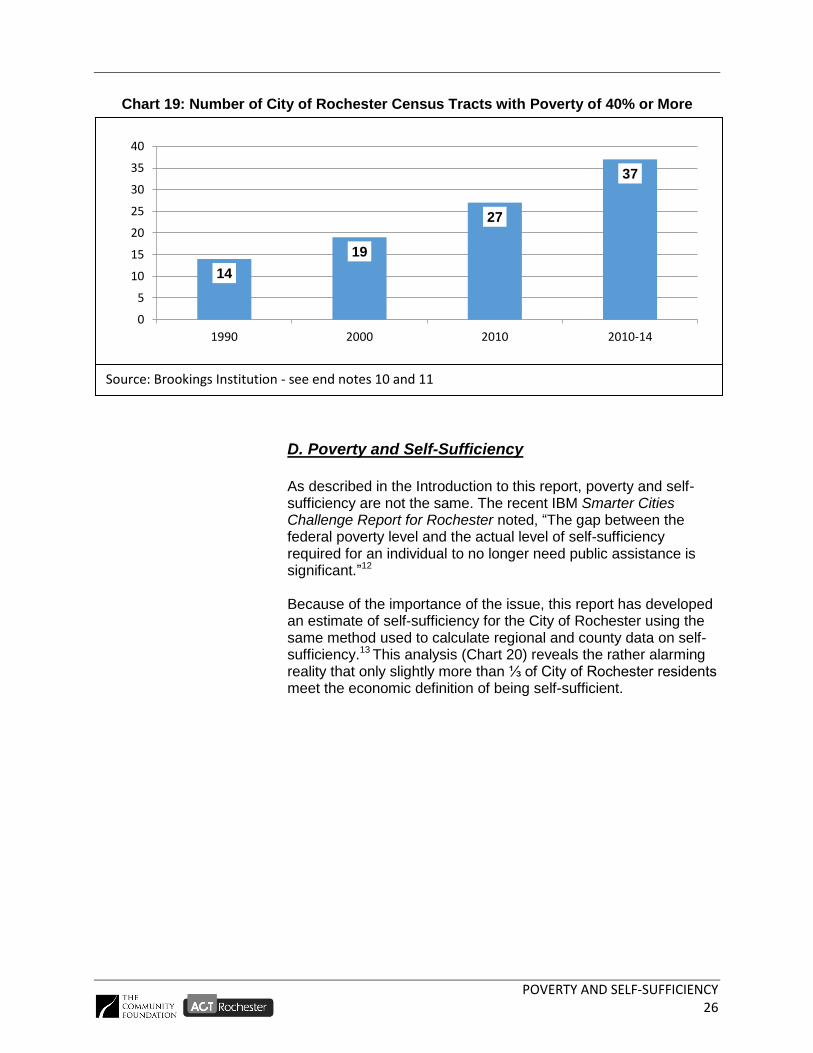
C. Neighborhoods of Extreme Poverty The 2013 Report cited a Brookings Institution study10 that examined the degree to which metro areas and their principal cities concentrated populations of poor people into extremely poor neighborhoods. These neighborhoods were defined as areas (census tracts) with poverty rates of 40% or higher. This study found the Rochester Metro area to have the 13th highest degree of poverty concentration among the nation’s top 100 metropolitan areas. That same study found that the City of Rochester had the 3rd highest rate of poverty concentration among the principal cities in the nation’s top 100 metropolitan areas. A new Brookings study11 with updated data has found that Rochester has retained these rankings – both as a metro area and as a city. This might seem to indicate stability, but in fact, the latest Brookings study showed a large increase in residents living in areas of extreme poverty. Both Brookings studies examined neighborhoods where 40% or more of the population is living in poverty. Such neighborhoods in Rochester (census tracts) have grown from 27 to 37 since the previous study. This continues the steady climb in neighborhoods of extreme poverty (see Chart 19). City census tracts with poor populations of 40% or more have nearly doubled in number over the past 14 years (2000 to 2014). During the same 14-year period, the percentage of the City’s poor population living in these extremely poor neighborhoods has grown from 34% to 59%.
15.6% 15.6% 14.3%
33.8% 39.8%
22.1%
0.0%5.0%
10.0%15.0%20.0%25.0%30.0%35.0%40.0%45.0%
U.S. NY State 9-CountyRegion
Rochester City Detroit Mid-pointComparable
CitiesSource: U.S. Census Bureau – American Community Survey (2010-14)
Chart 18: Comparative Poverty Rates
POVERTY AND SELF-SUFFICIENCY 26
Chart 19: Number of City of Rochester Census Tracts with Poverty of 40% or More
D. Poverty and Self-Sufficiency
As described in the Introduction to this report, poverty and self-sufficiency are not the same. The recent IBM Smarter Cities Challenge Report for Rochester noted, “The gap between the federal poverty level and the actual level of self-sufficiency required for an individual to no longer need public assistance is significant.”12
Because of the importance of the issue, this report has developed an estimate of self-sufficiency for the City of Rochester using the same method used to calculate regional and county data on self-sufficiency.13 This analysis (Chart 20) reveals the rather alarming reality that only slightly more than ⅓ of City of Rochester residents meet the economic definition of being self-sufficient.
14
19
27
37
0
5
10
15
20
25
30
35
40
1990 2000 2010 2010-14
Note: There are 80 census tracts in the City of Rochester Source: Brookings Institution - see end notes 10 and 11

POVERTY AND SELF-SUFFICIENCY 27
Chart 20: Self-Sufficiency for Monroe County - City and Suburbs
These findings relating to poverty and near poverty describe an
enormously challenging reality for the City of Rochester and for
the larger region as it faces the task of reducing poverty and its
impacts in our community.
34.9% 71.3% 61.2%
31.3%
20.4%
23.4%
33.8%
8.3%
15.4%
0.0%
10.0%
20.0%
30.0%
40.0%
50.0%
60.0%
70.0%
80.0%
90.0%
100.0%
City Suburbs Monroe County
Self-Sufficient Near Poor Poor
Poor: Below the federal poverty level
Near Poor: Above the federal poverty level, but below the Self-Sufficiency Standard – see end note #4
Self Sufficient: Above the Self- Sufficiency Standard
See Table A (p. 9) for poverty and self-sufficiency income levels.
Source: Estimate calculated for this report – see end note #13.
See Table A (p. 9) for income poverty and self-sufficiency income levels.

POVERTY AND SELF-SUFFICIENCY 28
Section 5: Benchmarking Update In 2015, the Community Foundation and ACT Rochester issued a second report titled, “Benchmarking Rochester’s Poverty: A 2015 Update and Deeper Analysis of Poverty in the City of Rochester.” This report compared Rochester with all cities of comparable size (all principal cities in metro areas with populations within 200,000 [+/-] of Rochester). Utilizing data from the U.S. Census American Community Survey for 2009-13, this report is still reasonably up-to-date and the report is of value to readers. Chart 21 below utilizes data updated to 2010-14 for selected characteristics, and it shows Rochester’s position relative to comparably sized cities. The key findings of this update include:
Rochester continues to rank #2 in overall poverty rate.
Rochester still ranks #1 in childhood poverty at 52.5%.
Rochester still ranks #1 in extreme poverty (below half the federal poverty level) at 16.4%.
Rochester still ranks #1 in poverty level for female-headed families (49.0%) and female-headed families with children (59.9%).
The poverty rate for those with less than a high school education has remained the same (44.0%), but Rochester now ranks #2 instead of #1.
The poverty rate for those with a Bachelor’s degree (or higher) decreased slightly from 9.7% to 9.3%; and Rochester’s rank fell from #2 to #5.
Rochester’s lowest (best) ranking is for seniors (65 and older) who have a poverty rate of 14.8%. This ranks Rochester 7th highest among comparably sized cities.
Chart 21:Rochester’s Rank Among Comparably Sized Cities for Selected Characteristics
Poverty Rate for: Rochester’s Rank in the U.S. Among Cities of Comparable Size:
1 2 3 4 5 6 7 8 9 10 11 12 13 14 15 16 17 18 19
Overall Poverty ●
Extreme Poverty* ●
Child Poverty (under 18) ●
Adult Poverty (18 to 64) ●
Seniors Poverty 65+ ●
Less than HS Education ●
Bachelor degree or higher ●
Female headed family ●
Female head. with child.*** ●
With a Disability ●
Foreign Born ●
* Percent of individuals living below half of the poverty level. ** The actual Census terminology is “Female householder, no husband present.” *** The actual Census terminology is “Female householder, no husband present, with related children under 18.”
Comparably sized cities are all principal cities in metropolitan areas within 200,000 (+/-) population of Rochester. There are now 19 cities of comparable size; there were 18 at the time of the 2015 Report. Source: U.S. Census, American Community Survey (2010-14).

POVERTY AND SELF-SUFFICIENCY 29
Section 6: Understanding and Action A. Understanding and Action The information in this report, and the previous reports, is not surprising to many, especially to those who have worked with people in poverty or who have studied the issues of poverty. Yet, to many in the community, the extent of our poverty comes as a shock. Even when a degree of awareness is achieved, there seems to be very little shared understanding of poverty, including its causes and impacts. Far too many possess a single view of poverty as something with simple solutions. With little shared understanding, people will form their own beliefs, ideas, and biases. The greater Rochester community has undertaken a great effort to focus directly on our poverty and related issues. Some see this focus as unprecedented. Below is a brief summary of the many efforts currently underway. First, we will frame a few of the overarching challenges facing the community’s effort to address the complex challenges of poverty.
The sheer magnitude and complexity of the issue is daunting. It is tempting to see poverty as a single thing. But, even a cursory review of the data requires us to think otherwise. Some people in our community are poor because they cannot find a job; others are poor because physical, mental, and other realities prevent them from doing so. Some will escape from poverty and others will face a life-long struggle. Many will find their way out of poverty, only to slide back when they cannot sustain their progress. There is abundant data to back up these observations, but there is precious little common understanding of what lies beyond the data.
Perspective matters. The position from which we view the issues will affect our sense of urgency. For academics and community professionals, it may seem important to gain greater understanding through study and dialogue. But, if you are close to poverty – personally, professionally, or through loved ones – fast action is imperative. Will those who know the value of study and analysis be supportive of immediate action where it makes sense to do so? Will those who want action be patient enough to acknowledge the need for long-term solutions that will require research and trial and error? Taking action on what we already know, while at the same time learning what we must learn is very challenging, but certainly the right course.
How do you approach such a broad societal problem on a local or regional level? In the mid-1960’s, President Lyndon

POVERTY AND SELF-SUFFICIENCY 30
Johnson launched a national “war” on poverty. The success or failure of this effort has been debated widely, but most agree that so much more needs to be done. Is it realistic to ameliorate poverty without the resources and policy might of the federal government? The partnership with New York State will be critical as the Rochester community serves as a laboratory for regional strategies to combat poverty.
There is no roadmap. Poverty has vexed political, social, academic, and religious leaders the world over for centuries. In 2014, a scan of international anti-poverty efforts was conducted for the United Way of Greater Rochester by the Center for Governmental Research.14 This study yielded valuable information about national and provincial efforts in Great Britain and Canada. It also documented many specific program-level strategies. But the study did not find comprehensive, regional-level initiatives that can serve as a model for greater Rochester. We are truly pioneers.
Strategies that combat the concentration of poverty are different than those that target poverty generally. Certainly, greatly reducing poverty will alleviate concentration. But, our great concentration of poverty presents a terrible handicap to our anti-poverty efforts, especially by neutralizing one of the best tools for fighting poverty – education. Will we find and pursue regional strategies that combat the concentration of poverty?
In the face of these great challenges, the greater Rochester community has entered into a bold and unprecedented effort to gain greater understanding of poverty and to develop strong actions. The following group of initiatives have aligned programs to support coordinated learning and action to overcome Rochester’s poverty.
B. New York State Initiatives Governor Andrew Cuomo recognized Rochester’s poverty challenges when he formed the Rochester Anti-Poverty Task Force in early 2015.15 Consisting mostly of New York State department and agency heads, the Task Force is intended to help facilitate State support for local anti-poverty efforts. The Task Force has visited Rochester to receive direct testimony from those impacted by poverty as well as those who work closely with people living in poverty. The Task Force works directly with the Rochester Monroe Anti-Poverty Initiative. In 2016, New York State expanded its anti-poverty initiative through creation of the Empire State Poverty Reduction Initiative.16 Based on the Rochester model, this program will expand the

POVERTY AND SELF-SUFFICIENCY 31
State’s initiative to additional cities and will provide additional supports.
C. Rochester Monroe Anti-Poverty Initiative (RMAPI) The centerpiece of Rochester’s anti-poverty strategy, RMAPI is a broad collaboration comprising community leaders, local and state government, service providers and practitioners, faith institutions, volunteers, youth advocates, and importantly, the active participation of people impacted by poverty. RMAPI is led by New York State Assembly Majority Leader Joseph D. Morelle, Rochester Mayor Lovely Warren, and Monroe County Executive Cheryl Dinolfo. It is convened and supported by United Way of Greater Rochester.17 The collaborative work of RMAPI is carried out through a Steering Committee and several resource and work teams, all staffed by community leaders and volunteers. RMAPI is currently assisted by a professional staff at the United Way. In September of 2015, RMAPI issued a progress report to the community.18 The report laid out the goal of reducing poverty by 50% in 15 years (30% in ten years and 15% in five years). As its initial work, the progress report offered 33 recommendations for action. These recommendations followed a structured “Roadmap” that identified three major themes, three solution areas, and the overarching goal of creating a coordinated and integrated system of social support (see illustration below).

POVERTY AND SELF-SUFFICIENCY 32
An important value of RMAPI is the active engagement of people
living in poverty. This has been fostered through several efforts:
Involvement of people living in poverty as full members of the
work teams that formed the 33 recommendations;
Focus groups and surveys to understand the barriers facing
people in poverty;
Town hall meetings to gain further input from people in poverty
and the general public; and
Current steps are being taken by RMAPI, the City of
Rochester and several other community initiatives to set up a
Community Advisory Council to provide ongoing engagement
of neighborhood residents.19
RMAPI has also partnered with the City of Rochester Mayor’s
Office of Innovation to plan and organize a number of pilot
communities as recommendations move into program actions.
After considerable data analysis and community engagement, the
eastside areas encompassing the neighborhoods of Beechwood,
EMMA, and Marketview Heights were selected.
D. City of Rochester, Mayor’s Office of Innovation and
Strategic Initiatives
Initiated by Rochester Mayor Lovely Warren, this creative
endeavor seeks to empower city departments, agencies,
businesses, and residents to continually improve.20 The current
focus is on issues of poverty in Rochester. More specifically, the
Office of Innovation is working on understanding the drivers of
poverty – concentrating on joblessness in distressed
neighborhoods. The Office of Innovation's poverty work is
partnered with RMAPI and other important community efforts.
Among the specific activities undertaken by the Office has been
coordination of an IBM Smarter Cities Rochester study that took a
systems look at the challenges faced by the community in
providing supports to help individuals and families overcome
poverty. Among its 13 recommendations, the IBM Report
advocates a “person-centered” approach to measuring social
program outcomes and the implementation of new data systems
to track these outcomes. Other activities of the Office of
Innovation include supporting RMAPI in establishing and
organizing pilot neighborhoods, conducting a door-to-door survey
of residents to more fully understand barriers and issues faced by
those in poverty, and supporting the development of market-driven
business cooperatives in challenged neighborhoods.

POVERTY AND SELF-SUFFICIENCY 33
E. ROC the Future
Established several years before RMAPI, this education reform
initiative has chosen to associate with the community’s anti-
poverty efforts. Its mission is “to promote alignment and focus
community resources to improve the academic achievement of
children in the City of Rochester.” 21 ROC the Future is part of the
national Strive Together network that focuses on collective impact
to support the success of every child from cradle to career.
F. Pathways to Prosperity
This initiative serves as the link between regional economic
development efforts and the community’s anti-poverty work in
general, and RMAPI in particular. A program of the Finger Lakes
Regional Economic Development Council, Pathways to Prosperity
was established as a key element of our region’s successful
application for support from New York State’s Upstate
Revitalization Initiative (URI). “Guided by the efforts of the
Rochester-Monroe Anti-Poverty Initiative (RMAPI), the Finger
Lakes region is committed to reducing poverty and providing
opportunities for success through targeted education and training
efforts that directly link to employment. At the core of this
approach is the relationship between education, employment, and
poverty.”22
G. Connected Communities
This new nonprofit organization has been established to work on
the holistic revitalization of the EMMA and Beechwood
neighborhoods, part of the pilot area established by RMAPI and
the City of Rochester. Connected Communities will follow the
Purpose Built Communities model of development23 that has as its
interrelated components four important pillars: neighborhood-
based cradle to college and career education, mixed income
housing, integrated wellness services and economic
development.24
This is a truly impressive list of initiatives and activities, covering
human services, education, economic development, housing and
other disciplines. More impressive than the scope is the
commitment to align and collaborate. Already, these efforts have
yielded cooperation, such as: sharing data and resources;
collaborating to engage residents; and developing coordinated
strategies. This effort at coordination and alignment is essential to
success.

POVERTY AND SELF-SUFFICIENCY 34
H. Other Efforts
Of course, these are not the only community efforts underway.
Several organizations are focusing on the issues of race, including
the nexus of race and poverty. Facing Race, Embracing Equity
(FR=EE) was set up specifically to promote an agenda of racial
equity.25Unite Rochester is an initiative of the Democrat and
Chronicle to “raise awareness about race and racism, and inspire
a more inclusive and creative approach to solving community
problems.” 26 The YWCA of Rochester & Monroe County sponsors
the annual Stand Against Racism and it operates the
Person2Person program that promotes understanding through
direct 1-on-1 interactions.27 Great Schools for All is a community
collaborative whose mission is to guarantee “access to excellent
public schools that offer opportunities and programs that are only
feasible through collaborative cross-district approaches.”28
ACT Rochester, an initiative of the Community Foundation,
continues to provide general up-to-date indicators of community
wellbeing. It is also the repository of data that supports a number
of the initiatives described here, including poverty work, education
(ROC the Future) and work related to race and ethnicity.29
Finally, it is important to realize that many organizations, groups
and individuals have worked diligently for years to combat poverty
and to serve those who are in poverty. These groups are on the
front lines and many of them continue to evolve new strategies
and approaches. For example, Action for a Better Community
(ABC) has recently announced an ambitious program (Health
Professions Opportunity Grants, or HPOG) to help low-income
individuals gain the necessary basic skills to enter employment in
the healthcare field. 30
Conclusion The challenge is so great, almost too great to comprehend. The greater Rochester community has responded with bold plans and strong early efforts to collaborate and coordinate. Clearly, this will require an unprecedented long-term commitment. To sustain this effort will require continuous improvement along the way and the continued goodwill of all sectors of the community. It will also require ongoing communication among all involved, including the general public. Rochester has achieved great things in the past. Being a national leader in combating poverty would certainly be our community’s greatest accomplishment.

POVERTY AND SELF-SUFFICIENCY 35
End Notes
1. Rochester Area Community Foundation, “Poverty and the Concentration of Poverty in the Nine-
County Greater Rochester Area,” December 2013 and Rochester Area Community Foundation,
“Benchmarking Rochester’s Poverty: A 2015 Update and Deeper Analysis of Poverty in the City
of Rochester,” January 2015
http://www.actrochester.org/poverty
2. Rochester Monroe Anti-Poverty Initiative at United Way of Greater Rochester, “Progress Report:
A Roadmap for Change,” September 2015, p. 7.
3. The federal poverty level, as used in the U.S. Census, was originally established in 1963 by
determining the income requirements for food subsistence, and multiplying that amount by three
to account for other needs. The number is updated annually based on the general rate of
inflation. There is a single rate for the entire United States (except Alaska and Hawaii). The data
is released annually by the U.S. Department of Health and Human Services. See Appendix D for
the 2016 information. https://aspe.hhs.gov/basic-report/computations-2016-poverty-guidelines
4. Diana M. Pearce, PhD, Center for Women’s Welfare, University of Washington, “The Self-
Sufficiency Standard for New York State 2010,” prepared for the New York State Self-Sufficiency
Standard Steering Committee.
http://www.fiscalpolicy.org/SelfSufficiencyStandardForNewYorkState2010.pdf
5. The Self-Sufficiency Standard (see End Note #4) establishes income requirements for various
sizes and types of families. It does not track the number of people who meet or fail to meet the
standard. To estimate these numbers, this report analyzed U.S. Census data for individuals at
various percentage gradients of the federal poverty level and U.S. Census family size data.
6. ACT Rochester, “Racial and Ethnic Disparities in the Greater Rochester Region.”
http://www.actrochester.org/race-ethnicity-indicators
7. Perhaps owing to relatively high residential turnover, the U.S. Census American Community
Survey (2010-14) data for the Village of Geneseo shows a number of unusual characteristics.
First, the statistical margin of error indicated in the Census data for the childhood poverty
indicator is 13.5 percent, considerably higher than the typical 1-5 percent for most Census data
points used in this analysis. Also, the portion of Geneseo’s population for whom the Census could
determine a poverty status was only 59%, as compared to the 95% to 97% typical for most
communities. These data anomalies do not mean that the poverty data for Geneseo is not
accurate; only that more research would be appropriate.
8. For a discussion of how these patterns ensued in Rochester, see Rochester Area Community
Foundation, “Poverty and the Concentration of Poverty in the Nine-County Greater Rochester
Area,” December 2013, Section 5 (pp. 23-33).
9. Edward Glaeser and Jacob Vigdor, “The End of the Segregated Century,” Manhattan Institute for
Policy Research, January 2012. See also “Poverty and the Concentration of Poverty in the Nine-
County Greater Rochester Area,” pp. 23-26 for a discussion of the Manhattan Institute findings
relating to Rochester and its benchmark cities.
10. Elizabeth Kneebone, Carey Nadeau, and Alan Berube, “The Re-Emergence of Concentrated
Poverty,” Metropolitan Policy Program at the Brookings Institution, November, 2011.
POVERTY AND SELF-SUFFICIENCY 36
End Notes (continued)
11. Elizabeth Kneebone and Natalie Holmes “U.S. Concentrated Poverty in the Wake of the Great
Recession,” Brookings Institution, March 31, 2016.
https://www.brookings.edu/research/u-s-concentrated-poverty-in-the-wake-of-the-great-recession/
12. Rochester, USA Smarter Cities Challenge report, IBM Corporate Citizenship & Corporate Affairs,
Armonk, NY, January 2016, p.7.
13. An estimate prepared for this report using U.S. Census ACS (2010-14) data on income and family
size and composition. See End Note #5.
14. “Reducing Poverty in Rochester: An International Scan of Options to Consider,” Center for
Governmental Research, Rochester, December 2014. Available through United Way of Greater
Rochester.
https://www.uwrochester.org/UnitedWayOfRochester/media/Our-Work-
Results/Documents/United-Way-Reducing-Poverty-in-Rochester.pdf
15. NY State Task Force on Poverty in Rochester.
https://www.governor.ny.gov/news/2015-opportunity-agenda-restoring-economic-opportunity-6
16. Empire State Poverty Reduction Initiative (ESPRI).
http://nyscommunityaction.org/nyscaa-public-policy/empire-state-poverty-reduction-initiative-and-
community-action/
17. United Way of Greater Rochester. http://www.uwrochester.org
18. United Way of Greater Rochester, RMAPI, “Progress Report: A Roadmap for Change,
September 2015.”
http://www.uwrochester.org/UnitedWayOfRochester/media/Our-Work-
Results/Documents/RMAPI-Progress-Report-October-2015-print-version.pdf
19. United Way of Greater Rochester, RMAPI.
http://www.uwrochester.org/UnitedWayOfRochester/media/Our-Work-
Results/Documents/Community-Advisory-Council-letter.pdf
20. City of Rochester, Mayor’s Office of Innovation and Strategic Initiatives
http://www.cityofrochester.gov/innovation/
21. ROC the Future http://rocthefuture.org/
22. Pathways to Prosperity.
https://www.ny.gov/sites/ny.gov/files/atoms/files/FLREDC_URI_FinalPlan.pdf
23. Purpose Built Communities http://purposebuiltcommunities.org/
POVERTY AND SELF-SUFFICIENCY 37
End Notes (continued)
24. Rochester Democrat and Chronicle, January 5, 2016.
http://www.democratandchronicle.com/story/news/2016/01/05/neighborhoods-look-national-
nonprofit-aid-renewal-beechwood-emma-rochester-purpose-built-communities/77972004/
25. Facing Race=Embracing Equity
https://www.facebook.com/FacingRaceEmbracingEquity/
26. Rochester Democrat and Chronicle, Unite Rochester
http://www.democratandchronicle.com/blog/uniterochester/
27. YWCA of Rochester and Monroe County www.ywcarochester.org
28. Great Schools for All http://gs4a.org/
29. ACT Rochester www.actrochester.org
30. Action for a Better Community (ABC), Health Professions Opportunity Grants
http://www.abcinfo.org/hpog/about-us

POVERTY AND SELF-SUFFICIENCY 38
APPENDIX A
Poverty Data for all Regional Municipalities
Listed by County, then in order of poverty within jurisdiction type
Livingston County Poverty Rate: 14.7%
Population: 64,867 Poor People: 8,644
Type Municipality Total
Population Poverty
Rate
Towns Geneseo 10,535 32.9%
West Sparta 1,332 27.1%
Mt. Morris 4,411 21.3%
North Dansville 5,461 21.3%
Leicester 2,183 15.1%
Nunda 3,026 14.1%
Springwater 2,265 11.9%
Portage 855 11.8%
Conesus 2,413 11.6%
Livonia 7,737 11.1%
Groveland 3,299 10.7%
Ossian 773 9.5%
Lima 4,224 9.5%
Sparta 1,678 8.5%
Caledonia 4,219 7.7%
Avon 7,103 5.5%
York 3,353 5.2%
Total* 64,867 14.7%
Villages* Geneseo 8,043 46.5%
Nunda 1,479 26.2%
Mt. Morris 2,610 24.0%
Dansville 4,618 21.5%
Lima 2,487 15.6%
Livonia 1,322 15.3%
Caledonia 2,219 11.8%
Avon 3,357 7.8%
Leicester 498 0.8%
* Villages are within towns and are included in the town data and “Total” row above. They are shown here separately for information.
Source:
U.S. Census – American Community Survey (2010-14)
Genesee County Poverty Rate: 12.6% Population: 59,702 Poor People: 7,441
Type Municipality Total
Population
Poverty
Rate
City Batavia 15,274 22.2%
Towns Pavilion 2,605 13.5%
Bergen 3,096 11.7%
Alabama 1,713 11.7%
Pembroke 4,314 10.9%
Oakfield 3,221 10.3%
Byron 2,292 9.8%
Darien 3,134 9.3%
Batavia 6,870 8.4%
Le Roy 7,579 7.9%
Stafford 2,342 7.9%
Bethany 1,625 7.7%
Elba 2,463 7.5%
Alexander 2,631 7.1%
Reservation Tonawanda 543 18.2%
Total* 59,702 12.6%
Villages* Corfu 792 12.6%
Oakfield 1,797 11.2%
Bergen 1,305 9.4%
Le Roy 4,348 7.6%
Alexander 528 7.5%
Elba 644 2.3%
* Villages are within towns and are included in the town data and “Total” row above. They are shown here separately for information. Note: The Village of Attica is located partially in Genesee County, but mostly in Wyoming County. It is listed in Wyoming.
Source:
U.S. Census – American Community Survey (2010-14)

POVERTY AND SELF-SUFFICIENCY 39
APPENDIX A
Poverty Data for all Regional Municipalities
Listed by County, then in order of poverty within jurisdiction type
Monroe County Poverty Rate: 15.4% Population: 748,076 Poor People: 111,713
Type Municipality Total
Population Poverty
Rate
City Rochester 210,461 33.8%
Towns East Rochester** 6,687 18.7%
Sweden 14,210 16.8%
Henrietta 43,291 13.2%
Brighton 36,870 10.8%
Gates 28,506 9.4%
Irondequoit 51,594 9.3%
Greece 96,606 8.9%
Hamlin 9,090 8.8%
Riga 5,612 8.7%
Clarkson 6,796 8.5%
Webster 43,402 6.9%
Wheatland 4,768 6.5%
Perinton 46,569 6.5%
Ogden 20,059 6.4%
Chili 28,726 6.2%
Parma 15,783 6.0%
Rush 3,473 5.8%
Penfield 36,751 4.6%
Pittsford 29,577 4.5%
Mendon 9,245 4.3%
Total* 748,076 15.4%
Villages* Webster 5,528 27.5%
Brockport 8,398 25.1%
Churchville 1,997 9.4%
Honeoye Falls 2,707 8.6%
Scottsville 2,446 6.6%
Spencerport 3,606 6.2%
Pittsford 1,507 5.1%
Fairport 5,364 3.4%
Hilton 5,954 1.9% *Villages are within towns and are included in the town data and “Total” row above. They are shown here separately for information. * *East Rochester has the dual status of a town and village. It is treated here as a town because it is not within any town.
Source:
U.S. Census – American Community Survey (2010-14)
Ontario County Poverty Rate: 10.4% Population: 108,975 Poor People: 11,010
Type Municipality Total
Population Poverty
Rate
Cities Geneva 13,202 25.2%
Canandaigua 10,532 13.3%
Towns Naples 2,505 15.1%
Gorham 4,258 13.0%
South Bristol 1,643 12.6%
Canadice 1,680 11.3%
West Bloomfield 2,533 10.6%
Manchester 9,439 10.4%
Phelps 7,039 10.0%
Canandaigua 10,285 9.6%
Farmington 12,501 9.0%
East Bloomfield 3,618 8.1%
Hopewell 3,732 6.9%
Richmond 3,333 6.1%
Geneva 3,252 5.8%
Bristol 2,294 5.7%
Seneca 2,742 5.4%
Victor 14,387 2.6%
Total* 108,975 10.4%
Villages* Rushville** 692 25.4%
Naples 1,187 16.2%
Bloomfield 1,581 15.9%
Manchester 1,691 14.9%
Clifton Springs 2,293 13.8%
Shortsville 1,387 13.3%
Phelps 2,008 11.5%
Victor 2,798 5.6%
* Villages are within towns and are included in the town data “Total” row above. They are shown here separately for information. ** Rushville is shown in Ontario County, but is located about equally in Ontario and Yates counties.
Source:
U.S. Census – American Community Survey (2010-14)

POVERTY AND SELF-SUFFICIENCY 40
APPENDIX A
Poverty Data for all Regional Municipalities
Listed by County, then in order of poverty within jurisdiction type
Orleans County Poverty Rate: 15.5% Population: 42,492 Poor People: 6,127
Type Municipality Total
Population Poverty
Rate
Towns Albion 8,442 23.8%
Shelby 5,260 21.5%
Murray 4,917 16.3%
Ridgeway 6,687 13.5%
Kendall 2,695 13.5%
Barre 2,052 13.0%
Clarendon 3,645 12.5%
Gaines 3,345 12.2%
Carlton 2,981 10.7%
Yates 2,468 5.7%
Total* 42,492 15.5%
Villages* Albion 5,799 26.8%
Holley 2,011 24.0%
Medina 5,962 20.5%
Lyndonville 797 7.9%
* Villages are within towns and are included in the town data and “Total” row above. They are shown here separately for information.
Source:
U.S. Census – American Community Survey (2010-14)
Seneca County Poverty Rate: 13.0% Population: 35,232 Poor People: 4,175
Type Municipality Total
Population Poverty
Rate
Towns Junius 1,408 21.8%
Seneca Falls 8,986 14.9%
Lodi 1,686 14.3%
Ovid 2,226 14.3%
Tyre 923 13.2%
Waterloo 7,595 12.8%
Fayette 3,928 10.8%
Covert 2,213 9.9%
Varick 1,914 9.8%
Romulus 4,353 7.6%
Total* 35,232 13.0%
Villages* Interlaken 638 19.8%
Lodi 418 14.8%
Waterloo 5,178 13.8%
Ovid 620 10.9%
* Villages are within towns and are included in the town data and “Total” row above. They are shown here separately for information. Note: Seneca Falls Village was dissolved on December 31, 2011 and did not have 2010-14 data available
Source:
U.S. Census – American Community Survey (2010-14)

POVERTY AND SELF-SUFFICIENCY 41
APPENDIX A
Poverty Data for all Regional Municipalities
Listed by County, then in order of poverty within jurisdiction type
Wayne County Poverty Rate: 11.9% Population: 92,887 Poor People: 10,926
Type Municipality Total
Population Poverty
Rate
Towns Lyons 5,596 20.5%
Palmyra 7,845 17.9%
Arcadia 14,078 17.8%
Savannah 1,340 16.9%
Sodus 8,306 15.2%
Wolcott 4,427 15.0%
Huron 2,280 13.9%
Butler 2,003 13.2%
Williamson 6,918 11.7%
Galen 4,223 11.4%
Rose 2,540 10.0%
Marion 4,702 7.8%
Macedon 9,085 6.6%
Ontario 10,129 6.3%
Walworth 9,415 2.1%
Total* 92,887 11.9%
Villages* Wolcott 1,698 27.5%
Sodus 2,226 22.8%
Lyons 3,343 22.1%
Palmyra 3,473 20.8%
Newark 9,019 20.2%
Red Creek 629 17.8%
Clyde 1,987 17.6%
Sodus Point 1,093 14.7%
Macedon 1,648 6.5%
* Villages are within towns and are included in the town data and “Total” row above. They are shown here separately for information.
Source:
U.S. Census – American Community Survey (2010-14)
Wyoming County Poverty Rate: 10.2% Population: 41,679 Poor People: 3,861
Municipality
Total Population
Poverty Rate
Towns Pike 1,088 19.9%
Warsaw 4,987 16.3%
Perry 4,534 14.9%
Wethersfield 846 14.3%
Arcade 4,177 14.3%
Genesee Falls 395 11.5%
Castile 2,873 10.8%
Middlebury 1,437 10.6%
Sheldon 2,328 9.2%
Gainesville 2,267 8.3%
Covington 1,120 7.3%
Eagle 1,194 7.0%
Orangeville 1,573 6.0%
Java 1,958 4.0%
Attica 7,564 3.8%
Bennington 3,338 2.7%
Total* 41,679 10.2%
Villages* Perry 3,383 17.6%
Arcade 2,187 15.9%
Warsaw 3,591 16.9%
Silver Springs 787 15.6%
Castile 969 13.6%
Wyoming 386 9.8%
Attica ** 2,609 5.3%
Gainesville 228 4.8%
* Villages are within towns and are included in the town data “Total” row above. They are shown here separately for information. **Attica is shown in Wyoming County, but a small part of the village is within Genesee County. Note: Pike Village, shown in 2013 Report, is now a hamlet and no longer has census data
Source:
U.S. Census – American Community Survey (2010-14)

POVERTY AND SELF-SUFFICIENCY 42
APPENDIX A
Poverty Data for all Regional Municipalities
Listed by County, then in order of poverty within jurisdiction type
Yates County Poverty Rate: 15.4% Population: 25,281 Poor People: 3,707
Type Municipality Total
Population Poverty
Rate
Towns Milo 6,924 21.0%
Italy 1,160 17.4%
Potter 2,018 17.0%
Torrey 1,523 15.5%
Starkey 3,548 14.7%
Jerusalem 4,487 13.5%
Middlesex 1,334 10.9%
Barrington 1,445 10.5%
Benton 2,842 7.6%
Total* 25,281 15.4%
Villages* Dresden 442 37.6%
Penn Yan 5,011 24.1%
Dundee 1,508 13.9%
* Villages are within towns and are included in the town data and “Total” row above. They are shown here separately for information. Note: The Village of Rushville is shown in Ontario County, but is located about equally in Yates and Ontario counties.
Source:
U.S. Census – American Community Survey (2010-14)
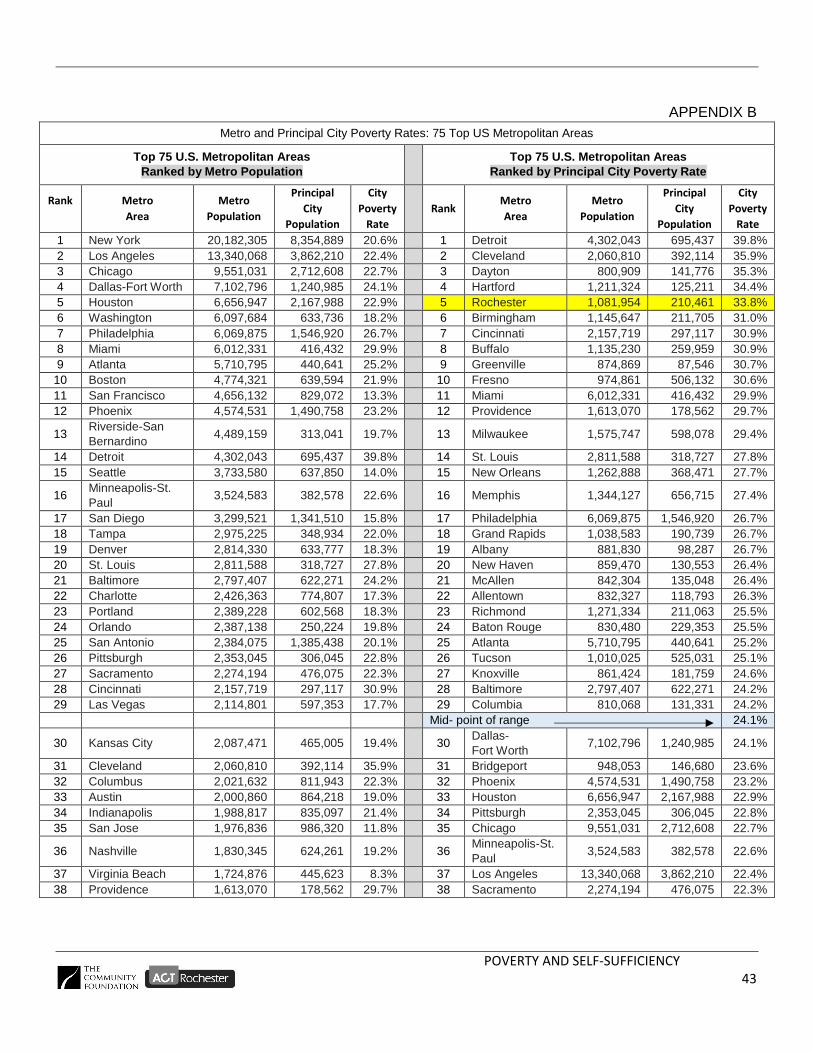
POVERTY AND SELF-SUFFICIENCY 43
APPENDIX B
Metro and Principal City Poverty Rates: 75 Top US Metropolitan Areas
Top 75 U.S. Metropolitan Areas
Ranked by Metro Population
Top 75 U.S. Metropolitan Areas
Ranked by Principal City Poverty Rate
Rank
Metro
Area
Metro
Population
Principal
City
Population
City
Poverty
Rate
Rank Metro
Area
Metro
Population
Principal
City
Population
City
Poverty
Rate
1 New York 20,182,305 8,354,889 20.6% 1 Detroit 4,302,043 695,437 39.8%
2 Los Angeles 13,340,068 3,862,210 22.4% 2 Cleveland 2,060,810 392,114 35.9%
3 Chicago 9,551,031 2,712,608 22.7% 3 Dayton 800,909 141,776 35.3%
4 Dallas-Fort Worth 7,102,796 1,240,985 24.1% 4 Hartford 1,211,324 125,211 34.4%
5 Houston 6,656,947 2,167,988 22.9% 5 Rochester 1,081,954 210,461 33.8%
6 Washington 6,097,684 633,736 18.2% 6 Birmingham 1,145,647 211,705 31.0%
7 Philadelphia 6,069,875 1,546,920 26.7% 7 Cincinnati 2,157,719 297,117 30.9%
8 Miami 6,012,331 416,432 29.9% 8 Buffalo 1,135,230 259,959 30.9%
9 Atlanta 5,710,795 440,641 25.2% 9 Greenville 874,869 87,546 30.7%
10 Boston 4,774,321 639,594 21.9% 10 Fresno 974,861 506,132 30.6%
11 San Francisco 4,656,132 829,072 13.3% 11 Miami 6,012,331 416,432 29.9%
12 Phoenix 4,574,531 1,490,758 23.2% 12 Providence 1,613,070 178,562 29.7%
13 Riverside-San
Bernardino 4,489,159 313,041 19.7%
13 Milwaukee 1,575,747 598,078 29.4%
14 Detroit 4,302,043 695,437 39.8% 14 St. Louis 2,811,588 318,727 27.8%
15 Seattle 3,733,580 637,850 14.0% 15 New Orleans 1,262,888 368,471 27.7%
16 Minneapolis-St.
Paul 3,524,583 382,578 22.6%
16 Memphis 1,344,127 656,715 27.4%
17 San Diego 3,299,521 1,341,510 15.8% 17 Philadelphia 6,069,875 1,546,920 26.7%
18 Tampa 2,975,225 348,934 22.0% 18 Grand Rapids 1,038,583 190,739 26.7%
19 Denver 2,814,330 633,777 18.3% 19 Albany 881,830 98,287 26.7%
20 St. Louis 2,811,588 318,727 27.8% 20 New Haven 859,470 130,553 26.4%
21 Baltimore 2,797,407 622,271 24.2% 21 McAllen 842,304 135,048 26.4%
22 Charlotte 2,426,363 774,807 17.3% 22 Allentown 832,327 118,793 26.3%
23 Portland 2,389,228 602,568 18.3% 23 Richmond 1,271,334 211,063 25.5%
24 Orlando 2,387,138 250,224 19.8% 24 Baton Rouge 830,480 229,353 25.5%
25 San Antonio 2,384,075 1,385,438 20.1% 25 Atlanta 5,710,795 440,641 25.2%
26 Pittsburgh 2,353,045 306,045 22.8% 26 Tucson 1,010,025 525,031 25.1%
27 Sacramento 2,274,194 476,075 22.3% 27 Knoxville 861,424 181,759 24.6%
28 Cincinnati 2,157,719 297,117 30.9% 28 Baltimore 2,797,407 622,271 24.2%
29 Las Vegas 2,114,801 597,353 17.7% 29 Columbia 810,068 131,331 24.2%
Mid- point of range 24.1%
30 Kansas City 2,087,471 465,005 19.4%
30 Dallas-
Fort Worth 7,102,796 1,240,985 24.1%
31 Cleveland 2,060,810 392,114 35.9% 31 Bridgeport 948,053 146,680 23.6%
32 Columbus 2,021,632 811,943 22.3% 32 Phoenix 4,574,531 1,490,758 23.2%
33 Austin 2,000,860 864,218 19.0% 33 Houston 6,656,947 2,167,988 22.9%
34 Indianapolis 1,988,817 835,097 21.4% 34 Pittsburgh 2,353,045 306,045 22.8%
35 San Jose 1,976,836 986,320 11.8% 35 Chicago 9,551,031 2,712,608 22.7%
36 Nashville 1,830,345 624,261 19.2%
36 Minneapolis-St.
Paul 3,524,583 382,578 22.6%
37 Virginia Beach 1,724,876 445,623 8.3% 37 Los Angeles 13,340,068 3,862,210 22.4%
38 Providence 1,613,070 178,562 29.7% 38 Sacramento 2,274,194 476,075 22.3%
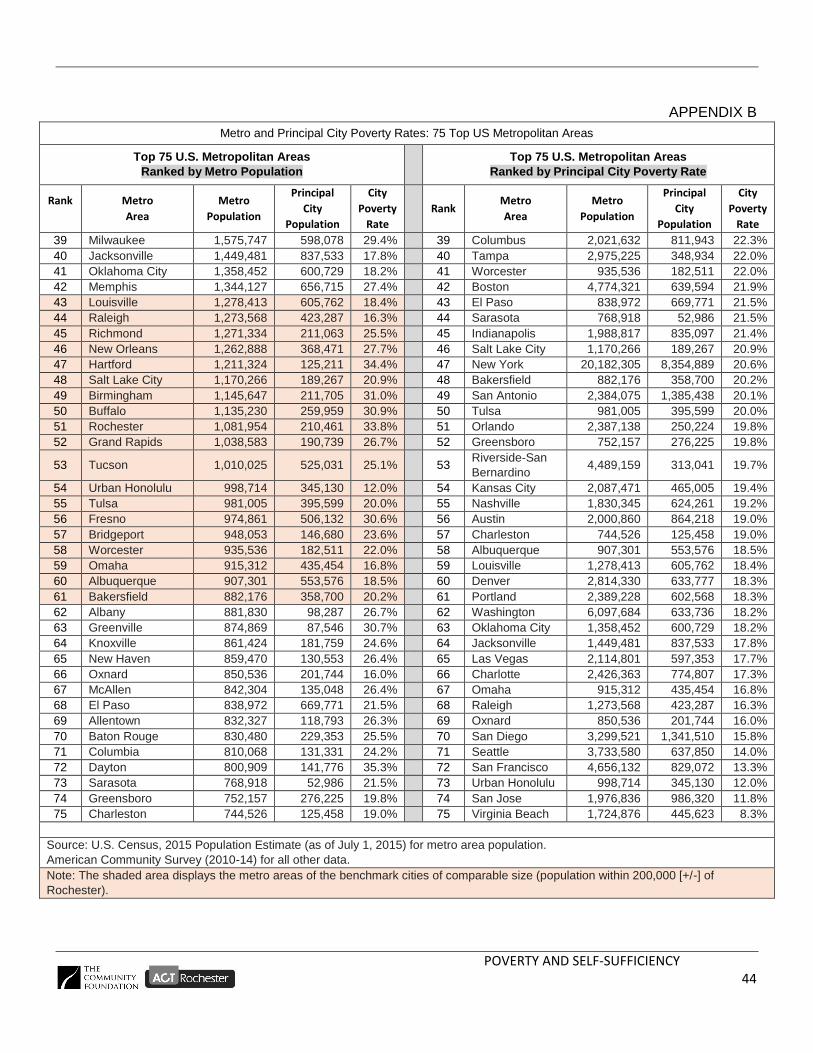
POVERTY AND SELF-SUFFICIENCY 44
APPENDIX B
Metro and Principal City Poverty Rates: 75 Top US Metropolitan Areas
Top 75 U.S. Metropolitan Areas
Ranked by Metro Population
Top 75 U.S. Metropolitan Areas
Ranked by Principal City Poverty Rate
Rank
Metro
Area
Metro
Population
Principal
City
Population
City
Poverty
Rate
Rank Metro
Area
Metro
Population
Principal
City
Population
City
Poverty
Rate
39 Milwaukee 1,575,747 598,078 29.4% 39 Columbus 2,021,632 811,943 22.3%
40 Jacksonville 1,449,481 837,533 17.8% 40 Tampa 2,975,225 348,934 22.0%
41 Oklahoma City 1,358,452 600,729 18.2% 41 Worcester 935,536 182,511 22.0%
42 Memphis 1,344,127 656,715 27.4% 42 Boston 4,774,321 639,594 21.9%
43 Louisville 1,278,413 605,762 18.4% 43 El Paso 838,972 669,771 21.5%
44 Raleigh 1,273,568 423,287 16.3% 44 Sarasota 768,918 52,986 21.5%
45 Richmond 1,271,334 211,063 25.5% 45 Indianapolis 1,988,817 835,097 21.4%
46 New Orleans 1,262,888 368,471 27.7% 46 Salt Lake City 1,170,266 189,267 20.9%
47 Hartford 1,211,324 125,211 34.4% 47 New York 20,182,305 8,354,889 20.6%
48 Salt Lake City 1,170,266 189,267 20.9% 48 Bakersfield 882,176 358,700 20.2%
49 Birmingham 1,145,647 211,705 31.0% 49 San Antonio 2,384,075 1,385,438 20.1%
50 Buffalo 1,135,230 259,959 30.9% 50 Tulsa 981,005 395,599 20.0%
51 Rochester 1,081,954 210,461 33.8% 51 Orlando 2,387,138 250,224 19.8%
52 Grand Rapids 1,038,583 190,739 26.7% 52 Greensboro 752,157 276,225 19.8%
53 Tucson 1,010,025 525,031 25.1%
53 Riverside-San
Bernardino 4,489,159 313,041 19.7%
54 Urban Honolulu 998,714 345,130 12.0% 54 Kansas City 2,087,471 465,005 19.4%
55 Tulsa 981,005 395,599 20.0% 55 Nashville 1,830,345 624,261 19.2%
56 Fresno 974,861 506,132 30.6% 56 Austin 2,000,860 864,218 19.0%
57 Bridgeport 948,053 146,680 23.6% 57 Charleston 744,526 125,458 19.0%
58 Worcester 935,536 182,511 22.0% 58 Albuquerque 907,301 553,576 18.5%
59 Omaha 915,312 435,454 16.8% 59 Louisville 1,278,413 605,762 18.4%
60 Albuquerque 907,301 553,576 18.5% 60 Denver 2,814,330 633,777 18.3%
61 Bakersfield 882,176 358,700 20.2% 61 Portland 2,389,228 602,568 18.3%
62 Albany 881,830 98,287 26.7% 62 Washington 6,097,684 633,736 18.2%
63 Greenville 874,869 87,546 30.7% 63 Oklahoma City 1,358,452 600,729 18.2%
64 Knoxville 861,424 181,759 24.6% 64 Jacksonville 1,449,481 837,533 17.8%
65 New Haven 859,470 130,553 26.4% 65 Las Vegas 2,114,801 597,353 17.7%
66 Oxnard 850,536 201,744 16.0% 66 Charlotte 2,426,363 774,807 17.3%
67 McAllen 842,304 135,048 26.4% 67 Omaha 915,312 435,454 16.8%
68 El Paso 838,972 669,771 21.5% 68 Raleigh 1,273,568 423,287 16.3%
69 Allentown 832,327 118,793 26.3% 69 Oxnard 850,536 201,744 16.0%
70 Baton Rouge 830,480 229,353 25.5% 70 San Diego 3,299,521 1,341,510 15.8%
71 Columbia 810,068 131,331 24.2% 71 Seattle 3,733,580 637,850 14.0%
72 Dayton 800,909 141,776 35.3% 72 San Francisco 4,656,132 829,072 13.3%
73 Sarasota 768,918 52,986 21.5% 73 Urban Honolulu 998,714 345,130 12.0%
74 Greensboro 752,157 276,225 19.8% 74 San Jose 1,976,836 986,320 11.8%
75 Charleston 744,526 125,458 19.0% 75 Virginia Beach 1,724,876 445,623 8.3%
Source: U.S. Census, 2015 Population Estimate (as of July 1, 2015) for metro area population.
American Community Survey (2010-14) for all other data.
Note: The shaded area displays the metro areas of the benchmark cities of comparable size (population within 200,000 [+/-] of
Rochester).

POVERTY AND SELF-SUFFICIENCY 45
APPENDIX C
0.0%
10.0%
20.0%
30.0%
40.0%
50.0%
60.0%
70.0%
80.0%
90.0%
100.0%
Genesee Livingston Monroe Ontario Orleans Seneca Wayne Wyoming Yates
POVERTY, NEAR POVERTY, AND SELF-SUFFICIENCY RATES BY COUNTY
Self-Sufficient Near Poverty Poverty
Poverty: Below the federal poverty level.
Near Poverty: Above the federal poverty level, but below the self-sufficiency standard.
Self-Sufficient: Above the self-sufficiency standard.
Source: Estimate prepared for this report (see end note #4), all data derived from U.S. Census –
American Community Survey (2010-14)

POVERTY AND SELF-SUFFICIENCY 46
APPENDIX D
Federal Poverty Level for 2016
Family Size* Annual Income
1 $11,880
2 $16,020
3 $20,160
4 $24,300
5 $28,440
6 $32,580
7 $36,720
8 $40,860
* Add $4,140 for each additional family members
Source: U.S. Department of Health and Human Services https://aspe.hhs.gov/basic-report/computations-2016-poverty-guidelines