poverty lecture 9 why don’t the poor work more?. today’s readings schiller ch.4: labor force...
TRANSCRIPT

Poverty Lecture 9
Why don’t the poor work more?

Today’s readings
• Schiller Ch.4: Labor Force Participation• Current Population Report, P60-229, p. 8• DeParle, Ch. 6, The Establishment Fails:
Washington, 1992-1994

Today’s Topics
• The importance of earnings• Terms
– Labor force participation vs. unemployment– Reservation wage
• Labor Market data• Labor Force Participation Trends
– Men– Women– Mothers
• With children

Today’s Topics, cont.
• Why is labor force participation among the poor low?– A theory of LFP for individuals– A theory of LFP for groups
• Other supply side factors– Pavetti and Olson--barriers to employment
• Demand side factors: will anyone hire low-skilled workers?

the importance of earning$(Source: Schiller, pp. 66-68)
Percent of Families Receiving Earnings
Income Source Two-Parent Families Single Female Head
Poor Nonpoor Poor Nonpoor
Earning$ 77.7 97.7 66.3 95.3
Welfare
Cash Transfers 15.5 2.5 37.4 9.3
Food stamps 34.6 4.7 58.5 12.2
Housing Assistance 12.5 2.1 32.6 8.2

the importance of earning$
• Observations:– Virtually all nonpoor two-parent families earn some
wages, and – Earning$ from work are universally present for
nonpoor female-headed families– 7 out of 9 poor two-parent families have earning$– 6 out of 9 poor female-headed families have
earning$

the importance of welfare
• Not surprisingly, poor families are more likely to receive welfare in all forms than nonpoor families– Families with female heads are more likely to
receive welfare than two-parent families. Why?
• Significant proportions of poor families of both types receive no welfare
• The most common source of welfare income for all poor families is food stamps.
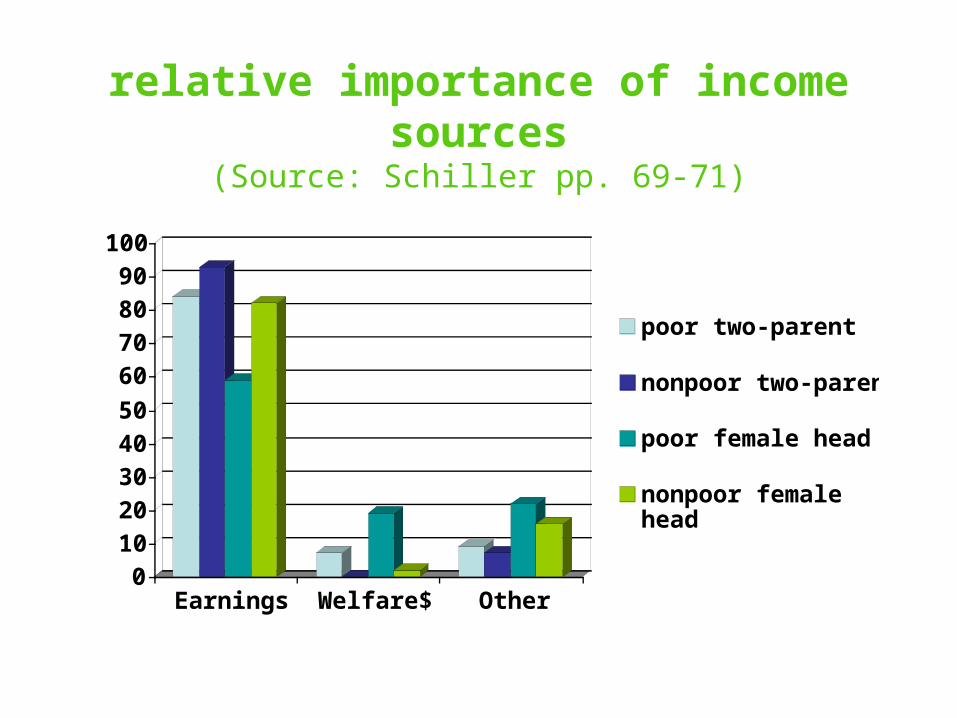
relative importance of income sources(Source: Schiller pp. 69-71)
01020304050
60708090
100
Earnings Welfare$ Other
poor two-parent
nonpoor two-parent
poor female head
nonpoor femalehead

relative importance of income sources
• Earning$ are the primary source of income for all families
• The difference in average income between poor and nonpoor families is huge:– Two-parent families: $12,500 vs. $83,300– Female head: $8,400 vs. $39,000
• The income gap between the poor and nonpoor is largely explained by earning$.

why are the earnings of poor families so low?the role of labor force participationSubtitle: They don’t work (enough)
• Terms– Labor force participation: all people
working for pay + those actively looking for work• LF = employed + unemployed
– Reservation wage: the lowest wage that will induce a person to enter the labor force

terms, cont.
– Subemployment:• Unemployment--those not working but who are
actively looking for a job• Discouraged workers--nonparticipants who
cease to look for a job believing they will not find one
• Marginal worker--nonparticipants who want a job but cite personal reasons for not working
• Underemployment--not working to capacity

where can I find data on labor force participation and employment?
• Homepage for the Bureau of Labor Statistics:– http://www.bls.gov
• Historical tables: See handouts – Source for the handouts and the HighlightsHighlights on the following
slides: U.S. Department of Labor, Bureau of Labor Statistics, Women in the Labor Force: A Databook, available at http://www.bls.gov/cps/wlf-databook2005.htm

labor force participation trendsHighlightsHighlights
• Since the early 1980s, the unemployment rates for men and women have been roughly similar.
• The unemployment rates for white and Asian women have been much lower than those of their black and Hispanic counterparts.
• LFP rates of mothers with children less than 18 years rose from 47 percent in 1975 to 73 percent in 2000.
labor force participation trendsHighlights, cont.Highlights, cont.
– Mothers with older children (6 to 7) are more likely to be in the labor forces than are mothers with children less than 6 years.
– Unmarried mothers have higher participation rates than married mothers.
• Educational attainment of women age 25 to 64 rose substantially from 1970 to 2004.

labor force participation trendsHighlights, cont.Highlights, cont.
• Women held half of all management, professional, and related occupations in 2004
• Women accounted for more than half of all workers in:– Financial activities– Education and health services– Leisure and hospitality
• Women were underrepresented in mining, construction, and transportation and utilities.

labor force participation trendsHighlights, cont.Highlights, cont.
• The percentage of women working part-time (< 35 hrs per week) has held steady over the past 35 years: 26 % of employed women in 2004
• The median wage for women who worked full time in 2004 was 80 percent of the men’s median.
• About 60 percent of women worked full-time all year round in 2004.
• The percentage of married couples with both husband and wife working climbed steadily from 44% in 1967 to 58% in 2004.

labor force participation trendsHighlights, cont.Highlights, cont.
• In 1973 wives’ earning accounted for 26% of their families income at the median; by 2003 their share was 35%.
• Women who were in the labor force for 27 weeks or more in 2003 were slightly more likely than men to live in poverty: 6.0 % vs. 4.7%.
• Black and Hispanic women were more than twice as likely as whiter and Asian women to live in poverty.

a theory of labor force participation for individuals*
• T = L + l + s, where– T = total time– L = time spent at work– l = leisure– s = time spent in subsistence activities (sleep)
• U = f(Y, l), where– U = utility or satisfaction from leisure– Y = income
• *Source: T Hyclak, G. Jones, and R Thornton, Fundamentals of Labor Economics, Houghton Mifflin, 2003.
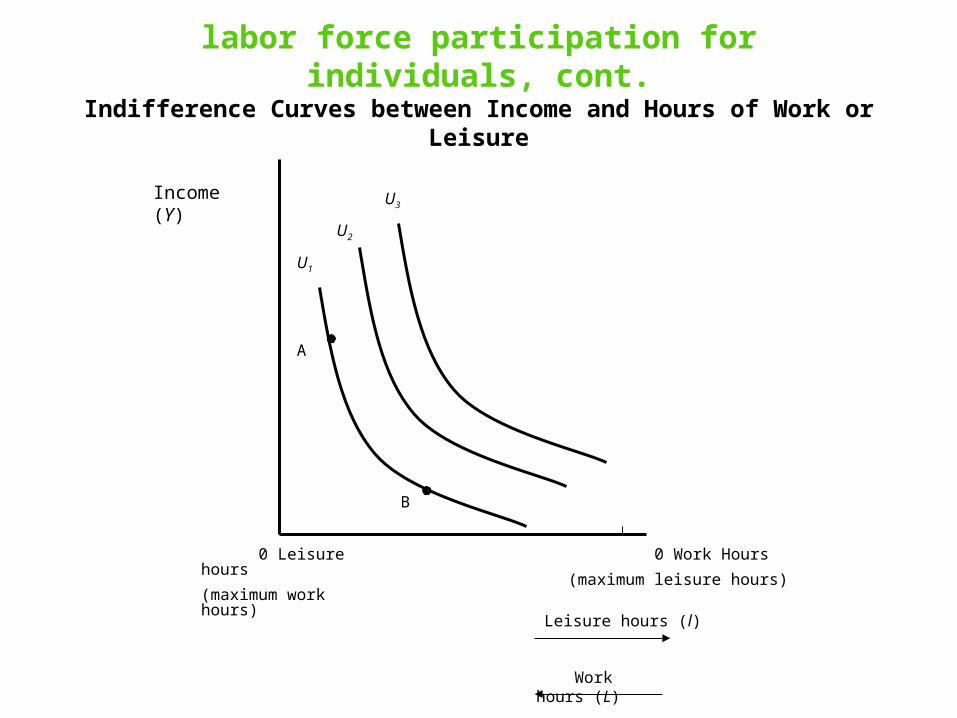
labor force participation for individuals, cont.Indifference Curves between Income and Hours of Work or Leisure
0 Work Hours
(maximum leisure hours)
Leisure hours (l)
Work hours (L)
Income (Y)
0 Leisure hours
(maximum work hours)
U1
U2
U3
B
A

labor force participation for individuals, cont.
• For any level of utility (eg. U1) various combinations of (Y) and (l) will provide the same level of satisfaction.
• The slope of the utility curve at a give point (A or B) tells us just how much more income a person would require in return for giving up an additional hour of leisure if the level of utility is to remain the same. – At which point would the individual require more
income to give up an hour of leisure: A or B?
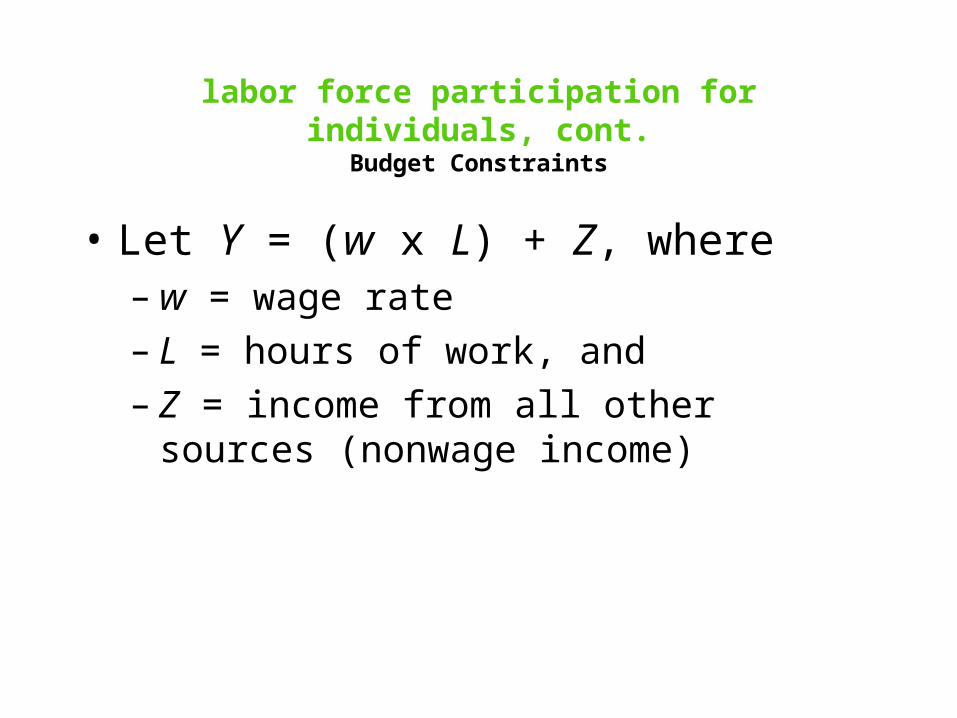
labor force participation for individuals, cont.Budget Constraints
• Let Y = (w x L) + Z, where– w = wage rate– L = hours of work, and – Z = income from all other sources
(nonwage income)

labor force participation for individuals, cont.Budget Constraints
D
B
A
Y
C
Z2
Z1
0 hours of work0 leisure hours
E

labor force participation for individuals, cont.Budget Constraints
• On budget constraint ABC,– Z1 = income not due to market work– BC = earnings at different amounts of market work– Slope of BC = w =hourly wage rate--how much
more income is earned by giving up an additional hour of leisure
– w = -(∆Y/∆l)
• Budget constraint ADE – The individual has higher nonwage income (Z2)
but a lower market wage (the slope in less steep).

labor force participation for individuals, cont.Individual Chooses No Work
0 Work Hours
(maximum leisure hours)
Leisure hours (l)
Work hours (L)
Income (Y)
0 Leisure hours
(maximum work hours)
U3
U2
U1
A
B
C
Highest Utility reached at B (U2)
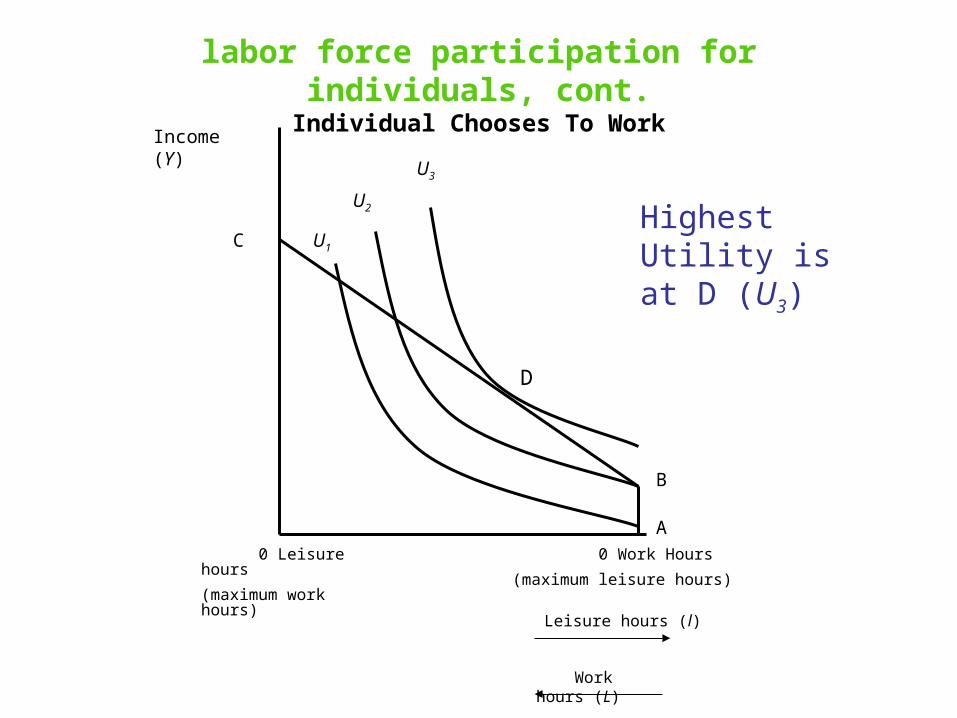
labor force participation for individuals, cont.Individual Chooses To Work
0 Work Hours
(maximum leisure hours)
Leisure hours (l)
Work hours (L)
Income (Y)
0 Leisure hours
(maximum work hours)
U3
U2
U1
A
B
C
D
Highest Utility is at D (U3)

labor force participation for individuals, cont.Response to increase in nonwage income rises
0 Work Hours
(maximum leisure hours)
Leisure hours (l)
Work hours (L)
Income (Y)
0 Leisure hours
(maximum work hours)
U3
U2
U1
A
B
C
D
Highest Utility is at G or E
E
G
a theory of labor force participation for groups
• LFPR = f(Z, w, preferences), where– LFPR = labor force participation rate for a
certain group (welfare moms)– Z = unearned income– w = wages, and– Preferences are reflected in the reservation
wage and other factors that influence the shape of the utility curve

a theory of labor force participation for groups, contChanges in nonwage income
• Focusing on a particular group– An increase in the average nonwage
income should have a negative effect on LFPR: ∆(LFPR)/∆Z < 0
– This is the income effect: The part of a the change in the quantity demanded that is caused by a change in real income

theory of labor force participation for groups, cont. Changes in nonwage income
– The increase will probably also encourage at least some members of the group to leave the labor force (and party night and day on First Street) because people use their increased income to buy more leisure.
– A higher income raises a person’s reservation wage; a lower income lowers the reservation wage
theory of labor force participation for groups, cont. Changes in nonwage income
• The nominal maximum AFDC/TANF benefit has not be changed in many states since 1976. How would the declining real value of AFDC/TANF cash transfers affect the LFPR of welfare mothers?

theory of labor force participation for groups, cont. Changes in average wage$
• Higher wages raise the LFPR of a group– A higher wage means that the opportunity
cost (or the price) of leisure is higher. An individual gives up more income for each hour not worked.
– substitution effect: ∆(LFPR)/∆w > 0• The expected relationship between wage rates
and participation is positive
theory of labor force participation for groups, cont. Changes in average wage$
• How would the declining value of the minimum wage affect the LFPR of poor single mothers?– 1998 $6.09 per hour– 2006 $5.15 per hour

other supply side factors affecting LFP
• See handout: “Reasons for Low Labor Force Participation among the Poor and Polices to Increase Participation”
• Krista Olson and LaDonna Pavetti, Personal and Family Challenges to the Successful Transition from Welfare to Work. Washington, D.C.: The Urban Institute, May 1996, http://www.urban.org/

•Krista Olson and LaDonna Pavetti, Personal and Family Challenges to the Successful Transition from Welfare to Work. Washington, D.C.: The Urban
Institute, May 1996, http://www.urban.org/

•Krista Olson and LaDonna Pavetti, Personal and Family Challenges to the Successful Transition from Welfare to Work. Washington, D.C.: The Urban Institute, May 1996, http://www.urban.org/

the demand side: will anyone hire welfare mothers?
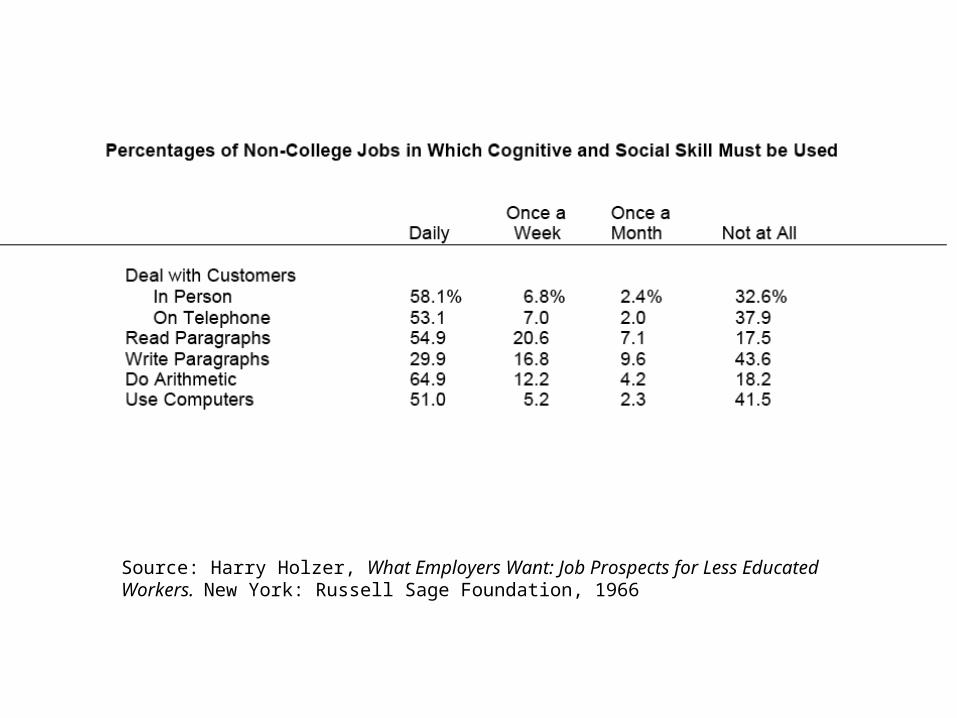
Source: Harry Holzer, What Employers Want: Job Prospects for Less Educated Workers. New York: Russell Sage Foundation, 1966

Source: Harry Holzer, What Employers Want: Job Prospects for Less Educated Workers. New York: Russell Sage Foundation, 1966