poverty environment for sustainable development …
TRANSCRIPT
M/P
/OM
ACRO
ECON
OMIC
SFO
R S
UST
AIN
AB
LE D
EV
ELO
PM
EN
T P
ROGR
AM O
FFIC
E
DevelopingandApplying
PovertyEnvironment
Indicators
P O V E R T YENVIRONMENT
POVERTYENVIRONMENT: Developing and Applying Poverty Environment Indicators
D a v i d R e e d
David Reed is Director of WWF’s Macroeconomics for
Sustainable Development Program Office (MPO) in Washington,
D.C. He holds a Ph.D. and graduate degrees from the University
of Geneva, Switzerland. He has worked for twenty years in social
and economic development programs in Latin America, Africa,
and Asia at both the grassroots and managerial levels and has
authored numerous books and publications, including: Structural
Adjustment, the Environment, and Sustainable Development
(1996); Economic Change, Natural Resource Wealth and
Governance: The Political Economy of Change in Southern Africa
(2001); Towards a Just South Africa: The Political Economy of
Natural Resource Wealth (2003); Poverty is Not a Number; The
Environment is Not a Butterfly (2002).
P r a d e e p T h a r a k a n
Pradeep Tharakan holds a Ph.D. in Energy and Natural Resources
Management and a Masters Degree in Forestry from the State
University of New York, and a Masters degree in Public Policy
from Syracuse University. He has nearly nine years of experience
in the fields of energy and natural resources management, and
the poverty-environment nexus. Dr. Tharakan has worked
throughout North America and South Asia on issues related to
ecological and social impacts of forest plantations, utilizing
renewable energy to expand livelihoods, climate change mitiga-
tion, and strategic environmental assessments of country
development programs (PRSPs). He has authored over 15 arti-
cles and book chapters, including publications in journals such
as Nature, Energy Policy, Biomass and Bioenergy and Bioscience.
O c t o b e r 2 0 0 4
T a b l e o f C o n t e n t s
Presentation · · · · · · · · · · · · · · · · · · · · · · · · · · · · · · · · · · · · · · · · · · · · · · · · · · · · · · · · · · · · · · · · · · · · · · · · · · · 1I. A Word of Caution · · · · · · · · · · · · · · · · · · · · · · · · · · · · · · · · · · · · · · · · · · · · · · · · · · · · · · · · · · · · · · · · · · · 3II. A Review of Recent Initiatives to Develop Poverty-Environment Indicators · · · · · · · · · · · · · · · · · · · · · · · · · · · 5III. WWF-MPO’s Approach to Poverty-Environment Indicators · · · · · · · · · · · · · · · · · · · · · · · · · · · · · · · · · · · · · · 9IV. Applying This Approach in Diverse Contexts · · · · · · · · · · · · · · · · · · · · · · · · · · · · · · · · · · · · · · · · · · · · · · · · 13
David Reed and Pradeep TharakanOctober 2004
P O V E R T YENVIRONMENT
DevelopingandApplying
PovertyEnvironment
Indicators
POVERTYENVIRONMENT: Developing and Applying Poverty Environment Indicators 1
POVERTYENVIRONMENT
Developing and Applying Poverty Environment Indicators
Presentation
For over a decade, WWF’s Macroeconomics Program Office (MPO) has analyzed and tried
to influence the impact of macroeconomic reforms on the environment and the rural poor
in more than 20 developing countries. Our analytical work, shared through book-length publica-
tions, numerous monographs, and diverse articles, has contributed to shaping public policy
regarding the content and implementation of macroeconomic instruments.1 More recently, strate-
gic interventions to support poverty reduction and improved natural resource management2 in
five developing countries (China, Indonesia, El Salvador, South Africa, and Zambia) under the
umbrella of the Economic Change, Poverty and the Environment project resulted in significant
change at local, meso, and macro levels.
Our continued efforts to gauge the impact of macro-
economic and institutional reforms on the
poverty-environment nexus (P-E nexus) have led us to
examine closely the concept of poverty-environment
indicators (P-E indicators). The use of P-E indicators is
increasingly accepted among development agencies,
NGOs, and developing country governments as a tool
for designing, planning, and evaluating strategies and
programs at various intervention levels. Our experi-
ence, through analysis and direct interventions, shows,
however, that key drivers of the P-E nexus are often
inadequately reflected in the indicator frameworks
used by these institutions. The drivers that have fre-
quently been left aside include, among others, the role
of institutions, macroeconomic policies, regulatory
regimes, and the exercise of power and privilege.
As the MPO reviewed ways of correcting this short-
coming, we were obliged to recognize that we are,
fundamentally, a user of indicators, not a producer of
indicators. We do not have the ability to produce or
collect new data on many of the issues we deem
important or the institutional capacity to conduct
analysis and comparisons across a broad range of
countries or ecoregions. Consequently, we recognize
that our contribution, as a user, is limited primarily to
identifying information and information systems that
can help us analyze the most important facets of the
poverty-environment dynamic as it pertains to major
changes taking place in
developing countries.
WWF-MPO’s approach to
developing and using P-E
indicators is tied to our insti-
tutional mission. Foremost,
we seek to protect the
integrity of ecosystems
PR
ES
EN
TA
TI
ON
PO
VE
RT
YE
NV
IR
ON
ME
NT
while ensuring improved well-being for the rural poor.
Specifically, the WWF/MPO seeks to identify and
remove key obstacles that prevent the rural poor from
managing their natural resources sustainably and
improving their livelihoods. From this perspective, we
are concerned not only with using indicators to moni-
tor conditions and changes, but also with how to guide
interventions that seek to improve management of the
P-E nexus. This activist orientation ultimately aims to
put in place policies, institutions, or regulatory systems
that will strengthen environmental management and
improve rural livelihoods.
Developing an information system and indicators to
serve these purposes poses considerable challenges.
Those challenges include identifying a limited set of
indicators that can capture the essence of poverty-
environment dynamics in rural and peri-urban areas
undergoing significant economic and institutional
change. These indicators should serve the needs of
key stakeholders-primarily local groups-by helping
them understand and respond more effectively to the
conditions in which they live. In addition to being cost-
effective, indicators also need to be adaptable to a
wide range of natural and social environments.
This document focuses on the design and implementa-
tion of a poverty-environment information system and
the indicators that flow from that system. It consists of
four complementary parts. In the first section, A
Word of Caution, we highlight a number of considera-
tions that we believe should be taken into account in
designing an information system for the poverty-envi-
ronment nexus. The second section, Review of
Previous Initiatives to Develop Poverty-Environment
Indicators, highlights the recent contributions from
UK’s Department for International Development
(DFID) and the World Bank. In the third section,
WWF-MPO’s Approach to Poverty-Environment
Indicators, we offer the specific elements of an infor-
mation system and indicators to be applied in localities
of developing countries. In the final section we discuss
opportunities for applying the WWF approach to spe-
cific contexts in the developing world.
2 POVERTYENVIRONMENT: Developing and Applying Poverty Environment Indicators
U s i n g I n d i c a t o r s
These indicators should serve the needs of key stakeholders-primarily local groups-by helping themunderstand and respond more effectively to the conditions in which they live.
POVERTYENVIRONMENT: Developing and Applying Poverty Environment Indicators 3
A WORD OF CAUTION
It is with caution that we approach the challenge of proposing a set of indicators for monitor-
ing the poverty-environment nexus. Our caution arises primarily from the all too frequent
misuse of indicators for purposes that they cannot realistically fulfill.
For the sake of clarity, we begin by distinguishing
between more general data sets and specific indica-
tors. Data sets are intended to be broad, inclusive
quantified information about a given socio-economic
context or change process. As such, data sets are
often designed for use by a wide range of potential
clients who may have equally diverse purposes in
using the data, ranging from analysis to strategic plan-
ning at multiple levels. We encourage, whenever
possible, production of rigorous, multidisciplinary data
sets over extended periods to help analysts under-
stand the characteristics and drivers of social change
and enable them to design more effective programs to
address specific problems.
In contrast, indicators are the small or focused end of a
complex, multidimensional system of information about
a given social experience. Indicators reduce this com-
plex information system, including data sets, into a
narrow band or specific type of information that reflects
a selected part of a far more sophisticated web of expe-
rience. Indicators should be carefully chosen measures
that reflect important aspects of processes of change
taking place in a given locality or country. As con-
densed measures, indicators should attempt to provide,
through a limited number of categories, significant
information about a much larger societal dynamic.
Our second prefatory note regards the political nature
of indicators and interventions that flow from their
application. We raise this concern because of the
alleged “neutrality” or “scientific” basis ascribed by
some institutions to the particular set of indicators they
choose to use. Poverty and environmental disruption
do not occur as natural or neutral phenomena.
Regardless of the country or local context, the P-E
nexus is shaped by institutions and political arrange-
ments that reflect the interests of competing social
groups. Quite frequently, prevailing institutional
arrangements allow natural resources and rural com-
munities to produce wealth for more powerful elites.
In this context, we become quite concerned when
agencies propose sets of indicators that employ dozens
of measures as a means of being “balanced” and inclu-
sive. While such broad sets of indicators may provide a
general understanding of a given situation, the very
breadth of coverage may mask the most important
problems facing the poor and the environment in a
given locality. In fact, inclusion of too many indicators
can allow worsening problems to pass as insignificant.
A third note of caution regards the dangers of creating
and applying generic indicators. WWF has designed
this approach to P-E indicators primarily for use with
and by local stakeholders to analyze the impacts of
direct interventions on social, economic, and ecologi-
cal conditions at local, meso, and macro levels. Given
our belief that indicators must be designed to address
the needs of specific stakeholders, we are reluctant to
suggest that there are
generic indicators that can
capture the basic poverty-
environment dynamics in a
CH
AP
TE
RI
AW
OR
DO
FC
AU
TI
ON
wide range of situations. Certainly, some agencies or
research institutes may want to develop generic P-E
indicators for conducting cross-country conditions.
We must caution, however, that these higher level
indicators may have little applied utility for local stake-
holders seeking to improve local conditions through
specific interventions.
Finally, the process of designing indicators can be as
important as their actual implementation. The
process of designing indicators can help local users in
three distinct ways:
• Clarifying the purposes of interventions
• Refining the design of interventions and the activi-
ties to be undertaken during intervention
• Clarifying the resources to be used in undertaking
the interventions.
All too frequently the process of designing indicators
and associated information systems is delegated to
“experts” and agents external to a process of change.
If indicators and information systems are to be used to
support the empowerment of local stakeholders, the
design process provides a unique opportunity to
strengthen local capacity and build social capital.
WWF-MPO hopes that appropriately designed indica-
tors become tools used with local partners in a
process of empowering them as they seek solutions to
P-E dynamics in a given locality or country.
We find that many of these issues can be addressed in
large measure if the designers of indicators are explic-
it about the specific uses of indicators and if they are
equally transparent about how the indicators are to be
applied. Such transparency includes clarifying the
relationship between the designers of indicators and
the social groups or institutions that are the intended
users and beneficiaries.
4 POVERTYENVIRONMENT: Developing and Applying Poverty Environment Indicators
S e e k i n g S o l u t i o n s
WWF-MPO hopes that appropriately designed indicators become tools used with local partners in aprocess of empowering them as they seek solutions to P-E dynamics in a given locality or country.
POVERTYENVIRONMENT: Developing and Applying Poverty Environment Indicators 5
RECENT INITIATIVESA Review of Recent Initiatives to Develop
Poverty-Environment Indicators
Development of P-E indicators is a relatively recent process that builds on the previous
work of many diverse organizations, work that treated indicators on poverty and on the
environment as separate issues. Development of P-E indicators, that is, measures that capture
the complex dynamic between these two arenas, received considerable impetus in the late 1990s
from the Poverty Environment Partnership created by leading development institutions. As part
of our attempt to understand current P-E indicators, we reviewed recent studies including those
of the UK’s Department for International Development (DFID) and the World Bank. The
review and critique in this section focuses on the framework or approach that was used to devel-
op the set of indicators, rather than on specific indicators.
The World Bank’s 2002 Study
The stated purpose of the World Bank’s 2002 study,
Poverty-Environment Indicators, is to “identify indi-
cators that can be used to assess poverty
environment interactions.”3 From the Bank’s per-
spective, it seeks to develop indicators that can be
applied “from local to global levels” and that can also
be used to monitor changes “globally,” that is,
through cross-country comparison.
The proposed indicators covered two distinct, albeit
complementary, fields. The first category it addresses
is the relationship between environmental conditions
(such as quality of water supply and levels of pollution
and wastes) and human health. The indicators suggest
a direct causal relationship between surrounding envi-
ronmental conditions and the health of sectors of
society determined by income level.
The second category of P-E indicators monitors the
impact of resource loss as a determinant of poverty,
measuring how the loss of access to resources “affect
the well being of the poor.” While recognizing the
complexity of poverty-environment dynamics, the
World Bank study examines only “how resource loss
can act as a determinant of poverty.” In this perspec-
tive, the proposed indicators monitor how issues of
deforestation, water scarcity, overfishing, and land
degradation affect the well-being of the poor. In
exploring this relationship, the World Bank draws on
and expands the OECD’s Pressure-State-Response
(PSR) model by adding a fourth dimension-poverty-
making it a Pressure-State-Poverty-Response (PRPR)
model. In this approach,
not only should the indica-
tors examine the pressures
CH
AP
TE
RI
IR
EC
EN
TI
NI
TI
AT
IV
ES
acting on the environment, they should also examine
the impact on the poor and, thereafter, the responses
of the human community to those environmental and
poverty problems. The Bank’s study also encourages
the use of poverty-environment maps to add a geo-
graphic dimension to the monitoring process.
The publication leaves little doubt that the approach is
designed for use in cross-country analysis by interna-
tional development agencies to track changes across a
series of general poverty-environment themes. The
indicators are information-intensive and require a fair-
ly complex information system to support their
effective use. For this reason, they do not seem well-
suited for local users or even national agencies in
most developing countries. Despite the author’s sug-
gestion to the contrary, the indicators seem most
appropriate for assessing the design of generic pro-
grams such as PRSPs as they relate to the
poverty-environment nexus but not for helping local
organizations or government agencies strengthen
their intervention strategies to reduce poverty and
improve natural resource management.
Moreover, as the author recognized, these indicators
do not look at the complexity of poverty-environment
dynamics, including circular causality, feedback loops,
and the impact of poverty on the environment. Rather
the indicators look at the one directional change, that
is, how the environment affects the poor, not how the
poor affect the environmental assets on which their
sustenance and livelihoods depend. In this sense, the
indicators do not reveal how pressures from new
development policies and programs, including eco-
nomic reforms, reforms in natural resource
management, and poverty alleviation strategies, influ-
ence the poverty-environment dynamic. While the
Bank’s approach has the merit of shifting the empha-
sis from just the poor and just the environment to
monitoring the interaction between the two issues
areas, its utility seems restricted to a limited number
of large institutions as they examine one important
part of the poverty-environment nexus.
DFID’s study, Poverty and the Environment:
Measuring the Links, further contributes to the devel-
opment of generic poverty-environment indicators for
cross-country analysis.4 The study states from the
outset that it seeks to “identify a generic set of indica-
tors” suggesting that the information should
contribute to strengthening the activities of develop-
ment agencies working under the auspices of the
OECD’s Development Assistance Committee. By pro-
viding examples through summaries of applications in
three developing countries, the study encourages
adaptation to local contexts and to different users in
developing countries.
The starting point of DFID’s proposal is identification
of the following priority areas to be covered by the
P-E indicators.
• Environment and health
• Forest cover
• Soil degradation
• Water quality and quantity
• Fisheries
• Natural disasters
• Tenure and property rights
• Sanitation
Under each of these priority areas, multiple indicators
were developed, including (1) proportion of poor with
secure land use rights for farming (tenure and proper-
ty rights); (2) hours spent collecting water by rural
women and children (water quality and quantity); and
(3) percentage of population living in areas prone to
flooding (natural disasters).
A key strength of the DFID study is that it goes
beyond indicators that monitor aspects related only to
the environment or poverty, in an effort to examine
the relationship between the two. The study under-
scores the diversity of poverty-environment dynamics
6 POVERTYENVIRONMENT: Developing and Applying Poverty Environment Indicators
POVERTYENVIRONMENT: Developing and Applying Poverty Environment Indicators 7
in developing countries and underscores the need to
adapt the approach to local contexts. Second, the
study does not limit itself to proposing a set of indica-
tors, but evaluates relevance and data availability
across a range of developing country contexts. The
testing of these indicators in applications in Uganda,
Nepal, and Nicaragua highlight the complexities of
applying generic indicators in specific countries and
the challenges of applying them in cross-country
analysis. While the generic indicators offered by
DFID do not suggest ways to ensure adaptation to
local conditions, the accompanying case studies pro-
vide insights into how such adaptation was necessary
in the three countries.
An Assessment
Overall, we believe that both studies contributed sig-
nificantly toward developing effective P-E indicators.
They both break out of a one-dimensional analysis of
changes in the status of the environment and the con-
ditions besetting the poor, and attempt to capture part
of the complex dynamic linking poverty to the envi-
ronment. They also suggest a framework and
approach that can be used across many countries and
contexts. For these reasons, we owe an intellectual
debt to the work of these two institutions.
Viewed from the perspective of a civil society organi-
zation trying to change poverty-environment dynamics
in developing countries, we believe that the World
Bank and DFID approaches embody two important
limitations. The first limitation is that both approaches
fall short of providing information that would allow an
evaluation team to begin deciphering why changes, be
they desired or undesired, are occurring. In raising
this concern, we recognize that indicators in and of
themselves, are not intended to explain why certain
changes are, or are not, taking place. The interpreta-
tion of causality of change is fundamentally the
responsibility of an evaluation or assessment team that
deciphers the data following its collection. However,
indicators and the information system on which indi-
cators are built can be designed to collect data that
will help the evaluation team understand the causali-
ties and dynamics of changes that are occurring in a
given locality by offering evidence about the underly-
ing causes of change.
Enhancing the explanatory power and applicability of
the two approaches could be accomplished through
three refinements. First, indicators could be organ-
ized in relation to a series of factors along a probable
chain of causality, in order to confirm or disprove the
role of these factors as the drivers of observed
changes in poverty-environment dynamics. Linking
indicators to these causal factors, rather than simply
to outcomes, can help an assessment team understand
underlying drivers of changes. Second, ensuring that
data collection and indicators are applied over an
extended period can enhance indicators’ explanatory
power. Both the magnitude and pace of changes can
be tracked more easily. In addition, correlating the
magnitude and pace of change to a suspected chain of
causality can provide considerable insight into the
underlying dynamics of change in a given locality,
region, or country. This data and relations of causality
can then be the focus of supplemental analysis and
interpretation. The third and perhaps most obvious
suggestion is to include the stakeholders directly in
the assessment process that follows application of the
indicators. Nothing can compare with the explanatory
power of the primary stakeholders themselves and
certainly this dimension should be given a prominent
place in both the World Bank and DFID approaches.
In making this recommendation we recognize that
increasing the explanatory power of indicators may
well conflict with the two institutions’ desire to devel-
op generic indicators that can measure changes
across many countries. However, without increased
explanatory ability built into the information systems,
and without clear guarantees that a wide range of
views, including direct stakeholders, will be included
in the assessment processes, we are concerned that
the interests and perspectives of the two institutions
will be the main analytical perspective for interpret-
ing the data. In other words, there is a strong
probability that the indicators will become a mecha-
nism for justifying and reproducing the programs
and intervention strategies already employed by the
development institutions in what they consider to be
they best ways to help the poor and the environment
in the developing world.
The second limitation that concerns us is that neither
study is geared to helping the poor increase their abili-
ty to change the political economy of poverty and
ecological disruption. The two approaches do not nec-
essarily involve the poor, and they do not provide
information that would allow the poor to become more
effective in improving livelihoods and resource man-
agement. What our own experience has taught us is
that generating fundamental changes in P-E dynamics
requires reordering policies and institutions so that
the poor can exert far greater control over both their
resources and the institutions that determine how
those resources are used. Moreover, these changes
must improve the access of the poor to a range of fac-
tors that would allow them to improve resource
management and increase their productivity.
As a consequence of this experience, we find that a
useful information system and accompanying indica-
tors about the P-E nexus must collect information
about these underlying fundamental social factors to
complement other data. We recognize that the indica-
tors and information system we propose below may
have certain limits in carrying out cross-country com-
parison. Nonetheless, it is the focus on providing
tools and information to the poor, their partners at
many levels, and appropriate government agencies
that remains at the center of our concern. It is this
imperative that has pushed us to develop the approach
presented below.
8 POVERTYENVIRONMENT: Developing and Applying Poverty Environment Indicators
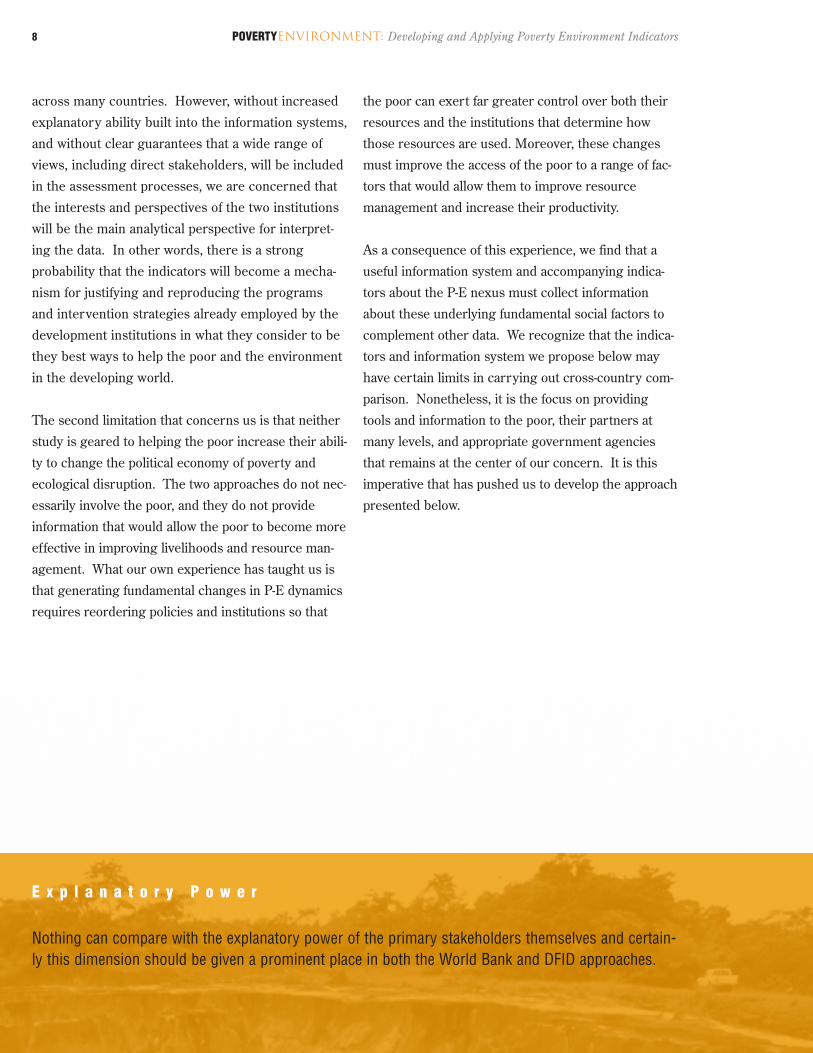
E x p l a n a t o r y P o w e r
Nothing can compare with the explanatory power of the primary stakeholders themselves and certain-ly this dimension should be given a prominent place in both the World Bank and DFID approaches.
POVERTYENVIRONMENT: Developing and Applying Poverty Environment Indicators 9
WWF-MPO’S APPROACHWWF-MPO’s Approach to
Poverty-Environment Indicators
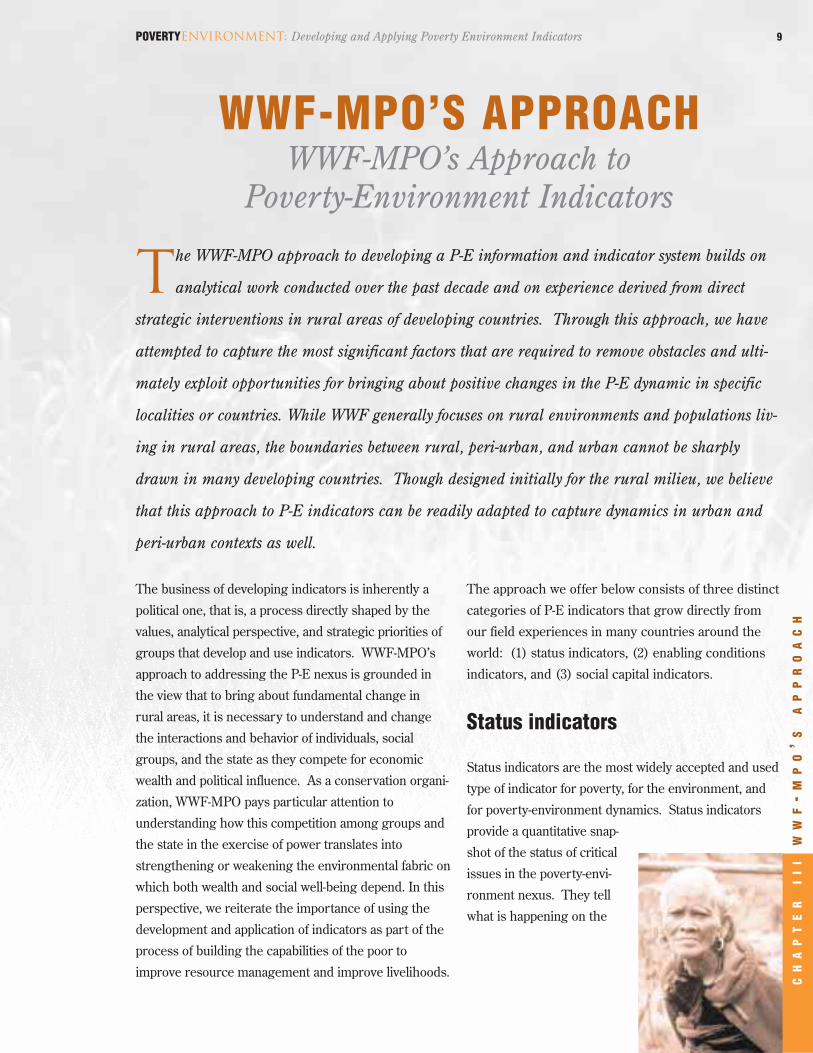
The WWF-MPO approach to developing a P-E information and indicator system builds on
analytical work conducted over the past decade and on experience derived from direct
strategic interventions in rural areas of developing countries. Through this approach, we have
attempted to capture the most significant factors that are required to remove obstacles and ulti-
mately exploit opportunities for bringing about positive changes in the P-E dynamic in specific
localities or countries. While WWF generally focuses on rural environments and populations liv-
ing in rural areas, the boundaries between rural, peri-urban, and urban cannot be sharply
drawn in many developing countries. Though designed initially for the rural milieu, we believe
that this approach to P-E indicators can be readily adapted to capture dynamics in urban and
peri-urban contexts as well.
The business of developing indicators is inherently a
political one, that is, a process directly shaped by the
values, analytical perspective, and strategic priorities of
groups that develop and use indicators. WWF-MPO’s
approach to addressing the P-E nexus is grounded in
the view that to bring about fundamental change in
rural areas, it is necessary to understand and change
the interactions and behavior of individuals, social
groups, and the state as they compete for economic
wealth and political influence. As a conservation organi-
zation, WWF-MPO pays particular attention to
understanding how this competition among groups and
the state in the exercise of power translates into
strengthening or weakening the environmental fabric on
which both wealth and social well-being depend. In this
perspective, we reiterate the importance of using the
development and application of indicators as part of the
process of building the capabilities of the poor to
improve resource management and improve livelihoods.
The approach we offer below consists of three distinct
categories of P-E indicators that grow directly from
our field experiences in many countries around the
world: (1) status indicators, (2) enabling conditions
indicators, and (3) social capital indicators.
Status indicators
Status indicators are the most widely accepted and used
type of indicator for poverty, for the environment, and
for poverty-environment dynamics. Status indicators
provide a quantitative snap-
shot of the status of critical
issues in the poverty-envi-
ronment nexus. They tell
what is happening on the
CH
AP
TE
RI
II
WW
F-
MP
O’
SA
PP
RO
AC
H
ground-at the local level-where users of resources inter-
act with the diverse natural resources. Status indicators
include, for example, hectares of forested land, per capi-
ta availability of freshwater, the number of households
without access to land titles, and so on. Below are just a
few of the potential status indicators designed to reflect
the current state of the environment and poverty-envi-
ronment relations:
Environment • Resource quantity and quality-indicators that reflect
the physical extent, condition, and productivity of
resources (for example, size of fish stocks, soil
organic matter levels, biochemical oxygen demand
of rivers).
• Rate of resource degradation or improvement-indi-
cators relating to rate of loss or gain or lowering or
improvement of quality (for example, rate of forest
land conversion, topsoil erosion rates).
Poverty-environment • Access to resources-per capita availability of
resources (for example, fresh water, fuel wood), dis-
tance and time to collect forest products, percentage
of income derived from non-timber forest products.
• Level of vulnerability-exposure to and impact of nat-
ural disasters and declining or improving
environmental quality (for example, number of indi-
viduals affected by flood and drought, incidence of
acute respiratory illnesses).
Enabling conditions indicators
The improved understanding of poverty-environment
dynamics over the past years has allowed concerned par-
ties, including WWF, to identify enabling conditions that
encourage more direct and comprehensive strategies for
addressing the P-E nexus in specific localities. Enabling
conditions indicators reflect societal responses to envi-
ronmental problems, to conditions of poverty, and to
poverty-environment dynamics. Among those enabling
conditions are: development of national sustainability
strategies that integrate the environment into economic
growth plans; strategic environmental analysis instru-
ments that anticipate changes and impacts on vulnerable
populations and the environment; a host of regulatory
mechanisms that establish performance standards; and
new financing mechanisms that offer incentives for sus-
tainable environmental management and compensation
to providers of environmental services.
Indicators of enabling conditions can be grouped into
three basic categories: institutional arrangements, eco-
nomic policies, and ecological management capacity.
While generalized to a certain degree, these indicators
do need to be tailored to the specific conditions in
each locality.
Institutional arrangementsInstitutional indicators measure the scope, characteris-
tics and capabilities of institutions that influence
P-E dynamics
• Institutional reforms-existence of reforms that
encourage resource management institutions to be
responsive and adaptable; degree of transfer of
power to appropriate entities; degree of accountabil-
ity and transparency in decisionmaking.
• Legal-regulatory framework-availability of incen-
tives that protect the environment; steps taken to
enhance access to resources among the poor; ease
of adjudicating disputes related to environmental
issues; enforcement mechanisms.
• Participatory processes and empowerment-exis-
tence of policies or regulations that encourage the
poor, particularly women and minorities, to partici-
pate; training and capacity-building programs;
extent of accountability and transparency in envi-
ronmental planning and policymaking.
10 POVERTYENVIRONMENT: Developing and Applying Poverty Environment Indicators
POVERTYENVIRONMENT: Developing and Applying Poverty Environment Indicators 11
Economic policies and incentivesEconomic indicators measure the magnitude of financial
resources, the impact of specific market dynamics and
the influence of policy reforms that shape the P-E nexus.
• Budgetary allocation and investment trends-share
of spending on P-E projects relative to other sec-
tors; investment programs for infrastructure,
extractive industries, and energy generation that
have environmental and social impacts; investments
focused on repairing and restoring damaged
natural resources.
• Addressing market failures-existence of efforts to
value and monetize externalities; relative impor-
tance given to financial versus economic criteria in
planning; availability of incentives and schemes to
make payments to the poor by the rest of society
for their environmental stewardship role.
• Addressing impacts of recent economic change-
level of effort to measure and respond to the
dislocations associated with economic reforms,
including availability of safety nets, retraining pro-
grams, and compensation plans; attempts to predict
and mitigate impacts of global trade agreements,
shocks in global market trends, and exogenous
interests on the national P-E nexus.
Ecological management capacityEcological management indicators measure the ability
of institutions to prepare for and respond to anticipat-
ed trends and unexpected environmental shocks.
• Monitoring ecological dynamics-existence of plans
and projects to track long-term changes in the
biophysical environment; efforts to examine
impacts of current and emerging technologies on
the P-E nexus (for example, genetically modified
crops, aquaculture).
• Environmental risk mitigation-existence of manage-
ment systems to support adjustments to external
environmental shocks; existence of planning proce-
dures to adjust to impacts of anticipated
environmental changes (for example,
Environmental Impact Assessments or Strategic
Environmental Analysis for major projects and struc-
tural reform programs, respectively); application of
safe minimum environmental standards; steps to pro-
tect the poor from any unintended consequences.
Social capital indicators
Social capital includes the organizations, networks,
norms, relationships, and other mechanisms that
enable communities to undertake collective action.
Social capital is the capacity of local populations to
influence basic decisions and institutional arrange-
ments that shape their livelihoods and natural
resource use. As we implemented strategic interven-
tions over the past four years with local partners in
five developing countries to change P-E dynamics, we
found that the main determinant of the success of the
interventions was the ability of local communities,
supported by other partners, to influence institutions
and policies at local, meso, and national levels. The
depth and breadth of changes generated through
interventions were directly related to the organization-
al and political capacity of local communities and
partners acting effectively in their own interests. In
the absence of their ability to drive change, no funda-
mental and enduring change seemed possible.
We give particular emphasis to social capital because
privately held capital, in its many forms, is often
scarce in rural areas of the developing world. In the
absence of diverse and widely available private capital,
improving the living conditions of the rural poor
depends heavily on building institutions and embark-
ing on collective actions to improve the welfare of
broad groups of inhabitants.
This point is central to WWF-MPO’s concerns
because our objective is to help remove the obstacles
that prevent the rural poor from improving their liveli-
hoods and natural resource management. Unless
social capital and the ability of local communities to
shape their lives and livelihoods are placed at the cen-
ter of the development of indicators, we believe that
attention will be diverted from the most central prob-
lem in rural areas. Rural P-E dynamics do not happen
in a vacuum. They unfold in a context of competition
for resources and opportunities. The rural poor, with
few exceptions around the world, have been pushed to
the margins of national decisionmaking and have been
deprived of the means and mechanisms for influenc-
ing the policies and institutions that shape their lives.
In light of these political economy considerations, we
believe we need to complement the set of quantitative
indicators for monitoring drivers of P-E change in rural
areas with qualitative assessments based on a frame-
work that has the concept of social capital at its core. In
the context of P-E dynamics, we believe the evaluative
framework should focus on four main points:
• Can the rural poor influence institutions at various
levels that are linked to the management of rural
livelihoods and environmental resources? Qualitative
assessments should identify the most important insti-
tutions shaping rural livelihoods and natural resource
use and should assess the ability of the poor to
engage in the operation and decisionmaking of those
institutions. Frequency of interactions, level of influ-
ence, points of influence, outcomes, and other
measures could capture these dynamics. Also need-
ed is an assessment of whether the voices of the poor
are influencing decisionmaking.
• Can the rural poor respond to economic policies and
incentives that affect rural livelihoods and environ-
mental management? Qualitative assessments
should identify the most important economic forces
and factors that shape rural livelihoods and natural
resource use. They should identify the require-
ments for responding to those economic factors
and the capacity of the rural poor to respond. The
assessment should review the capacity to mobilize
investment and productive resources, gain access
to information, gain market access, and acquire
technology. Indicators should assess how current
participation has led to livelihood improvements.
• Can the rural poor manage the environmental
resources on which their livelihoods depend? In cap-
turing this ability, the emphasis should be on
assessing the effectiveness of existing and innova-
tive management systems to positively influence
the P-E nexus. Of interest here is the existence of
systems for co-management, payments for ecosys-
tem services, innovative land-tenure systems, and
assessments of how well they are functioning.
• Can the rural poor mobilize supplemental resources
(investment capital, adaptation funds, information)
to help them improve their access to, control of, and
management of environmental resources? Measures
should identify the avenues by which the rural poor
can mobilize resources that are required to improve
livelihoods and resource management. These meas-
ures should not only include established
government mechanisms but also extend to include
access to private sector resources, development
agencies, and diverse civil society organizations.
If properly designed, the qualitative assessments regard-
ing social capital, coupled with data from status and
enabling conditions indicators, can provide useful
insights into the processes of change unfolding in a
given locality. This information can help users under-
stand what constraints continue to hamper efforts to
improve natural resource management and poverty alle-
viation and what additional measures must be
undertaken by users to accomplish their goals. We must
underscore the importance of organizing an assessment
team that brings different skills and perspectives, per-
haps from economic, institutional, and ecological vantage
points, that can interpret the information in complemen-
tary ways. Of course, direct users of the information
system must be included so that observations, conclu-
sions, and recommendations can be used by
stakeholders to support their stated objectives.
12 POVERTYENVIRONMENT: Developing and Applying Poverty Environment Indicators
POVERTYENVIRONMENT: Developing and Applying Poverty Environment Indicators 13
DIVERSE CONTEXTS Applying This Approach in Diverse Contexts
We have continually emphasized the importance of developing an information system
and indicators that can be used by direct stakeholders, that are cost effective, and that
are geared to promoting change. To meet these standards we have suggested limiting the number
of indicators and coupling quantitative measures with qualitative assessments designed to gauge
the ability of the poor to respond to major events and institutions that shape their lives.
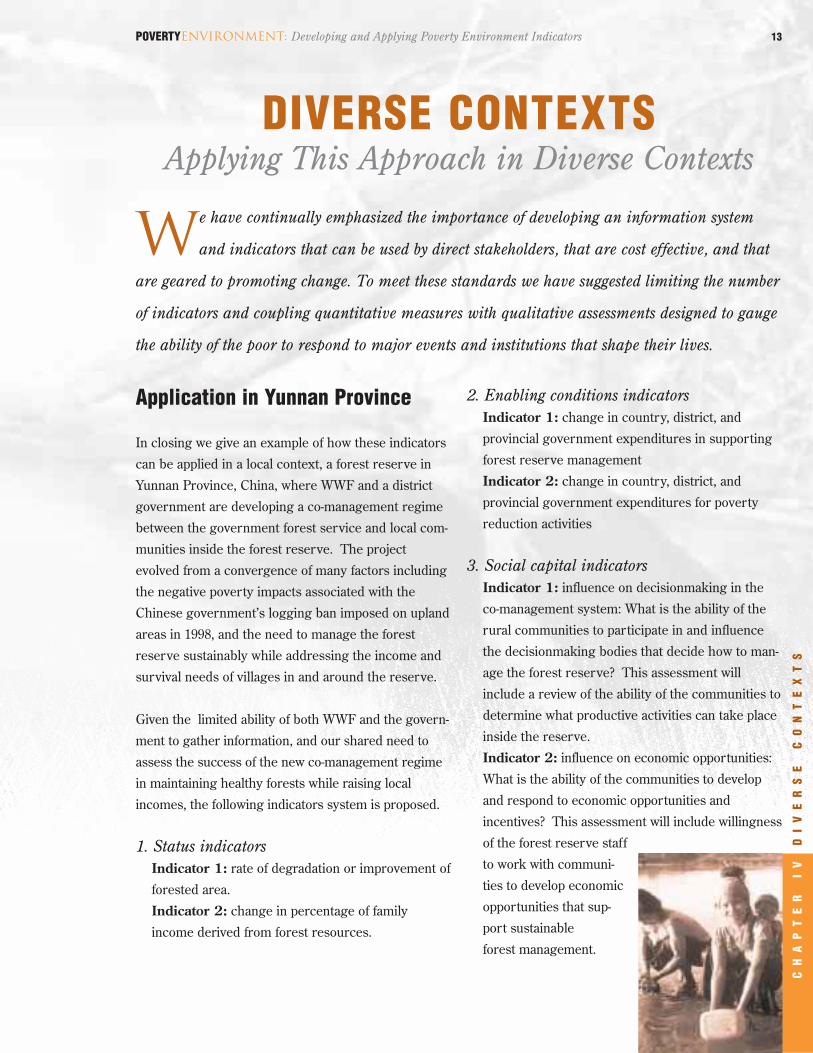
Application in Yunnan Province
In closing we give an example of how these indicators
can be applied in a local context, a forest reserve in
Yunnan Province, China, where WWF and a district
government are developing a co-management regime
between the government forest service and local com-
munities inside the forest reserve. The project
evolved from a convergence of many factors including
the negative poverty impacts associated with the
Chinese government’s logging ban imposed on upland
areas in 1998, and the need to manage the forest
reserve sustainably while addressing the income and
survival needs of villages in and around the reserve.
Given the limited ability of both WWF and the govern-
ment to gather information, and our shared need to
assess the success of the new co-management regime
in maintaining healthy forests while raising local
incomes, the following indicators system is proposed.
1. Status indicatorsIndicator 1: rate of degradation or improvement of
forested area.
Indicator 2: change in percentage of family
income derived from forest resources.
2. Enabling conditions indicatorsIndicator 1: change in country, district, and
provincial government expenditures in supporting
forest reserve management
Indicator 2: change in country, district, and
provincial government expenditures for poverty
reduction activities
3. Social capital indicatorsIndicator 1: influence on decisionmaking in the
co-management system: What is the ability of the
rural communities to participate in and influence
the decisionmaking bodies that decide how to man-
age the forest reserve? This assessment will
include a review of the ability of the communities to
determine what productive activities can take place
inside the reserve.
Indicator 2: influence on economic opportunities:
What is the ability of the communities to develop
and respond to economic opportunities and
incentives? This assessment will include willingness
of the forest reserve staff
to work with communi-
ties to develop economic
opportunities that sup-
port sustainable
forest management.
CH
AP
TE
RI
VD
IV
ER
SE
CO
NT
EX
TS
This limited information system is designed to provide
to the co-management team critical data and analysis
on which basic decisions can be made about adjusting
the forest management system to address emerging
economic, social, and ecological dimensions of the
P-E nexus.
Use by Development Agencies and Others
It is our hope that civil society organizations and
development agencies alike will be open to adopting
the basic elements of this approach. It is focused,
cost-effective, change oriented, and can be adapted to
meet the purposes of each specific intervention.
Moreover, the time and information demands required
to deliver data that can help reshape a specific inter-
vention approach or strategy are relatively modest.
We also believe that its focus on the most important
aspects of a change process involving the poor and its
modest information demands render this approach par-
ticularly attractive. Prevailing approaches to
eliminating poverty consistently underscore the impor-
tance of involving local stakeholders. The indicators
offered above not only provide a means of reflecting
the ability of the poor to drive favorable change
processes but also actually strengthen their ability to
shape interventions alleged to serve their interests.
The design of the information system and selection of
indicators is a political process, a process that is based
on values, past experiences, and aspirations. We hope
the premise is accepted that there is no information
system or set of indicators that can claim impartiality,
neutrality, or lack of bias, regardless of its scientific or
quantitative veneer. From our point of view, the only
acceptable response to the question of bias is to be
very clear about one’s interests and orientation, to
subject one’s work to public review and comment, and
to demonstrate the reasonableness of one’s decisions
and choices. The final test of the value and validity of
a P-E information system and indicators is the direct
contribution to strengthening the interests and capaci-
ties of the poor whom the system is intended to serve.
October 2004.
14 POVERTYENVIRONMENT: Developing and Applying Poverty Environment Indicators
1 See Reed, D (ed). 1992. Structural Adjustment and the Environment, WestviewPress, Boulder, CO; Reed, D (ed). 1996. Structural Adjustment, the Environmentand Sustainable Development. Earthscan Publications, London. 387 pp., and Reed,D. 2001. Economic change, governance and natural resource wealth - The politicaleconomy of change in southern Africa. Earthscan publications, London. 168 pp.Also see Gutman, P. 2001. Forest Conservation and the Rural Poor: A call tobroaden the research agenda. A viewpoint series on poverty and the environment.WWF-MPO, Washington, D.C., December 2001. 12 pp.; Reed, D. and Sheng, F.1998. Macroeconomic Policies, Poverty and the Environment. Washington, D.C.,and Reed, D. 2002. Poverty is not a number, the environment is not a butterfly. Aviewpoint series on poverty and the environment. WWF-MPO, Washington, D.C.May 2002. 17pp.
2 Economic Change, Poverty and the Environment project funded by the EuropeanCommission, Dutch Ministry of Development Cooperation and the SwedishInternational Development Agency.
3 Shyamsundar, P. 2002. Poverty-Environment indicators. Environmental EconomicsSeries. Paper no 84. World Bank, Washington, D.C. January, 32 pp. available at:http://lnweb18.worldbank.org/essd/essdext.nsf/44ByDocName/PovertyandEnvironmentIndicators2002189KPDF/$FILE/PovertyandEnvironmentIndicators2002.pdf
4 Nunan, F. et al. 2002. A study of poverty-environment indicators with case studiesfrom Nepal, Nicaragua and Uganda. Environment Policy Department, Issue paperNo 2. February, United Kingdom Department for International Development,London. 71 pp.
POVERTYENVIRONMENT: Developing and Applying Poverty Environment Indicators
A c k n o w l e d g e m e n t s
The authors have benefited from the comments and advice of
many experts and practitioners. We would particularly like to
thank Pamela Stedman-Edwards and Alison Lobb-Rabe for their
comprehensive and rigorous professional reviews of various
drafts of this document. We benefited greatly from the support
of Mats Segnestam and Annika Otterstedt of the Swedish
International Development Agency and we thank them for their
assistance in organizing a review process with Swedish experts
that included Dag Ehrenpreis, Alexandra Wachtmeister, Ingemar
Gustafsson, Daniel Asplund, Anders Ekbom, Daniel Slunge, and
Maria Berlekom. Likewise, we extend appreciation to colleagues
from WWF-Sweden who provided thoughtful advice and com-
ments to strengthen the environmental side of the
poverty-environment equation. Finally, we would like to extend
our appreciation to Dawn Montanye, Pablo Gutman, and Brent
Nordstrom, colleagues in WWF-Macroeconomics Program Office
(MPO), for their patience and persistence in ensuring that this
document serves the needs of partners in developing countries.
O c t o b e r 2 0 0 4
M/P
/OM
ACRO
ECON
OMIC
SFO
R S
UST
AIN
AB
LE D
EV
ELO
PM
EN
T P
ROGR
AM O
FFIC
EWWF Macroeconomics Program Office1250 Twenty-Fourth Street, NWWashington, DC 20037-1175, USAPhone: (202) 778 9752Fax: (202) 293 9211E-mail: [email protected]: http://www.panda.org/mpo
©Copyright WWF Macroeconomics Program Office,
October 2004
©1986 Panda Symbol WWF-World Wide Fund for Nature
(Also known as World Wildlife Fund)
Photography:
© WWF-Canon / Edward PARKER© WWF-Canon / Elizabeth KEMF© WWF-Canon / Elizabeth KEMF© WWF-Canon / Martin HARVEY© WWF-Canon / Elizabeth KEMF© WWF-Canon / Pablo CORRAL© WWF-Canon / Pablo CORRAL© WWF-Canon / Jo BENN
This program is carried out with support from:
European Commission DG Development
Netherlands’ Ministrerie vanBuuitenladse Zaken (DGIS)
Swedish InternationalDevelopment Agency (SIDA)
A CPrinted on recycled, recyclable paper,using soy-based inks.