poverty alleviation effort of west bengal …webfac/bardhan/papers/... · poverty alleviation...
TRANSCRIPT

1
POVERTY ALLEVIATION EFFORT OF WEST BENGAL PANCHAYATS 1
Pranab Bardhan and Dilip Mookherjee
November 25, 2003
We examine poverty alleviation effort of West Bengal panchayats, comprising implementation of landreforms and pro-poor targeting of credit, agricultural minikits, employment programs and fiscal grants.The sample includes 89 villages and covers four successive panchayat administrations. While averagelevels of poverty alleviation effort were high, there were significant variations both across and withinvillages over time. Poverty alleviation effort within villages improved when land was distributed moreequally, the poor became more literate, there were fewer low caste households, and local elections weremore contested. We argue that this reflects the phenomenon of limited accountability of gram panchayatsto the poor in the presence of high inequality in socio-economic status and political power. The allocationbias was considerably stronger with regard to allocation of resources across gram panchayats, implyingthe need to incorporate need-based formulae in interpanchayat allocations instead of political discretion ofhigher level officials.
1. INTRODUCTION
Elected local governments (panchayats) have played an important role in the implementation of variouspoverty alleviation programs in West Bengal since 1978. These programs include land reform, delivery ofcredit, farm inputs and local infrastructure projects designed to generate employment for the poor. It iswidely believed that these programs were effectively targeted in favour of the poor, due in part to theinvolvement of the panchayats in their implementation.2 The West Bengal experience thus suggests thatdecentralization of delivery of antipoverty programs can result in reduction of targeting failures which haveplagued traditional delivery mechanisms entrusted to centralized bureaucracies.
The literature on decentralization of service delivery however stresses some potential pitfalls.3 The mostimportant of these is the possibility that local democracy may not function well in some contexts, e.g.,where the distribution of assets, literacy and social status is highly unequal, a tradition of widespreadpolitical participation does not exist, and political competition is lacking. Under such conditions, politicalparties may be prone to capture by special interest groups, participation in elections may not be widespread,
1 This paper reports results from an ongoing project on land reforms and decentralization in West Bengal.We are grateful to the MacArthur Foundation and the Guggenheim Foundation for funding this project, andto survey teams led by Sankar Bhaumik and Sukanta Bhattacharya of Calcutta University for the panchayatdata collection. We are also grateful to Bhaswar Moitra and Biswajeet Banerjee of Jadavpur University forleading teams which collected farm cost of cultivation data, and to Indrajit Mallick of the Center forStudies in Social Sciences, Kolkata for helping us obtain relevant election data. We have benefited fromcomments of participants at seminars presented at the Center for Studies in Social Science, JadavpurUniversity, MacArthur Inequality network meetings, MIT, Pennsylvania State University, Stanford andToulouse.2 See, for instance, Appu (1996), Dreze and Sen (1989), Kohli (1997), Lieten (1992), Sengupta and Gazdar(1996), Swaminathan (1990) and Webster (1992).3 See Bardhan (1996, 2002), Bardhan and Mookherjee (2000), Bird (1995), Crook and Manor (1998),Dreze and Sen (1989), Lieten (1996), Mathew and Nayak (1996), Mookherjee (2004), Prud'homme (1995),Tanzi (1996), Manor (1999) and the 2003 World Development Report.

2
and voters may be swayed more by campaign rhetoric or political handouts rather than genuine policyissues. Dreze and Sen (1989) explain this concern succinctly:
``The extent of economic distress experienced by different individuals is,to a great extent, a matter of common knowledge within a given ruralcommunity. An apparent solution to the selection problem would take theform of making the selection process rely on local institutions to allocatepublic support according to individual needs.
Would this method work in practice? The leaders of a village communityundoubtedly have a lot of information relevant for appropriate selection.But in addition to the informational issue, there is also the question as towhether the community leaders have strong enough motivation --- orincentives --- to give adequately preferential treatment to vulnerablegroups. Much will undoubtedly depend on the nature and functioning ofpolitical institutions at the local level, and in particular on the power thatthe poor and the deprived have in the rural community. Where the poor arealso powerless --- as is frequently the case --- the reliance on localinstitutions to allocate relief is problematic, and can end up being at bestindiscriminate and at worst blatantly iniquitous, as numerous observershave noted in diverse countries.’’ (Dreze and Sen (1989, p.107))
In some earlier theoretical work we have explored some of these issues and their implications for the effectof decentralizing delivery of antipoverty programs.4 However there is relatively little detailed empiricalevidence available about how targeting performance in a decentralized system varies with local assetinequality, literacy or political concentration.5
In this paper we report the results of our recent research concerning this issue in the context of the WestBengal panchayats. It is based on a dataset we have assembled for a sample of 89 villages spread through15 districts of the state (which exclude only Kolkata and Darjeeling). Our data includes the extent of landreforms implemented, and the proportion of benefits of various antipoverty programs that accrued tolandless and small landowners, across four different panchayat administrations spanning two decades sincethe late 1970s. We examine how these varied with land inequality, literacy among the poor, proportion ofscheduled castes and tribes in the local population, and political concentration (i.e., the proportion ofpanchayat seats secured by the dominant Left Front). Our results are based on examining variations in landreform effort and targeting of antipoverty programs with respect to variations in land inequality, literacyand political concentration within these villages over time. This enables us to control for unobservedvillage or district characteristics that may give rise to spurious correlations in a cross-sectional analysis.The West Bengal experience is uniquely suited for this purpose because it provides a long enoughexperience with devolution to local governments to permit such an analysis.
Such an exercise is aimed at understanding determinants of effectiveness of local democracy inimplementing antipoverty schemes. The data does not permit us to compare the performance of thedecentralized system with the centralized system that preceded it in West Bengal prior to the late 1970s,nor relative to other Indian states. The results reported here are based on a more detailed analysis whichinterested readers seeking further clarification of the data, econometric methodology or regression resultscan refer to.6 The purpose of this paper is to provide an overview of the main results, without going into
4See Bardhan and Mookherjee (2002, 2003a).5 There are of course numerous case studies in the literature, many of which have been cited above.Available literature on experience of different developing countries is surveyed in Mookherjee (2004).Econometric evidence on targeting of a decentralized education program in Bangladesh is studied byGalasso and Ravallion (2000), and of a land reform program in Vietnam by Ravallion and van de Walle(2002). Banerjee (2003) examines the allocation of infrastructure, education and health services acrossIndian villages.6 See Bardhan and Mookherjee (2003b, 2003c).
3
excessive technical detail. Accordingly we present the results in terms of the impact of a hypotheticalceteris paribus change in land distribution, literacy or political concentration (of a magnitude comparableto changes observed over the sample period).
Section 2 describes the nature of the data set and its construction. Section 3 then evaluates the land reformexperience, and Section 4 the targeting performance of farm input delivery and various antipovertyschemes. Finally Section 5 concludes.
2. DATA
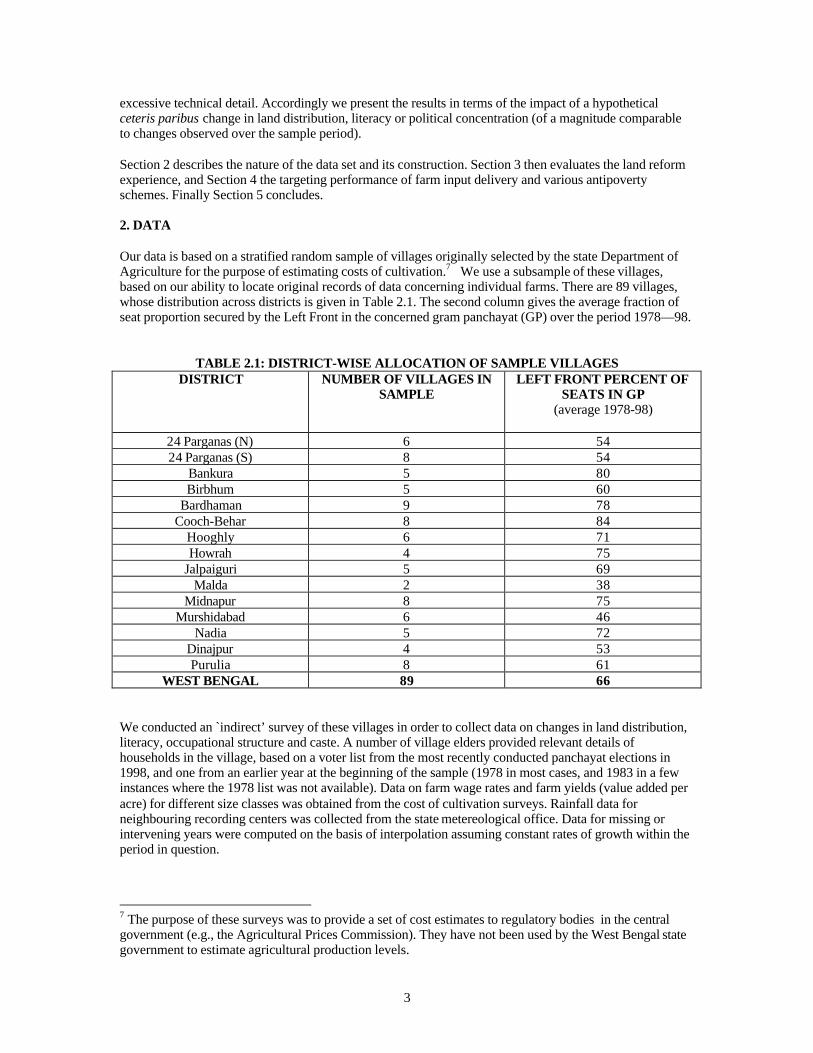
Our data is based on a stratified random sample of villages originally selected by the state Department ofAgriculture for the purpose of estimating costs of cultivation.7 We use a subsample of these villages,based on our ability to locate original records of data concerning individual farms. There are 89 villages,whose distribution across districts is given in Table 2.1. The second column gives the average fraction ofseat proportion secured by the Left Front in the concerned gram panchayat (GP) over the period 1978—98.
TABLE 2.1: DISTRICT-WISE ALLOCATION OF SAMPLE VILLAGESDISTRICT NUMBER OF VILLAGES IN
SAMPLELEFT FRONT PERCENT OF
SEATS IN GP(average 1978-98)
24 Parganas (N) 6 5424 Parganas (S) 8 54
Bankura 5 80Birbhum 5 60
Bardhaman 9 78Cooch-Behar 8 84
Hooghly 6 71Howrah 4 75
Jalpaiguri 5 69Malda 2 38
Midnapur 8 75Murshidabad 6 46
Nadia 5 72Dinajpur 4 53Purulia 8 61
WEST BENGAL 89 66
We conducted an `indirect’ survey of these villages in order to collect data on changes in land distribution,literacy, occupational structure and caste. A number of village elders provided relevant details ofhouseholds in the village, based on a voter list from the most recently conducted panchayat elections in1998, and one from an earlier year at the beginning of the sample (1978 in most cases, and 1983 in a fewinstances where the 1978 list was not available). Data on farm wage rates and farm yields (value added peracre) for different size classes was obtained from the cost of cultivation surveys. Rainfall data forneighbouring recording centers was collected from the state metereological office. Data for missing orintervening years were computed on the basis of interpolation assuming constant rates of growth within theperiod in question.
7 The purpose of these surveys was to provide a set of cost estimates to regulatory bodies in the centralgovernment (e.g., the Agricultural Prices Commission). They have not been used by the West Bengal stategovernment to estimate agricultural production levels.

4
Sample averages of relevant characteristics for 1978 and 1998 are provided in Table 2.2. There was a sharpincrease in the number of households within villages, resulting in increased population density relative tocultivable land area. In computing the land distribution we use only statistics pertaining to cultivable land,excluding what households received from the land reform program. As we shall see later these changeswere substantially larger than the extent of land distributed through the land reform program. The averagefraction of landless households rose from 45 to 49%, accounting for almost half the population by the endof the period. At the same time big landholdings were subdivided into smaller ones. In terms of thedemographic weight of different land classes, the proportion of medium and big landowners declined by2.5% and 0.7% respectively. The shift to small landholdings below 5 acres in size involved about 12.5% ofcultivable land, operating through household division and market sales. Even within the small landholdingcategory there was an increase in the proportion of land in the marginal category ranging from 0 to 2.5acres. Our working paper shows that these changes in our dataset parallel corresponding changes in thedistribution of operational holdings between 1980 and 1995 in the state Agricultural Censuses.8
TABLE 2.2: ECONOMIC AND DEMOGRAPHIC CHARACTERISTICS IN SAMPLE VILLAGES
1978 AVERAGE 1998 AVERAGENumber of Households 219 388Operational Land-household ratio 1.75 acres 1.07 acresPer cent households landless 44.8 48.7Per cent households smalllandowners (0-5 acres)
51.3 50.5
Per cent households mediumlandowners (5—12.5 acres)
4.9 2.4
Per cent big landowners (12.5acres--)
1.1 0.4
Per cent land in small holdings 67.3 79.9Per cent land in medium holdings 23.6 15.2Per cent land in big holdings 9.1 4.9Per cent of poor (landless+smalllandowners) that are illiterate
50.5 38.4
Per cent of households belongingto scheduled castes/tribes
32.8 34.4
Per cent households with head innonagricultural occupation
38.7 47.4
Farm yield (value added inRs/acre)
1995 6483 (in year 1996)
Hourly male wage rate (Rs/hour) 2.11 4.43Cost of living index .80 6.50
Apart from the change in the land distribution, there were also significant changes in education andoccupational structure. The illiteracy rate among the poor (henceforth defined as the sum of landless andsmall landowning households) dropped from one half to one third. Medium and big landowners werealmost entirely literate at the beginning of the time period, so did not encounter any significant change inthis respect. The proportion of households belonging to scheduled castes and tribes (SC/ST) remainedstationary at about one-third. The importance of non-agricultural occupations grew substantially. Farmyields and male wage rates rose in nominal terms, though most of these were outweighed by increases inthe cost-of-living index.
8 They are also consistent with the findings of the WIDER survey carried out by Sengupta and Gazdar(1996) for six villages.

5
3. LAND REFORMS
Table 3.1 provides averages of the land (patta) distribution and sharecropper (barga) registration programsachieved by 1998. Data on land titles distributed and sharecroppers registered for the relevant villages inthe local block land records office (BLRO) were collected directly from those offices. An alternativeestimate was provided by the village elders in the indirect survey, while accounting for the nature andsources of land belonging to different households. As Table 3.1 indicates, the survey estimates lieconsiderably below the BLRO estimates. Since the survey estimates are based on third-party non-legalevidence (and also subject to recall biases concerning land reforms carried out upto twenty years ago), weprefer to use the BLRO estimates which are firmly based on legal records.9
TABLE 3.1 LAND REFORMS IMPLEMENTED: SAMPLE AVERAGES
PATTALAND PATTADAR BARGALAND BARGADAR%
CULTI-VABLELANDAREA
%CULTI-VABLELANDAREA
%HOUSEHOLDS
%HOUSEHOLDS
%CULTI-VABLELANDAREA
%CULTI-VABLELANDAREA
%HOUSEHOLDS
%HOUSEHOLDS
1998 1998 1998 1998 1998 1998 1998 1998BLRO Survey BLRO Survey BLRO Survey BLRO Survey
OutsideNorthBengal
3.7 3.0 13.8 5.5 8.0 3.0 5.3 1.9
NorthBengal
21.1 4.3 18.5 13.5 2.5 2.2 3.4 1.6
WestBengal
9.0 3.4 15.3 8.1 6.2 2.8 4.7 1.8
The following facts are worth noting from Table 3.1. Particularly outside North Bengal, the proportion ofcultivable land area distributed in the form of land titles was below 4%. This is considerably less than thechange in the cultivable area into small holdings from medium or big holdings that occurred throughhousehold division or land sales. Second, the proportion of households that were issued land titles was ofthe order of 15%. This amounted to approximately one in every three landless households. The land reformprogram was thus more significant in terms of the number of households that benefited, rather thancultivable land area transferred. Third, in demographic terms the land title program was far more
9 However it should be noted that some of the discrepancy may involve failures in the delivery of actuallandtitles to the concerned recipients, so the BLRO records may represent an overestimate of the actualdistribution of benefits to households. Moreover the BLRO land title statistics pertain to all land titlesissued, including both cultivable and noncultivable land, whereas the village elders involved in the surveyended to discount titles to barren, noncultivable land. This partly accounts for the large discrepancy in theland areas estimated to have been transferred in North Bengal villages, many of which reportedly involvedabandoned fruit orchards that could not be used for cultivation. Our survey estimate of the cultivablefraction of distributed land was 70% in north Bengal, compared with 90% in the rest of the state.

6
significant that the barga program, which benefited less than 5% of households on the basis of the BLROrecords. A similar estimate of the relative magnitude of the two programs is provided by the survey data.
Our regression analysis examined the covariation of these four different land reform measures (proportionof cultivable land area and of households under the two different programs) with the village landdistribution, literacy among the poor, proportion of SC/ST households, and proportion of seats in the localGP secured by the Left Front. These span four successive five year timeblocks, each corresponding to agiven panchayat administration (1979-83, 1984-88, 1989-93, 1994-98). The regression controlled forvillage fixed effects, time dummies and substantial censoring in the data (wherein a majority of villages didnot carry out any land reforms at all in any given timeblock). The regression coefficients can therefore beinterpreted as the extent to which deviations in the land reform measure from a common time trend wereassociated with changes occurring in any regressor within any village, while controlling for all otherregressors, for a village in which land reforms were being undertaken at all.
We found that a significant determinant of land reform activity was the extent of Left control over the localGP. Specifically, land reform was declining in the extent of political concentration. The relationship withthe Left share of GP seats represented an inverse-U, with a turning point well below the mean Left share of68% (as well as the median share of 74%). In other words, for a majority of villages in the sample, therewas a tendency for land reform effort to decline as the Left Front gained increased control of the localgovernment.
Our working paper explored possible explanations for this finding. While in principle the Left share of GPseats is endogenously determined along with land reforms, we provide evidence there that the Left sharewas driven principally by swings in voter loyalty, based on events at the district or state level, combinedwith historical patterns of incumbency within the village. In particular they do not seem to have beeninfluenced either by the existing land distribution or past land reforms carried out in the village. Hence theinverse-U pattern cannot be explained by a possible correlation of Left electoral success with a perceivedneed (or lack of it) for land reform by voters within the village.
Proceeding on the assumption that changes in political control were exogenous with respect to the landreforms or the nature of the local land distribution, the inverted U pattern can be explained by a tendencyfor the dominant party to slacken its effort to satisfy voter demand for land reform when it faced lesselectoral competition from its political rivals (owing to a swing of voter sentiment in its favor). Converselyofficials from rival parties exerted greater land reform effort in an effort to woo voters back. The incentiveof the dominant party to slacken land reforms may be the result of various factors, such as the cost of therequired effort by the concerned officials, campaign contributions or influence exerted by other means bymedium or big landowners to limit the reforms.
Local land inequality or prevalence of SC/ST households played a less important role, relative to politicalcomposition of gram panchayats. On the other hand, higher literacy among the poor were strongly andpositively correlated with the land distribution program, though not with the sharecropper registrationprogram. The significance of different factors in explaining the land reform effort is depicted in Table 3.2,which displays the effect of a hypothetical ceteris paribus change in different aspects of the landdistribution, literacy, and caste on different land reform measures as predicted by our regression results.The latter are of an order of magnitude comparable to those actually observed over time (e.g., in theaverage across different villages), with the exception of the SC/ST proportion which changed very slightly(less than 2 percentage points).
An increase in the Left share of GP seats from 68% to 75% was associated with a statistically significantdrop in land areas covered by either land distribution (patta) or sharecropper registration (barga) programs,and in the proportion of households receiving pattas. The predicted changes are quantitatively significant,e.g., relative to the mean value of the concerned land reform measure. The same is true in relation to thestandard deviation as well, excepting the case of land area distributed.10 The effect of a 12% increase in
10 They are between a third and one sixth the standard deviation reported in the first row of Table 3.2,which include variability both across and within villages. The appropriate benchmark however is the within

7
literacy among the landless and small landowners is even more dramatic. A 10% shift in the share ofcultivable land area from medium to small landowners has a statistically significant effect only on theproportion of households receiving pattas, but this effect is large (amounting to almost twice the standarddeviation of the dependent variable). In summary, villages with a more egalitarian land distribution, higherlevels of literacy among the poor, and more evenly contested between rival political parties experiencedsignificantly higher land reform. From a normative (equity) standpoint the `need’ for land reform is morepressing the more unequal the land distribution and the less literate the poor are. The fact that the actualpattern was the opposite of this suggests that differences in political accountability of the local governmentsplayed a key role, with greater equality in land, literacy and political competition inducing greateraccountability.
TABLE 3.2: LAND REFORM ASSOCIATED WITH CHANGES IN LAND DISTRIBUTION,LITERACY, CASTE AND POLITICAL CONCENTRATION
PATTALAND PATTADAR BARGALAND BARGADARMean (s.d.)fraction of
land/hh’s pertimeblock
.016 (.119) .048 (.142) .032 (.421) .013 (.051)
EFFECT OF:2.5% householdsswitch frommedium tolandless category
i i i i
10% cultivableland shifts frommedium to smallcategory
i .24 i i
12% rise inliteracy amongpoor
.54 .22 i i
5% householdsswitch from non-SC/ST to SC/STcategory
i i i i
Left share of GPseats rises from68% to 75%
-.008 -.031 -.068 -.018
i: denotes statistically insignificant effect (at 10% level)Entries reported only for statistically significant effects at 10%s.d. denotes standard deviation.
village standard deviation (over time), which were approximately a half of the overall standard deviation.The predicted changes are thus between one third and two thirds of the within-village standard deviations,with the exception of land area distributed (where it was one eighth).

8
4. DELIVERY OF FARM INPUTS AND ANTIPOVERTY PROGRAMS
The West Bengal panchayats played an important role in delivery of farm inputs and implementation ofpoverty alleviation schemes. This included selection of beneficiaries of credit under the IRDP program,agricultural minikits, and employment generation programs aimed at creating and maintaining ruralinfrastructure such as roads and irrigation (e.g., the Jawahar Rozgar Yojana (JRY) program). Besides thesemajor programs, they implemented hundreds of minor earmarked programs handed down from upper levelgovernments. In most cases, the aggregate quantum of the resource in question was handed down to thepanchayats through a hierarchical budgeting process, and their capacity to supplement these with additionallocal revenues was limited. Most of the grants received from higher level governments were tied to specificprograms, offering them little flexibility with respect to their allocation across different sectors. The onlypossible exception is the allocation of JRY funds, which the gram panchayats could allocate acrossdifferent kinds of local projects (though we have been told by panchayat officials that even this wasrestricted in certain periods). The employment programs typically stipulate the proportion of expendituresacross wages and material costs, further limiting flexibility with respect to their implementation.Accordingly the main responsibility devolved to the gram panchayats was the selection of beneficiaries oflimited amounts of resources within specified sectors within the village.
Accordingly the analysis of targeting of these programs involves two distinct but interrelated components.First, each resource was allocated across different districts and villages, a decision made at higher levels ofthe government, such as the District Rural Development Agency (DRDA) of the state governmentallocating them across districts, zilla parishads at the district level allocating their allotments acrossdifferent blocks, and panchayat samities at the block level allocating theirs in turn across different grampanchayats. We refer to the outcome of this as the intervillage allocation. Second, each gram panchayatallocates the amounts it receives across different villages under its purview, and across beneficiaries withineach village. We refer to the latter as the intravillage allocation. It is made by a different set of officials(elected officials of the gram panchayat, rather than upper level bodies), motivated by different kinds ofelectoral pressures (winning local rather than district or state elections), informational bases and resourceconstraints. Accordingly the intra and intervillage allocations need to be analyzed separately, and revealsomething about responsiveness of the panchayat systems at different levels. The intra and intervillageallocations are likely to be linked, owing to attempts made by the state government since the mid-80s toinvolve lower levels of the panchayat system in expressing their needs to higher levels. In addition, theintervillage allocation is likely to incorporate expectations by higher level panchayat officials concerningthe nature of intravillage targeting achieved by different gram panchayats within their jurisdiction. Forinstance, if a given gram panchayat is not expected to target any significant portion of the resource to thepoor, a higher level government may decide not to allocate much to that gram panchayat on the groundsthat most of the resource will not reach the intended beneficiaries. This does not necessarily indicate thatthe higher level government officials lack a commitment to the poor.
Additional problems arise in making inferences about accountability from targeting performance, which areelaborated more fully in our working paper. A panchayat may allocate less farm inputs to small landownersrelative to large ones if the former are likely to make less productive use of these inputs. An accountablegovernment may be motivated by considerations of the overall productivity of agriculture in the village,which may benefit the poor indirectly: e.g. by generating more farm employment for the landless, morerevenues for the panchayat which could be used to fund low-income benefits. Such productivityconsiderations (rather than lower levels of panchayat accountability) may induce lower targetingperformance when land shares are skewed in favour of big landowners. Our analysis of targeting thereforecontrols for productivity differences between small and large landowners in the intravillage allocation, andbetween villages in the intervillage allocation.
A more revealing way to infer patterns of accountability is to examine variations of targeting shares withthe demographic weights of the poor, since demographic weights are less likely (than their land shares orliteracy) to directly affect relative productivity of small and big farms in the use of distributed resources.Villages with greater proportion of landless households for instance thus ought to target its resources more
9
intensively in favour of the poor. This is the outcome one would expect from a functioning local democracywhen landless and small landowners comprise 95% of the population. If the observed pattern is theopposite --- i.e., if a rise in the proportion of landless or low caste households is associated with poorertargeting to those groups, it is more likely to have been caused by an accompanying decline in governmentaccountability to the poor.11
A third way to evaluate accountability on the basis of targeting performance is to examine leakages inprograms earmarked exclusively for the poor, such as the IRDP credit program. We also examine theproportion of panchayat expenditures allocated to developmental expenditures rather than salaries andadministrative costs, which reflect the allocation of public revenues between panchayat officials on the onehand and both poor and nonpoor residents on the other.
IRDP Credit Program
The IRDP program which started in 1978 replaced a number of different programs with a single integratedpackage of technology, services and assets aimed at improving the earning capacity of the rural poor. Themost important component was a loan offered to the recipient, a certain fraction of which was a subsidywhich did not have to be repaid. The target groups were scheduled castes and tribes, agricultural workers,artisans, marginal and small farmers not owning more than 5 acres of land. The subsidy rate was highest(50%) for scheduled castes and tribes, and lower (ranging from 25 to 33%) for others depending on howmuch land they owned. A certain fraction was earmarked for women and scheduled castes and tribes. Theloans were usually given to enable recipients to invest in assets required in service professions (such asartisan tools, retail shops or rickshaws), livestock and agricultural implements. The loans were channeledthrough `lead' commercial banks located in the vicinity of the villages. The panchayats usually selected anumber of applicants from within each village and forwarded their applications to the local lead bank, withthe ultimate loan decision made in consultation between panchayat officials, officers of the bank, blockofficials, and DRDA officers.
Table 4.1 provides some descriptive statistics concerning disbursement of loans in our sample villages.Data was collected for selected years (usually one or two years within any given five year timeblockassociated with a given panchayat administration) from the corresponding lead bank, who furnished detailsof IRDP loans advanced during that year. Matching the names of the borrowers with our indirect surveyenabled us to identify their landholding status. However the coverage of the data was limited in the firsttime-block 1979-83, possibly because the IRDP program was slow to start in the beginning (Lieten (1992,Chapter 7)). A complete enumeration of landholding status of all loans advanced was possible for over 90%of the village-years that we sampled, and our analysis is based on this subsample. We also estimated theextent of the loan subsidy involved by incorporating the direct subsidy component, and imputing theindirect subsidy on the rest under varying assumptions about the difference between the interest chargedand informal interest rate. Since the results did not turn out to be affected by alternative assumptionsconcerning informal interest rates, we report the results corresponding to the assumption of a 50%difference between the interest charged on the loan and the rate on the informal market.
Table 4.1 indicates that by the mid-80s, virtually all villages were participating in the program. Withinparticipating villages the total volume of credit subsidy in any given year was Rs 6700 (in 1980 prices),amounting to about Rs 30 per household. The average size of subsidy in an individual loan was Rs 826,with eight out of three hundred households on average receiving a loan. Hence participation within thevillage was highly selective.
The share of credit subsidy of the target population comprised of the landless and small landowners was.96, averaging across all villages and years. The corresponding average share of the landless was
11 In addition, a negative correlation of targeting with demographic weight of the poor cannot be accountedby potential endogeneity of the demographic weights arising from migration of the poor. If at all the poormove between villages and districts in order to be eligible for the benefits of these antipoverty programs, itwould induce a positive correlation between targeting and landlessness.

10
approximately half of this, amounting to .46. As Table 4.1 indicates, these were above their respectivedemographic weights and land shares. The average level of targeting to the intended beneficiaries was thusquite high. However, this high average was accompanied by substantial variations within the sample,especially with regard to the targeting share of the landless.
TABLE 4.1 IRDP CREDIT: SAMPLE VILLAGE AVERAGES
1979-83 1984-88 1989-93 1994-98 ENTIREPERIOD1978--98
Number ofVillage-yearsin sample
10 100 160 165 425
Number ofvillage-yearswith positivecredit flow
10 96 159 165 420
Averagesubsidy perhousehold invillages withpositive credit
130.61 38.58 28.27 18.19 29.10
Landless shareof creditsubsidy (s.d.)
.40 (.46) .49 (.40) .44 (.38) .45 (.40) .46 (.39)
Upto Small:share of creditsubsidy (s.d.)
.73 (.40) .96(.16) .97(.11) .98(.10) .96(.14)
Landless: ratioof subsidyshare todemographicweight
.81 1.59 1.42 1.23 1.37
Upto Small:ratio of creditsubsidy todemographicweight
.82 1.05 1.03 1.01 1.02
Upto Small:ratio of creditsubsidy to landshare
1.57 1.57 1.41 1.32 1.41
All amounts expressed in 1980 prices. `Upto Small’ indicates category comprising landless and smalllandowners (all households owning 5 acres or less of cultivable land). s.d. denotes standard deviation.

11
TABLE 4.2: INTERVILLAGE TARGETING OF IRDP CREDIT SUBSIDIES
Mean (s.d.) at 1980 pricesIRDP Credit Subsidy per household received by
a village
29(66)
EFFECT OF:2.5% households switch from medium to landlesscategory
-37
10% cultivable land shifts from medium to smallcategory
12?
12% rise in literacy among `upto small’ 15?5% households switch from non-SC/ST to SC/STcategory
-21
Left share of Zilla Parishad seats rises from 86% to96%
-4
`Upto Small’ indicates category comprising landless and small landowners (all households owning 5 acresor less of cultivable land). s.d. denotes standard deviation.
i: denotes statistically insignificant effect (at 20% level), ?: denotes statistically significant at 20% but notat 10%; Entries reported only for statistically significant effects at 20%
TABLE 4.3: INTRAVILLAGE TARGETING OF IRDP CREDIT SUBSIDIES
Share of Landless Share of `Upto Small’ Share of MediumLandowners
Average (s.d.) .46(.39) .96(.14) .015EFFECT OF:2.5% households switchfrom medium to landlesscategory
i -.06 .011
10% cultivable landshifts from medium tosmall category
i .02 -.06
12% rise in literacyamong poor
i i i
5% households switchfrom non-SC/ST toSC/ST category
i -.02 .06?
Left share of ZillaParishad seats rises from86% to 96%
i i .02
i: denotes statistically insignificant effect (at 20% level)?: denotes statistically significant at 20% but not at 10%
Entries reported only for statistically significant effects at 20%

12
Table 4.2 indicates substantial biases in the intervillage allocation of IRDP credit operating against landlessand SC/ST households.12 Relatively small increases in their demographic weight were associated with largedecreases in credit allotted to the village. On the other hand increases in land share of small landowners andtheir literacy were associated with large increase in credit allotments. While the latter can perhaps berationalized by productivity considerations, the former fact is less easy to rationalize on that basis,particularly for a program whose objective is to help the rural poor and low caste population invest in assetsin order to reduce their poverty. It is more plausible to interpret these as reflecting variations in the politicalweight of the poor, which fell when there was greater poverty within the village. Table 4.1 also indicatesthat political concentration at the district level affected the intervillage allocation. An increase in the Leftshare of the Zilla Parishad by ten percentage points from its mean was associated with a decline in theallocation to villages in that district by about one seventh of the mean allocation.
Table 4.3 shows similar biases operating in the intravillage allocation as well. Increased landlessness,prevalence of SC/ST households in the village and a rise in political control of the Left over the ZillaParishad beyond the mean was associated with increased leakages to medium and big landowners at theexpense of the intended beneficiaries (the `upto small’ category). Conversely, increased land shares ofsmall landowners were associated with improved targeting. These effects are however small in comparisonwith the high average level of targeting. Moreover, no statistically significant effects on the share of thelandless emerged, suggesting that the results reflect a conflict between small landowners on the one handand medium and big landowners on the other. Especially striking is the fact that the magnitude of the biasesin intravillage targeting pale in comparison with the intervillage allocation. For instance, if we calculate thecombined effect of increased landlessness or proportion of SC/ST households in the village on the flow ofthe credit subsidy to its intended beneficiaries, the intervillage biases dominate by far. Credit to the villageas a whole declined by 140 and 75% respectively, while the intravillage share of target groups declined byless than 5%.
Agricultural Minikits
An important component of agricultural policy during this period comprised the distribution of minikitscontaining seeds of high yielding rice varieties, potatoes, mustard, sesame, vegetables, fruits andlentils, besides fertilizers and pesticides. These were distributed by the block offices of the state'sAgriculture department, in consultation with panchayat officials. In the sample villages the bulk of thesewere accounted by HYV rice seeds, potato seeds and oilseeds. Table 4.4 provides some of the relevantdescriptive statistics for the number of all kits distributed, as well as those kits containing rice seeds, potatoand oilseeds specifically. The spread of kits of any single category was limited to a relatively small fractionof villages in any given year, and this is even more true for other categories of kits. So it makes sense tofocus mainly on the allocation of all kits. Since the kits cannot be used by non-cultivators, we examine thetargeting share of the ̀ upto small' category rather than of the landless households.13
Similar to the allocation of IRDP credit, the target share of small and marginal landowners was high onaverage, amounting to approximately 87%. The same average prevailed within the category of kits
12 Apart from village and timeblock dummies, the underlying regression controls for the average credit flowin the state as a whole, population-bank branch ratio in the district, and the following village variables:number of households, average farm yield, wage rate, rainfall, and percent household heads innonagricultural occupations.13 Landless households may however use the kits on homestead land, or on plots they may lease in.Moreover even if they could not use a kit they could conceivably sell it. So it does not make sense toexclude them either in the target group. It turns out that a nontrivial fraction of the kits were indeedallocated to landless households.

13
containing rice seeds and potato/oilseeds as well. These shares significantly exceeded their demographicweights and land shares.
Table 4.5 provides estimates of how intra and inter-village targeting varied with village characteristics.Again, increased landlessness is associated with a significant decline in the number of kits received by avillage, and in turn the fraction of these allocated to small landowners or landless within the village. Andagain the magnitude of the variation associated with the intervillage bias is proportionately much greaterthan the intravillage bias. In case one wonders whether the intervillage bias can be rationalized by theinability of the landless to use the kits productively, note that similar results obtain for demographic shiftsbetween medium and small landowners which are unlikely to impact relative productivity the same waythat landholdings or literacy might. Parallel to the credit results, we again see a positive effect on targetingassociated with rising land shares of small landowners (at the intravillage level), and a negative effect withrising proportion of SC/ST households. Rising literacy among the poor was associated with a significantrise in the allocation received by the village. All these results are consistent with the hypothesis that thevariations are driven by political weights of the poor that declined as they became poorer and less literate.The alternative hypothesis that productivity considerations dominated the allocation decisions isadditionally undermined by the fact that the effects reported here control for productivity differences(between villages in the intervillage analysis, and between size classes within the village in the intravillageanalysis).
TABLE 4.4 MINIKIT DISTRIBUTION: SAMPLE AVERAGES
1979-83 1984-88 1989-93 1994-98 ENTIREPERIOD:1979-98
Number ofVillage Yearsin Sample
73 84 94 97 358
Number ofVillage Yearswith positivenumber of kits
61 73 85 89 308
Number ofVillage Yearswith positivenumber of ricekits
24 45 29 16 114
Number ofVillage Yearswith positivenumber ofpotato/oilseedkits
38 36 37 57 168
Averagenumber of kitsper householdin villagesreceiving kits
.19 .17 .12 .12 .14
Averagenumber of ricekits perhousehold invillages
.15 .08 .04 .02 .08

14
receiving ricekitsAveragenumber ofpotato/oilseedkits perhousehold invillagesreceiving suchkits
.15 .08 .04 .02 .08
Upto Small:share of all kits
.91 .84 .87 .87 .87
Upto Small:share of ricekits
.87
Upto Small:share ofpotato/oilseedkits
.85
Upto Small:ratio of all kitsshare todemographicweight
.98 .91 .92 .89 .92
Upto Small:ratio of all kitsshare to landshare
1.43 1.38 1.32 1.17 1.33
TABLE 4.5 MINIKIT INTERVILLAGE AND INTRAVILLAGE TARGETING
Intervillage All Kits(kits/household)
Intravillage All Kits(share of `upto small’)
Average (s.d.) .13(.24) .87 (.27)EFFECT OF:
2.5% households shift frommedium landowners to landless
-.09 -.06?
2.5% households shift frommedium to small landownercategory
-.075 I
10% shift of land from medium tosmall category
i I
12% rise in literacy of ̀ uptosmall’ category
.06 I
5% rise in proportion of SC/SThouseholds
-.05 I
Left share of Zilla Parishad risesfrom mean by 10%
i I
i: denotes statistically insignificant effect (at 20% level)?: denotes statistically significant at 20% but not at 10%
Entries reported only for statistically significant effects at 20%

15
Employment Programs
Employment programs were probably the single most important instrument for generating incomes amongthe poor. In 1980 the Food for Work program as replaced by the NREP and RLEGP, whose objectives wereto generate employment for the landless, with a preference for scheduled castes and women. The projectsusually involved construction of rural infrastructure. In 1989 these various programs were merged into theJRY, which existed until the late 1990s. The programs were sponsored by the central government, withmatching contributions from the state government. In West Bengal responsibility for implementation of theprograms were devolved to the panchayats. However numerous restrictions concerning utilization of fundswere imposed, especially with respect to proportion of labour and material costs, and sometimesconcerning the nature of projects to be selected. While allocation of these grants were formula-based, theiractual utilization often varied from the sanctioned amounts owing to delays in disbursements.
The scale of these programs were considerably larger than the IRDP. From the budgetary records of theGPs in our sample we computed the total grants actually received and spent for all employment programsfor selected years. Approximately one in ten GPs did not receive any grants in any given year. For thosethat did receive grants, the average amount received was about Rs 60,000 per year at 1980 prices, or aboutRs 850 per household. This was ten times the average allotment of credit subsidies under the IRDP.
To examine the nature of targeting of these employment grants, we examine variations in grants receivedper household by any given village for the intervillage analysis, and mandays of employment generated perrupee of grant money received for the intravillage analysis (since employment generated best represents thebenefits of the program to the landless). 14 Our regression results indicate that the targeting of employmentprograms varied far less with respect to changes in the land distribution, literacy or caste than in credit orminikits.15 None of these village characteristics had a statistically significant effect on either intervillage orintravillage targeting. The only significant correlate of employment generation from allotted grants to theGP was the fraction of local GP seats secured by the Left, with respect to which an inverted-U relationshipemerged, parallel to our results for the land reform program.
Table 4.6 provides estimates of shifts in land distribution, literacy, SC/ST proportion and Left control ofthe GP on targeting of employment programs. The results are qualitatively similar to those of the credit,kits and land reform programs, though most of these effects are statistically insignificant owing to largestandard errors. Increased landlessness and higher illiteracy among the poor worsened targeting at bothintervillage and intravillage levels, while caste had a negligible effect. The intervillage effects of changingland distribution were quantitatively more significant than the intravillage effects. However the oppositewas true for changes in literacy and political composition of the GP.
The fact that the effects of changing land distribution and literacy were similar to those seen for the otherprograms, and that these employment programs were intended mainly to increase incomes of the landless,adds credence to the hypothesis that targeting variations responded to changing political weights ofdifferent classes (rather than productivity differences). However the employment program exhibited lessvariability with respect to these village characteristics. This is perhaps the effect of being more formula-bound than the credit or kits program, allowing less discretion to panchayat officials over theirimplementation. Our regressions found that the intervillage allocation of employment grants was also
14 We do not have access to data concerning the landholding status of those employed in these programs, socannot assess intravillage targeting on that basis.15 The intravillage regression uses a tobit with district (rather than village) fixed effects in order toincorporate substantial censoring in the data, i.e., villages that did not generate any employment at all in agiven year. Some of the statistical imprecision may have resulted from this.

16
insensitive to variations in rural wage rates, farm yields or rainfall. This is the flip-side of a formula-boundprogram: a lack of sensitivity to variations in local need.
TABLE 4.6 EMPLOYMENT PROGRAMS: INTERVILLAGE AND INTRAVILLAGETARGETING
Employment grant received byGP
(Rs/household), 1980 prices
Mandays employmentgenerated per rupee of
employment grant receivedAverage (s.d.) 315 (511) .018 (.095)
EFFECT OF:2.5% households shift from
medium landowners to landless-150i -.004i
10% shift of land from medium tosmall category
27i .001i
12% rise in literacy of ̀ uptosmall’ category
78i .007?
5% rise in proportion of SC/SThouseholds
-6 i -.000i
Left share of gram panchayatrises from mean by 20%
-5 i -.002
i: denotes statistically insignificant at 20%, ? denotes statistically significant at 20% but not 10%
Fiscal Performance
Finally we consider the fiscal performance of the panchayats in some respects which had a bearing on theshare of benefits from government programs accruing to the poor. Apart from employment grants whichcomprised approximately 50---60% of the resources available to gram panchayats in any given year, anumber of other fiscal grants tied to specific projects collectively accounted for approximately 25% ofpanchayat revenues. The rest was raised by the gram panchayats from local sources, mostly in the form ofschemes involving sale of assets and collectively produced goods (e.g., fish produced in communityponds). Taxes and fees accounted for a miniscule fraction of panchayat revenues, less than 4% on average.Over three quarters of panchayat revenues were accounted by fiscal grants received from higher levelgovernments.
Table 4.7 provides estimates of the effect of variation in land distribution, literacy, caste and politicalcomposition on the volume of aggregate fiscal grants per household received by a GP. The onlystatistically significant effect arises from an increase in proportion of landless households: a 2.5% increasein this proportion was associated with over 20% decline in fiscal grants. The other effects are statisticallyinsignificant, though the effects or rising literacy or political competition are quantitatively quite large. Thedirection of change is the same as in all previous contexts studied: villages received larger grants per capitawhen they had fewer landless or low caste households, when the poor became more literate and owned alarger share of cultivable land share, and when political competition between the Left and the Congress wasmore keen.

17
TABLE 4.7 INTERVILLAGE TARGETING OF FISCAL GRANTS
Average grant received per household bygram panchayat at 1980 prices (s.d.)
579 (1780)
EFFECT OF:2.5% households shift from mediumlandowners to landless
-128
10% shift of land from medium to smallcategory
43 i
12% rise in literacy of ̀ upto small’ category 152 i
5% rise in proportion of SC/ST households -23 i
Left share of Zilla Parishad rises from meanby 10%
-157 i
i: denotes statistically insignificant at 20%
Since most of the fiscal grants (excluding those in the employment program) were associated with a largevariety of minor welfare and infrastructure programs, it is difficult to perform a detailed analysis of howwell they were targeted within the village. Instead we examine the fraction of the overall gram panchayatbudget allocated to nondevelopmental expenditures, i.e., to salaries and administrative costs. As Table 4.8indicates, on average about 36% of panchayat budgets were devoted to nondevelopmental expenditures,with a standard deviation of 19%. A rise in this proportion meant that less was available for spending onwelfare and public works programs that would benefit the poor. It is apparent that there was considerablevariation in this proportion within the sample. Our regressions (which control for the scale of the grantreceived and the village population in order to capture the fixed overhead cost nature of administrativecosts, besides other village characteristics) reveal that a significant part of this variation was associatedwith changes in the land distribution within the village. Increased landlessness and inequality of land sharesraised the proportion allocated to nondevelopmental expenses. Literacy among the poor or caste did nothave a significant effect, but were qualitatively similar to the patterns observed in other contexts.
TABLE 4.8 PROPORTION OF GRAM PANCHAYAT EXPENDITURES SPENT ON SALARIESAND ADMINISTRATIVE COSTS
Average Proportion (s.d.) .36 (.19)EFFECT OF:2.5% households shift from mediumlandowners to landless
.09
10% shift of land from big to small category -.1212% rise in literacy of ̀ upto small’ category -.02 i
5% rise in proportion of SC/ST households .01 i
i: denotes statistically insignificant at 20%

18
5. CONCLUSION
We first summarize our main findings.
First, average levels of targeting and land reform effort were quite high. Leakages of the IRDP creditprogram to ineligible households was small, only about 4%. 87% of the minikits were given to landless andsmall landowning households. The land distribution program benefited one in seven households onaverage, and one in three landless households. The land areas involved in the land reform program were nothigh (of the order of 3—8% of cultivable land), though significantly higher than reported for most otherIndian states (e.g., Appu (1996) reports that most states have distributed less than 2% of land). Thisconfirms what many others have remarked – that the West Bengal panchayats directed a significant portionof benefits of different developmental and poverty alleviation programs to the poor.
Second, this high average masks significant variability in targeting and land reform effort. Our analysisfocused on the extent to which changes in these over time were associated with changes in local landdistribution, literacy among the poor, prevalence of low caste households, and contestability of panchayatelections. We consistently found that targeting performance was poorer when the land distribution becameless equal, the poor were less literate, when there were more low caste households, and local elections wereless contested. From a normative standpoint, the opposite should have happened: poverty alleviation effortshould have increased when there was greater poverty, illiteracy or inequality. This suggests that theoutcomes reflected variations in government accountability owing to a decline in the political weight of thepoor when they became more vulnerable.
Some of the patterns could conceivably be rationalized by productivity considerations, whereinthe poor were allocated less when they would be expected to be less productive. We argued that such anexplanation did not seem satisfactory for many reasons: it does not pertain to explicitly redistributiveprograms (such as the IRDP credit program) or measures of fiscal performance (such as proportion ofpanchayat expenditures devoted to salaries and administrative costs) that affect all categories of residents ina similar fashion. Moreover, the regressions underlying our analysis controlled for differences in farmyields. Finally the sharpest results obtained with respect to increases in demographic weight of the landlessand small landowners, which are unlikely to be driven by productivity considerations. In a well functioningdemocracy these demographic changes ought to have improved targeting. The fact that the opposite wastrue thus suggests that there were significant distortions in government accountability that were accentuatedwith greater landlessness, illiteracy and prevalence of low caste households.
Third, the political biases were more significant in the allocation of resources across villages, rather thanwithin villages. The findings reported here are similar to those of Galasso and Ravallion (2000) for adecentralized education program in Bangladesh. Most of the literature stressing the pitfalls ofdecentralization in contrast have stressed the danger of poor intravillage targeting owing to capture of localgovernments by local elites. Considerably less attention has been devoted to the process by whichresources are allocated across villages by higher level governments. In Bolivia and South Africa,decentralization to local government has been accompanied by formula bound transfers across jurisdictionsand levels of government. The available evidence suggests that this was instrumental in increasinginterregional equity in those countries.16 In West Bengal with the possible exception of the employmentgenerating programs, most others were based on political discretion of higher level governments. Even inthe context of employment program grants, we found some evidence of similar patterns, though these wereconsiderably weaker. This suggests that incorporation of need-based formulae in intervillage allocationscould significantly improve pro-poor targeting.
16 See Faguet (2003) and Wittenberg (2003).

19
We now mention a number of qualifications to our analysis. Our use of the indirect survey inevitably givesrise to measurement error in the key village characteristics, a problem which can be rectified only if directhousehold surveys are carried out to estimate changes in landholding patterns, literacy or caste moreprecisely. Moreover, we analyzed targeting on the basis only of landholding status of recipients, rather thangender, caste or political affiliation. In other words, we examined the fraction of resources reaching thepoor (defined in terms of landholding status), but not the fraction reaching other minority groups. It hasbeen argued that targeting performance of the West Bengal panchayats on the other dimensions was farweaker.17 Further research is needed on both these issues.
Second, our results could be criticized for assuming that variations in land distribution, literacy, caste orpolitical concentration were exogenous with respect to targeting. Instead they could be subject to reversecausality, or the outcome of unobserved factors that simultaneously affected targeting. In the absence ofany truly exogenous source of variation in these village characteristics, such concerns are difficult toconfirm or dispel in any conclusive fashion.
Yet one can attempt to rule out a number of possible channels of reverse causality or omitted variable bias.Unobserved village characteristics fixed over time have been controlled for with village fixed effects in theunderlying regressions. The scale of most of the programs was quite small, and unlikely to have asignificant impact on the distribution of land or literacy within the village. For instance the land reformprogram involved no more than 3-4% of cultivable land area outside North Bengal, a small fraction of theoverall change in the land distribution. IRDP loans amounted to about Rs 30 per household per year, andemployment programs to about Rs 300 per household per year. Given an average daily wage of Rs 40—60for farm labour, these programs were small, amounting to no more than ten days wages. On this scale theywere unlikely to make a significant dent in the local land distribution or other assets of the poor.
Endogeneity bias could conceivably arise from migration and resulting `welfare magnet’ effects, whereinthe poor or low caste groups migrate to regions with superior targeting performance. It seems to us unlikelythat migration among the poor could have been motivated by considerations of eligibility for servicesdelivered by the government --- outsiders are hardly likely to be recipients when there are so many poorresidents of long standing in proportion to the benefits being offered. Participation within the village washighly selective: with the exception of the land distribution program the average proportion of householdsreceiving any benefits in any given program was typically less than 5%. Moreover, welfare magnet effectsshould give rise to a positive correlation between targeting and demographic weight of the poor, whereaswe observed exactly the opposite. If at all significant, the bias resulting from this effect ought to bepositive, in which case our results understate the true effects.
Another source of endogeneity bias may be the impact of poor targeting on yield of small landholdings,which discourages purchase of small plots by the landless, causing greater landlessness. We think this isunlikely for two reasons. One is that we controlled for productivity of small plots relative to others in thevillage in our regressions. Second, the results of changing demographic weights with respect to casteparalleled those with respect to landlessness. Since caste is inherited by birth and cannot be acquired, suchan explanation cannot work for explaining the patterns with respect to caste.
Political competition for panchayat seats is undoubtedly jointly determined along with antipoverty policiesof the panchayat. However our working paper documents that the electoral success of the Left Front ingram panchayat elections were driven primarily by wider shifts in voter loyalties (as gauged by vote sharesat the district level in elections to the state legislature occurring around the same time) and pro-incumbencybias among voters, rather than local patterns of land distribution, literacy or caste.
One could continue to examine whether the evidence fits any other hypothesis of endogeneity bias. Insteadwe conclude our discussion by noting that the hypothesis of lower political accountability of localgovernments to the poor when they are more vulnerable provides a parsimonious explanation of theobserved targeting patterns in a wide variety of programs.
17 See Webster (1992, p.117) for instance, who finds in case studies of two gram panchayats that benefits ofdevelopmental programs were not reaching women in general, and poor women in particular.

20
REFERENCES
Appu PS (1996), Land Reforms in India, Vikas Publishing House, New Delhi.
Banerjee A (2004), ``Who is Getting the Public Goods in India: Some Evidence and Some Speculation,” inK Basu (edited), India’s Emerging Economy: Performance and Prospects in the 1990s and Beyond, MITPress, Cambridge MA, forthcoming.
P. Bardhan (1996), "Decentralized Development", Indian Economic Review, vol.31, no.2.
------------------- (2002), ``Decentralization of Governance and Development," Journal of EconomicPerspectives, Fall 2002, 16(4), 185--206.
-------- and D.Mookherjee (2000), ``Capture and Governance at Local and National Levels,'' AmericanEconomic Review, May 2000, 135--139.
------------------------- (2002), ``Decentralizing Anti-Poverty Program Delivery in Developing Countries,''mimeo,Boston University, http://econ.bu.edu/dilipm/wkpap.htm/wkpaphmpg.html. Forthcoming, Journalof Public Economics.
------------------------ (2003a), ``Decentralization and Accountability in Infrastructure Delivery inDeveloping Countries,'' Working Paper, Institute for Economic Development, Boston University ,http://econ.bu.edu/dilipm/wkpap.htm/wkpaphmpg.html.
------------------------ (2003b), ``Political Economy of Land Reforms in West Bengal 1978—98,” mimeo,Boston University, http://econ.bu.edu/dilipm/wkpap.htm/wkpaphmpg.html .
----------------------- (2003c), ``Pro-Poor Targeting and Accountability of Local Governments in WestBengal,” mimeo,Boston University, http://econ.bu.edu/dilipm/wkpap.htm/wkpaphmpg.html.
Bird R. (1995), ``Decentralizing Infrastructure: For Good or Ill?'' in A. Estache (ed.), DecentralizingInfrastructure: Advantages and Limitations, World Bank Discussion Papers 290, Washington D.C., 1995.
Crook R. and J. Manor (1998), Democracy and Decentralisation in South Asia and West Africa,Cambridge: Cambridge University Press, 1998.
Dreze J. and A. Sen (1989), Hunger and Public Action, Oxford University Press, New Delhi.
Faguet JP (2003), `` Decentralization and Local Government in Bolivia,” paper prepared for a conferenceon The Rise of Local Governments in Developing Countries, London School of Economics, May 2003,http://sticerd.lse.ac.uk/events/decentralisation.asp.
Galasso E. and Ravallion M. (2000), ``Distributional Outcomes of a Decentralized Welfare Program,”Working Paper no. 2316, World Bank Research Department.
Kohli A. (1997), ``From Breakdown to Order: West Bengal,” in P. Chatterjee, Editor, State and Politics inIndia, Oxford India Paperbacks, Oxford University Press, New Delhi.
Lieten G K (1992), Continuity and Change in Rural West Bengal, Sage Publications, New Delhi.
-------------- (1996), ``Panchayats in Western Uttar Pradesh,'' Economic and Political Weekly, September 281996, 2700-2705.

21
Manor J. (1999), The Political Economy of Democratic Decentralization. Washington DC: The WorldBank, 1999.
Mathew G and R Nayak, ``Panchayats at Work: What It Means for the Oppressed?'' Economic andPolitical Weekly, July 6 1996, 1765-1771.
Mookherjee D. (2004), The Crisis in Government Accountability: Essays on Governance Reforms andIndia’s Economic Performance, Oxford University Press, New Delhi, forthcoming.
Prud'homme P (1995), ``The Dangers of Decentralization," World Bank Research Observer, 10, 1995, 201-20.
Ravallion M and D van de Walle (2002), ``Land Allocation in Vietnam’s Agrarian Transition,” WorkingPaper, World Bank Research Department.
Tanzi V (1996), ``Fiscal Federalism and Efficiency: A Review of Some Efficiency and MacroeconomicAspects," in M. Bruno and B. Pleskovic (Edited), Annual World Bank Conference on DevelopmentEconomics 1996. Washington DC: The World Bank.
Sengupta S. and H. Gazdar (1996), ``Agrarian Politics and Rural Development in West Bengal,’’ in DrezeJ. and A. Sen, Editors, Indian Development: Selected Regional Perspectives, Oxford India Paperbacks,Oxford University Press, New Delhi.
Swaminathan M (1990), ``Village Level Implementation of IRDP: A Comparison of West Bengal andTamilNadu,” Economic and Political Weekly, XXV, 13:A17—A27.
Webster N. (1992), Panchayati Raj and the Decentralization of Development Planning in West Bengal, KPBagchi and Co, Calcutta,
Wittenberg M (2003), ``Decentralisation in South Africa,” working paper, University of Witwatersrand,Johannesburg, presented at a conference on The Rise of Local Governments in Developing Countries,London School of Economics, May 2003, http://sticerd.lse.ac.uk/events/decentralisation.asp.
World Development Report 2004, Making Services Work for Poor People, The World Bank, WashingtonDC., Oxford University Press.