potential project evaluation and prioritization indian and howard’s creeks local watershed plan...
TRANSCRIPT

Potential Project Evaluation and Prioritization
Indian and Howard’s Creeks Local Watershed PlanApril 23, 2009

Project Evaluation and Prioritization
• Stream Assessment Methods
• Stream Assessment Results
• Wetland Assessment Methods
• Wetland Assessment Results
• BMP Site Assessments
• Prioritization Methodology
• Stakeholder Input & NECBA

Stream Assessment Methods

Stream Assessment Methods
Phased approach – EEP provided sites to assess from Phase 1– ENTRIX performed aerial photo and GIS
evaluations to prioritize sites for field work– ENTRIX performed field assessments on
40 potential stream restoration sites and 10 potential preservation reaches
– Preliminary prioritization based on field data
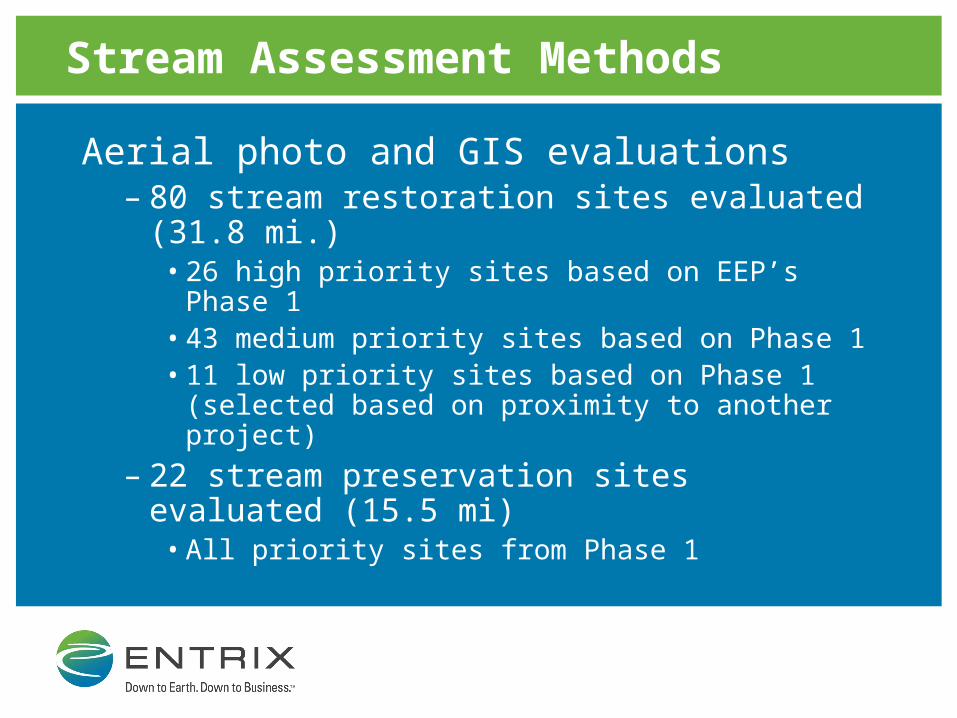
Stream Assessment Methods
Aerial photo and GIS evaluations– 80 stream restoration sites evaluated (31.8
mi.)• 26 high priority sites based on EEP’s Phase 1• 43 medium priority sites based on Phase 1• 11 low priority sites based on Phase 1
(selected based on proximity to another project)
– 22 stream preservation sites evaluated (15.5 mi)
• All priority sites from Phase 1

Stream Assessment Methods
Stream GIS and aerial photo evaluations included:
• Buffer vegetation condition
• Historic channelization
• Presence of bank erosion or sediment
deposition

Stream Assessment Methods
Aerial photo buffer vegetation assessment
• Percentage of 50 foot buffer zone forested based on 2005 aerial photo– 0% to 25% forested cover– 26% to 50% forested cover– 51% to 75% forested cover– 76% to 100% forested cover

Stream Assessment Methods
GIS-based assessment of channelization
• Based on comparison of historic aerials (1938, 1951, and/or 1968) with 2005 aerials
• Included consideration of topography
• Resulted in “channelized” or “not channelized”


Stream Assessment Methods
Aerial photo assessment of erosion and sedimentation
• Reviewed aerial photos to identify areas where erosion or deposition were present
• Resulted in “erosion/sedimentation present” or erosion/sedimentation not present”

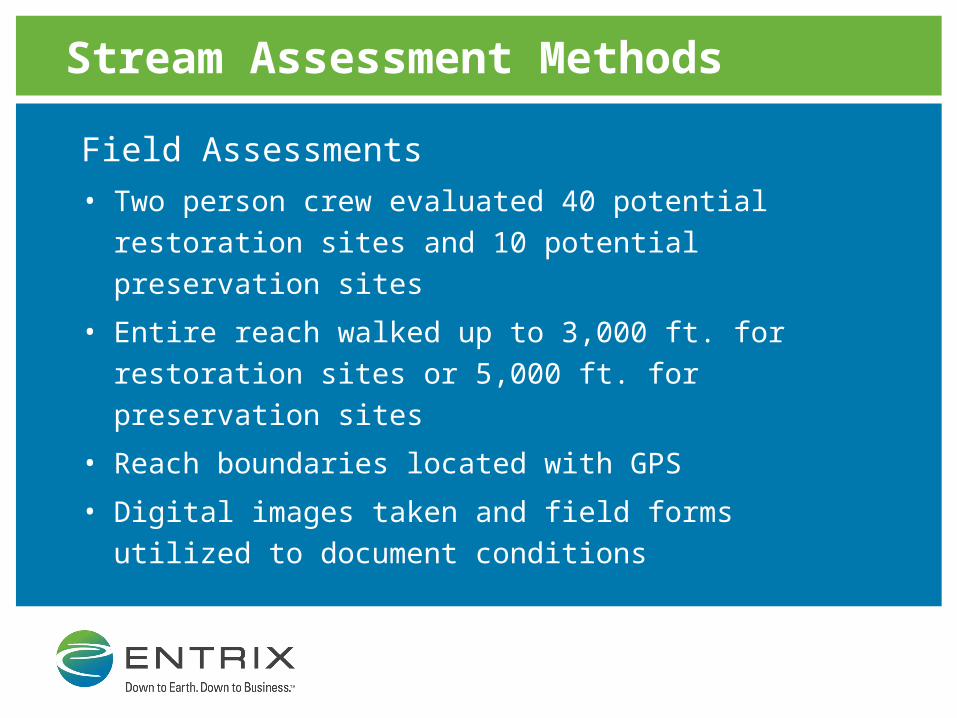
Stream Assessment Methods
Field Assessments
• Two person crew evaluated 40 potential restoration
sites and 10 potential preservation sites
• Entire reach walked up to 3,000 ft. for restoration
sites or 5,000 ft. for preservation sites
• Reach boundaries located with GPS
• Digital images taken and field forms utilized to
document conditions

Stream Assessment Methods
Field Assessments
• DWQ habitat assessment for piedmont and
mountain streams
• Stream bank stability assessment – modified
HEC-20 assessment
• Evaluation of channel hydraulic capacity
• Evaluation of Mitigation Project Potential

Stream Assessment Methods
DWQ habitat evaluation• 8 riparian and in-stream habitat metrics:
– Evidence of channel modification– In-stream epifaunal habitat– Bottom substrates– Pool variety– Riffle habitats– Bank stability and vegetation– Canopy coverage– Riparian zone width

Stream Assessment Methods
Channel stability assessment
• Watershed land use• Flow status• Channel pattern• Entrenchment/confinement• Bed material• Bar development
• Presence of obstructions
• Bank soil texture/coherence
• Bank angle• Bank vegetation• Bank cutting• Mass waisting/failure

Stream Assessment Methods
Channel hydraulic capacity assessment• Cross-sectional area measured
– To top of bank– At representative riffle
• Flows computed with USGS regional regression equations for Q2 and Q10
• Channel gradient, roughness, and Q used to calculate flow area
• Ratio of calculated to measured flow area developed to identify channel enlargement

Stream Assessment Results

Stream Assessment Results
GIS-based prioritization for field assessment
• Reviewed and amended by EEP
• Forty stream restoration sites prioritized for
field assessment (+ alternates)
• Ten stream preservation sites prioritized for
field assessment

Stream Restoration Parameters
Buffer Percent Forested Channelized EEP Ranking Erosion
Value 0-25 25-50 50-75 75-100 Yes No High Med Low Yes No
Score 3 2 1 0 3 0 3 2 0 1 0
Stream Preservation Parameters
Buffer Percent Forested Channelized EEP Ranking
Value 0-25 25-50 50-75 75-100 Yes No High Med Low
Score 0 1 2 3 0 3 3 2 0
Stream Assessment Results
GIS assessment results


Stream Restoration Site Examples

R-90 Howard’s Creek Middle

R-61 Howard’s Creek Middle

R-77 Howard’s Creek

R-31 Mill Creek

R-51 UT to Howard’s Creek Upper

Stream Preservation Site Examples

P-10 Howard’s Creek

P-6 Indian Creek Upper

P-31 Indian Creek Upper

Wetland Assessment Methods

Wetland Assessment Methods
Phased approach – EEP provided 59 sites to assess from
Phase 1– ENTRIX performed aerial photo and GIS
evaluations to prioritize sites for field work– ENTRIX performed field assessments on
30 potential wetland restoration sites– Preliminary prioritization based on field
data

Wetland Assessment Methods
Aerial photo and GIS evaluations
• 57 wetland restoration sites evaluated
• All priority sites from Phase 1 – 2005 aerial photographs,
– Soils GIS data (NRCS, 2007),
– Topography data (EEP, 2008
– NWI data (USFWS, 1999).

Wetland Assessment Methods
GIS-based wetlands assessments• Determination of mapped hydric soils• Extent of wetland vegetation
– no vegetation– partially-vegetated– fully-vegetated
• Proximity to NWI wetland• Proximity to potential stream project
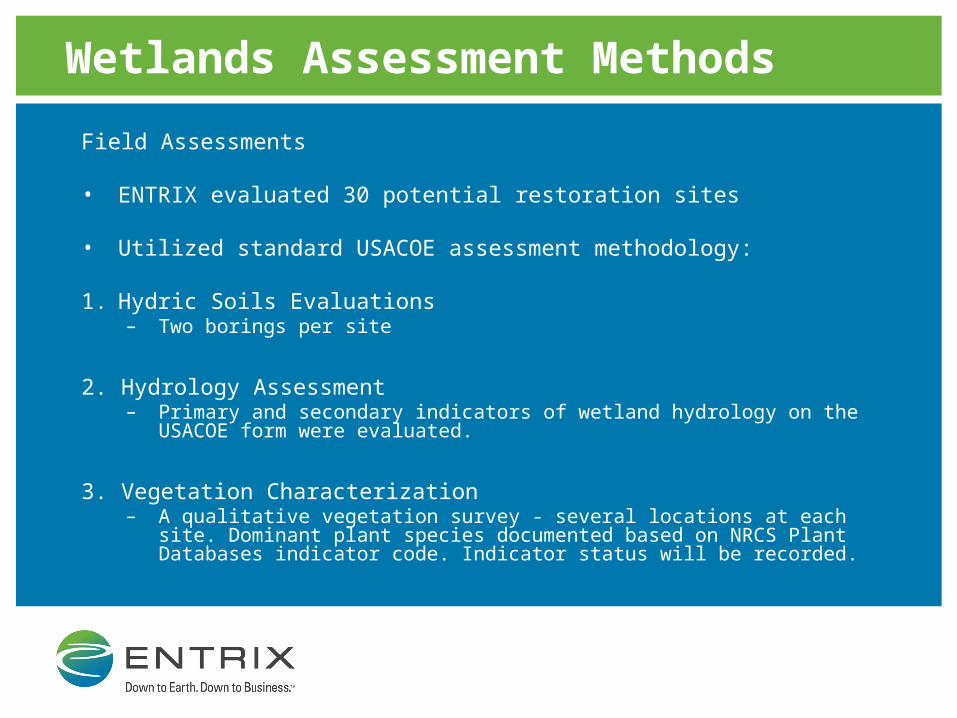
Wetlands Assessment Methods
Field Assessments
• ENTRIX evaluated 30 potential restoration sites
• Utilized standard USACOE assessment methodology:
1. Hydric Soils Evaluations– Two borings per site
2. Hydrology Assessment– Primary and secondary indicators of wetland hydrology on the USACOE form
were evaluated.
3. Vegetation Characterization– A qualitative vegetation survey - several locations at each site. Dominant
plant species documented based on NRCS Plant Databases indicator code. Indicator status will be recorded.

Wetland Assessment Methods
DWQ staff evaluated 67 potential preservation sites (DWQ, October, 2008)
– To identify and assess a random sample of jurisdictional wetlands within the Indian/Howard’s Cr. LWP area;
– To calculate restoration equivalents based on potential for enhancement at each of the assessed jurisdictional wetlands, where appropriate;
– To characterize the level of functioning of wetlands as a whole throughout the LWP area by using a stratified random sampling design.

Wetland Assessment Results

Wetland Assessment Results
• GIS-based prioritization for field assessment
• Reviewed and amended by EEP
• Thirty wetland restoration sites prioritized for field assessment (+ alternates)

Wetland Assessment Results
Wetland Restoration Parameters
Vegetation NWI EEP Ranking
Adjacent to Stream
Restoration Opportunity
Value Fully Partially No Yes Nearby No High Med Low Yes No
Score 0 1.5 3 3 2 1 3 2 0 3 0
GIS assessment results

Wetland Assessment Results
• Add in maps, tables, and pictures

Wetland Restoration Site Examples

W-30 Howard’s Creek

W-39 Middle South Fork Upper

W-44 Middle South Fork Upper
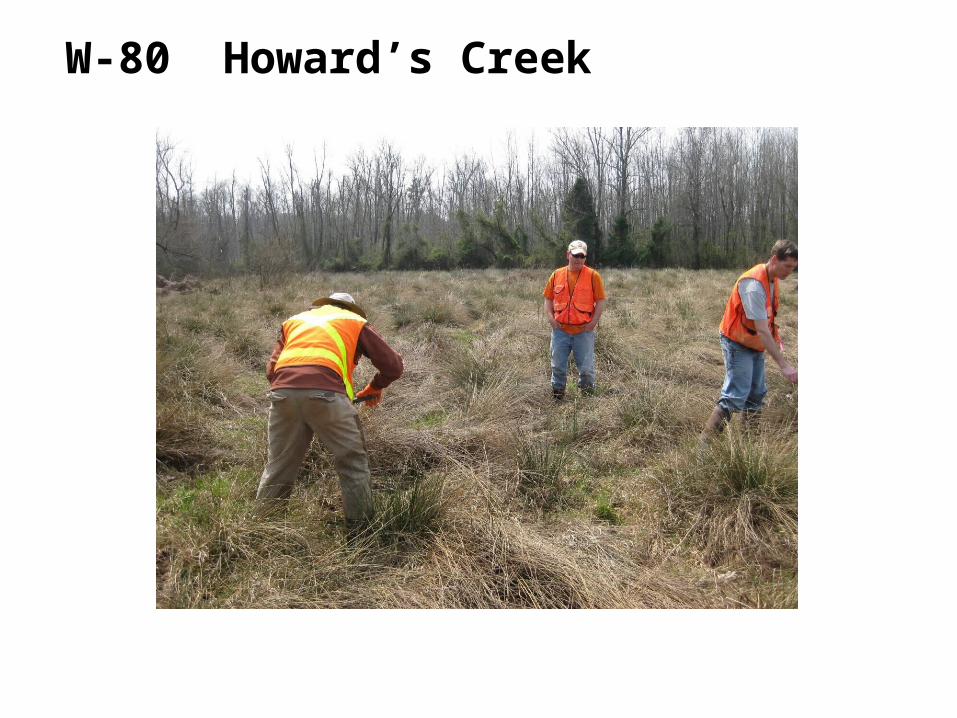
W-80 Howard’s Creek
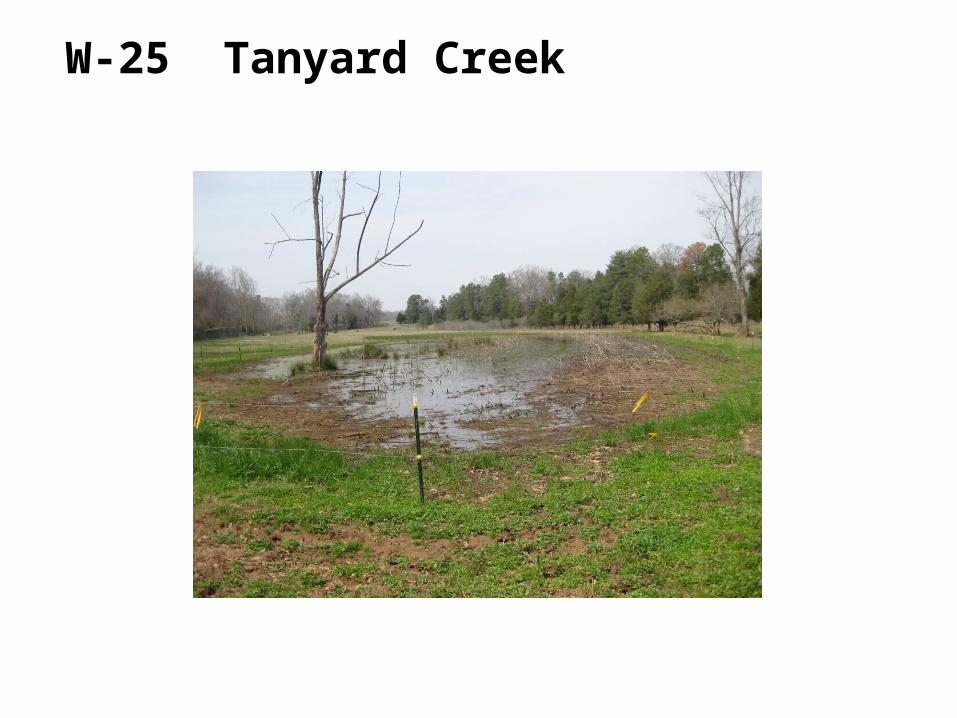
W-25 Tanyard Creek

Potential BMP Site Assessments

Potential BMP Site Assessments
• Potential locations for BMPs identified through GIS analysis– Available space– Urban watershed– Topography/drainage
• Preliminary field site review of each potential facility
• Site reviews performed for 10 sites

Site quality – Medium
Potential BMP type – Bioretention, swale
Construction access – Excellent
Treatment area – Bus and car parking lot (approx. 0.7 acres)
BMP-2 Cherryville HS

Site quality – High
Potential BMP type – Bioretention, swale, and/or wetland
Construction access – Excellent
Treatment area – Parking lot (up to approx. 2.3 acres)
BMP-8 West Lincoln HS
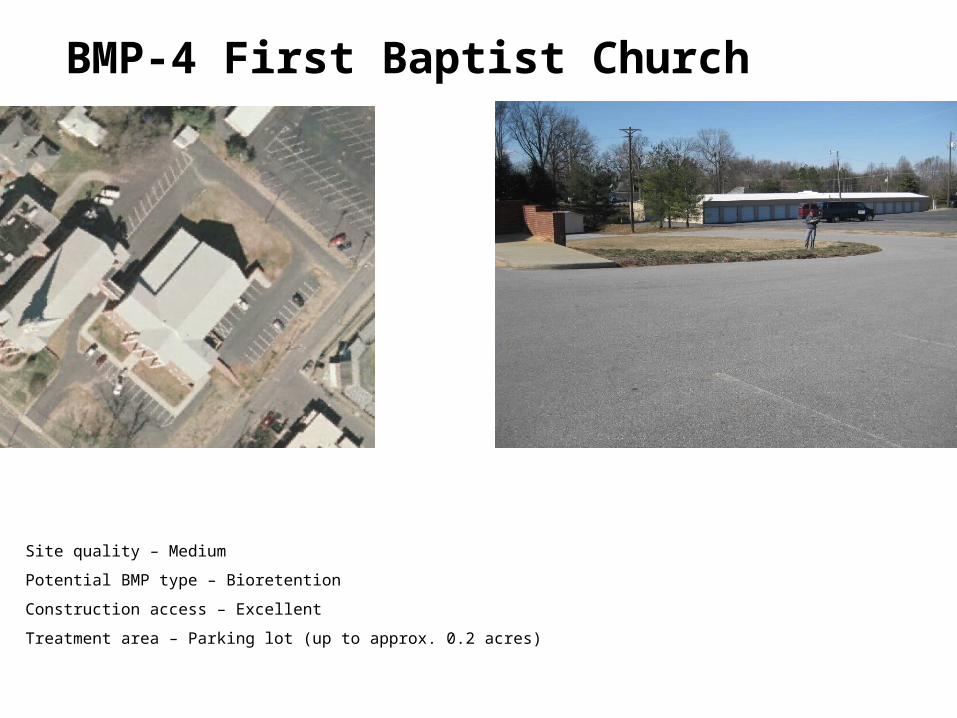
Site quality – Medium
Potential BMP type – Bioretention
Construction access – Excellent
Treatment area – Parking lot (up to approx. 0.2 acres)
BMP-4 First Baptist Church

Prioritization Methodology

Prioritization Methodology
• Step 1: GIS analysis• Step 2: Field Assessment• Step 3: Develop project database
– 25 stream restoration projects– 10 stream preservation projects– 20 wetland restoration projects– 3 BMP projects
• Step 4: Pollutant removal analysis• Step 5: Stakeholder input – Net Environmental and
Community Benefits Analysis (NECBA)• Step 6: Develop final ranking, Project
Implementation Report, & Project Atlas

Overview of Net Environmental and Community Benefit Analysis

Situations Where MCDA Provides Value
• Complex projects with significant uncertainties
• Numerous potential strategies with multiple decisions
• Multiple stakeholders with competing objectives and different definitions of success
• Potential risks to human health and safety, environment, and reputation
• Significant project costs
• Organizes client intuition
• Reveals insights about trade-offs and cost drivers
• Provides a systematic, transparent, decision-making process
• Helps identify the strategy that best meets client’s goals
• Provides bottom-line cost savings
Benefits of MCDA
Multi-Criteria Decision Analysis

• Capital Budget Priorities for a Port Authority
• Remedial Priorities for Portfolio of 500 Sites for an Oil & Gas Company
• Recreation Priorities for Restoration Projects for State Agencies
• Private Land Use Planning
Examples of Applications

Decision Analysis – Framework
On-Line Survey
On-Line Survey
Framing
Session
Framing
Session
Develop M
odel
Develop M
odel
Prioritize
Projects
Prioritize
Projects

Example Trade-Off Question for On-line Survey
Which alternative is better ?Which alternative is better ?
Alternative A Alternative BImplementation Cost $500,000 $1,000,000
Number of Credits 400 600
Habitat Score 80 60
Probability of Success,Technical Feasibility
75% 50%
A is much better than B
A is better than B
A and B are about the same
B is better than A
B is much better than A

Weights from Trade-Off Questions
0.09
0.16
0.31
0.44
0 0.1 0.2 0.3 0.4 0.5
Credits
Habitat Score
Probability ofSuccess
Cost
Cri
teri
a
Weight

Example of Scoring Calculations
Cost Success Habitat Credits
(0.41 x 25) + (0.29 x 40) + (0.15 x 2)+ (0.08 x 50) = 26.2
Green = Weight
Yellow = Amount of criteria output for an alternative

Comparison of Scores
Project A
Project B
Project C
0 10 20 30 40 50 60

Sensitivity Analysis
Success
Credits
Habitat
Cost
Weight