potential output and the recent productivity decline - research
TRANSCRIPT

JOHN A. TATOM
OTENTIAL output refers to the real grossnational product (GNP) that is produced if theeconomy operates under high-employment condi-tions. Measures of potential output depend onmeasures of available resources, such as capital andlabor, and re] iahle estimates of the relationshipbetween national output and the employment ofresources.
Since 1973, the growth of productivity (measuredas output per unit of labor) has slowed substantially(see chart 1), raising doubt about the relationship ofinput to output and, therefore, the measurement ofthe nation’s potential GNP. This issue is of consider-able importance as it bears on the traditional concernover the degree of resource underutilization and theassociated output losses in the economy. An accurateassessment of potential ontput is essential to deter-mine the expected gain in output from a policy in—tended to achieve full employment. The relationshipbetween resource supplies and ~5otential output alsois important in analyzing the output gain fi’oni sup-
ply—side policies to increase the supply of resources
through increased work, saving and investment.
This Bank’s measure of potential output differsfrom others in that it provides direct estimates of theeffects of labor force growth, capital accumulationand changes in the relative cost of energy resourceson productivity and economic capacity.’ The stabil-ity of the input-output relationship on which thismeasure is based, and its ability to fully accotmt forthe unusual productivity developments during thelast decade, provided support for the credibilityof past estimates. Since energy costs have increased
‘The original measures used by this Bank and the methods of theirconstruction are explained in Robert H, Rasche and John A.Tatom. ‘‘Energy Resources and Potential CNP,” this Re clew(June 1977), pp. 10-24. The theoretical basis for the energy priceeffect is developed in Robert H. Rasche and John A. Tatom, ‘‘TheEflècts of the New Energy Regime on Economic Capacity Pm-ductson and Prices,’’ this Rccie,c (May 1977), pp. 2-12. These
dramatically since 1978, it is important to verify thatthe earlier empirical results are consistent withrecent productivity experience, as well as to assessthe impact of this shock on potential GNP. Also,recent revisions of the GNP accounts incorporatenew information on output and involve some con-ceptual changes that require revisions in potentialGNP measures. In addition, since 1977 some modi-fications have occurred in the methods used by thisBank to measure potential output. The revisions andmodifications are described below,
ENERGY PRICE S ROCKS ANDP.ROi) UCTIVITY
A sharp increase in the relative price of energycauses a reduction iii the output (productivity) ofexisting labor and capital resources, or economiccapacity. The particular channels through which thischange occurs vary from firm to firm, but includechanging production methods to reduce the use ofhigher-cost energy, the closing of plants renderedunprofitable, reduced optimal and actual use ofexisting facilities, and the diversion of labor andcapital resources to uses that economize on higher-cost energy. These changes result in less outputbeing produced despite an initially unchangedavail-ability of domestic capital and labor resources. As aresult, measures of productivity such as output perworker, per hour, or per unit of capital, decline, Therise in energy prices also induces a percentage in-crease in the nominal prices of output equal to thepercentage decline in productivity or potential out-
hypotheses are further elaborated, and international evidencesupporting them are presented in Rasche and Tatom, ‘‘EnergyPrice Shocks, Aggregate Supply and Monetary Pol icy-: TheTheory- and International Evidence,’’ in Karl Brunner and Allanli. Meltzer, eds., Sopp/q Shock-s iuc-eutires 0,1(1 .‘s’otio,,alSI/ca It ii. Carnegie—Rochester Conference Series on Psihl IcPolicy, Vol. 11 (1981 I, pp. 9-93.
Potential Output and the RecentProductivity Decline
3

FEDERAL RESERVE BANK OF ST. LOUIS JANUARY 1982
Chart 1Output per Hour (Private Business Sector)
put, since less output is proditicib Ic for a givensupply of money.
In addition, the decline in productivity shifts thedemand for labor and capital resources down. In theshort run, these shifts are reflected in a fall in the realwages of workers and a decline in the value of exist-ing plant and equipment relative to its replacementcost. Over a longer period, the capital stock availableper worker will decline from the level that wouldotherwise have occurred, so that the long-run de-cline in potential output, labor productivity and realwages is larger than the initial decline.
The effect of a rise in the relative price of energyon production is manifested in a production functionapproach through reductions in inputs (especially
reduced energy usage), or through changes inproductive efficiency or capacity that are “disem-bodied,” that is, not associated with changes inthe use of physical inputs such as labor, capital orenergy. Earlier studies have provided an unbiasedestimate of the effect of a rise in the relative price ofenergy on output that supports the energy price!econoiniccapacity hypothesis.2 Before re—examining
2An elaborate review of other analyses of energy price eIT~.ctsonthe economy is presented in Rasche and Tatoni, ‘‘Energy PriceShocks, Aggregate Supply, pp. 16-33.4 more recent critiqueof the analysis here is Ernst R. Berndt, “Energy Price Increasesand the Productivity Slowdown in (/nited States ~danufaetur—ing,” Federal Reserve Bank of Boston, The Decline in Pt-odor—hefty Growth, Conference Series No. 22 (June 1980), pp. 60-89.
Berndt finds no effect of higher energy prices on manuflictur—ing productivity, in conhast to the evidence in John A. Tatom,
194849 50 51 52 53 54 55 56 51 58 59 60 41 62 63 64 45 64 67 68 69 10 11 72 13 14 75 16 11 78 19 801981tatest data plotted, 3rd quarter Source, U.S. Department of Labor
4

FEDERAL RESERVE BANK OF ST. LOUIS JANUARY 1052
the plodluction function estimates. however, it isuseful to review recent revisions in the data series
used to est iiate potential GNP.
~‘r.:f~ Ri:-~:.(/ ii. ~ ~ ~ ;.::%~ ( i~.ai ‘..4 I
STOCK j.4f7\:5cJfl~T
From time td) ti lie, the U .S. Department of Com-merce announces major revisions in the CX Paccounts based ou new source data, new estimating
procedures arid definitional or conceptual changes.The latest revision was published iii December1980 a
The has is of the recent revision was new inibrina-tion from the 1972 i uput—output tables, the 1977economic censuses of various industries. and infer—mation from the 1973 and 1976 faxpay-er Compli—ance Measurement Program. In adtlitioii, GNP wasredefined to include the reinvested earnings of
incorporated foreign affiliates of U.S. direct inves-tors ~mdl to exclude those of incorporated U.S. affil-iates of foreign direct investors. The redefinitionof CNP primarily affects the measure of incomeoriginating in the rest of the world, with little effectof the measurement of output fism the nation’s
private sector.
Another important part of the revision was in gross
private domestic investment. The revision of thismeasure was largely due td) revised estimates of
producer durable equipment investment. At the.same time, a conceptual change occurred, shiftingthe output and investment in hotels and motels from
the residential to the nonresidential sector. Exceptfir the treatment of reinvested earnings abroad,however, the revisions of GNP primarily affect data
beginning in 1968.
Table 1Revisions in Rea Net Capital Stock andPrivate Bu&ness Sector Output(selected years)
Upw dl vsion U wa vts, riof api istok I opiate
Year begi fling o ye be ness sac or ou p
1950 21S 03°955 20 06
1960 1.6 051965 9 021979 29 021975 49 8
Figures lImper entage n re e f 1980 evtseddata vet-data av dable in 1977
The new source information affected measures ofthe nations capital stock as well, especially after1967. The reclassification of hotel and motel capitalstocks is the primary source of changes in the mea-sures prior to 1967. \Vhile the level of the nation’s
net nonresidential private capital stock (constant
prices) was raised because of these changes, thegrowth rate was changed very little prior to 1973. Forexample, the revised data show a 4.2 percent annualrate of growth from 1948 to 1968, the same as earlierdata. F’rom 196$ to 1973, the revised data indicategrowth of the net capital stock at a 4.4 percent rate,up from 4.0 percent in the earlier data. From 1973 to197$, the revised capital stock shows that capitalfonnation slowedl to a 3.1 percent rate. Earlier datashow the same extent of slowing in capital formation
to a 2.7 percent rate from 1973 to 1978. As a result,the conclusion of earlier research that capital foniia—tiori sloweol subsequent to 1973. especially when
measured relative to labor force growth, has beenuuaffbcted liv the revisions. The rate of growth of thecapital stock, however, has been somewhat flustersiuce 1968 than earlier estimates showed; this eottld
affect earlier estimates of input—output relationsh i ps
Table 1 shows the extent of both the upward revi-
sion of the coustaut—dol lar net stock of fixed noures i—deutial private capital at the begi nuiug of the yearaudi the prix-ate business sector output for data usedin 1977 as compared with the recent revi s ions. Ibecapital stock has been revised upxvardl relativelymore than output.
5
“The Productivity Problem,’’ this Rceicie (September 1979). pp.1:3— 1-I - ufoitsni,stc lv as BIn sclt notes, a major sli are of en ergvresources is c-lassificd as raw materials in Ins data set, and Insanalysis can lie easily extended is show that most of theproductivity decline lid’ analyzes is (Isle to an increase in the‘el atiye i ~nics of tls e se ‘raw n mate rio1s - ‘‘ Be r, icit also ela mis toslsow that all observed sleeline in the value of claims on existingph y s ical cap i t:sl i-c lsst i ye to t lie i-cplacement cost- as hsy pot Ii s’sizedabove, is also not explained by- energy jined’ increases- histheoretical analysis is flaw,_’cl liv the oniissiou of:, significantoutput t’flect that substsuitialhv raisd’s the magnitude of Ins esti—ns:ite of the cued of limber energy prices oil the value ofexistiugcapital -
:1 (liseussion s,f these revisions, see Keith Ni, Carlson, ‘‘lie-
cent Revisions of CNP.” tins Recieir: (Mardi 1981), pp. 27-32: andVhsc’ Nat ional Inca me ass cI l’i-ci sI,, e t _keeo,ints iii t lie Lii ted I
State : ,-\ n hi ti-s scm I’ t ion to the Res i secl Es ti niate s I tsr 1 929—80.’’‘usisimj oJ( ,sssust Bmssi,e ss 1)dsduih,i , 1950i pp 126
A

FEDERAL RESERVE BANK OF ST. LOUIS JANUARY 1982
Its 1:::: pi.:b~).-: 5rd-.5~ FThe basis oftliis Bank’s potential output estimates
is a produd’tion function for private business sector(PBS) otstput that relates output to) hours of employ—men t, the utilization of capital, and energy Avail-able nieastsres of energy tend ts) be broken down bytypes of users, such as residential, commercial andiudlustrial. No euergv measures exist that are tie—tailed by production vs. consumption use by house-holds, or by prodlucing sectors I ikd the manuihe—turing and private business sector. Since energyiueasnres compatible with existing data on seetoralOtit~ititaudI eniplovment of labor andl capital do notexist, a “first—order conchtiou for o-suergv employ—
nsc’nt is used to elini mate the quantity of energy fromthe prodlnd’tiosi fund’tion, replacing it with therelative pride of energy. Formally, the estimatedl
equation is of the form,
tI) Its Xs =: /3o -* /3,ln Ii, —s— /3aImi k~-i— /3-sIn (Pd’/P)s ±/lsIn t,
where Xs is PBS output in periodl t, hi~is hsossrs of all
persons. k5 is the o tihizecl net uonres idlential capitalstock (constaut prices), the prodluet of the FedleralReserve Boardl masiuflucturirig capacity utilizationrate and the capital stock in place at the end! of period
t— 1, and hIP is the relativ-e price ofenergy, found bydleflatiug the producer price index for ftiel, power andrelated products by the implicit price dleflator for
private business sector output. The t term is a timetrend intended to) capture the rate of technologyelsange . Wlie n equation 1 is den vedi Irons a Cobb—Dossglas production function, the /3s in equation 1are related to the output elasticities of the inputs, asshown in table 2.
F stiinates oftlie annual production function usingthe revised data for the periods 1949—73, 1949-75 asid1949—80 are shown its table 3~4There are three note—
worthy rexisions in the estimates. First, the coeffi—cit’nt on thse relatixe price of energy and estimateof the oistpttt elasticity of energy are smaller inabsoh site val sic’, though not iii a statistically signifi-cant sc-risc, xvi Ui the new nieas tires of output andl
ilss ss,shs,s in ci t sip, so 01555 tsisi uc sisl tlsc cssclhc id,stsnstahslc 3 are virtually ide,itis-isl bsst tlsc Ds,,-hsi,s—W atsois sh~stistid-s,irs’ 1,28. 1.3-5. isud L37 dr thsc 19-19—73. 1949—75, assch 19—19—-SOpc,-iods. rcshsectivel\-. 3/s c-Inc-hi syhseilis’n thsiscssstsicssnrs~hatechcnsssr
1s:stts’nis i-cssihts f,ssns tlis’ ssississiu,i isI sig,sifis-a,st hisugd’d isspsst
cffdc.~tss:s,s sss.stpuit, Osic :srsd twss his:.-nisss:h lags cs,s tsc iusj.ssit s:sniihsld.~sarc cichcleci ts) thsc eqss:sticsns ius t:sbhs:s 3 avis:
1tbss:sir OLS c.-oiinst:strpz•srts.
\k’hscss tts s is dhss,se. the c..csc.~fficis..:..rsi:s and’ mast siitssilicas,t, dieDsirhsiss—Wsitscsnstististic chsss:ss ,sot c:fsansssc issscl the csti,nnstc csf pstssssy,-i in table 3 is ,sot ncch,sc-cd.
Table 2Indirect Least Squares Estimation of aCobb Douglas Production FunctionProduction Function Xi — A h k E e
where X — outputh hours of all personsk — utilized capital stockE energy inputA — scale factor
/3 y — output elas city of hourscapital, and energy respectivelytrend growth rate per year orper quar ertime per od
First 0 de Condition for Energy Fe/P — X/E
where Fe/P the priceof energy relatve to theprice of output
Linear mode ~- n k rt
capital. In the earlier estimation for 1949—73 and1949-75, 5’ is 11.7 percent (t = 1.92) and 12.0 percent
(t -= 5.66), respectively. Second, the antocorrelationad! justnsent. jS, is suial her than before (0.63 for the
19-19—75 perissd). Finally, the estimates for the period19-19—7:3 arc even closer to those for the longersample periods than tbc’v are with the earlier esti-
mates. In the earlier est iiations, there are iso
significant differencs’s in the coefficient estiniates
acrssss periods, hut i~is 1.2 percent per year and /3 is58.9 percent in the 1949-73 sample period; these are1.6 percent and 64.9 percent, respectively, iii thai’
earlier estiniation for till’ 1949—7.5 sample period.An important hivpothes is that was supportedi in
earlier work is rejec’tesl using the rd’yisc’d data. AsI owisig in the tinie trend for techutslogicai chasigehegisiuing hi 1967 could! not he rejected earlier. Forall three s;miple periods in table 3, tIns Is vpoths csisis rejected. A time-trend variable with a value of-zerotos 1966, then increased by one cads yeas fi~otii1966
oss, was added to each equation estimated in table 3.The t-statistics Ion the sloxyer trend! variable are
6

FEDERAL RESERVE BANK OF ST. LOUIS JANUARY 1982
Table 3Production Functton Estimate for the0$ Private Business Sector
1949 73 949-75 19 9-80
0 3440 1 4663 1 4971(3 8) (1070) (1 25)
/3 0688 07 0 0 20(1253) 1 25) 07
03115 0269 0279(567) 90 08)00704 0087 0095
100) 396 ( 22)01 00 7
(84) (68) (48)64 06 574
95 I 0 1458)o 0 n 1 55(5 (6 1)00668 0080 00870(07) 9 6.8)
0157 0067 0016(61 ) 10°4 6)
P 08 097 07
SE 00091 00099 010
OW 03 193 19
04 039 039
The output elasticity of hours cluriisg the tbsree
periodls is ssot siguificasstly dhffereut from the shareof labor iss total cssts during each of the threeperiods. rhsis is extreissely- ssportant as the Cobb—Douglas prodsictitsis fussction implies ~t price elastic-ity for energy deusassdl that issay’ be biased upward.While this would riot yield! a bias in the estimatedeffhct of energy prices on output, it would! yield! anupward—biased! estisssate of Va rida downxvard!—biasedestinsate of a. There is no evidence of such a bias.The t—statistics for the equality of the a estimate andtlse actual share of labor iii each period are —0.22,0.27, and —0.08, respectively, so thsat the hypothesisthat a is eqnah td) the actual shsare of labor causiothe rejected.
Other fhctors that failed to add significantly tothe productix-ity relationships estisssated earliercontinue to be insignificasst. These issc’hssde
adljscsttssessts for pollutioss abateuseist capital andl thechassging proportions of vouisg people (age 16—19) orwouseu its the labor force,
Finally, it rensaius the ease that pre—1974produc-
tion fnssctioss est siates that onsit essergs/ develop—ussessts break olowss after 1973. Whets thse 1949—73
model is estimated withsosut the relative price ofenerg~-,the stassdard! error ofthse equatioss is io!euticalto that shown in table :3, When the saissple period! isextessd!ed to 1975 and 1980, the staudard error of tlseequatioss xvithout energy rises to 1.24 percent and1.37 percent, respectively. Thse Clsow test issdic’atesthsat a sigssificasst change iu tlse striscture of thsd- pro-duction fnnctioss occurs in each case xvhsen euergy isoussitted! asic! the sansple period! is lengthened. As thsestability of tise standlard! errors its table 3 indid,ates,such structui-al clsassges can he rejected! lisissg thseChow test wlseu energy prices are included.
—1.67, —1.50, and —1.41. for tlse 1949-73, 1949-75.and 1949—80 period!s, respectix’ely. Tise showissg is
ssot statistically significant at aS percesst hex-el iss anyof thsese periodls.5 In adidition .a test for ais optinsah
point for a trend! break usissg a nsiuimnus staisdarc! Au estisnate of the productiou functiou usingerror criterion fitihs to reveal a point superior to 1967. quarterly data Irons 11/1948 td) 111/1981 is:There is no evidence tlseus for a slowd!owss in produc—ts~itx gi ds\~th o!sse to d!sSdusbodic c! I ictos 5 sn flust uctug t
2 !,~~s 1 1688 ± 0 7351 lus h, m 0 2619 In k,
the treisd!. (21.03) (23.8h~ (8.585
The nexv estimates do not alter any of tlse otlser-— 0.089:3 list h-/hTh ± 0.0045
earlier cosschssssons. Its psu’tsc’ular, tlse status of a nuns— 8 Sis - -Jf d I
her ofhypotheses tested earlier Isas been usschauged! . .-
because of tlse chsauges its the private busissess sector —
R’—OYY 81 =00074 D\\ —196 p—076concepts ass~ithe new ssseasures. F or exanspie, tests -
of the Co!sb-Dossghas restrictiois yiehdl thse rejectiois ci =0.6718 /3 = 0.21:32 c = 0.0820 i’ 0.0041of a traushog specificatiou oldie prodnctiois function. (26.09) (10.22) (9.05) (18.11)
5Tbisn-scilt lids
1lselcsme the ncceist ncvisiinss as well, See’ Raschse The estinsatedi coefficients are essentially die sause
andl Tatssus. “Emss-’ngy Pnicc Shusscks . Ag’pregatc ~ ~, 25. as those in table 3.1’ Isis quarterly prodnctioss ftsnc-
7

FEDERAL RESERVE BANK OF St LOUIS JANUARY 1882
tion is used below to derive the revised potentialoutput series. The stability and all other propertiesdiscussed above for the annual equations in table 3apply to the quarterly estimates as well,
The impact of a change in the relative price ofenergy on output, productivity, real wages, and thecapital stock can be assessed using the productionfunction estimate in equation 2. For a given employ-ment of labor hours and capital services (the short-run effect), a 10 percent rise in the relative price ofenergy reduces PBS output (Xe) and productivity by0.89 percent. The long-run elasticity of output,labor productivity, real wages, and the capital stockis (—Y/a~,or 0.122 in this case.6 Thus, a 10 percentrise in the relative price ofenergy leadsto a long-rundecline in output thatis 36 percent larger than in theshort run. In particular, a 10 percent increasereduces output, productivity and the capital-laborratio by 1,22 percent. From the thirdquarter of 1973to the third quarter of 1974, and, again from thefirst quarter of 1979 to the second quarter of 1980,the relative price of energy rose 40 percent.7 Giventhe estimates above, each shock reduced produc-ticity and potential output by3.6percent in the shortrun and 4.9 percent after adjustment of the marketfor capital goods.
REVISED MEASURES OF POTENTIALOUTPUT
To determine potential real GNP, measures ofpotential employment of labor and capital are usedto construct potential private business sector output.Other components of real GNP thatare not sensitiveto cyclical movements in output and are inde-pendentofthe employment of labor are then addedto obtain potential GNP. The latter components arethe output originating in the rest of the world.general government, households and non-profitinstitutions,
The deviation of actual from potential employ-ment of the nation’s capital stock is based onan observation that at peak periods in the past,the Federal Beserve Board capacity utilization ratemeasure has been about 87.5 percent. This bench-mark is used in the private business sector produc-tion function for full employment.8
The potential input of hours of.all persons em-ployed in the private business sector is found bydetermining potential hours per worker and poten-tial employment. In each case, actual measures arerelated to a measure ofslack in the labor market Thisslackmeasure (UN) is the unemployment rate of thecivilian labor force (U), minus the full-employmentunemployment rate of the civilian labor force (UF),which was prepared in 1977 for the Council of Eco-nonlic Advisers (UN = U — UF).~Hours perworkerin the private business sector are found from theregression ofhours per worker on excess unemploy-ment in the current and past quarter, a shift variable(I)) to account for the unusually high levels ofhoursper worker from 11111961 to 11/1967, and a timetrend (t) to account for a secular decline in hours perworker. For the period 11/1948 to 111/1981, thisequation is:
(3) In HPW = 0.797 — 0.496 (JN~+ 0.177 UN~.1(546.1) (—6.06) (2.16)
— 0.001 t + 0.014 1)(—57.06) (7.29)
B~‘~0.99 SE = 0.0032 DW= 1.89 ~ = 0.62
This equation has not been changed since 1977,except for the addition ofthe significant lagged slack
‘SeeJohn A. Tatom, “Energy Prices andCapital FormatIon; 1972-77,” this Renew (May 1979), PP. 2-11, for an explanation andderivation of this result.
‘Note that percentage changes are measured by the change in thelogarithm ofthe relative price ofenergy. The exact magnitudesover the two periods are 40.7 percent and 40.3 percent, whichmeasured as actual percentage increases are 50.2 and 49.6 per-cent, respectively. The relative price of energy rose another12 percent in the first halfof 1981 due to the immediate eflèctsof domestic crude oil decontrol, but subsequent a~ustmentsin the world market due to decontrol took 2.8 percentage pointsoffthis in the third quarter of 1981 alone.
8
lit can be argued that, at these peaks, “nonnal” operating con-ditions forthe nation’s plant andequipment are not observed andthat, ifdemandwere sustained, finns would increase investmentto Ioweropemtlngrates tooptimal levels. In this case an 87.5per-cent rate for the FBB capacity utilization rate overstates the“natural rate” of capacity utilization. This argument has beenmade in John A. Tatom, “The Meaning and Measurement ofPotential Output: A Comment on the Perloff and WachterResults,” in Karl Bninner and Allan H. Meltzer, eds., ThreeAspects of Policymaking; Knowledge, Data and Institutions,Carnegie-Rochester Conference on Public Policy, volume 10(1979), pp. 165-78. The benchmark is supported by comparativemovements in “excess” unemplo,vment of the civilian laborforce and the capacity utilization rate. When the capacity utiliza-tion is regressed on the excess unemployment rate described inthe text below over the period 1/1955-1111981, the constant is86.2 percent with a standard enor of 0.78 percentage pointswhen a significant lagged unemployment rate is Included.
‘This data series and its development Is described by Peter K,Clark, “Potential Output in the United States 194840,” U.S.ProducticeCapacity; Estimating the Utilization Cap (Washing-ton University; Center for the Study of American Business,December 1977), pp. 21-66.

FEDERAL RESERVE BANK OF ST. LOUIS
term.1°The sum ofthe slackterms, —0.32, is virtuallyidentical to the single contemporaneous term in theearlier estimates, so that only the timingof the cycli-cal effect has been changed. Potential hours perworker is found from the predicted values of equa-tion 3 withtheslackvariable setat zero in thecurrentand past quarter.
Potential employment in the private businesssector is found in a similar manner. In particular, thelogarithm of private business sector employment (InEM1) is regressed on a constant, a time trend (‘F), ex-cess unemployment in the current and past quarter,and a trend shift variable (T2) to account for a shiftin the trend rate of growth of the labor force after1964. This particular break in trend was chosenon the basis ofthe lowest standard error ofthe equa-tion, A break in trend is included to improve theefficiency ofthe estimation ofthe coefficients for theslack variables. The equation for the 11/1948-11111981 period is:
(4) InEM=3.94+0.002T+0.004T2(371.63) (7.21) (9.59)
— 0.013 UN, — 0.003 UN1.1(—11.03) (—2.63)
as=o.gi SE=0.0046 DW=L87 b=0.92
When this equation is differenced,the autoregressivedisturbances disappear (the Durbin-Watson statisticwithout first-order autocorrelation adjustment is1.89), and the coefficients for the trend, break intrend, and slack variables are virtually identical. Tofind potential employment in the private businesssector, the actual level of employment is cyclicallyadjusted by (0.13 UNt + 0.003 UNbL) percent, accord-ing to the level and first-difference equations.’1
JANUARY 1062
This method of determining potential employ-ment differs from the one this Bank used earlier,Until recently, potential PBS employment wasfound by subtracting the level of current employ-ment outside theprivate business sector from poten-tial civilian employment [(1 — Up’) times the civilianlabor forcel. The fbnrierwas equated to the differencein actualcivilian employment andPBS employment.This method had two minor shortcomings. First,periodic census revisions and changes in samplingand estimation methods alterthe civilian labor forceand employment data, slightly affecting a measuresuch as the above and an accompanying measure ofpotential output Second, this employment measurewas somewhat cyclical, despite the absence of anypermanent cyclical effrcts on the civilian labor forcemeasure. The reason for this appears to be that PBSemployment and civilian employment dataare esti-mated by different methods, and their differenceis cyclical.12
Revised quarterly estimates ofpotential real GNPare presented in the appendix to this article- Thesedata as well as actual real GNP are shown in chart 2.The growth rate of this revised potential outputseries has been unchanged for past periods. Theaverage growth rate of potential output was 3.7 per-cent from 1949 to 1973, the same as in the originalestimates. This rate has varied somewhat in the past,however, largely reflecting differences in the growthrate of the labor force. For example, from 1951 to1963, potential output grew at a 3.3 percent ratewhile the civilian labor force grew at only a 1.2 per-cent rate. Potential output growth accelerated to a4.0 percent rate from 1963 to 1973, as labor forcegrowth accelerated to a 2.1 percent rate,
Since 1973~the potential growth rate hasaveraged3.1 percent despite a labor force growth of 2.4percent The potential output growth rate has beenas highas 5.0percent in 1977-78. The annual growthrate of potential output in 1974 and 1980 was only2.0 percent; in 1975, this growth rate was only 2.6percent. These relativelyslowrates reflectthe impact
tO’fl~5
equation was explained in Robert H. Rauche and John A.Tatoni, “Potential Output and Its Growth Rate — the Domi-nance of Higher Energy Cost in the 1970’s,” U.S. ProductiveCapacity; Estimating the Utilization Gap (Washington Uni-versity: Center Ibr the Study ofAmerican Business. December1977). pp. 76-77. The unusual shift in hours per worker in the‘60s has also been noted by George L. Perty. “Potential Outputand Productivity,” Brookings Pag;er.s on Economic Activity(1:19Th,pp. 1147. Tests ofadditional laggedvalues ofthe excessunemployment rate found them to be insignificant.
“Theeffect ofaone percentrise inthe excess unemploymentrateon PBS employment shouldbe roughly a percentdecline equalto the ratio of the civilian labor force to PBS unemployment.This may be derived from the relation that PBS employment is(1— U) LF — NE, where U is the unemployment rate of thecivilian labor force (LF), and NE is non-PBS employment,measured by the difference in civilian employment and PBSemployment. The actual ratio of the labor force to PBS employ-
n,ent in the sample period has a mean of 1.26. The remainder isdue to cyclical variation in non-PBS employment that does notaffect non-PBS output.
“The dlflèrence between establisment-based payroll measuresofemployrnent and households-sampling-based civilian employ-mentmeasures is procyclical so that theold method resulted In ameasure of potential PBS employment that was inverselyrelated to excess unemployment. This cyclical difference isdiscussed by Alexander Korns, “Cyclical Fluctuations in theDift~renceBetween Payroll and Household Measures of Em’ployment,” Survey of Current Business (May 1979), pp. 14-44.
9

FEDERAL RESERVE BANK OF ST. LOUIS JANUARY 1982
Chart 2
Real GNP
of sharp increases in the relative price of energyresources.
Table 4 shows the annual averages of recent levelsof potential CNP together with recent estimates bythe Council of Economic Advisers (CEA).13 TheCEA estimates range from 1.4 percent below to 1.0
percent above those presented here. The percentagedifference between the two measures is virtuallythe same in 1973 as reported earlier, hut the 1977CEA estimates for the period 1974-76 rose from1.1 percent larger to almost 3 percent larger than thisBank’s estimates. The two estimates are now extreme-ly close. largely doe to major revisions in the CEA
‘3
See Council of Economic Advisers, Leottoinie Report of theI’ir-s,theit t, 1981
estimates reported in the Lconoti je Report of (It cPus itlen t in 1977 and 1978. These rexi sions pushedthe 1973 level below that estimated by this Bank, hutthen assumed a roughly constant growth rate thatwas luster in 1974—76, then slower in 1976-79, thanthat estimated here. The CEA reported in 1981 thatpotential output was expected to grow at a 2.9 per-cent rate in 1979 and 1980, then reIn n~to a 3.0 per-cent rate.14
441hc (1\ c stun itc is tpp inotis l)tStcl tiJ)0ll (lit C SP( Ct iton th it
tI e I au or force Sc ill grow at a 1 .75 e reel it rate, hours pc’worker svil] deeh n e at a Secular rate of 0.5 pe ree lit 14111 tI i at
potential pr ,doet Ritv (output per h Ott r ss ill ri Sc~ at al sot it a1.75 pereent rate. See Lcooonnr Report, 1980, pp. 89—90 andIteonoone Report, 1981, pp. 180—81. Such a rate of productivityadvai ice II lay appear opti iiii stie in ii gh t oFt] it cx perle flee lii lee1978 or in 1973—75. It s lion! c1 he n otec!, howe ‘c r, that poteii ti a]
Billions of 1972 dollars Billions of 1972 dollars1600
1500
1400
1300
1200
1100
1000
900
800
700
600
1948495051525354555657 58596061626364656667686970717273747516777879801981totest data plotted: 3rd quarter Source: U.S. Deportment of Commerce
500
400
10

FEDERAL RESERVE BANK OF ST. LOUIS
Table 4Recent Measures of Potential GNP(billions of 1912 dollars)
Potential GNP CEA estimate Ratio
1973 $1,2548 $12349 983%
1974 12797 12775 99.81975 1313.0 1,320,6 10061976 13518 13651 1010
1977 14006 1,4114 100.8
1978 14700 1,459 993
1979 15262 1,5046 986
1980 15562 15485 995
The primary diffbrence shown in table 4 is that theCEA growth rite of potential output of 3.4 percentin 1973-76 exceeds the 2.5 percent rate estimatedhere, while its growth rate for 1976-79 of 3.3 percentis less than the 4.1 percent rate estimated here. Itappears that, in recent years, the CEA has smoothedits potential outputseries to capture the sharp supplyshock effects on potential output by lowering thegrowth rate ofpotential output over several years. Asa result, the levels of potential output have notdiffered substantially. This difference is to an extentintentional, as the CEA has always employed a givengrowth rate for long periods. This tendency has beentempered in recent years, as can he seen b’v the slightvariability in the CEA annual growth rate shown intable 4. Itmaybe thatthe 1980-81 productivity lossesthat result from energy shocks will be largelyreflected in the CEA’s use of’too slow a rate of poten-tial growth for the early 1980s.
JANUARY 1982
Table 5Recent Productivity Developments(compound annual rates)
IV/1948- lV/1973-lvf1973 1V11980 Difference
Growth of output/hour 287% 067% 220Potential growth ate 2 8 094 1 88Cyclical factors 009 020 0.29Residual factors 0 04 007 0 03
Contribution to potentialgrowth rate ofCapital accumulation 092 028 0 64(Growtltinhtglt.employment casz (104) (Z481
aprtal~laborrat 0)
Energy price changes 0 07 1 13 1 20
Since 1973, productix ity ‘s abysmal peiformance hasbeen a major concern fbi polic~m’ikers. Thus it isuseful to detail the fhctors influencing such growthover the last seven - ear •15
An analysis of the actual and potential productivitydecline for the private business sector appears in
table 5, where growth rates and the contribution ofvarious hictors are compared for two periods: 1948 tothe end of 1973, and 1973 to the end of 1980, Output
per hour grew at a 2.87 percent rate from I\~I1948toIV! 1973, then slowed to a 0.67 percent rate over thenext seven years. This growth canhe analyzed in twoways. The first is to look at the contribution of thefactors entering equation 2: the actual changes in thegrowth of employed capital relative to lahor, therelative price of energy, the pace of technologicalchange, and residuals due to random errurs offittingthe equation at the end points of the period. Thesecond, shown in the top panel of table 5, is to breakdown actual productivity growth in each period intochanges due to the groxvth of potential productivity.changes clue to cyclical variations in the employ—rnent of capital and labor at the beginning and endperiods, and differences in the residual or randomerror component of equation 2.
151n contrast to Edward F. Denison, ‘‘Explanations of DecliningProclueti vi tv Growth,’’ S is it e!t of Cit“Ce iii Btcsities i, (An p st1979, part 2), pp. 1-24, the analysis here of post—1973 prodtietiv-itv cleve lopmen ts fully explains the productivity ‘‘pnzz]e’while other explanations do not. See Tatoin, “The ProductivityProhiens” or especially Denison ‘s paper for a cii setission ofthese other factors. The puzzle is presninahiv all the moredial lenging to c,ther analysts due to the pc,st— 1978 cessation citprod octi vi ty growth
11
•RECENT ACTUAL AN!) POTENTIALPRODUCTIVITY DEVE.LOPME.NTS
The sharp drops in potential output growth in1974-75 and 1980 reflect the effbct of mi~orenergyprice changes on actual and potential productivity.
output per hour, discussed in the next section, rose over five—year pen mis at no less than a 2.5 percent rate from 1948—73.Fc,] loutt ig the in t pl ementati on of acce I erntc’cl diepreciation and]corporate tax cuts, the pace of capital formation i’c,se sharply sothat it surged to the post—World War II peak rate of 3.2 percentfrom 1963 to mid— 1970. Even chiring 1978 potential productivitygrowth had risen to over a 2 percent rate as the adjustment to
c’ prior energs’ sI iock was apparently approaching coni p1eti on.
A repeat of that pattern and] recent si ipp]v-sid]e policies suggesta niorc’ rapi ci pace of prod net i vi tv growth froin 1982—85 than thatprojected hy the CEA.

FEDERAL RESERVE SANK OF ST. LOUIS JANUARY 1982
ChartS
Capital Labor Ratio (Private Business Sector)
The contribution of cyclical hictors accounts fbrthe difibrence between the productivity effect of thegrowth of the potential PBS capital—labor ratio (thecontribution of the capital—labor ratio to potentialgrowth) and the efkct of the actual growth in theutilization of capital per hour. The discrepancy be-tween the two arises from the cyclical variability of’the capital—labor ratio shown in chart 3. The sum ofthe cyclical hictor’’ and the contribution of capitalaccumulation’’ to potential productivity growth inch—cates the estimate of the actual impact of movementsin the observed ratio of utilized capital to labor hourson the observed productivity growth.
Most of’ the 2.2 percentage—point decline in pro—dnctivitv growth over the last seven years has beendue to factors that slowed pote’ntial productivitygrowth. For the particular comparison shown, cvcli—cal differences between productivity movements inthe two periods or residual errors account for only0.3 percentage points of the observed slowing.
In the lower part of the table, the htctors contrib-uting td) the potential productivity growth slowdownare shdnvn. What is omitted in the lower part of thetable is the trend growth of total factor productivitywhich contributed 1.82 percentage points tds the rate
1912 dollars per worker 1912 dollars per worker7.0 7.0
1948 49 50 51 52 53 54 55 56 57 58 59 60 61 62 63 64 65 66 67 68 69 70 71 72 73 74 75 76 77 78 79 80 1981Sources, U.S. Deportment of Labor, and Board of Governors of the t’ederal Reserve System
The potential ratio is the capitat stock adjusted for an 87,5% capacity utilization rate divided by potential hours of employment in the privatebusiness tectar. The actual ratio useu the actual dapadity utili ration rate and hours of employment in the private business sector,
Latest data plotted, 3rd quarter
12
FEDERAL RESERVE BANK OF ST. LOUIS JANUARY 1982
Chart 4
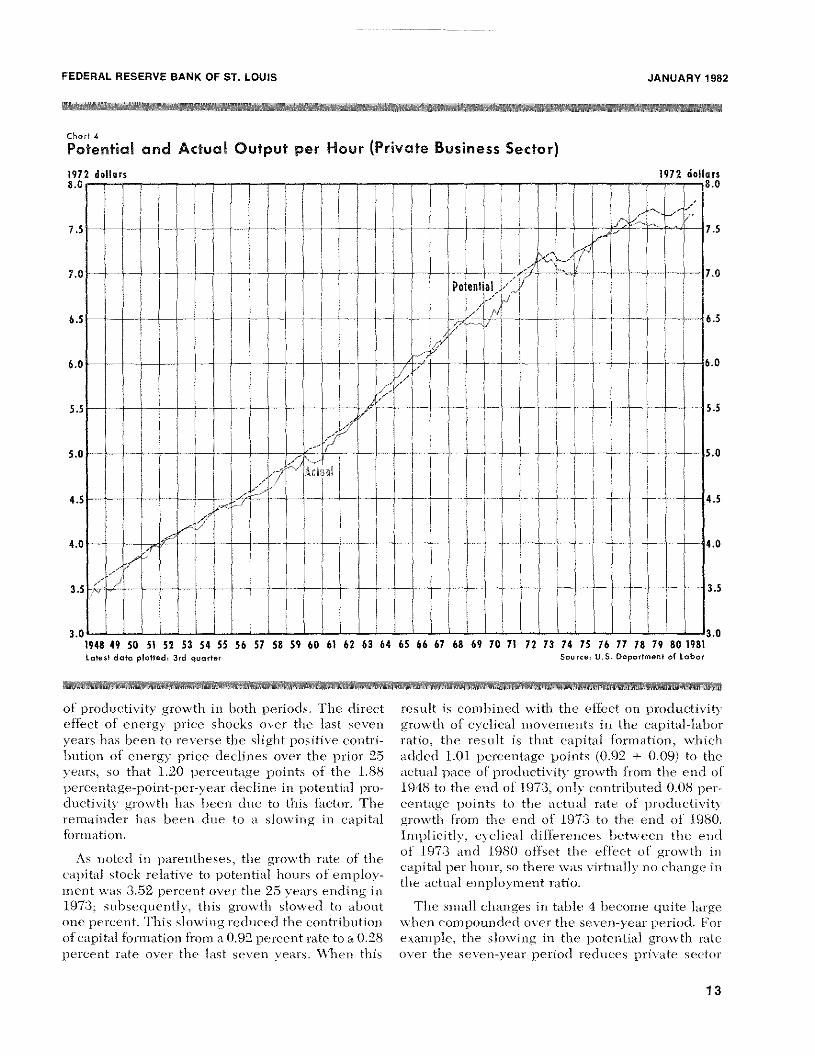
Potential and Actual Output per Hour (Private Business Sector)
Latest data platted, 3rd quarter
of productivity growth in both perioc1s, The directeffect of energy price shocks over the last sevenyears has been to reverse the slight positive contri-bution of energy price declines over the prior 25years, so that 1.20 percentage points of the 1,88percentage—point—per—year decline in potential pro-ductivity growth has been clue to this hictor. Theremainder has been due to a slowing in capitalformation.
As noted in parentheses, the growth rate of thecapital stock relative to potential hours of employ-ment was 3,52 percent over the 25 y-ears ending in197:3; subsequently, this growth slowed to aboutone percent. This slowing reduced the contributionof capital formation from a 0.92 percent rate to a 0.28
percent rate over the last seven years. When this
result is combined with the effdct on productivitygrowth of cyclical movements in the capital—laborratio, the result is that capital fbrmation, whichadded 1.01 percentage points (0.92 + 0.09) to theactual pace of productivity growth from the end of1948 to the end of 1973, only contributed 0.08 per-centage points td) the actual rate of productivitygrowth from the end of 1973 to the end of 1980.Implicitly, cyclical differences between the endof 1973 and 1980 offset the effect of growth incapital per hour, 50 there was virtually’ no change inthe actual employment ratio.
The small changes in table 4 become dluite largewhen compounded over the seven—year period. Forexample, the slowing in the potential growth rateover time seven—year period reduces private sector
1972 dollars 1972 dollars8.0 8.0
194849 50 51 52 53 54 55 56 57 58 59 60 61 62 63 64 65 66 67 68 69 70 71 72 73 74 15 76 77 18 79 801981Source, U.S. Deportment of Labor
13

FEDERAL RESERVE BANK OF ST. LOUIS JANUARY 1982
Chart 5
Real GNP per Civilian Worker
Latest data plotted, 3rd quarter
output by 13.8 percent by the end of 1980. The directi inpact of energy price increases alone over theseseven years reduces output by 8.3 percent.
Moreover, a large share of’ the redludttion in capitalformation since 197:3 has been due to energy pricedevelopments. The inclusion of the energy price-nschtcecl s low’i ng in the desired capital—labor ratioleads to an 11.5 percent loss in output. The retnai o—ing loss in potential productivity is associated with anon—energy—relatedl sloveing in capital formation .t~
‘° Factors ic sf500 Si I sic lo r tise cc s sati o is of gr,,wtls is tbc’ o I iii Scci
capital—lalsor ratio besides tIst— declise in tIme imiocbtc’tivitv olcapital dnc to eisergv ps’icc’ changes and stissor cvc’iicssl issflts—t’ssces, include sods factors ssslsiglser expected inflatioss, inflationtincertai,stv, antI riskier rctns’sss disc tcs sos isscrc’ased probabilitYof goverss oicssta! intervcotiois tisroogis rcgcslattss’y its itiativcs,
St r stosts I ‘mc Es odoc tss itt Pt ohlc us P stnc H Hr sstk I
H tntl lv, it shot tIc1 he noted that table 5 presents asumnsary view of the effect of energy price changeson actual and potential prods ictivit that does notreflect the actstal pattern of events. In particular, the
slovvclown’’ described in table 5 is not continuous.Associated xvith each energy shock is a once—and—for-all dccli ne in both measures of proditeti vitv, sx’ith
slsott, ‘‘Tise Decline in Aggregatc-’ Slsare Valsics, Taxatioss,\sdssation Errors. Risk, said Profitability, :\itt(’rieOti Ec’osso,soclies i c’sr i Deer’ is] ser I 95 It. pp. 909—22. cii set is sc-’ s timc se a sd otisefactors that c’osstri butt’ to the slosvdowss in capital formation aisdargues that inflation alone has had littic isspact on tlsc clechsseits sbarc values and, insplicitlv, capital fcsrtssatioo. Instead bec’laiisss that a c’bange its risk presssionls attrii,otc’cI to is,c’ressseds,nccrtainty alsoist pricc and regulatory cisaisges) its cijisity titdIsoncI v ic’ Idis c’s ci redo cc-ti prc- tax pusfi tab iii ti, have been tIs eresisoss for sdsotit ball the decline its share sallies. lle,sdc-rslsottdoes not assess tIme role of a higlser relative price sf energY its
rednciisg use pretax ri—al profststlsdstv of tlsc’ corporate ea1sital
stock.
Thousands of 1972 dollarsThousands of 1972 dollars
16
194849 SO 51 52535455565758596061 626364656667686970717213747576777879801981Sources, U.S. Department of Labor and U.S. Deportment of Commerce
14

FEDERAL RESERVE BANKOF Si. LOUIS
temporarily slower growth as the capital-labor ratiois adjusted toward a lower desired level. Thispatternis more clearly apparent in chart 4, which showspotential and actual measures of private businesssector output per hour. Deviations in the two arepredominantly due to the business cycle. The pat-tern of potential productivity developments in chart4 shows virtually no growth from mid-1973 to mid-1975 and relatively slow expansion from mid-1975to mid-1977. Following the second energy shock,potential productivity fell, then was virtually un-changed until the end of 1980. The second phaseof a relatively slow pace of potential produc-tivity expansion is apparent in the first three quartersof 1981.
chart 5 shows an alternative measureofproductiv-ity, real CNP per civilian worker, again measuredon both an actual and a high-employment basis.t7
The primary difference from chart 4 is the secularrate ofdecline in hours per worker. Both actual andpotential real CNP per worker have flattened outtwice relative to the prior trend growth, with aresumption of growth from early 1977 until early1979. At the end of 1980, potential real GNP per
JANUARY 1982
worker stood only 5.7 percent higher than at theend of 1973,sothat five years worth of the prior trendgrowth (2.2 percent rate) has been lost during thepast seven-year period.
SUMMARY
Recent revisions in the measures of the nation’soutput and capital stock, as well as minor changes inprocedures, have altered this Bank’s measures ofpotential output. The major conclusions of earlierBank studies, however, have been unaffected bythese changes. In particular, the growth of potentialoutput has been sharply reducedby the 1973-74 and1979-80 energy shocks and subsequent adjustmentsin the desired capital intensity ofproduction. Theseeffects have been confirmed by the re-estimation ofearlier production function coefficients, and, moreimportant, the confirmation of the prior empiricalestimates in the latest round of energy priceincreases.
The decline in thegrowthofpotential output since1973 has, in recent years,been acknowledgedby theCouncil of Economic Advisers, but through a trendreduction rather than through sharp temporarydeclines in 1974-75 and 1979-80 as implied here.Nonetheless, the level ofpotential output estimatedby the CEA in recent years is little different from thisBank’s estimate. The slowing in potential output
masks a sharper reduction in the growth of produc-tivity in recent years. A detailed analysis of produc-tivity developments shows a marked deteriorationin growth relative to past trends. In themeasurementof potential output, this deterioration has been par-tially offsetby a more rapid growth of both potentialand actual employment.
ttflse lilgh-entployment measureofcivilian employsnentis foundby regressingchanges in the logarithmofthe civilian laborkneeon a constant, a shift for faster labor force growth after 1964 andcurrent and one-lagged changes in the excess unemploymentrate. Additional lags are not statistically significant. Moreover.theconstraint that the effect ofslack Is zero after two quarterscould not be rejected. The effect of a one percentage-point in-crease in slack is to increase the labor force by 0.2 percent (t2.34) in the current quarter and this is othiet in thesubsequentquarter. To find the higli-eniployment civilian employment,these cyclical effect ale added back to the observed civilianlabor Force and high-employment unemployment (LW) (IS) isremoved.
(See appendix on nat page)
15

I i I & I ‘p I
a a