potential impacts of climate change on food security in mali · potential impacts of climate change...
TRANSCRIPT

I24
80
E/1
/11
.11
Potential imPacts of climate change onfood security in mali
CC_FS_Mali_Cover_05.indd 1 13/11/12 15.16

Food and Agriculture Organization of the United Nations (FAO)
Natural Resources Management and Environment Department
Rome, October 2012
Potential imPacts of climate change onfood security in mali
CC_FS_Mali_intPages_30.indd 1 13/11/12 15.02

Pedercini, M., Kanamaru, H. and Derwisch, S. 2012. Potential impacts of climate change on food security in Mali. Natural Resources Management and Environment Department, FAO, Rome.
The designations employed and the presentation of material in this information product do not imply the expression of any opinion whatsoever on the part of the Food and Agriculture Organization of the United Nations (FAO) concerning the legal or development status of any country, territory, city or area or of its authorities, or concerning the delimitation of its frontiers or boundaries. The mention of specific companies or products of manufacturers, whether or not these have been patented, does not imply that these have been endorsed or recommended by FAO in preference to others of a similar nature that are not mentioned. The views expressed in this information product are those of the author(s) and do not necessarily reflect the views of FAO.
All rights reserved. FAO encourages the reproduction and dissemination of material in this information product. Non-commercial uses will be authorized free of charge, upon request. Reproduction for resale or other commercial purposes, including educational purposes, may incur fees. Applications for permission to reproduce or disseminate FAO copyright materials, and all queries concerning rights and licences, should be addressed by e-mail to [email protected] or to the:
Chief, Publishing Policy and Support Branch Office of Knowledge Exchange, Research and Extension FAO Viale delle Terme di Caracalla 00153 Rome, Italy
© FAO 2012
Cover photo: © Katja Remane
CC_FS_Mali_intPages_30.indd 2 13/11/12 15.02

i i i
P ot e n t i a l i m Pa c t s o f c l i m at e c h a n g e o n f o o d s e c u r i t y i n m a l i
contents
ACRONyMS
PREFACE
ExECUTIVE SUMMARy
INTRODUCTION
MODEl DESCRIPTION AND ClIMATE CHANgE SCENARIOSThe overall modeling approach: T21Modeling climate change impacts
Climate-induced potential changes in yieldsShifts in land use patternsShifts in cropping patterns
SENSITIVITy ANAlySISThe “Base Run” scenarioThe impact of climate change on food production and availability The broader impact of climate change on the socio-economic system and on access to food
POlICy ANAlySISDescription of policy scenarioPolicy simulation results and discussion
CONClUSION
REFERENCES
v
vi
viii
1
44889
10
10101420
242427
30
32
iii
CC_FS_Mali_intPages_30.indd 3 13/11/12 15.02
iv
P ot e n t i a l i m Pa c t s o f c l i m at e c h a n g e o n f o o d s e c u r i t y i n m a l i
list of tables, figures and boxes
Box 1Four Dimensions of Food Security
Box 2Improvements in agricultural practices and inputs.
Figure 1High level representation of the T21 model (ROW stands for Rest of the World)
Figure 2Base Run results for agriculture production (top scale, red and blue lines); average yield (mid scale, grey and green lines); and GDP (bottom scale, brown and black lines), 1990 – 2050, from DNSI/WDI data and T21 simulation.
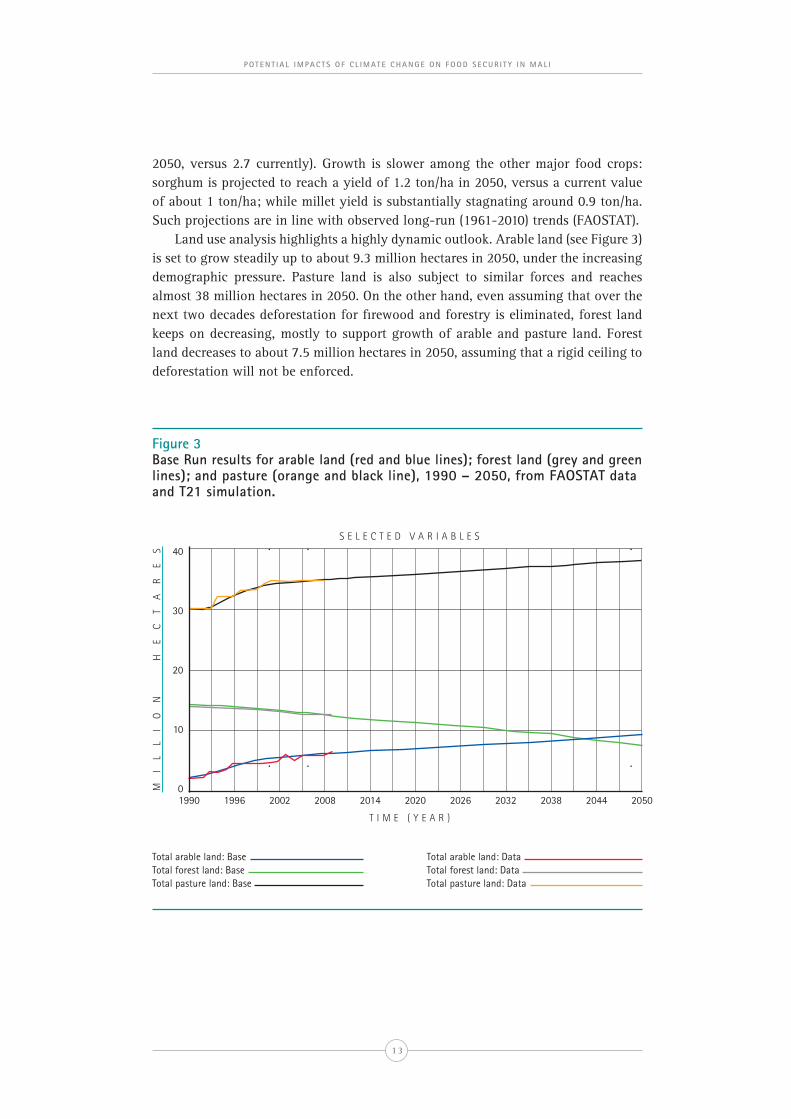
Figure 3Base Run results for arable land (red and blue lines); forest land (grey and green lines); and pasture (brown and black line), 1990 – 2050, from FAOSTAT data and T21 simulation.
Figure 4Simplified causal diagram of major feedback structures involving yield in T21.
Figure 5Sensitivity results for average yield (ton/ha) in Mali 1990 – 2050.
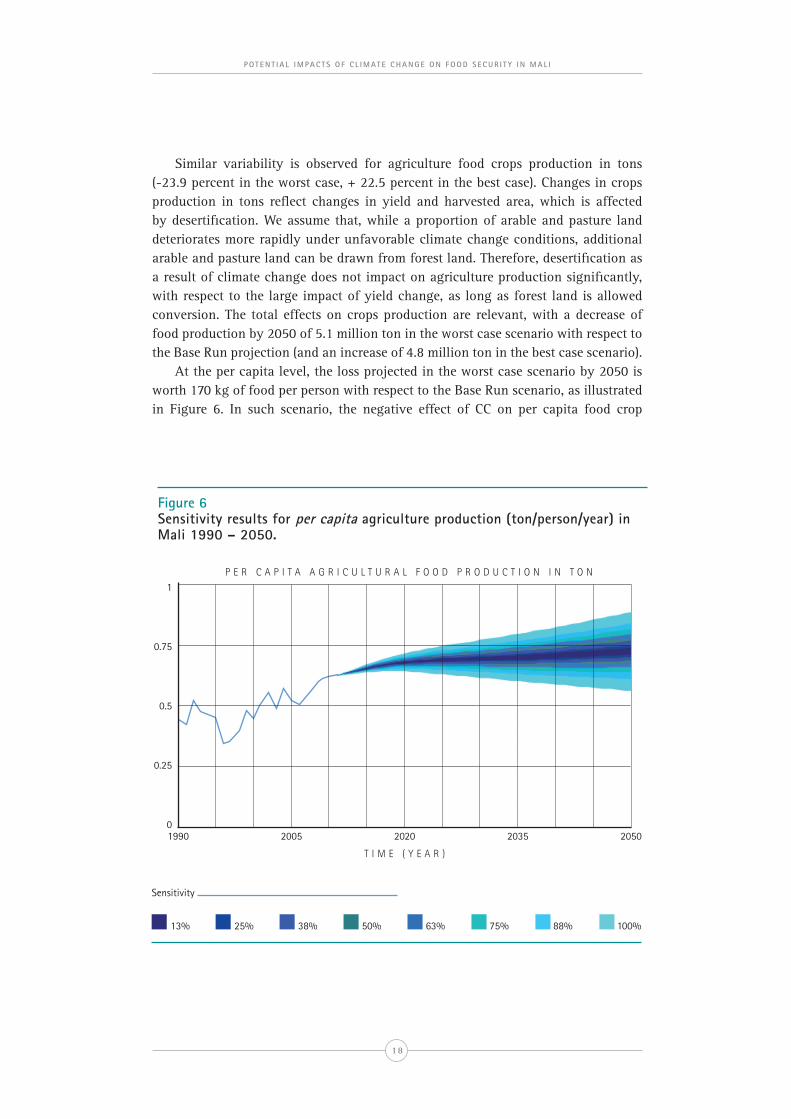
Figure 6Sensitivity results for per capita agriculture production (ton/person/year) in Mali 1990 – 2050.
Figure 7Sensitivity results for agriculture production (real local currency/year) in Mali 1990 – 2050.
Figure 8Sensitivity results for proportion of population living below the poverty line (dimensionless) in Mali 1990 – 2050.
Figure 9Sensitivity results for forest land (million hectare) in Mali 1990 – 2050.
Figure 10Policy simulation results for forest land (million hectare) in Mali 1990 – 2050.
Table 1Summary statistics for key indicators (comparison period: 1990-2008)
Table 2Comparison of results from the difference scenarios for key indicators.
2
25
6
12
13
16
17
18
19
21
23
29
11
15
CC_FS_Mali_intPages_30.indd 4 13/11/12 15.02

v
P ot e n t i a l i m Pa c t s o f c l i m at e c h a n g e o n f o o d s e c u r i t y i n m a l i
abbreviations and acronyms
ASTI-CGIAR Agricultural Science and Technology Indicators -
Consultative group on International Agricultural Research
BCFN Barilla Center for Food and Nutrition
CC Climate Change
DNSI-DNPD Direction Nationale de la Statistique et de l'Informatique -
Direction Nationale de la Planification du Developpement, Mali
EIA Energy Information Administration
FAO Food and Agriculture Organization
GDP gross Domestic Product
GHG greenhouse gas
IMF International Monetary Fund
IPCC Intergovernmental Panel on Climate Change
PPP Purchasing Power Parity
R&D Research & Development
RMSPE Root Mean Square Percent Error
SSA Sub-Saharan Africa
T21 SF T21 Starting Framework
T21-Mali Threshold21-Mali
UN United Nations
UNCCD United Nations Convention to Combat Desertification
USAID United States Agency for International Development
WB World Bank
WRI World Resources Institute
CC_FS_Mali_intPages_30.indd 5 13/11/12 15.02

vi
P ot e n t i a l i m Pa c t s o f c l i m at e c h a n g e o n f o o d s e c u r i t y i n m a l i
Preface
Food security remains a challenge in Sub-Saharan Africa where the proportion
of undernourished people (30 percent - FAO Statistical year Book 2012) is the
highest globally. However, even within Sub-Saharan Africa, large variations are
observed from country to country in food security status. Mali is one of the few
countries of the region to have achieved Millennium Development goal 1, which
seeks to halve the proportion of people who suffer from hunger between 1990
and 2015. yet, 12% of total population is still undernourished in the country
(2006-2008). Climate change is expected to pose an additional threat to these
currently food insecure people and more broadly, to small marginal farmers in
many sub-Saharan countries.
The impacts of climate change on agriculture and food security may be felt
primarily through changes in crop yields, water availability, pests and diseases,
animal health and other biophysical factors. Such biophysical changes propagate
through a number of components of the socio-economic system and ultimately,
impact the livelihoods of people in a variety of ways. A common approach to
assessing impacts of climate change focuses on one particular aspect (e.g. crop
yields) by way of a specialized model, which can provide a high level of detail
on the specific interactions being analyzed. To complement such approach,
integrated modeling can shed a new light on the complex interaction of the
processes within the society, the economy, and the environment, providing a
comprehensive understanding of the impacts of climate change that cannot be
analyzed with a mono-sector model.
While the demand for accurate climate change information is high, future
climate projections carry inherently deep, multi-layered uncertainties. We do not
know how human activities will evolve in the coming decades, and hence their
consequent effects on greenhouse gas emissions and climate change. In addition,
scientific understanding of the climate system, and of the systems that depend
on climate, including physiological responses of plants, is far from perfect. Thus,
it is not an easy task to accurately study the future of food security under a
CC_FS_Mali_intPages_30.indd 6 13/11/12 15.02

vii
P ot e n t i a l i m Pa c t s o f c l i m at e c h a n g e o n f o o d s e c u r i t y i n m a l i
changing climate in any given country. The task is even harder for countries in
the Sahel, where different climate models provide disparate projections.
given such uncertainties, this paper examines how climate change could affect
projections for agricultural production and rural poverty in Mali by performing a
sensitivity analysis with the Threshold21 model, an integrated scenario-analysis
tool. The simulation suggests potentially important impacts on agriculture
production and more pronounced impacts in the rural population. In fact, the
suggested impact of climate change on this share of the population foresees an
additional 1 130 000 people in rural areas falling below the poverty line in 2050.
The paper further examines the effectiveness of public investment, namely research
and development for agriculture, as a crucial measure for adaptation. The large
amount of resources that would be necessary to avoid the worst case scenario
suggests the necessity of continued support from the international community to
improve food security in the country and Sub-Saharan Africa as a whole.
Alexander MüllerAssistant Director-general
Natural Resources Management and
Environment Department
Food and Agriculture Organization of
the United Nations
CC_FS_Mali_intPages_30.indd 7 13/11/12 15.02

vii i
P ot e n t i a l i m Pa c t s o f c l i m at e c h a n g e o n f o o d s e c u r i t y i n m a l i
executive summary
Food security is likely to be affected by climate change (CC) in several ways: food
security depends not only on the direct impact of CC on food production, but also
on its indirect impacts on human development, economic growth, trade flows,
and food aid policy (Keane et al., 2009). The extent of such impact is however
very uncertain, especially in regions where climate projections are ambivalent,
such as in the Sahel zone in Sub-Saharan Africa (SSA). In our study we assess:
how projections for key food security indicators – such as agriculture production
and rural poverty – are affected by the uncertainty in climate change; and how
investment in adaptation measures can help dealing with such uncertainty.
In our analysis, we focus particularly on food production and availability, as
well as on access to food. We link agriculture production with broader socio-
economic-environmental processes in order to depict adaptation to CC and thus,
to make a comprehensive impact assessment of CC. We use Mali as case study,
a country whose economy is largely based on agriculture. We first assess the
direct impact of CC on average yield, food production and total agriculture
production. Then we assess the influence such phenomena have on the entire
economy and on rural poverty. Finally, we assess relevant policy options. We
use as a framework the Threshold21-Mali (T21-Mali) model developed by the
Millennium Institute, which is an integrated scenario-analysis tool designed to
support national development planning. The T21-Mali model integrates into one
framework the most essential social, economic and environmental aspects of
development, allowing for systemic analysis of climate change and food security.
The model well replicates historical trend for agriculture production since 1990.
We perform sensitivity analysis considering a possible variation of yields due
to climate change of +/- 25 percent by 2050, and a loss of +/- two percent of
arid drylands; +/- one percent of semi-arid drylands; and +/- 0.5 percent of
subhumid drylands due to desertification. Our sensitivity analysis indicates that
the response of average yield to climate change is partially counteracted by
the contraction/expansion of marginal lands, which have lower productivity
than average. Increased desertification only marginally affects agriculture
CC_FS_Mali_intPages_30.indd 8 13/11/12 15.02

ix
P ot e n t i a l i m Pa c t s o f c l i m at e c h a n g e o n f o o d s e c u r i t y i n m a l i
production, as more arable and pasture land is drawn from the forest stock.
In our worst case scenario (most severe adverse CC), the loss of value added
from agriculture production due to climate change is projected to be as large
as 16 percent by 2050. Overall, the combination of the effects described above
leads to minor changes in the key human development indicators for the whole
population, changes limited by the fact that the households income can count on
value added from the rapidly growing industry and services sectors. The picture
changes when we look at the rural population (expected to still account for
55 percent of the total population in 2050), mostly supported by agriculture: in
our worst case scenario, an additional 1 130 000 people in rural areas could fall
below the poverty line, with respect to the Base Run, by 2050. This effect, added
to the projected loss in food production and forest resources, can compromise
food security for this share of the population.
In order to explore effective policies to deal with such phenomena, we simulate
and analyze a policy scenario focusing on public investment in agriculture
Research & Development (R&D). We assume an average return on investment
in R&D of about 30 percent and an average life of R&D knowledge of 35 years
(10 years of gestation and a third order depreciation process over the following
25 years). We take as starting point our worst case scenario, and by way of
iterative simulation of alternative levels of investment in agriculture R&D, we
identify USD295 million (up from the current USD25 million) as the long-term
target level of investment that would compensate for the negative effects of
climate change on agriculture. Such large increase in investment would be
necessary only in our worst case scenario, and assuming no other adaptation
measures are put in place. Although climate projections in the region are highly
uncertain, investment in agriculture R&D is already greatly needed in the country
and would benefit agriculture in all cases, making it a reasonable policy option
under the precautionary approach, and as part of an integrated adaptation
policy package. The large amount of resources to be mobilized and the lack of
short-term return on investment suggest that external financial support for such
investment might be especially important.
CC_FS_Mali_intPages_30.indd 9 13/11/12 15.02

CC_FS_Mali_intPages_30.indd 10 13/11/12 15.02

1
P ot e n t i a l i m Pa c t s o f c l i m at e c h a n g e o n f o o d s e c u r i t y i n m a l i
introduction
Agriculture constitutes the backbone of most African economies. It is the largest contributor to gross Domestic Product (gDP); the biggest source of foreign exchange, accounting for about 40 percent of the continent’s foreign currency earnings; and the main generator of savings and tax revenues. In addition, about two-thirds of manufacturing value-added is based on agricultural raw materials, and 56% of the workforce is employed in agriculture (FAOSTAT 20101).
Climate change is considered as posing the greatest threat to agriculture production and food security in the 21st century, particularly in many of the poor, agriculture-based countries of Sub-Saharan Africa (SSA), due to their low capacity to effectively cope with a possible decrease in yields among others (Shah et al., 2008; Nellemann et al., 2009).
Food security is defined as a ‘situation [...] when all people, at all times, have physical, social and economic access to sufficient, safe, and nutritious food that meets their dietary needs and food preferences for an active and healthy life’ (FAO, 2002). Food security is not narrowly defined as whether food is available, but, in addition, whether the monetary and non-monetary resources at the disposal of the population are sufficient to allow everyone access to adequate quantities and qualities of food (Schmidhuber and Tubiello, 2007). More specifically, the four dimensions of food security include: food availability; stability of food supplies; access to food; and food utilization (see Box 1). All these dimensions of food security are likely to be affected by climate change: food security will depend not only on the direct impact of climate change on food production, but also (and critically so) on human development, economic growth, trade flows, and food aid policy (Keane et al., 2009).
All dimensions of food security are thus closely intertwined with agriculture production, which is both source of food and source of income for rural households. Climate change, through changes in temperature and rainfall patterns, is thus expected to have major impacts on food security for rural households. Although an increasing amount of knowledge is being accumulated on the subject, the extent of such impact is however very uncertain, especially in regions where climate projections are ambivalent, such as in the Sahel zone in SSA. While projections from climate models for temperature seem to converge, projections on precipitation – a key factor in determining yield – are highly uncertain, as “individual models generate large, but disparate, responses in the Sahel” (IPCC, 2007a). The intensity of the direct effects of climate change on yield, land use, and cropping patterns remains uncertain.
CC_FS_Mali_intPages_30.indd 1 13/11/12 15.02

2
P ot e n t i a l i m Pa c t s o f c l i m at e c h a n g e o n f o o d s e c u r i t y i n m a l i
box 1four dimensions of food security
food production and availability: Climate affects food production directly through changes in agro-ecological conditions and indirectly by affecting growth and distribution of incomes, and thus demand for agricultural produce. Changes in land suitability, potential yields (e.g. CO2 fertilisation) and production of current cultivars are likely. Shifts in land suitability are likely to lead to increases in suitable cropland in higher latitudes and declines of potential cropland in lower latitudes.
stability of food supplies: Weather conditions are expected to become more variable than at present, with increasing frequency and severity of extreme events. Greater fluctuation in crop yields and local food supplies can adversely affect the stability of food supplies and food security. Climatic fluctuations will be most pronounced in semi-arid and sub-humid regions and are likely to reduce crop yields and livestock numbers and productivity. As these areas are mostly in sub-Saharan Africa and South Asia, the poorest regions with the highest levels of chronic undernourishment will be exposed to the highest degree of instability.
access to food: Access to food refers to the a bility of individuals, communities and countries to purchase food in sufficient quantities and quality. Falling real prices for food and rising real incomes over the last 30 years have led to substantial improvements in access to food in many developing countries. Possible food price increases and declining rates of income growth resulting from climate change may reverse this trend.
food utilisation: Climate change may initiate a vicious circle where infectious diseases, including water-borne diseases, cause or compound hunger, which, in turn, makes the affected population more susceptible to those diseases. Results may include declines in labour productivity and an increase in poverty, morbidity and mortality.
(Schmidhuber and Tubiello, 2007 – from Ludi, 2009)
CC_FS_Mali_intPages_30.indd 2 13/11/12 15.02

3
P ot e n t i a l i m Pa c t s o f c l i m at e c h a n g e o n f o o d s e c u r i t y i n m a l i
Focusing on the case of Mali, the aim of this study is to assess:
° how projections for key development food security indicators – such as agriculture production and rural poverty – are affected by the uncertainty in climate change; and
° how investment in adaptation measures can help dealing with such uncertainty.
We take Mali as an example of a Sub-Saharan country whose economy is based largely on agriculture. Based on IPCC projections for the region and their level of uncertainty, we run sensitivity analysis assuming varying degree of impact of climate change on selected factors. Specifically, we focus on the effect of climate change on three factors that impact food production and availability:
° change in potential yields;
° shifts in the availability of suitable land for agriculture;
° shifts in cropping patterns.
We propose an integrated, long-term impact assessment of climate change for a pilot country (Mali), with the purpose of tracing the impact of climate change on agriculture and also on the broader development, and of illustrating different components of adaptation. We are therefore using the Millennium Institute’s Threshold 21 (T21) integrated quantitative planning model1 as our main analytical tool. In the context of mid- to long-term strategic planning, integrated quantitative modeling approaches such as T21 are necessary to support the development of a coherent, consistent, and effective strategy for adaptation to climate change.
In recent years, a variety of modeling tools have been developed for the assessment of the impact of climate change on agriculture and of adaptation strategies (e.g. Nelson et al., 2009; gommes et al., 2009). More specifically, Butt et al. (2005) provided an example of integrated approach to climate change and food security in Mali. Among such variety of modeling tools, T21 is characterized by an endogenous perspective on the broad development process, including key environmental, social, and economic aspects. By representing economic growth and development endogenously, T21 helps to generate realistic development scenarios, in which climate change has ripple-through system-wide effects. For instance, T21
1 www.millennium-institute.org
CC_FS_Mali_intPages_30.indd 3 13/11/12 15.02

4
P ot e n t i a l i m Pa c t s o f c l i m at e c h a n g e o n f o o d s e c u r i t y i n m a l i
allows not only to assess the direct impact of climate-change induced reduction in yield on agriculture production, income, poverty and education, but also keeps track of how a reduction in income and education can feedback to further reduce yield in the long-run. By analysing these processes we do not look at agriculture as an isolated sector in the economy, but as a dynamic component at the heart of the development process. Also, a broad perspective on the development context in which climate change takes place fundamentally helps in assessing the ability of a country to implement proper adaptation measures. For example, comparing the cost of measures to long-run gDP figures can provide important insights regarding the sustainability of such measures. On the other hand, the breadth of the T21 framework is counterbalanced by a lower level of detail in the agriculture sector: for instance, T21 does not support as detailed yield functions as those used in some of the above mentioned studies.
Section 2 of the study provides an overview of the model and of the assumptions we made for the development of climate change scenarios. Section 3 of the study shows the results from sensitivity analysis, and section 4 assesses adaptation strategies according to impact and costs.
model descriPtion and climate change scenarios
the overall modeling approach: t21
In order to develop our analysis, we used as starting framework the Threshold21 (T21) model developed by the Millennium Institute (Barney 2002). T21 is an integrated scenario-analysis tool designed to support national development planning that has been so far applied in over 30 countries and at the global level (Bassi et al, 2011; BCFN, 2011; Pedercini, 2011; Pedercini and Barney, 2009; Qureshi 2008). The model integrates into one framework the most essential social, economic and environmental aspects of development, allowing for a comprehensive long-term policy analysis.
T21 is a system dynamics-based scenario-analysis tool, which quantitatively represents causal relationships across the social, economic and environmental systems. Relationships are formalized in the form of algebraic equations and the behaviour of the system can be simulated and easily analysed. The knowledge from a variety of sources (data, theories, and experts’ opinions) can be easily incorporated in the representation of the system in order to better understand the causes of problems and identify leverage points. The high degree of transparency of the model supports an open and participatory debate about model assumptions and results.
CC_FS_Mali_intPages_30.indd 4 13/11/12 15.02

5
P ot e n t i a l i m Pa c t s o f c l i m at e c h a n g e o n f o o d s e c u r i t y i n m a l i
T21 is useful at four levels in the planning process. First, the participatory process of model development provides insights on the coherence and consistency of objectives, hypotheses and data used for policy-making in different sectors. Second, the Base Run simulation of the model offers an outlook into the key development issues the country/region might face in the future. Third, alternative scenarios provide an understanding of how different strategic choices or external conditions can impact future development, and how sectoral policies synergistically interact. Fourth, the resulting development plan provides a clear basis for action in the various sectors, as well as for monitoring and evaluation of performance.
The creation of each specific T21 model application is based on the so-called T21 Starting Framework (T21 SF), which is then customized to capture the particular issues of the specific country/region being analysed. T21 SF is a generic structure that represents development mechanisms that can be found in most developing and industrialized countries. As such, it covers a broad range of common long-term development issues, from poverty to environmental degradation, from education to health, from economic growth to demographic expansions. given its long-term focus, T21 is not a predictive model, and it is not intended to produce precise forecasts. The T21-Mali model, while keeping the broad and integrated approach that characterizes the generic T21 SF, is specifically developed with an emphasis on representing and analysing the dynamics of climate change and food security. The model has been conceived in particular with two functions in mind: to support an integrated assessment of the impact of climate change on food security and to analyse alternative policy scenarios and their long-term implications. The model also allows for analysing the implication of growth for poverty in a broad sense, including monetary aspects of poverty, as well as access to basic social services.
Figure 1 provides a high level representation of the structure of the T21-Mali. The structure is composed of three spheres (economy, society and environment), each including six sectors. All sectors are dynamically interacting with each other, within the same sphere, as well as across different spheres. Social resources, natural resources and economic resources, all contribute to economic production and are affected by it, providing an endogenous perspective on growth and development. In this framework, agriculture occupies a central role, since it produces essential resources for socio-economic development, and also requires input in terms of human resources (e.g. human capital), economic resources (e.g. physical capital) and environmental resources (e.g. land). The following paragraphs provide a general description of the major structural component of the model. In order to properly capture the consequences of climate change on agriculture and overall development of Mali, we included additional data and model structure, which is further explained in the Modeling climate change impacts section.
CC_FS_Mali_intPages_30.indd 5 13/11/12 15.02

6
P ot e n t i a l i m Pa c t s o f c l i m at e c h a n g e o n f o o d s e c u r i t y i n m a l i
figure 1high level representation of the t21 model
In the social sphere, the population sector includes the key mechanisms underlying demographic development. Fertility is determined based on income and education (Birdsall, 1988), and mortality based on income, nutrition, access to water and health care (Rodgers, 1979; Coale and Demeny, 1983). The labor sector accounts for labor supply/demand balances, distinguishing between skilled and unskilled labor. The health and education sectors determine respectively the level of access to basic health care and the adult literacy rate, based on the level of public service offered. The poverty sector determines the level of monetary poverty using a lorenz curve approach (Essama-Nssah, 2005; Qu and Barney, 2002), and the infrastructure sector represents specifically roads and irrigation infrastructure.
In the economy, the central sector is production, where resources of various kinds – economic, social, and environmental – converge to give rise to economic
Poverty
PoPulation
l a b o r health
education infrastructure
s o c i e t y
row
government
technology households
investment Production
e c o n o m y
sustainability
land
minerals emissions
wat e r energy
e n v i r o n m e n t
Rest Of the World (ROW), commonly used term in economic modeling to indicate the external sectors, that is, the external economic agents (individuals, firms, institutions...) that exchange economic flows with the country (e.g. imports, exports, remittances, etc.).
CC_FS_Mali_intPages_30.indd 6 13/11/12 15.02

7
P ot e n t i a l i m Pa c t s o f c l i m at e c h a n g e o n f o o d s e c u r i t y i n m a l i
production. We represent production separately for agriculture, industry, and services; and agriculture production is further split into crops production, livestock production, fishery and forestry. Crops production includes production of five major crops (cotton, rice, maize, millet, and sorghum) and a sixth residual category. We adopt Cobb-Douglas production functions (Cobb and Douglas, 1928) with an endogenous treatment of total factor productivity. We identified physical capital, human capital and infrastructure (including roads, irrigation, water and electricity distribution infrastructure) as the key resources for the country’s development (Sacerdoti et al., 1998; Calderón and Servén, 2004). In addition to these, for the calculation of crop yield we also consider the effect of agriculture R&D (Alston, 1998b).
The resources generated through economic production are allocated between consumption and investment. Investment in physical capital mostly takes place in the private sector, enhanced by foreign direct investment and remittances from abroad. Investment in human capital, via better education and health, fundamentally takes place as public spending in infrastructure and staff in the education and health sectors. Key public infrastructure (such as transportation and irrigation infrastructure), as well as public R&D capital also develop as a result of public investment.
In the environment, land, water, minerals and other natural resources are used to sustain production and to cover basic needs, and are regenerated based on their natural cycles. Natural resources include resources such as gold (non-renewable); water (renewable but available only in limited quantity and locations); and land (fixed, but can be shifted to a limited extent among different uses). Specifically for land, we consider five possible uses (forest, arable land and permanent crops, pasture, settlement land and unproductive land); and four degrees of humidity (hyper-arid; arid; semi-arid; sub-humid). Energy is generated using both internal resources (i.e. hydropower) and external resources (imported fossil fuels). In addition to the various indicators of sustainability included in the environmental sectors described above, long term sustainability is also assessed using the ecological footprint (Monfreda et al., 2004), which is determined based on the emissions from energy production and the other standard components of the footprint taken as constant on a per capita basis.
modeling climate change impacts
The major crops grown in Mali are cotton, rice, maize, millet, sorghum and other crops like vegetables or groundnut. But different areas in Mali differ in their distribution of land use considerably, due to large climatic differences across the country. Mali can be divided into three climatic zones: the Sudanic in the South (16 percent of the territory), with 700 to 1 000 mm of annual precipitation; the Sahelian in the centre and West (44 percent of the territory), with 200 to 400 mm precipitation;
CC_FS_Mali_intPages_30.indd 7 13/11/12 15.02

8
P ot e n t i a l i m Pa c t s o f c l i m at e c h a n g e o n f o o d s e c u r i t y i n m a l i
and the Saharan in the North (40 percent of the territory), with little or no rain. In the Sudanic area, cotton, rice, millet, sorghum, groundnuts and vegetables are predominant. In the Sahelian area, millet, sorghum and some rice are grown. In the Saharan area, pastoralism is the only viable livelihood. Considering these large differences in climatic conditions and land use, it becomes clear that climate change will have different impacts on areas that are vulnerable to different degrees and thus, it will affect land use and overall cropping patterns in Mali.
In our attempt to represent the impact of climate change on the Malian agriculture, we consider the impact of changing temperature and precipitation patterns on: changes in potential yields; changes in land use; and changes in cropping patterns. In sections below, we explain how these are represented in the T21 model.
The technology trend is one of the most important indicators of adaptation to climate change, as technology can, at least partly, offset the negative impact of climate change in many cases (gommes et al., 2009). The technology trend is endogenously determined in this study and is the result of changes in total factor productivity and of the accumulation of physical capital in the agriculture sector. The total factor of productivity is determined as a function of education, health, road density and water availability. The stock of agricultural capital is increased over time by the investment from other producing sectors in the economy and the investment that comes from agricultural production. We do not make any specific assumption regarding the level of technology in our scenarios: this will be the result of the overall development process in the country.
Climate-induced potential changes in yieldsConsidering that climate is an important factor for agricultural productivity, any increasing temperatures and decrease in water availability will tend to decrease potential yields for most crops. The actual impact of climate change on potential yields depends on the agro-ecological zone, the specific crop and the specific management approach (e.g. high external input, low external input, intermediate). When climate projections for a climate zone are robust and climate data largely available, calibrated yield functions can be used to estimate the impact of climate change on yield. For instance, gommes et al. (2009) in their study on the impact of climate change on the agricultural sector in Morocco use weather data of the last 50 years to develop yield functions that relate historical yields to climatic conditions. These yield functions are then used to project how climate change impacts on future yields.
In the case of Mali, such approach is not viable, due to the less complete data available, and also less useful, given the high uncertainty in climate projections. As indicated at the beginning of this section, only part of Mali lies in the Saharan zone (for which climate projections are less uncertain), and only limited information is available regarding the intensity of climate change to be expected in the other
CC_FS_Mali_intPages_30.indd 8 13/11/12 15.02
9
P ot e n t i a l i m Pa c t s o f c l i m at e c h a n g e o n f o o d s e c u r i t y i n m a l i
areas of the country. Regarding precipitation, projections indicate that “in all four [African] regions and in all seasons, the median temperature increase lies between 3 °C and 4 °C [between the years 2080 to 2099 and the years 1980 to 1999 in the A1B projections]” (IPCC, 2007a). It is safe to assume that temperature change across Mali will follow the general trend for the whole Africa. Regarding precipitation, projections for the non-Saharan zones in Mali are highly uncertain, as “individual models generate large, but disparate, responses in the Sahel” (IPCC, 2007a). Although reduction of precipitation on average is not expected to be as strong as in the Sahara zone, a recent study for the Sahel region indicates that the extremely dry and wet years will likely be more frequent during the 21st century (Huntingford et al., 2005). Considering the high level of uncertainty in the available projections from IPCC, we chose to consider a range of possible variation of yield to climate change of +/- 25 percent with respect to its baseline projection, with a normal distribution and standard deviation of 0.5. Such range is in line with IPCC estimation of response of cereal crops to temperature (IPCC, 2007b) and with similar studies for neighboring countries (gommes et al.,2009).
Shifts in land use patternsMajor forms of land use are forestry, pasture and agricultural land. In the past 40 years, important trends of land use change have been observed in Mali (Ruelland et al., 2010). Drivers for these land use changes are population growth that increases the demand of agricultural land, mainly at the expense of forest area and desertification which, in the Sahel region, is a particularly relevant problem (Olson et al., 2004). These processes therefore affect the size of forest land, agricultural land and desert land.
Agricultural land shows overall an increasing trend in Mali. Arable land has more than doubled in the period from 1990 to 2010 (FAOSTAT). The major driver for such an increase is population growth, as agricultural land increases to sustain rural population. On the contrary, forest land has decreased in Mali by about ten percent in the past 20 years (FAOSTAT), as the demand for more agricultural land exerted pressure on forest lands, and as a result of deforestation for firewood. Finally, pasture land has increased by about 15 percent, drawing primarily from marginal agriculture land.
It is highlighted by several institutions (UNCCD, 2010; WRI, 2010) that increasing temperature in the course of climate change will result in an increase in the desertification rate. We therefore assume that climate change will increase desertification as a consequence of less rainfall and increased extreme weather events (geist, 2005; Sivakumar, 2006). In this context, as climate change becomes more drastic, we assume that the deforestation will be accelerating, as pasture land and marginal agriculture land are increasingly affected by desertification and thus, pressure on forest land increases.
CC_FS_Mali_intPages_30.indd 9 13/11/12 15.02

10
P ot e n t i a l i m Pa c t s o f c l i m at e c h a n g e o n f o o d s e c u r i t y i n m a l i
In the T21 model, we consider four classes of drylands: hyper arid, arid, semi-arid and dry sub-humid (FAO, 2000). Based on Taylor et al. (2002) and Ruelland et al. (2010), we consider a realistic range of possible loss of productive land by 2050 because of desertification of: +/- two percent for arid drylands; +/- one percent for semi-arid drylands; and +/- 0.5 percent for subhumid drylands (with a normal distribution and a standard deviation of 0.5).
Shifts in cropping patternsBased on the anticipated changes in land use, we also derive changes in cropping patterns. The cropping pattern represents the relative share of land used for one of the major crops (cotton, rice, maize, sorghum, millet and other crops) that are included in our analysis. Due to the large climatic differences in Mali and the resulting differences in cropping pattern, we also assume that climate change will affect different regions in Mali in various manners. We expect that desertification will reduce cropland more in the Sahel region, where the major crops are millet and sorghum, than in other regions of Mali. Therefore, we assume a decrease of about ten percent in the share of land used for millet, sorghum and other minor crops. We then assume a corresponding increase in the share of land used for the remaining major crops grown in the rest of the country: cotton, rice and maize.
sensitivity analysis
the “base run” scenario
In order to establish a foundation for the development of alternative scenarios for our analysis, we first generate a reference scenario, which we call “Base Run”. In this scenario, we simulate the model until 2050 assuming that the future policy orientations and external conditions correspond to those that characterize the recent past, including no increase in temperature or changes in precipitation patterns. As a mean of model validation, we simulate the model starting in 1990 and compare the simulation results with the historical data available for a set of relevant indicators. In order to do so, we developed a comprehensive database, including records for more than 200 variables, over the period 1990-2005. The database is based on data from Mali’s National Statistical Office (DNSI-DNPD, 2005), supplemented with data from internationally accredited sources (UN, 2003; FAO, 2004; IMF, 2004a; IMF 2004b; IMF 2004c; WB,2007; EIA, 2008).
CC_FS_Mali_intPages_30.indd 10 13/11/12 15.02

11
P ot e n t i a l i m Pa c t s o f c l i m at e c h a n g e o n f o o d s e c u r i t y i n m a l i
The simulation results obtained for the major indicators for the period 1990 to 2008 are well in line with historical data as summarized in Table 1. Table 1 reports the Root Mean Square Percent Error (RMSPE), the Theil’s inequality statistics and the coefficient of determination (R2) resulting from the comparison of the Base Run with historical data for selected indicators. The RMSPE is an appropriate indicator of the goodness of fit of system dynamics models (Sterman, 1984), and its decomposition through Theil’s inequality statistics indicate the nature of the discrepancy between model results and data. In particular, Theil’s inequality statistics decompose the RMSPE into three components: its bias component (UM); its unequal variation component (US); and its unequal covariation component (UC).
table 1summary statistics for key indicators (comparison period: 1990-2008)
variable rmsPe u(m) u(s) u(c) r2
Real GDP at factor cost 0.068 0.175 0.138 0.687 0.972
Agriculture production 0.167 0.101 0.145 0.754 0.793
Average yield 0.119 0.028 0.560 0.411 0.756
Arable land 0.079 0.126 0.005 0.869 0.940
Pasture land 0.012 0.178 0.003 0.819 0.960
Forest land 0.013 0.422 0.224 0.353 0.957
Base Run projections for 2050 indicate a steadily growing population, although at a slightly decreasing rate in the long run. Total population reaches just above 29 million in 2050. Population growth is supported by sustained growth in gDP (on average 3.8 percent growth per year), as illustrated in Figure 2.
CC_FS_Mali_intPages_30.indd 11 13/11/12 15.02

12
P ot e n t i a l i m Pa c t s o f c l i m at e c h a n g e o n f o o d s e c u r i t y i n m a l i
figure 2base run results for agriculture production (top scale, red and blue lines); average yield (mid scale, grey and green lines); and gdP (bottom scale, orange and black lines), 1990 – 2050, from dnsi/wdi data and t21 simulation.
Agriculture production is set to increase up to nearly 1.5 trillion CFA 872 per year in 2050. It grows slower than total gDP, which accounts for a diminishing relevance of agriculture production as part of the total value added (about 22 percent in 2050, versus about 40 percent currently). Food crop production grows from the current 8.7 million tons up to 21 million tons in 2050. growth in food production is partially compensated by the rapid demographic growth: at per capita level, food production grows from the current 618 kg up to only 728 kg in 2050. growth in agriculture is primarily driven by the continuous growth in yield (average yield grows from the current 1.6 to about 2.8 ton/ha/year in 2050) and by the steady growth in arable land. The projected growth in average yield is especially fueled by growth in yield of rice (6.2 ton/ha in 2050, versus about 3.4 currently); and maize (3.7 ton/ha in
2 Cfa87 refers to the local currency (CFA - Communauté Financière Africaine) in real terms (base year 1987), which is adjusted for inflation. One US Dollar 2005 PPP corresponds to about 112 Cfa87.
1990 1996 2002 2008 2014 2020 2026 2032 2038 2044 2050
S e l e c t e d v a r i a b l e S
t i m e ( y e a r )
2e+0124
8e+012
1.5e+0123
6e+012
1e+0122
4e+012
500 B1
2e+012
000
Cfa87/YearTon/(Ha* Year)Cfa87/Year
Cfa87/YearTon/(Ha* Year)Cfa87/Year
Cfa87/YearTon/(Ha* Year)Cfa87/Year
Cfa87/YearTon/(Ha* Year)Cfa87/Year
Cfa87/YearTon/(Ha* Year)Cfa87/Year
Agriculture production: BaseAverage yield: BaseReal gdp at factor cost: Base
Cfa87/YearTon/(Ha* Year)
Cfa87/Year
Agriculture production: DataAverage yield: DataReal gdp at factor cost: Data
Cfa87/YearTon/(Ha* Year)
Cfa87/Year
CC_FS_Mali_intPages_30.indd 12 13/11/12 15.02
13
P ot e n t i a l i m Pa c t s o f c l i m at e c h a n g e o n f o o d s e c u r i t y i n m a l i
2050, versus 2.7 currently). growth is slower among the other major food crops: sorghum is projected to reach a yield of 1.2 ton/ha in 2050, versus a current value of about 1 ton/ha; while millet yield is substantially stagnating around 0.9 ton/ha. Such projections are in line with observed long-run (1961-2010) trends (FAOSTAT).
land use analysis highlights a highly dynamic outlook. Arable land (see Figure 3) is set to grow steadily up to about 9.3 million hectares in 2050, under the increasing demographic pressure. Pasture land is also subject to similar forces and reaches almost 38 million hectares in 2050. On the other hand, even assuming that over the next two decades deforestation for firewood and forestry is eliminated, forest land keeps on decreasing, mostly to support growth of arable and pasture land. Forest land decreases to about 7.5 million hectares in 2050, assuming that a rigid ceiling to deforestation will not be enforced.
figure 3base run results for arable land (red and blue lines); forest land (grey and green lines); and pasture (orange and black line), 1990 – 2050, from faostat data and t21 simulation.
S e l e c t e d v a r i a b l e S
mi
ll
io
n
h
ec
ta
re
S 40
30
20
10
01990 1996 2002 2008 2014 2020 2026 2032 2038 2044 2050
t i m e ( y e a r )
Total arable land: BaseTotal forest land: BaseTotal pasture land: Base
Total arable land: DataTotal forest land: DataTotal pasture land: Data
CC_FS_Mali_intPages_30.indd 13 13/11/12 15.02

14
P ot e n t i a l i m Pa c t s o f c l i m at e c h a n g e o n f o o d s e c u r i t y i n m a l i
In the process of model development, behavioral validation of the model was coupled with a structural validation process (Barlas, 1996) which included, in particular, a verification of the assumptions and parameters’ values included in the model with local experts from the various sectors portrayed in the model. For a full description of the validation process, see Pedercini (2009).
As discussed in section 2, based on the projections of IPCC, we run a sensitivity analysis considering the possible impact of climate change on yield, land availability, and land cropping patterns. Such scenarios do not include any specific public policy of adaptation, which will be discussed in section 4. The following sections report and discuss the results of the sensitivity analysis performed for selected indicators, focusing first on the impact of climate change on food production and availability, and then on access to food.
the impact of climate change on food production and availability
In this section, we examine the impact of climate change on food production and availability, including: impact of climate change on yield; impact of climate change on land use; impact of climate change on land allocation to crops. The combination of these three effects, factored in a complex agriculture system, leads to a series of relevant changes in agriculture production. We discuss results from sensitivity analysis, referring to either the width of the sensitivity range, or to the relative performance for a specific indicator in the worst and best cases by 2050 (i.e. those scenarios lying at the extremes of the sensitivity range). Recall we consider a possible variation of yields due to climate change of +/- 25 percent by 2050, and a loss of +/- two percent of arid drylands; +/- one percent of semi-arid drylands; and +/- 0.5 percent of subhumid drylands due to desertification for the sensitivity analysis. Results for such scenarios are compared to the Base Run and expressed in terms of percent difference. Figures are rounded to include decimals only when significant. Table 2 provides a comparison of results from the Base Run and the two most extreme scenarios for key indicators (CC-WORST and CC-BEST): such results are discussed in detail in the following paragraphs. Table 2 also includes results from our policy scenario, which is presented and discussed in detail in Section 4.
CC_FS_Mali_intPages_30.indd 14 13/11/12 15.02

15
P ot e n t i a l i m Pa c t s o f c l i m at e c h a n g e o n f o o d s e c u r i t y i n m a l i
table 2comparison of results from the difference scenarios for key indicators.
summary indicators
base run results result by 2050: % changes compared to base run
Current (2010)
Final (2050)
CC-WORST CC-BEST R&D Adaptation
Total population (Million) 13 29.27 -1.0% 0.0% 0.0%
GDP (Trillion Cfa87/Year) 1.6 6.7 -5.5% 5.0% -0.6%
Agriculture production (Million Cfa87/Year)
640 1500 -16.0% 15.0% -2.0%
food crops production (Million Ton)
8 21 -23.9% 22.5% -3.0%
PC food crops production (Kg/Person/Year)
618 728 -23.0% 22.5% -4.0%
PC food crops production (Kg/Person/Year)
618 728 -23.0% 22.5% -4.0%
Average yield (Ton/Ha/Year) 1.6 2.8 -23.6% 22.4% -3.0%
Arable land (Million Ha) 6.2 9.3 0.0% 0.0% 0.0%
Forest land (Million Ha) 12.2 7.5 -4.0% 4.5% -4.0%
Rural population below poverty line (%)
62.5% 42.0% 16.5% -14.0% 2.0%
Rural population below poverty line (Million)
5.41 6.74 15.4% -13.8% 2.0%
Life expectancy (Year) 55 74.5 -3.0% 0.5% 0.0%
yields
base run results result by 2050: absolute values (ton/ha/year)
Current (2010)
Final (2050)
CC-WORST CC-BEST R&D Adaptation
Rice yield 3.4 6.2 4.6 7.8 5.8
Maize yield 2.7 3.7 2.7 4.7 3.4
Sorghum yield 1.0 1.2 0.9 1.5 1.1
Millet yield 0.9 0.9 0.7 1.1 0.8
CC_FS_Mali_intPages_30.indd 15 13/11/12 15.02

16
P ot e n t i a l i m Pa c t s o f c l i m at e c h a n g e o n f o o d s e c u r i t y i n m a l i
In the following paragraphs, we present results for a series of indicators, starting from yield, which illustrate how the direct impact of climate change on yield spreads through the entire socio-economic-environmental system. The diagram in Figure 4 provides a simplified representation of the major feedback structures involving yield in the T21 model. Far from covering all relevant causal structures in the model, the diagram shows how changes in yield lead to changes in production (both in volume and value) and eventually to changes in gDP. Changes in gDP impact on households income and poverty (differently in urban and rural areas) and on the amount of resources available to the government. In turn, households income affect private investment and government revenues affect public investment. Private and public investments affect the amount resources available for production, thus affecting yield in return. The extent to which the initial direct impact of climate change on yield propagates through these various channels varies over time - and is discussed in detail below.
figure 4simplified causal diagram of major feedback structures involving yield in t21.
direct imPact of climate change
harvested area
forest land
croP Production value added
croP Production in tons
livestock production value added
forestry production value added
fishery production value added
agriculture Production value added
services production value added
industry production value added
yield
gross domestic Product
government revenue
income and Poverty
Public investmentPrivate investment
human caPital
infrastructure
agriculture caPital
r & d caPital
CC_FS_Mali_intPages_30.indd 16 13/11/12 15.02

17
P ot e n t i a l i m Pa c t s o f c l i m at e c h a n g e o n f o o d s e c u r i t y i n m a l i
Figure 5 illustrates sensitivity results for average yield in Mali (in ton/ha) for the period 1990-2050. The historical data are represented by a red line and sensitivity ranges by different shades of blue (each shade of blue represents an additional 12.5 percent probability distribution range). The same formatting is used for the other graphs of this section.
figure 5sensitivity results for average yield (ton/ha) in mali 1990 – 2050.
Results indicate that the combination of effects of climate change on agriculture considered, lead in the worst case to a decrease in yield of 23.6 percent by 2050 with respect to the Base Run projection, and to an increase of 22.4 percent in the best case. These changes in performance are slightly smaller than the direct effect of climate change on yield considered (+/- 25 percent), as a result of combined forces. On one hand, variation in average yield is partially offseted by contraction/expansion of marginal lands, which have lower productivity than average. On the other hand, the direct effect of climate change on yield feeds back, through changes in production and investment, to affect yield in the long run (Figure 4). The impact on yield on the positive and negative side is not perfectly symmetric, since many resources relevant to yield (e.g. harvested area, water availability, etc.) exhibit diminishing returns.
13% 25% 38% 50% 63% 75% 88% 100%
Sensitivity Data
a v e r a g e y i e l d4
3
2
1
01990 2005 2020 2035 2050
t i m e ( y e a r )
CC_FS_Mali_intPages_30.indd 17 13/11/12 15.02
18
P ot e n t i a l i m Pa c t s o f c l i m at e c h a n g e o n f o o d s e c u r i t y i n m a l i
Similar variability is observed for agriculture food crops production in tons (-23.9 percent in the worst case, + 22.5 percent in the best case). Changes in crops production in tons reflect changes in yield and harvested area, which is affected by desertification. We assume that, while a proportion of arable and pasture land deteriorates more rapidly under unfavorable climate change conditions, additional arable and pasture land can be drawn from forest land. Therefore, desertification as a result of climate change does not impact on agriculture production significantly, with respect to the large impact of yield change, as long as forest land is allowed conversion. The total effects on crops production are relevant, with a decrease of food production by 2050 of 5.1 million ton in the worst case scenario with respect to the Base Run projection (and an increase of 4.8 million ton in the best case scenario).
At the per capita level, the loss projected in the worst case scenario by 2050 is worth 170 kg of food per person with respect to the Base Run scenario, as illustrated in Figure 6. In such scenario, the negative effect of CC on per capita food crop
figure 6sensitivity results for per capita agriculture production (ton/person/year) in mali 1990 – 2050.
13% 25% 38% 50% 63% 75% 88% 100%
Sensitivity
p e r c a p i t a a g r i c u l t u r a l f o o d p r o d u c t i o n i n t o n1
0.75
0.5
0.25
01990 2005 2020 2035 2050
t i m e ( y e a r )
CC_FS_Mali_intPages_30.indd 18 13/11/12 15.02

19
P ot e n t i a l i m Pa c t s o f c l i m at e c h a n g e o n f o o d s e c u r i t y i n m a l i
production entirely offsets the underlying positive growth trend that is driven by technological improvement and by the expansion of arable land. As a result, in the worst case scenario per capita food crop production in 2050 (559 kg/person/year) is lower than the current level (618 kg/Person/year).
Variation in total agriculture production is offseted by an overall stable performance of livestock, fish and forestry production (Figure 7). Sensitivity results are distributed in a range of -16 percent (worst case) and +15 percent (best case), a significantly smaller range than the one observed for crops production. These results depend on our assumption that livestock production is only moderately affected by climate change: although worsening climate will likely affect productivity of marginal pasture lands, we consider that part of less productive arable land will be abandoned from cropping for conversion into pasture, compensating such decrease in productivity. We also consider that by 2050, livestock production will be more technology-intensive and thus, depend less directly on the productivity of pasture land.
figure 7sensitivity results for agriculture production (real local currency/year) in mali 1990 – 2050.
13% 25% 38% 50% 63% 75% 88% 100%
Sensitivity Data
a g r i c u l t u r e p r o d u c t i o n2e+012
1.5e+012
1e+012
500 B
01990 2005 2020 2035 2050
t i m e ( y e a r )
CC_FS_Mali_intPages_30.indd 19 13/11/12 15.02

20
P ot e n t i a l i m Pa c t s o f c l i m at e c h a n g e o n f o o d s e c u r i t y i n m a l i
the broader impact of climate change on the socio-economic system and on access to food
In order to assess the impact of the slower growth of agriculture production projected in our worst case scenario on the broader socio-economic system and on access to food, we present sensitivity results for gDP along with other selected socio-economic indicators, with special emphasis on the simulated poverty levels for rural households.
As discussed when presenting results for the Base Run, agriculture gradually becomes a less relevant sector for Mali’s economy and thus, even in the most extreme cases considered, the expected change in agriculture production affects gDP as a whole in a moderate way; about –5.5 percent and +5 percent in 2050, in the worst and best case scenarios, respectively. As a result, investment in agriculture is also expected to change to a similar extent (-5.5 percent and +5 percent in 2050). Investment in infrastructure is also affected and the expected change in roads density per hectare of agriculture land is about +/- two percent. On the social side, changes in gDP growth are reflected in changes in pace of human development: on one hand, progresses in education are driven by strong inertia and thus, are not substantially affected by the limited changes in public investment; on the other hand, life expectancy is projected to decrease by about 2 years in 2050 in the worst case scenario with respect to the Base Run (72.5 years instead of 74.5), as a result of lower nutrition levels. In the best case scenario, life expectancy is set to increase by only 0.3 years with respect to the Base Run, as a result of the diminishing returns associated with higher nutrition levels. In turn, the described changes in investment, infrastructure and health influence productivity and thus, affect yield in the long-run.
The impact of the projected changes in yield on socio-economic development is larger when considering specifically the population living in rural areas. It is expected that by 2050, a large share of population will still live in rural areas (55 percent) and be mostly supported by agriculture activities. This implies that the income of rural households will be affected significantly by the projected change in agriculture production. Figure 8 illustrates sensitivity results obtained for the proportion of population living in poverty in rural areas. The range of distribution is important and the observed reduction in income affects especially the poorest households: the proportion of population below the poverty line by 2050 is 16.5 percent higher (or roughly +7 percentage points) in the worst case, and 14 percent smaller in the best case. Considering the size of the population living in rural areas, this implies in the worst case scenario about 1 130 000 additional people living below poverty line in 2050 with respect to our Base Run.
CC_FS_Mali_intPages_30.indd 20 13/11/12 15.02

21
P ot e n t i a l i m Pa c t s o f c l i m at e c h a n g e o n f o o d s e c u r i t y i n m a l i
figure 8sensitivity results for proportion of population living below the poverty line (dimensionless) in mali 1990 – 2050.
Model results also indicate that the per capita gDP and the other key human development indicators for the whole population (such as literacy rates and life expectancy) are not substantially affected by climate change through changes in agriculture production. This is due to the fact that the overall economic resources available to the population also include value added from the rapidly growing industry and services sectors. These results are in line with the findings of Schmidhuber & Tubiello (2007). According to them “it is likely that the magnitude of these climate impacts will be small compared with the impact of socio-economic development.” They argue that “economic growth and a decline in population growth projected for the 21st century will, in all but the A2 [scenario], significantly reduce the number of people at risk of hunger in 2080.” The picture changes when we look at the rural
13% 25% 38% 50% 63% 75% 88% 100%
Sensitivity Data
S h a r e o f p o p u l a t i o n b e l o w p o v e r t y l i n e [ r u r a l ]1
0.75
0.5
0.25
01990 2005 2020 2035 2050
t i m e ( y e a r )
CC_FS_Mali_intPages_30.indd 21 13/11/12 15.02

22
P ot e n t i a l i m Pa c t s o f c l i m at e c h a n g e o n f o o d s e c u r i t y i n m a l i
population that is supported by agriculture. In our Base Run, a large share of the total labor force is expected to be still employed in the agriculture sector by 2050. In our climate change scenarios, as a result of more limited resources available for agriculture production, the income of rural households is significantly reduced. This implies that living conditions in the rural areas deteriorate significantly, compromising access to food.
Finally, the land area covered with forest is another key variable that affects the quality of life of many in rural areas. As illustrated in Figure 3, in the Base Run forestland exhibits a downwards trend over time (1990-2050). This already unfavorable development is further strengthened by climate change: due to increasing desertification, more pressure is put on forestland, set to decrease slightly faster in the worst case scenario, reaching a level about 320,000 hectares lower than in the Base Run (Figure 9). Interestingly, the impact of climate change on forest cover is not linear: it is relatively small up to about 2030, and then increasingly large. This is due to the fact that initial losses of arable and pasture land due to desertification are partially compensated by the stock of unused land available. Towards 2030, that stock is almost exhausted, and then a larger share of land is drawn from forest.
Forest land is a fundamental resource for rural population as a source of habitat, animal, and vegetal food. The reduction in forest cover observed in the worst case scenario is thus expected to negatively impact on the living conditions of rural households. Deforestation is also negatively affecting biodiversity (USAID, 2008) and the loss of forestland could further increase the speed of desertification (Taylor et al., 2002), posing a threat to agriculture in the longer run. Whether such accelerated deforestation will be allowed by the authorities or an attempt to control it will be put in place, will fundamentally affect how climate change will impact on rural households: either through a stronger decrease in agriculture production, or through a decrease in forest land. given the potentially dramatic effects of deforestation on long-run sustainability, in the following section we will not assess additional forest loss as a policy option to counter the negative effects of climate change.
CC_FS_Mali_intPages_30.indd 22 13/11/12 15.02

23
P ot e n t i a l i m Pa c t s o f c l i m at e c h a n g e o n f o o d s e c u r i t y i n m a l i
figure 9sensitivity results for forest land (million hectare) in mali 1990 – 2050.
In summary, in our worst case scenario, the combination of slower growth in food production – leading to a decrease in food production at per capita level with respect to current values – coupled with slower reduction in rural poverty and more intensive deforestation than in the Base Run, may have a major impact on access to food at the rural level. Additional adaptive measures need to be taken to deal with such negative effects of climate change. The next section provides an example of such measures and discusses associated costs and benefits.
13% 25% 38% 50% 63% 75% 88% 100%
Sensitivity Data
t o t a l f o r e S t l a n d20 M
16.5
13 M
9.5 M
6 M1990 2005 2020 2035 2050
t i m e ( y e a r )
CC_FS_Mali_intPages_30.indd 23 13/11/12 15.02
24
P ot e n t i a l i m Pa c t s o f c l i m at e c h a n g e o n f o o d s e c u r i t y i n m a l i
Policy analysis
description of policy scenario
In the previous sections, we have assessed the impact of climate change on food availability and access to food, while this section focuses on adaptation strategies. In the literature on adaptation to climate change, we find several policy recommendations that relate to the factors that we consider in this study (FAO, 2007; IPCC, 2000). let us consider a policy focusing on stimulating investments into agriculture R&D, which is a commonly suggested policy for adaptation to climate change (FAO, 2007; IPCC, 2000).
The potential to improve yields in Mali by improved practices and improved inputs is great (World Bank, 2008; Kouyaté et al., 2000; govt. of Mali, 2009). Agricultural productivity in SSA and also Mali is lagging behind (World Bank, 2008) and climate change urges Mali to take action in order to offset potential negative effects and not threaten the positive development of the economy that we observe in the base case.
Better agricultural practices enhance yield per hectare but can also have indirect effects on other issues that Mali has to tackle in the course of climate change. The most important of such issue is desertification with its significant impact on agricultural production. Better farm inputs and thus higher productivity reduce over-intensive use of land in general and marginal land in particular, which is especially vulnerable to desertification. In addition, sustainable agriculture practices may reduce over-utilization of natural resources and thus, increase land’s productive life. Desertification can therefore be reduced by better agricultural practices that enhance productivity. Box 2 provides an overview of relevant improvements that can be achieved, both in terms of agricultural practices and inputs.
CC_FS_Mali_intPages_30.indd 24 13/11/12 15.02

25
P ot e n t i a l i m Pa c t s o f c l i m at e c h a n g e o n f o o d s e c u r i t y i n m a l i
box 2improvements in agricultural practices and inputs.
Agricultural practices and inputs: cultural practices and inputs:
° Increase soil organic matter by way of organic fertilizers, that also contribute to carbon sequestration, with a mitigating effect on CC. Additionally, organic soil management practices will also improve water drainage and moisture retention capacity, thus having positive impacts on water and land productivity (Rockstrom et al., 2007).
° Improve seed production systems, to increase seed variety and ensure rapid access of farmers to varieties adapted to their new agro-ecological conditions (FAO, 2010).
° Improve soil fertility management (maintain the long-term productivity) and integrated pest management and improvement of locally-adapted agrobiodiversity (Pretty et al., 2006), to improve yields while reducing GHG emissions.
° Raise water-use efficiencies through integrated water management, reducing water losses in both irrigation and rain-fed schemes, and increasing sustainability (World Bank, 2008).
° Improve agricultural land management, including conservation tillage, rotations, agro-forestry, integrated plant-animal systems and rehabilitation of degraded crop and pasture land. Such practices can improve soil productivity (Mrabet and El Brahli, 2005), cut emissions and preserve biodiversity while providing diversified commodities.
° Increase green farm biodiversity, enabling them to better respond to change and reduce risk. The use of intra- and inter-species diversity, among genetically different crops or livestock and fisheries systems, serves as an insurance against future environmental changes by increasing the system’s resilience (Ensor, 2009).
° Adoption of crop and livestock diversification strategies for protecting farm biodiversity and achieving sustainable agricultural productivity. Effective diversification practices that match with location-specific agro-climate conditions and create balanced cycles can improve economic returns (FAO, 2010).
CC_FS_Mali_intPages_30.indd 25 13/11/12 15.02

26
P ot e n t i a l i m Pa c t s o f c l i m at e c h a n g e o n f o o d s e c u r i t y i n m a l i
In order to stimulate investment in better agricultural practices, we consider an increase in the country’s investment in agriculture research and development (R&D). The practical implementation of such a policy in Mali might not be simple and the associated costs may be decisive. Investment into agriculture R&D in Mali has been stagnating during the past 20 years and especially subsistence crops have received little attention (ASTI-CgIAR). In an ideal setting, agriculture R&D would normally be carried out by public sector organizations, as well as by private sector companies, these processes complementing each other. However, in Mali there are currently no private for profit actors conducting R&D (ASTI-CgIAR), which leaves R&D a task of the public sector.
The short-term approach would then be to invest more into public agricultural R&D. Although Mali is already above Sub-Saharan average in R&D investment, Mali only invests about a tenth of what a country such as South Africa does (ASTI-CgIAR). Even in latin America, there is on average three times as much investment per researcher as there is in Mali (Pardey, ASTI-CgIAR). Investment in agriculture is a priority for the government (farmers account for about 80 percent of the country’s workforce (FAO, 2004), but public sector expenses in agricultural R&D have oscillated over time around USD25 million (USD 2005 PPP3) per year (ASTI-CgIAR). Our policy analysis focuses on identifying the additional amount of investment in agriculture R&D necessary to overcome the negative impact of climate change on agriculture production.
The timing of such increase in investment is very important, since it can take decades before return on investment in R&D materializes (Alston et al., 1998a). For example, if we consider investment in variety development, this costs between USD50 000 and USD1.5 million per variety per year and it can take 5 to 15 years before it yields results, depending on the crop and on the technology used. For Mali, considering the relatively small budget that is invested into crop improvement, it is likely that the delays in crop breeding will be rather longer then shorter. This means that there are only about two breeding cycles left for crop improvement before 2030, when impacts of climate change are projected to worsen. This emphasizes the point that increases in investment in R&D need to be rapid and substantial in order to have a relevant impact on agriculture output on time. We assume for our policy scenarios that it takes 10 years on average for the increase in budget for crop improvements to affect yield; and that increase in investment happens gradually over a 5 years period, to avoid absorption capacity constraints.
In the long run, private sector activity should be stimulated by creating the right regulatory and legal environment for investments. One constraint to private R&D investment is a weak investment climate for private investors generally, primarily due to corruption, weak infrastructure, strong regulatory constraints and factor market issues (World Bank, 2005). For smallholders, access to improved technologies is especially difficult because of risks, credit constraints, and poor access to information.
3 Purchasing Power Parity (PPP)
CC_FS_Mali_intPages_30.indd 26 13/11/12 15.02
27
P ot e n t i a l i m Pa c t s o f c l i m at e c h a n g e o n f o o d s e c u r i t y i n m a l i
Another constraint is that production systems and technologies in much of the developing world make it difficult to enforce IPRs. Added to these constraints are restrictions on private sector imports of technologies and high regulatory barriers to the release of new technologies, such as the varieties developed by the private sector (World Bank, 2008). We thus also assume in our policy scenarios that policies that aim at creating the right legal frameworks and decrease regulatory obstacles are put in place in order to increase supply of improved agricultural inputs for farmers, and also attract foreign direct investment in the agricultural sector as well as stimulates local private companies to emerge.
It is especially difficult to quantify the direct beneficial effects of the proposed policies on yield and desertification, especially due to the inherent uncertainties in R&D activities. Results from our policy analysis are inherently dependent on our assumptions regarding return on investment in agriculture R&D and knowledge stock depreciation. Based on Alston et al. (1998b), we consider an average return on public R&D investment of about 30 percent per year. Also, in line with Chavas and Cox (1992), we consider an overall average life of R&D knowledge stock of 35 years (10 years of gestation and a third order depreciation process over the following 25 years). The next section presents and discusses results obtained from our policy analysis.
Policy simulation results and discussion
Using as reference the worst case scenario (CC-WORST), through iterative exploration of different levels of investment in R&D we identify the amount of investment necessary to counter the negative effects of climate change on agriculture productivity. The proposed intervention consists of a gradual increase of the level of investment in agriculture R&D from about USD25 million (USD 2005 PPP) to about USD295 million in 2017. Such level of investment, similar to the level of public agriculture R&D in South Africa in 2008 (ASTI-CgIAR), is then kept constant until 2050. Compared to the projected gDP of Mali in 2017, such amount corresponds to 1.35 percent of gDP and decreases to 0.45 percent of gDP by 2050. We label such scenario as our R&D-Adaptation scenario: results for per capita food crop production are illustrated in Figure 10 (green line).
Results from this scenario show a substantial improvement compared to the CC-WORST scenario (red line in Figure 10), and even compared to the Base Run (blue line in Figure 10) for some periods. Performance for per capita food crop production is steady, but shows periods of slow growth, rapid growth, and then decline. This is due to the several factors at play in this scenario. In the first years of the proposed policy being implemented, up to 2015, policy impacts are negligible, due to the assumed gestational lags. At the same time, climate change begins to gradually reduce yield and as a consequence, food production declines along the projection
CC_FS_Mali_intPages_30.indd 27 13/11/12 15.02

28
P ot e n t i a l i m Pa c t s o f c l i m at e c h a n g e o n f o o d s e c u r i t y i n m a l i
obtained in the CC-WORST scenario. From 2016, implemented R&D investment start becoming productive, leading to growth in yield and in food production, which by 2020 is higher than in the Base Run. growth in yield slows down as the flow of investment in R&D stabilizes and the effect of climate change becomes more severe, after 2030. Eventually, yield and crop production in the R&D-Adaptation scenario fall below the level observed in the Base Run, but they are very similar on average on the overall period.
The net result of the R&D-Adaptation scenario in terms of food production is very similar to that of the Base Run and thus, entirely compensates the losses in production due to climate change. In addition, investment in agriculture R&D also affects productivity of non-food crops (primarily cotton). The impact of climate change on poverty is also compensated by the proposed intervention and rural poverty level in our R&D-Adaptation scenario decreases along the lines observed in the base case. Therefore, beyond the benefits in terms of value added, this scenario would also bring about substantial benefits in terms of food production and income for rural farmers, with an important positive impact on food security. Such positive impact would not be exhausted in 2050, but on the contrary the benefits of investments carried out through this period will also be relevant in the longer run.
Overall, we believe that policies directed at facilitating investment in agriculture R&D, both in the public and private sector, would be important for long-term development of agriculture. The analysis carried out indicates that a very large increase in investment in agriculture R&D would be necessary to entirely compensate for the adverse effect of climate change on productivity as in our worst case scenario. Increasing investment to USD295 million per year is a significant economic effort considering the current size of Mali’s agriculture sector - and it might be difficult to mobilize the necessary resources internally. However, the entire amount would be necessary only (i) in our worst case scenario, and (ii) assuming that adaptation to climate change in agriculture would be sought only through investment in R&D.
Regarding the first point, the uncertainty in climate projections for the Sahel region suggest caution in estimating the extent of the possible adverse effects for agriculture. As our sensitivity analysis illustrates, the implication of climate change in the country could also be positive. Nevertheless, independently on the actual intensity and direction of climate change, investment in agriculture R&D can be an important engine for growth in productivity, especially in an economy where the agriculture sector has a fundamental importance, such as Mali. Regarding the second point, the simulated policies consider investment in agriculture R&D in isolation from other possible adaptation policies, for the sake of properly estimating the impact of such intervention. In reality, it is to be envisioned that investment in agriculture R&D would be one important component of a broader, integrated adaptation policy package.
CC_FS_Mali_intPages_30.indd 28 13/11/12 15.02

29
P ot e n t i a l i m Pa c t s o f c l i m at e c h a n g e o n f o o d s e c u r i t y i n m a l i
In summary, large-scale investment in agriculture R&D in Mali seems coherent under the precautionary approach (UN, 1992). Investment in R&D would need to grow to up to USD295 million per year in our worst case scenario, and assuming that the impact of climate change on agriculture is entirely compensated by increase in R&D investment only. However, benefits from investment in R&D are expected to be small in the short run due to delays inherent in R&D activities, and to the fact that the impact of climate change is expected to be especially severe after 2030. These delays could discourage investment by the private sector (under pressure for short-term profit) and also by the public sector (under pressure for short-term development performance). The large amount of resources to be mobilized and the lack of short-term return on investment suggest that external financial support for such investment might be especially important.
figure 10Policy simulation results for forest land (million hectare) in mali 1990 – 2050.
p e r c a p i t a a g r i c u l t u r a l f o o d p r o d u c t i o n i n t o n
1990 1996 2002 2008 2014 2020 2026 2032 2038 2044 2050
t i m e ( y e a r )
to
n/
pe
rS
on
/y
ea
r
0.8
0.6
0.4
0.2
0
Per capita agricultural food production in ton: BasePer capita agricultural food production in ton: CC-WORSTPer capita agricultural food production in ton: R&D-Adaptation
CC_FS_Mali_intPages_30.indd 29 13/11/12 15.02

30
P ot e n t i a l i m Pa c t s o f c l i m at e c h a n g e o n f o o d s e c u r i t y i n m a l i
conclusion
Our systemic analysis illustrates that, in order to understand the full range of implications that this phenomenon has for food security it is important to consider the linkages between expected direct impacts of climate change on agriculture production and the broader socio-economic and environmental processes. Concerning agriculture production, our sensitivity analysis indicates that the response of average yield to climate change is partially counteracted by the contraction/expansion of marginal lands, which have lower productivity than average. Increased desertification only marginally affects agriculture production, as more arable and pasture land is drawn from the forest stock. The loss of value-added from agriculture production due to climate change is expected by 2050 as high as 16 percent in our worst case scenario.
The effect on the overall socio-economic development in our worst case scenario is projected to be moderate: when considering impacts on average for the overall country, we observe small impacts on gDP growth, moderate impacts on life expectancy and negligible impacts on education. In terms of income generation for the average household, economic development in the industry and services sectors is prospering and can outgrow the importance of the agricultural sector. However, when focusing on rural areas, in our worst case scenario the population sustained by agriculture production encounters reduced live standards and an additional 1 130 000 people in rural areas fall below the poverty line by 2050. The combination of a reduction in food production and income for the rural population indicate that the impact of climate change on this share of the population might thus be severe.
Measures must be taken to reduce the impact of climate change on rural farmers. We simulate a policy focusing on investments into agriculture R&D, which is a commonly suggested policy for mitigating impacts of climate change. Results indicate that an increase of such investment to about USD295 million per year would be sufficient to compensate the negative effects of climate change on agriculture, in our worst case scenario and assuming no other adaptation policies are implemented. Climate projections in the region are highly uncertain, but investment in agriculture R&D is greatly needed in the country and would benefit agriculture in all cases, making it a reasonable policy option under the precautionary approach, as part of an integrated adaptation policy package. However, the large amount of resources to be mobilized and the small benefits expected in the short-run, suggest that external financial support may be initially needed to undertake such investments.
CC_FS_Mali_intPages_30.indd 30 13/11/12 15.02

31
P ot e n t i a l i m Pa c t s o f c l i m at e c h a n g e o n f o o d s e c u r i t y i n m a l i
gathering more precise data about the inter-relatedness of climate change, yield, and desertification will improve our estimates. Our analysis would also benefit from further disaggregation to account for regional changes in land use that will affect specific income cohorts of the population. In addition, the model boundaries could be expanded to take into consideration additional indirect effects of climate change on food security: for example the current model does not consider changes in infectious disease burden (e.g. malaria) due to climate change. Adding these elements to the analysis will bring further precision to the actual results and the estimated adaptive potential of Mali.
Finally, we believe that our approach complements well the existing approaches to assess climate change, enhancing the awareness of policy makers of the constraints to the country’s adaptive potential. Further research is required in Mali and other countries in the region to improve this approach and test it in other settings.
CC_FS_Mali_intPages_30.indd 31 13/11/12 15.02

32
P ot e n t i a l i m Pa c t s o f c l i m at e c h a n g e o n f o o d s e c u r i t y i n m a l i
references
Alston, J. M., Craig, B. & Pardey, P. 1998a Dynamics in the creation and depreciation of knowledge, and the returns to research. EPTD discussion paper No. 35, International Food Policy Research institute, Washington, D.C.
Alston, J. M., Marra M.C., Pardey, P. & Wyatt, T.J. 1998b Research returns redux: a meta-analysis of the return to agricultural R&D. EPTD discussion paper No. 38, International Food Policy Research institute, Washington, D.C.
ASTI-CGIAR. Undated. Agricultural Science and Technology Indicators - Consultative group on International Agricultural Research. Available at http://www.asti.cgiar.org/data (last accessed on November 2010).
Barney, G. O. 2002. The global 2000 Report to the President and the Threshold 21 model: influences of Dana Meadows and system dynamics. System Dynamics Review, 18(2): 123-136.
Barlas, Y. 1996. Formal Aspects of Model Validity and Validation in System Dynamics. System Dynamics Review. 12(3): p. 183-210.
Bassi, A.M., Tan Z., Ansah, J.P. & Pedercini, M. 2011. Modeling global green Investment Scenarios. Supporting the Transition to a global green Economy. In Towards a Green Economy: Pathways to Sustainable Development and Poverty Eradication, UNEP, February 2011, Nairobi, Kenya.
BCFN. 2011. New models for sustainable agriculture. Barilla Center for Food and Nutrition, Parma, Italy.
Birdsall, N. 1988. Economic Approaches to Population growth. In T.N.S. H. Chenery, Editor, Handbook of Development Economics. Elsevier Science Publishers B.V. Amsterdam. p. 478-542.
Butt, T.A., McCarl, B.A., Angerer, J., Dyke, P.T. & Stuth, J.W. 2005. The Economic and Food Security Implications of Climate Change in Mali. Climate Change, 68: 355-378.
Calderón, C. & Servén. L. 2004. The Effects of Infrastructure Development on growth and Income Distribution. World Bank Working Paper. World Bank, Washington, D.C.
Chavas, J.P. & Cox, T.L. 1992. A nonparametric analysis of the influence of research on agricultural productivity. American Journal of Agricultural Economics, Vol. 74, No. 3.
Coale, A.J. & Demeny P. 1983. Regional Model Life Tables and Stable Population. Second ed. Academic Press, New york.
Cobb, C.W. & Douglas, P.H. 1928. A Theory of Production. The American Economic Review, 18(1): p. 139-165.
CC_FS_Mali_intPages_30.indd 32 13/11/12 15.02

33
P ot e n t i a l i m Pa c t s o f c l i m at e c h a n g e o n f o o d s e c u r i t y i n m a l i
DNSI-DNPD. 2005. Rapport sur la Situation Economique et Sociale du Mali en 2005 et Perspectives pour 2006. Direction Nationale de la Statistique et de l’Informatique - Direction Nationale de la Planification du Developpement (DNSI-DNPD), gouvernement du Mali.
EIA. Undated Country analysis brief. Energy Information Administration (EIA) Available at http://www.eia.gov/countries/country-data.cfm?fips=Ml&trk=m. last accessed October 2010.
Ensor, J. 2009. Biodiverse agriculture for a changing climate, Practical Action Publishing, Rugby, UK. Available at www.practicalaction.org.
Essama-Nssah, B. 2005. The Poverty and Distributional Impact of Macroeconomic Shocks and Policies: A Review of Modeling Approaches, in World Bank Policy Research Working Paper No. 3682. World Bank: Washington D.C.
FAO. 2000. Land resources and potential constraints at regional and country levels. Food and Agriculture Organization of the United Nations (FAO), Rome.
FAO. 2002. The State of Food Insecurity in the World 2001. Food and Agriculture Organization of the United Nations (FAO), Rome.
FAO. 2006. FAOSTAT country profiles. Available at http://faostat.fao.org/site/666/default.aspx, last accessed on October 2010. Food and Agriculture Organization of the United Nations (FAO), Rome.
FAO. 2007. Adaptation to climate change in agriculture, forestry and fisheries: Perspective, framework and priorities. Food and Agriculture Organization of the United Nations (FAO), Rome.
FAO. 2010. Climate-Smart Agriculture – Policies, Practices, and Financing for Food Security, Adaptation, and Mitigation. Food and Agriculture Organization of the United Nations (FAO), Rome.
FAOSTAT, online database. Available at http://faostat.fao.org/default.aspx (last accessed May 2012).
Geist, H. 2005, The Causes and Progression of Desertification. Ashgate. Belgium.
Gommes, R., El Hairech, T., Rosillon, D., Balaghi, R. & Kanamaru, H. 2009. Impacts of Climate Change on Agriculture in Morocco. World Bank – FAO.
Government of Mali. 2009. National strategy for the development of rice growing. Ministry of Agriculture, Bamako, Mali.
Huntingford, C., Lambert, F.H., Gash, J.H.C., Taylor, C.M. & Challinor, A.J. 2005. Aspects of climate change prediction relevant to crop productivity. Philos. T. Roy. Soc. B, 360, 1999-2009.
CC_FS_Mali_intPages_30.indd 33 13/11/12 15.02

34
P ot e n t i a l i m Pa c t s o f c l i m at e c h a n g e o n f o o d s e c u r i t y i n m a l i
IMF. 2004a. International Financial Statistics yearbook 2004. International Monetary Fund (IMF). Washington D.C.
IMF. 2004b. government Finance Statistics yearbook 2004. International Monetary Fund (IMF). Washington D.C.
IMF. 2004c. Balance of Payments Statistics yearbook 2004. International Monetary Fund (IMF). Washington D.C.
IPCC. 2000. Summary for policymakers, Emission scenarios, a Special Report of Working Group III. UNEP and WMO, geneva.
IPCC. 2007a. Christensen, J.H., Hewitson, B., Busuioc, A., Chen, A., gao, x., Held, I., Jones, R., Kolli, R.K., Kwon, W.-T., laprise, R., Magaña Rueda, V., Mearns, l., Menéndez, C.g., Räisänen, J., Rinke, A., Sarr, A. & Whetton, P. Regional Climate Projections. In Climate Change 2007: The Physical Science Basis. Contribution of Working Group I to the Fourth Assessment Report of the Intergovernmental Panel on Climate Change. Solomon, S., Qin, D., Manning, M., Chen, Z., Marquis, M., Averyt, K.B., Tignor, M. & Miller, H.l. (eds.). Cambridge University Press, Cambridge, United Kingdom and New york, Ny, USA.
IPCC. 2007b. Easterling, W.E., Aggarwal, P.K., Batima, P., Brander, K.M., Erda, l., Howden, S.M., Kirilenko, A., Morton, J., Soussana, J.-F., Schmidhuber, J. & Tubiello, F.N. Food, fibre and forest products. In Climate Change 2007: Impacts, Adaptation and Vulnerability. Contribution of Working Group II to the Fourth Assessment Report of the Intergovernmental Panel on Climate Change, Parry, M.l., Canziani, O.F., Palutikof, J.P., van der linden, P.J. & Hanson, C.E. (eds.), Cambridge University Press, Cambridge, UK, 273-313.
Keane J., Page S., Kergna A., Kennan J. 2009. An Overview of Expected Impacts, Adaptation and Mitigation Challenges, and Funding Requirements, Issue Brief No. 2, Overseas Development Institute.
Kouyaté, Z., Franzleubbers, K., Juo, A.S.R. & Hossner, L.R. 2000. Tillage, crop residue, legume rotation, and green manure effects on sorghum and millet yields in the semiarid tropics of Mali. Plant and Soil 255, 141-151.
Ludi, E. 2009. Climate change, water and food security. ODI Background Note, ODI, london.
Monfreda, C., Wackernagel, M. & Deumling, D. 2004. Establishing national natural capital accounts based on detailed Ecological Footprint and biological capacity assessments. land Use Policy, 21: p. 231-246.
Mrabet, R. & El Brahli, A. 2001. Soil and Crop Productivity under Contrasting Tillage Management Systems in Semiarid Morocco.
Nellemann, C., MacDevette, M., Manders, T., Eickhout, B., Svihus, B., Prins A. & Kaltenborn, B. 2009. The Environmental Food Crisis. The environment’s role in averting future food crises. A UNEP rapid response assessment. Arendal, UNDP.
CC_FS_Mali_intPages_30.indd 34 13/11/12 15.02

35
P ot e n t i a l i m Pa c t s o f c l i m at e c h a n g e o n f o o d s e c u r i t y i n m a l i
Nelson, G. C., Rosegrant, M.W., Koo, J., Robertson, R., Sulser, T., Zhu, T., Ringler, C., Msangi, S., Palazzo, A., Batka, M., Magalhaes, M., Valmonte-Santos, R., Ewing, M., & Lee, D. 2009. Climate change: impact on agriculture and costs of adaptation. International Food Policy Research Institute, Washington, D.C.
Olson, J. M., Salome, M., Campbell, D.J., Mbonile, M. & Mugisha, S. 2004. The Spatial Patterns and Root Causes of land Use Change in East Africa. lucid Working Paper 47.
Pedercini, M. & Barney, G.O. 2009. Dynamic analysis of interventions designed to achieve millennium development goals (MDg): The case of ghana. Socio-Economic Planning Sciences, Vol. 44, Issue 2, 2010.
Pedercini, M. 2011. Development Policy Analysis in Mali: Sustainable growth Prospects, Barthe, g., Pardo, A. and Schneider g. (Eds.): SEFM 2011, lecture Notes in Computer Sciences 7041, pp. 447–463, 2011. Springer-Verlag Berlin Heidelberg.
Pretty, J. 2006. Agroecological Approaches to Agricultural Development. Available at: http://www.rimisp.org/getdoc.php?docid=6440.
Qu, W. & Barney G.O. 2002. A Model for Evaluating the Policy Impact on Poverty. In Proceedings of the 20th International Conference of the System Dynamics Society. The System Dynamics Society, Palermo, Italy.
Qureshi, M. A. 2008. Challenging Trickle-down Approach: Modelling and Simulation of Public Expenditure and Human Development - The Case of Pakistan. International Journal of Social Economics, 35(4): 269-282.
Rockström, J. & Barron, J.2007. Water productivity in rainfed systems: overview of challenges and analysis of opportunities in water scarcity prone savannahs. Irrigation Science, Volume 25, Number 3 (2007), 299-311, DOI: 10.1007/s00271-007-0062-3.
Rodgers, G.B. 1979. Income and Inequality as Determinants of Mortality: An International Cross-Section Analysis. Population Studies, 33(2): p. 343-351.
Ruelland, D., Levavasseur, F. & Tribotte, A. 2010. Patterns and dynamics of land-cover changes since the 1960´s over three experimental areas in Mali. International Journal of Applied Earth Observation and Geoinformation, 12(1): S11-S17
Sacerdoti, E., Brunschwig, S. & Tang J. The Impact of Human Capital on growth: Evidence from West Africa, in IMF Working Paper. 1998, International Monetary Fund: Washington D.C.
Schmidhuber, J. & Tubiello, F. N. 2007. Global food security under climate change. PNAS 104 (50): 19703-08.
Shah, M., Fischer, G. & van Velthuizen, H. 2008. Food Security and Sustainable Agriculture. The Challenges of Climate Change in sub-Saharan Africa. laxenburg: International Institute for Applied Systems Analysis.
CC_FS_Mali_intPages_30.indd 35 13/11/12 15.02
36
P ot e n t i a l i m Pa c t s o f c l i m at e c h a n g e o n f o o d s e c u r i t y i n m a l i
Sivakumar, M. V. K.. 2006. Interactions between climate and desertification. Agricultural and Forest Meteorology 142: 143-155.
Sterman, J.D. 1984. Appropriate summary statistics for evaluating the historical fit of system dynamics models. Dynamica. 10(2): p. 51-66.
Taylor, C.M., Lambin, E.F., Stephenne, N., Harding, R.J. & Essery, R.L.H. 2002. Between the years 2080 to 2099 and the years 1980 to 1999 in the A1B projections. Journal of Climate, Volume 15, pp.3615-3629, American Metereological Society.
UN. 1992. Rio Declaration on Environment and Development, The United Nations Conference on Environment and Development, June 3rd - 14th, 1992, Rio de Janeiro, Brazil.
UN. 2003. World Population Prospects: The 2002 Revision. United Nations Population Division: New york.
UNCCD.2010. Available online at http://www.unccd.int/lists/SiteDocumentlibrary/Publications/Desertificationandclimatechange.pdf, last accessed June 2012.
USAID. 2008. Mali Biodiversity and Tropical Forests 118/119 Assessment. United States Agency for International Development (USAID), Biodiversity Analysis and Technical Support Team.
World Bank. 2005. Summary of Mali Investment Climate Assessment, Africa Region, Private Sector Unit, Note Number 11, September 2005,Washington D.C.
World Bank. 2007. World Development Indicators 2007. World Bank: Washington D.C.
World Bank. 2008. World Development Report 2008 - Agriculture for Development. World Bank, Washington D.C.
WRI available at http://earthtrends.wri.org/updates/node/210/. http://www.atlapedia.com/online/countries/mali.htm (last accessed October 2010).
CC_FS_Mali_intPages_30.indd 36 13/11/12 15.02
Printed in Italy on ecological and recycled paper,
October 2012
Design/layout: [email protected]
Figures’ design: Donatella Marchi ([email protected])
CC_FS_Mali_intPages_30.indd 38 13/11/12 15.02
I24
80
E/1
/11
.11
Potential imPacts of climate change onfood security in mali
CC_FS_Mali_Cover_05.indd 1 13/11/12 15.16