assessment of climate change impacts on water …€¦ · assessment of climate change impacts on...
TRANSCRIPT

Dr. Nezar Hammouri Faculty of Natural Resources & Environment The Hashemite University [email protected]
Assessment of Climate Change Impacts on Water Resources of North Jordan

Jordan is one of the fourth driest countries in the World, with an annual per capita share of water for all purposes standing at about 110-150 cm3, compared to the international water poverty line of 1,000 cm3 of water per person annually.
1
2
3
1 Base Flow
Flood Flow
210 to 220 MCM/a
120 (Dry Year) 524 (Wet Year) MCM/a
2
3
• Wastewater reuse, • Water desalination, • Importation of water, • Weather modification
(cloud seeding).
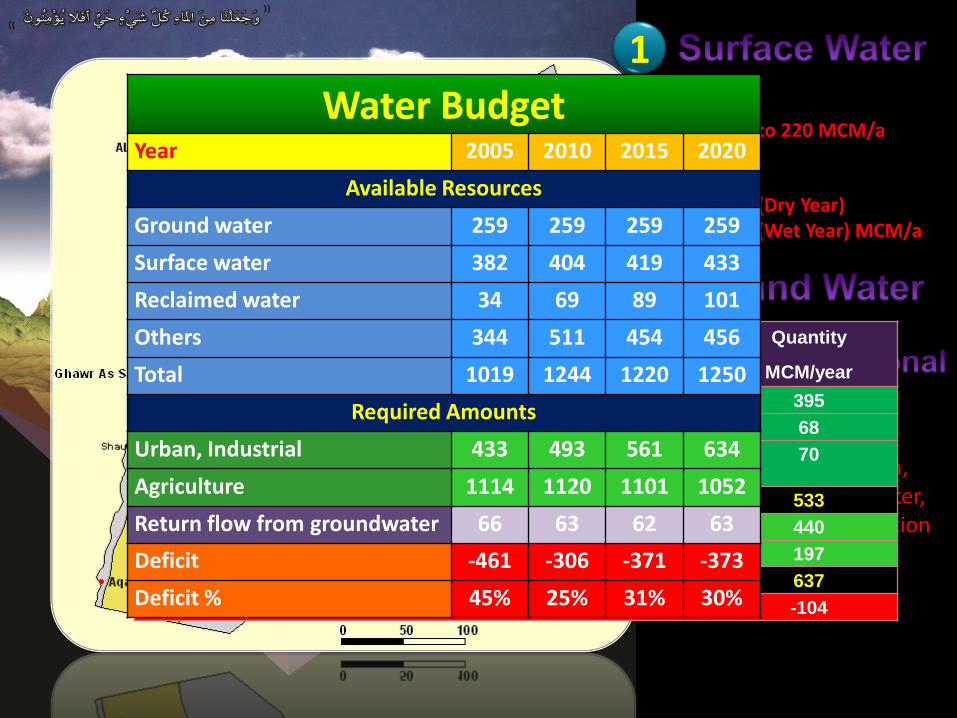
Budget Component Quantity
MCM/year
Groundwater recharge from precipitation 395
Trans-boundary groundwater inflow from Syria 68
Return flows from irrigation, leaks from pipes, reservoirs, wastewater
treatment plants
70
Total inflow 533
Groundwater abstraction (wells, springs) 440
Baseflow 197
Total outflow 637
Change in storage (inflow - outflow) -104
Water Budget Year 2005 2010 2015 2020
Available Resources
Ground water 259 259 259 259
Surface water 382 404 419 433
Reclaimed water 34 69 89 101
Others 344 511 454 456
Total 1019 1244 1220 1250
Required Amounts
Urban, Industrial 433 493 561 634
Agriculture 1114 1120 1101 1052
Return flow from groundwater 66 63 62 63
Deficit -461 -306 -371 -373
Deficit % 45% 25% 31% 30%
Climate change is expected to affect the quantity and quality of the country's water resources.
International studies, including reviews by the Intergovernmental Panel on Climate Change (IPCC), have reported that regions with already scarce water resources, such as the Middle East and North Africa, will suffer even more from water scarcity (IPCC, 2008).
Previous regional and local studies of past weather records already show an increase in mean temperatures, and in the magnitude and frequency of extreme temperatures (IPCC, 2008).
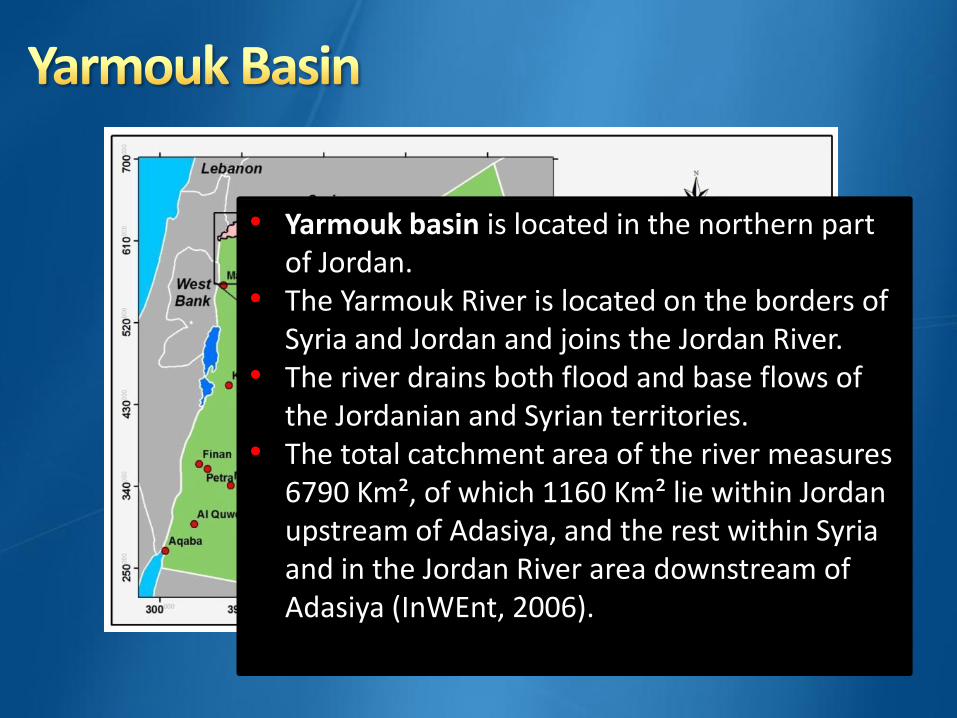
• Yarmouk basin is located in the northern part of Jordan.
• The Yarmouk River is located on the borders of Syria and Jordan and joins the Jordan River.
• The river drains both flood and base flows of the Jordanian and Syrian territories.
• The total catchment area of the river measures 6790 Km², of which 1160 Km² lie within Jordan upstream of Adasiya, and the rest within Syria and in the Jordan River area downstream of Adasiya (InWEnt, 2006).
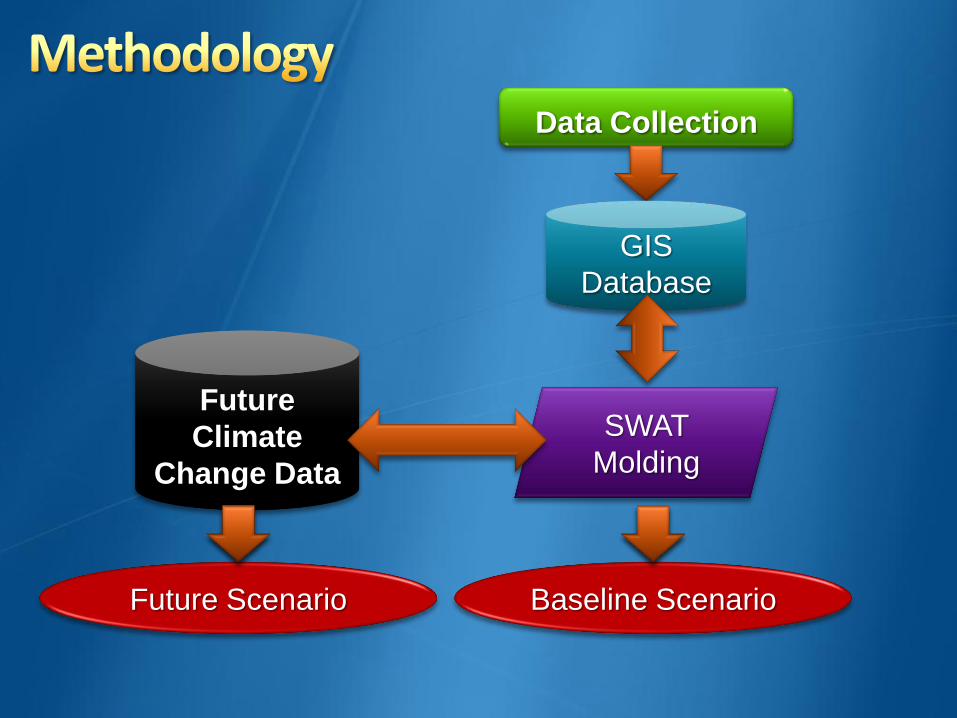
Data Collection
GIS
Database
SWAT
Molding
Baseline Scenario
Future
Climate
Change Data
Future Scenario

Data set Resolution Source
1 Digital Elevation
Model
30m Earth Remote Sensing Data
Analysis Center (ERSDAC) website
(http://www.gdem.aster.ersdac.or.
jp/).
2 Soil Data 1:50,000 Ministry of Agriculture
3 Landsate ETM+
Images
30m USGS Earth observation and
Science (EOS)
(http://glovis.usgs.gov/).
4 Meteorological Data Last 40 Years Ministry of Water and Irrigation
Department of Meteorology
5 Surface runoff gaging
data
Last 40 Years Ministry of Water and Irrigation
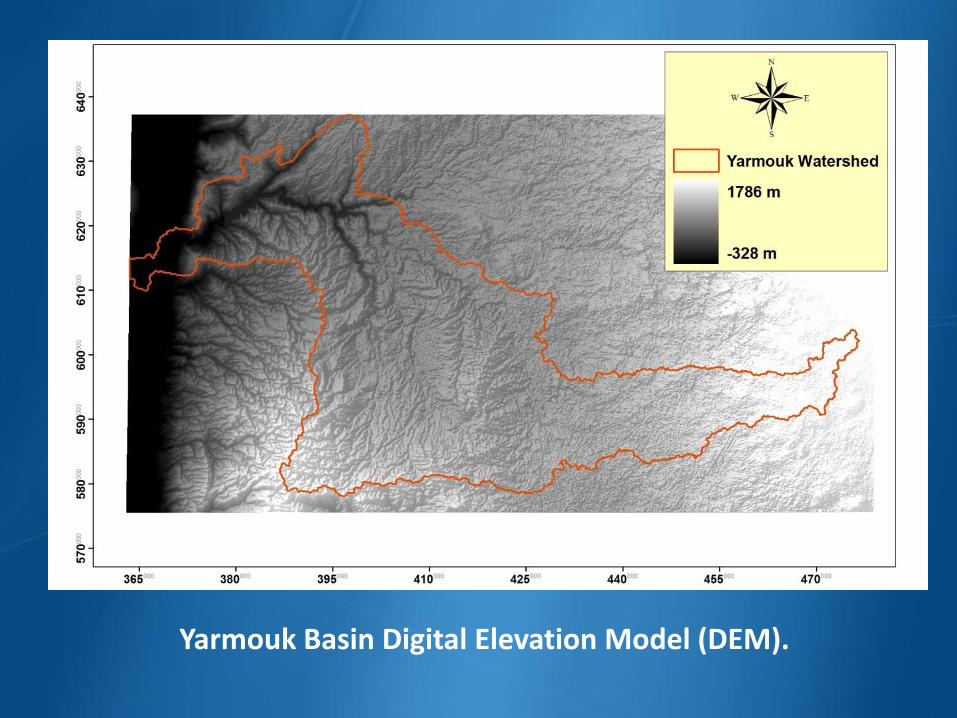
Yarmouk Basin Digital Elevation Model (DEM).
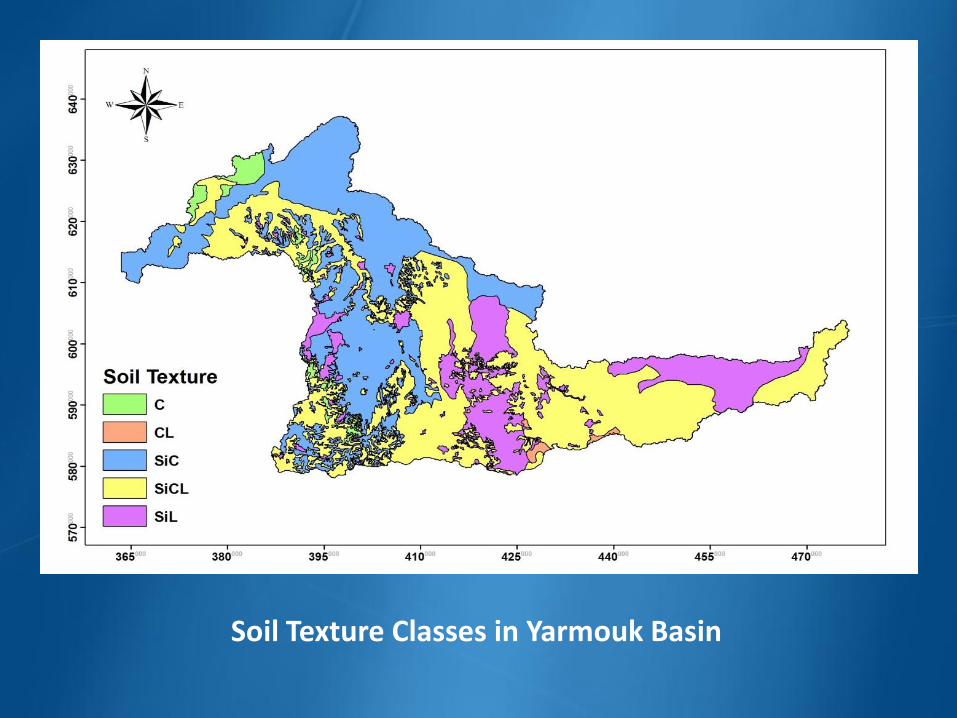
Soil Texture Classes in Yarmouk Basin

Land Cover Classes in Yarmouk Basin.
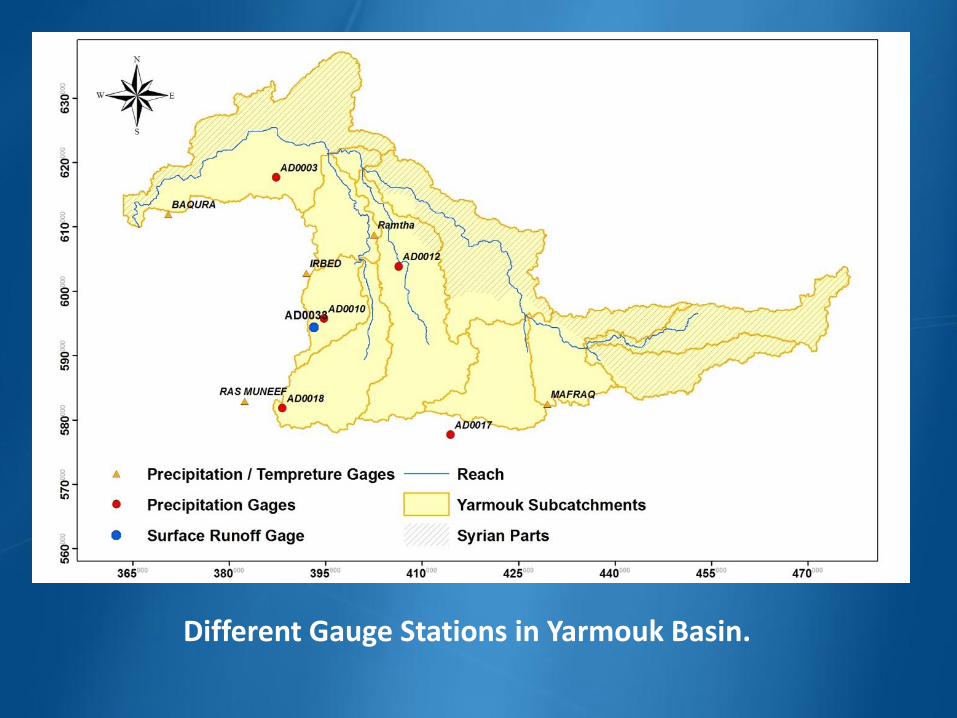
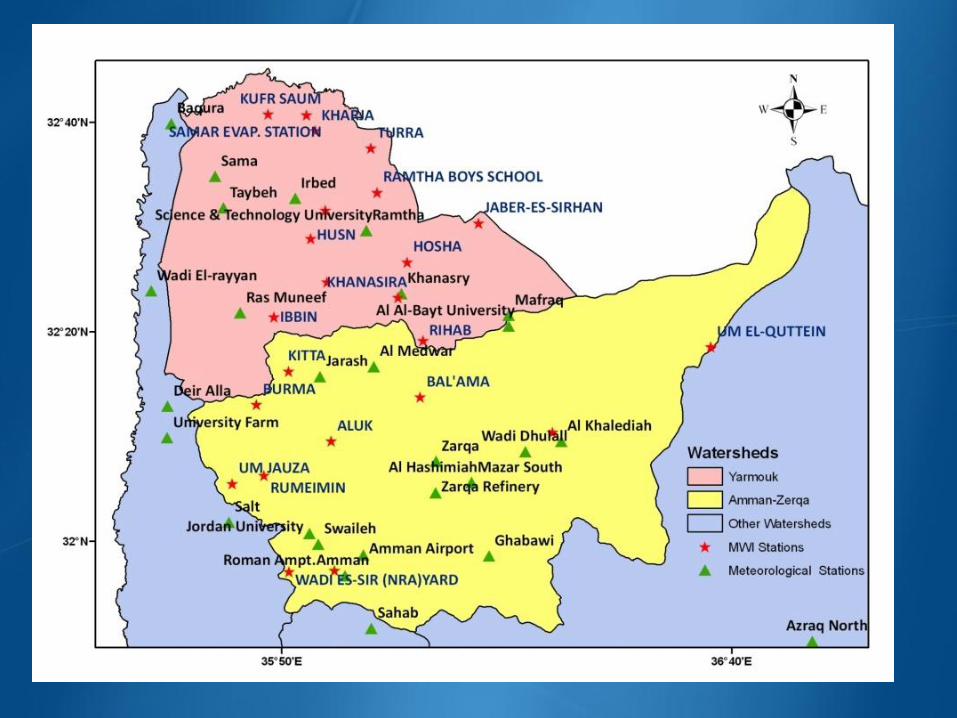
Different Gauge Stations in Yarmouk Basin.
SWAT is the acronym for the Soil and Water Assessment Tool, a watershed scale model developed by the USDA Agricultural Research Service (ARS).
SWAT was developed to predict the impact of land management practices on water, sediment and agricultural chemical yields in large complex watersheds with varying soils, land use and management conditions over long periods of time.
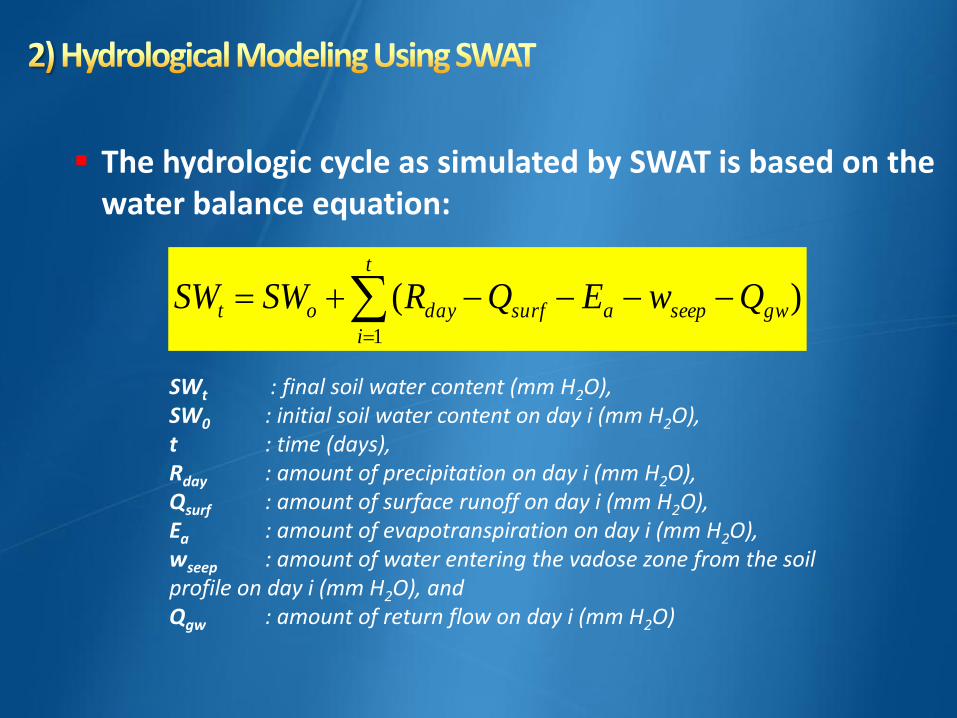
The hydrologic cycle as simulated by SWAT is based on the water balance equation:
)(1
gwseepasurf
t
i
dayot QwEQRSWSW
SWt : final soil water content (mm H2O), SW0 : initial soil water content on day i (mm H2O), t : time (days), Rday : amount of precipitation on day i (mm H2O), Qsurf : amount of surface runoff on day i (mm H2O), Ea : amount of evapotranspiration on day i (mm H2O), wseep : amount of water entering the vadose zone from the soil profile on day i (mm H2O), and Qgw : amount of return flow on day i (mm H2O)
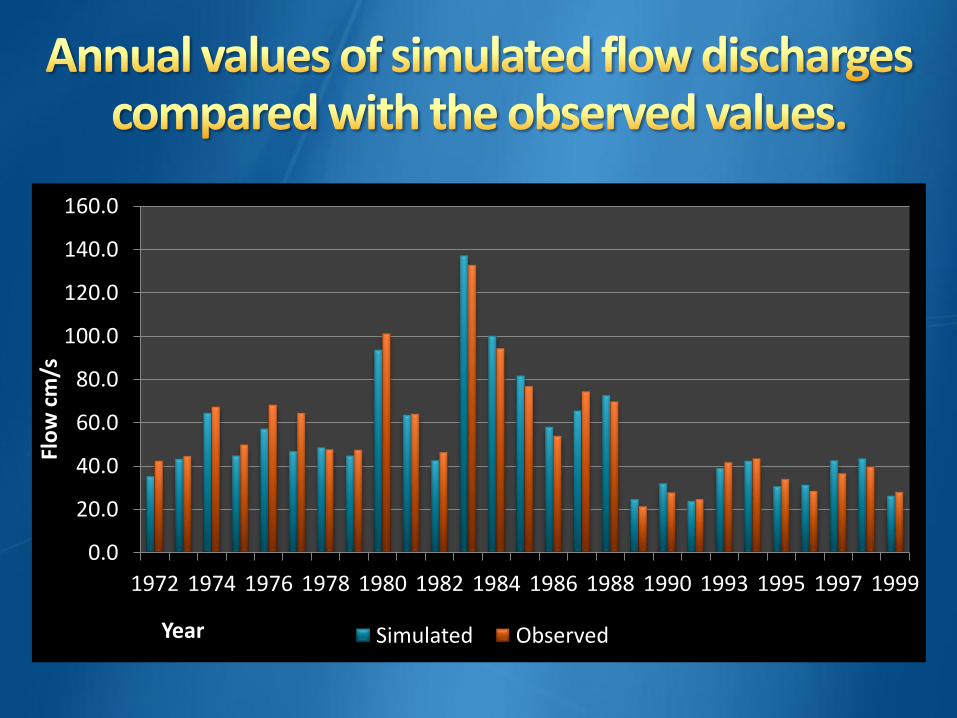
The baseline scenario which represents the current conditions of the watershed was created using ArcSWAT.
The time domain for the baseline scenario is from 1/1/1972 to 31/12/1999. This period contains dry, wet, and normal flood flow years.
For calibration purposes, the period from 1/1/1972 to 31/12/1990 was used, while the period from 1/1/1991 to 31/12/1999 was used for validation purposes.
SWAT model contains a large number of parameters, with most of them measured or estimated from the ArcSWAT database. Before the calibration process sensitivity analysis was performed to consider the most sensitive parameters.

Name Definition Estimated
value
Calibrated
value
Units Possible range
Min Max
CN2 Curve number 80.1 82.6 - 0 100
SOIL_ALB Moist soil albedo 0.21 0.81 - 0 1
EPCO Plant uptake
compensation factor
0.41 0.95 inche
s
0 1
ESCO Soil evaporation
compensation factor
0. 099 0. 1200 inche
s
0 1
SOIL_K Saturated hydraulic
conductivity
0.9100 0.9100 mm/
hr
0 2000
CANMX Maximum canopy
storage (mm H2O)
0.186 0.27 mm 0 2.5
REVAPMN Threshold depth of
water in the shallow
aquifer
0.13 0.65 mm -1 1
0.0
20.0
40.0
60.0
80.0
100.0
120.0
140.0
160.0
1972 1974 1976 1978 1980 1982 1984 1986 1988 1990 1993 1995 1997 1999
Flo
w c
m/s
Year Simulated Observed
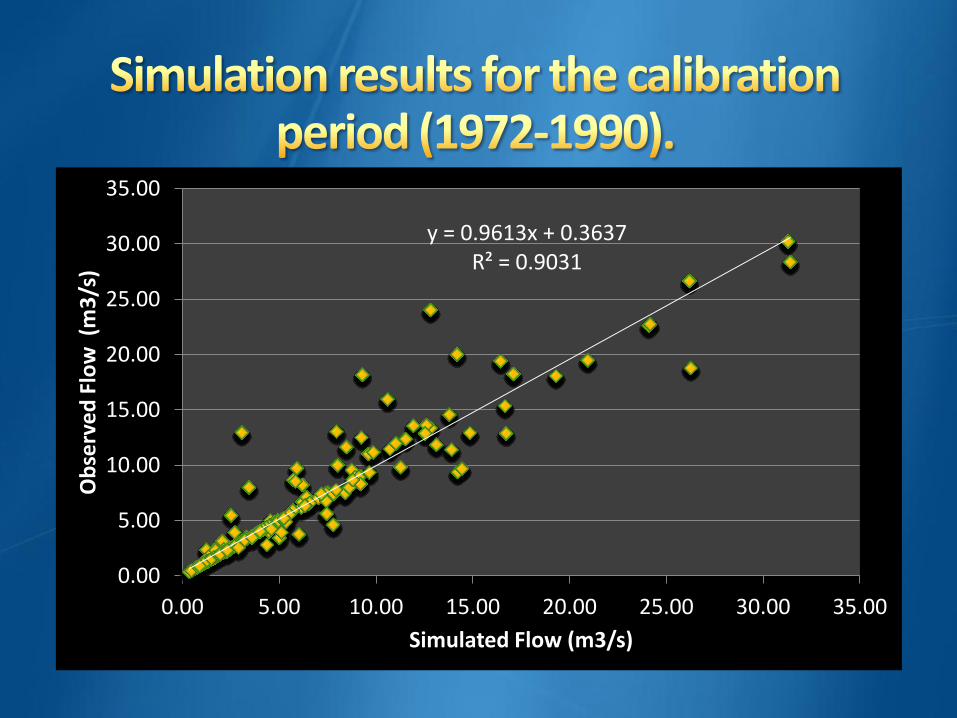
y = 0.9613x + 0.3637 R² = 0.9031
0.00
5.00
10.00
15.00
20.00
25.00
30.00
35.00
0.00 5.00 10.00 15.00 20.00 25.00 30.00 35.00
Ob
serv
ed
Flo
w (
m3
/s)
Simulated Flow (m3/s)
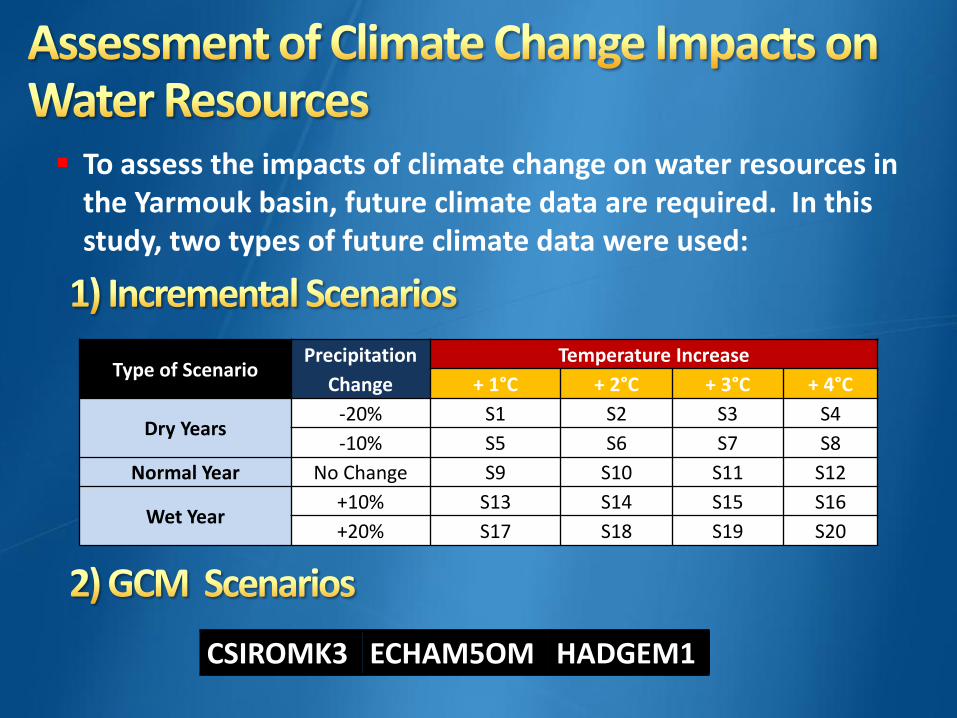
To assess the impacts of climate change on water resources in the Yarmouk basin, future climate data are required. In this study, two types of future climate data were used:
Type of Scenario Precipitation
Change
Temperature Increase
+ 1°C + 2°C + 3°C + 4°C
Dry Years -20% S1 S2 S3 S4
-10% S5 S6 S7 S8
Normal Year No Change S9 S10 S11 S12
Wet Year +10% S13 S14 S15 S16
+20% S17 S18 S19 S20
CSIROMK3 ECHAM5OM HADGEM1

0.0
0.5
1.0
1.5
2.0
2.5
3.0
3.5
4.0
4.5
Oct Nov Dec Jan Feb Mar Apr May
Flo
w m
3/s
Baseline CSIROMK3 ECHAM5OM HADGEM1
-50.0%
-40.0%
-30.0%
-20.0%
-10.0%
0.0%
10.0%
20.0%
30.0%
40.0%
Oct Nov Dec Jan Feb Mar Apr May
Flo
w m
3/s
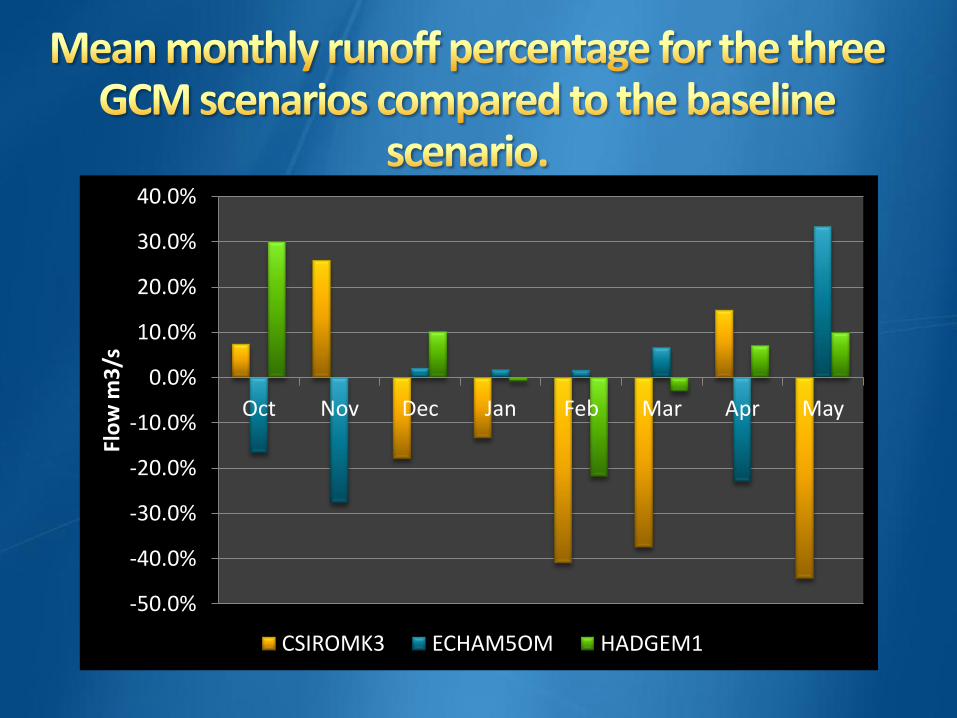
CSIROMK3 ECHAM5OM HADGEM1
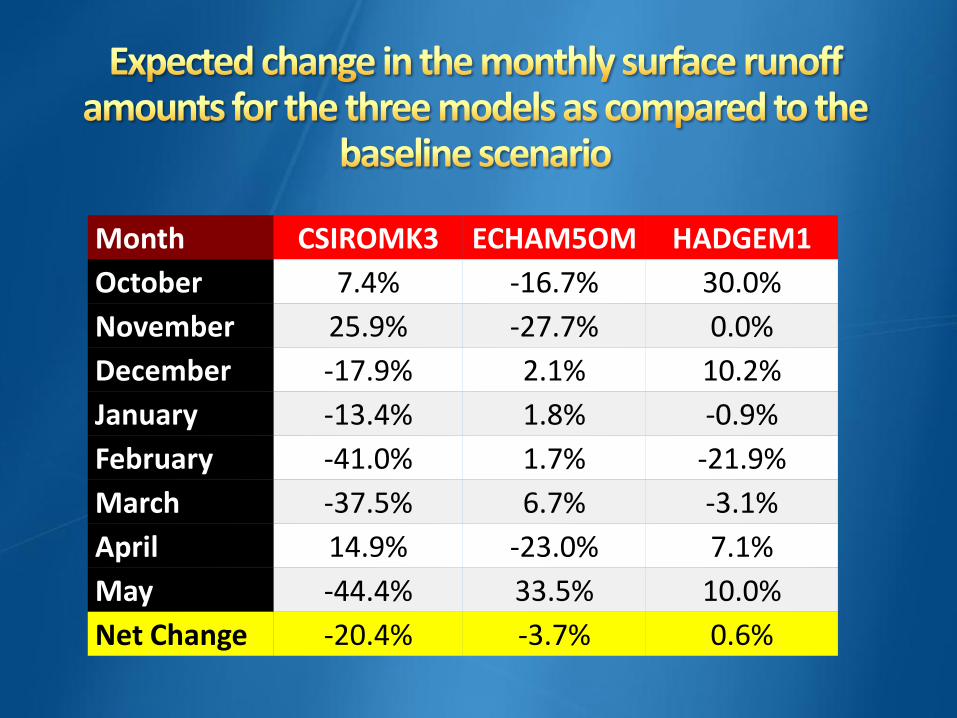
Month CSIROMK3 ECHAM5OM HADGEM1
October 7.4% -16.7% 30.0%
November 25.9% -27.7% 0.0%
December -17.9% 2.1% 10.2%
January -13.4% 1.8% -0.9%
February -41.0% 1.7% -21.9%
March -37.5% 6.7% -3.1%
April 14.9% -23.0% 7.1%
May -44.4% 33.5% 10.0%
Net Change -20.4% -3.7% 0.6%
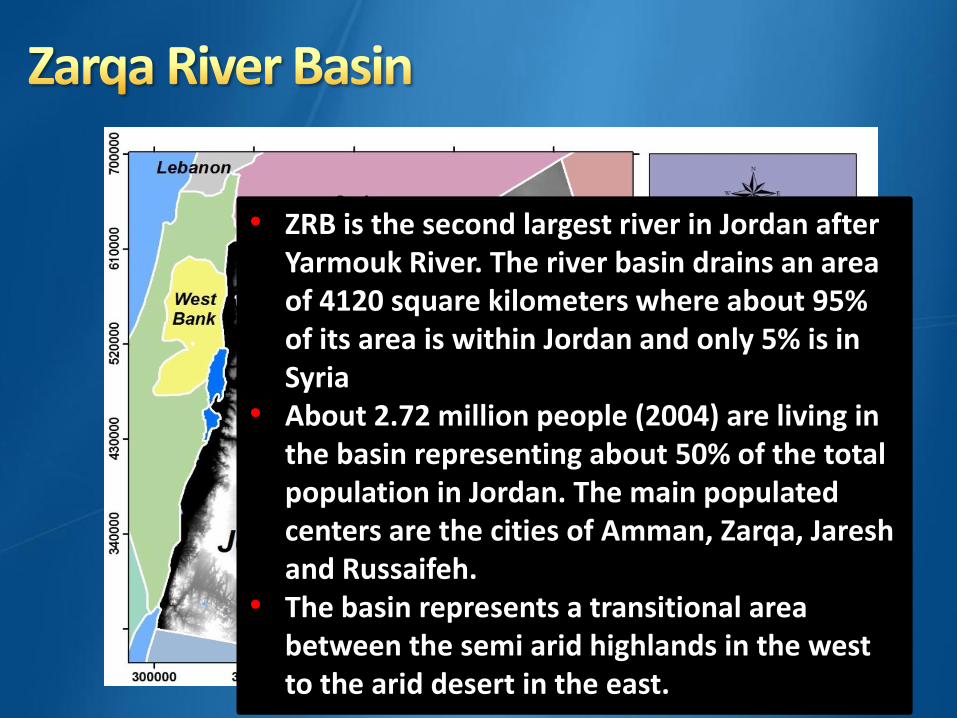
• ZRB is the second largest river in Jordan after Yarmouk River. The river basin drains an area of 4120 square kilometers where about 95% of its area is within Jordan and only 5% is in Syria
• About 2.72 million people (2004) are living in the basin representing about 50% of the total population in Jordan. The main populated centers are the cities of Amman, Zarqa, Jaresh and Russaifeh.
• The basin represents a transitional area between the semi arid highlands in the west to the arid desert in the east.
Jordan is a country with limited water resources. The critical situation of water resources in Jordan could become even more difficult due to the potential impacts of climate change.
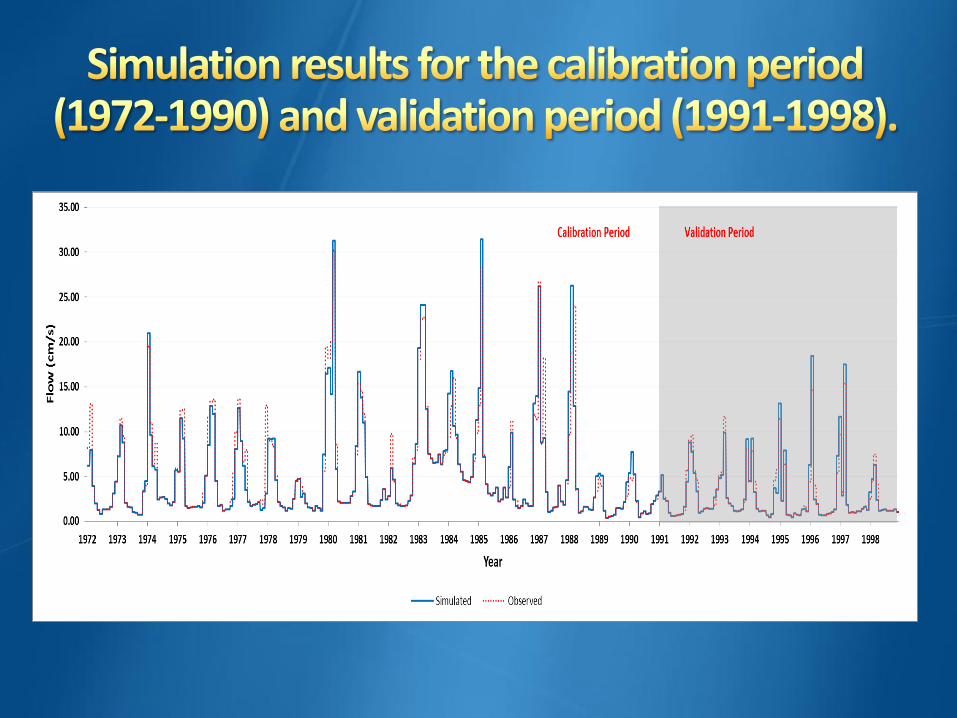
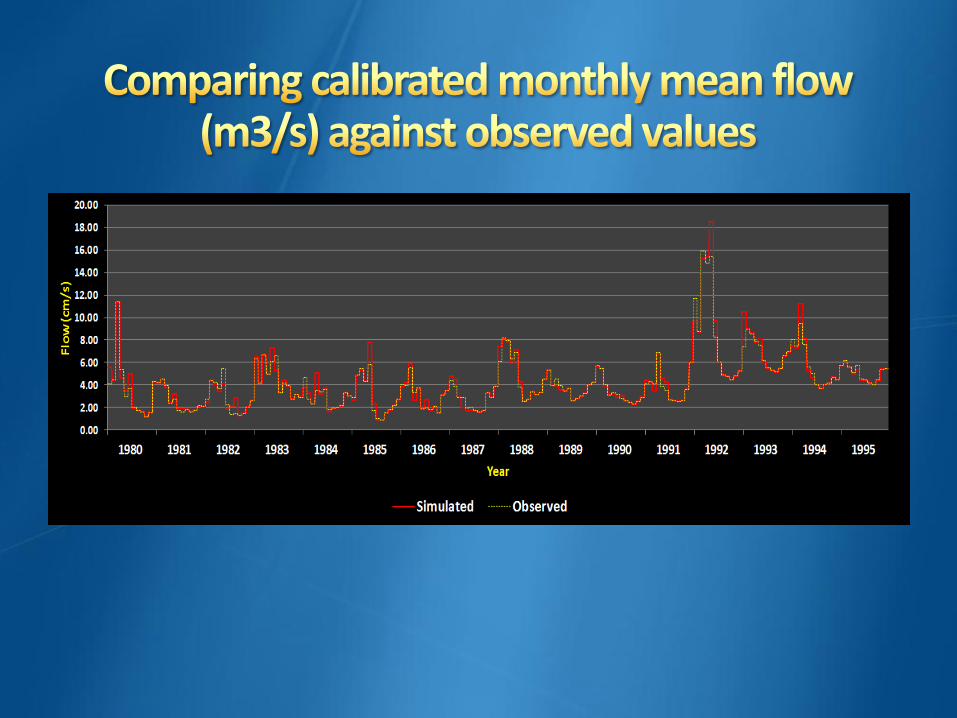
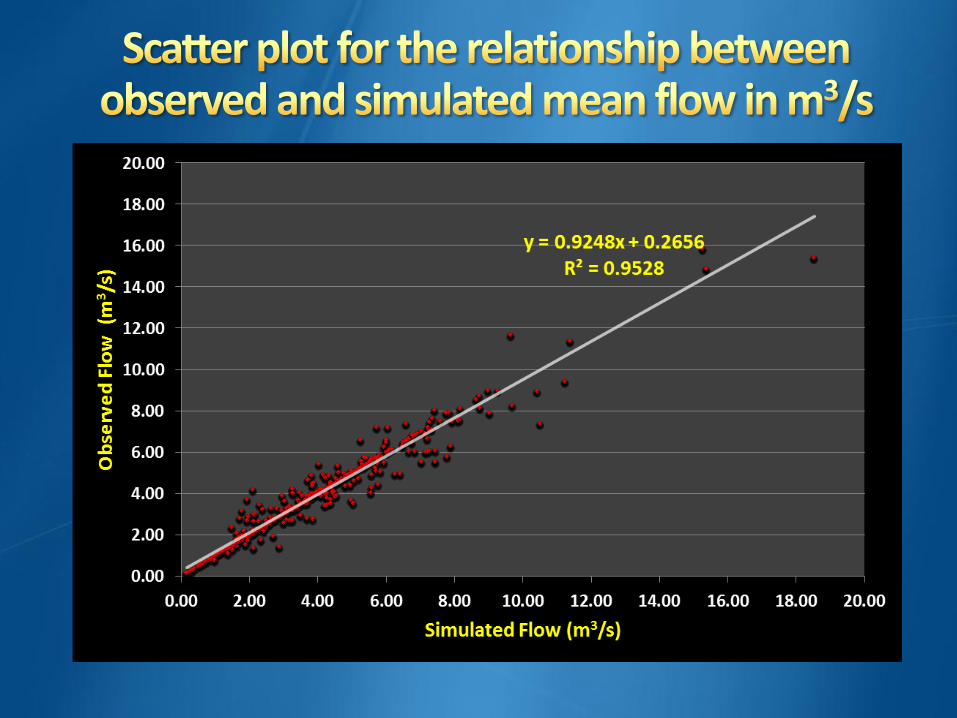
The baseline SWAT model was created and calibrated using observed data obtained from the runoff gauge station in the basin.
The calibrated model was tested using the root mean square and Nash and Sutcliffe method. Both methods showed that the outputs of the calibrated model closely match the observed flow values.

Future climatic data are required to assess the impacts of climate change on water resources.
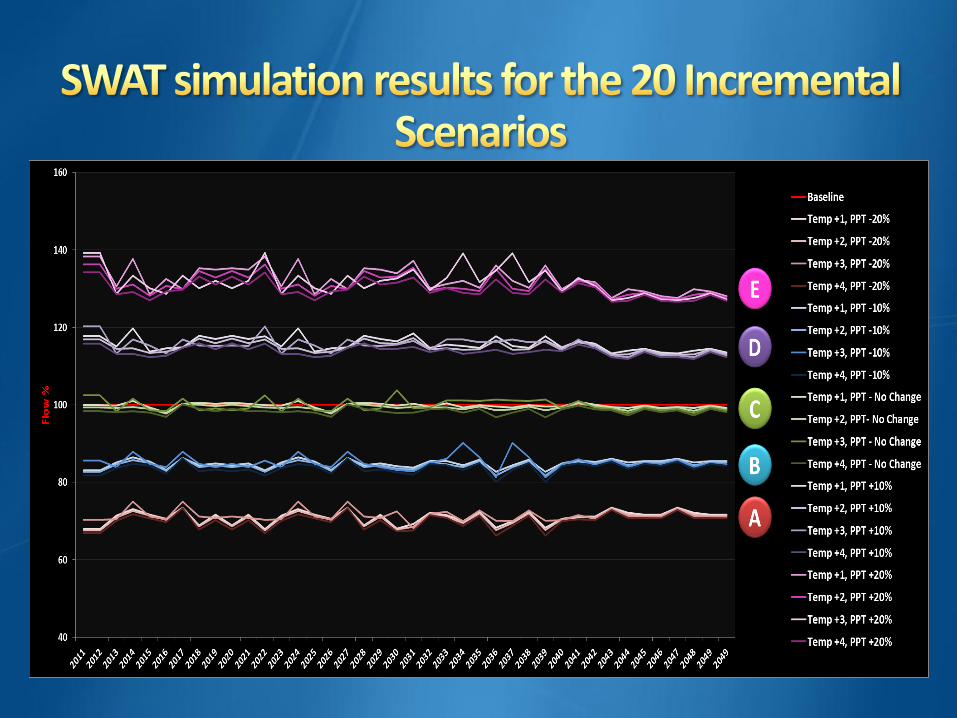
Two types of future data were used in this study. The first type of future data is incremental scenarios, where 20 different climatic scenarios were created to represent the dry, normal and wet year conditions.
The simulation results of these 20 scenarios showed that precipitation is the major factor that affects the vulnerability of surface runoff values. It was also determined that temperature plays a minor role in changes in surface runoff amounts.
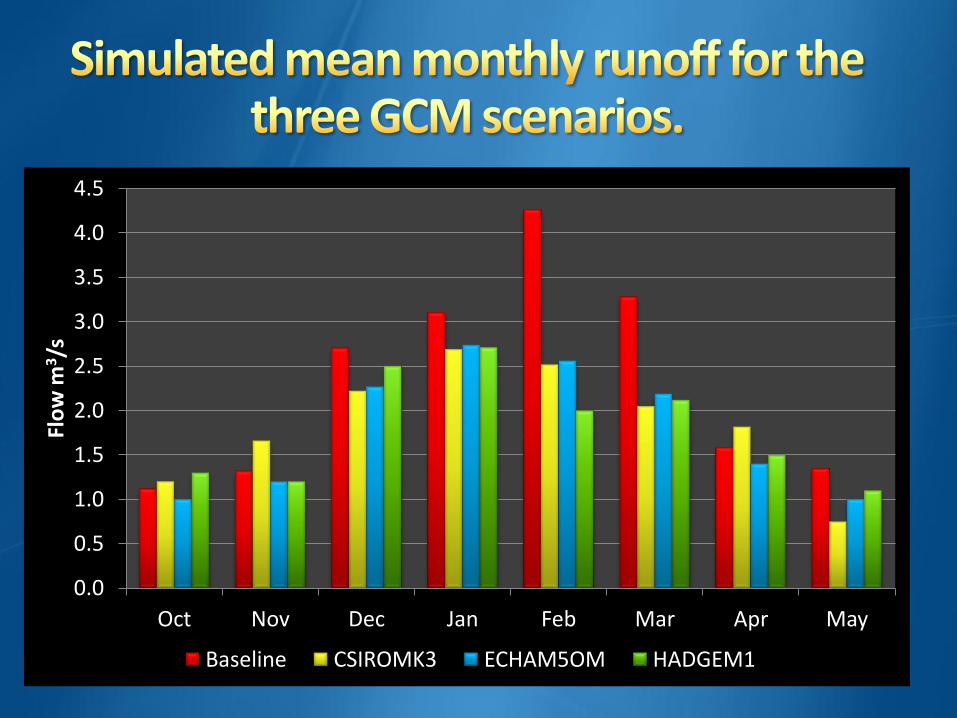
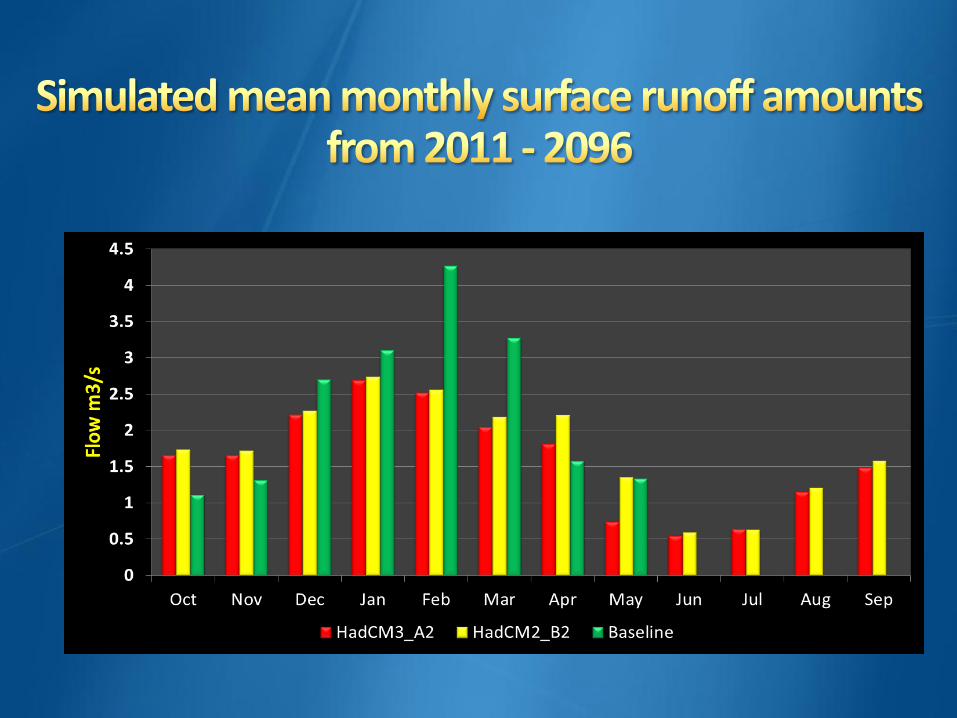
The second type of future climate data is GCM scenarios. Three different models were used in this study: CSIROMK3, ECHAM5OM and HADGEM1.
According to the CSIROMK3 model, a decrease in surface runoff amount is expected in October (7%), November (26%), December (18%), January (13%), February (41%), March (38%) and May (44%).
According to the ECHAM5OM model, a decrease in surface runoff amount is expected in October (17%), November (28%), and April (23%). According to the HADGEM1model, a decrease is predicted in February (22%) and March (3%).
The CSIROMKE model predicts the highest impact of climate change on surface runoff amounts (-20%), while HADGEM1 predicts almost negligible impacts (-0.6%).
As the results of this study reveal, surface runoff amounts are going to be affected by the impacts of climate change. In light of this, it is necessary to revise the water budget of Jordan to consider these changes in the budget.
Furthermore, it is necessary for Jordan to think about policies and strategies to help the country adapt to the impacts of climate change, and to consider these strategies and policies in the context of Jordan’s National Water Strategy which was initiated in 2008 and which involves future planning until 2022.