potential for urban mining in norrk¶ping
TRANSCRIPT
The Tema Institute
Campus Norrköping
Bachelor of Science Thesis, Environmental Science Programme, 2011
Simon Andersson Johan Petersson
Potential for Urban Mining in Norrköping
– a Static Quantification of Metal in Subterranean Infrasystems
Linköpings universitet, Campus Norrköping, SE-601 74 Norrköping, Sweden
Rapporttyp
Report category
Licentiatavhandling
Examensarbete
AB-uppsats
C-uppsats
D-uppsats
Övrig rapport
________________
Språk
Language
Svenska/Swedish
Engelska/English
________________
Titel
Title
Potential for Urban Mining in Norrköping
– a Static Quantification of Metal in Subterranean Infrasystems
Författare
Author
Simon Andersson
Johan Petersson
Sammanfattning
Abstract
As the society’s demand for metal increases, the rate of mineral extraction will do the same. This contributes to
environmental implications in the form of emissions and depletion of finite natural resources. Conventional recycling
is a common practice used to reduce the need for extraction of metal ore and in turn reduce the environmental impact.
Recycling is an important source to satisfy the metal demand; as much of 30 % of the metal demand is covered by
recycling in some markets. Another form of recycling is the practice of urban mining. A practice which includes
recycling of society’s stocks of unused but not discarded metal, these unused amounts metal is part of a so called
hibernating stock. An example of a very large stock is the infrasystems in the shape of power cables and pipes.
The objective of this thesis is to quantify the metal stocks of copper, aluminium and iron in subterranean
infrasystems in the city district of Södra Butängen in Norrköping. Also, a quantification for Norrköping as a whole is
performed but on slightly different infrasystems.
An economical valuation of these stocks is also performed. The Municipality of Norrköping has the ambition to
transform this small industrial area, that Södra Butängen is today, into to a sustainability profiled residential and
commercial area which opens up an opportunity to recycle the infrasystems when all buildings are removed and the
ground is dug up.
To fulfil the objective of the thesis, and quantify the metal stocks, so called static quantification was used. The
infrasystems to be included in this study were chosen and the data describing these systems was collected from the
respective owner of the systems. The gathered data consists of maps which were digitalized with GIS-software using
ArcMap 10 where the stocks then were quantified.
The results show that the infrasystems in Södra Butängen holds almost 600 tons of metal with an economical value
of 4.67 million SEK. For the Norrköping quantification the results shows that the stock contains about 30,000 tons of
metal. The economical value is a little over 70 million SEK. The hibernating stocks in Norrköping equals to 5,100
tons of metal and a value of 9.5 million SEK.
There is a potential for urban mining in Södra Butängen that should be considered. However, there are some
issues that also must be considered, like cost of extraction. There are large stocks of metal that not have been possible
to identify in this thesis. This includes the power grid for Norrköping; a valuable stock due to its large copper content.
ISBN
_____________________________________________________
ISRN LIU-TEMA/MV-C—11/11--SE _________________________________________________________________
ISSN
_________________________________________________________________
Serietitel och serienummer
Title of series, numbering
Handledare
Tutor
Joakim Krook
Nyckelord
Keywords
urban mining; copper; iron; aluminium; hibernated stock; recycling; infrasystem
Datum
Date
2011-05-31
URL för elektronisk version
http://www.ep.liu.se/index.sv.html
Institution, Avdelning
Department, Division
Tema vatten i natur och samhälle,
Miljövetarprogrammet
Department of Water and Environmental Studies,
Environmental Science Programme
1 (35)
Acknowledgement
First of all, we would like to thank our tutors, Joakim Krook and Björn Berglund, for valuable
feedback during the work process and also for giving us the opportunity to perform this study
and to participate in the projects at the department. We would also like to thank Per
Frändegård, Annica Carlsson and Nils Johansson for additional help and feedback. Last but
not least, a special thanks to all the organisations and their representatives which generously
have contributed with data and other information to this thesis. Without this information, this
study would not have been possible.

2 (35)
Abstract
As the society’s demand for metal increases, the rate of mineral extraction will do the same.
This contributes to environmental implications in the form of emissions and depletion of finite
natural resources. Conventional recycling is a common practice used to reduce the need for
extraction of metal ore and in turn reduce the environmental impact. Recycling is an
important source to satisfy the metal demand; as much of 30 % of the metal demand is
covered by recycling in some markets. Another form of recycling is the practice of urban
mining. A practice which includes recycling of society’s stocks of unused but not discarded
metal, these unused amounts metal is part of a so called hibernating stock. An example of a
very large stock is the infrasystems in the shape of power cables and pipes.
The objective of this thesis is to quantify the metal stocks of copper, aluminium and iron
in subterranean infrasystems in the city district of Södra Butängen in Norrköping. Also, a
quantification for Norrköping as a whole is performed but on slightly different infrasystems.
An economical valuation of these stocks is also performed. The Municipality of
Norrköping has the ambition to transform this small industrial area, that Södra Butängen is
today, into to a sustainability profiled residential and commercial area which opens up an
opportunity to recycle the infrasystems when all buildings are removed and the ground is dug
up.
To fulfil the objective of the thesis, and quantify the metal stocks, so called static
quantification was used. The infrasystems to be included in this study were chosen and the
data describing these systems was collected from the respective owner of the systems. The
gathered data consists of maps which were digitalized with GIS-software using ArcMap 10
where the stocks then were quantified.
The results show that the infrasystems in Södra Butängen holds almost 600 tons of metal
with an economical value of 4.67 million SEK. For the Norrköping quantification the results
shows that the stock contains about 30,000 tons of metal. The economical value is a little over
70 million SEK. The hibernating stocks in Norrköping equals to 5,100 tons of metal and a
value of 9.5 million SEK.
There is a potential for urban mining in Södra Butängen that should be considered.
However, there are some issues that also must be considered, like cost of extraction. There are
large stocks of metal that not have been possible to identify in this thesis. This includes the
power grid for Norrköping; a valuable stock due to its large copper content.

3 (35)
Table of Content
1 Introduction .......................................................................................................................................... 4
1.1 Objective ....................................................................................................................................... 5
1.2 Delimitation and definitions .......................................................................................................... 5
2 Theoretical framework ......................................................................................................................... 7
2.1 Industrial ecology .......................................................................................................................... 7
2.2 Material flow analysis ................................................................................................................... 7
2.3 Urban Mining ................................................................................................................................ 8
3 Material and Methods ......................................................................................................................... 11
3.1 Identification and selection of systems ........................................................................................ 11
3.2 Data collection on the length and composition of the studied infrasystems................................ 12
3.3 Calculation of metal stocks ......................................................................................................... 13
3.4 Economical valuation of the metal stocks ................................................................................... 13
3.5 Reliability and validity of the data and the calculations .............................................................. 13
4 Metal stocks in the infrasystems of Södra Butängen .......................................................................... 15
4.1 Aluminium stock in Södra Butängen .......................................................................................... 15
4.2 Copper stock in Södra Butängen ................................................................................................. 16
4.3 Iron stock in Södra Butängen ...................................................................................................... 17
5 Metal stock in selected infrasystems in Norrköping .......................................................................... 18
5.1 Aluminium stock in Norrköping ................................................................................................. 18
5.2 Copper stock in Norrköping ........................................................................................................ 19
5.3 Iron stock in Norrköping ............................................................................................................. 20
6 Economic valuation of metal stocks ................................................................................................... 21
7 Discussion .......................................................................................................................................... 23
8 Conclusions ........................................................................................................................................ 25
References ............................................................................................................................................. 26
Appendix 1 - Town gas calculations ..................................................................................................... 28
Appendix 2 - District heating ................................................................................................................ 30
Appendix 3 - Cables .............................................................................................................................. 31
Appendix 4 - Water and sewage system ................................................................................................ 33
Appendix 6 - Data- and calculation uncertainties ................................................................................. 34

4 (35)
1 Introduction The extraction and processing of metals from earth’s crust is vital for the support of the
technological development and standard of the human society of today (UNEP, 2010). In
many aspects, the society has made itself more or less dependent on this constant flow of
metals from the lithosphere1 into the antroposphere
2. It has been established that the flow of
metals into the antroposphere is larger than its corresponding outflows; which in turn leads to
an accumulation of metals in the antroposhere (Wittmer, Lichtensteiger & Wittmer, 2007).
However, there are some issues related to this practice of consuming metals. The mining
and extraction of minerals is, for instance, not performed without certain environmental
impact. According to Norgate and Hauge (2009) the practice of mining and processing of ore
both consumes significant amounts of energy and gives rise to various pollutant emissions.
The increasing usage of metals (Wittmer, Lichtensteiger & Wittmer, 2007), and therefore
the increasing extraction and mining of these metals, contributes to consumption and
depletion of the finite natural resources which the metals represents. The Swedish annual
copper consumption did, for instance, increase to 532 tons from 239 tons between the years
1998 to 2005. (SCB, 2009). This is also a contributing factor to decreasing ore grades, which
has fallen globally (Norgate & Hauge, 2009). This could in turn lead to higher prices and also
a lower supply on the metal market. Also, the environmental impacts caused by mining could
increase further when more ore has to be mined in order to produce a given amount of metal
(Norgate & Hauge, 2009).
One way to treat and reduce the extent of these problems is to use conventional metal
recycling in which scrap metal is recycled to reduce the need of new metal into the
antroposphere. The environmental benefits consist of large energy savings; in the case of
aluminium recycling, up to 95 % of the energy can be saved compared to mining of the said
metal (Wernick & Themelis, 1998). Recycled metal represents a relatively large portion of the
total metal demand in some parts of the world; approximately 30 % of the copper demand in
Europe (Graedel et al., 2004) and 50 % of the iron demand in North America (Wang, Müller
& Graedel, 2007) is covered by recycled scrap metal. However, there are other methods of
recovering unused metal apart from this conventional recycling. An example of a recycling
method with potential is the so called practice of urban mining. Urban mining is used to
recover resources, including metals, that are located within the society and that have fallen
into disuse. These resources could, for instance, be in the form of buildings or infrasystems
that no longer are used but still not scrapped or removed. Unused, potential resources are in
urban mining terms known as hibernating. Large stocks of hibernating metal can be found in
infrasystems in the form of cables (Wendell, 2005; Krook et al., 2011) and pipes. However
these stocks are expensive to extract since excavation within a build city environment is often
required (Krook et al., 2010).
Considering this mentioned cost issue, an exceptional opportunity, from an urban mining
perspective, has now emerged. This opportunity is related to certain municipal plans
concerning the area of Södra Butängen. At present, the mentioned area consists of small-scale
industries and commercials activities, but the Municipality of Norrköping is planning a
transformation of the whole area; from an industrial district to a modern sustainability-
profiled residential and commercial area (Norrköping Municipality, 2009). If these plans
would be realised, all current buildings would have to be removed and this may possibly
apply to the infrasystems below ground as well. This leaves an exceptional opportunity to
consider; to extract and recycle the subterranean infrasystems of a whole city district, in this
case Södra Butängen. This would be a possible way of avoiding some of the costs connected
to the practice of urban mining as mentioned earlier. Also, not only the hibernating parts of
1 All solid matter, which is part of the earth’s crust.
2 Everything that is part of the human society or made or modified by humans.

5 (35)
the infrasystems could be extracted; the parts that are currently in use could also become
available if the buildings are demolished.
This leads to the objective of this thesis which has been conducted in collaboration with
the department of Environmental Technology and Management at Linköping University as a
part of the projects Urban Mining and Sustainable Norrköping.
1.1 Objective
The aim of this thesis is to investigate the potential for urban mining in subterranean
infrasystems in Södra Butängen and the city of Norrköping. To fulfill this aim, the following
questions should be answered:
How much aluminium, copper and iron are contained in the subterranean infrasystems
in Södra Butängen and Norrköping respectively?
What is the economical value of these metal stocks in Södra Butängen and
Norrköping?
The metal quantification for Södra Butängen is the main focus of this thesis, the quantification
of Norrköping is used to illustrate a metal content for the whole city.
1.2 Delimitation and definitions
This thesis is delimited to examine subterranean infrasystems made of the metals aluminium,
copper, and iron3. These metals were chosen because of their significant presence in the
analyzed infrasystems and their economical value. Zinc was meant to be included in the
quantification, but during the work progress it became clear that no systems contained any
significant amount of this metal.
Infrasystems above ground, such as aerial cables or train- and tram tracks are excluded
from the study. The reason to this is that infrasystems above ground often is taken care of and
recycled when no longer used. Subterranean cables and pipes on the other hand are exposed to
a higher risk to become forgotten and left hibernating below ground where a stock is built up.
Pipes and similar infrastructure made of non-metal materials, like plastic and concrete, are
also excluded. Since the focus is set to subterranean systems; all parts of the systems inside
building are excluded from the examinations.
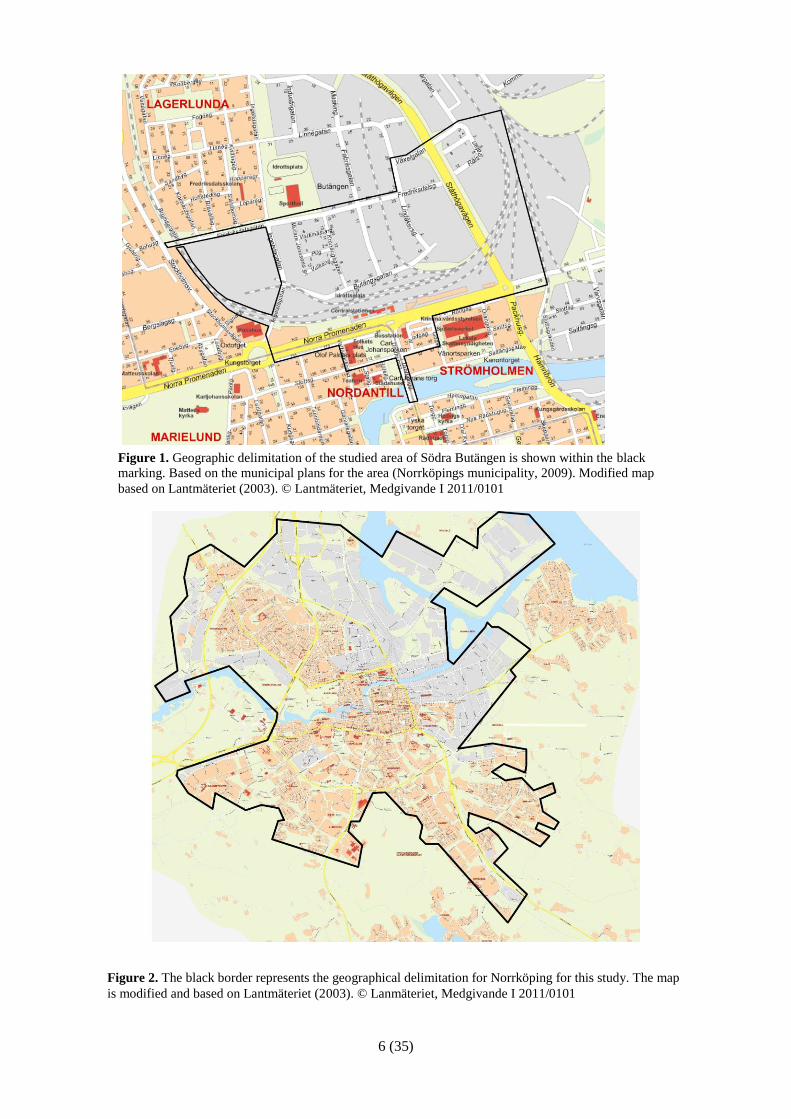
The quantification for Södra Butängen is geographically delimited to fit the planned area
of the Municipality of Norrköping as seen in figure 1 (Norrköping Municipality, 2009). For
the Norrköping quantification the study is delimited to the built urban areas of the city of
Norrköping, see figure 2. The chosen infrasystems for both examined areas are the district
heating system, water- and sewage system and street lighting. However, for the area of Södra
Butängen additional systems are examined; power cables and telephone lines. There are also
additional, completely hibernating systems that are studied for Norrköping as a whole and not
detailed for Södra Butängen, these are the old town gas system, a cable-TV network and the
subterranean parts of the old DC-power cables to the tram system. As a complement, the
modern in-use DC-cables to tram system is also included.
Where possible, a distinction between so called hibernating system parts and in-use
system parts is done. Hibernating system parts are those that no longer are in active use, have
lost their intended function and are considered as scrap but not physically removed or
discarded. There are also cables that are not in active use, but are meant as backup in case of
broken cables. In the quantification, these cables are treated as a special case since these not
actively in-use nor hibernating.
3 Includes steel and similar ferrous alloys. In the results these ferrous metals are just called “iron”.
6 (35)
Figure 2. The black border represents the geographical delimitation for Norrköping for this study. The map
is modified and based on Lantmäteriet (2003). © Lanmäteriet, Medgivande I 2011/0101
Figure 1. Geographic delimitation of the studied area of Södra Butängen is shown within the black
marking. Based on the municipal plans for the area (Norrköpings municipality, 2009). Modified map
based on Lantmäteriet (2003). © Lantmäteriet, Medgivande I 2011/0101

7 (35)
2 Theoretical framework
2.1 Industrial ecology
Industrial ecology is an approach developed to meet the environmental and sustainability
issues created by the industry and the industrial society. These issues exist in the form of
resource depletion, pollution and disturbance of natural ecosystems (O’Rourke, Connely &
Koshland, 1996). In order to allow for industrial development in a sustainable way, and avoid
conflict with the natural environment, there are several goals that industrial ecology strife for.
One of the major goals is to optimize the usage of natural resource and to minimize the
creation of waste. To achieve this several strategies are used; material substitution,
dematerialization, recycling and industrial symbiosis. The latter two are essential in the strife
towards the closing of material flows in society which is central to the concept of industrial
ecology (O’Rourke, Connely & Koshland, 1996). This means that the waste of one industrial
process should constitute the feedstock of another industrial process as far as possible
(O’Rourke, Connely, Koshland, 1996; Garner & Keolian, 1995), in essence this is an attempt
to mimic natural ecosystems and their processes (Frosch, 1992).
In order to study the effects on, amongst else, the environment caused by industrial
processes of the modern society, industrial or societal metabolism studies could be used
(Anderberg, 1998). These studies could identify the flows of materials into, out from and
within the society. For these studies material flow analysis is a useful method and tool.
2.2 Material flow analysis
An established method to investigate and quantify the flows of certain materials or substances
in the society is the so called material flow analysis (MFA). MFA as a tool and method can
be, and has been, used in many different ways. It has, for example, been used to quantify
inflows, non-hibernating stocks and accumulation of heavy metals in Stockholm (Sörme,
Bergbäck & Lohm, 2000). Another study by Spatari et al. (2005) makes use of MFA to
investigate the flows of copper in North America. The study then estimates the accumulation
of copper in landfills to examine the potential to recycle and use them as a source of
secondary resources. Also, Wendell (2005) has used MFA to quantify the flows of metal into
and out from the stock of power and communication cables where hibernating amounts of
copper and aluminium was quantified.
According to Brunner and Rechberger (2004), MFA is based on the estimation of flows
of certain substances or materials into and out from a defined system during a certain period
of time. In short, the MFA process is described by Brunner and Rechberger (2004) as follows.
The first step is to select which materials or substances to analyze; this depends on the aim of
the study. The next step is to define the boundaries and delimitations in both time and space
of the studied system. Then the relevant stocks and flows must be identified to thereafter
determine the mass and concentration of these stocks and flows. When the size of the inflows
and outflows of an analyzed system is known, the accumulation in the stocks can be
estimated.
However, Kapur and Graedel (2006) suggest another approach to MFA that can be used
in urban mining applications; the static or the bottom-up approach. This is in contrast to the
previously mentioned MFA process where stocks and flows are investigated. Using the static
method, the material content in a geographical delimited area and stock is directly determined
and quantified. No material flows related to the system are considered. The quantification of
the stock is done via collection of data describing the system, its material content and
components. This static approach has not been used so much in earlier studies, and therefore
not much is written about it in literature. It can in some ways be considered a relatively new
method. This is the used method in this thesis because this method offers relatively high
precision in quantifying the stocks.
8 (35)
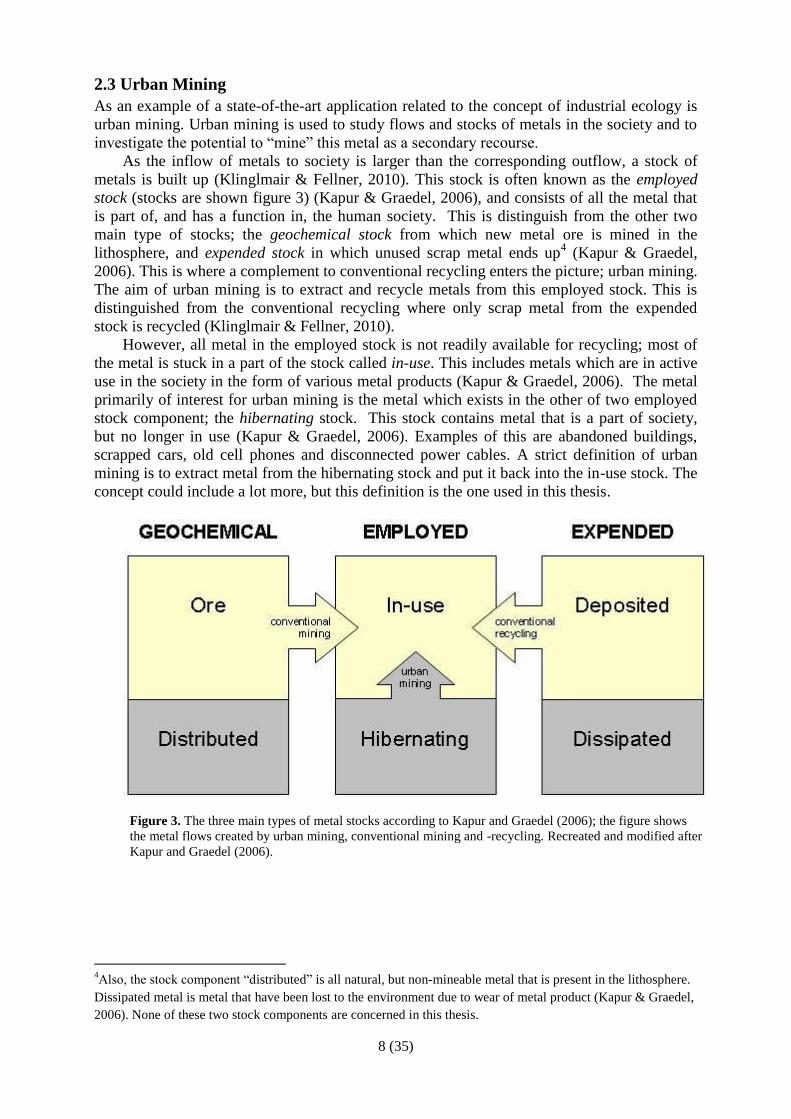
2.3 Urban Mining
As an example of a state-of-the-art application related to the concept of industrial ecology is
urban mining. Urban mining is used to study flows and stocks of metals in the society and to
investigate the potential to “mine” this metal as a secondary recourse.
As the inflow of metals to society is larger than the corresponding outflow, a stock of
metals is built up (Klinglmair & Fellner, 2010). This stock is often known as the employed
stock (stocks are shown figure 3) (Kapur & Graedel, 2006), and consists of all the metal that
is part of, and has a function in, the human society. This is distinguish from the other two
main type of stocks; the geochemical stock from which new metal ore is mined in the
lithosphere, and expended stock in which unused scrap metal ends up4 (Kapur & Graedel,
2006). This is where a complement to conventional recycling enters the picture; urban mining.
The aim of urban mining is to extract and recycle metals from this employed stock. This is
distinguished from the conventional recycling where only scrap metal from the expended
stock is recycled (Klinglmair & Fellner, 2010).
However, all metal in the employed stock is not readily available for recycling; most of
the metal is stuck in a part of the stock called in-use. This includes metals which are in active
use in the society in the form of various metal products (Kapur & Graedel, 2006). The metal
primarily of interest for urban mining is the metal which exists in the other of two employed
stock component; the hibernating stock. This stock contains metal that is a part of society,
but no longer in use (Kapur & Graedel, 2006). Examples of this are abandoned buildings,
scrapped cars, old cell phones and disconnected power cables. A strict definition of urban
mining is to extract metal from the hibernating stock and put it back into the in-use stock. The
concept could include a lot more, but this definition is the one used in this thesis.
4Also, the stock component “distributed” is all natural, but non-mineable metal that is present in the lithosphere.
Dissipated metal is metal that have been lost to the environment due to wear of metal product (Kapur & Graedel,
2006). None of these two stock components are concerned in this thesis.
Figure 3. The three main types of metal stocks according to Kapur and Graedel (2006); the figure shows
the metal flows created by urban mining, conventional mining and -recycling. Recreated and modified after
Kapur and Graedel (2006).

9 (35)
Figure 4. The McKelvey resource classification system shown in a so called McKelvey box. The reserves
box represents the available resources for human extraction because of economical feasibility. The arrow is
representing the potential prospecting for urban mining. The figure is based on work by Smil (2003).
The extraction of the metals from the hibernating stock in the antroposphere can be compared
with conventional mining, where the McKelvey resource classification system is used to
classify and distinguish so called reserves from other resources (see figure 4). Reserves are
natural resources that are available for extraction since their locations are known and
extraction is economically feasible. Resources on the other hand, are not primary available for
extraction because of marginal economical feasibility (Smil, 2003). This view could also be
applied for urban mining situation, where hibernating stocks could be considered for as a non-
reserve because of uncertain economical feasibility and stocks location. Just like in
conventional mining where prospecting is used to enlarge the reserve stock similar
“prospecting”, in the form of urban mining studies, could be used to find and identify reserves
in the employed stock.
To reduce the extent of the potential issues caused by falling ore grades (Norgate & Hauge,
2009; Klinglmair & Fellner, 2010) and rising raw material prices, urban mining can be a
valuable measure. Urban areas, and their accumulated stocks of metals, could act as pools of
secondary resources to reduce the need of primary resources. According to Kinglmair and
Fellner (2010) urban mining even has the potential to become more important than traditional
ore mining. Also, more scarce supplies of primary ore in the future could further increase
need and importance of urban mining (Klinglmair & Fellner, 2010). An example of the
consequences of rising metal prices on the market is the looting of power cables in Russia
were miles of both live and disconnected power cables is stolen annually (Tyler, 2000). This
could be seen as an extreme variety of urban mining.
The significance and possibility of urban mining as a potential secondary resource is
illustrated by Kinglmair and Fellner (2010) who describes the raw material shortage situation
in Austria during World War I. According to the said study no more than 10 % of the
domestic copper demand was covered by primary ore mining at the time, while the supply
from urban mining was approximately three times larger during 1917. Another urban mining
study, which also is somewhat similar to this thesis, is Beers and Graedel (2003) who
quantified the in-use copper stock in Cape Town, South Africa in order to evaluates its
potential as a secondary resource. The study did, amongst else, quantify the copper content in

10 (35)
infrasystems like power cables and telephone lines, and investigated the potential in these
stocks as a source of copper.
A hibernating stock of significant size is the infrasystems that consists of power- and
communication cables, water-, sewage- and heat pipes etc. Wendell (2005) concludes that the
hibernating stock of cables in Sweden has a mass of approximately 800,000 tons of copper
and aluminium, which equals to an economic value of about 30 GSEK. Also, a study by
Krook et al. (2011) estimates that the amount of hibernating cables in local power grids, in
Gothenburg as an example, is as much as 17 %.
The practice of extracting metals from the anthropogenic stock, and in particular built
urban areas, is surrounded by several complications. These complications are mainly of
economical character. This is highlighted by Krook et al. who investigates the cost associated
to the extraction of different types of hibernating cables (2010). Common issues related to this
include excavation, soil storage, land rental, shutting of the traffic and site restoration, which
are relatively costly. These issues are primary related to so called separate recovery in built
urban areas were only the hibernating cable itself is extracted. According to Krook et al.
(2010) one could practice integrated recovery; which means that hibernating cables is
recovered during other works, such as maintenance of existing active cables. The authors
conclude that the economical feasibility of cable recovery in a built city environment is very
low. At current metal prices the costs related to cable recovery often outweighs the revenues
(Krook et al., 2010).
11 (35)
3 Material and Methods The used method in this thesis is essentially based on MFA; more specifically, it makes use of
the previously mentioned static quantification. It could also be mentioned that this method not
has been used before in this context, as in quantifying infrasystems on this level of detail. This
contributes to a higher quality of data and a more precise result compared to other studies in
the same field using slightly different methods.
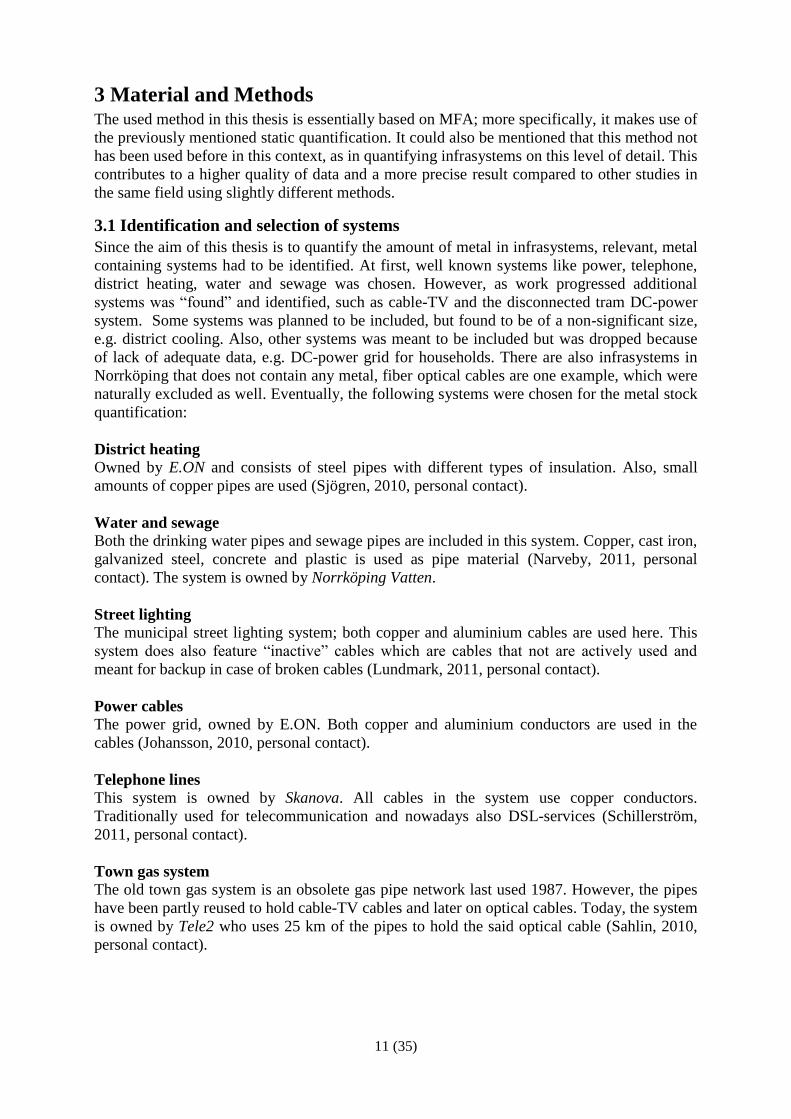
3.1 Identification and selection of systems
Since the aim of this thesis is to quantify the amount of metal in infrasystems, relevant, metal
containing systems had to be identified. At first, well known systems like power, telephone,
district heating, water and sewage was chosen. However, as work progressed additional
systems was “found” and identified, such as cable-TV and the disconnected tram DC-power
system. Some systems was planned to be included, but found to be of a non-significant size,
e.g. district cooling. Also, other systems was meant to be included but was dropped because
of lack of adequate data, e.g. DC-power grid for households. There are also infrasystems in
Norrköping that does not contain any metal, fiber optical cables are one example, which were
naturally excluded as well. Eventually, the following systems were chosen for the metal stock
quantification:
District heating
Owned by E.ON and consists of steel pipes with different types of insulation. Also, small
amounts of copper pipes are used (Sjögren, 2010, personal contact).
Water and sewage
Both the drinking water pipes and sewage pipes are included in this system. Copper, cast iron,
galvanized steel, concrete and plastic is used as pipe material (Narveby, 2011, personal
contact). The system is owned by Norrköping Vatten.
Street lighting
The municipal street lighting system; both copper and aluminium cables are used here. This
system does also feature “inactive” cables which are cables that not are actively used and
meant for backup in case of broken cables (Lundmark, 2011, personal contact).
Power cables
The power grid, owned by E.ON. Both copper and aluminium conductors are used in the
cables (Johansson, 2010, personal contact).
Telephone lines
This system is owned by Skanova. All cables in the system use copper conductors.
Traditionally used for telecommunication and nowadays also DSL-services (Schillerström,
2011, personal contact).
Town gas system
The old town gas system is an obsolete gas pipe network last used 1987. However, the pipes
have been partly reused to hold cable-TV cables and later on optical cables. Today, the system
is owned by Tele2 who uses 25 km of the pipes to hold the said optical cable (Sahlin, 2010,
personal contact).

12 (35)
Cable-TV
A cable-TV network that was owned and operated by Hyresbostäder i Norrköping and
installed in the mentioned gas pipes. Nowadays the net is unused and therefore completely
hibernating. The system uses co-axial aluminium cables (Sandell, 2010, personal contact).
Tram DC-power cables
Consists of two separate systems; a larger DC-system made of copper, and a new smaller
system that replaced the older one in 2010 (Lundmark, 2011, personal communcation). The
newer system uses both aluminium and copper conductors, and transmits power through the
regular AC-grid over some of the longer distances. The newer system is therefore smaller.
The older system is completely unused.
3.2 Data collection on the length and composition of the studied infrasystems
In order to fulfill the objective of this thesis, spatial and physical data describing the examined
systems was collected. The respective owner of each system was contacted. The aim was to
collect GIS-layers for every system to quantify their metal content. This since GIS is,
according to Kapur and Graedel (2006), a valuable tool for this static quantification. The used
method of static quantification is also very time-consuming since spatial data for complete
infrasystems must be handled. To store and make use of data describing the location and
physical attributes of every object in an infrasystem, GIS is an invaluable tool. Without GIS,
this method would be practically impossible to use in any but in a very small scale.
This collection of data was possible for street lighting and water and sewage systems.
One significant weakness in this GIS data for the water and sewage and street lighting is the
lack of data describing the hibernating parts. All hibernating objects are continuously
removed from the GIS by the system owners and a static quantification is therefore not
possible (Narveby, 2011, personal contact; Lundmark, 2011, personal contact).
As for district heating, no GIS-data was handed out since the data was considered to be of
such critical nature that it could not be handed out. The quantification and calculations of the
metal stock was made on-site at the system owner, E.ON, using their GIS system (Facil Plus).
A distinction between in-use and hibernating system parts was possible for this system.
For most of the systems, however, GIS ready data was not possible to obtain. In the case
of power cables, telephone lines, the old tram DC-power and cable TV analogue maps was
Type of
system
System length
(Butängen
only)
Pipes or
cables?
Type of
metal
In operation or
disconnected
Addressed stocks
NK=Norrköping
SB=Södra Butängen
Type of data
sources
District
heating
400 (5.3) km pipes steel, copper in operation NK & SB, in-use &
hibernating
GIS
Town gas 147 km pipes steel, iron disconnected NK, Hibernating Historical
sources
Power grid (27) km cables copper,
aluminium
in operation SB, In-use & hibernating Physical maps
Telephone (11) km cables copper in operation SB, In use & hibernating Physical maps
Old tram
DC-power
12 km cables copper disconnected NK, Hibernating Physical maps
New tram
DC-power
4.6 km cables copper,
aluminium
in operation NK, In-use Specification list
Cable-TV 4 km cables aluminium disconnected NK, Hibernating Physical maps
Water &
sewage
967 (11) km pipes steel, iron,
copper
in operation NK, & SB. In-use GIS
Street
lighting
767 (46) km cables copper,
aluminium
in operation NK & SB, In-use GIS
Table 1. A summary of the analyzed systems and their characteristics

13 (35)
collected instead. These maps then had to be digitalized by hand using GIS-software (ESRI
ArcMap 10). The maps for the power cables, was used up until the year 2005 (Johansson,
2010, personal contact). Eventual changes in the system after 2005 have therefore not been
observed. These maps are, however, the only source for hibernating cables since hibernating
objects are not included in the superseding digital system (Johansson, 2010, personal contact).
Data describing hibernating cables are present in the maps for telephone lines. However,
it was said (Schillerström, 2011, personal communication) that there are several complications
regarding hibernating telephone lines; the cables themselves may be crucial for the support of
concrete canalizations and that the occurrence of hibernating cables are rare.
For the town gas system and the new tram DC-power no spatial data was available.
Instead, for town gas, different sources of historical data (Ekdahl, 1951; Norrköping, 1938-
1965) describing the physical properties of the system had to be combined. However, as parts
of this system are used as canalization for optical cable (Sahlin, 2010, personal contact), parts
of the system is not truly hibernating.
The data for the new tram DC-power cables was available as listed specifications for the
cables (Nilsson, 2011, personal contact). Also, no parts of this system are hibernating since it
is recently installed.
Because of the lack of available GIS-data, a quantification of the metal stocks for power
cables and telephone lines was performed for Södra Butängen only and not for the rest of
Norrköping. This since manual digitalizing of analogue maps for a whole city is not possible
within the scope of this thesis. In complement to all collected data concerning these systems,
interviews with system owner representatives was performed to gather missing or
complementary data not available in the data material.
3.3 Calculation of metal stocks
When all necessary data had been collected, the GIS-layers were imported into GIS and
layered over a base map. These layers are in the forms of vector files, where each object, in
this case cables or pipes, are represented by a single vector line. For those systems where no
GIS-layers were obtained, copies of the physical maps were imported instead. On top of these
maps, new vectors were created by hand. Each vector represented a single cable or pipe.
Attribute data for hibernation state, dimensions and types were added to each vector. This
data was acquired partly from the maps and partly from the interviews. With all the necessary
data added, the respective attribute table for each system was exported to an Excel
spreadsheet. To calculate the metal content, values for area and length were multiplied for
each object to calculate the metal volume. The real metal concentration for each and every
object separately was used in calculation. The volume was then multiplied with the density for
each of the three metals. Equivalent calculations were performed for the town gas system and
the new tram DC-cables. For more detail concerning the calculation for each infrasystem see
appendices 1-5.
3.4 Economical valuation of the metal stocks
To perform the valuation of the metal stocks, scrap metal prices was acquired from Göran
Thorsell (2011, personal contact) at the recycling company Stena Recycling.
3.5 Reliability and validity of the data and the calculations
Some issues are adhering in these calculations. All uncertainties and assumptions related to
the calculations are more thoroughly presented in appendix 6 based on the ideas of Hedbrandt
and Sörme (2000). This shows that most of the data uncertainties adhere to the calculations of
the town gas system. This since the quantifications of the system is based on historical source
and not on spatial data. However, as Hedbrandt and Sörme (2000) suggests, the data
uncertainties should be quantified to achieve a total uncertainty interval, this has not been
performed in this thesis.
14 (35)
Some of the more important questions regarding reliability are:
For some systems, there are missing data for hibernating objects. For instance, street
lighting where data regarding hibernating cables are missing in the system owners
GIS-system.
Attribute data regarding specifications for cables and pipes are missing in some GIS-
layers. It is unknown if these objects contain metals. For water and sewage these
objects have been left out from the analysis. For the other systems a mean value has
been used instead.
Some data is based on assumptions and estimations regarding the physical property of
the system. This does especially apply to the town gas system where no GIS-files or
maps have been obtained.
For the systems where no GIS-layers were obtained, manual digitalizing of the objects
was used instead. This is a potential weakness in the method since the accuracy is
sometimes suboptimal. Physical paper maps are first scanned and then imported in to
GIS-software where the vectors are drawn by hand in accordance to the appearance of
the objects in the maps.
For telecommunication cables, the thickest, most copper rich transportation-network
cables have not been quantified since the metal content in these are unknown, even by
the system owner (Schillerström, 2011, personal contact).
However, despite a handful uncertainties and reliability issues the used method offers
a fairly high precision compared to many other studies in the same field, like Beers
and Graedel (2003). In this thesis a quantification of the metal content in more or less
every object, using every object’s individual metal concentration, is performed.
15 (35)
4 Metal stocks in the infrasystems of Södra Butängen The results from metal stock quantification are presented below and are divided between
Norrköping as a whole and Södra Butängen. Each metal is presented separately and is divided
on in-use, hibernating and “inactive” metal. Note the differing scales on the figures.
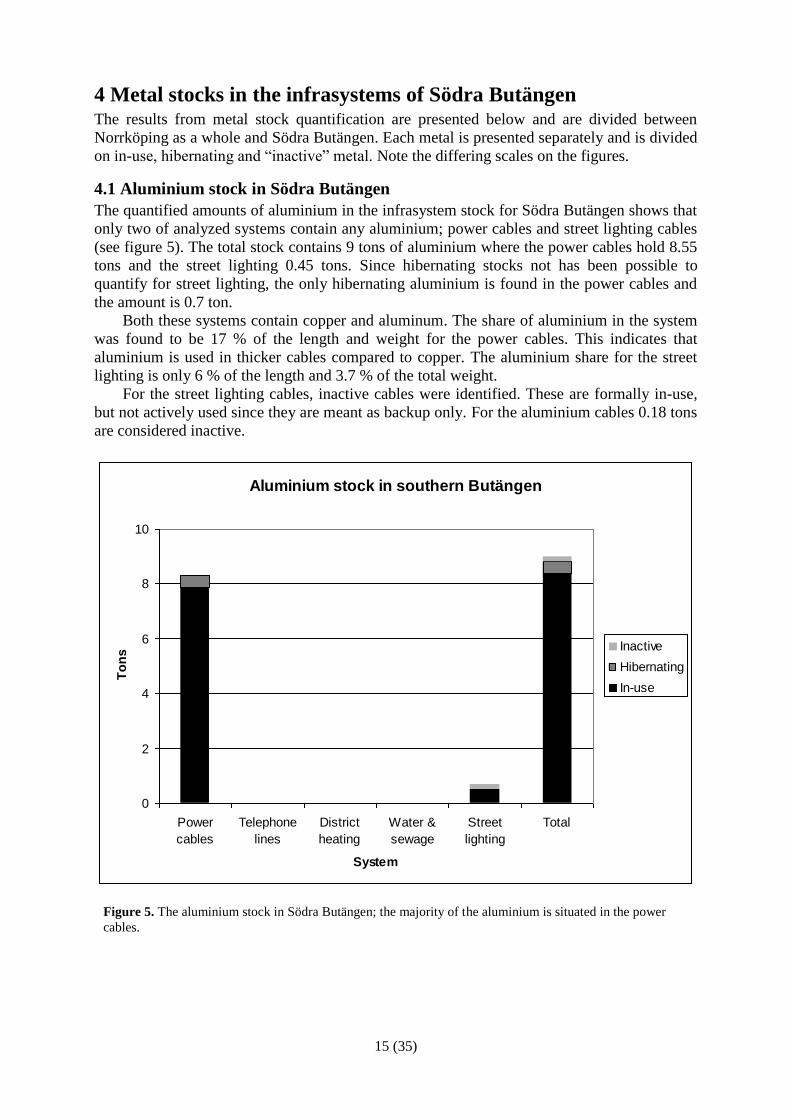
4.1 Aluminium stock in Södra Butängen
The quantified amounts of aluminium in the infrasystem stock for Södra Butängen shows that
only two of analyzed systems contain any aluminium; power cables and street lighting cables
(see figure 5). The total stock contains 9 tons of aluminium where the power cables hold 8.55
tons and the street lighting 0.45 tons. Since hibernating stocks not has been possible to
quantify for street lighting, the only hibernating aluminium is found in the power cables and
the amount is 0.7 ton.
Both these systems contain copper and aluminum. The share of aluminium in the system
was found to be 17 % of the length and weight for the power cables. This indicates that
aluminium is used in thicker cables compared to copper. The aluminium share for the street
lighting is only 6 % of the length and 3.7 % of the total weight.
For the street lighting cables, inactive cables were identified. These are formally in-use,
but not actively used since they are meant as backup only. For the aluminium cables 0.18 tons
are considered inactive.
Aluminium stock in southern Butängen
0
2
4
6
8
10
Power
cables
Telephone
lines
District
heating
Water &
sewage
Street
lighting
Total
System
To
ns Inactive
Hibernating
In-use
Figure 5. The aluminium stock in Södra Butängen; the majority of the aluminium is situated in the power
cables.
16 (35)
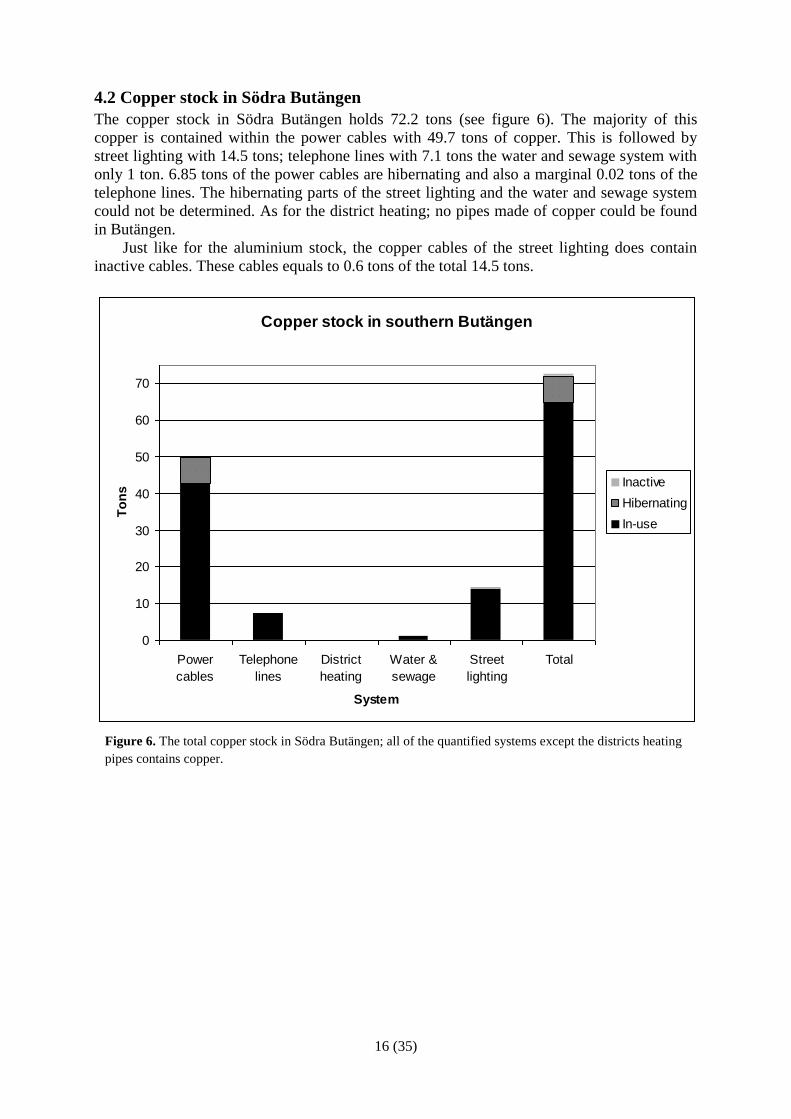
Figure 6. The total copper stock in Södra Butängen; all of the quantified systems except the districts heating
pipes contains copper.
4.2 Copper stock in Södra Butängen
The copper stock in Södra Butängen holds 72.2 tons (see figure 6). The majority of this
copper is contained within the power cables with 49.7 tons of copper. This is followed by
street lighting with 14.5 tons; telephone lines with 7.1 tons the water and sewage system with
only 1 ton. 6.85 tons of the power cables are hibernating and also a marginal 0.02 tons of the
telephone lines. The hibernating parts of the street lighting and the water and sewage system
could not be determined. As for the district heating; no pipes made of copper could be found
in Butängen.
Just like for the aluminium stock, the copper cables of the street lighting does contain
inactive cables. These cables equals to 0.6 tons of the total 14.5 tons.
Copper stock in southern Butängen
0
10
20
30
40
50
60
70
Power
cables
Telephone
lines
District
heating
Water &
sewage
Street
lighting
Total
System
To
ns
Inactive
Hibernating
In-use
17 (35)
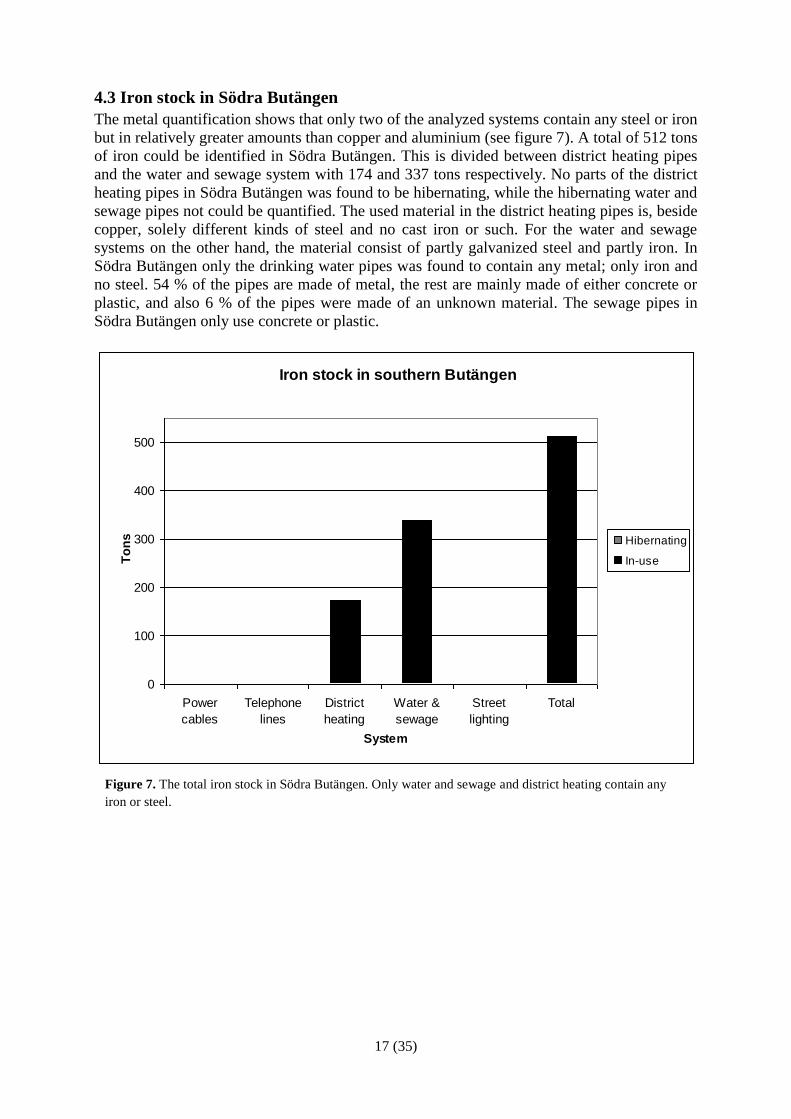
Figure 7. The total iron stock in Södra Butängen. Only water and sewage and district heating contain any
iron or steel.
4.3 Iron stock in Södra Butängen
The metal quantification shows that only two of the analyzed systems contain any steel or iron
but in relatively greater amounts than copper and aluminium (see figure 7). A total of 512 tons
of iron could be identified in Södra Butängen. This is divided between district heating pipes
and the water and sewage system with 174 and 337 tons respectively. No parts of the district
heating pipes in Södra Butängen was found to be hibernating, while the hibernating water and
sewage pipes not could be quantified. The used material in the district heating pipes is, beside
copper, solely different kinds of steel and no cast iron or such. For the water and sewage
systems on the other hand, the material consist of partly galvanized steel and partly iron. In
Södra Butängen only the drinking water pipes was found to contain any metal; only iron and
no steel. 54 % of the pipes are made of metal, the rest are mainly made of either concrete or
plastic, and also 6 % of the pipes were made of an unknown material. The sewage pipes in
Södra Butängen only use concrete or plastic.
Iron stock in southern Butängen
0
100
200
300
400
500
Power
cables
Telephone
lines
District
heating
Water &
sewage
Street
lighting
Total
System
To
ns Hibernating
In-use
18 (35)
5 Metal stock in selected infrasystems in Norrköping
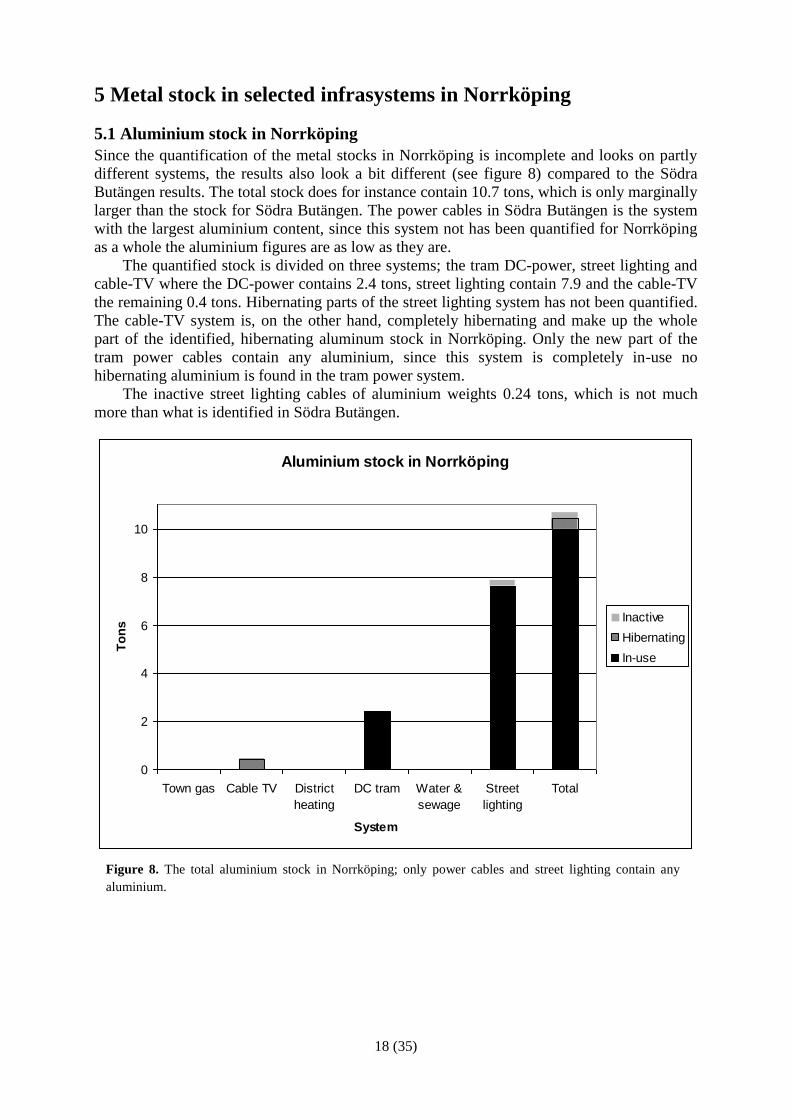
5.1 Aluminium stock in Norrköping
Since the quantification of the metal stocks in Norrköping is incomplete and looks on partly
different systems, the results also look a bit different (see figure 8) compared to the Södra
Butängen results. The total stock does for instance contain 10.7 tons, which is only marginally
larger than the stock for Södra Butängen. The power cables in Södra Butängen is the system
with the largest aluminium content, since this system not has been quantified for Norrköping
as a whole the aluminium figures are as low as they are.
The quantified stock is divided on three systems; the tram DC-power, street lighting and
cable-TV where the DC-power contains 2.4 tons, street lighting contain 7.9 and the cable-TV
the remaining 0.4 tons. Hibernating parts of the street lighting system has not been quantified.
The cable-TV system is, on the other hand, completely hibernating and make up the whole
part of the identified, hibernating aluminum stock in Norrköping. Only the new part of the
tram power cables contain any aluminium, since this system is completely in-use no
hibernating aluminium is found in the tram power system.
The inactive street lighting cables of aluminium weights 0.24 tons, which is not much
more than what is identified in Södra Butängen.
Aluminium stock in Norrköping
0
2
4
6
8
10
Town gas Cable TV District
heating
DC tram Water &
sewage
Street
lighting
Total
System
To
ns
Inactive
Hibernating
In-use
Figure 8. The total aluminium stock in Norrköping; only power cables and street lighting contain any
aluminium.
19 (35)
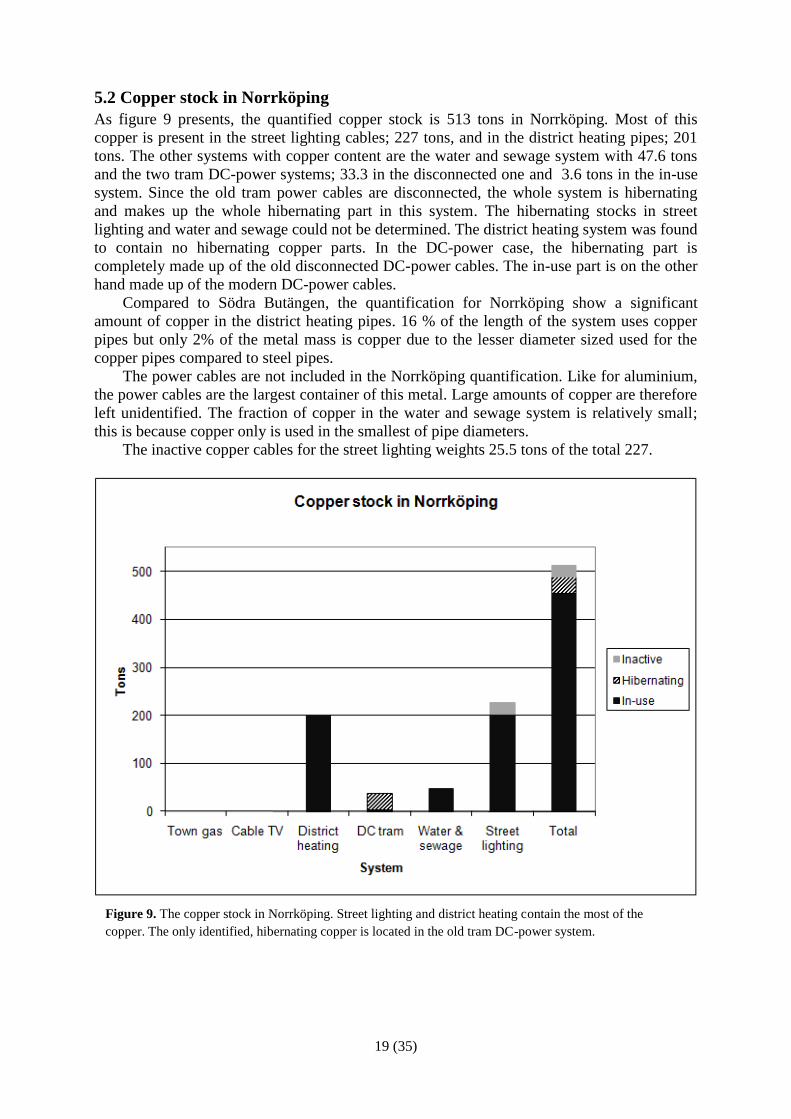
5.2 Copper stock in Norrköping
As figure 9 presents, the quantified copper stock is 513 tons in Norrköping. Most of this
copper is present in the street lighting cables; 227 tons, and in the district heating pipes; 201
tons. The other systems with copper content are the water and sewage system with 47.6 tons
and the two tram DC-power systems; 33.3 in the disconnected one and 3.6 tons in the in-use
system. Since the old tram power cables are disconnected, the whole system is hibernating
and makes up the whole hibernating part in this system. The hibernating stocks in street
lighting and water and sewage could not be determined. The district heating system was found
to contain no hibernating copper parts. In the DC-power case, the hibernating part is
completely made up of the old disconnected DC-power cables. The in-use part is on the other
hand made up of the modern DC-power cables.
Compared to Södra Butängen, the quantification for Norrköping show a significant
amount of copper in the district heating pipes. 16 % of the length of the system uses copper
pipes but only 2% of the metal mass is copper due to the lesser diameter sized used for the
copper pipes compared to steel pipes.
The power cables are not included in the Norrköping quantification. Like for aluminium,
the power cables are the largest container of this metal. Large amounts of copper are therefore
left unidentified. The fraction of copper in the water and sewage system is relatively small;
this is because copper only is used in the smallest of pipe diameters.
The inactive copper cables for the street lighting weights 25.5 tons of the total 227.
Figure 9. The copper stock in Norrköping. Street lighting and district heating contain the most of the
copper. The only identified, hibernating copper is located in the old tram DC-power system.

20 (35)
5.3 Iron stock in Norrköping
Iron is, according to the quantification, present in significantly greater amount than the other
metals (see figure 10). A total of 28,700 tons of iron could be identified. 13,867 tons of this
metal can be found in the water and sewage system; 10,648 tons in the district heating system
and somewhere between 4,200-5,350 tons in the town gas system depending on chosen
parameters in the calculations. The whole town gas system is unused and is therefore
considered hibernating. Of the district heating system 894 tons is in a hibernating state. A
quantification of the hibernating parts of the water and sewage system could not be
performed.
Both the town gas system and the water and sewage system are made from part steel and
part iron. In the town gas case this iron-steel ratio is 62:38 in system length. The used
materials are cast iron and welded steel respectively. There is also mentionable difference
between water pipes and sewage pipes. The drinking water pipes contain 69 % metal of which
less than 1 % is galvanized steel and the rest is cast or grey iron. For the sewage pipes
concrete and plastic dominates; only a tiny fraction at less than 1 % consists of metal.
Figure 10. The iron stocks in Norrköping, divided between three systems.
21 (35)
Figure 11. The economical value of the metal stocks in Södra Butängen.
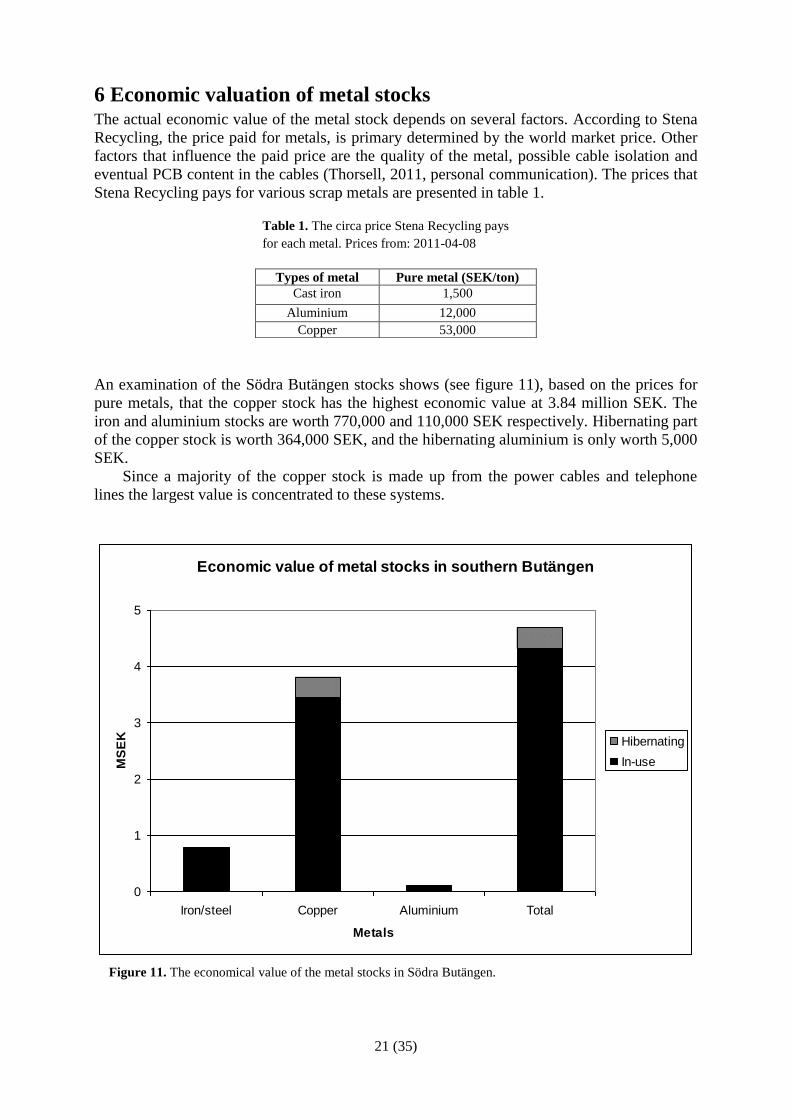
6 Economic valuation of metal stocks The actual economic value of the metal stock depends on several factors. According to Stena
Recycling, the price paid for metals, is primary determined by the world market price. Other
factors that influence the paid price are the quality of the metal, possible cable isolation and
eventual PCB content in the cables (Thorsell, 2011, personal communication). The prices that
Stena Recycling pays for various scrap metals are presented in table 1.
An examination of the Södra Butängen stocks shows (see figure 11), based on the prices for
pure metals, that the copper stock has the highest economic value at 3.84 million SEK. The
iron and aluminium stocks are worth 770,000 and 110,000 SEK respectively. Hibernating part
of the copper stock is worth 364,000 SEK, and the hibernating aluminium is only worth 5,000
SEK.
Since a majority of the copper stock is made up from the power cables and telephone
lines the largest value is concentrated to these systems.
Economic value of metal stocks in southern Butängen
0
1
2
3
4
5
Iron/steel Copper Aluminium Total
Metals
MS
EK Hibernating
In-use
Types of metal Pure metal (SEK/ton)
Cast iron 1,500
Aluminium 12,000
Copper 53,000
Table 1. The circa price Stena Recycling pays
for each metal. Prices from: 2011-04-08
22 (35)
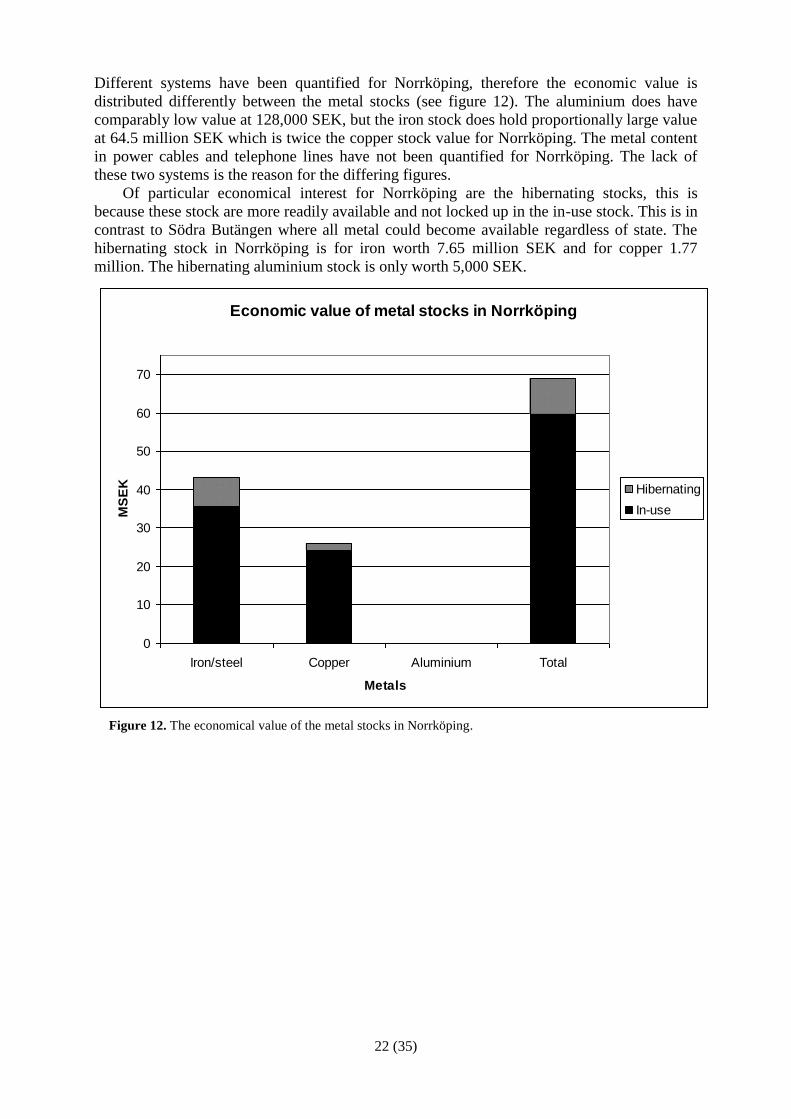
Figure 12. The economical value of the metal stocks in Norrköping.
Economic value of metal stocks in Norrköping
0
10
20
30
40
50
60
70
Iron/steel Copper Aluminium Total
Metals
MS
EK Hibernating
In-use
Different systems have been quantified for Norrköping, therefore the economic value is
distributed differently between the metal stocks (see figure 12). The aluminium does have
comparably low value at 128,000 SEK, but the iron stock does hold proportionally large value
at 64.5 million SEK which is twice the copper stock value for Norrköping. The metal content
in power cables and telephone lines have not been quantified for Norrköping. The lack of
these two systems is the reason for the differing figures.
Of particular economical interest for Norrköping are the hibernating stocks, this is
because these stock are more readily available and not locked up in the in-use stock. This is in
contrast to Södra Butängen where all metal could become available regardless of state. The
hibernating stock in Norrköping is for iron worth 7.65 million SEK and for copper 1.77
million. The hibernating aluminium stock is only worth 5,000 SEK.

23 (35)
7 Discussion As the presented results show, there is a sizable metal stock with a potential for urban mining
in Södra Butängen. With a mass of almost 600 tons and a market value of approximately 4.7
million SEK there should be strong reasons for a consideration to recycle parts of these metal
amounts. The largest share of this economic value is mainly related to the copper stocks,
which is dominated by the power cables. These cables also hold the largest hibernating part of
copper in Butängen; 16 % of the weight in the power cables is hibernating. This could be
compared with studies by Krook et al. (2011) who estimated a hibernation ratio of 17 % and
3.6 % in Gothenburg and Linköping respectively. Another study by Wendell (2005) suggests
that the ratio of hibernating copper in cables on the Swedish national scales is 31 %.
Although, the results from these studies are not directly comparable to this thesis since only a
single, industrial city district is analyzed here, and in the case of Wendell (2005) the figures
are aggregated. However, there are high costs related to the extraction of these stocks in the
form of infrasystems within a city (Krook et al., 2010; 2011). But since so called integrated
recovery (Krook, et al. 2010) can be practiced in the Butängen case, the extraction can be
done with less cost.
There are also some other complications that must be considered before an eventual
extraction. There may, for instance, be system parts in Butängen that is vitally connected to
other parts of the system; e.g. telephone lines in Södra Butängen may connect with lines in
other parts of the city. Other complications could also be of environmental character; some
cables may for instance contain toxic substances which could constitute a potential hazard
(Thorsell, 2011, personal communication).
The quantification of the metal stocks made for the rest of Norrköping does also
demonstrate significant amounts of metal with a total stock of almost 30,000 tons. However,
the situation for Norrköping looks different; more or less the whole metal stock in Södra
Butängen could be made available for extraction, an opportunity which is not possible to the
same extent for the whole of Norrköping. To dismantle and extract a fully working
infrasystem in-use for a whole city is neither desirable nor practically possible. The stocks of
interest though, from an urban mining perspective, are the hibernating parts (Kapur &
Graedel, 2006) of the infrasystems, as a possible secondary resource. This since these parts no
longer are in-use and could be extracted without affecting the functionality of the in-use
infrasystems. The calculated economical value for these hibernating parts is approximately
8.5 millions SEK. This economical value is related mostly to the hibernating town gas system;
a system which is not completely hibernating though since parts of the system is used for hold
optical cables. There is also a possible issue concerning the economical value of the stocks.
Especially in the case of the partly 150-year old (Ekdahl, 1951) town gas system, some pipes
can have been exposed to corrosion, which would affect the prices paid for the metals.
However, sooner or later parts of the in-use infrasystems could become disconnected and
hibernating, for instance when cables or pipes reaches the end of their service life. Through
this, parts of the quantified amounts of the in-use metals could therefore in the long term
become available for extraction.
In addition to this quantified amount, there is an unidentified potential for even larger
stocks; several systems have not been possible to quantify, including the power cables and
telephone lines which are systems with a major copper content. There is, in other words, a
significantly larger economic value hidden in these non-quantified stocks. The economic
valuation for Södra Butängen, with its copper rich power cables, shows this; the copper cables
hold a proportionally large economic value. There are also probably much larger hibernating
stocks too, stocks that not have been quantified due to scarcity of data concerning these
systems; street lighting is one example of this.
Of significant interest to urban mining are also the relatively large stocks of hibernating
metal that consists of whole obsolete systems that nowadays have lost their intended function.
24 (35)
Mentionable examples are the town gas system and the DC-power grid for households. As the
town gas system proves, these systems can hold large amount of hibernating metal. What
make these systems differ from the others is that they have no clear owner or other interested
actors. This does also mean that there are few who have interest in keeping data and
documentation describing these systems. The collection of data describing these systems is
therefore very difficult and requires the use of historical sources. The town gas system is a
notable exception to this since it has found a new use. This is an example how an old system
can be reused for another purpose. This does also show that it is not necessarily determined
that the recycling of the infrasystems is preferable; the infrasystems could also be reused
instead of recycled. The telephone lines are another example of a system for that has found a
new area of use; where the primary function of telephone services has been complemented
with modern DSL-services (Schillerström, 2011, personal contact).
If these hibernating metal stocks are to be extracted as resources, like with traditional
mineral prospecting their location and quantity must be identified (Smil, 2003). There is,
however, one great obstacle that complicates this; the apparent disinterest to keep record of
disconnected and unused cables and pipes of some of the system owners. During the data
collection it became clear that this is not always the highest priority with the system owners.
For the used static method, this leads to severe issues with the data availability as hibernating
stocks not always can be fully quantified. Even if this data is available, it is many times
sensitive information that is not easily obtained due to the criticality of infrasystems. For
future studies using the same method, this is a problem that must be considered.
Simultaneously, in those cases where digital GIS-data for the systems were available, GIS
proved to be a very helpful tool for static quantification just as Kapur and Graedel states
(2006).
This study clearly shows that there is a potential for urban mining in Norrköping, and
especially for Södra Butängen. However, it may not be economically feasible to extract these
metals today. But if the ore grades will continue to fall (Norgate & Hauge, 2009) and the
metal consumption rise (Wittmer, Lichtensteiger & Wittmer, 2007), the metal prices, and in
turn the attractiveness of urban mining, would increase. In other words the reserve, or the
stock of extractable resources, could grow as prices increases and stocks are identified (Smil,
2003). Urban mining of city infrasystems seems to offer a promising opportunity to meet the
future resource demands, especially in the case of city redevelopment projects like Södra
Butängen. If this is to be made possible the various actors and stakeholders, such as system
owners and the municipality, would have to cooperate. According to Krook et al. (2010) this
is traditionally uncommon since this is located outside the actors’ primary sphere of interest.
Also, several opportunities for additional studies have been identified during the work
with this thesis. Most notably is a quantification of the power- and telecommunication cables
which not has been quantified for the whole of Norrköping. These cables most likely hold a
great economical value since they are made out of valuable copper and could potentially offer
urban mining possibilities. However if these infrasystems are to be quantified, an other
method than the used static quantification would most likely have to be used due to the format
and availability of data for these system.
There is also another system which not has been quantified at all; the DC-power cables
for households. This is a completely hibernating system that also is made of valuable copper.
A quantification of this system would require a supplementary data from historical sources to
be made possible.

25 (35)
8 Conclusions
The southern parts of Butängen have been quantified to hold a total metal stock of
almost 600 tons of metal; copper, iron and aluminium included. The stock has an
economical value of approximately 4.7 million SEK, mostly related to the copper
content in the power cables.
For Norrköping as a whole the total stock was quantified to almost 30,000 tons of
metal. Most of this is iron or steel. The hibernating parts of this stock is in the size of
5,100 tons where the majority of this consist of the old town gas system. The stocks
are in total worth over 70 million SEK, and the hibernating part approximately 9.5
million SEK.
There are large metal stocks, mainly of copper, that not have been possible to quantify
for the whole of Norrköping. This is due to the format of the available data which
many times only are available in non-digital format. These unidentified stocks do
probably hold the largest economical value due to copper content in, for example,
power cables.
The stocks that generally are of most interest for urban mining, the hibernating ones,
are not always easy to quantify. The data needed to quantify these stocks are in some
cases non-existent, which makes a quantification of these stocks nearly impossible.
There seems to be a potential for urban mining in Södra Butängen, especially with the
valuable copper stock and the redevelopment plans in mind. This opportunity for
urban mining should be evaluated and considered.

26 (35)
References Anderberg, S. (1998). Industrial metabolism and the linkages between economics, ethics and
the environment. Ecological Economics 24(1998): 311–320
Beers, D. van and Graedel, T.E. (2003). The magnitude and spatial distribution of in-use
copper stocks in Cape Town, South Africa. South African Journal of Science 99(2003):
61-69
Brunner, P.H. and Rechberger, H. (2004). Practical Handbook of Material Flow Analysis.
Austria: CRC/Lewis
Brunner, P.H. (2007). Reshaping urban metabolism. Journal of industrial ecology. 2(11): 11-
13
CommScope (n.d.A). QR 540 Series Cables Product Descriptions. CommScope
CommScope (n.d.B). QR 860 Series Cables Product Descriptions. CommScope
EBR (2009). Hälsa – Miljö Säkerhet: Hantering av uttjänt kabel. Swedenergy AB
Ekdahl, D. (1951). Norrköpings gasverk 1851-1951: En hundraårskrönika: Kort översikt över
verksamheten under ett sekel. Norrköping: Gasverket
Frosch, R.A. (1992). Industrial ecology: a philosophical introduction. Proceedings of the
National Academy of Sciences 89(1992): 800-803
Garner, A. and Keolian, G.A. (1995). Industrial Ecology: An Introduction. Ann Arbour:
National Pollution Prevention Center for Higher Education
Graedel, T.E., Vandeers, D., Bertram, M., Fuse, K., Gordon, R.B., Gritsinin, A., Kapur, A.,
Klee, R.J., Lifset, R.J., Memon, L., Rechberger, H., Spatari, S and Vexler, D. (2004).
Multilevel cycle of anthropogenic copper. Environmental Science & Technology 38(4):
1242-1252
Hedbrandt, J. and Sörme, L. (2000). Data Vagueness and Uncertainties in Urban Heavy-Metal
Data Collection. Water, Air, and Soil Pollution: Focus 1(2001): 43-53
Kapur, A. and Graedel, T.E. (2006). Copper Mines Above and Below the Ground.
Environmental Science & Technology 40(10): 3135-3141
Klinglmair, M. and Fellner, J. (2010). Urban Mining in Times of Raw Material Shortage
Copper Management in Austria During World War I. Journal of Industrial Ecology.
14(4): 666-679
Krook, J., Eklund, M., Carlsson, A., Frändegård, P. and Svensson, N. (2010). Urban Mining –
Prospecting for Metals in the Invisible City. Conference paper. ERSCP-EMSU
conference, Knowledge collaboration & learning for sustainable innovation, 25-29
October 2010, Delft, The Netherlands
Krook, J., Carlsson, A., Eklund, M., Frändegård, P. and Svensson, N. (2011). Urban Mining:
Hibernating Copper Stocks in Local Power Grids. Journal of Cleaner Production,
Article in Press
Lantmäteriet (2003). Stadskartan [CD-ROM]. Gävle: Kartförlaget
Norgate, T. and Haque, N. (2009). Energy and greenhouse gas impacts of mining and mineral
processing operations. Journal of Cleaner Production (18): 266–274
Norrköping (1938-1985). Statistisk årsbok för Norrköpings stad. Norrköping:
Drätselkammarens utrednings- och organisationskontor.
Norrköping Municipality (2009). Fördjupning av översiktsplanen för Resecentrum och södra
Butängen. Norrköping: Norrköpings kommun, Stadsbyggnadskontoret, Fysisk planering
O’Rourke, D., Connely, L. and Koshland, C.P. (1996). Industrial Ecology: a critical review.
International Journal of Environment and Pollution 6(2): 89-112
SCB (2009). Varuflöden/materialflöden (MFA), biomassa, mineraler och fossila bränslen.
Import, export, inhemsk produktion och konsumtion av produkter/varor efter produkt,
nivå 5. År 1998-2005 [online]. Available online: <http://www.ssd.scb.se/> (2011-04-10)
Smil, V. (2003) Energy at the crossroads: global perspectives and uncertainties.
Massachusetts Institute of Technology: USA, citing: McKelvey, V.E. (1973). Mineral
27 (35)
resource estimates and public policy. In United States Mineral Resources, eds. Brobst,
D.A. and Pratt, W.P. 9-19, Washington, DC: USGS
Spatari, S., Bertram, M., Gordon, R.B., Henderson, K. and Graedel, T.E. (2005). Twentieth
century copper stocks and flows in North America: A dynamic analysis. Ecological
Economics 54(2005): 37–51
Sörme, L., Bergbäck, B. and Lohm, U. (2000). Century Perspective Of Heavy Metal Use In
Urban Areas – A Case Study in Stockholm. Water, Air, and Soil Pollution: Focus
1(2001): 197-211
UNEP (2010). Metal Stocks In Society – Scientific Synthesis. United Nations Environmental
Programme
Tyler, P.E. (2000). Thieves Looting Russia of Its Power Lines [online]. The New York Times,
2000-04-18. Available online: <http://www.nytimes.com/2000/04/18/world/thieves-
looting-russia-of-its-power-lines.html?src=pm> (2011-03-30)
Wang, T., Müller, D.B. and Graedel, T.E. (2007). Forging the anthropogenic iron cycle.
Environmental science & technology 41(14): 5120-5129
Wendell, J. (2005). Cables – Societal Stocks and Potential for Increased Recycling [master
thesis]. Linköping: Linköping University, Department of Mechanical Engineering
Wernick, I.K. and Themelis, N.J. (1998). Recycling Metals for the Environment. Annual
Review of the Energy and the Environment 1998(23): 465-497, citing Chapman, P.F. &
Roberts, F. (1983). Metal Resources and Energy. Boston: Butterworth
Wittmer, D., Lichtensteiger, T. and Wittmer, D. (2007). Exploration of urban deposits: long-
term prospects for resource and waste management. Waste management & research
(25): 220-226
Personal communication
Carlsson, Lars (2010). Former chief engineer at Norrköping gas plant
Johansson, Pia (2010). Document technician, E.ON Norrköping
Lundmark, Paul (2011). Electricity engineer, Norrköping Municipality
Narveby, Per (2011). Inquiry engineer, Norrköping Vatten
Nilsson, Stellan (2011). Electrical competency manager, Göteborgs spårvägar
Sahlin, Tony (2010). Planner, Tele2 Norrköping
Schillerström, Mats (2011). Net planner, Skanova Stockholm
Sjögren, Maud (2011). Distribution department, E.ON Norrköping
Thorsell, Göran (2011). Operation manager, Stena Recycling Norrköping.
28 (35)
Appendix 1 - Town gas calculations In order to calculate the metal content in the town gas system, several types of data describing
the physical properties of the system had to be acquired. The following data was collected:
Total pipe length of the system
Inner diameters of the pipes
Distribution of diameter types of the total system length
Thickness of the pipes
Pipe material and distribution of material types among the pipes.
Service pipe diameter and total length
The maximum length of each diameter type of pipe was used for the calculations. The used
diameter distribution up until 1950 is based on information from Ekdahl (1951). Between
1951 and 1970 the system expanded with another 25,092 meters (Norrköping, 1938-1985).
The diameter of the pipes used for this expansion is unknown. In the calculations an
assumption was made; the post-1951 expansion was made using the two most common
diameter types only; 100 mm and 150 mm pipes. The length of each diameter type is
presented in table A2:1.
According to Ekdahl (1951) all pipes installed before 1926 are made of cast iron and
pipes installed after 1942 are made of steel. The pipes installed between these years make use
of both steel and cast iron. In the calculations an assumption is done that the ratio of steel and
iron between 1926 and 1942 is 50:50. Also, ratios of 90:10 and 10:90 are used to calculate the
resulting weight interval.
The pipe wall thickness of cast iron pipes are, according to Karlsson (2010, personal
communication), 12-15 mm and 10 mm for steel pipes for pipes with an inner diameter over
75 mm. To calculate the resulting interval, both 12 and 15 mm thickness was used for the iron
pipes in the calculations. Pipe thickness is presented in table A2:2. The inner diameter used
for the service pipes is, according to Karlsson (2010, personal communication) 50, 75 and 100
mm. In the calculations a distribution at 45:45:10 respectively was assumed. With the inner
diameter and thickness known, the outer diameter could be calculated. Then, the area of the
inner diameter was subtracted from the outer diameter area. This was done for each diameter
type. The resulting difference was then multiplied with the corresponding maximum length of
each diameter type to obtain the total metal volume of the system. The volume was then
multiplied with the chosen density of 7.84 tons/m3
to receive the total mass of the system
which is shown in table A2:3.

29 (35)
Pipe lenght (m)
Inner diameter (mm) Cast iron pipes Steel pipes
38 777 0
50 10244 0
64 1667 0
75 17492 0
81 526 0
100 20350 23370
125 936 0
150 15602 18948
200 5055 2144
250 2980 1979
300 608 589
350 234 234
450 369 369
50 (service pipe) 6305 3594
75 (service pipe) 6305 3594
100 (service pipe) 1401 799
Pipe thickness (mm)
Inner diameter (mm) Cast iron pipes Steel pipes
<76 5
>75 12-15 10
Table A2:1. Pipe length of each diameter type.
Table A2:2. Pipe thickness of each diameter and material type.
Iron pipe thickness (mm)
Ratio iron:steel 12 15
10:90 4203 4561
50:50 4358 4956
90:10 4513 5351
Table A2:3. The differing results depending on the chosen parameters
(iron:steel ratio & iron pipe thickness). The result is shown in tons.
30 (35)
Appendix 2 - District heating The quantification of the metal stock in district heating pipes was made on-site at the system
owner E.ON. The system owners own GIS-software (Facil Plus) was used from where an
attribute table for all pipes was exported to an Excel spreadsheet. Data concerning pipe length
and pipe water volume was present. From this, the inner diameter was calculated.
Complementary data concerning thickness of the pipes was acquired from Sjögren (2011,
personal contact). With this information it was possible to calculate the metal volume of the
pipes which was multiplied which the density of 7.84 tons/m3 for steel pipes and 8.96 tons/m
3
for copper pipes. The exact length and the dimensions of the copper pipes were not known.
However, it was known that 16 % of the pipes are made of copper, that these pipes used
thinner material and only the lesser diameter pipes uses copper. The copper has a metal
volume that is 60 % of that of the steel pipes. A calculation of: “steel volume * 0.16 * 0.40”
was used to obtain the copper volume. The quantification of the district heating holds one
mentionable weakness, the system parts of Söderköping is included. However, the length of
the pipes corresponds to less than 0.5 % of the total system length.
31 (35)
Appendix 3 - Cables Power cables
Physical maps describing the location and specification of the power cables was collected
from E.ON. The maps has not been updated since 2005 (Johansson, personal contact). With
the maps acquired, they were imported into GIS (ESRI ArcMap 10) and adjusted to match a
base map layer. For every single cable on the maps, a vector was created which was given
attribute data for its specifications. The length of each cable was calculated with the built-in
geometry calculator. The complete list of cables was exported to an Excel spreadsheet.
Information concerning copper content was based on information from EBR (2009) for
certain cables. For other cables not present in that source, the mean value of 0.0093
kg/m/mm2 was used for copper cables and 0.0027 was used for aluminium cables. The value
for kg metal/m was multiplied with the length of the cable. This was done for every cable to
obtain the total mass of the cables. Some cables lacked information regarding specification on
the cables; the metal content was therefore unknown. For these cables a mean value of 1.49
kg copper/m was used. They were assumed to contain no aluminium. All disconnected cables
were separated in the calculation.
Cable TV
A map describing the main parts of the old cable TV net was acquired from Sandell (2010,
personal contact) at HNAB. The GIS-procedure was then more or less equal to the one used
for the power cables. The aluminium content in the cables was determined using product
specifications from the cable manufacturer (CommScope, n.d.A; n.d.B). The mean conductor
area based on the product specifications was 35.22 mm2 in conductor area; this since the cable
types was known but not the used ratio between the cable types. Cirka 50 % of the cable
length was of an unknown type, the mean area was used for this cable as well. The cable
conductor area was multiplied with the total cable length to obtain the metal volume. The
volume was then multiplied with the aluminium density; 2.7 tons/m3, to obtain the total metal
mass of the system.
Telephone lines
Maps and wiring diagrams for the telephone lines of Södra Butängen was acquired from the
system owner Skanova (Schillerström, 2011, personal contact). The following GIS-procedure
was the same as for all the previous systems. From conductor diameter and number of
conductor pairs the total conductor area was calculated. The area was multiplied with cable
length and copper density to obtain the total copper mass. So called transportation-network
cable has not been included in the quantification because of unknown metal content in these
cables.
The old tram DC-power
The metal quantification procedure was similar to the one used for cable-TV. Maps describing
the location of the positive pole cables and the negative pole cables were collected from
Lundmark at Norrköping Municipality (2011, personal contact). Like for the power cables
and cable TV, the tram DC-cables were imported into, and hand digitalized in GIS. The total
cable length was multiplied with the cable conductor area of 300 mm2 (according to
Lundmark, 2011, personal contact). The resulting volume was multiplied with the copper
density; 8.96 tons/m3 to obtain the total mass.
The new tram DC-power For this system no maps or GIS-data was available. Instead a complete list of all cables, their
conductor area and conductor material was acquired from Nilsson (2011, personal contact),

32 (35)
Göteborgs Spårvägar. The conductor area was multiplied with length and aluminium or
copper density to obtain the total mass of the two metals.
Street lighting
GIS-ready data covering the whole street lighting system in the municipality was acquired
from Lundmark (2011, Norrköping Municipality). The GIS-layers was imported into GIS
where all cables outside the geographical delimitation were removed. The cable density was
based on information from EBR (2009) which was multiplied with the cable length to obtain
the total metal mass.

33 (35)
Appendix 4 - Water and sewage system From Norrköping vatten, GIS-layers covering the whole municipality were obtained for these
systems. In the GIS-software all pipes outside the geographical delimitation was excluded.
The object attribute table in the GIS was exported to an Excel spreadsheet. This data
contained information regarding inner diameter, the length of the pipes and material.
Specifications for the pipe outer diameter were obtained from Per Narveby at Norrköpings
vatten (2011). With this information the metal volume was calculated; multiplied with the
densities of 7.84 tons/m3 for iron or steel and 8.96 for copper pipes the mass was obtained. All
pipes made of non-metal materials were excluded from the calculations.

34 (35)
Appendix 6 - Data- and calculation uncertainties All sources used in the calculations for every variable used in the calculations are listed in
table A6:2. The sources are then classified in levels (1-5) according to the liability and quality
of the data. The levels and their explanations are presented in table A6:1. This model of data
and information source valuation and classification was developed by Hedbrand and Sörme
(2000) to be used for handling and quantification of data uncertainties. The model used here is
a simplification since no quantifications have been used. However, it gives an overall picture
of the data quality and reliability used for the calculations in this thesis.
UNCERTAINTY CLASSIFICATION
LEVEL Source of information
1 Data describing the system:
Maps
Litterature
Manufacturer specifications
GIS
Data from experts (DC-power)
2 Rescaling of known data
Hand digitalizing of GIS-maps
3 Information from experts (Town gas)
4 Assumptions based on mean values
5 Assumptions
Table A6:1. The uncertainty classification levels used
for the classification of data sources.
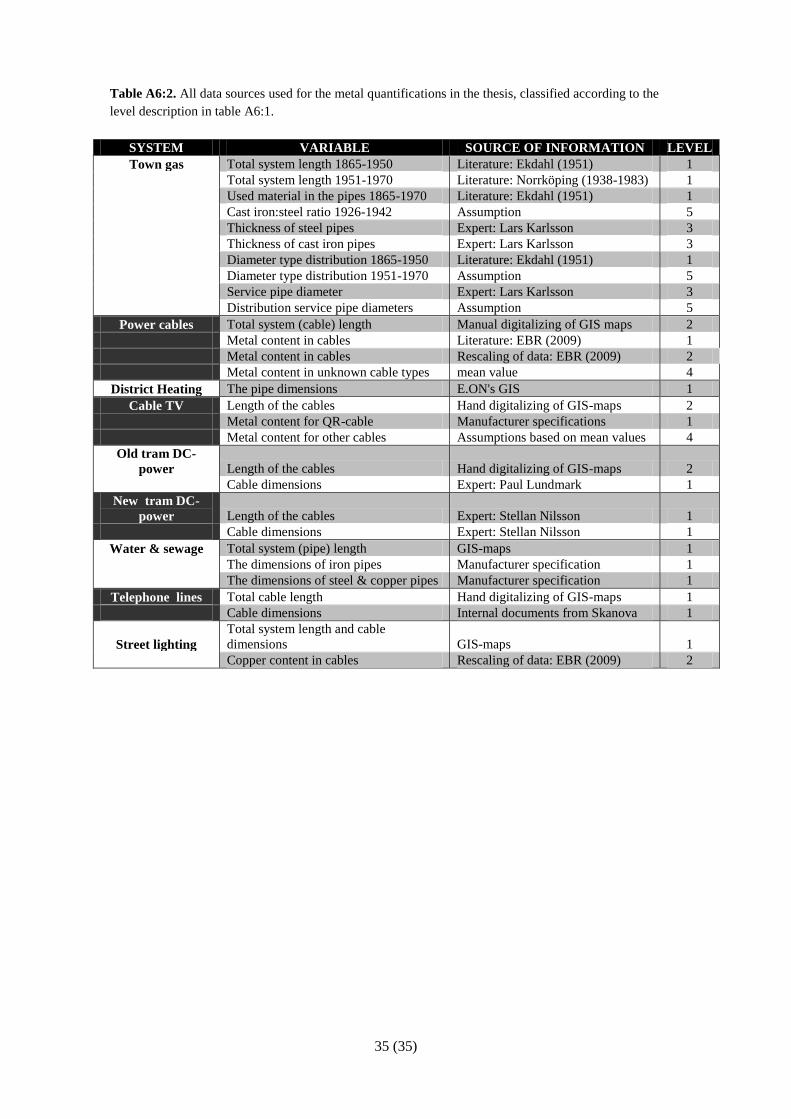
35 (35)
SYSTEM VARIABLE SOURCE OF INFORMATION LEVEL
Town gas Total system length 1865-1950 Literature: Ekdahl (1951) 1
Total system length 1951-1970 Literature: Norrköping (1938-1983) 1
Used material in the pipes 1865-1970 Literature: Ekdahl (1951) 1
Cast iron:steel ratio 1926-1942 Assumption 5
Thickness of steel pipes Expert: Lars Karlsson 3
Thickness of cast iron pipes Expert: Lars Karlsson 3
Diameter type distribution 1865-1950 Literature: Ekdahl (1951) 1
Diameter type distribution 1951-1970 Assumption 5
Service pipe diameter Expert: Lars Karlsson 3
Distribution service pipe diameters Assumption 5
Power cables Total system (cable) length Manual digitalizing of GIS maps 2
Metal content in cables Literature: EBR (2009) 1
Metal content in cables Rescaling of data: EBR (2009) 2
Metal content in unknown cable types mean value 4
District Heating The pipe dimensions E.ON's GIS 1
Cable TV Length of the cables Hand digitalizing of GIS-maps 2
Metal content for QR-cable Manufacturer specifications 1
Metal content for other cables Assumptions based on mean values 4
Old tram DC-
power Length of the cables Hand digitalizing of GIS-maps 2
Cable dimensions Expert: Paul Lundmark 1
New tram DC-
power Length of the cables Expert: Stellan Nilsson 1
Cable dimensions Expert: Stellan Nilsson 1
Water & sewage Total system (pipe) length GIS-maps 1
The dimensions of iron pipes Manufacturer specification 1
The dimensions of steel & copper pipes Manufacturer specification 1
Telephone lines Total cable length Hand digitalizing of GIS-maps 1
Cable dimensions Internal documents from Skanova 1
Street lighting
Total system length and cable
dimensions GIS-maps 1
Copper content in cables Rescaling of data: EBR (2009) 2
Table A6:2. All data sources used for the metal quantifications in the thesis, classified according to the
level description in table A6:1.