potassium and magnesium in irrigation water quality assessment
TRANSCRIPT
A
P
Ca
b
c
a
AA
KWHCS
1
bgdwtsopasitmegwi
h0
ARTICLE IN PRESSG ModelGWAT-3993; No. of Pages 6
Agricultural Water Management xxx (2014) xxx–xxx
Contents lists available at ScienceDirect
Agricultural Water Management
jou rn al hom ep age: www.elsev ier .com/ locate /agwat
otassium and magnesium in irrigation water quality assessment
.J. Smitha,∗, J.D. Osterb, G. Spositoc
CSIRO Land and Water, PO Box 1666, Canberra ACT 2601, AustraliaDepartment of Environmental Science, University of California, Riverside, CA 92506, USADepartment of Environmental Science, Policy and Management, University of California, Berkeley, CA 94720-3114, USA
r t i c l e i n f o
rticle history:vailable online xxx
eywords:aste water
ydraulic conductivityationstability index
a b s t r a c t
There is a growing trend of K replacing Na in wastewaters from agricultural industries to reduce theadverse effects of irrigation with these waters on soil hydraulic properties. However, problems withsoil physical properties caused by wastewaters with high concentrations of K have been reported inboth Australia and California. A review of the literature dating back to the 1930s supports the generalconclusion that the relative order of deleterious effect on soil hydraulic properties of the four commoncations in soils is Na > K > Mg > Ca. This paper explores the capabilities of the Cation Ratio of StructuralStability (CROSS), a generalized Sodium Adsorption Ratio incorporating all four cations, as an improvedirrigation water quality parameter. This new parameter includes a coefficient for K that accounts for
its relative deleterious effect as compared with Na and another coefficient for Mg that accounts for itsrelative beneficial effect as compared with Ca. Based on optimizing CROSS using threshold electrolyteconcentration data for a Sodosol from the Riverina Region of Australia, the deleterious effect of K isestimated to be about one-third of that of Na, while the concentration of Mg needs to be about an orderof magnitude larger than Ca to have the same beneficial effect.© 2014 Published by Elsevier B.V.
. Introduction
Wastewaters generated by agriculture and municipalities areeing re-used increasingly for irrigation, both as a way to miti-ate severe water shortages and as means of avoiding wastewaterischarge to surface waters while producing economic value fromastewater streams (Bond, 1998; Arienzo et al., 2012). However,
he sustainable use of wastewaters generated by agriculture posesignificant challenges because they can contain high concentrationsf K. This is especially the case for wastewaters generated by dairies,iggeries, wineries, and olive or tomato processing plants (Smilesnd Smith, 2004a; Arienzo et al., 2009, 2012; Dellavalle, 2010, per-onal communication; Rengasamy and Marchuk, 2011). The changen water composition arises mainly as a result of moving from Na-o K-based products in the cleaning process and/or shifting ani-
al diet, wherein cheese whey (K concentration: 1660 mg/L; Feigint al., 1991) is used as part of the feed formulation (intensive pig-
Please cite this article in press as: Smith, C.J., et al., Potassium and mManage. (2014), http://dx.doi.org/10.1016/j.agwat.2014.09.003
eries). In many cases, the shift to K has been deliberate because ofell-established concerns about negative effects of Na on soil phys-
cal properties (U.S. Salinity Laboratory Staff, 1954; Levy, 2012).
∗ Corresponding author. Tel.: +61 262465960.E-mail address: [email protected] (C.J. Smith).
ttp://dx.doi.org/10.1016/j.agwat.2014.09.003378-3774/© 2014 Published by Elsevier B.V.
However, recent studies have documented problems with waterinfiltration caused by high levels of K in applied waters (Rengasamyand Marchuk, 2011), particularly in Australia (Smiles and Smith,2004a) and California (Nat Dellavalle, personal communication,2010).
Generally, studies of the hydraulic properties of salt-affectedsoils have focused exclusively on the potential deleterious effectsof two soil properties, exchangeable Na and soil water salinity(Quirk and Schofield, 1955; Bresler et al., 1982; Shainberg andShalhevet, 1984; Sumner, 1993; Sumner and Naidu, 1998; Osterand Jayawardane, 1998; Levy, 2012). One reason the effect of Kon soil hydraulic properties has not traditionally been taken intoconsideration is that Na concentrations in salt-affected soils andgroundwaters are usually much higher than those of K, but the mostimportant reason is that the authors of Handbook 60 (U.S. SalinityLaboratory Staff, 1954) concluded 60 years ago that “exchangeableK has only a slight or no adverse effect upon the physical propertiesof soils.” This conclusion was influenced by “measurements maderecently at the Laboratory on samples of seven soils adjusted to var-ious levels of exchangeable sodium and exchangeable potassium
agnesium in irrigation water quality assessment. Agric. Water
(Fig. 1)”. The figure in question displays the ratio of air permeabil-ity to water permeability as a function of exchangeable sodiumpercentage (ESP) and exchangeable potassium percentage (EPP).This ratio increases exponentially with ESP, whereas for EPP there

ING ModelA
2 ater M
iwfi(awtttMeptt2
2
e(srcwrhtd(tot6Ksd
a(ooTRsiwa1tAcrwHhSrp1
tetf
ARTICLEGWAT-3993; No. of Pages 6
C.J. Smith et al. / Agricultural W
s no increase observed for three of the seven soils examined,hile the increase is small for the other four. Variations of thisgure were published by Reeve et al. (1954) and Brooks et al.1956), who stated: “Combinations of various levels of exchange-ble sodium and potassium showed that exchangeable potassium,hether alone or in the presence of exchangeable sodium, had lit-
le if any effect in increasing the permeability ratio. . .” One mayhus infer that the authors of Handbook 60 were confident in set-ing aside a premise stated long ago by de Sigmond (1928) and
agistad (1945), that exchangeable Na and K should be consid-red to have additive deleterious effects on soils. Even today, theotential impact of exchangeable K on soil properties is not men-ioned in ASCE No. 71, a standard engineering manual relatedo salinity assessment and management (Wallender and Tanji,012).
. Effects of K and Mg on soil hydraulic conductivity
Quirk and Schofield (1955), inspired by research on the effects oflectrolyte concentration on the permeability of soils in CaliforniaFireman and Bodman, 1939), reported what appears to be the firstystematic investigation to document the effects of K on the satu-ated soil hydraulic conductivity. They equilibrated soil pads withoncentrated Cl solutions of Na, K, Ca, or Mg, then leached themith a series of more dilute Cl solutions of the same cation. Their
esults showed decreases in the hydraulic conductivity over a five-our period of leaching which depended on both the cation andhe leaching solution concentration. The decrease in hydraulic con-uctivity followed the order: Na > K > Mg > Ca. Quirk and Schofield1955) defined the cation concentration at which a 10–15% reduc-ion in the saturated hydraulic conductivity occurred at the endf the leaching period as the threshold (electrolyte) concentra-ion (TEC), reporting TEC values for Na, K, Mg, and Ca as 250,7, 2.0 and 0.6 mmolc/L, respectively. They noted in particular for
that a concentration of 20 mmolc/L produced turbidity in theoil percolate, and a concentration of 10 mmolc/L resulted in clayeflocculation.
Since this early work, researchers have reported both positivend negative effects of K on soil hydraulic conductivity. Keren1984), in his comprehensive review of the effects of K and Mgn soils, concluded that these mixed results indicate “the effectf exchangeable K on soil properties is not well understood.”he same ambivalence was echoed recently in a brief review byengasamy and Marchuk (2011), who also noted that the need toolve this conundrum has grown more urgent because of increas-ng irrigation with wastewaters. Levy and van der Watt (1990),
orking with three South African soils, found little K effect onn Alfisol with kaolinite and iron oxide mineralogy (EPP of 6 or3), a much larger effect on an Aridisol with illite and smec-ite mineralogy (EPP of 18.9), and an intermediate effect on anlfisol with this same mineralogy. For two soils having an illiteontent of 10–11%, Chen et al. (1983) reported that the satu-ated hydraulic conductivity increased with increasing EPP < 20%,hile for EPP > 20%, the conductivity decreased with increasing EPP.owever, for a third soil which had an illite content of 16%, theydraulic conductivity uniformly decreased with increasing EPP.canning electron micrographs showed that enrichment with Kesulted in the formation of dense, continuous networks of clayarticles filling the pore spaces between sand particles (Chen et al.,983).
Marchuk et al. (2012) applied computed X-ray tomography
Please cite this article in press as: Smith, C.J., et al., Potassium and mManage. (2014), http://dx.doi.org/10.1016/j.agwat.2014.09.003
o characterize changes in pore architecture as influenced byxchangeable Na, K, Mg, and Ca. Total porosity and pore connec-ivity were influenced by cation valence, as might be anticipatedrom the Schulze-Hardy Rule (Sposito, 2008). A well-developed
PRESSanagement xxx (2014) xxx–xxx
pore structure was evident in soils having a sufficiently high con-centration of exchangeable Ca and Mg, whereas soils dominatedby Na and K had isolated pore clusters surrounded by pores filledwith dispersed clay particles (Marchuk et al., 2012). Clay disper-sion decreased in the order: Na > K > Mg > Ca and, correspondingly,hydraulic conductivity decreased in the reverse order, as reportedoriginally by Quirk and Schofield (1955).
Magnesium has long been considered to have effects similar toCa on soil physical properties (Keren, 1984; Levy, 2012), leadingthe U.S. Salinity Laboratory Staff (1954) to group these two bivalentcations together as promoting and maintaining good soil structure.Bresler et al. (1982) remarked that this customary grouping may notreflect the true status of Mg, which is masked by the typically two-to five-fold greater concentration of Ca over Mg in irrigation watersand soil solutions. Rengasamy et al. (1984) concluded that Mg hasthe greatest effect on the saturated hydraulic conductivity when theelectrolyte concentration is low, a point also made by Keren (1984),Sumner (1993), and Levy (2012). Use of gypsum on silt loam soilswith an exchangeable Mg saturation near 36% reduced runoff undersurface irrigation conditions (Vyshpolsky et al., 2010). In experi-ments conducted on soils from the corn belt in the United States,Dontsova and Norton (2002) reported Mg-treated soils had half thefinal infiltration rate as Ca-treated soils for two of four soils theystudied. In summary, the available literature supports the premisethat, under certain conditions, both K and Mg can have deleteriouseffects on soil hydraulic properties, and when there are deleteriouseffects, they usually relate to clay particle dispersion, resulting inreduced soil permeability.
These trends, observed for soils of varying clay mineralogy,have to do with the fundamental relationship between soil particleflocculation and cation adsorption. If we think of the simplest the-oretical approach to this relationship, diffuse double layer theorycomes to mind (Sposito, 2008). This theory implies that only cationvalence (Z) matters, and hence all cations of a given valence shouldbehave in the same way, although monovalent cations shouldbehave differently from bivalent cations. Therefore, one parameterto explain particle flocculation is cation valence, and this parameteralone suffices not only to understand the Schulze-Hardy Rule, butalso to develop a semi-quantitative model of critical flocculationconcentrations (Sposito, 2008). But such a model cannot explainNa–Mg systems as compared to Na–Ca systems, or K–Ca versusNa–Ca.
Two other parameters that have been used to account for cationadsorption phenomena are ionic potential (Z/R) and Misono soft-ness (Sposito, 2008). The first one (ionic potential, Z/R) scales thevalence by cation radius (R) and is a measure of the electrostaticbinding energy of a cation, whereas the second one (Misono soft-ness) involves the energy required to extract an electron from acation and is a measure of the covalency of cation binding. RecentlyMarchuk and Rengasamy (2011) combined these two parametersinto a single index for the degree of covalency of cation binding,then subtracted it from 1.0 to get what they termed the degree ofnon-covalency, or the ionicity index. This new index depends oncation valence and the energy required to extract an electron froma cation, but it does not depend on cation size. Thus it goes beyonddiffuse double layer theory by saying that the degree of covalencyin cation binding also is important, not just electrostatics, and inthis way it distinguishes Na from K, and Ca from Mg. Table 3 inMarchuk and Rengasamy (2011) shows that the ionicity index isa very good predictor of both clay suspension turbidity and clayparticle zeta potential for a wide variety of soil clays. In particu-lar, it predicts observed differences in turbidity, a measure of clay
agnesium in irrigation water quality assessment. Agric. Water
dispersion, with the ordering: Na > K > Mg > Ca. We suggest, there-fore, that the reason for the observed differences in soil response toapplied water composition, summarized above, is related to boththe valence of the cations and their ionicity index.
ING ModelA
ater M
3p
3
mS
S
wmnSi2dLiqTTK2f
epA
M
bmNInat
KpcRMpiStflCspCrf
flEc
ARTICLEGWAT-3993; No. of Pages 6
C.J. Smith et al. / Agricultural W
. A new water quality parameter related to soil hydraulicroperties
.1. Moving beyond SAR
The Sodium Adsorption Ratio (SAR) has long been the standardeasure of potential sodium hazard for irrigation water (U.S.
alinity Laboratory Staff, 1954):
AR = Na
[(Ca + Mg)/2]0.5(1)
here a chemical element symbol indicates a concentration inmolc/L. The SAR can be related through a rigorous thermody-
amic argument to the exchangeable sodium percentage (Oster andposito, 1980), a key soil property determining aggregate stabil-ty and soil permeability (Bresler et al., 1982; Keren, 1984; Levy,012). Similarly, the potassium adsorption ratio (PAR) has beenefined, with K concentration replacing that of Na (U.S. Salinityaboratory Staff, 1954), but there are no guidelines based on PARn the standard reference publications related to irrigation wateruality assessment (Ayers and Westcot, 1985; Rhoades et al., 1992;anji and Kielen, 2002; Tyagi and Minhas, 1998; Wallender andanji, 2012). However, recent research (Smiles and Smith, 2004a,b;ruger et al., 1995; Arienzo et al., 2009; Rengasamy and Marchuk,011) has reported a reduction in saturated hydraulic conductivityrom the accumulation of exchangeable K.
Smiles and Smith (2004a), recognizing the possibility of a syn-rgistic effect of monovalent cations on soil hydraulic properties,roposed that the SAR be replaced by the Monovalent Cationdsorption Ratio (MCAR) to assess irrigation water quality:
CAR = Na + K + NH4
[(Ca + Mg)/2]0.5(2)
These authors pointed out the need to apply MCAR carefully,ecause K can become strongly adsorbed in soils, whereas NH4ay be only ephemeral in soil, becoming rapidly oxidized toO3. Indeed, under conditions favourable for rapid nitrification,
ntrawech et al. (1982) found that ammonium-based fertilizers hado measurable influence on soil structure or compactability during
10-year field study conducted in Kansas under cropped condi-ions.
In the MCAR, no relative distinction is made between Na and in promoting soil clay dispersion, or between Ca and Mg inromoting soil clay flocculation. Considering differences in the floc-ulating power of cations having the same valence (Sposito, 2008),engasamy and Marchuk (2011) proposed an alternative to theCAR that incorporates the differing effects of Na and K as dis-
ersing cations and of Mg and Ca as flocculating cations. This newrrigation water quality parameter, the Cation Ratio of Structuraltability (CROSS), incorporates the inverse of the critical floccula-ion concentration (CFC) for a particular cation as a measure of itsocculating power. Rengasamy and Sumner (1998) have reportedFC values for K-, Mg-, and Ca-saturated clays extracted from fouroils, which they used to calculate the average relative flocculatingower of each cation by dividing its average CFC into the averageFC for Na-clay, taken as a reference. Compared to Na, the averageelative flocculating power of K, Mg, and Ca for the four soils wasound to be: 1.8 ± 0.3, 27 ± 5, and 45 ± 8, respectively.
Please cite this article in press as: Smith, C.J., et al., Potassium and mManage. (2014), http://dx.doi.org/10.1016/j.agwat.2014.09.003
CROSS differs from MCAR by introducing ratios of the relativeocculating power as coefficients of the K and Mg concentrations inq. (2), after dropping NH4 (Rengasamy and Marchuk, 2011). Theoefficient of K, a measure of its dispersing power relative to Na,
PRESSanagement xxx (2014) xxx–xxx 3
is 0.56 (1/1.8). The coefficient of Mg, a measure of its flocculatingpower relative to Ca, is 0.60 (27/45), resulting in the definition:
CROSSf = Na + 0.56K
[(Ca + 0.60Mg)/2]0.5(3)
where we have added a subscript f to indicate that the coefficientsare based on the relative flocculating power. Rengasamy andMarchuk (2011) tested Eq. (3) by correlating SAR, MCAR, andCROSSf with their measurements of the percent dispersible clayin four Australian soils they examined. Although all three waterquality parameters were correlated significantly with percent dis-persible clay, the correlation with CROSSf was greatly superior tothat with SAR and somewhat better than that with MCAR. They alsofound that CROSSf showed better correlation than MCAR with theratio of exchangeable monovalent to exchangeable bivalent cationsin the four Australian soils.
In light of the fact that the electrolyte concentration required tocause flocculation of soil clays is usually considerably greater thanthat which results in the dispersion of soil clays (Quirk, 2001), weused the TEC values reported by Quirk and Schofield (1955), whichrelate to clay dispersion, instead of CFC values to calculate the twocoefficients in CROSS. Thus, comparing clay dispersion instead offlocculation for the monovalent cations, the coefficient of K wouldbe the ratio of TEC for K to that for Na, 0.26 (66/250). For the biva-lent cations we must compare flocculation, so the coefficient of Mgwould be the ratio of TEC for Ca to that for Mg, 0.3 (0.6/2.0), leadingto the final expression:
CROSSd = Na + 0.26K
[(Ca + 0.30Mg)/2]0.5(4)
where the subscript d indicates that the coefficients for K and Mgare now based on relative dispersing power.
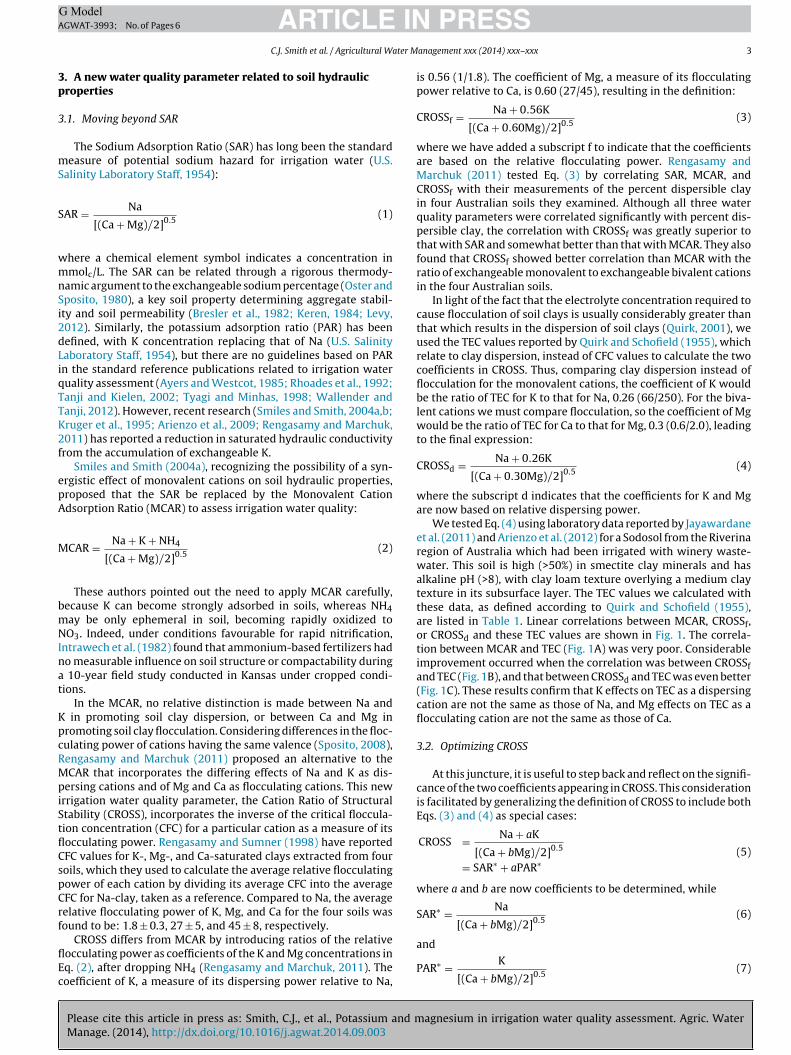
We tested Eq. (4) using laboratory data reported by Jayawardaneet al. (2011) and Arienzo et al. (2012) for a Sodosol from the Riverinaregion of Australia which had been irrigated with winery waste-water. This soil is high (>50%) in smectite clay minerals and hasalkaline pH (>8), with clay loam texture overlying a medium claytexture in its subsurface layer. The TEC values we calculated withthese data, as defined according to Quirk and Schofield (1955),are listed in Table 1. Linear correlations between MCAR, CROSSf,or CROSSd and these TEC values are shown in Fig. 1. The correla-tion between MCAR and TEC (Fig. 1A) was very poor. Considerableimprovement occurred when the correlation was between CROSSfand TEC (Fig. 1B), and that between CROSSd and TEC was even better(Fig. 1C). These results confirm that K effects on TEC as a dispersingcation are not the same as those of Na, and Mg effects on TEC as aflocculating cation are not the same as those of Ca.
3.2. Optimizing CROSS
At this juncture, it is useful to step back and reflect on the signifi-cance of the two coefficients appearing in CROSS. This considerationis facilitated by generalizing the definition of CROSS to include bothEqs. (3) and (4) as special cases:
CROSS = Na + aK
[(Ca + bMg)/2]0.5
= SAR∗ + aPAR∗(5)
where a and b are now coefficients to be determined, while
SAR∗ = Na
[(Ca + bMg)/2]0.5(6)
agnesium in irrigation water quality assessment. Agric. Water
and
PAR∗ = K
[(Ca + bMg)/2]0.5(7)

Please cite this article in press as: Smith, C.J., et al., Potassium and mManage. (2014), http://dx.doi.org/10.1016/j.agwat.2014.09.003
ARTICLE IN PRESSG ModelAGWAT-3993; No. of Pages 6
4 C.J. Smith et al. / Agricultural Water Management xxx (2014) xxx–xxx
Fig. 1. Correlations between the Monovalent Cation Adsorption Ratio (MCAR; A),the Cation Ratio of Structural Stability (CROSS), with the coefficients for K and Mgbased on either the flocculating power of the cations (CROSSf; B) or their relativedispersing power (CROSSd; C); or where the coefficients are optimized (CROSSopt; D)
Table 1Sodium (SAR) and potassium adsorption ratio (PAR), threshold concentration (TEC,mmolc/L) and cation concentrations (mmolc/L) in applied water leading to a 15%reduction in the saturated hydraulic conductivity of surface and subsurface layersin a calcareous soil from the Riverina region of Australia (Arienzo et al., 2012).
Soil layer SAR or PAR TEC K Na Mg Ca
Surface SAR40 Ca 66.0 0.00 61.30 0.00 4.70Surface PAR40 Ca 15.5 15.21 0.00 0.00 0.29Surface SAR20 Ca 30.2 0.00 26.70 0.00 3.50Surface PAR20 Ca 9.6 9.18 0.00 0.00 0.42Surface SAR5 Ca 2.0 0.00 1.76 0.00 0.24Surface PAR5 Ca 2.0 1.76 0.00 0.00 0.24Subsurface SAR40 Ca 134.0 0.00 116.90 0.00 17.10Subsurface PAR40 Ca 32.9 31.65 0.00 0.00 1.25Subsurface SAR20 Ca 16.7 0.00 15.50 0.00 1.20Subsurface PAR20 Ca 26.9 24.92 0.00 0.00 1.98Subsurface SAR5 Ca 1.5 0.00 1.35 0.00 0.15Subsurface PAR5 Ca 1.5 1.35 0.00 0.00 0.15Surface SAR40 Ca+Mg 191 0.00 159.30 15.85 15.85Surface PAR40 Ca+Mg 22.6 22.00 0.00 0.30 0.30Surface SAR20 Ca+Mg 66.9 0.00 52.95 6.98 6.98Surface PAR20 Ca+Mg 10.7 10.18 0.00 0.26 0.26Surface SAR5 Ca+Mg 1.5 0.00 1.35 0.07 0.07Surface PAR5 Ca+Mg 2 1.76 0.00 0.12 0.12Subsurface SAR40 Ca+Mg 224.8 0.00 183.00 20.90 20.90Subsurface PAR40 Ca+Mg 71.9 66.40 0.00 2.75 2.75Subsurface SAR20 Ca+Mg 33.3 0.00 29.10 2.10 2.10Subsurface PAR20 Ca+Mg 7.1 6.87 0.00 0.12 0.12Subsurface SAR5 Ca+Mg 1 0.00 0.93 0.03 0.03Subsurface PAR5 Ca+Mg 1 0.93 0.00 0.03 0.03Surface SAR40 Mg 517.0 0.00 357.00 160.00 0.00Surface PAR40 Mg 140.0 121.50 0.00 18.50 0.00Surface SAR20 Mg 283.0 0.00 158.00 125.00 0.00Surface PAR20 Mg 99.5 73.00 0.00 26.50 0.00Surface SAR5 Mg 23.2 0.00 12.00 11.20 0.00Surface PAR5 Mg 18.9 10.30 0.00 8.60 0.00Subsurface SAR40 Mg 501.0 0.00 349.00 152.00 0.00Subsurface PAR40 Mg 136.0 118.50 0.00 17.50 0.00Subsurface SAR20 Mg 156.0 0.00 103.00 53.00 0.00Subsurface PAR20 Mg 60.7 49.00 0.00 11.70 0.00Subsurface SAR5 Mg 8.7 0.00 5.90 2.80 0.00
Subsurface PAR5 Mg 15.1 8.85 0.00 6.25 0.00are generalizations of SAR and PAR, respectively. Eq. (5) indicatesthat CROSS can be interpreted as a weighted sum of a generalizedSAR and PAR, with the weighting factor a serving as a measure ofthe efficacy of PAR*, relative to that of SAR*, as a control on the soilproperty with which they are correlated. In particular, the linearityof Eq. (5) implies that the y-intercept of a linear correlation betweenCROSS and TEC, i.e., the limiting value of CROSS as TEC becomes verysmall, will scale with the value of the coefficient a. If a < 1, as it isin Eqs. (3) and (4), then the impact of PAR* on increasing the TEC isaccordingly less than that of SAR*.
On the other hand, the slope of a correlation between CROSS andTEC should scale with the inverse-square-root of the coefficient b,implying that the coefficient b cannot be interpreted in quite thesame way as a. By analogy with activity coefficients in chemicalthermodynamics, one could interpret the product bMg as an effec-tive concentration of Mg, analogous to the product of an activitycoefficient and a molar concentration of an ion defining its effectiveconcentration. In the present context, the effective concentrationrefers to the relative impact of Mg in promoting soil clay floccula-
agnesium in irrigation water quality assessment. Agric. Water
tion or, equivalently, in preventing clay dispersion, as compared toCa taken as a reference. Thus b is expected to be <1, and it multipliesthe actual concentration of Mg to produce an effective concentra-tion as a way of expressing the lesser flocculating power (or greater
based on the threshold concentration (TEC, mmolc/L) that caused a 15% reduction inthe relative saturated hydraulic conductivity of a calcareous soil from the Riverinaregion of Australia (Arienzo et al., 2012). RMS represents the root-mean-square.

ING ModelA
ater M
dtCa
ip1w
wECT
obscflcsoitFatvfibiTs
4
sqtaptNtib
oimoccftaiab
ARTICLEGWAT-3993; No. of Pages 6
C.J. Smith et al. / Agricultural W
ispersing power) of Mg relative to Ca. In this context, a concentra-ion of Mg would have to be 1/b times larger than a particular one ofa in order to have the same positive impact on soil clay structurend water infiltration rates.
Fig. 1D shows the correlation between the generalized CROSSn Eq. (5) and TEC as obtained using an optimization technique torovide best-fit values of a and b (Duan et al., 1993; Rosenbrock,960) based on the data in Table 1. The resulting values of a and bere 0.335 (s.e. = 0.038) and 0.0758 (s.e. = 0.012), respectively:
CROSSopt = SAR∗ + 0.335(±0.038)PAR∗
= Na + 0.335(±0.038)K
[(Ca + 0.0758(±0.012)Mg)/2]0.5
(8)
here the subscript opt designates optimization. Fig. 1 shows thatq. (8) improves significantly on CROSSd, making it the most robustROSS relationship with TEC that can be obtained from the data inable 1.
The optimized value of a is consistent with our estimate basedn TEC values in Eq. (3) and is significantly smaller than the estimateased on relative flocculation power in Eq. (4). This finding wouldupport the conclusion that a based on threshold concentrations forlay dispersion has a better foundation than one based on relativeocculation power. The optimized b coefficient, however, does notonform to the trend in both Eqs. (3) and (4), i.e., a ≈ b. Instead, itsmall value indicates that, for the data in Table 1, the concentrationf Mg must be about an order of magnitude larger than that of Ca tompart the same effectiveness in promoting soil permeability. Thisrend can in fact be deduced from examining the data in Table 1.or example, the TEC values for SAR40 Ca and SAR40 Mg are 66.0nd 517.0 mmolc/L, respectively. In this case, a plays no role andhe coefficient b in is solely responsible for the second, much largeralue of TEC. According to Eq. (8), the estimated value of CROSSopt
or TEC = 517 is 147. Since SAR = 40, this result implies that SAR*s 3.67 (147/40) times larger than SAR, leading to an estimate for
of 0.0743, close to the optimized value. The physico-chemicalnterpretation here is that, for the soil described by the TEC data inable 1, Mg is significantly less effective than Ca in promoting soiltructure and water permeability.
. Conclusions
Previous studies on the relative effects of Na, K, Ca, and Mg onoil hydraulic conductivity over a range of SAR or PAR show that,uantitatively, negative K effects on hydraulic conductivity are lesshan those for Na, and positive Mg effects on hydraulic conductivityre less than those for Ca. The general conclusion we draw, based onublished research since the 1930s, is that the relative order of dele-erious effect of the common cations on soil hydraulic properties is:a > K > Mg > Ca. However, these important differences between the
wo monovalent and the two divalent ions are not currently takennto account in existing irrigation water quality criteria, which areased on salinity and the SAR of the irrigation water.
The concept of CROSS, which has been proposed as an indexf irrigation water quality to replace SAR, takes these differencesnto account. The coefficients for K and Mg in the original for-
ulation of CROSS (Marchuk and Rengasamy, 2010) were basedn the clay flocculating ability of Mg as compared to Ca, or K asompared to Na. Whilst this concept is reasonable, we found thatoefficients based on clay dispersing ability, i.e., TEC values for theour cations at which the saturated hydraulic conductivity beginso decline significantly, improved the correlation between CROSS
Please cite this article in press as: Smith, C.J., et al., Potassium and mManage. (2014), http://dx.doi.org/10.1016/j.agwat.2014.09.003
nd TEC for a Sodosol soil from the Riverina region of Australiarrigated with winery wastewater. This result led us to postulate
more general definition of CROSS (Eq. (5)), which produced theest correlation with TEC for this soil through optimization of the
PRESSanagement xxx (2014) xxx–xxx 5
two coefficients using irrigation water composition data (Table 1).These coefficients indicated that, for this soil, the deleterious effectof K is about one-third of that for Na and the concentration of Mgneeds to be about 13 times larger than Ca to have the same benefi-cial effect. The findings presented here, of course, must be tested onother soils and for waters that contain either NH4, known to impairthe soil hydraulic properties if nitrification is slow, or SO4. For thelatter ion, the coefficients for K and Mg may be influenced by claymineralogy as well as SO4 ion pair formation with K and Mg.
Acknowledgements
We consider our individual contributions to this paper to beequal. The authors thank Dr. Jayawardane for providing the rawdata on relative hydraulic conductivity changes published in Figs.1 and 2 in the papers by Jayawardane et al. (2011) and Arienzo et al.(2012). Gratitude also is expressed to Dr. A. L. Page for helpful com-ments on a draft version of this paper. Support for Dr. Smith wasprovided by the Australian Water Recycling Centre of Excellenceunder the Commonwealth’s Water for the Future Program and theCSIRO Water for a Healthy Country Research Flagship. Prepara-tion of this paper also was supported in part by funds allocatedto Dr. Sposito as the Betty & Isaac Barshad Chair in Soil Science andadministered through the College of Natural Resources, Universityof California at Berkeley.
References
Arienzo, M., Christen, E.W., Quayle, W.C., Kumar, A., 2009. A review of the fate ofpotassium in the soil–plant system after land application of wastewaters. J.Hazard. Mater. 164, 415–422.
Arienzo, M., Christen, E.W., Jayawardane, N.S., Quayle, W.C., 2012. The relative effectsof sodium and potassium on soil hydraulic conductivity and implications forwinery wastewater management. Geoderma 173–174, 303–310.
Ayers, R.S., Westcot, D.W., 1985. Water quality for agriculture. FAO Irrig. Drain. Pap.29 Rev.1. FAO, Rome.
Bond, W.J., 1998. Effluent irrigation – an environmental challenge for soil structure.Aust. J. Soil Res. 36, 543–555.
Bresler, E., McNeal, B.L., Carter, D.L., 1982. Saline and Sodic Soils. Springer-Verlag,Berlin, Germany.
Brooks, R.H., Bower, C.A., Reeve, R.C., 1956. The effect of various exchangeable cationsupon the physical condition of soils. Soil Sci. Soc. Am. J. 20, 325–327.
Chen, Y., Banin, A., Borochovitch, A., 1983. Effects of potassium on soil structure inrelation to hydraulic conductivity. Geoderma 30, 135–147.
de Sigmond, A.A.J., 1928. The classification of alkali and salty soils. 1st Int. Cong. SoilSci. Proc. (1927) 1, 330–344.
Dellavalle, N., 2010. Private Communication. Dellavalle Laboratory Inc., 1910, WMcKinley Ave, Fresno, CA, pp. 93728.
Dontsova, K.M., Norton, L.D., 2002. Clay dispersion, infiltration, and erosion as influ-enced by exchangeable Ca and Mg. Soil Sci. 167, 184–193.
Duan, Q.Y., Gupta, V.K., Sorooshian, S., 1993. Shuffled complex evolution approachfor effective and efficient global minimization. J. Optim. Theory Appl. 76 (3),501–521.
Feigin, A., Ravina, I., Shalhevet, J., 1991. Irrigation With Sewage Effluents. AdvancedSeries in Agricultural Science, vol. 17. Springer, Berlin.
Fireman, M., Bodman, G.B., 1939. The effect of saline irrigation water upon thepermeability and base status of soils. Soil Sci. Soc. Am Proc. 4, 71–77.
Intrawech, A., Stone, L.R., Ellis Jr., R., Whitney, D.A., 1982. Influence of fertilizer nitro-gen source on soil physical and chemical properties. Soil Sci. Soc. Am. J. 46,832–836.
Jayawardane, N.S., Christen, E.W., Arienzo, M., Quayle, W.C., 2011. Evaluation ofthe effects of cation combinations on soil hydraulic conductivity. Soil Res. 49,56–64.
Keren, R., 1984. Potassium, magnesium and boron in soils under saline and sodicconditions. In: Shainberg, L., Shalhevet, J. (Eds.), Soil Salinity under Irrigation:Processes and Management. Springer-Verlag, Berlin, Germany, pp. 77–99.
Kruger, I., Taylor, G., Ferrier, M., 1995. Effluent at work. Australian Pig Housing Series,NSW Agriculture, Tamworth, NSW.
Levy, G.J., 2012. Sodicity. In: Huang, P.M., Li, Y., Sumner, M.E. (Eds.), Handbook of SoilSciences. Resource Management and Environmental Impact, 2nd ed. CRC Press,Boca Ratón, FL (Chapter 18).
agnesium in irrigation water quality assessment. Agric. Water
Levy, G.J., van der Watt, H.v.H., 1990. Effect of exchangeable potassium on thehydraulic conductivity and infiltration rate of some South African soils. Soil Sci.149, 69–77.
Magistad, O.C., 1945. Plant growth relations on saline and alkali soils. Bot. Rev. 11,181–230.

ING ModelA
6 ater M
M
M
M
O
O
Q
Q
R
R
R
ARTICLEGWAT-3993; No. of Pages 6
C.J. Smith et al. / Agricultural W
archuk, A.G., Rengasamy, P., 2010. Cation ratio of soil structural stability (CROSS).In: 19th World Congress of Soil Science, Soil Solutions for a Changing World,1–6 August, Brisbane, Australia, pp. 9–11.
archuk, A., Rengasamy, P., 2011. Clay behaviour in suspension is related to theiconicity of clay-cation bonds. Appl. Clay Sci. 53, 754–759.
archuk, A., Rengasamy, P., McNeill, A., Kumar, A., 2012. Nature of the clay-cationbond affects soil structure as verified by X-ray computed tomography. Soil Res.50, 638–644.
ster, J.D., Jayawardane, N.S., 1998. Agricultural management of sodic soils. In:Sumner, M.E., Naidu, R. (Eds.), Sodic Soil: Distribution, Properties, Manage-ment and Environmental Consequences. Oxford University Press, New York,pp. 125–147.
ster, J.D., Sposito, G., 1980. The Gapon coefficient and the exchangeable sodiumpercentage-sodium adsorption ratio relation. Soil Sci. Soc. Am. J. 44, 258–260.
uirk, J.P., 2001. The significance of the threshold and turbidity concentrations inrelation to sodicity and microstructure. Aust. J. Soil Res. 39, 1185–1217.
uirk, J.P., Schofield, R.K., 1955. The effect of electrolyte concentration on soil per-meability. J. Soil Sci. 6, 163–178.
eeve, R.C., Bower, C.A., Brooks, R.H., Gschwend, F.B., 1954. A comparison of theeffects of exchangeable sodium and potassium upon the physical condition ofsoils. Soil Sci. Soc. Proc. 18, 130–132.
engasamy, P., Sumner, M.E., 1998. Processes involved in sodic behaviour. In:Sumner, M.E., Naidu, R. (Eds.), Sodic Soil: Distribution, Properties, Manage-
Please cite this article in press as: Smith, C.J., et al., Potassium and mManage. (2014), http://dx.doi.org/10.1016/j.agwat.2014.09.003
ment and Environmental Consequences. Oxford University Press, New York,pp. 35–50.
engasamy, P., Greene, R.S.B., Ford, G.W., Mehanni, A.H., 1984. Identification of dis-persive behaviour and management of red-brown earths. Aust. J. Soil Res. 22,413–431.
PRESSanagement xxx (2014) xxx–xxx
Rengasamy, P., Marchuk, A., 2011. Cation ratio of soils structural stability (CROSS).Soil Res. 49, 280–285.
Rhoades, J.D., Kandiah, A., Mashali, A.M., 1992. The use of saline waters for cropproduction. FAO Irrig. Drain. Pap. 48. FAO, Rome, Italy.
Rosenbrock, H.H., 1960. An automatic method for finding the greatest or least valueof a function. Comput. J. 3, 175–184.
Shainberg, L., Shalhevet, J. (Eds.), 1984. Soil Salinity Under Irrigation: Processes andManagement. Springer-Verlag, Berlin, Germany.
Smiles, D.E., Smith, C.J., 2004a. A survey of the cation content of piggery effluents andsome consequences of their use to irrigate soils. Aust. J. Soil Res. 42, 231–246.
Smiles, D.E., Smith, C.J., 2004b. Absorption of artificial piggery effluents by soil: alaboratory study. Aust. J. Soil Res. 42, 961–975.
Sposito, G., 2008. The Chemistry of Soils, 2nd ed. Oxford University Press, New York.Sumner, M.E., 1993. Sodic soils: new perspectives. Aust. J. Soil Res. 31, 683–750.Sumner, M.E., Naidu, R. (Eds.), 1998. Sodic Soil: Distribution, Properties, Manage-
ment and Environmental Consequences. Oxford University Press, New York.Tanji, K.K., Kielen, N.C., 2002. Agricultural drainage water management in arid and
semi-arid areas. FAO Irrig. Drain. Pap. 61. FAO, Rome, Italy.Tyagi, N.K., Minhas, P.S., 1998. Agricultural Salinity Management in India. Director,
Central Soil Salinity Research Institute, Karnal, India.U.S. Salinity Laboratory Staff, 1954. Diagnosis and Improvement of Saline and Alkali
Soils. Handbook No. 60. US Department of Agriculture, Washington, DC.Wallender, W.W., Tanji, K.K., 2012. Agricultural Salinity Assessment and Manage-
agnesium in irrigation water quality assessment. Agric. Water
ment. ASCE Manuals and Reports on Engineering Practice No. 71. ASCE, Reston,VA.
Vyshpolsky, F., Mukhamedjanov, K., Bekbaev, U., Ibatullin, S., Yuldashev, T., Noble,A.D., Mirzabaev, A., Aw-Hassan, A., Qadir, M., 2010. Agric. Water Manage 97,1277–1286.