posthdisaster!needsassessment! (pdna)! floods post disaster needs assessment 2009.pdf2009$!!!!!...
TRANSCRIPT

2009
AUGUST 2009
Post Disaster Needs Assessment (PDNA)
A Report Prepared by the Government of the Republic of Namibia, with support from the International Community

POST-‐DISASTER NEEDS ASSESSMENT (PDNA) A Report Prepared by the Government of the Republic of Namibia, with Support from the International Community
August 2009

Namibia Post Disaster Needs Assessment ii
Page ii
Foreword
In March of 2009, torrential rains across Angola, Namibia, and Zambia increased water levels in the Chobe, Kunene, Kavango and Zambezi rivers to such an extent that the North-‐Central and North-‐Eastern Namibia experienced the worst flooding in decades. The damage affected an area that is home to sixty percent of the total population, destroying critical infrastructure, washing away crops and livestock, damaging homes, and causing widespread displacement. Many of those affected by the 2009 floods had not recovered fully from the heavy rainfalls in 2008 that had also caused destruction and dislocation.
In the aftermath of the flooding, the Government of Namibia immediately mobilized emergency assistance to meet the most pressing needs of people in the affected regions. The Government allocated N$ 109 million towards the response effort and established 110 temporary camps in the six affected regions (Caprivi, Kawango, Ohangwena, Omusati, Oshana, Oshiko,) to house the displaced population. The regional authorities set up and administered the camps, installing pit latrines and showers/bathing facilities and basic water supplies. Officials also made available non-‐food items (tents, tarpaulins, blankets, water-‐purification tablets, and mosquito nets) for the dislocated communities. Logistics, airlifting capacity as well as vehicles and motor boats, were provided by government, through the various line ministries. The private sector also contributed to the Government’s efforts by providing new vehicles and other items. Donors provided immediate assistance amounting to some US$ 36 million, a gesture that is highly appreciated. The Government is currently continuing to provide food assistance to the displaced population in the camps, and has decided to extend the food assistance scheme until they are able to return to their homes.
The disaster response has been coordinated nationally by the Directorate of Emergency Management (DEM), within the Office of the Prime Minister, and regionally by the Regional Councils through the Regional Emergency Management Units. In the Ohangwena, Omusati, Oshana, and Oshikoto regions, the Government reactivated the Flood Emergency Management Coordination Office (FEMCO) in order to coordinate relief assistance. The National Planning Commission in The Office of the President has worked to ensure effective coordination with the international community, working hand-‐in-‐hand with civil society and the private sector.
These efforts were complemented by international donors, such as the United States Government, the Government of the People’s Republic of China, Italy, Germany, Finland, Spain, Austria, France, Botswana, Estonia, Federation of Russia and the World Food Programme, the International Federation of Red Cross and Red Crescent Societies (IFRC) the UNHCR, and the UN Central Emergency Response Fund.
Immediately following the relief efforts, the National Planning Commission (NPC) requested the World Bank, through the Global Fund for Disaster Risk Reduction and Recovery (GFDRR), and in to undertake a Post Disaster Needs Assessment (PDNA) in coordination with the United Nations and European Commission in order to assist the Government This was the first step towards developing a holistic approach to recovery and reconstruction efforts, and also aimed to provide the

Namibia Post Disaster Needs Assessment iii
Page iii
Government of Namibia with options for working towards longer term, sustainable Disaster Risk Reduction. The 2009 floods highlight the importance of reducing risks in Namibia, particularly as the country is predicted to face a greater likelihood of extreme weather patterns affecting temperatures and precipitations patters due to climate change.
The Government of Namibia would like to thank the Post-‐Disaster Needs Assessment team for their swift response to the request for assistance, for the dedication of the team shown throughout the assessment, and for the quality of this report. The PDNA offers an outstanding example of effective coordination between various development partners, specifically the World Bank, the United Nations, the European Commission, the United States Agency for International Development, and the Government of Namibia. This assessment report provides a clear analysis of the extend of the damages and losses caused by the devastating floods, the hardship suffered by people, as well as the adverse impacts this had on the economy and the environment. Furthermore, it identifies financing needs required to formulate comprehensive early recovery actions, implement medium-‐term recovery and reconstruction plans, and develop a long-‐term risk management and reduction strategy.
Finally, our sincere appreciation is extended to the Global Facility for Disaster Reduction and Recovery (GFDRR) for the amount of US$ 0.2 million for carrying out this analysis and compiling the report.
Professor Peter H. Katjavivi Director General National Planning Commission Office of the President Republic of Namibia
Representing the Government of the Republic of Namibia

Namibia Post Disaster Needs Assessment iv
Page iv
Acknowledgements
[to be finalized by mid September with EC comments and Government input] This report was prepared by the Government of Namibia, with support from members of the international community, including the European Commission, the United Nations, the World Bank, and a wider network of development partners. In the weeks following the devastating floods of 2009, initiation damage assessments were conducted by the Government of Namibia, and assisted by a team from the United Nations. The results of these assessments provided a basis for immediate response and short-‐term recovery, and the PDNA team is indebted to the initial evaluation teams for their guidance and assistance. After the initial humanitarian relief phase, the Government of Namibia initiated a Post-‐Disaster Needs Assessment (PDNA), which was overseen by the Hon. Prof. Peter Katjavivi, Director General, National Planning Commission of the Office of the President, supported by Ruth Kagia, Country Director of the World Bank and Simon Nhongo, United Nations Resident Coordinator. The entire process was facilitated by the Global Facility for Disaster Recovery and Reconstruction (GFDRR) and the United Nations Development Programme’s Bureau for Crisis Prevention and Recovery (UNDP-‐BPCR), with financial support from the European Commission, the Grand Duchy of Luxembourg, and the World Bank. The PDNA was coordinated by Michael Mutonga (National Planning Commission) and Japhet Iitenge (Directorate for Emergency Management) assisted by a team from the international community that was led by Jean-‐Christophe Carret (World Bank) and Seth Vordzorgbe (UNDP). The team from the Government of Namibia included: Gerson TSamaseb, Linda Munsu, Shikupe Meroro, Benson Matali, Ervin Nahafingo, Veikko Shigwedha, Peter Muteyali, Olimpio Nhuleipo, Sofia Nekongo, Lahja Nqhipandula [Government to provide further input] The international community core team included: Kari Egge (EC), Roberto Jovel, Francis Muraya, Doekle Geert Wielinga (GFDRR), Guido Lemoine, Andrea Gerhardinger (JRC), Noro Aina Andriamihaja, Pedro Arlindo, Sofia Bettencourt, Karsten Feuerriegel, IJsbrand de Jong, Sheila Dutta, Brent Hampton, Erin Hansell, Zahra Hassanali, Larisa Leshchenko, Stephen Ling, Eugenia Marinova, Tesfamichael Nahusenay, Patrice Rakotoniaina, Tojoarofeitra Ramankirahna, Mahefaa Randrianalijahona, Hasimahery Randrianosolo, John Steytler (World Bank), Puji Pujiono (UNDP), and Patrick Diskin (USAID), as well as heads of various UN agencies, including Admir Bay (FAO), Boshigo Matlou (ILO), Pierre Bry (OCHA), Gloria Billy, Robert Bennoun, Elina Titus, David Faustinus (UNAIDS), Megan Carolus, McDonald Kadzatsa, Lebogang Motlana, Mfaro Moyo, Mkwetu Mweutota (UNDP), Edem Adubra, Matthias Lansard, Melanie Seto (UNESCO), Fabian Byomuhangi, Pandu Hailonga, Jonathan Ndzi, Sakaria Nikodemus (UNFPA), George Kozonguizi, Fredrick Kustaa, Hosea Mahua, Eduardo Seuerake, Kamanja Tjatjitua (UN-‐Habitat), Joyce Mends-‐Cole, Maria Vakeni (UNHCR), Elaine Bainard, Gunder Edstrom, Fritz Etienne, Ian Macleod, Ahmed Madar, Tabit Tambwe, Nolan Van Der Ross (UNICEF), Jan Kellet, Maude Mugisha, Emma Sitambuli (UN-‐ORC), Baton Osmani, Paula Hidalgo Sanchis (WFP), Petrus Mhata, Innocent Mwesigye, Magda Robalo, Desta Tiruneh (WHO),

Namibia Post Disaster Needs Assessment v
Page v
The mission was assisted in the field by Erika Odendaal (World Bank) and Lemmy Kapinka (World Bank), and from Pretoria by Sandeep Mahajan (World Bank), Sarwat Hussain (World Bank), and Juan Gaviria (World Bank). The report was designed by Leon Heyns (FEMCO), Virginia Arnecchi (UNDP) and assembled by Anna O’Donnell (GFDRR). Photographs used in this publication were taken by the PDNA team and Government staff.

Namibia Post Disaster Needs Assessment vi
Page vi
Table of Contents FOREWORD ................................................................................................................................................... II
ACKNOWLEDGEMENTS .................................................................................................................................IV
TABLE OF CONTENTS .....................................................................................................................................VI
LIST OF ABBREVIATIONS ............................................................................................................................... XI
EXECUTIVE SUMMARY ................................................................................................................................ XIII
SECTION I: THE DISASTER ............................................................................................................................... 1
1.1. THE 2009 FLOOD ........................................................................................................................................... 2 1.2. THE HUMAN TOLL .......................................................................................................................................... 3 1.3. THE IMMEDIATE RESPONSE .............................................................................................................................. 4 1.4 SOCIAL AND ECONOMIC BACKGROUND OF THE AFFECTED AREAS .............................................................................. 5 1.5. NAMIBIA’S VULNERABILITY TO NATURAL HAZARD AND CLIMATE CHANGE ................................................................. 7
SECTION II: SUMMARY OF DAMAGE AND LOSSES ......................................................................................... 9
2.1 METHODOLOGY ............................................................................................................................................ 10 2.2 SUMMARY OF DAMAGE AND LOSSES ................................................................................................................. 11
SECTION III: ESTIMATION OF DAMAGE AND LOSSES BY SECTOR ................................................................. 16
3.1 SECTOR IMPACTS: INFRASTRUCTURE .................................................................................................................. 17 3.2. SECTOR IMPACTS: PRODUCTIVE SECTORS .......................................................................................................... 24 3.3. SECTOR IMPACTS: SOCIAL SECTORS .................................................................................................................. 30 3.4. CROSS CUTTING ISSUES ................................................................................................................................. 37 4.1. MACRO-‐ECONOMIC IMPACT ........................................................................................................................... 40 4.2. IMPACT ON INCOME AND LIVELIHOODS ............................................................................................................. 45 4.3. IMPACT ON FOOD SECURITY ........................................................................................................................... 47 4.4. IMPACT ON GENDER, HIV/AIDS, GOVERNANCE AND PROTECTION ........................................................................ 47
SECTION V: EARLY RECOVERY REQUIREMENTS ........................................................................................... 50
5.1 INTRODUCTION ............................................................................................................................................. 51 5.2 EARLY RECOVERY STRATEGIC OBJECTIVES, PRINCIPLES AND VALUES........................................................................... 51 5.3. SECTOR EARLY RECOVERY ACTIONS ................................................................................................................... 55 5.4 RECOMMENDATIONS ON WHEN TO MOVE TO LONG TERM RECOVERY AND DEVELOPMENT ............................................ 59
SECTION VI: MEDIUM AND LONG TERM RECOVERY AND RECONSTRUCTION REQUIREMENTS .................... 61
6.1 RECOVERY AND RECONSTRUCTION STRATEGY ...................................................................................................... 62 6.2 MEDIUM TERM RECOVERY AND RECONSTRUCTION NEEDS (PHASE 2) ...................................................................... 62 6.3 LONG TERM RECONSTRUCTION NEEDS (PHASE 3) ................................................................................................ 64 6.4. SUMMARY OF RECOVERY AND RECONSTRUCTION NEEDS ...................................................................................... 66 6.5 THE WAY FORWARD ....................................................................................................................................... 68
SECTION VII: REDUCING RISKS .................................................................................................................... 69
7.1 SITUATION DURING THE DISASTER ..................................................................................................................... 70 7.2 STRATEGY FOR DISASTER RISK REDUCTION IN NAMIBIA ......................................................................................... 70

Namibia Post Disaster Needs Assessment vii
Page vii
ANNEXES ..................................................................................................................................................... 78
ANNEX 1: WATER SUPPLY AND SANITATION ............................................................................................................. 79 ANNEX 2: TRANSPORT AND COMMUNICATION .......................................................................................................... 83 ANNEX 3: ENERGY ............................................................................................................................................... 90 ANNEX 4: AGRICULTURE, LIVESTOCK AND FISHERIES .................................................................................................. 97 ANNEX 5: INDUSTRY AND COMMERCE ................................................................................................................... 109 ANNEX 6: TOURISM ........................................................................................................................................... 117 ANNEX 7: HOUSING........................................................................................................................................... 123 ANNEX 8: HEALTH ............................................................................................................................................. 132 ANNEX 9: EDUCATION........................................................................................................................................ 141 ANNEX 10: ENVIRONMENT ................................................................................................................................. 154 ANNEX 11: FOOD SECURITY ................................................................................................................................ 166 ANNEX 12: GIS MAPPING .................................................................................................................................. 181
LIST OF TABLES TABLE 1: SUMMARY OF DAMAGE AND LOSSES .............................................................................................................. XIVTABLE 2: SUMMARY OF RECOVERY AND RECONSTRUCTION NEEDS ..................................................................................... XVTABLE 3: INVESTMENT PROGRAM FOR LONG-‐TERM DISASTER RISK MANAGEMENT .............................................................. XIXTABLE 4: INTERNATIONAL DONATIONS TO THE NAMIBIAN FLOODS (AS OF JULY 9, 2009): ....................................................... 5TABLE 5: POPULATION OF THE SIX AFFECTED REGIONS, 2009 (EST.) .................................................................................... 5TABLE 6: INCIDENCE OF POVERTY AND POVERTY SHARES BY REGION, 2003/2004 ................................................................ 6TABLE 7: VALUE OF DAMAGE AND LOSSES CAUSED BY THE 2009 FLOODS DISASTER IN NAMIBIA ............................................ 11TABLE 8: SUMMARY OF DAMAGES AND LOSSES BY REGION ............................................................................................... 13TABLE 9: PER CAPITA DAMAGE AND LOSSES (N$/PERSON) ............................................................................................... 14TABLE 10: SUMMARY TABLE OF DAMAGES AND LOSSES TO THE WSS SECTOR ...................................................................... 17TABLE 13: RECOVERY NEEDS IN THE WSS SECTOR (N$ MILLION) ...................................................................................... 18TABLE 14: DAMAGE AND LOSS IN ROAD TRANSPORT (N$ MILLION) .................................................................................. 19TABLE 15: TRANSPORT SECTOR NEEDS (N$ MILLION) ..................................................................................................... 21TABLE 16: DAMAGE AND LOSSES INCURRED IN THE ENERGY SECTOR .................................................................................. 22TABLE 17: ESTIMATES OF DAMAGE AND LOSSES IN THE AGRICULTURAL SECTOR .................................................................. 25TABLE 18: SUMMARY OF NEEDS FOR AGRICULTURE, LIVESTOCK AND FISHERIES ................................................................... 26TABLE 19: ESTIMATES OF INDUSTRY AND COMMERCE DAMAGE AND LOSSES ....................................................................... 27TABLE 20: SUMMARY OF INDUSTRY AND COMMERCE NEEDS ........................................................................................... 28TABLE 21: SUMMARY OF DAMAGE AND LOSSES IN THE TOURISM SECTOR .......................................................................... 29TABLE 22: SUMMARY OF TOURISM NEEDS ................................................................................................................... 29TABLE 21: TOTAL ESTIMATE OF AFFECTED HOUSEHOLDS IN THE WHOLE REGIONS ................................................................. 31TABLE 22: SUMMARY OF HOUSING SECTOR NEEDS ........................................................................................................ 32TABLE 23: DAMAGE AND LOSS ESTIMATES BY TYPE OF HEALTH FACILITY ........................................................................... 33TABLE 24: HEALTH SECTOR RECOVERY NEEDS ............................................................................................................... 34TABLE 25: SUMMARY OF DAMAGE AND LOSSES IN THE EDUCATION SECTOR ....................................................................... 35TABLE 26: EDUCATION SECTOR RECOVERY AND RECONSTRUCTION NEEDS ......................................................................... 36TABLE 27: SUMMARY OF DAMAGE AND LOSSES IN THE ENVIRONMENT SECTOR ................................................................... 37TABLE 28: ENVIRONMENT SECTOR NEEDS. .................................................................................................................... 38TABLE 29: SUMMARY OF DAMAGE AND LOSSES AND THE VALUE ADDED LOSSES (N$ MILLION) .............................................. 42TABLE 30: IMPACT OF THE FLOOD DISASTER ON ECONOMIC GROWTH ................................................................................. 43

Namibia Post Disaster Needs Assessment viii
Page viii
TABLE 31: IMPACT OF THE FLOOD DISASTER ON THE CURRENT ACCOUNT BALANCE (2009) ................................................... 44TABLE 32: IMPACT OF THE FLOOD DISASTER ON THE FISCAL SECTOR (2009) ........................................................................ 45TABLE 33: HOUSEHOLD INCOME, POVERTY AND LABOUR FORCE IN THE SIX AFFECTED AREA .................................................... 46TABLE 34: DAMAGES AND LOSSES AND INCOME PER CAPITA LOSS AFTER THE FLOOD IN THE SIX REGIONS .................................. 46TABLE 35: EARLY RECOVERY PRIORITY ACTIVITIES (PHASE 1) ........................................................................................... 58TABLE 36: SUMMARY TABLE OF MEDIUM AND LONG TERM RECOVERY AND RECONSTRUCTION NEEDS FOR PHASES 2 AND 3 (N$
MILLION) ...................................................................................................................................................... 67TABLE 37: ESTIMATED DISASTER RISK REDUCTION NEEDS (US$) ..................................................................................... 77TABLE 42: URBAN AND RURAL WATER SUPPLY COMPONENTS ......................................................................................... 80TABLE 43: SUMMARY TABLE OF DAMAGES AND LOSSES TO THE WSS SECTOR (N$ MILLION) ................................................... 80TABLE 44: RECOVERY NEEDS IN THE WSS SECTOR (N$ MILLION) ...................................................................................... 82TABLE 45: EXTENT OF DAMAGE IN THE TRANSPORT SECTOR (N$ MILLION) ......................................................................... 85TABLE 46: ESTIMATED LOSSES IN THE TRANSPORT SECTOR (N$ MILLION) ............................................................................ 85TABLE 47: ROADS PROPOSED FOR UPGRADING (N$ MILLION) ......................................................................................... 87TABLE 48: ROADS PROPOSED FOR IMPROVEMENT OF EMBANKMENTS AND DRAINAGE STRUCTURES ........................................ 87TABLE 49: ACCESS TO BASIC SERVICES (INITIAL INTERVENTION) ........................................................................................ 88TABLE 50: URBAN ROADS IMPROVEMENTS AND RAIN STORM WATER MANAGEMENT .......................................................... 88TABLE 51: DAMAGES INCURRED DUE TO 2009 FLOOD AND STORMS (OMUSATI, OHANGWENA, OSHANA AND OSHIKOTO ) ......... 91TABLE 52: INDICATION OF DAMAGES INCURRED DUE TO 2009 FLOOD AND STORMS, KAVANGO REGION .................................. 92TABLE 53: INDICATION OF DAMAGES INCURRED DUE TO 2009 FLOOD AND STORMS, CAPRIVI REGION ..................................... 92TABLE 54: LOSSES INCURRED DUE TO 2009 FLOOD AND STORMS. (OMUSATI, OHANGWENA, OSHANA AND OSHIKOTO ) ............ 93TABLE 55: INDICATION OF LOSSES INCURRED DUE TO 2009 FLOOD AND STORMS, KAVANGO REGION ...................................... 93TABLE 56 INDICATION OF LOSSES INCURRED DUE TO 2009 FLOOD AND STORMS. CAPRIVI REGION .......................................... 94TABLE 57: NAMIBIA: TOTAL CEREAL PRODUCTION HISTORY ('000 TONS) .......................................................................... 99TABLE 58: ESTIMATES OF AGRICULTURAL DAMAGE AND LOSS (N$ MILLION) .................................................................... 101TABLE 59: DISASTER IMPACTS TO CROP PRODUCTION ................................................................................................. 101TABLE 60: FOOD ASSISTANCE NEEDS ARISING FROM FLOOD DAMAGES AND LOSSES .......................................................... 102TABLE 61: POPULATION EXPERIENCING FOOD INSECURITY ............................................................................................. 103TABLE 62: CROP REHABILITATION NEEDS FOR FLOOD AFFECTED AREAS (N$ MILLION). ....................................................... 107TABLE 63: NEEDS FOR RESTOCKING SMALL FARMER AND COMMUNALLY-‐OWNED FISH PONDS (N$ MILLION) ........................ 107TABLE 64: SUMMARY OF RECOVERY NEEDS (N$ MILLION) ............................................................................................ 108TABLE 65: GDP PER ACTIVITY AT CURRENT PRICES (%) ................................................................................................. 110TABLE 66: EMPLOYMENT RATE PER INDUSTRY AND PER OCCUPATION RESPECTIVELY (%) ...................................................... 111TABLE 67: DEFINITION OF SMALL BUSINESSES IN THE REPUBLIC OF NAMIBIA ..................................................................... 112TABLE 68: TOTAL DAMAGES AND LOSSES FOR THE INDUSTRY AND COMMERCE SECTOR (N$) ................................................ 113TABLE 69: RECOVERY AND RECONSTRUCTION NEEDS FOR THE INDUSTRIAL AND COMMERCIAL SECTORS ................................ 116TABLE 70: TOTAL DAMAGES AND LOST REVENUE FOR PRIVATE TOURIST FACILITIES IN KAVANGO AND CAPRIVI .......................... 118TABLE 71: DAMAGES AND LOSSES IN TOURISM SECTOR (N$ ‘000S) ............................................................................... 119TABLE 72: LOSSES TO COMMUNITY CONSERVANCIES IN KAVANGO AND CAPRIVI ................................................................. 119TABLE 73: SUMMARY OF NEEDS FOR THE TOURISM SECTOR ........................................................................................... 122TABLE 38: CALCULATIONS FOR DAMAGE AND LOSS ASSESSMENT IN THE HOUSING SECTOR .................................................... 125TABLE 39: ESTIMATE OF AFFECTED HOUSEHOLDS IN THE NORTH-‐CENTRE AND NORTH-‐EASTERN REGIONS .............................. 126TABLE 40: DAMAGE AND LOSSES (N$ MILLION) .......................................................................................................... 128TABLE 41: EARLY AND MEDIUM AND LONG TERM RECONSTRUCTION NEEDS (N$ MILLION) .................................................. 131TABLE 74: DAMAGE AND LOSS ESTIMATES BY TYPE OF HEALTH FACILITY ......................................................................... 134

Namibia Post Disaster Needs Assessment ix
Page ix
TABLE 75: ESTIMATES OF HEALTH RECOVERY AND RECONSTRUCTION NEEDS (N$) .............................................................. 140TABLE 76: SCHOOLS AND LEARNERS IN FLOOD-‐AFFECTED REGIONS .................................................................................. 141TABLE 77: TYPES OF CLASSROOMS ........................................................................................................................... 142TABLE 78: 2008 GROSS AND NET ENROLMENT RATIOS ............................................................................................... 143TABLE 79: NUMBER OF SCHOOLS IN THE AFFECTED REGIONS .......................................................................................... 144TABLE 80: BUDGET FOR 2008/2009 AND 2009/2010 ............................................................................................... 145TABLE 81: PROGRAM ALLOCATION FOR 2008/2009 AND 2009/2010 .......................................................................... 145TABLE 82: GOVERNMENT EXPENDITURE 2008/2009 BY FEBRUARY 28, 2009 ................................................................. 145TABLE 83: NUMBER OF SCHOOLS AND LEARNERS AFFECTED BY THE FLOODS ...................................................................... 147TABLE 84: FLOOD DAMAGE AND LOSSES BY REGION ...................................................................................................... 147TABLE 85: TOTAL DAMAGE BY LEVEL OF SCHOOL ......................................................................................................... 148TABLE 86: SUMMARY OF INFRASTRUCTURE NEEDS BY SCHOOL LEVEL (N$ MILLION) ............................................................ 161TABLE 87: SUMMARY OF INFRASTRUCTURE NEEDS BY REGION (IN N$ MILLIONS) ............................................................... 161TABLE 88: EARLY AND LONGER TERM RECOVERY AND RECONSTRUCTION (N$ MILLION) .................................................... 152TABLE 89: DAMAGES AND LOSSES IN ENVIRONMENT SECTOR .......................................................................................... 160TABLE 90: ENVIRONMENT SECTOR NEEDS ................................................................................................................... 163TABLE 91: REQUIRED PUBLIC SECTOR INTERVENTIONS ................................................................................................... 163TABLE 92: ESTIMATION ON NUMBER OF PEOPLE IN NEED OF ASSISTANCE TO COVER FOOD NEEDS .......................................... 170TABLE 93: GOVERNMENT ESTIMATION ON PEOPLE IN NEED OF FOOD RELIEF ..................................................................... 174TABLE 94: FEMCO RELIEF FOOD BASKET ................................................................................................................. 174TABLE 95: TOTAL FOOD DISTRIBUTION BY FEMCO ...................................................................................................... 175TABLE 96: DEM DROUGHT FOOD RELIEF SCHEME PLANNED FOOD RATION ...................................................................... 175
LIST OF FIGURES FIGURE 1: HIGH FLOOD WATERS IN THE 2009 FLOODS .................................................................................................... XIIIFIGURE 2: THE SEARCH FOR CLEAN WATER ..................................................................................................................... XVFIGURE 3: RESIDENTS CARRYING THEIR BELONGINGS TO HIGHER GROUND, OMUSATI ........................................................... XVIIFIGURE 4: THE SIX FLOOD AFFECTED REGIONS ................................................................................................................. 2FIGURE 5: HOUSES AFFECTED BY FLOODING .................................................................................................................... 3FIGURE 6: RESIDENTS OF A RELOCATION CAMP ................................................................................................................ 4 FIGURE 7: INCREASED DESERTIFICATION IS ONLY ONE OF MANY POTENTIAL RISKS FROM CLIMATE CHANGE ................................... 7FIGURE 8: FLOODING OCCURRED IN THREE OF THE PAST FIVE YEARS ..................................................................................... 8FIGURE 9: OWNERSHIP OF DISASTER DAMAGE (LEFT) AND DISASTER LOSSES (RIGHT) AMONG PUBLIC AND PRIVATE SECTORS ..... 12FIGURE 10: DISTRIBUTION OF DAMAGE (LEFT) AND LOSSES (RIGHT) AMONG MAIN SECTORS OF ECONOMIC ACTIVITY .................. 12FIGURE 11: SECTORAL DISTRIBUTION OF DAMAGE AND LOSSES ........................................................................................ 13FIGURE 12: SPATIAL DISTRIBUTION OF DAMAGE CAUSED BY THE 2009 FLOODS IN NAMIBIA .................................................. 14FIGURE 13: SPATIAL DISTRIBUTION OF LOSSES CAUSED BY THE 2009 FLOODS IN NAMIBIA .................................................... 14FIGURE 14: SPATIAL DISTRIBUTION OF 2009 DISASTER DAMAGE PER CAPITA IN NAMIBIA ..................................................... 15FIGURE 15: SPATIAL DISTRIBUTION OF 2009 DISASTER LOSSES PER CAPITA IN NAMIBIA ....................................................... 15FIGURE 16: FLOODED SANITATION FACILITIES ............................................................................................................... 17FIGURE 17: FLOODING DAMAGED ROADS AND BRIDGES .................................................................................................. 19FIGURE 18: FLOOD AFFECTED ROADS ........................................................................................................................... 20FIGURE 19: FLOODING IN A LOCAL VILLAGE, OMUSATI .................................................................................................... 23FIGURE 20: FLOODING OF AGRICULTURAL LANDS .......................................................................................................... 24FIGURE 21: LIVESTOCK ............................................................................................................................................. 25

Namibia Post Disaster Needs Assessment x
Page x
FIGURE 22: CROPS ARE CRITICAL TO THE SURVIVAL OF RURAL RESIDENTS ............................................................................ 25FIGURE 23: FLOODED COMMERCIAL ESTABLISHMENTS .................................................................................................... 27FIGURE 24: FLOODING NEAR TOURISM LODGES ............................................................................................................. 29FIGURE 25: FLOODING OF HOUSES BUILT OF CORRUGATED IRON ....................................................................................... 30FIGURE 26: HOUSES DAMAGED BY FLOODING ............................................................................................................... 31FIGURE 27: RESIDENTS OF A RELOCATION CAMP ............................................................................................................ 32FIGURE 28: FLOODING CAUSED DISRUPTED ACCESS TO MANY HEALTH FACILITIES .................................................................. 33FIGURE 29: MAKESHIFT CLASSROOMS AFTER THE FLOODING ............................................................................................ 35FIGURE 30: ARIAL VIEW OF FLOODING ......................................................................................................................... 37FIGURE 31: SHARE OF GDP BY SECTOR, 2008 .............................................................................................................. 40FIGURE 32: FOOD AT THE LOCAL MARKET ..................................................................................................................... 47FIGURE 33: FLOOD VICTIM ........................................................................................................................................ 48FIGURE 34: FLOOD VICTIM ........................................................................................................................................ 53FIGURE 35: MEDIUM TERM RECOVERY AND RECONSTRUCTION NEEDS (PHASE 1) (N$ MILLION) ........................................... 63FIGURE 36: LONG TERM RECONSTRUCTION NEEDS (PHASE 2) (BILLION N$) ...................................................................... 65FIGURE 37: REDUCING RISKS CAN PREVENT FUTURE RELOCATIONS ..................................................................................... 66FIGURE 38: FLOODPLAIN IN CAPRIVI, APRIL 2009 ......................................................................................................... 73FIGURE 39: COMMUNITY LEADERS TEACH OTHERS HOW TO READ FLOOD MARKERS. .............................................................. 75FIGURE 40: REGISTERED COMMUNAL CONSERVANCIES IN NAMIBIA ................................................................................. 155FIGURE 41: NATIONAL PARKS IN NORTHERN NAMIBIA – ETOSHA (5), BWABWATA (8), MUDUMU (9), MAMILI (10). ............. 157FIGURE 42: MAIZE MEAL PRICES IN URBAN AND RURAL AREAS ...................................................................................... 172

Namibia Post Disaster Needs Assessment xi
Page xi
List of Abbreviations
AIDS Acquired Immune Deficiency Syndrome ART Antiretroviral Treatment AU African Union CBO Community Based Organisation CCC Colorado Climate Centre CCSR Centre for Climate Systems Research CEMU Constituency Emergency Management Unit CERF Central Emergency Response Fund CRC Convention of Right of Child CSO Civil Society Organisations DAC Development Assistance Committee DEM Directorate of Emergency Management DREF Disaster Relief Emergency Fund DRR Disaster Risk Reduction EC European Commission EMIS Education management information System EPA Emergency Preparedness Activity EPR Epidemic Preparedness and Response ETSIP Education and Training Sector Improvement Program EU European Union FAO Food and Agricultural Organisation FEMCO Flood Emergency Management Coordination Office GBV Gender Based Violence GDP Gross Domestic Product GHG Green House Gasses GIS Geographical Information System GoN Government of Namibia HBC Home Based Care HIV Human Immuno-‐Deficiency Virus HRNA Human Recovery Needs Assessment IDSR Integrated Disease Surveillance and Response IFRC International Federation of the Red Cross and Red Crescent Societies INC Initial National Communication IPCC International Program on Climate Change MDG Millennium Development Goals MGECW Ministry of Gender Equality and Child Welfare MOE Ministry of Education MOHSS Ministry of Health and Social Services NAP National Action Plan NBC Namibia Broadcasting Corporation NDEF National Disaster Emergency Fund NDMS National Disaster Management System NDP National Development Plan NEMC National Emergency Management Committee NER Net Enrolment Ratio NEWFS National Early Warning and Food Information System NGO Non Government Organisation NGP National Gender Policy NHIES National Household Income and Expenditure Survey

Namibia Post Disaster Needs Assessment xii
Page xii
NPC National Planning Commission NRCS Namibian Red Cross Society OECD Organisation for Economic Cooperation and Development OPM Office of the Prime Minister OVC Other Vulnerable Children PCM Parallel Climate Model PDNA Post Disaster Needs Assessment PHC Primary Health Care PLWHIV People Living With HIV PMTCT Prevention of Mother to Child Transfer REMU Regional Emergency Management Unit SACMEQ Southern African Consortium for Monitoring Education Quality SADC Southern African Development Community STI Sexually Transmitted infections TBA Traditional Birth Attendants TWG Thematic Work Group UN United Nations UNAIDS United Nations Joint Programme on HIV/AIDS UNCT United Nations Country Team UNDAC United Nations Disaster Assessment and Coordination UNDP United Nations Development Fund UNDSS United Nations department of safety and security UNFPA United Nations Population Fund UNHCR United Nations High Commission for Refugees UNIC United Nations Information Centre UNICEF United Nations Children's Fund US United States WACPU Women and Child Protection Unit WASH Water and Sanitation & Hygiene WB World Bank WFP World Food Programme WHO World Health Organisation

Namibia Post Disaster Needs Assessment xiii
Page xiii
Executive Summary
In March 2009, flooding, caused by heavy rainfalls in the region, affected six regions in Northern Namibia (Caprivi, Kavango, Oshana, Oshikoto, Ohangwena, and Omusati). The 2009 flood is the second such event in two years, following three years of successive low-‐rainfall events. Flood waters surged to near record, overtopping roads and washing out local routes. As a consequence, commercial and industrial activities were disrupted. Local access to hospitals and schools was cut off, urban sewage systems overflowed with the inundation of water supply and sewage stations, and electricity provision was compromised. Overall, the entire economy was disrupted for almost three months and trade routes were severely interrupted.
The floods affected a particularly vulnerable portion of the population; one third of the country’s poor live in the six affected regions. Most live in rural areas, and their income highly dependent on subsistence farming. Many farmers lost the majority of their annual harvest as well as their livestock, jeopardizing their income and food sources. Many rural residents, as well as urban dwellers, lost their homes to the floods; in some cases houses made of mud simply washed away with the floods.
The 2009 floods were the second natural disaster to occur in as many years. Following relatively frequent flooding in the 1960s and 1970s, Namibia had enjoyed several decades with relatively little flooding. The past several years has seen a reversal in that trend, with flooding occurring in 2004 and 2008, and culminating with near record water levels in the 2009 floods.
Damage and Losses
In the aftermath of the disaster, the Government of Namibia requested a Post Disaster Needs Assessment (PDNA) to assess the level of damages and losses incurred as a result of the flooding, and to provide a preliminary assessment of recovery and reconstruction options that could provide the affected population with a safer environment in the face of future natural events such as droughts and floods.
Figure 1: High flood waters in the 2009 floods

Namibia Post Disaster Needs Assessment xiv
Page xiv
Table 1: Summary of Damage and Losses
Sector/ Sub-‐Sector Damage N$ (million)
Losses N$ (million)
Damage US$ (million)
Losses US$ (million)
Infrastructure 279.7 32.2 34.3 4.9 Water Supply & Sanitation 47.9 28 5.9 3.4
Transport 223.2 2.9 27.4 0.4 Energy 8.6 1.3 1.1 0.2
Productive 405.1 584.4 49.7 71.7 Agriculture 38.6 120.9 4.7 14.8
Industry 143.5 162 17.6 19.9 Commerce 209.7 289.7 25.7 35.5
Tourism 13.3 11.8 1.6 1.4 Social 416.5 19.5 51.1 2.4
Housing 385.7 13.8 47.3 1.7 Health 0.7 5.7 0.1 0.7
Education 30.1 0 3.7 0.0 Cross-‐Sectoral 10 0.9 1.2 0.1
Environment 10 0.9 1.2 0.1 Total 1,111.30 637.1 136.4 78.2
Source: Estimations by PDNA Assessment Team
Damages were spread among the infrastructure (roads), productive (industry and commerce) and social sectors (housing), (N$ 962.1 million or US$ 118.0 million for these three sectors only representing 86 percent of the total damages), whereas losses were located primarily in three of the four productive sectors (N$ 584.4 or US$ 71.7 million representing 90 percent of the losses. Where the education and health sectors did not sustain damages or losses to the same magnitude of the other sectors, it is important to note that these sectors remain critical lifelines to the most vulnerable populations. Access to health care services, for example, is crucial for populations living with HIV/AIDS; while Namibia’s HIV/AIDS rates have tapered off in recent years, around 17 percent of the population is infected, and many of them rely on health care facilities for survival.
The assessment found damages and losses from the 2009 flood were primarily incurred by the private sector (respectively 72.1 percent and 94 percent).
The Impact The economic impact of the floods is estimated to be about 1 percent of 2009 GDP or 0.6 percent of 2009 GDP growth (forecasted at 1.1 percent before the shock). While the total economic impact in any single year may not be an exorbitant amount at a regional or even national scale, if one were to total the damages and losses from extreme events (flooding and drought) over the past ten years, the total would be more significant. Given that Namibia is prone to potential flooding or droughts, it is likely that the economy will sustain damages and losses in the future as well. This additional cost comes at a time when Namibia has been impacted by the global financial crisis.
Namibia Post Disaster Needs Assessment xv
Page xv
Recovery and Reconstruction Interventions
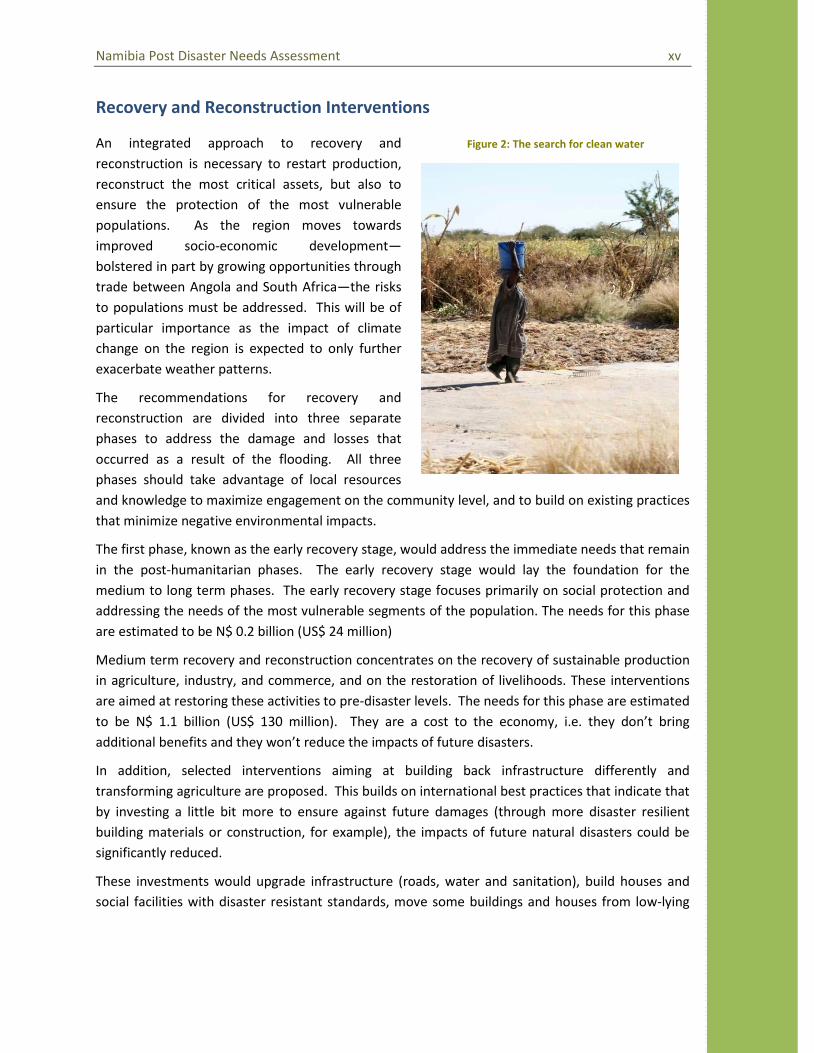
An integrated approach to recovery and reconstruction is necessary to restart production, reconstruct the most critical assets, but also to ensure the protection of the most vulnerable populations. As the region moves towards improved socio-‐economic development—bolstered in part by growing opportunities through trade between Angola and South Africa—the risks to populations must be addressed. This will be of particular importance as the impact of climate change on the region is expected to only further exacerbate weather patterns.
The recommendations for recovery and reconstruction are divided into three separate phases to address the damage and losses that occurred as a result of the flooding. All three phases should take advantage of local resources and knowledge to maximize engagement on the community level, and to build on existing practices that minimize negative environmental impacts.
The first phase, known as the early recovery stage, would address the immediate needs that remain in the post-‐humanitarian phases. The early recovery stage would lay the foundation for the medium to long term phases. The early recovery stage focuses primarily on social protection and addressing the needs of the most vulnerable segments of the population. The needs for this phase are estimated to be N$ 0.2 billion (US$ 24 million)
Medium term recovery and reconstruction concentrates on the recovery of sustainable production in agriculture, industry, and commerce, and on the restoration of livelihoods. These interventions are aimed at restoring these activities to pre-‐disaster levels. The needs for this phase are estimated to be N$ 1.1 billion (US$ 130 million). They are a cost to the economy, i.e. they don’t bring additional benefits and they won’t reduce the impacts of future disasters.
In addition, selected interventions aiming at building back infrastructure differently and transforming agriculture are proposed. This builds on international best practices that indicate that by investing a little bit more to ensure against future damages (through more disaster resilient building materials or construction, for example), the impacts of future natural disasters could be significantly reduced.
These investments would upgrade infrastructure (roads, water and sanitation), build houses and social facilities with disaster resistant standards, move some buildings and houses from low-‐lying
Figure 2: The search for clean water

Namibia Post Disaster Needs Assessment xvi
Page xvi
flood prone areas, and improve use of water for agriculture by constructing small scale multi-‐purpose reservoirs.
In the housing sector, it is proposed to use flood proof-‐materials, to build physical barricades around the housing structure and in some cases where houses are located in a highly exposed floodplain, to relocate housing to safer (higher) areas. In the social sector, the proposed activities include upgrading 600 km of access roads to schools and hospitals to all weather roads.
In the roads sector, it is proposed to build 1,100 km of climate resilient roads that will withstand temporary overflow of water and with adequate drainage structure installed at the appropriate locations, and to improve storm water drainage systems, as well as urban storm lines in Ondangwa and Oshakati.
In the water and sanitation sector, it is proposed to rehabilitate and cover 160 km canal to avoid water contamination during floods to double (from 750 to 1500 boreholes in the rural areas and to replace submersible water pumps and relocate waste dumping to higher ground).
In the agriculture sector, proposed activities include the development of small-‐scale reservoirs at village or homestead level for irrigation and downstream flood protection purposes on 10 000 hectares of highly vulnerable farmlands.
These needs are estimated to be N$ 3.75 billion (US$ 460 million). From an economic point of view, it is investments that would generate additional benefits to the economy, since it would (i) mitigate damages and losses from future floods and droughts; and (ii) deliver development benefits, such as increased productivity in agriculture, faster growth in the trade and manufacturing sectors, and reduced water borne diseases.
In total, the needs for the three phases amount for N$ 5 billion (US$ 620 million), about 5 percent of Namibia’s 2009 GDP.
Table 2: Summary of Recovery and Reconstruction Needs
Phase of Recovery and Reconstruction Value (N$
million)
Value (N$
million)
Value (N$
million)
Value (US$
million)
Percentage
Early Recovery (Phase 1) 196.4 24.1 4 %
Medium-‐Term Recovery and Reconstruction (Phase 2)
1,117.7 137.1 22%
Long-‐Term Reconstruction (Phase 3) 3,755.7 460.8 74%
Total 5,069.8 622.1 100%
Source: PDNA Assessment Team
The build back differently interventions presented in this report are a preliminary assessment by sector experts in their field of what would be needed to improve the resilience of the economy to climate shocks and should be treated as initial ideas and their costs as order of magnitude Prior analytical work would be needed to define these investments in roads, water and sanitation, housing and agriculture sectors. Moreover, future investments must also account for the risk from future flooding through a comprehensive regional hydrology and climate change study. In addition,

Namibia Post Disaster Needs Assessment xvii
Page xvii
local populations would have to be consulted, since many highly flood prone areas might require relocation of populations at risk. See also below the section on strengthening risk assessment.
Recurrent disasters affect core economic sectors such as transport, manufacturing and agriculture. Many of the proposed activities are already included in the National Development Plan 3 (NDP3), including activities on roads, water supply and sanitation, and agriculture. Where the proposed needs overlap with activities proposed under the NDP3, it has been noted in the report. These estimates would only increase the cost of NDP3 by one or two percent1
Disaster Risk Management Measures
, and provide the possibility to refocus investments planned in NDP3 to be more climate resilient.
In addition to the “build back differently” interventions suggested in infrastructure and agriculture sectors, the assessment team developed a series of recommended steps to introduce Disaster Risk Management (DRM) into economic planning. These suggested interventions will also serve to mitigate future impacts of the alternate recurrence of floods and droughts in North and Northeast Namibia. The 2009 floods have highlighted areas of priority interventions to address the most immediate areas of disaster risk management. These should, however, be a part of a broader risk management framework to holistically address the risks that Namibia faces.
Enable Legislation and Strengthen Institutions for Disaster Risk Reduction
The 2009 Disaster Risk Reduction (DRR) Policy necessitates a National Act and corresponding Regulations to clarify lines of command during emergencies. The DRR Act and Regulations could better specify the chain of command during emergencies. From international experience, the chain of command needs to be clear, simple and undisputable, giving the Emergency Agency (in this case the Directorate for Emergency Management -‐DEM) full powers to mobilize the regional authorities, the military and international partners once the President declares a State of Emergency. The latter should be based on parametric triggers – i.e. a pre-‐agreed indicator of likelihood of flood or drought (e.g. number of consecutive days of heavy or low rainfall; river levels upstream).
The 2006 National DRM System includes multi-‐sectoral DRM Committees and refocuses their role from emergency response to disaster risk reduction. These committees could benefit from
1 The amount estimated varies by growth forecast scenarios.
Figure 3: Residents carrying their belongings to higher ground, Omusati

Namibia Post Disaster Needs Assessment xviii
Page xviii
institutional strengthening that would allow for a more coordinated response, with staff trained in DRM principles, and logistical and operational support. Strategies to build an institutionalised DRM could bring particular reinforcement at the national levels, as well as concentrated localized support to Caprivi and Kavango.
Strengthened Risk Assessment
Given the latest floods (2004,2008, 2009) and droughts (2005, 2006, 2007) that have affected the region, climate variability trends and model changes in flood, drought and wild fire hazards could be of particular use to mitigate risk and future impacts from natural disasters. This may include modelling indexes such as rainfall intensity, wetday sequencing, potential evatranspiration, changes in water availability and average river flow. It also requires modelling the expected changes in key hazards (floods, droughts and wildfires) brought about by climate change. Participatory flood mapping can be a powerful tool for consensus decision making and community consultation of reconstruction decisions in the affected areas. The first step would be to simulate the disaster impacts of different flood return periods.
Lessons learned from the 2009 disaster indicates the need to strengthen the early warning system at several levels, including (i) improving transboundary collaboration with the Zambezi River Authority and the Okavango River Basin Commission to ensure continuous readings for Zambezi and Kavango; (ii) installing 17 new gauging stations and 20 new rain gauges in the Cuvelai system; and (iii) designing warning systems in accordance with local conditions that could involve flags, megaphones or another means of communication.
Strengthened Community Awareness Community awareness to disaster risk management is critical to ensure that populations on the local level can adapt to flooding or other natural disasters. Many traditional practices of flood adaptation have been lost during the last decades where flood incidences remained relatively low. Community leaders can be instrumental in delivering messages of flood preparedness to local level populations for improved flood resilience.
Strengthened Disaster Preparedness and Response
At the regional level, there is a need to develop local Contingency Plans as part of civil protection mobilization and awareness campaigns in the affected regions immediately after the disaster. Local authorities should also compile an optimized list of logistical support facilities – the type of equipment and goods needed for the next emergency. At the national level, it is recommended that an International Emergency Advisor be assigned to Namibia for two to three years.

Namibia Post Disaster Needs Assessment xix
Page xix
The following table provides a brief summary of financing needs for DRM.
Table 3: Investment Program for Long-‐Term Disaster Risk Management
Priorities Value (N$ million)
Value (US$ million)
Enabling Legislation and Strengthened Institutions for DRR 6.5 0.8 Strengthened Risk Assessment 16.7 2,0 Strengthened Community Awareness 3.3 0.4 Strengthened Disaster Preparedness and Response 15.9 2.0
Total Estimated Needs for DRR Strengthening 42.4 5.2

Section I: The Disaster

Namibia Post Disaster Needs Assessment 2
Page 2
1.1. The 2009 Flood
Namibia is divided into thirteen regions: Caprivi, Kavango, Kunene, Omusati, Ohangwena, Oshana and Oshikoto regions in the north; the Omaheke, Otjozondjupa, Erongo and Khomas regions in the central areas; and the Hardap, Karas regions in the south. The six affected regions in the floods are located in the North-‐Central and North-‐Eastern regions, in the districts of Caprivi, Kavango, Ohangwena, Omusati, Oshana, and Oshikoto.
Figure 4: The six flood affected Regions
The North-‐Central and North-‐Eastern regions experienced heavy flooding in the 1960s and 1970s, but the past several decades did not see any downpours. In the past several years, however, flooding has resumed; the 2009 floods were particularly devastating not only for the near record water levels that were reached, but also because these regions have experienced increased flooding (2004 and 2008), and several consecutive years of droughts.
In early March of 2009, torrential rains across Angola, Namibia, and Zambia resulted in water levels in the Chobe,Kavango, Kwandu, and Zambezi Rivers to increase to around eight metres, and the flood waters quickly inundated houses and villages in Kavango and Caprivi. The Zambezi and Chobe rivers have broad floodplains largely covered by grass, with only sporadic clumps of trees on slightly higher mounds that are often shared with small settlements. The Okavango and Kwandu have narrower floodplains covered with mostly with grass, but also with denser gallery forest in some areas. Water levels reached near record levels: in the Kavango and Caprivi regions, water levels reached heights not recorded since 1963.
Unlike the effects of the flood in the North-‐Eastern regions, the inundation patterns of the four North-‐Central regions seem to be mostly due to heavy rains (rather than the influence of major rivers), and were exacerbated by drainage systems that were unable to handle the volumes of water. The Ohangwena, Omusati, Oshana, and Oshikoto regions are located in the Cuvelai Basin, which originates in southern Angola. The Cuvelai system is a dense network of ephemeral rivers that carry water only during the rainy season (from November to March). During much of the year,

Namibia Post Disaster Needs Assessment 3
Page 3
depressional areas, or pans, (known locally as oshanas), remain dry and serve as grazing areas. The Cuvelai Basin drains to the Etosha Pan, which is located 150 km south in the Etosha National Park. Cumulative rainfalls in these four regions were almost twice the normal levels (850 mm compared to 450 mm measured at the Ondangwa weather station) from October 2008 to April 2009.
1.2. The Human Toll
UNDAC estimated the population affected by the floods to be 350,000 (or 16.6 percent of the total population of Namibia). However, revised figures from local authorities place the total at closer to 700,000 people (33 percent of the total population). Around 50,000 people were displaced and 102 people lost their lives. The effects of the flood varied by region; Caprivi was most affected by flood levels, but the Ohangwena, Omusati, Oshana, and Oshikoto regions were most affected in terms of population.
Caprivi Region
The area of Caprivi is a natural flood plain delineated by three major rivers (Chobe, Okavango, and Zambezi). This region experienced by far the most severe flooding; even though it has the lowest population of the six regions (about 100,000 people), about one quarter (23,000) of the total population was affected. The proportion of affected people was estimated to be as high as 90 percent in Kabe. During the 2009 floods, water levels of the Zambezi rose to 7.85 m, the highest levels recorded since 1963, and aerial surveys revealed stranded livestock, as well as flooded villages that were cut off. Nearly 9,000 people were relocated to one of four camps. The scale of the crisis stretched the limited capacity of local authorities to respond, and the relocation camps suffered from insufficient water and sanitation facilities (at the Schuckmansburg camp, 4,000 people shared two latrines). Major road access was cut in north Caprivi at four locations, limiting access to health clinics; only four out of eleven health facilities were functioning immediately following the disaster. Local relief efforts were hampered by poor information from the Zambezi River Basin Authority and from Angola.
Kavango Region
The Kavango region was the least affected of the six regions. Flooding was concentrated along a one kilometre (km) stretch of the Okavango river, where flood levels were close to their highest recorded (8.67 m in 2009 versus 8.91 m in 1969). About 2,000 people were displaced, and access to shelter and food, as well as clean water, remained a challenge immediately following the floods. As in Caprivi, the flood also affected tourism facilities, and small and medium enterprises.
Figure 5: Houses affected by flooding

Namibia Post Disaster Needs Assessment 4
Page 4
Ohangwena, Omusati, Oshana, and Oshikoto
The regions of Ohangwena, Omusati, Oshana, and Oshikoto are the most populated area of Namibia (combined population of 800,000). Local authorities quickly established a Flood Emergency Management Coordination Committee (FEMCO). According to FEMCO, some 670,000 people were affected (83 percent of the total population), 21,000 displaced (3 percent), and 4,000 relocated (0.5 percent). In addition, the floods resulted in the closure of more than 900 SMEs, 24 roads, and 135 schools (16 percent of the total). Three settlements had their sewerage systems washed away, twelve clinics were cut off, 45,000 ha of agricultural land were destroyed, and 3,000 livestock were lost (mostly goats). Immediately following the floods, 71,000 people were estimated to be in critical need of food relief.
Urban areas have also been severely affected; cities in Ohangwena and Oshakati saw pump stations inundated, and flood water mixed with sewerage was of particular concern to municipal authorities. Higher water levels boosted fisheries (as the number of fish became more available), but municipal authorities feared contamination from sewerage could cause epidemics of waterborne diseases. For Oshakati city, the floods were also due mainly to poor urban and water management.
1.3. The Immediate Response
On March 17, 2009, the President of Namibia declared a state of emergency and immediately mobilized resources to assist the regions affected by the flooding. The Government allocated N$ 109 million (US$ 13.37 million) for the response and established 110 relocation camps in the six regions to host the displaced. Regional authorities set up and administered the camps, installing pit latrines, showers/bathing facilities and establishing basic water supplies. Authorities also provided non-‐food items (tents, tarpaulins, blankets, water-‐purification tablets, mosquito nets) for displaced communities. Logistics, airlifting capacity, vehicles and motor boats, were provided by the Government, through line ministries. The private sector contributed in supporting Government’s response through new vehicle purchases. The Government provided food assistance to the displaced population in relocation camps and intends to extend the food assistance scheme until displaced populations return to their homes.
In addition, the President of Namibia called upon international partners to provide assistance for the flood affected communities. Relief agencies and foreign governments pledged aid in the form of
Figure 6: Residents of a relocation camp

Namibia Post Disaster Needs Assessment 5
Page 5
goods and financial allocations. These included2
Table 4: International Donations to the Namibian Floods (as of July 9, 2009):
:
Donor Value (US$)
UN Revised Flash Appeal3 1,913,330
UN Central Emergency Response Fund 1,200,000
Namibian Red Cross Society 863,834
United States Government 650,000
Government of Italy 395,257
Government of Germany 382,876
World Food Programme 156,220
International Federation of Red Cross and Red Crescent Societies (IFRC) 146,695
Government of Botswana 60,000
Government of France 52,701
UNHCR 34,000
Government of Estonia 28,664
Total 5,883,577
1.4 Social and Economic Background of the Affected Areas
Geography and Population
The six affected regions are home to 57 percent of the Namibian population (around 2.1 million). Most of the affected population in these regions is rural, and relies on subsistence farming for survival. Average incomes in these regions are half of the national average.
Table 5: Population of the six affected regions, 2009 (est.)
Region Population Households Location
Rural Urban
Caprivi 87,058 18,925 72 28
Kavango 257,347 40,210 72 28
Ohangwena 261,324 41,480 99 1
Omusati 243,658 42,747 99 1
Oshana 176,586 32,701 69 31
Oshikoto 181,304 33,575 91 6
Total (6 affected regions) 1,207,277 209639 86 14
Source: Population Projections 2001-‐2031, Central Bureau of Statistics, NPC. (Jan 2006)
2 Includes both monetary pledges, as well as the valued amount of goods donated 3 The revised flash appeal was based on the needs identified based on the preliminary results of the PDNA report for the following sectors: disaster risk reduction, health, education, HIV/AIDS, and shelter and protection.

Namibia Post Disaster Needs Assessment 6
Page 6
Economic Overview With a per capita income of about US$ 4,200 in 2008, Namibia is classified as a lower middle-‐income country. Namibia has experienced steady growth, moderate inflation, strong external surpluses and low indebtedness over the past several years as a result of generally prudent fiscal policies, a stable political environment, a fairly developed infrastructure, and a strong legal and regulatory environment. Namibia’s strong record of macroeconomic stability is based in part on a credible peg to the South African Rand through its membership in the Common Monetary Area, linking Namibia to South Africa’s inflation targeting framework
The main economic activity in the flooded areas is subsistence farming, with farmers growing pearl millet (locally known as mahangu), sorghum and keeping small herds of cattle and goats. Rural dwellers generally live in fenced homesteads consisting of mud huts covered with straw roofs. These homesteads, crop fields and pasture are all located along the flood plains and rivers.
The end of civil war in Angola resulted in improved trade between the two countries. Cars, food and construction materials from South Africa are transported to the region overland from Walvis Bay, through the north-‐central regions to Angola. As a result, the affected regions have enjoyed rapid growth that has translated into infrastructure expansion and urbanization over the past several years. In the north-‐eastern regions, especially Caprivi, nature tourism is an important and growing economic activity and source of revenue.
Poverty
The Kavango and Ohangwena Regions have the highest levels of poverty incidence and also the largest shares of poor households; these two regions are home to 17.8 and 16.5 percent, respectively, of all the poor households in Namibia. In other words, these two regions house more than one third of poor households in the country. If the regions of Omusati and Oshikoto are included, then between the four regions, almost 60 percent of all poor households in the country are included. Thus, the 2009 floods affected a population that is already vulnerable, and many were still coping with the cumulative effects disasters (floods and drought).
Table 6: Incidence of Poverty and Poverty Shares by Region, 2003/2004
Region Incidence of Poverty (poor)
(% of population)
Incidence of Poverty (severely poor) (% of population)
Poverty shares by region (% of total)
Caprivi 28.6 12.5 5.2 Kavango 56.5 36.7 17.8 Ohangwena 44.7 19.3 16.5 Omusati 31.0 12.8 11.9 Oshana 19.6 7.8 6.1 Oshikoto 40.8 16.6 12.7 National Average 27.6 13.8 Source: A Review of Poverty and Inequality in Namibia, Central Bureau of Statistics, National Planning Commission (October 2008)

Namibia Post Disaster Needs Assessment 7
Page 7
1.5. Namibia’s Vulnerability to Natural Hazard and Climate Change
Namibia is considered to be one of the most vulnerable countries to the effects of climate change in sub-‐Saharan Africa. Since Namibia is home to several different eco-‐regions (e.g. tropical, semi-‐arid, desert), the particular challenges posed by climate change will vary by region, and the responses are best formulated at the regional and the local levels.
A 1998 Climate Change Country Study identified that the climate change risk for Namibia includes a warming of up to 2 Celsius (C) over the coming 50 years, and an overall more variable and extreme climate with regional reductions of rainfall. All production sectors will be affected by such changes, and impacts on agricultural production (drier climates, more variable seasons, more frequent and prolonged dry spells and droughts), water availability (negative recharge rates of ground water;
seasonally increased run-‐off from areas that are expected to receive more rainfall, i.e. Angola’s central highlands), health (heat impacts, water stress, and spread of certain diseases such as malaria), and infrastructure (esp. through flooding damage), are to be expected. Preliminary estimates of climate change impact on natural resources alone (agriculture and fisheries) suggest that Namibia could lose annually between 1 and 6 percent if no action is taken to adapt to climate change4
Climate Change Hazard Exposure in the Flood-‐Affected Regions . This will affect the poor most (because they are more dependent on natural resources).
The majority of the population living in the six flood-‐affected regions is directly dependent on subsistence agriculture, livestock rearing, forestry, eco-‐ tourism, indigenous biodiversity and fisheries. Increasingly, due to the effects of worsening climatic conditions on long-‐term agricultural productivity, the adaptive capacities of farmers, pastoralists and natural resource managers are compromised. Land degradation – soil erosion, bush encroachment and deforestation – is becoming progressively worse in most parts of the country, but more acute in the six flood-‐affected regions. This leads to vegetation degradation and loss of soil fertility which affects agricultural productivity. Climate change is expected to only exacerbate this trend.
The expected climate change impacts in the regions include: decline in water availability and increasing temperatures, due to higher evapo-‐transpiration and changing patterns of rainfall. This, in turn, will affect water resources within the Cuvelai-‐Etosha Basin, the Kavango and Zambezi
4 The economic impact of climate change in Namibia. How Climate Change will affect the contribution of Namibia’s natural resources to its economy? IIED discussion paper 07-‐02, November 2007.
Figure 7: Increased desertification is only one of many potential risks from climate change

Namibia Post Disaster Needs Assessment 8
Page 8
Rivers, forests, and other natural ecological systems, agriculture and food security, power generation at Ruacana, infrastructure (housing, shelters and roads, telecommunication), tourism (lodges, camping sites, game) and human health (diseases, sanitation and water quality).
This is further likely to increase competition and conflict for scarce resources like water and arable land, which could lead to political instability and climate refugees, as well as unsustainable practices. Changing patterns and intensity of rainfall are likely to increase the rate of soil erosion, negatively affecting crop production and livestock rearing.
An increased incidence and severity of extreme weather events, such as flooding, will worsen soil erosion and destroy crops. Climate change will affect the agricultural yields directly
through changes in temperature and precipitation, and indirectly through changes in soil quality, introduction of pests, and diseases. Coping strategies for climate change need to be enhanced at local, regional and national levels. Addressing adaptation to climate change is one of the national priorities as reported in Namibia’s Initial National Communication (INC).
Figure 8: Flooding occurred in three of the past five years

Page 9
Section II:
Summary of Damage and Losses

Namibia Post Disaster Needs Assessment 10
Page 10
2.1 Methodology
In the aftermath of the flooding, the Government of Namibia requested a Post-‐Disaster Needs Assessment (PDNA) be conducted in the affected regions to assess the damage and losses that occurred as a result of the flooding, and to provide a preliminary assessment of needs required for recovery and reconstruction. PDNA is an integrated assessment framework and process to help identify and select response options covering interventions from early-‐ to long-‐term recovery in a Recovery Framework (RF).
The estimates for damage and losses were made using the DaLA methodology (damage and loss methodology). This methodology5
Baseline data for each of the sectors, as well as for the performance of the Namibian economy were assembled from a variety of sources, and collected by the PDNA team.
was first developed in the 1970s by the United Nations Commission for Latin America and the Caribbean (ECLAC), and has been continually updated and customized for use around different regions of the world. The methodology identifies and quantifies the social, economic, and environmental impacts of natural disasters (see Box 1). Damage estimates provide and initial indicator of reconstruction requirements, and losses represent the reduction, or decline, in economic activity and personal and family income that occurred as a result of the natural disaster.
Box 1: PDNA and Methodologies
The Post Disaster Needs Assessment (PDNA) makes use of a Damage and Loss Assessment (DaLA) methodology. The DaLA methodology is based on the ECLAC methodology for disaster assessment, developed in the 1970s, and has continuously been simplified and expanded for use in different areas of the world. DaLA bases the assessment of disaster impacts on the overall economy of the affected country as well as on the household level. This provides a basis for defining the needs for recovery and reconstruction following any disaster.
DaLA estimates:
1. Damage as the replacement value of totally or partially destroyed physical assets that must be included in the reconstruction program;
2. Losses in the flows of the economy that arise from the temporary absence of the damaged assets;
3. The resulting impact on post-‐disaster economic performance, with special reference to economic growth, the fiscal position and the balance of payments
5 See Handbook for Estimating the Socio-‐Economic and Environmental Effects of Disasters, United Nations Economic Commission for Latin America and the Caribbean, Santiago, 2003.

Namibia Post Disaster Needs Assessment 11
Page 11
2.2 Summary of Damage and Losses
The 2009 floods caused destruction of physical assets and decline in economic flows in Namibia. Estimates show that the value of destruction of assets is N$ 1.1 billion (US$ 136.4 million), and that the reduction in flows of the economy, arising from the flooding, amounts to a further N$ 637 million (US$ 78 million).6
Table 7: Value of Damage and Losses caused by the 2009 Floods Disaster in Namibia
Sector/ Sub-‐Sector Damage N$ (million)
Losses N$ (million)
Damage US$ (million)
Losses US$ (million)
Infrastructure 279.7 32.2 34.3 4.9 Water Supply & Sanitation 47.9 28 5.9 3.4
Transport 223.2 2.9 27.4 0.4 Energy 8.6 1.3 1.1 0.2
Productive 405.1 584.4 49.7 71.7 Agriculture 38.6 120.9 4.7 14.8
Industry 143.5 162 17.6 19.9 Commerce 209.7 289.7 25.7 35.5
Tourism 13.3 11.8 1.6 1.4 Social 416.5 19.5 51.1 2.4
Housing 385.7 13.8 47.3 1.7 Health 0.7 5.7 0.1 0.7
Education 30.1 0 3.7 0.0 Cross-‐Sectoral 10 0.9 1.2 0.1
Environment 10 0.9 1.2 0.1 Total 1,111.30 637.1 136.4 78.2
Source: Estimations by PDNA Assessment Team.
Of note is that most of the destroyed assets (72 per cent) fall within the domain of the private sector, including private individuals and enterprises, and that only a fraction (28 percent) of damage falls within the domain of the public sector. In terms of losses in economic flows, this proportion is even more pronounced: 94 percent of economic losses were sustained by the private sector, and only 6 percent in the public sector. This pattern of ownership of the effects of the floods in of special relevance, since it provides evidence of the proportion of efforts and investments that are to be made by the Government and by the private sectors to overcome the negative impact of the disaster.
6 A uniform Exchange rate of 8.15 Namibian Dollars per US Dollar has been used throughout the assessment, as the average rate of Exchange for the first half of the present year.

Namibia Post Disaster Needs Assessment 12
Page 12
Figure 9: Ownership of Disaster Damage (Left) and Disaster Losses (Right) Among Public and Private Sectors
Source: Estimates by PDNA Assessment Team
The structure of damage among sectors of economic activity in the affected areas is also of special relevance since the social sectors sustained 37.5 percent, the productive sectors sustained 36.5 percent, and infrastructure sustained 25 percent of the total damages. The structure of losses, however, is concentrated heavily in the productive sectors (92 percent), while infrastructure and social sectors account for the remaining 8 percent. This evidences the socio-‐productive nature of the disaster, rather than the typical case of disaster effects concentrated on infrastructure.
Figure 10: Distribution of Damage (left) and Losses (right) among main sectors of economic activity
Source: Estimations by PDNA Assessment Team
When breaking down the effects of the floods by individual sectors of economic activity, the damages are concentrated heavily in sectors such as housing (N$ 385.5 million, or 35 percent of the total), transport (N$ 223.2 million, or 20 percent) trade (N$ 209.7 million, or 19 percent), and manufacturing (N$ 143.5 million, or 13 percent). However, when considering the impact of the floods on losses to the economy, the decline in production is considered. In this case, losses are concentrated – in order of decreasing magnitude – in the trade sector (N$ 499.4 million, or 45 percent of total losses), manufacturing (N$ 162 million, or 25 percent), and in agriculture (N$ 120.9 million, or 19 percent).
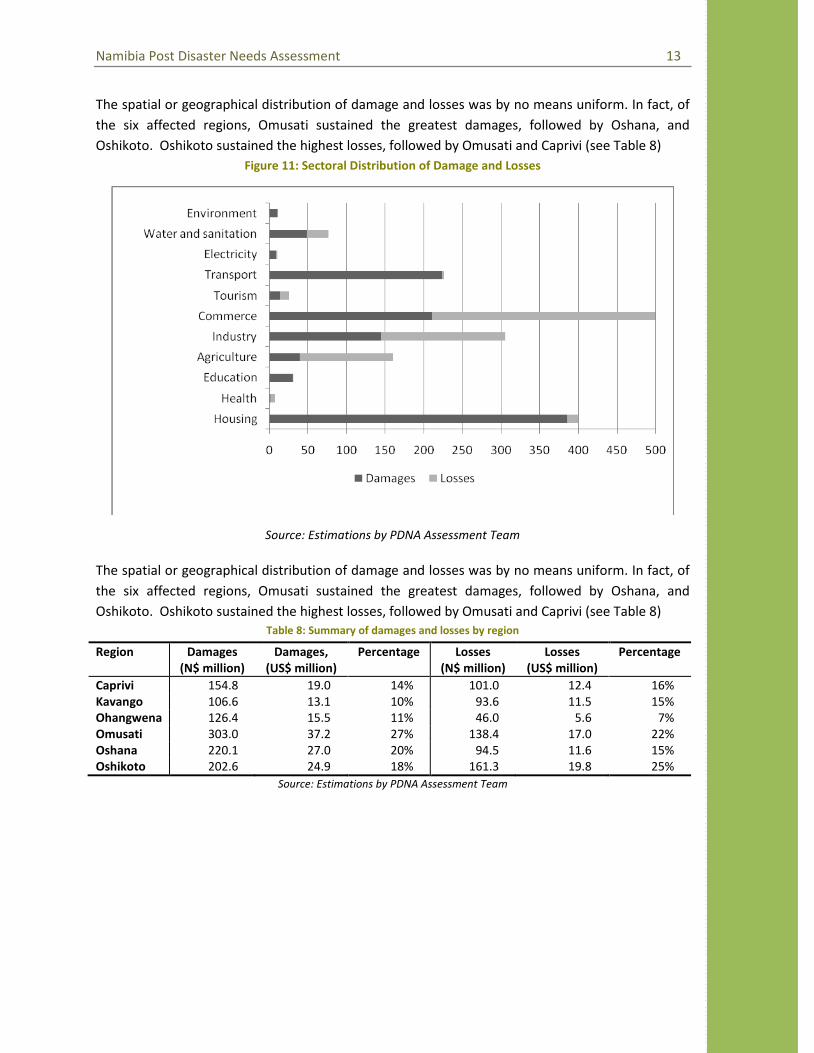
Namibia Post Disaster Needs Assessment 13
Page 13
The spatial or geographical distribution of damage and losses was by no means uniform. In fact, of the six affected regions, Omusati sustained the greatest damages, followed by Oshana, and Oshikoto. Oshikoto sustained the highest losses, followed by Omusati and Caprivi (see Table 8)
Figure 11: Sectoral Distribution of Damage and Losses
Source: Estimations by PDNA Assessment Team
The spatial or geographical distribution of damage and losses was by no means uniform. In fact, of the six affected regions, Omusati sustained the greatest damages, followed by Oshana, and Oshikoto. Oshikoto sustained the highest losses, followed by Omusati and Caprivi (see Table 8)
Table 8: Summary of damages and losses by region
Region Damages (N$ million)
Damages, (US$ million)
Percentage Losses (N$ million)
Losses (US$ million)
Percentage
Caprivi 154.8 19.0 14% 101.0 12.4 16% Kavango 106.6 13.1 10% 93.6 11.5 15% Ohangwena 126.4 15.5 11% 46.0 5.6 7% Omusati 303.0 37.2 27% 138.4 17.0 22% Oshana 220.1 27.0 20% 94.5 11.6 15% Oshikoto 202.6 24.9 18% 161.3 19.8 25%
Source: Estimations by PDNA Assessment Team

Namibia Post Disaster Needs Assessment 14
Page 14
Figure 12: Spatial Distribution of Damage caused by the 2009 Floods in Namibia
Figure 13: Spatial Distribution of Losses caused by the 2009 Floods in Namibia
Source: PDNA Assessment Team.
The average value of damage in the affected area, caused by the 2009 flood disaster, was estimated at N$ 922 per person while the average value of losses was estimated at N$ 525.9 per person. Since the spatial distribution of population is not uniform, however, per capita values of damage and losses varied from region to region. The most affected for the damage were the residents of the Omusati region and for the losses of the Caprivi region:
Table 9: Per capita damage and losses (N$/person)
Region Per Capita Damages (N$ million)
Per Capita Losses (N$ million)
Caprivi 1,778.7 1,160.1
Kavango 414.4 363.8
Ohangwena 483.6 176.0
Omusati 1,243.5 568.0
Oshana 1,246.4 535.4
Oshikoto 1,117.3 889.9
Average 922.3 525.9
Source: Estimations by PDNA Assessment Team
While these figures represent only a fraction of the average personal income of the population for the different regions, they are nevertheless a negative shock on personal wellbeing.

Namibia Post Disaster Needs Assessment 15
Page 15
Figure 14: Spatial Distribution of 2009 Disaster Damage per Capita in Namibia
Figure 15: Spatial Distribution of 2009 Disaster Losses per Capita in Namibia
Source: PDNA Assessment Team

Page 16
Section III:
Estimation of Damage and Losses by Sector
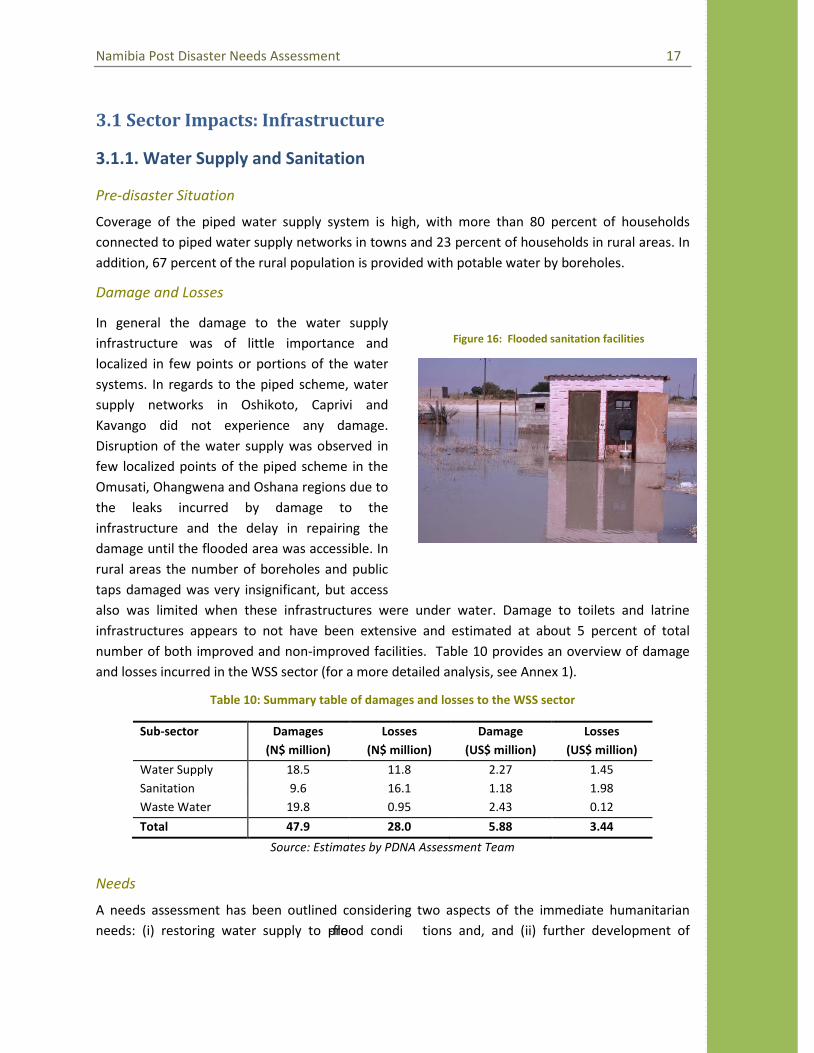
Namibia Post Disaster Needs Assessment 17
Page 17
3.1 Sector Impacts: Infrastructure
3.1.1. Water Supply and Sanitation
Pre-‐disaster Situation
Coverage of the piped water supply system is high, with more than 80 percent of households connected to piped water supply networks in towns and 23 percent of households in rural areas. In addition, 67 percent of the rural population is provided with potable water by boreholes.
Damage and Losses
In general the damage to the water supply infrastructure was of little importance and localized in few points or portions of the water systems. In regards to the piped scheme, water supply networks in Oshikoto, Caprivi and Kavango did not experience any damage. Disruption of the water supply was observed in few localized points of the piped scheme in the Omusati, Ohangwena and Oshana regions due to the leaks incurred by damage to the infrastructure and the delay in repairing the damage until the flooded area was accessible. In rural areas the number of boreholes and public taps damaged was very insignificant, but access also was limited when these infrastructures were under water. Damage to toilets and latrine infrastructures appears to not have been extensive and estimated at about 5 percent of total number of both improved and non-‐improved facilities. Table 10 provides an overview of damage and losses incurred in the WSS sector (for a more detailed analysis, see Annex 1).
Table 10: Summary table of damages and losses to the WSS sector
Sub-‐sector Damages (N$ million)
Losses (N$ million)
Damage (US$ million)
Losses (US$ million)
Water Supply 18.5 11.8 2.27 1.45 Sanitation 9.6 16.1 1.18 1.98 Waste Water 19.8 0.95 2.43 0.12
Total 47.9 28.0 5.88 3.44
Source: Estimates by PDNA Assessment Team
Needs
A needs assessment has been outlined considering two aspects of the immediate humanitarian needs: (i) restoring water supply to pre-‐flood condi tions and, and (ii) further development of
Figure 16: Flooded sanitation facilities

Namibia Post Disaster Needs Assessment 18
Page 18
services to prevent future natural disasters. A detailed analysis is provided in Annex 2, and the table below provides an estimation of needs in the WSS sector.
Table 11: Recovery Needs in the WSS sector (N$ million)
Sub Sector Rehabilitation Long Term Recovery
Water Supply 25.3 726.0 Urban 23.1 456.0 Rural 2.2 270.0
Waste Water 22.9 37.6
Total 48.2 763.6
Source: Estimates by PDNA Assessment Team
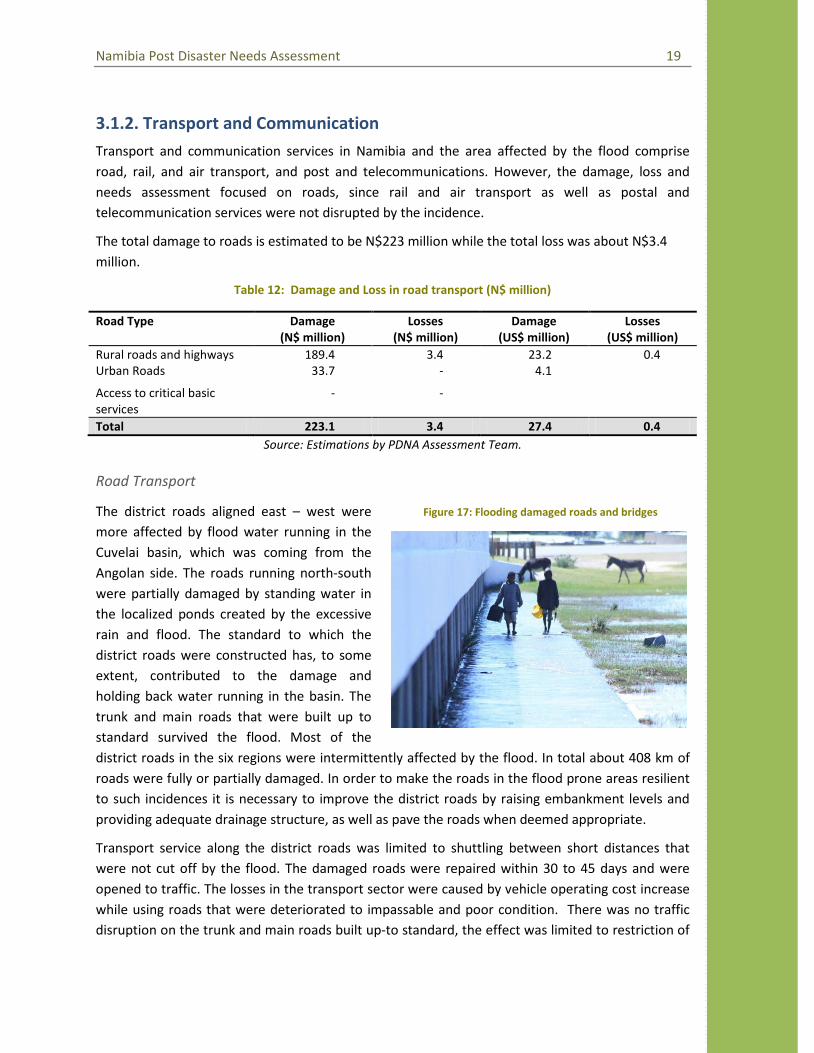
Namibia Post Disaster Needs Assessment 19
Page 19
3.1.2. Transport and Communication Transport and communication services in Namibia and the area affected by the flood comprise road, rail, and air transport, and post and telecommunications. However, the damage, loss and needs assessment focused on roads, since rail and air transport as well as postal and telecommunication services were not disrupted by the incidence.
The total damage to roads is estimated to be N$223 million while the total loss was about N$3.4 million.
Table 12: Damage and Loss in road transport (N$ million)
Road Type Damage (N$ million)
Losses (N$ million)
Damage (US$ million)
Losses (US$ million)
Rural roads and highways 189.4 3.4 23.2 0.4 Urban Roads 33.7 -‐ 4.1
Access to critical basic services
-‐ -‐
Total 223.1 3.4 27.4 0.4 Source: Estimations by PDNA Assessment Team.
Road Transport
The district roads aligned east – west were more affected by flood water running in the Cuvelai basin, which was coming from the Angolan side. The roads running north-‐south were partially damaged by standing water in the localized ponds created by the excessive rain and flood. The standard to which the district roads were constructed has, to some extent, contributed to the damage and holding back water running in the basin. The trunk and main roads that were built up to standard survived the flood. Most of the district roads in the six regions were intermittently affected by the flood. In total about 408 km of roads were fully or partially damaged. In order to make the roads in the flood prone areas resilient to such incidences it is necessary to improve the district roads by raising embankment levels and providing adequate drainage structure, as well as pave the roads when deemed appropriate.
Transport service along the district roads was limited to shuttling between short distances that were not cut off by the flood. The damaged roads were repaired within 30 to 45 days and were opened to traffic. The losses in the transport sector were caused by vehicle operating cost increase while using roads that were deteriorated to impassable and poor condition. There was no traffic disruption on the trunk and main roads built up-‐to standard, the effect was limited to restriction of
Figure 17: Flooding damaged roads and bridges
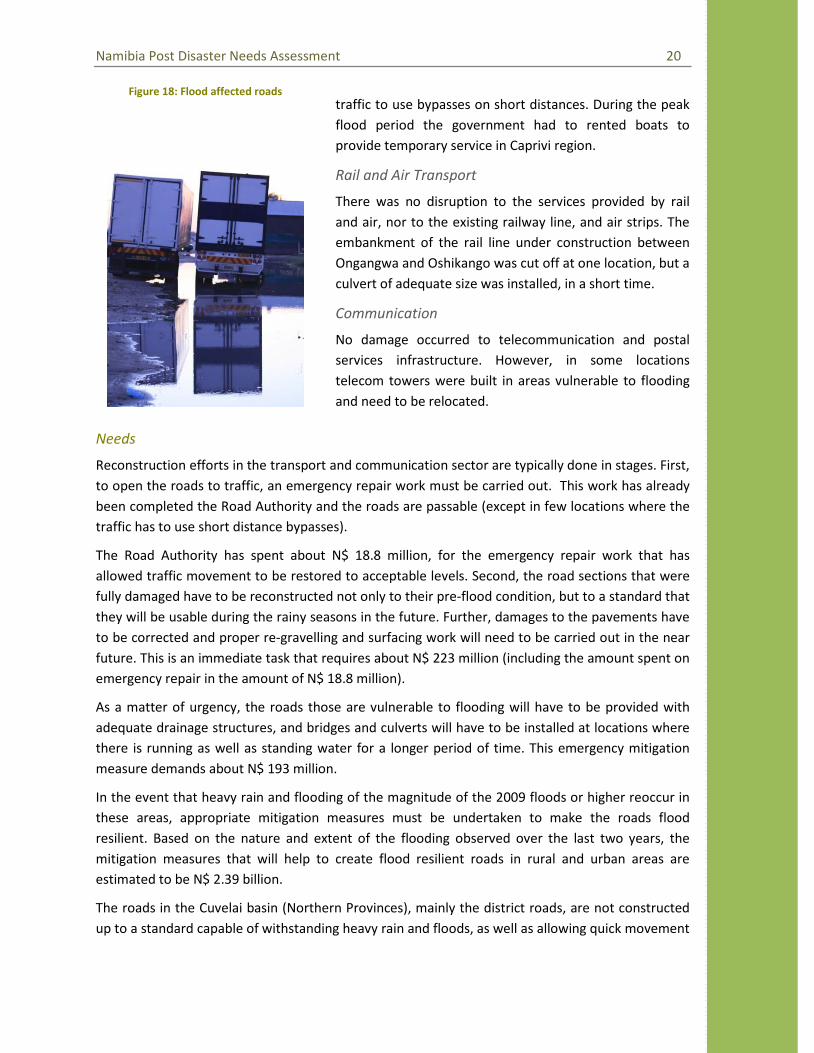
Namibia Post Disaster Needs Assessment 20
Page 20
traffic to use bypasses on short distances. During the peak flood period the government had to rented boats to provide temporary service in Caprivi region.
Rail and Air Transport
There was no disruption to the services provided by rail and air, nor to the existing railway line, and air strips. The embankment of the rail line under construction between Ongangwa and Oshikango was cut off at one location, but a culvert of adequate size was installed, in a short time.
Communication
No damage occurred to telecommunication and postal services infrastructure. However, in some locations telecom towers were built in areas vulnerable to flooding and need to be relocated.
Needs
Reconstruction efforts in the transport and communication sector are typically done in stages. First, to open the roads to traffic, an emergency repair work must be carried out. This work has already been completed the Road Authority and the roads are passable (except in few locations where the traffic has to use short distance bypasses).
The Road Authority has spent about N$ 18.8 million, for the emergency repair work that has allowed traffic movement to be restored to acceptable levels. Second, the road sections that were fully damaged have to be reconstructed not only to their pre-‐flood condition, but to a standard that they will be usable during the rainy seasons in the future. Further, damages to the pavements have to be corrected and proper re-‐gravelling and surfacing work will need to be carried out in the near future. This is an immediate task that requires about N$ 223 million (including the amount spent on emergency repair in the amount of N$ 18.8 million).
As a matter of urgency, the roads those are vulnerable to flooding will have to be provided with adequate drainage structures, and bridges and culverts will have to be installed at locations where there is running as well as standing water for a longer period of time. This emergency mitigation measure demands about N$ 193 million.
In the event that heavy rain and flooding of the magnitude of the 2009 floods or higher reoccur in these areas, appropriate mitigation measures must be undertaken to make the roads flood resilient. Based on the nature and extent of the flooding observed over the last two years, the mitigation measures that will help to create flood resilient roads in rural and urban areas are estimated to be N$ 2.39 billion.
The roads in the Cuvelai basin (Northern Provinces), mainly the district roads, are not constructed up to a standard capable of withstanding heavy rain and floods, as well as allowing quick movement
Figure 18: Flood affected roads

Namibia Post Disaster Needs Assessment 21
Page 21
of excess water. Improving standards of the main and district roads vulnerable to flooding and heavy rain storms (1,139 km of gravel roads) in the six regions is estimated to cost about N$1.575 billion. In addition, 600 km of roads that connect schools and clinics, and that are located far from all weather roads are proposed for construction is estimated to be N$ 680 million. Finally, roads that would improve storm water management in urban areas would require some improvement at N$ 136 million.
Table 13: Transport Sector Needs (N$ million)
Activity Value (N$ million)
Value (US$ million)
Urgent Reconstruction (short term) Rehabilitation of road 223 27.4 Urgent construction of bridges and culverts 193 23.7
Improving standards (long term) 0.0 Upgrading of critical roads 1,575.0 193.3 Access to critical services and villages 680.0 83.4 Improve storm water management in Oshakati and Ondangwa 136 16.7
Source: Estimations by PDNA Assessment Team

Namibia Post Disaster Needs Assessment 22
Page 22
3.1.3. Energy In the Northern regions, the damage to electricity infrastructure was not extensive compared to that normally sustained during floods, cyclones and other natural disasters. It is important to note however that it is highly probable that the lifespan of certain equipment may have been shortened by the effects of the flood. It is extremely likely that the insulation of certain equipment has been damaged to a limited extent and that this damage will result in early failure. It is thus necessary to make provision for the replacement of such equipment within a shorter period than normal. In the rural areas, the utility could not relate cost of damages to specific locations due to the lack of an effective MIS. The table below outlines the damage and losses incurred in the energy sector.
Table 14: Damage and Losses incurred in the energy sector
Energy company Damage (N$ million)
Losses (N$ million)
Damage (US$ million)
Losses (US$ million)
NORED/OPE 8.7 1.3 1.1 0.2 Source: Estimations by PDNA Assessment Team
The generation and transmission infrastructure of Nampower did not suffer any damage as a result of the disaster. Damages were limited to distribution infrastructure. The North Regional Electricity Distributor (NORED) and the Oshikati Premier Electric (OPE) were the only utilities to suffer damages as a result of the floods and storms which occurred in 2009. In the Caprivi and Kavango regions, almost no damage to electrical equipment occurred as a result of flooding due to the reticulation network being overhead. Lightning strikes were the main cause of failure of small transformers and destruction of wooden poles. The utility could not provide specific data on location of lightning strikes.
Losses are the revenue lost by the distribution utilities as a result of the disaster. In the Northern regions, sales of electricity rebounded extremely rapidly and in most areas March 2009 sales compared favourably with the average of the previous 12 months. This was due to the restoration of supply to most areas in a short period of time. In the North Eastern regions, fewer customers were disconnected and all have been reconnected with the exception of Mabusha Clinic and Sarasunga Lodge in Kavango and Mukusi River Lodge in Caprivi which were still without electricity at the time of the assessment.
Needs
The main areas of need with respect to mitigation of risk against further flood damage are the towns of Ondangwa and Oshikati. These are the areas with underground systems and a programme needs to be implemented to raise the mounting levels of equipment as a matter of urgency. There needs, however, to be a general revision of standards but this applies to the whole area under the jurisdiction of NORED and OPE.
A general study needs to be undertaken to examine measures which can be implemented to limit damage by lightning strikes related to conditions caused by the long MV line lengths throughout the Northern Namibian region.

Namibia Post Disaster Needs Assessment 23
Page 23
OPE and NORED commenced reconstruction of the network as soon as it was possible to gain access to the affected areas. Both OPE and NORED were able to make use of existing stocks of equipment. Temporary supply cables were connected to restore supply to customers in Ondangwa. The permanent network is currently being reconstructed.
Connections to rural customers in Omusati, Ohangwena, Oshana and Oshikoto and clinics and lodges in Kavango and Caprivi were restored once the premises were accessible. However, there is a possibility that the lodges may re-‐locate due to extensive flood damage and potential risk of future flooding.
Reconstruction costs have been financed by the utilities themselves. While the reconstruction process in this sector is almost complete, attention needs to be paid to developing programs to mitigate risk of possible damage by similar natural occurrences.
Figure 19: Flooding in a local village, Omusati

Namibia Post Disaster Needs Assessment 24
Page 24
3.2. Sector Impacts: Productive Sectors
3.2.1. Agriculture, Livestock and Fisheries
Pre-‐Disaster
Early crop production indications for the 2008/09 farming season for both the North-‐Eastern (Kavango and Caprivi) and north central (Oshana, Ohangwena, Oshikoti, and Omusati) farming regions of Namibia were promising due to steady, early rains in October and November. The country’s aggregate coarse grain production (white maize, pearl millet, wheat and sorghum) was provisionally forecasted at 165,129 tons, which would represent an increase in output of 56 percent, compared to 2007/08 harvest. However, severe flooding occurred in March and April 2009, affecting a total of 94,804 hectares. Flood levels were reached that had not been witnessed since 1969. In the north-‐central regions, the flat, natural topography combined with undersized drainage infrastructure further exacerbated the situation.
Damage and Losses
The 2009 floods impacted Namibia’s agricultural sector in a variety of complex and interrelated ways, aggravating the already dire situation as a result of flooding in 2008, and infestation of armyworms. The floods occurred in March and April, thus affecting crop production, due to flooding of crop lands immediately before the harvest. Livestock was affected by loss of livestock and livestock products, and damage to infrastructure. Forest plantations and orchards were also flooded, as a result of which trees and production were lost. The flooding has made traditional fishing places inaccessible and caused damage and losses to commercial and traditional fish ponds. In total, at least 350,000 people were affected by the flooding.
Total damages and losses are summarized in Table 15. Total damages to the agricultural sector are estimated at N$ 29.1million, and losses are estimated at N$ 127.5million. The northeast regions are most severely affected, with a reduction of 77 percent of the planted area as a result of the floods.
Figure 20: Flooding of Agricultural Lands

Namibia Post Disaster Needs Assessment 25
Page 25
Table 15: Estimates of Damage and Losses in the Agricultural Sector
Sector Damage (N$ million)
Losses (N$ million)
Damage (US$ million)
Losses (US$ million)
Field Crops 4.6 101.2 0.6 12.4 Livestock 8.9 17.0 1.1 2.1 Forestry 3.7 3.2 0.5 0.4 Fish Farms 11.9 6.1 1.5 0.7
Total 29.1 127.5 3.6 15.6
Source: PDNA Team estimates
Needs
The recovery framework for the agricultural sector can be divided into an early recovery phase, during which the food security needs of the affected population must be addressed, a medium term recovery phase during which the needs of the farmers to replant and ultimate harvest during the 2009/2010 season must be addressed, and finally a long term recovery phase which should address the recommendations made in the Risk Management Issues section of this report.
The floods washed away the stocks of sorghum and pearl millet (mahangu) stored from the previous harvest and from the 2009 harvest, and the remaining stocks at the household level are not expected to last beyond September. The losses of mahangu stocks have reduced the food availability and affect vulnerable households in both urban and rural areas. Furthermore, the situation can be expected to worsen around August and September, at which point, even those famers who managed to reap a small harvest will have exhausted their food stocks. External assistance will be required for approximately one third of the population in the flood-‐affected areas. The food needs arising from losses are estimated to be over N$ 47 million.
In terms of medium-‐term recovery actions to enable farmers to successfully harvest in the 2009/2010 season, significant government interventions are needed. The main harvest next year may be affected due to the reduction in seed availability, as it is likely that the most vulnerable households might consume the part of the production usually reserved as seed for the following year. At the same time, the household annual budget to purchase seeds might be used to obtain food commodities. Furthermore, since the Seed Co-‐operative crops were severely damaged by the flood, it will necessary to import seed. Without external assistance, long term reduction in household food availability is forecasted in the area. The total cropland area affected by the flooding was over 90,000 ha. Required inputs will be seed, fertilizer, and ploughing assistance.
Figure 21: Livestock
Figure 22: Crops are critical to the survival of rural

Namibia Post Disaster Needs Assessment 26
Page 26
Irrigation. The north central and North-‐Eastern regions are affected by drought as well as floods. In terms of long-‐term recovery, therefore, multi-‐use flood protection and irrigation schemes are recommended to reduce the regions’ vulnerability to disasters. The benefits of irrigation for drought control are obvious. As for flood control, if crops can be planted earlier, they stand a better chance of providing at least some yield should flooding occur. Given that the north central regions are
characterized by small-‐scale subsistence farming, a single regional irrigation scheme would not be appropriate, and small-‐scale irrigation schemes should instead be investigated at the village or homestead levels. In order to effectively implement such a multi-‐use scheme on a regional scale, however, changes in the farming patterns from small-‐scale individuals to larger cooperatives may be necessary.
In order to estimate the cost of putting all 10,000 hectares under irrigation, a unit cost of US$ 5,000 per ha was used. This unit cost was developed in an earlier study conducted by the World Bank for all of Africa (see Annex 4 for details).
Diversification. The main crop intensification program introduced by the Ministry of Agriculture in the region has been fruit trees, which have served both as a food source as well as a supplementary source of income to farmers. In the north central regions, donkeys have been progressively introduced due to their known resistance to floods, as they can continue to graze in flooded areas.
Table 16: Summary of Needs for Agriculture, Livestock and Fisheries
Needs/Timeline Value (N$ million)
Value (US$ million)
Early Recovery Needs 106.0 13.0 Temporary food needs, including grains, meat, etc 43.7 5.4 Provision of seeds, and other inputs 33.0 4.0 Assistance to land preparation 28.3 3.5
Long term disaster risk mitigation 400.0 49.1 Small-‐scale reservoirs for irrigation and downstream flood protection in 10,000 hectares
400.0 49.1
Source: Estimations by PDNA Assessment Team
residents

Namibia Post Disaster Needs Assessment 27
Page 27
3.2.2. Industry and Commerce Industry and commerce in the six regions affected by the flood in 2009 are dominated by small and medium enterprises and industries (SMEs). About 78 percent of industrial and commercial operations were affected by the disaster; most of them are located in flood prone areas. Businesses across industry and commerce were equally affected by the disaster: 44 percent of operations suffered damage to their business premises, while 31 percent suffered damage to equipment, and 18 percent suffered damage to their stock.
About 53 percent of business stopped their operations at some time or other due to the disaster, and 82 percent of businesses indicated that their output has been reduced due to the disaster, with an average monthly output decline of 14 percent. During the same period, the average number of employees per enterprise has declined from 9 to about 8, representing a decline of 11 percent. Raw materials became scarce or unavailable and deliveries to customers were delayed, both as an effect of the disaster to the supply infrastructure in general.
Most affected businesses were fish processing and Hotel and Restaurant. The fish industry was severely affected because fish ponds were flooded and all the fish escaped. Hotels and lodges, on the other hand, especially in the Okavango and Caprivi Regions are situated near the river in order to provide a good view for guests, as a result when the rivers were flooded these hotels were the first to be affected.
In value terms, the overall damages and losses sustained by the Industry sector are estimated at respectively N$ 142.4 million and N$ 161.9million. For commerce, the damages and losses are estimated at N$ 207.6 million and N$ 297.3 million.
Table 17: Estimates of Industry and commerce Damage and Losses
Source: Estimates by PDNA Assessment Team
Needs
Many businesses indicated that they are struggling to repay their loans and to meet other obligations. In addition, a number of businesses indicated that stocks had been lost because of the flooding, which further damaged their positions. These businesses could be helped by way of soft
Figure 23: Flooded commercial establishments
Sector Damage (N$ million)
Losses (N$ million)
Damage (US$ million)
Losses (US$ million)
Industry 142.4 161.9 17.5 19.9 Commerce 207.6 297.3 25.5 36.5 Total 350.0 459.2 42.9 56.3

Namibia Post Disaster Needs Assessment 28
Page 28
loans; soft loans are typically preferred to grants because they force the business to promote higher productivity in order to return the borrowed money. Where possible, government could simply act as guarantor for the business to access loans in the financial markets for immediate assistance where collateral is lacking.
There is also need to establish a fund, which could provide either grants or soft loans, for the reconstruction of businesses that suffered damage to premises and equipment. The exact amount of the fund should be based on an assessment of the actual damage to premises and equipment to each beneficiary. Where necessary, expert guidance should be provided to supervise the reconstructions or repair.
Business located in areas that are completely damaged, where the infrastructure will take time to rebuild or where the damage in the area is too big to repair, should be relocated immediately. A business relocation fund can be set up with criteria and procedures on how it should be used.
Following clear meteorological studies, areas prone to flooding should be identified and businesses in those areas should be relocated. Of course business activities follow where people reside. This means that people residing in flood prone areas will need to be resettled. No one should be allowed to build in areas designated as flood-‐prone. Funding for this exercise need to be determined and obtained.
Given the frequent floods and droughts over the last few years, it is important that government sets up contingency plans in case flooding recurs. A reserve fund can be set by levying businesses or by any other method. The fund should be allowed to grow and be used when disaster occurs. Other contingency plans should include how to respond during the very time of the disaster. Many businesses indicated that the government response to the floods was delayed. This preparedness may require training of key staff to handle various aspects of a disaster, in addition to the availability of funds. Government should enforce the development of flood contingency plans by all key ministries, including the Ministry of Trade and Industry, as well as regional councils.
Table 18: Summary of Industry and Commerce Needs
Needs/ Timeline Value (N$ million)
Value (US$ million)
Early Recovery 80.0 9.8
Soft credit lines for SMEs to restart production
80.0 9.8
Possible temporary tax relief to SMEs
Medium to Long Term Recovery 250.0 30.7
Financing to rebuild premises and replace equipment and machinery
250.0 30.7
Source: Estimations by PDNA Assessment Team

Namibia Post Disaster Needs Assessment 29
Page 29
3.2.3. Tourism The 2009 floods also had an adverse effect on tourism in the country. Structural damage to tourist facilities was relatively infrequent and most of the costs of damage involved numerous small jobs such as cleaning floors, re-‐painting, replacing doors, clearing drains, replanting grass and gardens.
On the other hand, damaged roads, power, access to clean water, sanitation facilities and telecommunications hampered several tourist facilities from functioning normally; of around 45 private operations in the affected areas, 24 were assessed to have been impacted, of which 18 were lodges, 3 small lodges and 3 campsites. Although many businesses managed to avoid the worst, some in Oshikoto, Kavango and Caprivi are still struggling to recover. The value of damage and losses to the tourism sector are summarized below.
Table 19: Summary of Damage and Losses in the Tourism Sector
Item Damage (N$ million)
Losses (N$ million)
Damage (US$ million)
Losses (US$ million)
Tourist lodges/ camps 13.3 11.8 1.6 1.4 Source: Estimations by PDNA Assessment Team
Needs
As shown in the table below, the needs for tourism sector are estimated to be N$ 25 million to cover promotion activities as well as to build better drainage systems around the affected lodges and the national park.
Table 20: Summary of Tourism Needs
Recovery Phase/Activity Value (N$ million)
Value (US$ million)
Early Recovery 10.0 1.2
Promotion campaigns abroad to attract tourists 10.0 1.2
Medium to Long Term Needs 15.0 1.8
Private sector reconstruction of lodges and Etosha Park 15.0 1.8
Source: Estimations by PDNA Assessment Team
Figure 24: Flooding near tourism lodges

Namibia Post Disaster Needs Assessment 30
Page 30
3.3. Sector Impacts: Social Sectors
3.3.1. Housing
Pre-‐disaster Situation
Three main types of housing were observed in the six affected regions: (i) traditional houses (wooden structure, thatch roofing and sand or mud brick walls), (ii) modern (solid) housing (bricks, cement blocks and steel reinforced structure and informal (transitional) housing (made of corrugated iron sheets or any other cheap material). None of depicted types of housing has been prepared for floods or even for moderate inundations, and it is rare to find a house that is built over the ground level, despite being located in flood prone areas. Even new modern (solid) houses are built at the ground level or in low risky areas prone to flooding.
Damage and Losses
The estimated number of households that were partially or fully damaged by the flood is around 58,000 or 39 percent of total households.
Informal housing was severely damaged as its structure is mainly built with untreated wood. In some areas water has not yet subsided. Modern (solid) housing was not structurally damaged, and after the water levels fell, it was possible to use them again after cleaning up. However, damages could be observed in floors that were destroyed and in internal and external wall plastering that were in contact with contaminated water for long periods of time. In addition, small add-‐on constructions like latrines, sewages, and other exterior facilities without a similar structure to the house were severely damaged.
In the Kavango region, both traditional and informal houses were totally destroyed as long as they were built in the low laying areas along the river. These houses were exposed to the river high and strong rising. The traditional structures of these houses were totally damaged as they stayed under water for long time, thus the materials cannot be used again for the same construction purposes.
In rural areas, housing suffered in a different way according to their construction characteristics. In the Caprivi region, the houses in rural areas were considered completely destroyed because they were made out of mud, sticks, and poles that, according to the people, cannot be reused. The damages to houses in the urban area of Katima were minimal compared to those in the rural areas.
Figure 25: Flooding of houses built of corrugated iron

Namibia Post Disaster Needs Assessment 31
Page 31
Table 21: Total estimate of affected households in the whole regions
Region Affected Population Affected Households Damaged Households
Caprivi 23,000 5,000 3,750 Kavango 7,976 1,246 1,246 Omusati 228,842 38,140 19,070 Oshana 161,916 26,986 13,493 Onhangwena 133,703 22,284 11,142 Oshikoto 117,818 19,636 9,818 Total 974,236 113,292 64,922
In monetary terms, the value of damages to households (traditional houses, modern housing and informal housing) was estimated at N$ 385.7 million and the value of losses (relocation camps) at N$ 13.8 million.
Needs
A preliminary assessment of needs includes interventions to provide the following:
Temporary Shelter Scheme. There is a need to establish semi-‐permanent relocation camps for highly vulnerability areas, and to provide the structures for easy and rapid installation of water and sanitation facilities, electricity, shelter and cooking facilities. Permanent fences, gates and security facilities should be considered. Basic community centres might be included as a permanent facility that uses the premises during non-‐emergency times.
Provision of construction materials for poor. There is a need to distribute reconstruction/repair materials and construction tools to those who have stayed in place and are in dire need of shelter. Direct subsidies (cash), training, building materials, or let market instruments (such as insurance), should be the main means of assistance to the affected people. In the case of distribution of construction materials (typically cement, rope, shovels, and wheel barrows), the distribution process would need to be done with regional authorities and communities to correctly identify the most affected households. Considering the high amount of the affected households in Namibia, it will be necessary to identify if this assistance should be given at the relocation camps, at the early resettlement level, or when they have already returned to their communities.
Private sector reconstruction using resilient standards. There is a need to use better quality and new flood proof materials, such as cement plastering and cement blocks, or soil-‐cement bricks that allow water to pass through the building without causing significant damage. It is also recommended to elevate bases (for the house), elevate shelves (to store valuables) and false roofs capable of storing food, seeds and even people during prolonged floods. Physical barricades could
Figure 26: Houses damaged by flooding

Namibia Post Disaster Needs Assessment 32
Page 32
be built around the housing structure (e.g. earth plinths, bamboo or other strong plants), although this will only work for relatively weak flooding.
Relocation. In some cases where houses are located in a highly exposed floodplain, housing relocation to safer (higher) grounds may be the only solution. By far, the preferred solution is for the homeowner to move voluntarily to a higher location close by, as identified by the participatory flood risk mapping. In this case, it is crucial to user markers as references of past floods, to remind community members that such floods may come back and that resettlement in high risk areas is to be discouraged at all costs.
Table 22: Summary of Housing Sector Needs
Activity/Timeline Value
(N$ million) Value
(US$ million)
Early Recovery 13.8 1.7 Temporary shelter scheme 13.8 1.7 Medium Term Recovery & Reconstruction 257.9 31.6
Private sector reconstruction 177.9 21.8
Provision of construction materials for poor 80.0 9.8 Long Term Reconstruction 539.5 66.2 Private sector reconstruction with disaster-‐resilient standards 539.5 66.2
Source: Estimations by PDNA Assessment Team
Figure 27: Residents of a relocation camp

Namibia Post Disaster Needs Assessment 33
Page 33
3.3.2. Health
Damage and Losses
The floods did not cause severe structural damage to health facilities in the affected regions. Less than five percent of the public health facilities have been partially damaged. Partially damaged facilities were recorded only in two of the six affected regions namely Oshikoto and Oshana regions. A private ward and Paediatric ward in Onandjokwe Hospital in Oshikoto Region, and Pharmacy in Oshakati Hospital in Oshana Region were damaged and sewerage pipes totally destroyed. About three health facilities were submerged and temporarily relocated.
Disruptions to basic and essential needs and services did not result in disease outbreaks. However, access to health services is particularly disrupted for the rural poor because of damaged infrastructure, where many facilities were accessible only by donkey carts or foot. Some health facilities were completely surrounded by water and could only be accessed by boat or air. Even in the rural areas, however, the incidence of malaria did not spike in the post-‐disaster period, although higher incidences in diarrheal diseases (and a relative surge in water
purification sachets/tablets) were noted and an increased number of severely malnourished children were admitted to the hospitals.
Table 23: Damage and Loss Estimates by Type of Health Facility
Item Public Private Total
Damage 500,000 150,000 650,000
District/Intermediate Hospitals 500,000 150,000 650,000
Health Centres -‐ -‐ -‐
Clinics -‐ -‐ -‐
Losses 4,194,503 1,500,000 5,694,503
Additional medical care 1,891,345 -‐ 1,891,345
Preventive programs 714,058 -‐ 714,058
Temporary facilities 1,589,100 1,500,000 3,089,100
Source: Estimations by PDNA Assessment Team
Figure 28: Flooding caused disrupted access to many health facilities

Namibia Post Disaster Needs Assessment 34
Page 34
In value terms, the damages to health facilities are estimated to be around N$0.65 million attributed to the damage to a private sector ward and to partial damage to the base of a pharmacy of one intermediate hospital. The losses are around N$8.5 million including the cost of additional medical care, preventive program and supply side response (malaria and water purification) and reduction in patients visiting the private ward.
Needs
The recovery strategy for the health sector aims to address infrastructural and technical assistance aspects of rebuilding the health system. This involves rebuilding and repairing the damaged facilities and monitor and control the morbidity levels.
Table 24: Health Sector Recovery Needs
Activity Value (N$ million)
Value (US$ million)
Repairs to hospitals 0.7 0.1
Monitoring and control of morbidity levels 5.7 0.7
Total 6.4 0.8
Source: Estimations by PDNA Assessment Team

Namibia Post Disaster Needs Assessment 35
Page 35
3.3.3. Education The floods in 2009 have had a severe impact on the education sector in Namibia. They have affected 328 schools and around 94,000 learners across the six regions.
In Caprivi, a total of 8 schools have suffered physical damages. In Ohangwena and Oshana, one school in each of the regions suffered physical damages. The highest damage reported was for Omusati where four hostel blocks were flooded and need replacement. No physical damage to school was identified in Kavango and Oshikoto. The categories of major physical damage across primary, secondary and combined schools were construction, sewerage and furniture.
Access to schools was disrupted in all regions affected, because flooded roads prevented access to schools. Thus under loss, three categories emerged: food savings, demolition costs and loss in school revenues. The regional offices saved money as they did not provided food to learners during the time but they lose money because learners did not pay fees. The value of damage and losses are given below.
Table 25: Summary of Damage and Losses in the Education Sector
Sector Damage (N$ million)
Losses (N$ million)
Damage (US$ million)
Losses (US$ million)
Education sector 29.8 3.6 3.7 0.5 Source: Estimations by PDNA Assessment Team
For more detail on the education sector, see Annex 9.
Needs
The education sector disaster recovery strategy aims to address infrastructural, technical assistance and training aspects of rebuilding the education system. This involves rebuilding and repairing the damaged facilities to improve resilience to natural disasters in the future.
The safest solution is to place the school infrastructure, especially toilets, above the maximum expected flood level. Ideally, the buildings should be relocated onto a safer ground, particularly to a site with good drainage, natural erosion deterrents (e.g. trees and ground cover), and clear evacuation roads. If relocation into safer ground is not possible, it may still be possible to elevate the site and/or base of the building above the expected flood level with earthen fill. The building’s lowest level should rest above the floodwater, either by resting the building on a concrete platform,
Figure 29: Makeshift classrooms after the flooding

Namibia Post Disaster Needs Assessment 36
Page 36
or building it on stilts. Where there is access to piped water, pit latrines should be replaced with flush toilets. Since road access was a major impediment to school attendance, there is also a need to build all weather roads to access social infrastructure.
The estimated reconstruction needs to build back public primary, secondary and combined schools to pre-‐flood conditions are N$ 29.8 million. Total infrastructure recovery needs are N$ 113 million, of which N$ 56 million is the cost of rebuilding improved school facilities which are more resilient to floods and N$ 57 million is for improving road access to rural schools. Table 26 shows the projected costs for each of these scenarios. Early recovery, in this case, refers to repairs to school buildings, acquisition of furniture and materials. In the medium to long term, however, the reconstruction needs will vary depending on whether reconstruction will replace facilities as is, or whether reconstruction will take into account principles of build back better.
Table 26: Education Sector Recovery and Reconstruction Needs
Phase of Recovery Estimated Needs (N$ million)
Estimated Needs (US$ million)
Early Recovery 5.0 0.61
Medium to Long Term Recovery 15.0 1.84
Reconstruction of schools with disaster-‐resilient standards
56.0 6.87
Construction of adequate road access to schools 57.0 6.99
Source: Estimations by PDNA Assessment Team

Namibia Post Disaster Needs Assessment 37
Page 37
3.4. Cross Cutting Issues
3.4.1 Environment Due to low population and development pressure, the natural environment of Namibia remains generally in good health. It has an important and well-‐recognized role in the economy, and the extensive protected areas system alone is estimated to contribute 3-‐6 percent of GDP, mainly through tourism.
In the areas impacted by the flooding, the floodplains of the northeast remain in a largely natural condition, although subject to some human modification, and their natural assets were therefore little affected by the flooding. The Oshanas of the North Central region, however, have been extensively degraded by increasing human and livestock populations, and are highly vulnerable to further land degradation and soil erosion. Even in this area, however, the gradual nature of the flooding resulted in very little direct impact on natural resources, and the greater issue is the potential for exacerbated resource depletion due to the additional demand created by reconstruction activities.
The environmental damages and losses enumerated here were therefore confined to (i) some modest impacts on protected areas infrastructure with consequent losses of gate revenues and exception
wildlife management costs, and (ii) small additional waste disposal costs associated with the clean-‐up of limited amounts of debris created in the Oshanas.
Table 27: Summary of Damage and Losses in the Environment Sector
Subsector/ Component
Damage (N$ million)
Losses (N$ million)
Damage (US$ million)
Losses (US$ million)
Oshikoto Etosha NP 3.0 0.27 0.4 0.03 Oshana Waste management 0.0 0.50 0.0 0.06 Kavango Mahangu WR 5.0 0.15 0.6 0.02 Caprivi Mamili NP 2.0 0 0.2 0.00 Buffalo feeding 0.0 0.12 0.0 0.01 Total 10.0 1.04 1.2 0.13
Figure 30: Arial view of flooding

Namibia Post Disaster Needs Assessment 38
Page 38
Source: Estimations by DaLA Assessment Team.
In terms of the impact on environmental resources themselves, the flooding is probably beneficial on balance, and the greater threat to the stressed environment of the Oshanas remains from drought and desertification. In the broader environmental narrative, the real issue is adaptation of the local populations to the ongoing environmental processes to which they are subject. This includes planning and impact assessment for floodplain development activities, and ensuring proper application of environmental engineering, particularly drainage standards. These issues are covered in more detail under the general discussion of river basin and flood management in the DRM section of the report, and in the sectors affected by sub-‐standard environmental engineering, particularly transport.
Needs The needs of the environment sector are modest, and include the requirement to upgrade protected area roads and some waste disposal facilities to a suitably engineered landfill, resistant to future flooding (especially the waste disposal facility of Oshakati). The need to ensure appropriate use and sourcing of reconstruction materials is covered under the housing sector.
Table 28: Environment sector needs.
Activity/ Timeline Value (N$ million)
Value (US$ million)
Early Recovery 1.7 0.2
Waste and wildlife management activities 1.7 0.2
Medium to Long Term Reconstruction 17.5 2.1
Reconstruction of roads and parks 17.5 2.1
Source: Estimations by DaLA Assessment Team

Page 39
Section IV: Economic and Social Impact

Namibia Post Disaster Needs Assessment 40
Page 40
4.1. Macro-Economic Impact
This section outlines the conclusions of the impact of the flood disaster on the overall economy, namely on the main domestic and external macroeconomic aggregates. Since the Namibian economy is diversified, and the wealth of the nation is concentrated in the non-‐flooded area, the flood had only a minor impact on the overall macroeconomic aggregates. However the affected area accounts for more than 60 percent of the total Namibian population. Thus, the flood disaster has affected household living conditions and it has affected more the people than the assets. As such, a recovery strategy should consider redistribution aspects.
4.1.1. The Namibian Economy Pre-‐Disaster Namibia is among the strongest performing African countries, with a GDP per capita of US$3,300 in 2006. The Namibian economy has registered a strong economic growth in recent year by an average growth of 7.3 percent during 2004-‐2006. The main source of growth has been the booming mining sector, but also tertiary industries, including producers of government services, wholesale, retails and repairs, real estate and business services, which account for 59 percent of growth between 2000 and 2007.
Figure 31: Share of GDP by sector, 2008
Agri & f ishing8%
Trade10%Other
15%
Construction4%
Transp & comm5%
Real estate7%
Social14%
Public adm & defense
8%
Manuf. & mining29%
Source: Namibian Bureau of Statistics, National Accounts, 2008
However, the economy is highly dependent on primary industry, namely the diamond industry, and, as such, remains vulnerable to exogenous shocks, including global financial crises. Since 2007, economic growth has slowed (4.1 percent in 2007 and 2.4 percent in 2008). Estimates for the 2009

Namibia Post Disaster Needs Assessment 41
Page 41
economic growth rate was recently revised downward by 1.1 percent in March 20097
The most developed mining, fishing and meat processing industries are located in the Kara and Hardap regions, which are located in the South and in the Centre of Namibia, relatively far from the recent floods that affected primarily the North. The economy in the affected area is a subsistence economy, although tourism accounts for some wealth. Overall, however, there is some unequal distribution of wealth at the regional level in Namibia.
, taking into account the early impact of the global crisis. Primary industry is expected to decline by 13.3 percent, and tertiary industry is expected to grow only at 2.6 percent in 2009.
The fiscal situation has remained strong over the past years. In 2008, Namibia’s revenues were the highest to date, reaching 33 percent of GDP in 2008. With expenditures at 28.3 percent of GDP, Namibia’s economy enjoyed a budget surplus of 4.7 percent of GDP. Receipts from the Southern African Customs Union (SACU) revenues (40 percent of total revenue) remain the highest contributors to government revenue. Mineral revenue was 6 percent of total revenue in 2008. However, trade liberalization in SACU countries, as well as the proposed SADC customs union that is to come into effect in 2010, the expected tax revenues from international trade is expected to decrease in the coming years. Government revenue patterns are expected to follow GDP growth, and tax revenues are likely to fall to only 31 percent of GDP in 2009/2010. At the same time, government expenditure may rise, leading to a slight budget deficit by 0.8 percent GDP in 2009.
As far as the Namibian debt is concerned, the level of domestic debt reached 25 percent of GDP in 2008, while external debt is not that high (at around 8 percent of GDP). The fiscal deficit is expected to be financed from the domestic market, which is still in a good shape despite the financial crisis.
The Namibian’s external position has been strong during the recent years. Namibia is among the top ten countries registering the highest current account surpluses in the middle income countries (18 percent of GDP in 2007), leading to a strengthening of its net foreign asset position (22 percent of GDP in 2006) and increasing its public and private savings. However the Namibian economy is most affected by the global crisis, while current account balance started to decline and went down to 8 percent of GDP in 2008, and even worsen as a result of the global crisis, the Current Account Balance was expected to be at 3 percent of GDP in 2009, while export would expect to decline by 30 percent in value terms as the diamond prices and external demand declined.
4.1.2. Macro economic Impact of Floods
Impact on economic growth
This sector considered only the current flood disaster impact on the 2009 GDP and economic growth, without taking into consideration of the economic losses that may occur in the years ahead or the possibility of economic growth due to the construction activities. This section doesn’t include the probable impact of the different reconstruction scenarios, which would require a further estimation of the current year, but also for the next two or three years.
7 Macroeconomic and Fiscal Framework, March 2009.

Namibia Post Disaster Needs Assessment 42
Page 42
For the first time in many decades, the Namibian economy is expected to register a close to zero growth, as a result of its high vulnerability to exogenous shocks that include impacts from the global crisis and the floods that gravely affected the six north regions of Namibia. The flood mostly affected four productive sectors which accounted for 35 percent of GDP in 2008: agriculture and livestock (many crops were destroyed especially millet, maize and sorghum), industry (fishing and meat), commerce and the tourism sector. The total value of the damages in these four sectors amounts to N$ 405 million, which, together with housing (N$ 386 million), make up almost the entire value of damages (N$ 791 million). Losses were concentrated primarily in the productive sectors; the estimated value of losses was N$ 584 million (close to the entire value of losses of N$ 600 million).
Table 29: Summary of Damage and Losses and the Value Added Losses (N$ million)
Sector & Sub-‐Sector
Damage Losses Value added Losses
Share of GDP per sector
Value Ownership
Value Ownership
Public Private Public Private
Infrastructure 279.7 270.1 9.6 32.3 30.2 2.0 -‐ 7.2
Transport 223.2 223.2 -‐ 2.9 1.0 1.9 5.3
Electricity 8.6 8.6 1.3 1.3 1.9
Water and sanitation 47.9 38.3 9.6 28.0 27.9 0.1 Productive 405.1 -‐ 405.1 584.4 -‐ 584.4 386.3 35.7
Agriculture 38.6 38.6 120.9 120.9 96.7 4.3
Industry 143.5 143.5 162.0 162.0 75.0 16.4
Commerce 209.7 209.7 289.7 289.7 209.1 11.0
Tourism 13.3 13.3 11.8 11.8 5.5 4 Social 416.5 30.1 385.7 19.5 0.0 13.8 -‐ 21.8
Housing 385.7 385.7 13.8 13.8 8.3 Health 0.7 5.7 3.9 Education 30.1 30.1 0.0 0.0 9.6
Cross-‐Sectoral 10.0 10.0 0.0 0.9 0.9 0.0 -‐ -‐
Environment 10.0 10.0 0.0 0.9 0.9 0.0
Total 1,111.3 310.2 800.4 637.1 31.2 600.3 386.3 73.7
Source: Estimations by PDNA Assessment Team
As a consequence, while GDP was expected to grow at 1.1 percent before the disaster, the real 2009 GDP growth is likely to be revised downward to 0.5 percent to account for the early impacts of the financial crisis and the flood on the economy.

Namibia Post Disaster Needs Assessment 43
Page 43
Table 30: Impact of the flood disaster on economic growth
Item Value (N$ million)
Value (US$ million)
GDP nominal 2009 before disaster 68,978 8,464 GDP nominal 2008 66,280 8,133 GDP nominal 2009 after disaster 68,592 8,416 Share of total production loss/GDP 2009 (%) 0.6 0.6 Real GDP 2009 50,484 6,194 Real GDP 2009 after disaster 50,202 6,160 Real GDP 2008 49,949 6,129 GDP growth before disaster (%) 1.1 1.1
GDP 2009 growth after disaster (%) 0.5 0.5
Source: Estimations by PDNA Assessment Team
Impact on the Balance of Payment
For statistical reasons, the assessment was measured only at the current account level. The 2009 current account forecast is based on recent exports and imports data from the preliminary national accounts of 2008, recently released by the National Planning Commission.
Impact on export
Manufacturing export accounts for more than half of the total Namibian exports, while ores and mineral, especially the diamond have accounted for 33 percent of total Namibian export in 2008, followed by fishing and meat processing and other manufacture products. However, as mentioned previously, the main sources of export for the Namibian economy is not produced in the six affected area located in the North of Namibia.
The flood did not significantly impact Namibian exports, since the damages on fishing and meat industry are mostly locally tradable or for the household subsistence. The decline in export was rather attributed to lowering of the international price and demand on diamond, and other manufactures products. Total export of goods remains at 38 percent of GDP before and after the flood disaster in 2009.
Impact on Imports
Reconstruction needs would have increased the government of Namibian import bill in 2009 and in the following years. In addition to emergency food imports, these new imports are caused by the reparation of housing and damaged schools and roads, the reconstruction of new schools, needs in seed, machinery and equipment import for the damaged infrastructures for trade and manufacture premises, electricity, water and sanitation. As a result, the import would rise by 0.3 percent of GDP, while accounting for 43.9 percent of GDP prior to the disaster; it would be set at 44.1 percent of GDP after disaster.
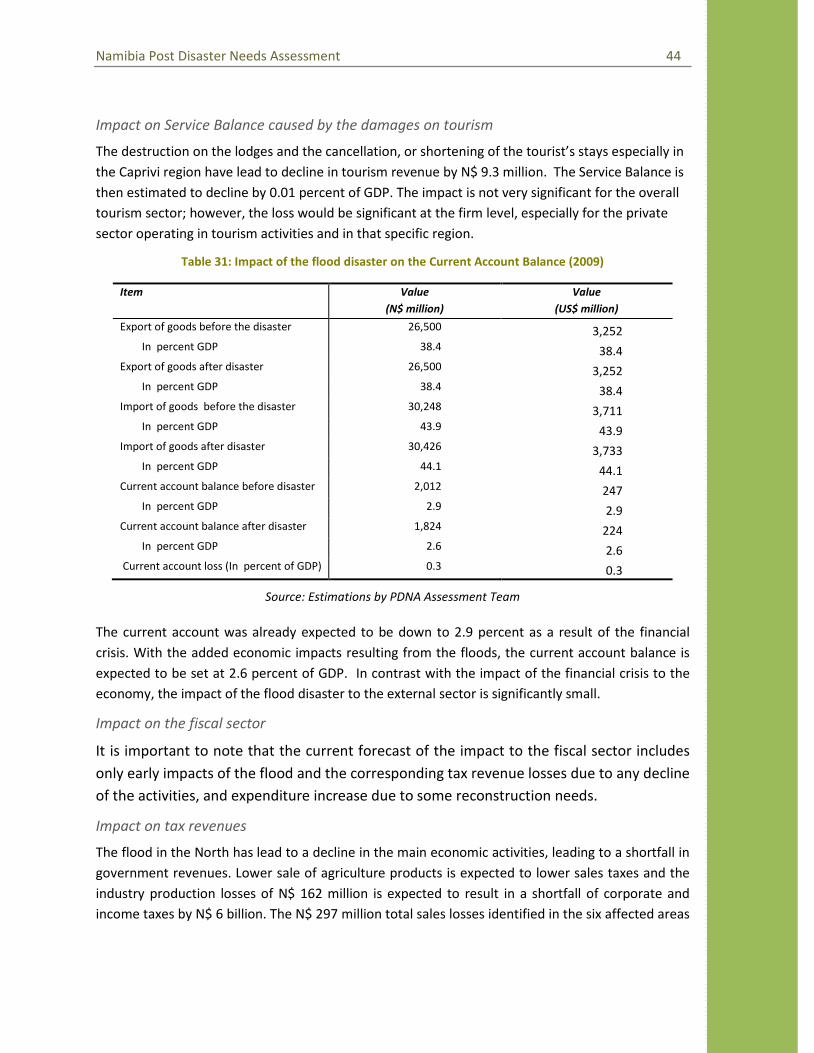
Namibia Post Disaster Needs Assessment 44
Page 44
Impact on Service Balance caused by the damages on tourism
The destruction on the lodges and the cancellation, or shortening of the tourist’s stays especially in the Caprivi region have lead to decline in tourism revenue by N$ 9.3 million. The Service Balance is then estimated to decline by 0.01 percent of GDP. The impact is not very significant for the overall tourism sector; however, the loss would be significant at the firm level, especially for the private sector operating in tourism activities and in that specific region.
Table 31: Impact of the flood disaster on the Current Account Balance (2009)
Item Value (N$ million)
Value (US$ million)
Export of goods before the disaster 26,500 3,252 In percent GDP 38.4 38.4
Export of goods after disaster 26,500 3,252 In percent GDP 38.4 38.4
Import of goods before the disaster 30,248 3,711 In percent GDP 43.9 43.9
Import of goods after disaster 30,426 3,733 In percent GDP 44.1 44.1
Current account balance before disaster 2,012 247 In percent GDP 2.9 2.9
Current account balance after disaster 1,824 224 In percent GDP 2.6 2.6
Current account loss (In percent of GDP) 0.3 0.3
Source: Estimations by PDNA Assessment Team
The current account was already expected to be down to 2.9 percent as a result of the financial crisis. With the added economic impacts resulting from the floods, the current account balance is expected to be set at 2.6 percent of GDP. In contrast with the impact of the financial crisis to the economy, the impact of the flood disaster to the external sector is significantly small.
Impact on the fiscal sector
It is important to note that the current forecast of the impact to the fiscal sector includes only early impacts of the flood and the corresponding tax revenue losses due to any decline of the activities, and expenditure increase due to some reconstruction needs.
Impact on tax revenues
The flood in the North has lead to a decline in the main economic activities, leading to a shortfall in government revenues. Lower sale of agriculture products is expected to lower sales taxes and the industry production losses of N$ 162 million is expected to result in a shortfall of corporate and income taxes by N$ 6 billion. The N$ 297 million total sales losses identified in the six affected areas
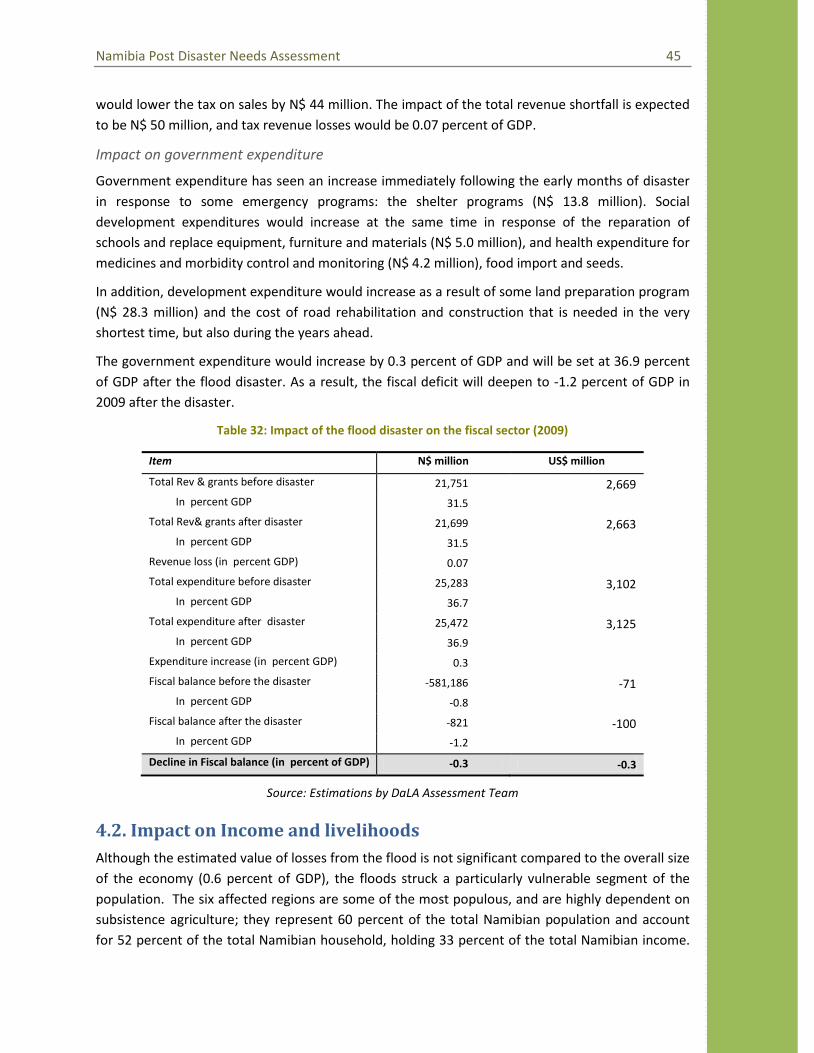
Namibia Post Disaster Needs Assessment 45
Page 45
would lower the tax on sales by N$ 44 million. The impact of the total revenue shortfall is expected to be N$ 50 million, and tax revenue losses would be 0.07 percent of GDP.
Impact on government expenditure
Government expenditure has seen an increase immediately following the early months of disaster in response to some emergency programs: the shelter programs (N$ 13.8 million). Social development expenditures would increase at the same time in response of the reparation of schools and replace equipment, furniture and materials (N$ 5.0 million), and health expenditure for medicines and morbidity control and monitoring (N$ 4.2 million), food import and seeds.
In addition, development expenditure would increase as a result of some land preparation program (N$ 28.3 million) and the cost of road rehabilitation and construction that is needed in the very shortest time, but also during the years ahead.
The government expenditure would increase by 0.3 percent of GDP and will be set at 36.9 percent of GDP after the flood disaster. As a result, the fiscal deficit will deepen to -‐1.2 percent of GDP in 2009 after the disaster.
Table 32: Impact of the flood disaster on the fiscal sector (2009)
Item N$ million US$ million
Total Rev & grants before disaster 21,751 2,669 In percent GDP 31.5
Total Rev& grants after disaster 21,699 2,663 In percent GDP 31.5
Revenue loss (in percent GDP) 0.07 Total expenditure before disaster 25,283 3,102
In percent GDP 36.7 Total expenditure after disaster 25,472 3,125
In percent GDP 36.9 Expenditure increase (in percent GDP) 0.3 Fiscal balance before the disaster -‐581,186 -‐71
In percent GDP -‐0.8 Fiscal balance after the disaster -‐821 -‐100
In percent GDP -‐1.2 Decline in Fiscal balance (in percent of GDP) -‐0.3 -‐0.3
Source: Estimations by DaLA Assessment Team
4.2. Impact on Income and livelihoods
Although the estimated value of losses from the flood is not significant compared to the overall size of the economy (0.6 percent of GDP), the floods struck a particularly vulnerable segment of the population. The six affected regions are some of the most populous, and are highly dependent on subsistence agriculture; they represent 60 percent of the total Namibian population and account for 52 percent of the total Namibian household, holding 33 percent of the total Namibian income.

Namibia Post Disaster Needs Assessment 46
Page 46
The six regions have 38 percent of the total Namibian labour force but account for 70 percent of the poor in Namibia. This contrast reflects an unequal wealth repartition in Namibia, witnessed by the fact that sources of growth are concentrated in the mining and industrial areas, while most affected household rely on subsistence agriculture for survival.
The household wealth of the affected area is worse than the Namibian average: at the exception of Oshana region, the average household income in the 6 areas is about the half of the average Namibian household, reflecting an unequal wealth distribution in the affected area and the rest of the Namibia region.
Table 33: Household Income, poverty and labour force in the six affected area
Region
HH Pop. Avg HH size
Total income Avg HH income
Income per
capita
Adjusted per capita income
Poverty share
Labour force share
% % percent N$ mill. % N$ N$ N$ %
Caprivi 5 4.7 4.6 471 2.9 25,304 5,447 6,411 5.2 3 Kavango 8.7 11.4 6.4 771 4.8 23,829 3,697 4,427 17.8 11 Ohangwena 10.2 12.9 6.3 841 5.2 22,207 3,551 4,304 16.5 4 Omusati 10.6 12.3 5.7 1035 6.4 26,369 4,591 5,466 11.9 4 Oshana 8.5 9.3 5.4 1454 9 45,704 8,529 9,963 6.1 9 Oshikoto 8.6 9.4 5.4 854 5.3 26,788 4,945 5,895 12.7 6
Affected Area 51.6 60 33.8 5426 33.6 70.2 38
Namibia 100 100 4.9 16176 100 43,521 8,839 10,358 100.0 100
Urban 40.5 34.7 4.2 10028 62 66,620 15,810 17,898 17.7 57 Rural 59.5 65.3 5.4 6147 38 27,798 5,141 6,139 82.3 42
Source: Namibian Household Income and Expenditure Survey, 2004, A Review of Poverty and Inequality in Namibia, 2004 and the Namibian Labour Survey, 2006
Given the lack of comprehensive data for household income, including the average salary, estimates of per capita income reduction are based on the estimated average income and the per capita losses at the regional level. It appears that the flood has affected the household income in the regions to different degrees. The per capita loss was the highest in the Caprivi region, followed by the Oshana and Ohangwena areas (where the poverty rate is at the highest). The income per capita losses was the highest in the Ohangwena and in the Caprivi region (more than 12 percent), while it appears to be significantly less for the Oshikoto region (1 percent).
Table 34: Damages and Losses and Income per capita loss after the flood in the six regions
Region Average Income, Per capita loss Post-‐Flood income Income reduction
N$/p (2008 value) N$/p N$/p %
Caprivi 7,442 920 6,522 12.4 Kavango 5,051 338 4,713 6.7 Ohangwena 4,851 623 4,228 12.85 Omusati 6,272 400 5,872 6.4 Oshana 11,653 708 10,945 6.1
Oshikoto 6,756 113 6,643 1.7
Source: Estimations by PDNA Assessment Team

Namibia Post Disaster Needs Assessment 47
Page 47
Income represents the households’ assets as well as on wage and non-‐wage incomes, and can include crop productions and livestock, or any type of capital that the household could own. On average, the household in Caprivi and Ohangwena are estimated to have lost 12 percent of their average wealth in four months. Table 34 presents the effects of the flood by region, level and household perspective. The impact per capita is highest in the Caprivi region, and lowest in the Ohangwena region, where the level of the income per capita is among the lowest compared to the average Namibian level. However for the Oshana region the per capita loss to income is not significant, despite the high value of damages and higher per capita income. The loss in per capita income is typically higher when the area is already poor, meaning that poor households are more vulnerable to the impacts of the flood, and their living conditions can deteriorate very quickly compared to the richer households.
4.3. Impact on Food Security
The households that are experiencing acute transitorily food insecurity are mostly headed by subsistence farmers that have lost their mahangu stocks, and have experienced average estimated losses of 80 percent. These are mostly single female-‐headed households, with low crop production, low expenditure per capita, and low livestock ownership in their communities. These vulnerable populations are experiencing transitory acute food insecurity as a direct effect of the floods.
Flooding has also affected wider populations, both rural and urban. The 2009 floods washed away stocks of sorghum and mahangu stored from the previous and 2009 harvests. These losses have directly affected the rural populations that rely on mahangu harvests for subsistence, and indirectly affected urban populations, who rely on mahangu transfers from relatives in rural areas. Future harvests are also expected to be affected, since flooding has resulted in reduced seed available.
Disruptions to road networks affected the provision of school lunch programs, which may have a long term negative effect on school children. Many of the most vulnerable households were still reeling from the shocks of the 2008 floods, and from the aftermath of several consecutive years of droughts. These households have had to adjust their coping strategies to include limiting food intake, reducing dietary diversity, migrating, borrowing cash, and purchasing food staples from the open market. For a detailed analysis of food security, see Annex 11.
4.4. Impact on Gender, HIV/AIDS, Governance and Protection
Vulnerable groups and governance systems have also been impacted by the flood disaster.
Gender
Figure 32: Food at the local market
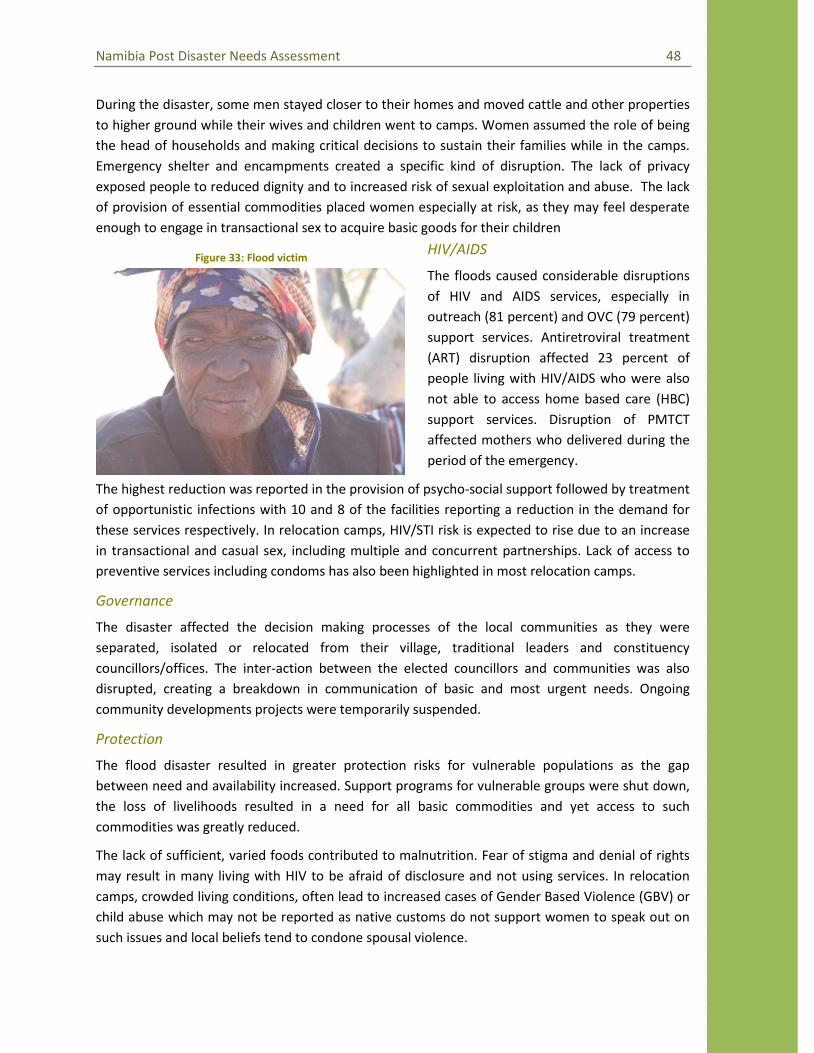
Namibia Post Disaster Needs Assessment 48
Page 48
During the disaster, some men stayed closer to their homes and moved cattle and other properties to higher ground while their wives and children went to camps. Women assumed the role of being the head of households and making critical decisions to sustain their families while in the camps. Emergency shelter and encampments created a specific kind of disruption. The lack of privacy exposed people to reduced dignity and to increased risk of sexual exploitation and abuse. The lack of provision of essential commodities placed women especially at risk, as they may feel desperate enough to engage in transactional sex to acquire basic goods for their children
HIV/AIDS
The floods caused considerable disruptions of HIV and AIDS services, especially in outreach (81 percent) and OVC (79 percent) support services. Antiretroviral treatment (ART) disruption affected 23 percent of people living with HIV/AIDS who were also not able to access home based care (HBC) support services. Disruption of PMTCT affected mothers who delivered during the period of the emergency.
The highest reduction was reported in the provision of psycho-‐social support followed by treatment of opportunistic infections with 10 and 8 of the facilities reporting a reduction in the demand for these services respectively. In relocation camps, HIV/STI risk is expected to rise due to an increase in transactional and casual sex, including multiple and concurrent partnerships. Lack of access to preventive services including condoms has also been highlighted in most relocation camps.
Governance
The disaster affected the decision making processes of the local communities as they were separated, isolated or relocated from their village, traditional leaders and constituency councillors/offices. The inter-‐action between the elected councillors and communities was also disrupted, creating a breakdown in communication of basic and most urgent needs. Ongoing community developments projects were temporarily suspended.
Protection
The flood disaster resulted in greater protection risks for vulnerable populations as the gap between need and availability increased. Support programs for vulnerable groups were shut down, the loss of livelihoods resulted in a need for all basic commodities and yet access to such commodities was greatly reduced.
The lack of sufficient, varied foods contributed to malnutrition. Fear of stigma and denial of rights may result in many living with HIV to be afraid of disclosure and not using services. In relocation camps, crowded living conditions, often lead to increased cases of Gender Based Violence (GBV) or child abuse which may not be reported as native customs do not support women to speak out on such issues and local beliefs tend to condone spousal violence.
Figure 33: Flood victim

Namibia Post Disaster Needs Assessment 49
Page 49

Page 50
Section V:
Early Recovery Requirements

Namibia Post Disaster Needs Assessment 51
Page 51
5.1 Introduction
The most likely scenario envisaged for the flood-‐affected areas is that flood waters will continue to recede throughout the affected areas. Families and communities will continue to return to areas previously flooded where they will find:
1. Homes that need to be repaired and reconstructed; household assets that have been washed away or destroyed;
2. Public services (health and education in particular) that are still in need of restoration to normal capacity;
3. Roads that have been severely damaged and may remain impassable for vehicles for some months to come;
4. Livelihoods that have been completely destroyed.
In Caprivi 25,000 people remain relocated in camps, in Kavango the number has dropped to 2,800 displace. Reportedly people would return by August, 2009. Before that, Government will continue to distribute food to people returning to affected areas and remaining people in relocation camps through its own food distribution scheme. In the coming months it is expected that vulnerable families will continue facing humanitarian needs due to poor access to basic services, a lack of sufficient income-‐generation activities to finance daily needs and reconstruction of their livelihoods.
5.2 Early recovery strategic objectives, principles and values
Early recovery is a multidimensional process guided by development principles that begins in a humanitarian setting, and seeks to build on humanitarian programmes and catalyze sustainable development opportunities8
Early recovery programmes are foundational in nature and involve early protection, stabilization and rehabilitation measures needed to generate quick stabilization of household and community welfare in the aftermath of the flood disaster while building capacity to up-‐scale key pilot Early recovery (ER) interventions and to strengthen longer-‐term development programmes and reforms.
. It is the start of recovery (phase 1) and constitutes the bridge between humanitarian interventions and longer-‐term development (phase 2 and 3, see next section VI).
Augment ongoing emergency assistance operations by building on humanitarian programmes
As the focus moves to recovery operations, some relief efforts will still have to be maintained. Early recovery (ER) aims at addressing these on-‐going needs and gaps in the delivery of relief assistance and at revitalizing the capacity of communities to recover from disasters. However, emergency operations targeting of these residual relief needs should be scaled down in tandem with the scale of implementing the ER activities, be targeted at the most vulnerable and be shaped so as to hasten
8Guidance note on Early Recovery Cluster Working Group on early Recovery in cooperation with the UNDO-‐ECHA Working Group on Transition. April 2008.

Namibia Post Disaster Needs Assessment 52
Page 52
socio-‐economic recovery of affected communities. Consequently, residual relief would no longer adopt blanket coverage but recipient targeting would be adjusted to focus more and more on only those not engaged in ER activities, so as to ensure progressive graduation from relief towards recovery. Early recovery should help move beyond and reduce dependencies on relief assistance by augmenting on-‐going emergency assistance operations through measures that foster the self-‐reliance of the affected population and meet the most critical needs to rebuild livelihoods.
Humanitarian needs as identified by the PDNA resulted in a revised Flash Appeal Revision by the United Nations. It should be noted that the Revised Flash Appeal addresses only those areas where there is a critical need identified, especially as indicated by the PDNA; where the Government is unable to respond appropriately or timely to this need; and where the United Nations is best placed to respond. The projects were developed carefully, based on the results of the PDNA undertaken, and with proper reference to what may or may not have been already funded through the original Flash Appeal or through other sources.
Support spontaneous recovery initiatives by affected communities
Communities began taking actions to minimize the impacts of the flood disaster and to lay the basis for recovering from it immediately during and immediately after the event. Although they expected government assistance, they were not waiting for that support before initiating actions to ameliorate the situation. For example, some of those displaced in camps in Oshana, Ohangwena, Oshikoto and Omusati already began voluntary return to their domiciles even at the time of the PDNA without waiting for government assistance to do so. Programmed ER actions need to support such spontaneous self-‐help recovery initiatives.
Prepare for future hazard events
A key rational for ER is to reduce exposure to and impacts of future hazards, whether they occur as independent events or as cascading fallouts from the current hazard which is the target of attention. At the time of the PDNA field visit the floods had subsided In the North Central regions and many families had returned to their homesteads. But in eastern Caprivi the flooding was still continuing and as at the end of June new floods were being experienced in the western part of the region from the Kwando river9. The risk of future flooding in the areas affected in 2008 and 2009 is real. Consequently, the United Nations Revision of the 2009 Flash Appeal included a request for funding for DRR “in light of the imminence of the next flooding season starting in November 2009”10
Lay the foundations for long-‐term recovery
. Given the likelihood of future flooding it is essential that ER interventions involve working with communities to prepare for future inundation, working immediately to reduce the risk and preparing together for possible future relocation and other flood mitigating actions.
Being an arid country, Namibia is predominantly prone to weather-‐induced hazards, mainly drought, wildfire, windstorms. Flood, although relatively more infrequent than these other hazards,
9 Namibia Floods, Operations Update no. 4, International Federation of Red Cross and Red Crescent Societies, 25 June 2009 10 United Nations, Namibia Revision 2009 Flash Appeal, July 2009

Namibia Post Disaster Needs Assessment 53
Page 53
often result in population displacement, economic disruption as transport, communication, livestock, crops and other physical and environmental assets are destroyed, resulting in significant economic costs. In these circumstances, developing a resilient Namibia is a progressive development undertaking which requires reconstructing the natural and built environment, livelihoods and socio-‐economic systems of affected communities to standards higher than those pre-‐disaster levels so as to reduce exposure to and impact of prospective hazards. Transitions from disaster to development create windows of opportunity for such transformation in which the role of ER is fundamental. ER is transformational because it involves early protection, stabilization and rehabilitation measures to generate quick stabilization of household and community welfare in the aftermath of disasters while building capacity to up-‐scale pilot ER interventions and to strengthen longer-‐term development programmes and reforms. To be effective, ER should aim to support national, regional and local capacities, strategies and policies required to promote sustainable solutions in long-‐term recovery and reconstruction by providing guidance for utilizing long-‐term development plans and priorities in the affected regions as the take-‐off point for building back differently.
Figure 34: Flood Victim

Namibia Post Disaster Needs Assessment 54
Page 54
Adherence to the above principles would ensure achievement of three core values of recovery:
Addressing vulnerability at the core of all programming
Building resilience and reducing vulnerability underpin the whole package of early recovery recommendations. All PDNA sectors teams have prioritised the most vulnerable of the affected
Box: 1: Early Recovery: Guiding principles
The early recovery programme will be multi-‐dimensional and multi-‐sectoral in order to address multiple hazards but will be temporally specific, targeted at people and communities affected by the flood. It is guided by the following principles that have been adopted by the United Nations system and international development partners, who support disaster recovery, rehabilitation and reconstruction processes:
a. Achieve national ownership of the early recovery process through the fullest possible engagement of national and local authorities in the planning, execution, and monitoring of recovery actions.
b. Promote local and national capacities by ensuring that external technical assistance complements rather that replaces existing capacities and is seen by national actors as supportive rather than directive.
c. Use and promote participatory practices to identify needs, empower communities and create foundations of sustained participation.
d. Build constructive working relationships between civil society organisations and nascent government institutions.
e. Influence how humanitarian and early recovery assistance is provided to ensure that interventions do no harm and take account of longer term development considerations.
f. Maximize synergies amongst different actors through efficient coordination of stakeholders in the early recovery process.
g. Include risk reduction and conflict prevention measures in the early recovery process by ensuring that key decisions are based on risk assessment. Assessments of hazard, vulnerability, and capacity will inform efforts to reduce risks.
h. Ground early recovery interventions on a thorough understanding of the context in which they take place, including in terms of conflict dynamics that may be unintentionally be reinforced by such interventions.
i. Ensure integration of gender and other cross cutting issues such as environment, protection and HIV/AIDs in assessment planning and implementation through the use of appropriate expertise and tool.
j. Promote gender equality by assessing particular needs and vulnerabilities in gender analysis. Women’s roles in transition and development are profoundly affected by how far early recovery efforts include them and their needs assessment, planning and programming.
k. Conduct effective assessments of needs and capacity to determine objectives and priorities for early recovery
l. Monitor, evaluate and learn through appropriate participatory techniques and mechanisms that allow timely identification of corrective measures, and capture the experiences and voices of the target population
m. Build on and /or reorient ongoing development initiatives to ensure that they contribute to building resilience and capacities of affected communities. As a minimum, review on-‐going initiatives to ensure that they do not contribute to the further accumulation of vulnerability.

Namibia Post Disaster Needs Assessment 55
Page 55
communities and work needed to build the resilience of communities and local authorities, support recovery, reduce risk and prepare for future disasters.
Building Back Differently
Early Recovery recommendations across all sectors are formulated with a view to capitalising on early opportunities to build better services and infrastructure than existed before the flood, reduce inherent vulnerability and promote diversity. Building back differently should not just be applied to infrastructure but needs to be interpreted in the broadest sense to ensure that the social and economic fabric of the flood-‐affected areas is rebuilt stronger and better.
Disaster-‐Resilient Programming
The programmatic interventions recommended are also designed to be resilient to future shocks, especially the onset of next season’s flooding in November. For example, it is recommended that government invests in supporting communities to construct more flood-‐resistant housing. Also, the recommendations of the education sector cover a range of initiatives (policy, institutions and programmes) to make education activities more resilient to disaster.
5.3. Sector early recovery actions
Effective early recovery can require implementation of a wide range of activities. Information from the PDNA helped identify a range of immediate, quick impact early recovery activities that address time-‐critical needs, require limited implementation time-‐span while at the same time are foundational in nature and provide the basis for the sustainable recovery of affected populations. In addition, for reasons of correspondence to national and local development priorities, resource constraints and capacity limitations, it was necessary to identify priority activities. These sector priorities are presented, along with their projected costs, in Table 35.
Building Resilience and Addressing Vulnerability
Core underlying principles of the PDNA are recommendations to build the resilience of communities and address vulnerabilities wherever they might be. These principles are articulated in the assessment in terms of Protection, Gender Equality and Governance. Whilst these issues are cross-‐cutting, with key inter-‐connections with all sectors, there are also some specific recommendations that have to be addressed separately, all of them targeting specific aspects of resilience and vulnerability.
Food, Agriculture and Income: Protection and Diversification
The flooding has caused substantial disruption to livelihoods, especially for subsistence farmers. The recommendations for government in early recovery are to provide immediate employment opportunities, restore basic conditions for farmers and to promote diversification. With this in mind, interventions are recommended in cash-‐for-‐work programmes, provision of agricultural inputs/technology, increased use of micro-‐finance and vocational training. At all times the most vulnerable will be prioritised for support.

Namibia Post Disaster Needs Assessment 56
Page 56
Access to Basic Services: Education
The goal of education interventions should be to re-‐establish educational services in the flood-‐affected areas to a standard equal to or better than existed before the disaster. Guided by existing Namibian national policies and standards the response should be multi-‐pronged and articulated around the following priorities: urgent rebuilding and repair of damaged facilities and development of risk reduction strategies for affected schools to improve resilience to natural disasters, provision of special services to affected learners and teachers, as well as training and technical assistance in disaster preparedness, response and management.
Access to Basic Services: Health
There are a number of core activities for the health sector in early recovery, with a focus on restoring access to essential health services and preparing for future disaster. These include urgent identification of nutrition needs, enhancing capacity for nutrition-‐intervention, early detection and containment of disease outbreaks through strengthening the surveillance system and capacity in preparedness and response. There is much-‐needed training of life-‐saving skills across communities as well as in disease surveillance, emergency preparedness and response training/planning across all regions affected. Elements of infrastructure investment that are needed now to both support returning communities and prepare for next flooding, including transport, and communications.
Protecting the Environment
Although damage to the environment has been relatively minor there are three areas that the PDNA has highlighted that need addressing: (i) the additional management and protection of wildlife in protected areas, conservancies and natural habitats (Oshanas and Rivers); (ii) the environmentally-‐sound clean up of all relocation camps that have been used or are still in use; and (iii) conducting of an Environmental Impact Assessment (EIA) prior to undertaking major recovery and development projects in the six affected areas.
Housing, Shelter & Settlements
The most pressing need for the housing, shelter and settlement sector is the urgent support of construction of homes for those families who have returned or are returning now. There is a need for rapid support to home construction, particularly for vulnerable groups. Beyond this the PDNA recommends social housing construction for the most vulnerable in affected communities, much-‐needed research into affordable and sustainable constructions including those ones that are more resilient, the development and implementation of a stronger housing policy as well as strengthening the capacity within the housing sector.
Water, Sanitation & Hygiene
Early recovery recommendations focus on rehabilitating the smaller and most critical infrastructure across the six affected regions, including water-‐supply points, open canals and drainage structures. There is also an urgent need to bring actors together to better understand Disaster Risk Reduction measures within the sector and to plan for future emergencies.

Namibia Post Disaster Needs Assessment 57
Page 57
Addressing HIV/AIDS
Given that the six flood-‐affected regions share characteristics that increase vulnerability and reduce resilience of people living with and affected by HIV, it is recommended that government develop specific early recovery interventions to greatly strengthen civil society activities in affected communities, to increase the capacity of the regional aid coordinators and thus deepen their impact, and finally to improve HIV/Aids response in emergency settings.
Disaster Risk Reduction
The ER agenda makes an explicit and synergistic link between ER and disaster risk reduction in several ways. Both DRR and ER aim to strengthen the resilience of communities at risk to natural hazard induced crises in a complementary manner: the DRR programme will help reduce hazard exposure and vulnerability to disaster risks while the ER programme helps restore the capacity of communities and institutions to recover from those crises, to build back livelihoods and assets better, and to prevent relapses. The ER Framework recognizes that the success of the ER programme depends on the effectiveness of risk identification, forecasting and early warning systems and on strengthening links between early warning and response, all of which actions lie in the domain of DRR. Also, emphasizing community-‐level involvement in disaster management will facilitate effective local-‐level recovery. Operationally, the ER activities programme will be established on the platform of the DRR institutional structure at the local level – the regional administrative structure. Using this operational platform will, in turn, promote strengthened DRR planning and implementation.
There are definite early-‐recovery needs for DRR to ensure that authorities at national, regional and local levels, as well as communities, work together to reduce disaster risk now, and are better prepared for future events. There is a need to formalise DRR legislation and to strengthen the basic disaster management institutions. There is an urgent need to better understand the present and future risks. Disaster response and preparedness needs to be strengthened now. Finally, there is a need to bring communities into disaster risk management, paying particular attention to the part of women.
Early recovery planning and coordination
Government should embark on a detailed early recovery programme in response to the flooding and based on these sector recommendations given. This programme should function at national, regional and community levels with detailed inter-‐connected projects and dedicated staffing. DRR mainstreaming is a critical element of this programme.
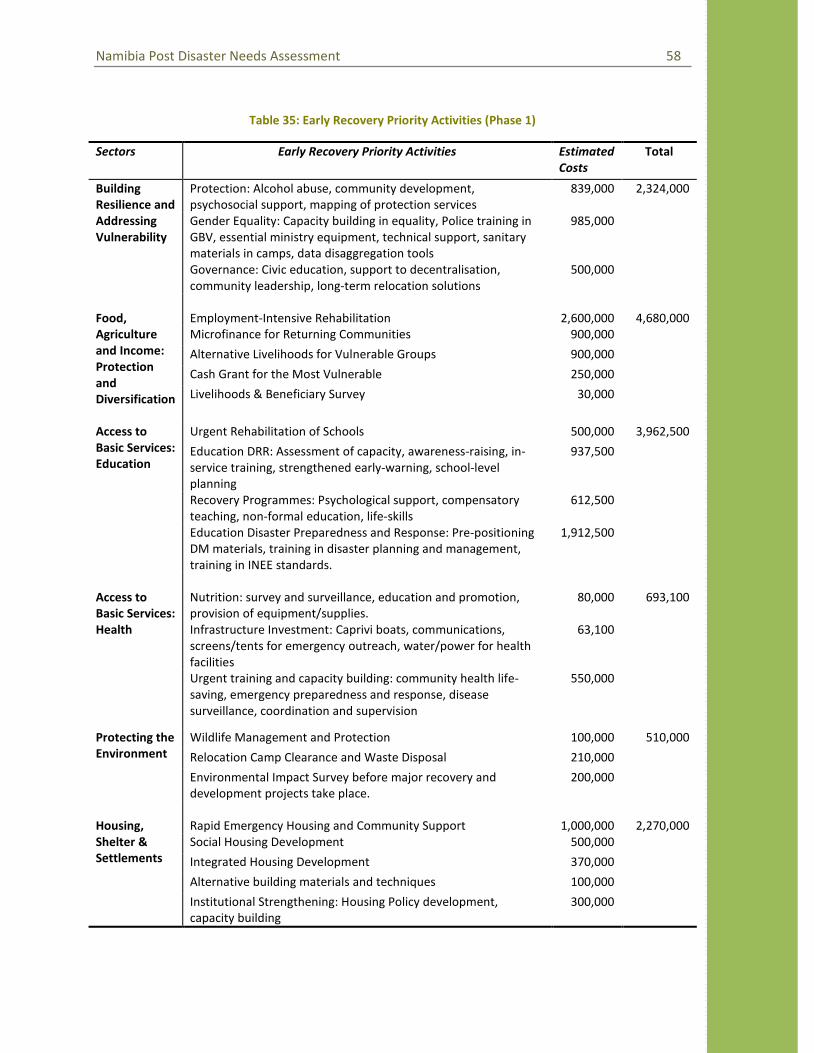
Namibia Post Disaster Needs Assessment 58
Page 58
Table 35: Early Recovery Priority Activities (Phase 1)
Sectors Early Recovery Priority Activities Estimated Costs
Total
Building Resilience and Addressing Vulnerability
Protection: Alcohol abuse, community development, psychosocial support, mapping of protection services
839,000 2,324,000
Gender Equality: Capacity building in equality, Police training in GBV, essential ministry equipment, technical support, sanitary materials in camps, data disaggregation tools
985,000
Governance: Civic education, support to decentralisation, community leadership, long-‐term relocation solutions
500,000
Food, Agriculture and Income: Protection and Diversification
Employment-‐Intensive Rehabilitation 2,600,000 4,680,000 Microfinance for Returning Communities 900,000
Alternative Livelihoods for Vulnerable Groups 900,000
Cash Grant for the Most Vulnerable 250,000
Livelihoods & Beneficiary Survey 30,000
Access to Basic Services: Education
Urgent Rehabilitation of Schools 500,000 3,962,500
Education DRR: Assessment of capacity, awareness-‐raising, in-‐service training, strengthened early-‐warning, school-‐level planning
937,500
Recovery Programmes: Psychological support, compensatory teaching, non-‐formal education, life-‐skills
612,500
Education Disaster Preparedness and Response: Pre-‐positioning DM materials, training in disaster planning and management, training in INEE standards.
1,912,500
Access to Basic Services: Health
Nutrition: survey and surveillance, education and promotion, provision of equipment/supplies.
80,000 693,100
Infrastructure Investment: Caprivi boats, communications, screens/tents for emergency outreach, water/power for health facilities
63,100
Urgent training and capacity building: community health life-‐saving, emergency preparedness and response, disease surveillance, coordination and supervision
550,000
Protecting the Environment
Wildlife Management and Protection 100,000 510,000
Relocation Camp Clearance and Waste Disposal 210,000
Environmental Impact Survey before major recovery and development projects take place.
200,000
Housing, Shelter & Settlements
Rapid Emergency Housing and Community Support 1,000,000 2,270,000 Social Housing Development 500,000
Integrated Housing Development 370,000
Alternative building materials and techniques 100,000
Institutional Strengthening: Housing Policy development, capacity building
300,000

Namibia Post Disaster Needs Assessment 59
Page 59
Water, Sanitation, Hygiene
Flood-‐Proofing of Water-‐Supply Points 200,000 1,420,000 Urgent repairs to open canals 200,000
Repair of drainage structures, ditches and outlets 1,000,000
DRR training for WASH sector 20,000
Addressing HIV/Aids
Strengthen NGO/CBO Capacity: Establish grant facilities 1,000,000 1,222,500 Increase greatly-‐needed impact of Regional Aids Coordinators 120,000
Strengthen HIV/AIDS Response in emergency settings. 102,500
Disaster Risk Reduction
Enable legislation and Strengthen DRR Institutions 1,000,000 7,740,000 Strengthen Risk Assessments and Early Warning 2,400,000
Community Awareness and Leadership 580,000
Strengthened Disaster Preparedness and Response 3,760,000
Early Recovery Planning and Coordination
National, regional and community early recovery programming and planning, implementation, monitoring etc.
500,000 500,000
TOTAL 24,075,800
5.4 Recommendations on when to move to long term recovery and
development
The government has not officially declared the emergency to be over, but the PDNA process showed general agreement among participants that the emergency is over and that the response is now (or should be) moving into the recovery and long-‐term development phases.
Recovery starts immediately after a disaster but takes time. The time needed for recovery depends on the severity and scale of the disaster, the resilience of the affected community and the scale and depth of the reconstruction effort. The greater the impact of the disaster on livelihoods, and the weaker the resilience of the community, and the less effective the recovery effort, the longer recovery will take.
When early recovery ends requires a qualitative judgment on the ground in a specific natural disaster context. However there are signals that can indicate the end of early recovery and the start of longer term recovery, reconstruction and development. These include:
A shift in early recovery coordination from humanitarian-‐led coordination structures to government-‐led coordination for recovery;
Emergence of a functioning, or caretaker, government in place with the minimum capacity to take charge of the recovery process, define long term national priorities, and deliver basic social services;
A transitional strategy/reconstruction/development plan in place around which the international community can align their support;

Namibia Post Disaster Needs Assessment 60
Page 60
Basic conditions for the voluntary return/resettlement/reintegration of displaced populations have been established;
Communities have at least temporary livelihoods opportunities to meet the immediate requirements of their families;
Plans are underway for the construction of permanent housing; and
Minor infrastructure has been rehabilitated enabling movement and access to markets.
It is important to set realistic time-‐frames for the recovery phase coherent with the context of the disaster. Planners need to allow for time over-‐runs in their plans. Global experience shows that the recovery phase could last at least three to five years for major disasters. However, in the context of the 2009 Namibia flood experience and for programming purposes, the ER interventions proposed were formulated for completion within a timeframe of up to 2 years. Given the sector priorities indicated above it is recommended that government pursue a multi-‐sector approach to supporting communities and local authorities in their flood-‐recovery efforts.

Page 61
Section VI:
Medium and Long Term Recovery and Reconstruction

Namibia Post Disaster Needs Assessment 62
Page 62
6.1 Recovery and Reconstruction Strategy
The Damage and Loss Assessment (DaLA) forms the basis for a comprehensive recovery and reconstruction strategy that combine medium and long term needs.
The medium term needs (2nd phase) look at the restoration of the essential economic activities as they were before the disaster. It focuses on reconstruction of damaged assets that are urgently needed to resume economic activities (housing, roads, water and sanitation) and on economic recovery in sectors whose production has been stopped during the flood (agriculture, manufacture and trade), as well as on livelihood recovery.
For example, damaged roads and other transport lines are repaired on an emergency basis, power is restored, commercial activities assisted to resume and factories brought back to production, agricultural productivity rehabilitated, and livelihood restored through income generation activities. From the infrastructure point of view, the function is rebuilt so that the vehicles can circulate and the people can have access to electricity, clean water and have a roof. In that phase, there is no time to think and plan differently.
The long terms needs (3rd phase) look at reconstructing infrastructure differently (or “better”) to make them less vulnerable to future disaster and at improving the resilience to disaster of important economic sector, such as for example agriculture in the North and Central regions of Namibia.
Reconstruction after a flood often sowed the seeds for destruction from disasters in the future, when vulnerabilities are reconstructed. Therefore, the aftermath of a flood provides opportunities to address historical vulnerabilities, such as opening drainage ditches, voluntary resettlement away from flood plains and the protection of existing structure. The location of houses, water points, sewerage ponds, schools, medical facilities can also be improved.
In addition to reduce vulnerability, there is also a possibility to factor in changes in external conditions such as urbanization, climate change (the two main crops that are cultivated in the six affected regions are resistant to drought not to flood) or the apparition of markets for agricultural products and thus the possibility to develop a commercial agriculture.
6.2 Medium Term Recovery and Reconstruction Needs (Phase 2)
The PDNA proposed main activities in that first phase are in the following areas:
1. Livelihood recovery: support communities through a cash for work program (income generation) to repair to basic services
2. Economic recovery: support agriculture recovery through seeds and other inputs and support private sectors recovery, especially small and agro-‐businesses, through soft term financing to restart production.

Namibia Post Disaster Needs Assessment 63
Page 63
Reconstructing physical assets: replace damaged infrastructure (repair of houses and building, schools and hospitals, roads and water and sanitation systems) to their pre-‐disaster conditions. For houses and building, it includes construction material to reconstruct houses and damaged household latrines and also credit to rebuilt commerce and industry premises. For roads it includes building critical culverts and bridges. For water and sanitation it includes the repair of pipes, wells, dams, and tanks, the cleaning up and rehabilitation of the open canal, and the rehabilitation of sewerage ponds.
Figure 35: Medium Term Recovery and Reconstruction Needs (Phase 1) (N$ Million)
The estimated cost of Phase 1 is N$ 1.12 billion (US$ 138.6 million), which consists of N$ 0.32 billion in economic recovery (US$ 39.3 million) and N$ 0.80 billion (93.3) in reconstruction of physical assets (See Figure 35 for a breakdown per sector). The income generation activity is designed to compensate the loss of income calculated in Section 3.2.
In the medium term, recovery activities are led by the public sector and reconstruction activities are led by the private sector: indeed, Seventy percent of the medium term recovery costs is borne by the Government and its development partners, agriculture recovery and income generation forming the bulk of it, while 70 percent of the medium term reconstruction cost is borne by the private sector, housing, commerce and industry forming the bulk of it.
This phase has already started and should take less than two years. For example, most of the roads have been reopened to traffic and built back to pre-‐flood conditions, food is being distributed, houses and building are being repaired. It is financed by Government of Namibia with the help of some development and by households and private sector.
However, some sectors might face a financing gap. For example, it is unlikely that the households and the private sector would be able to finance entirely the reconstruction of houses and businesses premises. Both households and the commerce and industry sectors would benefit from

Namibia Post Disaster Needs Assessment 64
Page 64
soft credit loans. The PDNA could serve as a useful tool for the Government of Namibia to consider the needs arising from the disaster to help close the financing gap.
In any case, the activities under phase 1 will come at a cost to the Namibian economy (they won’t bring any additional benefits) that is already impacted by the costs of the global financial crisis. Moreover, in the long run, the total cost to the economy might be higher if the area is affected again by a flood.
6.3 Long Term Reconstruction Needs (Phase 3)
The PDNA proposes main activities in that third phase could be divided into two categories: building differently or “better” housing and infrastructure (roads and water and sanitation) and transforming agriculture to improve reliable access to agricultural water (during droughts and floods). Preliminary activities identified by the PDNA could be the following:
In the housing sector, it is proposed to use flood proof-‐materials, such as cement plastering and cement blocks, or soil-‐cement bricks, that allow water to pass through the building without causing significant damages, to build physical barricades such as earth plinths, bamboo or other strong plants around the housing structure and in some cases where houses are located in a highly exposed floodplain, to relocate housing to safer (higher) areas.
In the social sector, the proposed activities include rebuilding improved school facilities, where applicable, that are more resilient to floods, and to upgrade 600 km of access roads to schools and hospitals to all weather roads. In the roads sector, it is proposed to build 1,100 Km of climate resilient roads that will withstand temporary overflow of water and with adequate drainage structure installed at the appropriate locations, and to improve storm water drainage systems, as well as urban storm lines in Ondangwa and Oshakati.
In the water and sanitation sector, it is proposed to rehabilitate and cover 160 km canal to avoid water contamination during floods to double (from 750 to 1500 boreholes in the rural areas and to replace submersible water pumps and relocate waste dumping to higher ground).
In the agriculture sector, proposed activities include the development of small-‐scale reservoirs at village or homestead level for irrigation and downstream flood protection purposes on 10,000 hectares of highly vulnerable farmlands. These multi-‐use flood protection and irrigation schemes will help small farmers be more resilient to both floods and droughts.

Namibia Post Disaster Needs Assessment 65
Page 65
Figure 36: Long Term Reconstruction Needs (Phase 2) (Billion N$)
The estimated cost of Phase 3 is N$ 3.7 billion (US$455 million). Roads constitute the bulk of the cost with 33 percent followed by water and sanitation and access to social services for 21 percent each. However, these cost estimates should be considered as benchmarks only as they could vary depending on the physical objectives that are given to this phase, i.e. the number of km of roads that are upgraded or the number of hectares of vulnerable farmlands that are protected from floods and droughts by small-‐scale reservoirs.
This phase is also expected to take longer, since investment projects with infrastructure components typically take around 5 to 7 years. As such, Phase 3 is a not a typical recovery and reconstruction phase after a disaster, but rather an investment program designed to improve resilience to the climate of the economy. As such, the Government could consider the possibility to develop a program for the six regions that could have four components: (i) housing; (ii) agriculture; (iii) roads (including access to social services); and (iv) water and sanitation.
An important precursor to investments made under Phase 3 would first require analytical work in advance of investments in the different sectors, for example in the agriculture sector to understand if there will be markets for a commercial agriculture and also more complete information on the potential severity and frequency of floods. Thus, a comprehensive, regional hydrology and climate change study should be undertaken, together with consultations with local population on possible relocation. These costs are accounted for in the proposed DRM activities (see next section)
Finally the activities that are contemplated in Phase 3, however, are not direct costs to the economy, but rather investments that generate two types of economic benefits: (i) damages and losses avoided from future floods and droughts (the magnitude of benefits will depend on the severity and frequency of future floods and droughts); and (ii) benefits from development, such as increased productivity in agriculture, faster growth in the trade and manufacturing sectors, and

Namibia Post Disaster Needs Assessment 66
Page 66
reduced water borne diseases. For example, upgrading the roads in addition to make them more resilient to floods will facilitate improvement of agriculture productivity.
In other words, investments proposed under Phase 3 would not only prepare Namibia from future climate shocks (droughts and floods), but would also assist in broader strategies of sustainable economic growth and development.
6.4. Summary of Recovery and Reconstruction Needs
The needs for medium and long term recovery and reconstruction after the 2009 flood are estimated to be N$ 4.8 billion (US$ 591 million equivalent). These needs are further broken down into two phases of recovery and reconstruction: medium term (Phase 2) and long term (Phase 3).
Figure 37: Reducing risks can prevent future relocations

Namibia Post Disaster Needs Assessment 67
Page 67
Table 36: Summary Table of Medium and Long term Recovery and Reconstruction Needs for Phases 2 and 3
(N$ Million)
Phases/ Sector
Phase 2 Phase 3
Recovery Reconstructing (the function) Building Back Differently
Description Cost, Description Cost, Description Cost,
Housing Temporary shelter scheme
13.8 Private sector reconstruction
177.9 Private sector reconstruction with disaster-‐resilient standards
539.5
Provision of construction materials for poor
80.0
Education Repairs to school buildings, acquisition of furniture and materials
5.0 Reconstruction of schools as is
15.0 Reconstruction of schools with disaster-‐resilient standards
50.0
Construction of adequate road access to schools
57.0
Health Repairs to hospitals 0.7
Monitoring and control of morbidity levels
5.7
Agriculture Temporary food needs, including grains, meat, etc
43.7 Small-‐scale reservoirs for irrigation and downstream flood protection in 10,000 hectares
400.0
Provision of seeds, and other inputs
33.0 Diversification of agriculture production
Assistance to land preparation
28.3
Manufacture Soft credit lines for SMEs to restart production
40.0 Financing to rebuild premises and replace equipment and machinery
100.0
Possible temporary tax relief to SMEs
Trade Soft credit lines for SMEs to restart production
45.0 Financing to rebuild premises and replace furniture
150.0
Possible temporary tax relief to SMEs
Tourism Promotion campaigns abroad to attract tourists
10.0 Private sector reconstruction of lodges and Etosha Park
15.0
Transport Rehabilitation of road traffic
4.3 Urgent reposition of bridges and culverts
192.9 Upgrading of critical roads 1,224.0
Access to critical services and markets
680.0
Communications Relocation of towers and antennas in safer areas
…
Water and Sanitation
Rehabilitation of water supply and waste-‐water systems
48.2 Reconstruction of systems using disaster-‐resilient standards
763.6
Income generation
Cash for work program to repair community and basic services
90.0
Environment Waste and wildlife management activities
1.7 Reconstruction of roads and parks
17.5
Total
321.2
796.5
3,755.7

Namibia Post Disaster Needs Assessment 68
Page 68
6.5 The way forward
The medium and long terms activities proposed PDNA does not constitute a recovery and reconstruction plan per se, which would require further analytical work and program preparation work to refine sectoral needs and priorities, elaborate implementation arrangements and complete and refine estimates of costs.
Moreover, the long term activities proposed by the PDNA and aiming at building differently and improving reliable access to agricultural water have to be coherent with the Government of Namibia Vision 2030 where economic growth, poverty and income inequalities reduction and living standards improvement of its people reach the level of a developed country by 2030.
Vision 2030 is to be realized through a series of National Development Plans. The third National Development Plan for 2007-‐2011 is currently under implementation. The total investment required to implement NDP3 is N$ 76.3 billion (US$ 9.4 billion) if the country wants to achieve 5 percent growth and is N$ 94.6 billion (US$ 11.6 billion) if the country wants to achieve 6.5 percent of growth.
The proposed investments in the housing, transport (including access to social services), water and sanitation and agriculture sectors are in line with the investments proposed in NDP3, however: roads and agriculture11
Nevertheless, the investment proposed in PDNA Phase 3 represents a significant change in the objective of NDP3 as they are introducing climate resilience in a growth strategy.
investment are already included in it, housing and water and sanitation, not really: there are housing and water and sanitation sub-‐ programs in NDP3 but they are not designed to flood proof housing and canals or relocate people. Therefore, the indicative investments that are proposed in the PDNA Phase 3 which represent about 4 to 5 percent of the cost of NDP3, depending on the growth scenario that is targeted, will only increase the cost of NDP3 of about 1 to 2 percent.
The development of the four components of a long term climate resilient reconstruction program should be discussed separately at a round table of development partners that could be interested at financing a adaptation to climate change program in northern Namibia.
11 The NDP3 proposes 10,000 hectares of large scale irrigation (the green scheme). PDNA proposes the same amount of hectares but small scale, multi-‐purpose reservoirs.

Page 69
Section VII:
Reducing Risks

Namibia Post Disaster Needs Assessment 70
Page 70
7.1 Situation during the Disaster
The 2009 flood was a major event, with levels not experienced since the late 1960s. However, the impact of the disaster was exacerbated by a series of factors which substantially increased population vulnerability:
1. Even though there were floods of comparable magnitude during the 1960s and 1970s, they were followed by a period of relative stability during the 1980s and 1990s. It was not until very recently (mid-‐2000s) that the pattern of heavy flooding started again. The national institutions established since independence (1990) were unprepared for such a disaster, and communities had largely lost their institutional memory to adapt. Many poor households compounded their vulnerability by settling inside the flood plain.
2. Against this background, the most vulnerable population of Namibia had been greatly weakened by a series of consecutive shocks: floods during 2004 and 2008, consecutive years of droughts, foot-‐and-‐mouth disease, and a downturn of construction contracts.
3. The poor conditions and experience with previous years’ relocation camps caused many people to choose to ignore flood warnings and prefer to remain in their homes to safeguard their assets until roads and other escape routes were cut off from the flooding.
4. Even though national authorities transmitted hydrological warnings, they did not result in appropriate action at the community level—thus, there is a need to strengthen the adequacy of local early warning messages and community mobilization.
5. There was a disruption of the previously good collaboration with the Zambezi River Authority for transmission of early warning readings due to a break-‐up in financial support. In Kavango, the transnational collaboration with Angola has historically been weak.
6. Storm water drainage systems and culverts were not maintained or cleaned and in some areas the floodway was blocked by informal structures.
7. Namibia lacks a clear national legislation and contingency plans defining the roles of responsibilities of the various agencies during a national emergency (although a National policy exists). As a result, the administrative system was unable to respond quickly and adequately to a disaster of the magnitude of the 2009 floods. In early April, for example, local authorities in Caprivi were still using relief supplies and procedures from last year’s drought.
8. With some exceptions (e.g. the Flood Emergency Management Coordination Committee in Cuvelai), disaster risk management committees are still incipient and ad-‐hoc, and require further training and equipment. In addition, the humanitarian logistic support to relocation camps needs to be systematically reviewed so that it ready for the next emergency; there is, for example, a surplus of donated (and inadequate) tents in some areas while sanitation remains a major problem.
7.2 Strategy for Disaster Risk Reduction in Namibia
Given the alternate recurrence of floods and droughts in North and Northeast Namibia, it will be critical for the Government to strengthen is disaster risk management strategy. The 2009 flood offers an opportunity to review lessons learned from the 2009 disaster and substantially strengthen Namibia’s risk management framework.

Namibia Post Disaster Needs Assessment 71
Page 71
The following main priorities have been identified to reduce disaster risk: 1. An Enabling Legislation and Strengthened Institutions for Disaster Risk Reduction
2. Strengthened Risk Assessment
3. Enhanced Community Awareness of Disaster Risks
4. Strengthened Disaster Preparedness and Response
These categories follow the priorities of the Hyogo Framework for Action.
An Enabling Legislation and Strengthened Institutions for Disaster Risk Reduction An Enabling Legislation While Namibia adopted a Disaster Risk Reduction (DRR) Policy in February 2009, it needs a national act and regulations to clarify lines of command during emergencies. Currently, the President declares a state of emergency during disasters, triggering a meeting of the National Emergency Committee. This cabinet-‐level committee, chaired by the Secretary to the Cabinet, will then assemble the Permanent Secretaries of the Ministries concerned by the disaster. The Directorate of Emergency Management (DEM) under the Office of the President acts as the Secretariat to the Emergency Committee. DEM then liaises with the Regional Emergency Management Units of the regions affected by the disaster, which are chaired by the Governor. However, this structure presents weaknesses at three levels, which constrain its ability to act swiftly in the early days of an emergency and thus potentially save lives:
First, many decision makers at the regional level are not familiar with the 2008 DRR Policy. It is critical that the policy be disseminated widely amongst key stakeholders.
Second, Namibia needs to adopt a DRR act and regulations specifying the chain of command during emergencies. From international experience, the chain of command needs to be clear, simple and undisputable, giving the emergency agency (in this case DEM) full powers to mobilize the regional authorities, the military and international partners once the President declares a state of emergency.
Third, the state of emergency should be based on parametric triggers, i.e. a pre-‐agreed indicator of likelihood of flood or drought (e.g. number of consecutive days of heavy or low rainfall, river levels upstream, etc.). By the time the disaster hits, it is often already too late to save lives and critical assets. Parametric triggers are now commonly recommended in catastrophe insurance schemes, such as the Caribbean Catastrophe Risk Insurance Facility (CCRIF).
Stronger DRM Institutions
In 2006, Namibia established a National Disaster Risk Management System, involving multi-‐sectoral DRM Committees and refocusing their role from emergency response to disaster risk reduction. The 2006 Cabinet Action Letter specifies the roles and responsibilities of multi-‐sectoral DRM committees at the national, regional, constituency and settlement levels (Figure 1). Namibia has also established a National Climate Change Committee in 2001, under the Ministry of Environment and Tourism. However, with few exceptions—notably the Cuvelai Flood Emergency Management Coordination Committee—the committees remain largely ad-‐hoc, and need to be

Namibia Post Disaster Needs Assessment 72
Page 72
institutionalized, trained in DRM principles, and provided with minimum logistical and operational support. They need particular reinforcement at the national levels, as well as in Caprivi and Kavango. Regional DRM Committees in other disaster-‐prone regions such as River Canyon may need to be reinforced as well.
Namibia has developed a National Risk Reduction Action Plan (2005-‐2015) and is finalizing a National Climate Change Adaptation and Mitigation Strategy under its Second National Communication. The National Risk Reduction Plan should now be revised to include updated information on hazards, climate change and variability, risk profiles, structures, and procedures. It should form the platform of linkages to the sectoral and regional Disaster Risk Management Plans specified in the 2009 National Policy, and to specific contingency plans (see 5.A). Given the recurrence of disasters in Namibia, disaster risk management should be mainstreamed into the National Development Plan. As is common with other countries, Namibia’s Vision 2030 and the Third National Development Plan (2007/08-‐2011/12) makes a relatively minor reference to extreme events and climate change, and they are classed under Environmental Sustainability issues. Given the current knowledge that these recurrent disasters affect core economic sectors such as transport, manufacture and agriculture, it is recommended that disaster risk reduction be mainstreamed into the next amendment of the National Development Plan and annual Ministerial Plans (and consequently, into the budget).
Strengthened Risk Assessment
Climate Variability and Hazard Modelling
While Namibia has made good progress in analyzing climate change trends based on historical data, it should now follow up by assessing climate variability trends and model changes in flood, drought and wild fire hazards. As part of its contribution to the First and Second National Communications, Namibia carried out a Country Study on Climate Change in 1998, which analyzed climate change trends from 1960 to 2005, as well as an economic impact study.12
Participatory Flood Risk Mapping
These studies describe a future temperature rise of 2-‐6oC by end of the century, a later start and shorter rainy season in the northern regions, and possibly more intense extreme events. The combined economic effects were estimated at 1.1 to 5.8 percent of GDP. Given the latest floods and droughts, there is a need, however, to further assess future climate variability trends. This may include modelling indices such as rainfall intensity, wet day sequencing, potential evatranspiration, changes in water availability and average river flow. It also requires modelling the expected changes in key hazards (floods, droughts and wildfires) brought about by climate change (see example of Figure 2). This modelling may be carried out by global and regional centres of expertise, such as the University of Cape Town, the SADEC Drought Monitoring Centre in Botswana, and the Global Wildlife Monitoring Centre in Germany. It would be important to ensure that Namibian experts are trained in the process.
12 Reid, H., L. Sahlen, J. MacGregor and J. Stage (2007). The Economic Impact of Climate Change in Namibia. International Institute of Environment and Development., Discussion Paper 07-‐02. London.

Namibia Post Disaster Needs Assessment 73
Page 73
The final reconstruction decisions will depend largely on the level of safety deemed acceptable for the affected zones. Participatory flood mapping can be a powerful tool for consensus decision making and community consultation of reconstruction decisions in the affected areas. The first step would be to simulate the disaster impacts of different flood return periods (e.g. once in 100 years, 1: 50, 1:25). The consensus should be to move to stricter safety levels if there is a chance of future loss of lives or extreme economic hardship. The associated spatial delineation of areas “at risk” for the different return periods of flooding would then provide a basis for participatory decision making. In general, the map would indicate the location of:
Floodway: the normal river channel or high water area, prone to high velocities, high erosion and high levels of debris. Apart from critical infrastructure such as bridges, no structures should be allowed in a floodway.
Floodplain: the residual flooding area, where flood-‐protected structures could be allowed. However, all new development should be compatible with a flood-‐prone area.
In some areas, a single-‐zone approach could be used.13
Once the initial safety-‐level mapping simulations were done, extensive stakeholder consultations would follow to reach a consensus on the zoning regulations and flood-‐proof measures to be adopted. This would be particularly important if it involved the relocation of any structures (e.g. public schools, health centres, or housing) into safer grounds.
Figure 38 shows an example of flood mapping. The dark blue area shows the extent of the floodplain in Caprivi in early April 2009. The 2009 floods had a frequency of approximately 40 years. If, through participatory flood mapping, the consensus was to select a safety level of 50 years or more, the majority of the structures inside the floodplain should be made flood proof. The type of flood modelling that would be needed would depend on the affected zone. For Cuvelai, a densely populated, high-‐growth zone, a more detailed flood mapping and zoning is recommended to help regulate future development (including satellite mapping, lidar aerial surveys of the drainage area, and adequate resolution digital terrain and soil mapping), which will complement the 20 km2 of existing LIDAR survey that already exists for the zone. For Caprivi and Kavango,
13 UN Department of Economic and Social Affairs, UNISDR and NOAA “Guidelines on Reducing Flood Losses.” ISDR. Geneva.
Figure 38: Floodplain in Caprivi, April 2009
Map Source: MapAction

Namibia Post Disaster Needs Assessment 74
Page 74
however, lower cost options might be considered, such as coarser flood maps coupled with a simple satellite rainfall-‐runoff models to compute water balances and simulate flood maps. This would help derive projections of likely affected population and help identify potential areas for evacuation based on coarse elevation data (Kwabena Asante, personal communication). Linking Information for Hazard Monitoring and Response – an Operations Room While different agencies collect hazard monitoring information, the system is not linked and information flow remains too slow. At present, the Department of Water Affairs at the Ministry of Agriculture, Water and Forestry issues most flood warnings and has considerable access to information databases. The Directorate of Emergency Management, however, lacks capacity in geospatial skills or the means to rapidly assemble disaster emergency and risk management information. It is critical that Namibia create a harmonized disaster risk management information database and operations room able to inform policy makers and the public on a real-‐time basis. According to a recent review by the UN-‐SPIDER,14
Stronger Early Warning and Transboundary Cooperation
four types of interventions would be needed to establish such a system: (a) awareness raising for end users of information; (b) training on spatial data handling, such as hazard mapping, risk identification, integration of different disaster data sources, GIS/GPS, and logistical planning; (c) remote sensing interpretation; and (d) integration of delinked information sources such as geophysical data, hydro-‐meteorological data, records of emergency response, disaster assessments, etc.
During the disaster, the Department of Water Affairs provided frequent early warnings; however, these were not fully effective on the ground. Lessons learned from the 2009 disaster indicate the need to strengthen the early warning system at several levels:
Designate a focal point to activate the International Charter on “Space and Major Disasters” allowing Namibia free access to satellite imagery from members to the Charter for such information as road and infrastructure damage, extent of flooding and estimation of affected population.15
Strengthen transboundary collaboration with the Zambezi River Authority and the Okavango River Basin Commission to ensure continuous readings for Zambezi and Kavango. Kavango, in particular, remains deeply affected by the ineffectiveness of the Okavango River Basin Commission to provide readings to the Government of Namibia. The previously good collaboration with the Zambezi River Authority was interrupted this year by lack of financial support from the Government of Namibia.
As of 2010, Namibia is already expected to benefit from satellite flood mapping from NASA.
The water level monitoring stations in Cuvelai were considered insufficient. The Department of Water Affairs is addressing this gap by installing 17 new gauging stations (for a total of 20), and 20 new rain gauges (for a total of 21).
14 UN Platform for Space Based Information for Disaster Management and Emergency Response “Report of Technical Advisory Mission to Namibia” 27 January-‐2 February 2009. 15 UN Platform for Space Based Information for Disaster Management and Emergency Response “Report of Technical Advisory Mission to Namibia” 27 January-‐2 February 2009.
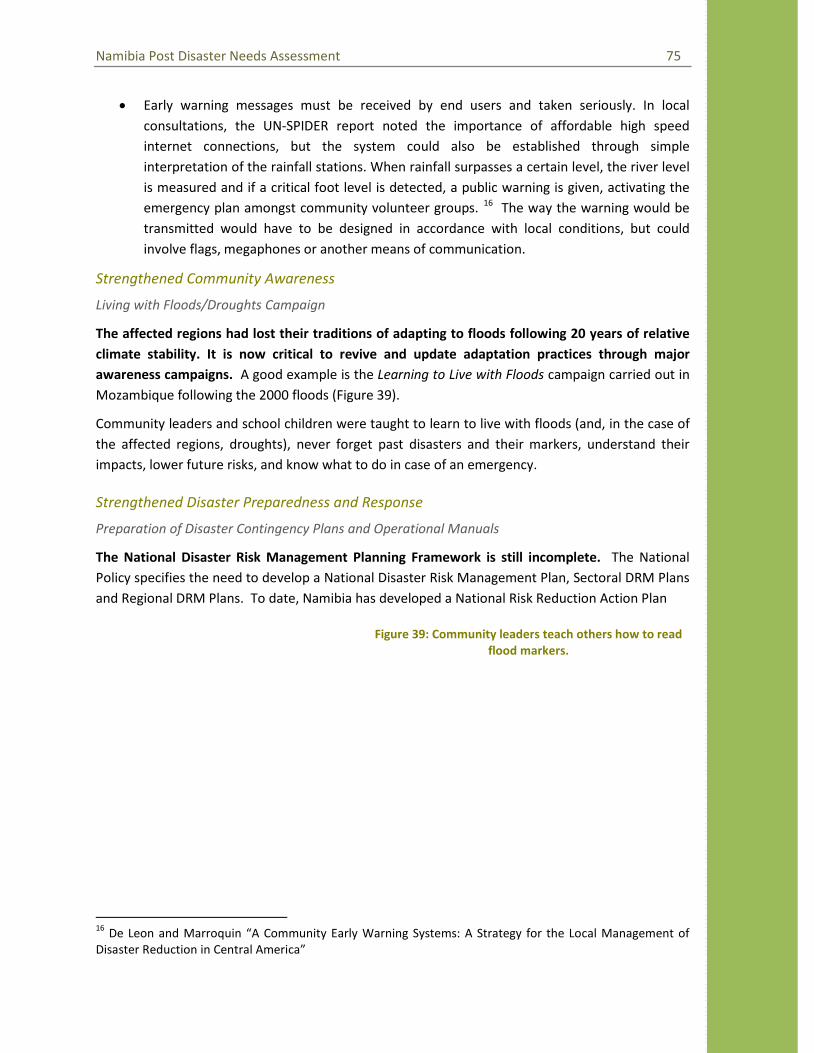
Namibia Post Disaster Needs Assessment 75
Page 75
Early warning messages must be received by end users and taken seriously. In local consultations, the UN-‐SPIDER report noted the importance of affordable high speed internet connections, but the system could also be established through simple interpretation of the rainfall stations. When rainfall surpasses a certain level, the river level is measured and if a critical foot level is detected, a public warning is given, activating the emergency plan amongst community volunteer groups. 16
Strengthened Community Awareness
The way the warning would be transmitted would have to be designed in accordance with local conditions, but could involve flags, megaphones or another means of communication.
Living with Floods/Droughts Campaign
The affected regions had lost their traditions of adapting to floods following 20 years of relative climate stability. It is now critical to revive and update adaptation practices through major awareness campaigns. A good example is the Learning to Live with Floods campaign carried out in Mozambique following the 2000 floods (Figure 39).
Community leaders and school children were taught to learn to live with floods (and, in the case of the affected regions, droughts), never forget past disasters and their markers, understand their impacts, lower future risks, and know what to do in case of an emergency.
Strengthened Disaster Preparedness and Response
Preparation of Disaster Contingency Plans and Operational Manuals
The National Disaster Risk Management Planning Framework is still incomplete. The National Policy specifies the need to develop a National Disaster Risk Management Plan, Sectoral DRM Plans and Regional DRM Plans. To date, Namibia has developed a National Risk Reduction Action Plan
16 De Leon and Marroquin “A Community Early Warning Systems: A Strategy for the Local Management of Disaster Reduction in Central America”
Figure 39: Community leaders teach others how to read flood markers.

Namibia Post Disaster Needs Assessment 76
Page 76
and Sectoral Plans for education, health and transport, but not for agriculture, industry and commerce, environment, regional administration and other critical sectors. At the regional level, only Caprivi has developed the initial stages of a disaster contingency plan. It will be particularly critical to develop local contingency plans as part of civil protection mobilization and awareness campaigns in the affected regions immediately after the disaster.
Simulation Training
Once Local Disaster Contingency Plans are adopted and Local DRM Committees established, it will be critical to carry out simulation training prior hazard seasons. This allows all stakeholders involved in DRM operations to simulate a situation of emergency, detect potential bottlenecks and weaknesses in the system, and know how to act fast to correct logistical problems when the disaster actually strikes. The experience of the 2009 floods revealed the need to have these contingency plans ready: in both Caprivi and Kavango, as late as April 2009, local authorities were using drought relief supplies to assist flood victims. Since the drought relief was limited to rural families, some urban victims were not being properly assisted. It is critical that local decision makers have access to the right disaster contingency plan once a state of emergency is declared.
Given the importance of DRM Capacity Building both at the National and Local Level, it is recommended that an International Emergency Advisor be assigned to Namibia for 2-‐3 years. Short term specialists with particular expertises—e.g. community flood protection mobilization, participatory mapping—should also be considered to assist the Government of Namibia in particular stages of their DRM institution building.
Strengthen Relief and Emergency Management at the Local Level
Disaster-‐prone areas need to optimize their logistical support, prior to a high-‐risk season. The 2009 disaster has given local authorities a plethora of donated tents and blankets, while other essential emergency items (such as boats) continue to be scarce. Based on this experience, local authorities should compile an optimized list of logistical support facilities: the type of equipment and goods needed for the next emergency (considering that the next time it might be a drought, or a wildfire); their optimal location and storage needs; how to procure and distribute food; how to transport people and goods; whether to hold humanitarian assistance in warehouses for the season or procure it locally, etc. The budget for logistical support and the corresponding plan should be an integral part of the local disaster contingency plans.
Source: Learning to Live with Floods Campaign, Mozambique, HR Wallingford, DFID, MICOA, UN Habitat.

Namibia Post Disaster Needs Assessment 77
Page 77
Table 37: Estimated Disaster Risk Reduction Needs (US$)
Priorities Estimated Costs (US$’)
Schedule
1. Enabling Legislation and Strengthened Institutions for DRR
1.A. DRR Act and Legislation 50,000 1 year (2010) 1.B. Institutional DRR Strengthening at National and
Regional Level 750,000 3 years (2010-‐
2012) 2. Strengthened Risk Assessment
2.A. Climate Variability and Flood, Drought and Wild Fire Hazard Modelling (3 Zones)
150,000 1 year (2010)
2.B. Participatory Risk Flood Mapping (3 Zones) 1,200,000 1.5 years (2009-‐2010)
2.C. Operations Room for Hazard Monitoring and Response (National)
550,000 2 years (2010-‐2011)
2.D. Strengthened Early Warning and Transborder Cooperation (with Angola and Zambezi River Authority)
150,000
3. Strengthened Community Awareness 3. A. Living with Floods and Droughts Campaign 400,000 2 years (2010-‐
2011) 4. Strengthened Disaster Preparedness and Response
4.A. Preparation of Disaster Contingency Plans and Operations Manuals
350,000 1 year (2010)
4.B. Simulation Training 100,000 1 year (2011) 4.C. Strengthen Relief and Emergency System
Management at Local Level (3 Zones) 1,500,000 2 years (2010-‐
2011)
Total Estimated Needs for DRR Strengthening 5,210,000

Page 78
Annexes

Namibia Post Disaster Needs Assessment 79
Page 79
Annex 1: Water Supply and Sanitation
Pre-‐Disaster Situation
Water Supply. Coverage of the piped water supply system is high, with more than 80 percent of households connected to piped water supply networks in towns and 23 percent of households in rural areas. In addition, 67 percent of the rural population is provided with potable water by boreholes. The quality of drinking water supplied through piped schemes and boreholes is acceptable. Households connected to the piped water networks pay fees on average of N$6.5 per m3 while water served from public taps is free. Rural communities that get water from boreholes are organized around community-‐based management organizations and contribute to operation and maintenance costs through cost recovery systems. However, the water supply remains vulnerable in rural areas where villages are located far from water points and often prefer to use traditional surface ponds. In the Caprivi region villages located along (or near) the Zambezi river get water supply directly from the river.
Sanitation facilities. The sanitation system was vulnerable even prior to the floods as an average 67 percent of the population uses non-‐improved facilities (i.e. pit latrines without slab, open latrines, shared toilet between households), and 15.9 percent of the urban population and 80 percent of the rural population still defecate in the open. Only 29 percent of the population is connected to public sewerage systems. Waterborne diseases remain a public health problem.
Waste water and urban drainage. In the affected areas, public sewerage systems only exist in large towns like Oshakati, Odangwa or Rundu. Most of cities and villages are located in low and flat areas, but the rain water drainage system is very poor and existing outlets and ditches are poorly maintained and silted-‐up. In urban areas it is not rare for buildings or houses to be built in a flood-‐prone area due to the absence of proper development planning; consequently, these structures hinder natural drainage or reduce considerably the storage capacity of the natural basin.
Damage and Losses Assessment
Water supply. In general the damage to the water supply infrastructure was of little importance and localized in few points or portions of the water systems. In regards to the piped scheme, water supply networks in Oshikoto, Caprivi and Kavango did not experience any damage. Disruption of the water supply was observed in few localized points of the piped scheme in the Omusati, Ohangwena and Oshana regions due to the leaks incurred by damage to the infrastructure and the delay in repairing the damage until the flooded area was accessible. In rural areas the number of boreholes and public taps damaged was very insignificant, but access also was limited when these infrastructures were under water. Table 38 shows type of damage by component.

Namibia Post Disaster Needs Assessment 80
Page 80
Table 38: Urban and Rural Water Supply Components
Component Urban Rural Water source 1 dam sealed up 3 small dams broken, 2 hand pumps
damaged Conveyance and Storage Open canal flooded and localized
damage on 23 points. 200 ml of pipes washed away, 2 motors destroyed, 1 incident of power cable cut
Distribution 60 plastic tanks washed away, 4 plastic tanks hit by elephants, break in 32 points of pipes, 76 public taps damaged
Sanitation facilities. Damage to toilets and latrine infrastructures appears to not have been extensive and estimated at about 5 percent of total number of both improved and non-‐improved facilities. The assessment, however, indicates that during the floods most of the facilities, particularly latrines in informal urban settlements and in rural areas, have been under water and unusable. Flood water mixed with sewage and defecation raised concerns about potential disease outbreaks, but the reported cases of waterborne diseases was quite limited.
Waste water and urban drainage. The reported damage consists of nine sewerage ponds which were washed away and some minor damage to pumps and pipes. However, one main issue of concern in urban areas was the lack of maintenance of existing outlets and ditches and natural drainage. Proper cleaning and maintenance of these systems could have minimized the effect of the flood in terms of duration of the inundation and the level of water in the flooded area. As discussed, the lack of properly implemented urban development planning results in construction and structures (commercial building, houses, warehouse, etc.) built on natural drainage outlets or in flood-‐prone areas, blocking natural water circulation or reducing the storage capacity of the artificial basin formed by roads.
Economic impact. The aforementioned damages to the existing water supply and sanitation infrastructure and further losses because of the damage are shown in the table below.
Table 39: Summary table of damages and losses to the WSS sector (N$ million)
Disaster Effects Ownership
Sub-‐sector Damages Losses Public Private Water Supply 18,5 11,8 30,3 Sanitation 9,6 16,2 25,8 Waste Water 19,8 1.0 19,8
Total 47,9 28,0 50,1 25,8
Stagnant water and inundation in low area. Some of the floods waters still remain as stagnant waters in some urban areas in Odangwa and Oshakati causing difficulties to households that returned home as well as to industry and commerce seeking to restart business. The stagnant water is also providing a breeding ground for mosquitoes (see Health).

Namibia Post Disaster Needs Assessment 81
Page 81
In the Caprivi and Kavango regions where water levels are steadily receding, some villages located along the Zambezi River were still inundated as well as some relocation sites were surrounded by water, at the time of the assessment. Relocated people were expected to return home in August-‐September, 2009.
Governance issues
While most of the policy, legislative and regulatory framework is in place—including a 2008 Water and Sanitation Sector Policy; a 1969 Public Health Act; a 2004 Resources Management Act; a 2007 Environmental Management Act; and a National Strategy for Sanitation under preparation—the main weakness remains in enforcement and control (before the permits are issued, during and after construction).
Disaster Risk Management Issues Access to clean water is the most important aspect of flood management. Water sources are frequently contaminated during floods, leading to water and vector-‐borne diseases (diarrhoea, malaria, and potentially cholera and typhoid outbreaks). Hence, the following risk management practices are recommended:17
Drainage systems should be kept clean at regular times—particularly prior to the rainy season. Garbage must be kept in containers or burned or buried if organic. Latrines and sewerage systems are a major source of contamination during floods. To the extent possible, latrines should be elevated above known flood levels .Flood management principles should be integrated into the design of urban sewerage system and waste water infrastructure (particularly in Cuvelai).Instructions related to disaster risk management need to be more fully developed and, when finalized, disseminated at the national, regional and local level. The following key issues should be addressed to allow for the application of existing regulation and standards in the fields: (i) lack of human resources to enable enforcement, (ii) set up of regional and national sector monitoring system including disaster risk analysis and early warning system, (iii) better coordination between sector ministries that will be involved in DRM, and (iv) capacity strengthening of staff at national, regional and local level.
(i) reducing walking distance from villages to water points (minimal of 2.5 km for now) to facilitate access. It was observed that if the nearest water point has been destroyed villagers would prefer to use natural surface ponds rather than walking 5 km; (ii) water containers/tanks containing clean water should be kept in elevated platforms or home roofs (above the previously recorded flood marks); (iii) All water faucets and electrical switches should be kept above previous flood mark levels, (iv) manual water pumps and/or power generators should be kept as spares (due to frequent power outages during floods), (v) floating watertight containers could be used in emergencies (during the 2000 floods in Mozambique, these helped save many lives), (vi) houses should be equipped with rainfall collection cisterns or rainfall roof collection systems, (vii) water disinfectant products and diarrhoea medicine should be kept in safe areas (elevated platforms or false roofs).
17 MICOA, UNDP, UN-‐HABITAT. 2007. Aprender a Viver com as Cheias. Maputo, Mozambique.

Namibia Post Disaster Needs Assessment 82
Page 82
Recovery and Reconstruction Needs
A needs assessment has been outlined considering two aspects of the recovery and reconstruction needs: (i) restoring water supply to pre-‐flood conditions and further development of services, and (ii) emergency preparedness to address future natural disasters.
The medium term reconstruction and recovery needs are restoration of water supply services and rehabilitation of damaged infrastructures (cleaning up and concrete works on the open canal, plastic tanks, pipes, protected wells, public taps, power cable cut, etc.), rehabilitation of damaged ponds, cleaning up of existing outlets, ditches and natural drainage, rehabilitation of household latrines, and promotion of better hygiene practices. The strategy for the recovery phase should also consider meeting SPHERE standards so that systems established are more sustainable. Medium Term Recovery and Reconstruction needs are estimated at N$48 million
As part of the long term recovery and reconstruction needs, a more sustainable program is needed after the initial relief and recovery, which should be three to five years in duration and should consider the following initial strategies: (i) sustained and improved access to the water supply in urban and rural areas (water sources are frequently contaminated during floods, leading to water and vector-‐borne diseases); (ii) a sustained access to improved sanitation facilities; (iii) proper urban development planning; and (iv) control and emergency preparedness to address future natural disasters (improvement of storm water management system and construction of critical bridges and roads in the towns Oshakati and Ondangwa).
The medium term reconstruction and recovery are for urban water supply: (i) the rehabilitation of the 160 km canal (N$440 million) as well as (ii) its covering to avoid water contamination during floods (N$ 16 million); for rural water supply the doubling (from 750 to 1 500) of the number of boreholes (N$ 270 million); for waste water the flood proofing of materials, the replacement of sumesible water pumps, the relocation of waste dumping on higher ground, the construction of concrete channels (N$37.6 million)
Longer-‐term recovery needs are estimated at N$ 763.6 million. while longer-‐term recovery needs amount to N$763 million.
Table 40: Recovery Needs in the WSS sector (N$ million)
Sub Sector Rehabilitation Long Term Recovery
Water Supply Urban 23.1 456 Rural 2.2 270
Waste Water 22.9 37.6
Total 48.2 763.6
The NDP3 has water supply and sanitation subprograms for an amount of N$ 1.3 billion. The climate proofing of water supply and sanitation infrastructure would come in addition to the planned investment, but would be relevant to the overall objectives of the two subprograms.

Namibia Post Disaster Needs Assessment 83
Page 83
Annex 2: Transport and Communication
Pre-‐Disaster Situation
The transport network of Namibia comprises 2,880 km of rail line, 44,428 km of roads, and air transport that provide services through one international airport and 40 domestic air strips. The main seaport at Walvis Bay is an important gateway to Namibia and neighbouring countries. Inland water transport is limited to individual use on Caprivi swamps and the Zambezi River. Road transport plays a dominant role in the provision of transport services for goods and passengers. Namibia’s road network consists of 4,572 km trunk (primary), 11,149 km main (secondary) and 26,379 km district (tertiary) roads, which are mostly in good condition.
The areas, which were affected by the 2009 flood (Omusati, Oshana, Ohangwena, Oshikoto, Kavango and Caprivi regions), are mainly served by roads consisting of 1,648 km trunk, 1,099 km main, and 4,165 km of district roads respectively. The six regions are also served by 12 airstrips. The single rail line in this area currently ends at Ondangwa town and an extension project to connect to Oshikango (Angolan border) is in progress.
The trunk, main and district roads are managed by the Namibia Roads Authority, which has a regional office in Oshakati that is responsible for the maintenance of the roads in the six regions. The roads were in good condition before the floods and quick action was taken by the regional office to open the roads to traffic in a short time. The unproclaimed18
Damage and Losses Assessment
roads in the region, which are tracks, are cleared by local administrations when there is a need. The roads in these regions are mainly providing public transport services, except the access roads within the national parks, which have an exclusive purpose and are reported on separately as part of the environment sector.
Roads in Cuvelai basin were not constructed up to a standard capable of withstanding heavy rain and flood as well as allowing quick movement of excess water.
Several waterways, spread over 100 km in the main cuvelai basin, are endangering the roads in these regions. There are also flood water ways spread over the two basins, west and east of the main cuvelai, covering about 30 to 50 km on each side. In the Eastern regions, the Caprivi area in particular, the water overflowing the Zambezi River and the water level rise in the swampy areas inundated the roads. These waterways traverse flat grounds and allow water to stand along the road intermittently. In the road sections where water was standing and overflowing roads, the base material was soaked and has created rampant potholes, which need base correction and resealing.
The major failure, the collapsing of the road and drainage structures, appears on the stretch of roads where these water ways are crossing. These water ways create ponds which cover areas up
18 Unproclaimed roads are mainly tracks serving villages and farms, and are not managed by the Roads Authority

Namibia Post Disaster Needs Assessment 84
Page 84
to three km in length. In some locations where the roads were not provided with adequate cross drainage the roads acted as a dike and exacerbated the pooling of rain and flood water.
The effect of the flood was greatest between February and April 2009. During this period some district (tertiary) roads were cut off. The trunk and main roads, which were constructed to standards, survived the flood. Along such roads, closures were not observed, but in specific spots there were overflows that damaged shoulders of the roads. In four locations, along T1/11 (trunk road) culverts collapsed and traffic was diverted to bypass roads. Borrow pits where gravel is extracted from were inundated and there was only one location in the Oshana and Omusati region that was not under water; material had to be hauled over 100 km for emergency maintenance activities.
The roads running East – West appear to be more vulnerable to the flood that was flowing from the north (Angolan side) to the south (Etosha pan) in the cuvelai basin. The flood water flow was slow and the water level in pans (low grounds) rose gradually. The road linking Outapi to Oshango sustained the most damage, which was overrun at about 14 locations. The culverts installed along this road were neither adequate to allow quick draining of the water nor sufficient to equalize water in the Oshanas’ ponds. In total nearly 408 km of roads were fully or partially damaged.
Storm water drains to intercept overflows from built up areas were generally missing from roads in the measure towns (Oshikati and Ongangwa), causing the roads to be flooded. Roads in urban areas were under water. In Oshakati, the biggest town in the area, about 90 percent of the roads were under water. Roads in Ondagwa town were also heavily damaged by the flood.
Access roads, mainly tracks, linking district roads to basic services, such as schools, clinics and markets were also under water. Similarly, access roads from homesteads to schools and clinics were inundated by flood and rain water. Roughly 337 schools were closed completely or partially due to lack of access to school premises. School children were forced to stay home; the public was unable to get to health centres.
Rail transport was less affected by the flood and no traffic disruption was reported. The existing rail line between Tsumeb and Ondangwa was not affected by the flood and rain water. Minor damage caused by rainwater was observed at the approaches of an over-‐pass bridge at Ondangwa and the fence at the Ondangwa station. The embankment, under construction, between Ondangwa and Oshinkago (Angolan border), was over-‐run in one location, but a new culvert was installed and the embankment was repaired.
However, culverts in the flood areas need to be checked for adequacy, to confirm if there is a need to install equalizers and allow water to move across. Overall, the rail line runs North-‐South, the same direction as the flow of the flood and rain water, and, it may not be a cause for holding-‐up flood and rain water.
No damage or service disruption occurred to air transport; rather it was the main transport mode for rescue operations.

Namibia Post Disaster Needs Assessment 85
Page 85
The overall damage to the roads in the six regions was estimated at N$223 million, as shown in Table 41.
Table 41: Extent of Damage in the transport sector (N$ million)
Damage Estimate (N$ million) Damage to primary/trunk roads 0.1 Damage to secondary/main roads 18.2 Damage to tertiary/district roads 166.0 Damage to urban roads 33.8 Damage to bridges and culverts 5.0 Total(Immediate) 223.2
Traffic movement was limited to intermittent sections not covered by water, and few light vehicles were in operation for about 30 to 45 days. The loss sustained by road transport operation, which was related to vehicle operating cost, was about N$3.4 million. The loss was relatively low, since heavy vehicles had stopped operation and the light vehicles were shuttling between slices of roads, which were in functional. In addition, the emergency repair work enabled traffic to get back on the damaged roads in a short period. The loss to operators is not included in this assessment, as the transport service was less commercial in nature, and the probable redeployment of vehicles to other routes.
Table 42: Estimated losses in the transport sector (N$ million)
Type of Loss Estimate (N$ million) Loss related to vehicle operating cost between flood occurrence and emergency repair
1.0
Loss related to vehicle operating cost until damage reconstruction completion19
1.4
Cost incurred to provide boats 1.0 Total 3.4
Disaster Risk Management Issues
Roads design standards should be upgraded to safety levels which take into account precipitation levels, flood patterns, ground water pressure, and climate change effects. The recommended risk management approaches for moderate flooding are: (i) Raising embankments to avoid frequent overrunning; (i) Providing adequate drainage structures; (iii) Upgrading selected roads to paved road standard, and re-‐graveling other roads with non slippery gravel material; and (iv) Regular preventive maintenance.
Prior to raising roads affected by previous flooding, it is important to conduct hydraulic studies to determine the optimal number and size of the drainage, otherwise the road could raise water levels artificially upstream or act as levees when they run parallel to the river.20
19 The financing resource for reconstruction is assumed to be released immediately and works will be completed before the rainy season
20 ISDR. 1998. Guidelines for Reducing Flood Losses. The UN International Strategy for Disaster Reduction. Geneva.

Namibia Post Disaster Needs Assessment 86
Page 86
It is especially important to ensure safe road access to schools, clinics, markets and critical public infrastructure and improve access to villages and homesteads vulnerable to flooding. Urban storm water management requires more comprehensive planning. Rainwater and over-‐spilling water from the outskirts of townships can be carried away by a storm water system constructed as part of the urban roads.
Reconstruction Needs
The reconstruction appears to be carried out into stages. First, to open the roads to traffic, emergency repair work was carried by the Road Authority and the roads are passable, except in few locations where the traffic has to use short distance bypasses. The Road Authority has spent about N$ 18.8 million, for the emergency repair and has carried out commendable work that ensured restoration of traffic movement to acceptable level.
Second, to bring back the roads to pre-‐flood condition the road sections that were fully damaged have to be reconstructed to a state which will be functional during the rainy season. Further, the damages to the pavements have to be corrected and proper re-‐gravelling and surfacing work has to be carried out shortly. This is an immediate task that requires about N$ 223 million, including the amount spent on emergency repair in the amount of N$ 18.8 million.
As a matter of urgency, the roads that are vulnerable to flooding have to be provided with adequate drainage structure. Bridges and culverts have to be installed at locations where there is running as well as standing water. This emergency mitigation measure costs approximately N$ 193 million.
Needs to make Roads flood Resilient
In the event of heavy rain and flooding reoccurring in these areas, of the magnitude that occurred in 2009 or higher, there is a need to take appropriate mitigation measures and make the roads flood resilient. Based on the nature and extent of the flooding observed over the last two years the following road upgrading and improvement works are proposed for consideration. In general, the mitigation measures that will help to create flood resilient roads in rural and urban are estimated to cost N$ 2.6 billion.
The roads in the cuvelai basin, mainly the districts roads, were not constructed up to standards capable of withstanding heavy rain and flooding as well as allowing quick movement of excess water. This calls for improvement in the standards for main and district roads vulnerable to flooding and heavy rain storms. Two approaches were considered to mitigate this problem. These actions are estimated to cost about N$ 1.6 billion, without provision for inflation, and could be implemented over a period of three to five years, depending on availability of funding.
First, upgrading selected roads to paved road standards, installing adequate drainage structures, and raising the embankment to avoid frequent overrunning are suggested. Second, improving roads vulnerable to moderate flooding by: i) raising embankments to desirable level, ii) providing adequate drainage facility, and iii) re-‐gravelling with non-‐slippery gravel material. Major drainage

Namibia Post Disaster Needs Assessment 87
Page 87
structures on these roads are considered to be constructed as part of the emergency reconstruction program. The roads proposed for consideration are presented in Table 43.
Table 43: Roads Proposed for Upgrading (N$ million)
Road No. Road Name Length (km)
Cost Estimate (N$ million)
M120 Oshakati-‐Endola-‐Onhuno 42 176.0 M121 Oshigambo-‐Eenhana 43 60.3 M125 Katima-‐Linyanti-‐Kongola 186.85 300.0 D3603 Onayena-‐Okankolo 34 42.0 D3615 Oshikuku-‐Elim 16 20.0 D3608 Omafo-‐Outapi 99 227.0 D3639 Omafo-‐Ondobe 31 49.0 D3607 Oshakati-‐Ompundja 14 44.0 D3638 MR92-‐Ongha 27 36.0 D3625 Oshigambo-‐Ondobe 31 38.0 D3508 T8/7-‐Isize 20.9 26.0 D3510 Bukalo-‐Kabbe 26.2 32.0 D3403 Divundu-‐Mohembo 113.9 139.0 D3616 Tsandi-‐Onesi 28 35.0 Total Road Upgrading 712.85 1,224.3
Table 44: Roads Proposed for Improvement of Embankments and Drainage Structures
Road No Road Name Length (km)
Cost Estimate (N$ million)
D3653 DR 3608 -‐ Oneleiwa 7 5.1 D3648 Ogongo -‐ Olutsiiidhi 23 74.6 D3641 Olupaka-‐Onesi 27 19.5 D3633 Tsandi -‐ Ongulumbashe 22 12.6 D3617 Onesi -‐ Otjorute 43 5.1 D3619 MR111 -‐ Onaanda 15 4.1 D3644 Ompundja -‐ Eheke 14 11.3 D3636 Eheke -‐ Onakamwandi 27 23.1 D3637 Okapya -‐ Ohalushu 27 19.5 D3605 Ondangwa -‐ Uukwiyu -‐
Uushona 16 7.6
D3629 Onethindi – Olukonda 14 4.4 D3645 Onanke -‐ Omuntele 41 29.6 D3606 Onmagundo -‐ Okashandja 6 4.7 D3507 Bukalo (T8/7) -‐ Silumbi 59.67 53.7 D3501 Sibinda (T8/6) -‐ Linyanti 43 38.7 D3520 Namalubi (T8/7) -‐ Kalumba 9.11 8.2 D3514 Ngunkwe(MR125) -‐ New
Kuwena 32.85 29.6
Total Road Improvement 426.63 351.4
A critical issue that emerged from this disaster was access to basic services and the absence of drainage facilities to protect urban roads. Even though some schools and clinics were built on higher ground, the access roads, mainly tracks, were under water and inaccessible to children and

Namibia Post Disaster Needs Assessment 88
Page 88
those who needed to reach health centres. In urban areas the storm water drains of roads, which are supposed to intercept overflows from built up areas, are missing and all roads in the main towns (Oshikati and Ongangwa) were under water. Access to telecom towers was also a challenge.
There is great demand for access roads to schools, clinics, markets and critical public infrastructure to be built to a standard that allows for movement in difficult weather situations. Such roads are shorter in distance, but many in number and may not be constructed in a short time. Therefore, the construction of about 300 km roads to connect schools and clinics that are located far from all weather roads is initially proposed. To improve access to villages and homesteads that are vulnerable to flood, about 300 km of roads are proposed for construction, as a pilot. The selection and prioritization of these roads should be carried out by local councils while at the initial stage the execution is suggested to be the responsibility of the Road Authority. In future scaling up operations, the engagement of regional and local councils might be considered. To create employment and reduce cost of construction and maintenance, these roads could be assembled using labour intensive methods.
Table 45: Access to Basic Services (Initial Intervention)
Road Type Length (km)
Cost Estimate (N$ million)
Improved access linking schools and clinics to all weather roads
300 340.0
Improved access linking villages/ cluster of homesteads to market and basic services
300 340.0
Total 600 680.0
Storm water management, in urban areas, requires a comprehensive solution. Flood water from outside the towns should be diverted before causing disruption to township. However, rain water and over-‐spilling water from the outskirts of townships should be carried away by storm water systems to be constructed as part of the urban road system. In this regard, proposals from the towns, Oshakati and Ondangwa, to improve the storm water management system and construction of critical bridges and roads are included in the needs assessment
Table 46: Urban Roads Improvements and Rain Storm Water Management
Activity Cost Estimate (N$)
Ondangwa Town Council storm water management and roads improvement 29.5 Oshakati Town council storm water management 107.0 Total 136.5
Total needs: In total, the financing needs for reconstruction and mitigation (making the roads in these areas flood resilient), without provision for inflation, are in the amount of N$2.8 billion.
The proposed investments suggestion could be aligned with Programme 1 of the transport sector in NDP3 where 2,000 km of rural gravel roads are proposed to be constructed, 300 Km of rural access

Namibia Post Disaster Needs Assessment 89
Page 89
roads improved to bitumen standards and 1,200 K of trunk and main roads improved to bitumen. However, they will be on top of NDP3’s investments.
NDP3 is suggesting to upgrade and to construct more roads compared to PDNA for obvious reason, since the NDP3 covers all the country. And this shows that there is a capacity to implement the roads suggested to upgrade and construct by the PDNA
The PDNA suggestion is to upgrade 262 km main roads and 450 km rural (district) roads to bitumen standard and improve about 426 km rural (district) roads. Some of the rural (district) roads when upgraded will move to main road. The roads identified by the PDNA could thus help to determine the roads to be upgraded under NDP3. The PDNA also suggests constructing about 600 km access roads while NDP3 anticipates 2000 km and this shows the 600 km access roads could be constructed within the NDP3 framework.
The construction industry has the benefit of tapping into the well developed capacity in neighboring countries. In addition, it gives the opportunity for the development of the local construction industry.
Preventive maintenance measures are an important factor in reducing damage and it is also essential to develop a maintenance strategy that will help to cope with the changes. It is also worth assessing the impacts of such incidences on maintenance cycles and road life maintenance costs, in order to develop and plan appropriate improvements.
The use of water transport in areas like the Caprivi region, particularly during the flooding period, is an idea that came strongly recommended by the local population. No damage was observed or reported on the existing telecom towers and ground cables. In most cases the towers were located on higher ground and the main problem was gaining access for maintenance purposes. Since the ground cable cover was made of water resistant material, the draining of manholes has continued with little difficulty. The operators have not reported loss in revenue associated to the flooding. Therefore, this report doesn’t contain a damage and loss estimate for the telecom sector.
However, towers in some places (e.g. Onesi town) were built on outlets of culverts and verges of flood pans, which is an issue to be considered by the operators before future rainy seasons.
Postal services also were not affected by the flooding and no damage or loss was reported.

Namibia Post Disaster Needs Assessment 90
Page 90
Annex 3: Energy
Pre-‐Disaster Situation
Generation and transmission: Nampower is the national utility responsible for generation and transmission of electricity throughout the country. The total installed generation amounts to 386.4 MW provided by the following stations:
-‐ Ruacana Hydro Power Station: Situated on the Kunene River in the northwest. This station is used for base load purposes during the rainy season and as a peak load station for the rest of the year. Power production at this station was not affected by the flood in the neighbouring regions. The capacity is 3 X 80 MW.
-‐ Van Eck Coal Fired Thermal Power Station: This station is situated in Windhoek and utilizes coal imported from South Africa. The station is only run on an emergency standby basis. The capacity is 4 X 30 MW.
-‐ Paratus Diesel Fired Power Station: This station is situated in Walvis Bay and is used as a peak load station. The capacity is 4 X 6.4 MW
The remainder of the power requirement is imported from neighbouring countries including Zimbabwe, Zambia, South Africa and Mozambique. Namibia is chiefly dependent on South Africa for importing power.
Current national maximum demand stands at approximately 445 MW. The national maximum demand was only marginally affected by the flood during February 2009. The transmission and subtransmission facilities under Nampower control exceed 988 km (400 kV), 521 km (330 kV), 1960 km (220 kV), 1876 km (132 kV) and 14,655 km (66 kV and below).
Distribution: The distribution sector is currently undergoing restructuring. Currently three regional electricity distributors (RED’s) have been established. These RED’s are owned jointly by Nampower and the local municipalities in the area.
Erongo RED serves customers in the western part of the country including Walvis Bay, Omaruru and Usakos; CENORED serves the central and near northern areas including Tsumeb, Grootfontein, Oshivello and Otjiworongo; and NORED serves the far northern areas from Ruacana to Katima Mulilo. Oshikati town is supplied by Oshikati Premier Electric (OPE) which takes supply directly from Nampower. This company is owned by the Oshikati Municipality.
In the remainder of the country electricity is supplied by municipalities in urban areas (including Windhoek) and by Nampower in rural areas. The Central RED, including Windhoek, Rehoboth and Gobabis and the Southern RED including Mariental and Keetmanshoop are yet to be established.
Damage and Losses Assessment
Damages in the NORED and OPE areas of supply: NORED and OPE were the only utilities in the country to suffer damages as a result of the floods and storms which occurred in 2008/2009. The

Namibia Post Disaster Needs Assessment 91
Page 91
generation and transmission infrastructure of Nampower did not suffer any damage as a result of the disaster. Damages were limited to distribution infrastructure.
Infrastructure damage occurred in the Ohangwena, Oshikoto, Oshana, Omusati, Kavango, and Caprivi Regions. No damage occurred in the Kunene Region. NORED does not operate according to regional boundaries hence it is not possible to provide a damage assessment in each region within Omusati, Ohangwena, Oshana and Oshikoto. This assessment thus indicates infrastructure damage data for Omusati, Ohangwena, Oshana and Oshikoto on a consolidated basis while Kavango and Caprivi Regions are listed separately.
Lightning strikes resulted in more than 50 percent of the damage caused to the network. This was further exacerbated by long MV line lengths (more than 100km in some cases) in the NORED area of supply which resulted in amplification of voltages caused by lightning. A number of wooden distribution poles were also destroyed by lightning strikes as well as a section of overhead line.
Rising water levels resulted in damage to ground mounted switchgear, transformers and kiosks. The majority of this damage occurred in the towns of Ondangwa and Oshikati which utilize underground reticulation in some parts. Some parts of the overhead network also utilize ground mounted kiosks and these units sustained damage.
The damage to the electricity infrastructure was not extensive compared to that normally sustained during floods, cyclones and other natural disasters. It is important to note, however, that it is highly probable that the lifespan of certain equipment may have been shortened by the effects of the flood. It is extremely likely that the insulation of certain equipment has been damaged to a limited extent and that this damage will result in early failure. It is thus necessary to make provisions for the replacement of such equipment within a shorter period than normal.
The following table contains details of the damages to electricity infrastructure in the Omusati, Ohangwena, Oshana and Oshikoto regions. Table 47: Damages incurred due to 2009 flood and storms (Omusati, Ohangwena, Oshana and Oshikoto )
Type of Equipment Replacement Cost (N$ million)
Transformers 1.5 Kiosks 0.2 Poles 11 m 0.1 Surge Arrestors 0.1 Cables Underground 3.6 Switchgear 0.2 Engine overhauls 0.2 Early failure provision 0.5
TOTAL 8,205,560
This damage assessment covers infrastructure for both the NORED and OPE. The towns of Oshikati and Ondangwa both have a high percentage of underground networks. This resulted in extensive damage to cables and ground mounted equipment such as kiosks and switchgear. Damage in

Namibia Post Disaster Needs Assessment 92
Page 92
Omusati, Ohangwena, Oshana and Oshikoto is also higher than in the other regions due to the destruction of three large transformers by lightning.
Damage to utility vehicles as a result of water has been included in the assessment. In addition provisions have been made for covering the costs of replacing equipment which is yet to fail due to partial damage of insulation.
The following tables contain details of the damage to electricity infrastructure in the Kavango and Caprivi Regions.
Table 48: Indication of damages incurred due to 2009 flood and storms, Kavango Region
Table 49: Indication of damages incurred due to 2009 flood and storms, Caprivi Region
Type of Equipment Replacement Cost (N$ million)
Transformers 0.1 Poles 11 m 0.02 Surge Arrestors 0.02 Distribution Line 0.05 Early failure provision 0.05
TOTAL 0.2
The damages incurred in these regions are considerably lower than in the case of Omusati, Ohangwena, Oshana and Oshikoto. Almost no damage to electrical equipment occurred as a result of flooding due to the reticulation network being overhead. Lightning strikes were the main cause of failure of small transformers and destruction of wooden poles. The substation at Ngoma was surrounded by water and was inaccessible. The substation remained undamaged.
It should be noted that three villages in Caprivi with electricity infrastructure were submerged by the flood. These villages have not been connected to the NORED network because of lack of capacity and hence no data is available concerning damage to this infrastructure.
Total damages incurred by NORED and OPE amounts to N$ 8,646,666.
Losses in NORED and OPE areas of supply: Losses were calculated on the basis of revenue lost by the distribution utilities as a result of the disaster. The losses are calculated for the three areas of (i) Omusati, Ohangwena, Oshana and Oshikoto; (ii) Kavango; and (iii) Caprivi. The calculation is based on the difference in energy sold in February 2009 and the average of energy sold during the previous 12 months. The calculation has been made for each feeder metered by Nampower
Type of Equipment Replacement Cost (N$ million)
Transformers 0.1 Poles 11 m 0.04 Surge Arrestors 0.01 Early failure provision 0.05
TOTAL 0.2

Namibia Post Disaster Needs Assessment 93
Page 93
supplying the affected areas. Sales of electricity rebounded extremely rapidly and in most areas March 2009 sales compared favorably with the average of the previous 12 months. This was due to the restoration of supply to most areas in a short period of time.
The following table indicates losses incurred by NORED and OPE in Omusati, Ohangwena, Oshana and Oshikoto.
Table 50: Losses incurred due to 2009 flood and storms. (Omusati, Ohangwena, Oshana and Oshikoto )
Location Revenue Losses N$ Temp Supplies TOTAL
Oshikati 166,649 100,000 266,649 Ondangwa 141,404 100,000 241,404 Remainder 312,574 312,574
TOTAL 620,629 200,000 820,627
The losses indicated are approximately 10 percent of the damages sustained in Omusati, Ohangwena, Oshana and Oshikoto. Losses in Oshikati were sustained by OPE and the remainder by NORED. The levels of damage were higher in Oshikati and Ondangwa due to the underground network which sustained more damage than the overhead network. Losses were sustained when feeders were switched off due to distribution equipment failure or flooding of customer premises. Electricity supply was provided to the temporary camps in both Ondangwa and Oshikati resulting in the costs indicated in the table above. These costs included labour, material and energy components.
With respect to the rural areas, the worst losses occurred in the Oshana Region where approximately 1,900 houses, seven schools and three clinics were disconnected. In the Omusati region a total of 1,400 houses, six schools and six clinics were disconnected. The majority of these customers have been reconnected. In Ondangwa 950 customers and in Oshikati 930 customers were disconnected. The majority have been reconnected.
It should be noted that the level of electrification of rural communities in Omusati, Ohangwena, Oshana and Oshikoto is only 28 percent. This a contributing factor to the low levels of loss experienced.
Three electrification projects in Omusati, Ohangwena, Oshana and Oshikoto were delayed as a result of the disaster since the contractor could not gain access to the areas to be electrified. The construction program was rescheduled to commence in the Kunene Region and the overall schedule has not been affected.
The following tables indicate losses incurred by NORED in the Kavango and Caprivi regions.
Table 51: Indication of losses incurred due to 2009 flood and storms, Kavango Region
Location Revenue Losses N$ Temp Supplies TOTAL
Kavango 231,977 0 231,977
TOTAL 231,977 0 231,977

Namibia Post Disaster Needs Assessment 94
Page 94
Table 52 Indication of losses incurred due to 2009 flood and storms. Caprivi Region
Location Revenue Losses N$ Temp Supplies TOTAL
Caprivi 255,299 0 255,299
TOTAL 255,299 255,299
The levels of loss and damage in these regions are similar. The vast majority of the networks is overhead and thus sustained less damage than in Omusati, Ohangwena, Oshana and Oshikoto. Fewer customers were disconnected and all have been reconnected with the exception of the Mabusha Clinic and Sarasunga Lodge in Kavango and the Mukusi River Lodge in Caprivi, which are still without electricity.
The loss was caused by consumers being disconnected because of distribution equipment damage rather than general flooding. No electricity supplies were provided to temporary camps in these regions.
It should also be noted that the electrification rate of rural communities in Kavango and Caprivi regions is estimated to be only 15 percent. This is a contributing factor to the low levels of loss experienced in these regions
Total losses incurred by NORED and OPE amounts to N$ 1,307.03.
Disaster Risk Management Issues
The following risk mitigation program is proposed.
Technical Issues: Choice of Technology: Technical standard and specifications are well developed and utilized by both OPE and NORED. Extensive use has been made of underground distribution systems in the major towns. While it is clearly not financially feasible to re-‐build these networks in an overhead configuration, it will be possible to flood proof the network to a reasonable degree to minimize future damage. This can be accomplished by lifting kiosks and switchgear to a suitable height off the ground in flood prone areas. The towns of Ondangwa and Oshikati are high priorities in this regard. In some cases use is made of ground mounted kiosks to distribute individual supplies from overhead systems in both urban and rural areas. These kiosks also need to be lifted to a suitable level to avoid damage by flooding. A risk mitigation project needs to be developed and implemented to flood proof existing networks as effectively as possible.
Apart from flood proofing the existing network, a detailed review of the policy defining choice of technology for new electricity distribution networks in the area needs to be undertaken. While there is currently a preference for utilizing underground networks in more affluent areas, it is clear that a revised policy needs to be developed as part of a risk mitigation program to ensure that the most appropriate technology is used to ensure minimal damage by future storms and floods in the region.
Technical issues: System Protection: Extensive damage occurred to transformers and surge arrestors due to lightning damage during the disaster period. Due to the large geographic area

Namibia Post Disaster Needs Assessment 95
Page 95
being served by NORED, use is made of extremely long Medium Voltage lines, many operating with minimal load. This situation increases the risk for damage to occur. In order to minimize future damage due to lightning, there is a need to conduct a technical study to determine methods of improving protection levels and mitigating against risk of extensive damage to the network in the future. Recommendations of the study should then be implemented as part of a risk mitigation program.
Management Issues: Management Information System (MIS): While OPE clearly has a well developed management information system in place and reported rapidly and accurately on the damages and losses caused by the flood as well as the progress with reconstruction, NORED demonstrated a lack of capacity in this regard. It should also be noted however that NORED covers a very large geographic area of supply and has only been in operation for seven years while OPE only supplies Oshikati town and has been in operation for a long period formerly as a municipal department.
The following data was not readily available from the NORED MIS: number of pre-‐payment customers and their location, reports on pre-‐payment customer consumption, details on disconnections and reconnections, details on equipment damaged by disaster, exact progress on reconstruction, and costs incurred because of disaster.
In order to manage future disaster situations effectively and to minimize the impact on customers, an effective MIS is essential. Such a system will clearly improve day-‐to-‐day efficiency as well as equipping the utility to cope with disaster situations.
As part of a risk mitigation program, it is recommended that an assessment be carried out of the existing MIS in NORED and recommendations made concerning upgrade of the system and associated management processes. In addition, an assessment needs to be made of the human resources capacity available to manage an improved system and recommendations made to improve the capacity if required.
Management issues: Disaster Management Plan: Investigations revealed that neither utility has developed a disaster contingency plan. This is clearly a deficiency and attention needs to be given to the development and implementation of such a plan for both OPE and NORED to enable the utilities to cope more efficiently with future disasters. This project will form part of the risk mitigation program for the sector.
In summary it is recommended that a risk mitigation program be implemented covering the technical and management aspects described above. Such a program will comprise technical assistance and project implementation in each case. The program will provide a considerable level of risk mitigation regarding future disasters of this nature.
Needs
OPE and NORED commenced reconstruction of the network as soon as it was possible to gain access to the affected areas. The majority of the required equipment was held in the stores of NORED and OPE. Temporary supply cables were connected to restore supply to customers in Ondangwa. The permanent network is currently being reconstructed.

Namibia Post Disaster Needs Assessment 96
Page 96
Connections to rural customers in Omusati, Ohangwena, Oshana and Oshikoto and clinics and lodges in Kavango and Caprivi will be restored once the premises are accessible. There is a possibility that the lodges may re-‐locate due to extensive flood damage and potential risk of future flooding.
Reconstruction costs have been financed by the utilities themselves.
While the reconstruction process in this sector is almost complete, attention needs to be paid to developing programs to mitigate risk of possible damage by similar natural occurrences.

Namibia Post Disaster Needs Assessment 97
Page 97
Annex 4: Agriculture, Livestock and Fisheries
Introduction
The agricultural sector, which includes crop production, livestock, forestry and fisheries, accounts for about 10 percent of GDP, yet an estimated 68 percent of the population derives at least part of its income from agriculture and forestry. Unlike in many Sub-‐Saharan African countries, agriculture does not play a central role in Namibia’s economy. The extraction sector is the leading sector economically. However, the agriculture sector employs 47 percent of the nation’s labour force. Subsistence farming is the main source of income for almost 40 percent of households in the country. Livestock production accounts for 75-‐80 percent of agriculture’s contribution to GDP. Annual per capita income from farming in the sub-‐sector is approximately N$260. Namibia has six major food producing regions, all of which are located in the northern portion of the country. These are: Omusati, Oshana, Oshikoto, and Ohangwena (collectively referred to as the north central regions) and Kavango and Caprivi (collectively referred to as the northeast regions).
Namibia’s cultivable area is estimated to be 25 million ha. In 2002, the cultivated area was 820,000 ha, of which 816,000 ha was arable land; the other 4,000 ha were under permanent crops, accounting together for about 1 percent of the total land area of the country and 3 percent of the cultivable area. Total water consumption in Namibia was 300 million m3 in 2000. Agriculture was the largest water user accounting for 213 million m3, of which 136 million m3 was for irrigation (45 percent of total) and the remaining 77 million m3 for livestock (26 percent). In 2002, 7,573 ha were equipped for irrigation, representing less than 1 percent of the cultivated area. The main irrigated areas include schemes along the Okavango River and with about 1,350 ha equipped area and schemes on the Zambezi River. In addition, flood recession cropping (mainly maize) is practiced in the flood plains of the Okavango and Zambezi rivers. The Government of Namibia has adopted a Green Scheme Policy which aims to develop some 20,000 hectares of irrigated agriculture in a joint venture between the Government, commercial, and small holder farmers. Commercial farmers are expected to provide irrigation services to small-‐scale farmers associated with the Green Scheme.
The agricultural sector is divided into a commercial farming sub-‐sector, where farms are privately owned, and a communal farming sub-‐sector, where farmers operate on lands that are held in communal tenure. The communal areas directly support 95 percent of their population, but occupy only 48 percent of the total agricultural land. Farmers in the communal areas are mainly engaged in subsistence agriculture and extensive livestock production. The commercial farming sub-‐sector occupies about 36.2 million ha which are mainly used for extensive ranching, accounting for 72 percent of agriculture’s contribution to the GDP, and provides employment for about 8 percent of the working population. The Namibian Agronomic Board produces and disseminates market prices for food staples. Controlled crops include millet, maize, and wheat.
The Ministry of Agriculture, Water and Forestry has a mandate to promote, develop, manage and utilize agriculture, water and forestry resources. The Ministry of Fisheries and Marine Resources has the overall mandate for promoting sustainable fish production both inland and marine. The Government of Namibia has adopted comprehensive policies for each of the agricultural sub-‐

Namibia Post Disaster Needs Assessment 98
Page 98
sectors, including an Agricultural Policy (1995), a National Drought Policy (1997), a Seed Policy (2005), a National Forest Policy, and a National Fisheries Policy (1991). Associated legislation has been prepared and enacted.
The National Assembly adopted the Decentralization Policy in 1997 and passed the Decentralization Enabling Act in 2000 to ensure that government services are brought closer to the people. Regional councils and local authorities have been established in accordance with the Regional Councils and Local Authorities Acts that was enacted in August 1992. A Trust Fund for Regional Development and Equity Provisions Act was passed in 2000. The Act provides for financial and technical support to development projects in regions and local authorities.
Functions are being decentralized in two phases—delegation and devolution. During the first phase, sub-‐national governments are delegated to perform certain tasks on behalf of the line ministries. During the second phase, decentralization takes full effect and sub-‐national governments have the full responsibility over the tasks delegated to them. So far, only one of the functions earmarked for decentralization in the Decentralization Policy, rural water supply, has been handed over to regional councils.
Pre-‐Disaster Situation
Agricultural production in the four north central and two northeast regions is mainly for subsistence and, despite the events of the past two years, crop production is generally constrained by low and erratic rainfall. Rain-‐fed agricultural production is only possible in areas receiving more than 400mm annual rainfall, which is the case for 34 percent of the country’s land mass. The sector is strongly influenced by climatic conditions and as a result the contribution to the GDP has varied between 6.8 percent and 12.3 percent since 1990, with low contributions in drought years. Crop production is further constrained by low soil fertility and low water retention capacity. Timing, amount and intensity of rainfall are critical determinants to output. Input use (fertilizer, improved seeds, agro-‐chemicals) is generally low.
The Ministry of Agriculture reports that there are 121,141 farming households in the north central regions, supporting an average of seven to eight people per household. Most farm plots range from two to five hectares. Mahangu, or pearl millet, accounts for approximately 95 percent of crops planted in the region, with sorghum making up the other five percent. In the northeast region, maize is by far the most important crop. There are only two major irrigation schemes in the north central region, the Etunda Irrigation Scheme near Ruacana in Omusati and a privately-‐owned irrigation scheme near Tsumeb. The Etunda Irrigation Scheme totals just over 2,000 ha and produces mostly maize, followed by wheat. There are six formal irrigation schemes in the northeast regions, five of which are located in the Kavango region. These five schemes have been developed by the GoN in an effort to attract private investment in irrigation development, in accordance with its Green Scheme policy. Private sector service providers are expected to provide irrigation and marketing services to small-‐scale farmers that have been settled within the schemes. In addition to formal irrigation, many farmers, living in close proximity to the regions’ many waterways, practice a variety of traditional irrigation methods, including small pumps, buckets and a variety of in-‐situ water management practices. As subsistence farmers generally have no access to irrigation, the

Namibia Post Disaster Needs Assessment 99
Page 99
planting calendar in the north central and northeast regions is dependent on the weather patterns. Crop planting in the north central and northeast regions commences with the beginning of the rainy season, generally between November and December.
On average, growth in food production increased very modestly, with important variation in all the six regions. While Oshana, Kavango and Caprivi had the least annual variations in food production, the other three regions had important annual variations that deserve in-‐depth analysis. Overall, Omusati, Ohangwena and Oshitoko Regions had the highest contribution to the national food production with 24, 22 and 21 percent respectively. Much of this growth has been achieved through area expansion, and yields have remained nearly steady over the past ten years. Except for the period of 2004–2006 when yields ranged between 2.4 and 3 tons per ha, in the rest of the period they remained between 1 and 1.6 tons per ha, for an average of 1.9 tons per ha in the period. On the other hand, cultivated area has on average remained the same over the past ten years. Horticulture production, including onions, tomatoes, potatoes, cabbage, watermelons, and sweet melons, has increased since 2002 in an effort to reduce imports of these products from South Africa. Table 53, below, presents the historical aggregate coarse grain production for the flood-‐affected regions as well as the national totals.
Table 53: Namibia: Total Cereal Production History ('000 tons)
Region/ Sector
1998 -‐ 1999
1999 -‐ 2000
2000 -‐ 2001
2001 -‐
2002
2002 -‐
2003
2003 -‐ 2004
2004 -‐ 2005
2005 -‐
2006
2006 -‐ 2007
2007 -‐ 2008
2008 -‐ 2009
Caprivi 9.0 16.1 11.3 8.4 8.7 9.7 9.0 12.6 8.2 9.0 8.6 Kavango 6.9 11.7 6.4 3.2 8.9 9.5 9.2 9.8 4.1 4.8 11.4 Omusati 21.7 12.4 35.1 17.0 14.0 22.6 21.3 28.0 13.8 8.9 27.4
Ohangwena 22.3 14.8 17.6 10.5 11.3 26.5 18.7 38.2 13.6 10.4 26.3
Oshana 11.6 13.9 17.9 6.5 7.7 9.6 8.3 12.9 5.7 5.4 10.5 Oshikoto 36.1 18.4 17.0 8.8 11.1 23.1 20.5 25.1 10.1 8.9 22.8
Commercial 13.8 14.9 41.1 29.7 33.6 36.5 66.9 52.4 60.9 58.2 58.2
Namibia 121.5 102.2 146.5 84 95.2 137.5 154.4 179 116.4 105.7 165.1
Source: Crop Prospects and Food Security Situation Report, March 2009 (Namibia Early Warning and Food Information Unit)
In addition to subsistence crop production, small private and communal fish ponds are found throughout the north central regions. The Government of Namibia, in conjunction with the Spanish Corporation, has developed the Inland Aquaculture Centre (IAC), located near Otapi in Omusati. The IAC provides training to interested farmers and communities who wish to develop a fish pond. Fingerlings are provided at subsidized prices and the IAC makes follow up visits to ensure that the ponds are being maintained. The fish produced from these ponds are generally consumed on-‐site or sold in very small quantities.
The food security situation was a challenge prior to the 2009 flooding due to the flooding in the north central and North-‐Eastern regions in 2008, combined with infestations of armyworm. The

Namibia Post Disaster Needs Assessment 100
Page 100
United Nations World Food Program (WFP) published an assessment of food security in June 2008 that revealed that 33 percent of households in Caprivi and 16 percent of households in the north central regions were food insecure before the 2009 floods. After the 2008 floods, a total of 146,000 people were estimated to require emergency assistance in the rural areas of the north central and North-‐Eastern regions in order to maintain their household food security and to avoid a deterioration of nutritional status and poverty level after the floods. Most of the population (80 percent) was identified to be in the north central regions. Entering the 2008/2009 growing season, the National Early Warning and Food Information System (NEWFIS), reported concerns among farmers regarding seed availability for planting. Severe flooding from 2008, preceded by years of drought had had the effect of limiting or exhausting farmers’ stocks. As of the December 2008 Crop Prospects and Food Security Report, published by NEWFIS, all the north central regions as well as the Kavango region were still waiting for improved seeds of mahangu from the Mahenene Seed Co-‐operative.
Early crop production indications for the 2008/09 farming season for both the North-‐Eastern and north central farming region of Namibia were promising due to steady, early rain received starting in October and November. The country’s aggregate coarse grain production (white maize, pearl millet, wheat and sorghum) is provisionally forecasted at 165,129 tons, which would represent an increase in output of 56 percent compared to 2007/08 harvest. In March 2009, the NEWFIS released an updated food security report based on information collected in February 2009.
Damage and Losses Assessment21
Above-‐average rainfall was received in northern Namibia as well as southern Angola starting in January 2009, raising concerns about the season’s prospects for harvests. In the north central regions, the flat, natural topography combined with undersized drainage infrastructure further exacerbated the situation. In the Caprivi Region, the Zambezi River reached its highest level since 1969. Farmers that had planted seeds in November 2008 did manage to harvest some crops; however, most farmers who waited until January 2009 to plant reported total losses. Damages to the agriculture sector are estimated at a floor of N$ 29.1 million and losses are estimated at nearly N$ 140 million, as shown in the table below. Losses were mainly felt in the field crops sub-‐sector.
21 Two other assessments of the crop, livestock and food security situation were made: one by the Namibia Early Warning and Food Information Unit of the Directorate of Planning, Ministry of Agriculture, Water and Forestry (Namibia: Crop Prospects and Food Security Situation Report, July 9, 2009) and one by the FAO and WFP (FAO/WFP Crop, Livestock and Food security Mission to Namibia, July 14 2009). There conclusion are similar to the PDNA.

Namibia Post Disaster Needs Assessment 101
Page 101
Table 54: Estimates of Agricultural Damage and Loss (N$ million)
Sector Disaster Effects Ownership by Sector
Damage Losses Private Public
Field Crops 4.6 101.2 231.2 Livestock 8.9 17.0 42.8
Forestry 3.7 3.2 0.7 5.8
Fish Farms 11.9 6.1 18
Total 29.1 127.5 292.8 5.8 Source: PDNA Team estimates
Table 55: Disaster Impacts to Crop Production
Area Planted Area (ha)
Actual Harvested Area
(ha)
Effect Forecast Production
(tons)
Actual Production (tons)
Effect
North Central Regions
259,400 177,812 -‐31% 87,000 64,850 -‐25%
North-‐ Eastern Regions
35,971 22,755 -‐37% 20,000 13,422 -‐33%
Total 295,371 200,567 -‐32% 107,000 78,272 -‐27%
Source: PDNA Team Estimates
In the North Central regions, Oshana and Omusati were some of the hardest hit. Damage was reported to over 80,000 ha of crop land in the north central regions and over 13,000 ha of cropland in the North Eastern regions. Damage was also reported to granaries used for storage of mahangu. In the north central region alone, FEMCO reported over 86,000 people in critical need of food aid as a result of damages to crop lands. The overwhelming majority of the cropland destroyed belonged to small subsistence farmers, who are particularly vulnerable to disaster impacts. As stated previously, an exceptionally poor harvest in 2008 further exacerbated the situation arising from the 2009 flooding. The timing of the flooding resulted in dramatic, although not total losses, in production because those farmers who planted prior to January 1, 2009 were able to harvest some crops. The Seed Co-‐operative, based in Ohanenene, Omusati, reported an entire loss of crops, which means that it will have to import seed from other countries to sell to farmers.
Representatives from the WFP conducted extensive field research to identify food security needs associated with early recovery for the agricultural sector. This research indicated that the rural populations, who remained with their homesteads to protect their assets during the flood, did not receive the same level of food assistance as people in the urban areas who were relocated to temporary shelters. The population group that did not receive food assistance during the floods relies on the household food stocks and the support from relatives and neighbours. The population affected by the floods that was originally chronically food insecure has developed to acute food insecurity.

Namibia Post Disaster Needs Assessment 102
Page 102
The WFP reported that households that are experiencing acute transitorily food insecurity are mostly headed by subsistence farmers that have lost their mahangu stocks and have experienced estimated losses of 80 percent on average of the main harvest due to the impact of the floods. They are mostly single female-‐headed households, with low crop production, low expenditure per capita, and low livestock ownership in their communities.
The needs in terms of food assistance for the period from March 2009 through March 2010 are shown in the table below.
Table 56: Food Assistance Needs Arising from Flood Damages and Losses
Sub-‐Sector Deficit (tons)
Crops 36,388 Meat 23,365 Milk 29,320,659
Source for Food Assistance Data 2008 WFP Food Security Report. Source for Required Food Quantities FAOStat (Consumption Statistics for Namibia. Source for Unit Prices for Food Import World Bank Commodity Price Data (Pink Sheet June 2009))
There was a significant mortality of livestock, owing to both drowning and flood-‐related disease. Flood-‐related disease also caused significant production losses while animals received treatment. Damages were sustained to two government-‐owned fisheries in the North-‐Eastern regions. In the North Central regions, there are no commercial fish farming operations, however there are numerous small ponds owned by communal farmers that sustained losses due to fish escaping from the ponds when flood waters peaked.
Recovery Strategy
The recovery framework for the agriculture sector can be divided into an early recovery phase, during which the food security needs of the affected population must be addressed; a medium-‐term recovery phase during which the needs of the farmers to replant and ultimately harvest during the 2009/2010 season must be addressed; and, finally a long-‐term recovery phase which should address the recommendations made in the Risk Management Issues section of this Annex.
The early recovery findings and recommendations in this report are drawn from findings of the WFP as part of the PDNA effort (see Annex 11). The food needs arising from the damages and losses are estimated to be over N$ 900 million. As per the findings of the WFP, the rural, vulnerable populations are experiencing transitory acute food insecurity as a direct effect of the floods and are in need of external assistance. Furthermore, the situation can be expected to worsen during August and September, at which point even those famers who managed to reap a small harvest will have exhausted their food stocks. External assistance will be required for approximately one third of the population in the flood-‐affected areas, as shown in the table below.

Namibia Post Disaster Needs Assessment 103
Page 103
Table 57: Population Experiencing Food Insecurity
Area Population Facing Food Insecurity Total Population Percent of Total
North-‐Eastern Region 39,023 280,945 14% North Central Regions 124,684 779,274 16%
Total 163,707 1,060,219 15%
Source: WFP Field work
For farmers who own “big cattle,” selling it can be a key coping strategy as the cash obtained by selling the livestock can cover the food needs of the household members for a long period of time. In the view of the large supply of animals, however, large-‐scale selling of livestock for cash could lead to a rapid drop in price, thus undermining this coping strategy. Typically, whether or not farmers own cattle can often be the dividing line between the poor and non-‐poor, or those needing assistance.
The floods have washed away the stocks of sorghum and mahangu stored from previous harvests as well as from the 2009 harvest; the remaining stocks at the household level are reportedly not likely to last beyond September 2009. The losses of mahangu stocks have reduced the food availability and affect both urban and rural vulnerable households. The rural households are forced to purchase their staple cereal and consume maize meal as mahangu is less available in the flood affected areas. While maize meal is a commodity available in all areas, mahangu is only available in markets in the main cities. Vulnerable households in urban areas that traditionally rely on the mahangu transfers from relatives in rural areas will have to increase their expenses in basic food commodities.
Fishing in communal channels and oshanas was observed to have increased immediately after the flooding as the flood waters brought a larger crop of catfish and tilapia. Fishing became an alternative livelihood for some affected people and increased the available protein. Dried fish are sold in the market and have provided an alternative source of animal protein. After the flooding period, with the recession in the water levels, the fish availability returned to pre-‐floods levels. Farmers and villages with their own ponds who lost their fish stocks in the flood will not have access to that resource until they can restock their ponds.
Disaster Risk Management Issues
A combination of drought and flood has resulted in a downward trend in agricultural production in the North-‐Central and North-‐Eastern regions of Namibia for approximately the past eight years. The north central regions contain the highest concentration of people in Namibia and are projected to become a major economic centre for the country. To that end, cycles of flood and drought will cause significant impediments to growth and must be addressed. In the agriculture sector, provision must be made to ensure consistent crop production levels during periods of climactic extremes of both types. Most importantly, emphasis must be placed on the development of, where possible, multi-‐use water management projects that address both flood control and irrigation. Irrigation schemes will enable farmers to be more resilient to both floods and droughts. With

Namibia Post Disaster Needs Assessment 104
Page 104
irrigation water available, farmers will be able to plant based on a calendar date, for example November 1st, rather than having to wait for the arrival on the rainy season. If crops can be planted earlier in the growing season, they stand a better chance of providing at least some yield should flooding occur during the harvest season. The benefits of irrigation as a means to weather periods of drought are obvious. The ability to irrigate would provide enhanced benefit to the Ministry of Agriculture’s tree planting and distribution program, which is already in progress. Interviews conducted with local farmers who have received fruit trees from the government indicate that fruit trees are not being watered as often as recommended because of challenges related to water supply. Rather, farmers wait until their fruit trees start to flower before watering them regularly which in turn reduces the yield. As stated previously, the agricultural sector in the north central region is predominantly characterized by small subsistence farming homesteads. Therefore, a single regional irrigation project alone may not be the only solution. It is recommended that small-‐scale irrigation schemes be investigated at the village or homestead level in addition to regional schemes. To this end, the consultation with and involvement of headmen is recommended. The national government could support small-‐scale irrigation schemes through the reduction or elimination of import tariffs on irrigation equipment, such as pumps. Even small-‐scale schemes will have multi-‐purpose benefits in terms of risk reduction to the agriculture sector as well as human livelihoods by allowing small farmers to farm on higher ground without compromising their access to water.
Other farming practices implemented both on subsistence farms and commercial farms can improve resiliency to drought and floods. First, modifications are recommended to the ploughing method used in the region. Currently, tractors use a disc harrow for ploughing, which can cover a wide area quickly but has the effect of breaking down the soil and increasing susceptibility to erosion from wind and rain. The preference for disc harrow ploughing relates to the fact that many farmers rely on the services of a few tractor owners to plough their fields. In the case of the 2007/2008 and 2008/2009 harvest seasons, farmers’ ability to use draught animals for ploughing may have been compromised due to flood-‐related diseases, furthering the reliance on rented tractor time. Even with government subsidies, renting tractor time is expensive for many small farmers, generally costing around $300/ha. Given the cost, there is an interest in ploughing quickly. Representatives from the Ministry of Agriculture Oshana Regional Extension office recommended reapers and moldboard ploughs as alternatives to disc harrow to maintain soil structure. Both of these methods, however, require more tractor time than disc harrowing. Hence, in order to encourage these practices, government intervention in the form of subsidies would likely be required.
Diversification through the enhanced emphasis of existing programs and the introduction of alternative crops may also improve disaster resiliency in the northern regions of Namibia. Currently, there are two programs in progress, both of which run through the Ministry of Agriculture. These are the free distribution of fruit trees and the distribution of fingerlings for fish farm operations. Both of these programs are accompanied by training programs as well as on-‐going technical assistance and follow up visits. Fruit trees and fish not only are providing an alternative food source to small subsistence farmers, they also provide supplemental income. Farmers participating in the

Namibia Post Disaster Needs Assessment 105
Page 105
fruit tree program have become remarkably self-‐sustaining, resulting from the quality of the training being offered. Farmers who were interviewed as part of this assessment had been able to replace lost trees because they were experienced in collecting seedlings and other techniques such as budding and grafting. Not only were they able to cope with the effects of the flood in terms damages, they are also able to expand their operations.
A risk to crop production that accompanied the flooding during the 2007/2008 harvest season is an infestation by armyworms. The African armyworm develops during the rainy season and tends to be even more prevalent after prolonged periods of drought. Although armyworms were not reported this year, consideration and planning for dealing with future outbreaks before they occur should be part of the risk reduction strategy for the agriculture sector. It is recommended that the Ministry of Agriculture pursue a program to investigate low-‐cost, environmentally-‐friendly means of treating or preventing outbreaks of armyworms in farming areas throughout Namibia. The United Kingdom’s Research into Use (RIU) Program of the Department of International Development has successfully used using low cost endemic armyworm nucleopolyhedrovirus (NPV) in a spray form to treat armyworm infestations. NPV is non-‐chemical, inexpensive, and environmentally friendly, according to the RIU Program.
Significant damages and losses to livestock in the flood-‐affected areas were sustained due to flood-‐related diseases, namely lumpy skin disease (LSD). This disease can be treated, but it takes animals out of production for at least six months until they are deemed to be fully healthy. It can in many instances be fatal if not treated early. LSD is transmitted through biting flies, which are more prevalent during periods of flood. Flood prevention projects that eliminate large areas of standing water would, therefore, be a measure to protect herds against LSD. Additionally, a vaccination is available to prevent this disease. As stated by the Oshana and Oshikoto Regional Veterinarians, it would be more cost-‐effective to vaccinate animals against LSD preventatively, rather than waiting until the animal is sick and then treating it with both the vaccine and expensive antibiotics and anti-‐inflammatory medications.
Capacity building within the Regional Extension Offices of the Ministry of Agriculture will also be an important component of future risk mitigation. For example, with additional staff more LSD vaccinations could be offered and additional training classes on best practices for both crops and fruit trees could be offered. Staff members interviewed at the Regional Extension Offices have identified many training needs for small subsistence farmers, however, lack of staff capacity was cited for the reason why they have been unable to deliver such services. In addition to staff capacity, other equipment and infrastructure is needed as well. In particular, service vehicles are needed to deliver veterinary services and to provide regular informational visits to farmers in local areas. Finally, the construction of a soils testing laboratory in the north central region would greatly improve the Regional Extension Office’s ability to deliver proper guidance to farmers in terms of fertilizer and other best practices for crop production. For example, in the case of the 2009 flooding, staff at the Oshikoto Regional Extension Office indicated that they suspected that the character of the soil (e.g., pH, salinity, etc) had been altered by the floods, however, they did not have the ability to perform quick soil tests to determine exactly how. With the addition of a

Namibia Post Disaster Needs Assessment 106
Page 106
regional soils testing laboratory, Regional Extension Staff could provide informed guidance each year prior to the planting season regarding recommended soil additives for optimized production.
Governance Issues
Pervasive poverty in the northern regions amplifies the impacts of natural disasters such as droughts and floods, and undermines the capacity of people to adopt adequate coping mechanisms. Given that agriculture is the main economic activity in the north, increasing agricultural output is critical to reduce poverty. Agricultural growth needs to be based on per hectare and per person productivity growth to achieve significant poverty reduction. Strong leadership of the government is required to increase agricultural productivity levels, including adequate policies that clearly identify and assign responsibilities among stakeholders, institutions that are capable to deliver on high expectations, the establishment of a favourable environment for private initiative, and specific support measures that would encourage farmers to invest.
Namibia has adopted strong policies to underpin its agricultural growth agenda. However, some institutional weaknesses remain. The Water Act 54 of 1956 applies to Namibia the riparian principles of well-‐watered European countries which is inconsistent with the country’s hydrologic reality. It predicates the right to water through ownership of riparian land and thus effectively excludes non-‐landowners, particularly in the rural areas, from having adequate access to water. The Government of Namibia is currently in the process of drafting the blueprint for a new Water Act for Namibia to replace the Water Act 54 of 1956. Legislation on irrigation in Namibia has been in draft form since 1993.
In 1998, the Government of Namibia launched a major review of current water resource management practices, approaches and policies through the Namibia Water Resources Management Review, with the long-‐term objective of achieving equitable access to, and the sustainable development of, water resources by all sectors of the national population. A National Water Policy was adopted in 2000 and paved the way for the implementation of integrated water resources management. A Water Resources Management Act was passed by Parliament in 2004.
The wage bill and transfers to numerous parastatals account for about 60 percent of total government spending. In the agricultural sector, these relate in particular to state farming carried out by the National Development Corporation (NDC). These farms are commercially operated as state farms, with management and paid labour. Several schemes under the NDC have been settled by farmers on 3 to 4 ha plots. The NDC manages and provides inputs to farmers as credits under soft loans. Any new government development is normally executed by the NDC.
Needs
In terms of medium-‐term recovery actions to enable farmers to successfully harvest in the 2009/2010 season, significant government interventions are needed. The main harvest next year may be affected due to the reduction in seed availability, as it is likely that the most vulnerable households might consume the seeds, and at the same time, the household annual budget to purchase seeds might be used to obtain food commodities. Furthermore, as mentioned previously, the Seed Cooperative crops were severely damaged by the flood and hence it will need to import

Namibia Post Disaster Needs Assessment 107
Page 107
seed. Without external assistance, long term reduction in household food availability is forecasted in the area. The total cropland area affected by the flooding was over 90,000 ha. Required inputs will be seed, fertilizer, and ploughing assistance. The table below itemizes these inputs. Fertilizer represents the majority of the cost for cropland recovery.
Table 58: Crop Rehabilitation Needs for Flood Affected Areas (N$ million).
Inputs Application Requirement Unit Total Requirement Unit Cost Unit Total Cost (N$ million)
Seed 50 kg/ha 4,713,238 $7 /kg 33.0 Fertilizer 10 kg/ha 942,648 $700 /kg 659.8 Ploughing n/a $300 /ha $28.3
Total 721.1
In addition to inputs required for cropland rehabilitation, inputs will be required for livestock and fisheries. Costs for replacing livestock are accounted for in the assessment of damages, as are costs for commercial fisheries. Fish ponds belonging to small farmers or villages will need restocking with fingerlings. Of the 811 fish ponds registered with the IAC, 639 are located in areas affected by the flooding. The table below summarizes the inputs required to restock these ponds.
Table 59: Needs for Restocking Small Farmer and Communally-‐Owned Fish Ponds (N$ million)
Inputs Application Requirement
Unit Total Requirement
Unit Cost
Unit Total Cost (N$
million)
Fingerlings 1500 fish pond 958,500 $0.20 /fingerling 0.19 Fish Food 4 kg/1000
fish 239,625 $2.40 /kg 0.57
Total 0.76
Source: Inland Aquaculture Centre
Table 60 summarizes all calculated needs arising from flood damages and losses. As discussed in the risk reduction section, the North-‐Central and North-‐Eastern regions are affected by drought as well as flood. In terms of long-‐term recovery, therefore, multi-‐use flood protection and irrigation schemes are recommended to reduce the regions’ vulnerability to disasters and improve reliable access to agricultural water". In order to effectively implement such a multi-‐use scheme on a regional scale, however, changes in the farming patterns from small-‐scale individuals to larger cooperatives may be necessary. In order to estimate the cost of improving reliable access to agricultural water some of the cultivated area, a unit cost of US$ 5000 per ha was used. This unit cost was developed in an earlier study conducted by the World Bank for all of Africa.22
22 Lessons from Irrigation Investment Experiences:Cost-‐reducing and Performance-‐enhancing Options for sub-‐Saharan Africa, International Water Management Institute, August 2005. This study involves collaboration among the African Development Bank (ADB), Food and Agriculture Organization of the United Nations (FAO),

Namibia Post Disaster Needs Assessment 108
Page 108
Table 60: Summary of Recovery Needs (N$ million)
Activities Medium Recovery Needs
Long Term Reconstruction Needs
Providing Food (Course Grains Only)
43.7
Rehabilitating Cropland Rehabilitation
721.1
Restocking of Fish Ponds .77 Improving reliable access to agricultural water
4,000.0
Total 765.6 16,600.0
10,000 hectares is proposed as a target, in accordance with NDP3 which considers an additional 10,000 hectares under irrigation. However, NP3 suggests that the key activity should be to implement the green schemes which are more capital intensive investments than the proposed investments in small scale multi purposes water infrastructure.
International Fund for Agricultural Development (IFAD), International Water Management Institute (IWMI), New Partnership for Africa’s Development (NEPAD), and the World Bank.

Namibia Post Disaster Needs Assessment 109
Page 109
Annex 5: Industry and Commerce
Pre-‐Disaster Situation
The economy of Namibia is known to be strongly based on rich mining resources. The mining sectors account, in terms of GDP contribution, for an average of 17.9 percent during the period 2004–2007, with a peak of 21.7 percent in 2006, as shown in the table below. The Government of the Republic of Namibia is committed to stimulating economic growth and employment. To that end, industrialization and exports are considered among the first priorities where special efforts have to be undertaken in order to sustain national economic policy. Incentives are largely concentrated on stimulating manufacturing enterprises in Namibia and promoting exports into the region and to the rest of the world. Current tax and non-‐tax based incentive regimes are designed to give Namibia-‐based entrepreneurs who invest in manufacturing and re-‐export trade a competitive edge. The Export Processing Zone (EPZ) is one of these newly established incentives.
In terms of national account, secondary industries, mainly manufacturing, and tertiary industries, mainly wholesales and retail trade, are among the top three sectors contributing to the GDP. Manufacturing and wholesale and retail trade contributed 11.0 percent and 10.9 percent, respectively, to Namibia’s GDP in 2004. As shown in Table 61 below, in 2007, these two sectors were still among the top three highest contributors to GDP, with 14.3 percent and 9.9 percent of the total GDP, respectively. Yet, if consideration is given to all sectors, tertiary industries are the most important ones in terms of GDP contribution.

Namibia Post Disaster Needs Assessment 110
Page 110
Table 61: GDP per activity at current prices (%)
Industry 2004 2005 2006 2007
Primary industries 18.9 19.4 23.3 23.0 Agriculture and forestry 5.1 6.0 6.2 6.4 Commercial 3.5 4.2 4.1 4.4 Subsistence 1.6 1.8 2.1 2.0 Fishing and fish processing on board 4.2 4.8 4.1 4.2 Mining and quarrying 9.6 8.5 13.0 12.4 Diamond mining 8.4 7.0 8.7 5.9
Secondary industries 17.3 16.7 17.8 20.4 Manufacturing 11.0 16.7 17.8 20.4 Meat processing 0.3 0.3 0.2 0.2 Fish processing on shore 2.1 1.2 1.4 1.5 Food and beverages 4.6 4.5 4.2 4.4 Electricity & water 3.3 3.4 2.7 2.7 Construction 3.0 3.1 3.6 3.4
Tertiary industries 55.1 55.0 50.6 49.5 Wholesale & retail trade, repairs 10.9 10.7 11.1 9.9 Hotels and restaurant 1.8 1.7 1.5 1.5 Transport & communication 7.3 7.6 5.7 5.9 Transport & storage 4.1 4.1 3.3 3.8 Post and telecommunication 3.2 3.5 2.4 2.1 Financial Intermediation 3.3 3.7 3.3 3.5 Real Estates and business services 9.7 9.5 8.7 8.4 Community, social & personal services 0.8 0.8 0.9 0.9 General government services 19.5 19.5 17.8 16.9 Other producers of services 1.8 1.7 1.5 1.5
All industries at basic prices 90.2 90.0 90.6 90.5 Taxes less subsidies on products 9.8 10.0 9.4 9.5
GDP at market prices 100 100 100 100
Source: Central Bureau of Statistics, National Planning Commission: Preliminary National Accounts 2007
The industry and commerce sectors play a key role in supporting the economic growth of Namibia. These two sectors are also very important for the economy in terms of employment and income generation. At the national level, all sectors generate employment, but the importance differs according to each sector not only in terms of quantity, but also in terms of the disaggregation of employment by gender. Thus in terms of employment, nationally, the industry and commerce sectors follow the leading sector, agriculture. If the agricultural sector generated 26.6 percent of the national employment in 2004, ranking therefore at the first position, combined manufacturing and “wholesale and retail trade, repairs” generated 20.2 percent during this period. An important point to stress is also that these latter two sectors employ more females than males; specifically, 15.9 percent and 12.5 percent (females/males) within the “wholesale and retail trade, repairs” sector as opposed to 6.9 percent and 5.6 percent, respectively, in the manufacturing sector. This

Namibia Post Disaster Needs Assessment 111
Page 111
situation is prevails within the education sector as well, with a total of 8.1 percent employment generated by this sector and the female employee percentage as high as 11.2 percent versus 5.7 percent of males. Conversely, the construction sector reports a higher male to female employee ration, 8.4 percent and 0.8 percent. These are illustrated by the table below.
Table 62: Employment rate per industry and per occupation respectively (%)
Employment by industry
Namibia Total Females Males
Agriculture 26.6 22.3 30.0 Fishing 3.3 2.8 3.7 Mining and quarrying 2.0 1.0 2.7 Manufacturing 6.2 6.9 5.6 Electricity, gas and water 1.6 0.7 2.3 Construction 5.1 0.8 8.4 Wholesale & retail trade, repairs 14.0 15.9 12.5 Hotels and restaurants 3.4 4.3 2.7 Transport and communication 4.1 1.8 5.9 Financial intermediation 2.0 2.4 1.6 Real Estate and business services 2.4 2.4 2.4 Public Administration, Defense & Social Security 8.0 6.2 9.3 Education 8.1 11.2 5.7 Health & social work 3.6 6.2 1.6 Community, social & personal services 3.3 3.1 3.5 Private households with employed persons 6.2 11.9 1.9 Ex-‐territorial organizations & bodies 0.0 0.0 0.0 Not reported 0.1 0.1 0.1 Total 100.0 100.0 100.0
Source: Namibia Labour Force Survey 2004
According to some sources, the industry and commerce sectors are dominated by small and medium enterprises (SMEs). However, it is difficult to ascertain the classification of different enterprises, since the government does not count large enterprises, especially those that are classified within the industry sector. SMEs, on the other hand, are classified as such, and accounted for.
The SME sector has been and continues to be a major driving force in the economy due to its income and employment generated by employing nearly 160,000 workers, approximately one-‐third of the nation’s workforce.
Recent estimates indicate that the small business sector provides full-‐time employment for upwards of 60,000 people, ranking it alongside the Government for the country’s biggest employer. The majority of SMEs are in the retail sector, primarily selling foodstuff, beverages and household products. This indicates a skewed sectoral development with no or small real value addition.
In the Republic of Namibia, small businesses can be defined as indicated by the following table.

Namibia Post Disaster Needs Assessment 112
Page 112
Table 63: Definition of small businesses in the Republic of Namibia
Sectors Criteria Employment Turnover
Less than N$ 000 Capital Employed Less than N$ 000
Manufacturing Less than 10 persons
1,000 500
All other Businesses Less than 5 persons 250 100 Source: Namibia: Policy and Programs, 1997
In Namibia, small business activities are informal and located in the unregistered sector as well as formally established businesses. The level of income generation differs considerably between the formal and informal sector. One of the most important reasons for this is that most informal operating entrepreneurs enter the business as a last resort rather than as a first option to self-‐employment while formal sector businesses are large in terms of both employment and incomes. For the affected regions, and most likely for the others regions, coca shops are one of these small businesses, which are considered to be an easy income generating activity to provide a household’s daily expenses. The 1997 SMEs policy and programs is certainly one of the main foundations that explain the wide growth of this sector. A primary objective of this policy was to facilitate the growth of income generating activities and increase the average earnings of SMEs, as well as to increase employment opportunities, through job creation and self-‐employment. One important point to be taken into consideration when talking about the industry and commerce sector is the implementation of the Namibian Chamber of Commerce and Industry (NCCI) which now has its regional and local representatives to support the sector.
Compared with other sub-‐region countries, the situation of SMEs in Namibia, except for the informal sector, is very favourable. However, efforts have to be made to develop this sector in order to achieve the National Development Plan (NDP1) objectives.
Damages and Losses Assessment
Like other economic activity sectors, the industry and commerce sector within the six regions (Caprivi, Kavango, Ohangwena, Omusati, Oshana and Oshakati) where the flood hit have been strongly affected. Damages and losses incurred by this flooding continue to affect not only the industry sector, but particularly the trading enterprises. During the field visit, it was apparent that small businesses were suffering the most; this preliminarily finding is confirmed by the table below. There are three main reasons that clarify how and why this sector was so affected: first, the regions hit strongly are flat and flood-‐prone areas. There are not enough places for escape that are high and/or safe, or for businesses to store their stocks safely. Secondly, even though an early warning system exists, many people interviewed reported they were not informed in a timely manner and were surprised by the flood waters. The third point is the lack of an effective urban planning format; instead the current urban planning policy allows people to construct buildings and houses without supervision or guidelines, which in turn ignore the already poor outlets and ditches, further hindering the normal water flow. The damages and the losses the industry and commerce sector suffered are very important due to the aforementioned reasons. In terms of number of affected

Namibia Post Disaster Needs Assessment 113
Page 113
establishments, the commerce sector was affected more than the industry sector (estimated respectively at 1,187 and 347). However, as the former sector is mainly composed of small businesses, more than 66.7 percent of the overall total, the difference in the costs of damages are estimated as not as important. The estimated damage costs are N$142.4 million for the industry sector and N$207.6 million for the trading sector. It should be noted that the damages incurred by the commerce sector are related to stock being under water during the flood. No commercial building was washed away by the water and the trading enterprises do not usually have heavy and expensive equipments like that of the industry sector. The overall costs for damages and losses for the industry and commerce sectors are estimated at N$809.2 million of which N$304.3 million (37.6 percent) is for the manufacturing sector and N$504.9 million (62.4 percent) is for the industry sector.
In terms of losses, as expected, the costs are important for both the industry and trading sectors. As shown in table below, the overall estimated loss costs are higher than the costs of damages. This is due to the fact that the production of Industry sector and sales related turn over for both Industry and Commerce sectors are expected to decrease for the 4 to 6 coming months. These assumptions are based on the following: first, the inputs from the agricultural sector will be decreased as agricultural crops were severely damaged by the flood, negatively effecting the production of this sector. Secondly, sales activity for the industry and commerce sectors are expected to slow down as customers face a decrease in income as part of the flood impact. Additionally, these same customers did not receive any assistance or support from the government and are struggling to renovate and reopen their businesses on their own. Hence, the overall losses are estimated at N$459.2 million, with the industry sector losses estimated at N$161.9 million and N$297.3 million for the commerce sector.
Table 64: Total damages and losses for the industry and commerce sector (N$)
Total damages Total losses
Sector/ Regions Industry Commerce Industry Commerce
Caprivi 20,717,169.0 19,204,668.3 22,150,029.9 26,251,497.6 Kavango 25,506,475.7 38,075,336.6 27,397,477.5 52,502,995.1
Ohangwena 37,756,511.4 56,564,595.8 40,819,340.8 78,223,904.2 Omusati 16,680,871.0 36,658,674.3 24,871,602.2 50,532,237.9 Oshana 34,194,615.0 51,188,544.0 36,916,716.5 70,745,133.0
Oshikoto 8,587,467.6 7,889,532.3 8,860,012.0 10,510,705.5
TOTAL 142,441,109.7 207,577,351.2 161,876,778.8 297,327,073.2
(%) 40.7% 59.3% 35.3% 64.7%
Source: PDNA Team Calculations
Disaster Risk Management Issues
Due to the costs and related damages and losses caused by the flood, risk management and reduction are important issues to be addressed by both sectors. However, the risk management and reduction issues are clearly most important for small enterprises as they are often unregistered, operating in the informal sector and constructed without observing building codes or
Namibia Post Disaster Needs Assessment 114
Page 114
within urban planning strategies. Consequently, they are exposed to a higher level of risk, particularly when they are located or operating in a flood-‐prone area. Furthermore, as many of these enterprises are in the informal sector, they do not have insurance (which in general is still not commonly practiced or undertaken by any businesses below the large or international status). This lack of insurance and high risk exposure, increases the vulnerability of the owners (most often consisting of the poorest households or managed by women, both in order to supplement their household income) to not only full-‐blown disaster during the emergency, but also afterwards during the reconstruction and repair phase, if that is even possibility.
For medium-‐sized enterprises, the same situation described above is typical, but with the difference that, in terms of recovery and reconstruction, these enterprises are much more professional and with a higher portion receiving insurance. They also have better access to loans. However, for these enterprises, the agreed terms of repayment with the banks would be very difficult, if not impossible, to meet. Without new agreements, some medium businesses may go bankrupt.
Another point to be considered is the high damage costs incurred by medium trading enterprises. Since many medium-‐sized enterprises were not prepared for the flood and were not able to safely store their stocks, it is recommended that an improved early warning system is created.
For large enterprises, although facing some of the similar damages and losses as described previously, reconstruction should be easier than those undertaken by the two categories of businesses already detailed. Most of these enterprises were insured as well as have access to loans from banks. Recovery could be more difficult as both internal markets and inputs supplies from other sectors of the economy are expected to face some issues, which could have a negative impacts on the large enterprises’ monthly turnovers. Therefore, like medium enterprises, the loan repayments would be difficult to meet unless new agreements are found and finalized with banks.
To summarize, based on the above findings and assumptions, the industry and commerce sectors are highly dependent on the other sectors, in particular the agricultural sector. However, the damages and losses the industry and commerce sectors incurred could have a serious effect on economic growth and thus the development of the country, especially in terms of GDP contribution. Medium-‐ and long-‐term policy taking into consideration disaster and risk reduction measures should be developed and addressed by all levels of the government.
Governance Issues
In the case of commercial and industrial sectors, the main governance issues seem to be the dearth of material and human resources that prevent the state and parastatal institutions from properly assuming their responsibilities when disasters strike. This observation is applicable mainly to decentralized territorial administrations, like regions and constituencies, and also to the traditional authorities which are still play an important role within the rural societies. The lack of effective multilevel organization within the public and parastatal institutions, in terms of disaster and risk reduction management involving both central and regional authorities, is another important issue to be addressed in the future. This findings and recommendations should be specifically taken into

Namibia Post Disaster Needs Assessment 115
Page 115
consideration by the Ministry in charge of the industry and commerce sectors and the Namibia Chamber of Commerce and Industry to better cope with emergencies in the future. Even though their roles are relatively clear, their disaster response is often quite slow, a factor that tends to heighten the already critical levels of vulnerability of households and many small commercial and industrial enterprises.
Needs
In light of the vulnerability of the industrial and commercial sectors, and particularly of manufacturing and trading microenterprises, consideration should be given to some degree of assistance to their restoration at least to pre-‐disaster conditions. Hence, the measures proposed below are primarily designed to enhance the risk management behaviour, business entrepreneurship and ultimately the resilience of private commercial and industrial enterprises. It is also important to note that although early recovery needs should cover the six affected regions only for emergency reasons, the medium-‐ and long-‐term program needs should, however, cover all 13 regions of the Republic of Namibia, given that they too could very well be impacted at some point in the future. These will not cover in details the early recovery activities as the livelihoods sector will give broader details on this issue. One of the very first steps the government will have to do would be to provide NCCI with disaster risk reduction/management training along with keys departments within the Ministry in charge of this sector in order to have skilled people to better assist businesses in the events of future disasters. This would imply that NCCI and the Government should have a closer relationship and collaboration. Table 65 gives a list of programs or projects to be used as a guideline while implementing a new policy aimed at resilience improvement in the industry and commerce sector. Most of these programs or projects are designed to supplement and reinforce existing industry and commerce development policy by stressing disaster risk Management/reduction mainstreaming. To do so, efforts will have to be made both on the government side and private side as well, within the framework of public-‐private partnership. These recommendations listed below are basically of two types: (i) tax based incentives, and (ii) non-‐tax incentives.
a) Private side
- buildings premises on higher ground to avoid construction in flood-‐prone areas;
:
- providing safe and flood-‐proof storage within or outside the premises; and
- formal business to benefit from government assistance in order to increase disaster resilience.
b) Government side
- reinforcing laws and enforcing urban planning;
:
- reinforcing partnership with private institutions (i.e. bank, financial institutions, NCCI, etc.) in order to offer to the sector wider opportunities in terms of disaster risk reduction and post-‐disaster reconstruction and recovery;
- providing incentives for informal commerce to be enrolled within the fiscal administration and the formal sector. In that regards, existing tax policy can be used as basis;

Namibia Post Disaster Needs Assessment 116
Page 116
- tax incentives for those following planning and building code regulations (i.e. where and how to build), to cover the cost related to upgrade business construction;
- sensitizing business people on DRR issues and of the importance, for example, of following building codes during construction and urban master development; and
- establishing of disaster loans facilities (insurance, microfinance, etc.) with soft terms.
Lastly, it is important to note that implementation of these programs, whether short-‐, medium-‐, or long-‐term, should be part of the overall policy as well as the sectoral policies of the State, with a view to enhancing their effectiveness and outcomes.
Table 65: Recovery and Reconstruction Needs for the Industrial and Commercial Sectors
Recovery and Reconstruction
(N$ Million)
Early Recovery
Medium/Long Term
Recovery
Total
Sub-‐sectoral Needs for industry and commerce enterprises SMEs: Sensitization and assistance to informal and unregistered small
enterprises to become formal ones.(priorities should be given to the 6 affected regions)
122.0 122.0
Business management technical assistance, to be provided in the event of disasters, oriented toward enhancing the level of professionalism of jobs and the productivity of these enterprises (business plan elaboration training and/or assistance, etc.)
6.0 6.0
Present and future entrepreneurs’ sensitization, information and counselling activities enhancing the level of their business safety addressing DDR/DRM issues.
18.0 18.0
05 specific training modules for each of the 6 Regions (Caprivi, Kavango, Ohangwena, Omusati, Oshana, Oshikoto) according to the entrepreneurs’ needs.
6.0 6.0
Soft term loans to affected enterprises with priority to small enterprises operating in affected regions through NDB and NCCI
3,000 6,000 9,000
Creation of at least 12 Business centres (2 per Region) within the 6 most affected Regions which do not have yet.
7.2 7.2
Total 9,159.2 9,159.2

Namibia Post Disaster Needs Assessment 117
Page 117
Annex 6: Tourism
Pre-‐Disaster Situation
The 2009 floods which affected six regions in northern Namibia had an adverse effect on tourism in the country. Kavango and Caprivi have a considerable number of nature-‐based tourism lodges, which are concentrated along the rivers that flooded. Most of the north central region is not a major destination for international tourists, but it still benefits from through-‐traffic, and Etosha National Park, although at the southern periphery of the area affected, is one of Namibia’s biggest tourism revenue earners.
The tourism sector in Namibia has shown strong growth in recent years, but the current global economic downturn is expected to decimate any potential for growth this year. Hence, wherever a projection is required for what would have happened without the flooding, 2008 data is taken as the baseline scenario, including for national park visitor rates as above.
Damage and Losses Assessment
Structural damage to tourist facilities was relatively rare (other than for access roads across floodplains), and most damage consisted of numerous small maintenance activities, such as cleaning floors, re-‐painting, replacing doors, clearing drains, replanting grass and gardens, etc. These diffuse clean-‐up and repair tasks were difficult to itemize and analyze separately, and therefore combined estimates of the overall damage for each business were made. Losses were treated similarly, as much of the income is derived from food, drink and other add-‐ons such as varied tours and activities, rather than room charges alone.
Some tourist lodge were directly flooded and forced to close. A greater number suffered from loss of road access (in Kavango and Caprivi access roads across the floodplains tended to be submerged before the riverbank lodges themselves, which are slightly raised on natural levees), and of interruptions to other services (e.g., power, access to clean water, sanitation facilities and telecommunications). A number of operators complained of a wider impact due to the negative publicity of the flooding and perceptions that the impact was greater and for a longer period than was true. Although many businesses managed to avoid the worst, some in Oshikoto, Kavango and Caprivi are still struggling to recover.
Estimates were based on the figures provided by owners themselves, in some cases backed by contractor quotes and account books. Verification was via comparison with estimates for other facilities similarly impacted, and in a small number of cases unrealistic estimates were rejected. Where credible estimates were not available for facilities known or reliably reported to have been affected, typical estimates of damage and losses were used based on figures for other businesses in the same category (i.e. campsite, small lodge, or lodge). The ‘lodge’ category accounted for the majority of operations. Although there is considerable variation in the room rates charged by different lodges, many clustered around the N$500 per night mark, and there is a strong inverse relationship between room rate and capacity, such that the overall size of the businesses is similar.

Namibia Post Disaster Needs Assessment 118
Page 118
Damage and loss estimates for the tourism sector in Kavango and Caprivi were subject to a number of uncertainties. In particular:
Water levels in the Kwandu River in Caprivi were still rising at the end of the field assessment. Lodges along this river had not been greatlyimpacted to date, but the subsequent couple of weeks were expected to be critical.
It was not possible to visit or contact the lodges in Impalila and Kasika at the far eastern tip of Caprivi, which are generally higher-‐end operations. Estimates of impact on these are therefore based on second-‐hand reports of the affect on their business operations.
It is difficult to estimate the impact on trophy hunting revenue because the hunting season is still at an early stage. Quotas are issued for the year, and it was therefore necessary to estimate whether disruption from flooding at the start of the season might result in a significant failure to reach the allocation by the end of the season. Since animals move across international boundaries and are hunted in more than one country, animals not hunted this year were not considered to be necessarily available to be hunted in subsequent years.
Of the around 45 private operations in the affected areas, 24 were assessed to have been impacted, of which 18 were lodges, three were small lodges and three were campsites. Typical figures used to fill in missing estimates were N$275,000, N$50,000 and N$50,000 for lost revenue (two months closure) to lodges, small lodges and campsites respectively, and N$300,000 for damage to lodges. The total damage and losses are provided in Table 66.
Table 66: Total damages and lost revenue for private tourist facilities in Kavango and Caprivi, (N$)
Category # Total damage (N$)
Total lost revenue (N$)
Campsites 3 210,000 163,000 Small lodges 3 509,000 170,000 Lodges 18 4,889,000 3,654,000
Total 24 5,608,000 3,987,000
In addition, two conservancy-‐operated campsites were affected, with combined losses estimated at N$65,000, including N$5,000 in lost income from cultural shows at one of the camps.
Based on phone conversations with three of the four trophy hunting operators in the area, losses for trophy hunting were roughly estimated at N$1,200,000. The loss is from trophy fees for quota animals expected not to be harvested due to the added difficulty of finding them following the disruption caused by flooding. In addition, conservancies may lose up to 50 percent of the meat from hunted game (projected total value of N$1.6m for the whole season) due to the difficulty of transporting it to them following the flooding.

Namibia Post Disaster Needs Assessment 119
Page 119
Table 67: Damages and losses in tourism sector (N$ ‘000s)
Subsector/ Component
Damage Losses Effects on:
Value Public Private Value Public Private BOP Fiscal Sector
Oshikoto Tourist facilities 7,000 7,000 3,417 3,417 2,793 546.7 Oshana Tourist facilities 700 700 1,248 1,248 660 199.7 Omusati Tourist facilities 24 24 555 555 345 88.8 Ohangwena Tourist facilities 13 13 483 483 285 77.3 Kavango Tourist facilities 2,961 2,961 2,138 2,138 2,138 342 Conservancy camps
55 55 55 8
Caprivi Tourist facilities 2,647 2,647 1,849 1,849 1,849 296 Conservancy camps
10 10 10 1.5
Trophy hunting (fees & meat)
2,000 2,000 1,200
Total 13,300 13,300 11,755 11,755 9,335 1,560.1
NB: government revenue from private tourism income = VAT (15%) + tourism levy (0 for camps; 1 percent for all-‐in; 2 percent for B&B)
In Kavango and Caprivi, the main losses to local communities come from the potential reduction in trophy hunting revenues for conservancies and loss of wages. It is difficult to establish the precise loss of conservancy income from reduced trophy hunting as different hunt operators appear to have different agreements with the conservancies in which they operate as well as the extent to which losses in trophy fees are passed on to the communities. Overall it is estimated that around N$0.8m (i.e. 20 percent of a projected total of N$4m) could be lost to conservancies from reduced trophy fees, plus the lost meat income as estimated above.
Overall estimated losses to conservancies are presented in Table 68.
Table 68: Losses to community conservancies in Kavango and Caprivi
Income type Loss Notes
Trophy hunting fees 800,000 20% of N$ 4m Trophy hunting meat 800,000 50% of N$ 1.6m Conservancy campsites 65,000 Estimated above Joint venture lodge fees 37,400 8% of gross revenue loss (minus 15%
VAT) of 2 Kasika lodges
Total 1,702,400

Namibia Post Disaster Needs Assessment 120
Page 120
About a third of the tourist facilities visited reported laying off staff during the flooding period. The reported reduction in wages was N$ 271,000, and extrapolating for the affected businesses for which information was not available produces an overall estimate of around N$ 350,000 in lost wages.
Other financial losses from tourism to affect local communities are unlikely to be significant. The handicraft trade was not reported to have been affected, and the demand for casual labour and materials such as timber and thatch would, if anything have probably increased due to the clean-‐up and repair needs. Some lodges also provide voluntary support to local communities, e.g. school construction and maintenance. It is possible that this support could be affected, but the affect will probably be limited and no estimate was made.
Disaster Risk Management Issues
Long-‐term planning at the national level is recommended for the successful development of tourism in Namibia. Vision 2030 as well as National Development Plan 3 highlights tourism as a growth priority area. However, the industry should be supported by a clear tourism strategy based on the reality of demand and broad policy objectives which can considerably improve forecasts for tourism rates.
With a high rate of unemployment and the inherent difficulties faced by agriculture in a semi-‐arid environment, community-‐based tourism is an important tool in alleviating poverty and for providing alternative livelihoods, especially in Namibia’s communal areas. Therefore, it is paramount that community-‐based tourism is financially viable and founded on business and market principles if it is to bring the desired long term benefits to local communities.
Some tourism operations in Kavango and Caprivi did have flood insurance and expect to receive partial compensation for damage and losses, but the majority did not, and even those who had it now face the likelihood that future coverage will be cancelled. At the same time, access to short-‐term credit to cope with interruptions in business was very limited because lodges are on communal land and therefore are not accepted by the banks as collateral. Establishing mechanisms of providing emergency credit facilities to disaster-‐affected businesses would be the main area in which government could assist tourism operators to be more resilient to future events.
New developments should also have access to better data on likely flood levels so that they can design structures appropriately (e.g. raising or relocating buildings). A number of operators said they had looked at flood levels over the past 20 or so years, but were not prepared for the level this year. For existing facilities, however, it will probably not be cost effective to substantially rebuild to higher flood resilience standards as the structural damage was only minor, and the business interruption was challenging but not typically disastrous.
For most affected lodges in Kavango and Caprivi, the first impact of flooding is loss of access across the floodplains. In some cases this is an annual occurrence. Some owners want the government to invest in raising the roads above the flood levels. Other lodge owners are concerned about the impact of roads on the natural environment of the floodplains. This is a complex issue that needs to be dealt with within the context of comprehensive floodplain management. An alternative

Namibia Post Disaster Needs Assessment 121
Page 121
approach is for lodges to prepare to bring visitors in by boat for a part of the year. A number of higher end lodges already do this and were less affected by the flooding as a result.
A couple of lodges on the Okavango and Zambezi were affected by localized bank erosion, but engineered solutions would be prohibitively expensive and negatively impact the environment. Planting vegetation on exposed banks has previously been effective for protecting against regular annual flood erosion and should be encouraged, although it is likely to be insufficient in the event of repeat floods of the magnitude of those in 2009.
Governance Issues
Namibia is one of the few countries in the world where tourism has a cabinet level portfolio. In the past decade, some significant moves have been made to provide a political and legislative framework that is conducive to the growth of the industry. Better regulation of tourism development at the local level is probably needed, however, to ensure that developments are appropriate to the environmental sensitivities or vulnerabilities of their surroundings. For floodplain areas, this is best done with a framework of integrated floodplain management, which is discussed in more detail in the separate DRM section.
Needs
As the tourism sector gains in importance, it is also increasingly complementing the country’s traditional economic sectors like agriculture. However, despite the clear potential for tourism growth opportunities that can diversify and enrich the Namibian economy, there is an extremely low government investment. Experience has shown that demand for any tourism grows sharply if marketing and promotions are well funded and effective. International awareness of Namibia and its tourism is relatively unpublicized especially compared with neighboring countries like South Africa and Zambia. National marketing strategy based on up to date research is vital to raise the country’s profile so that it can compete in the international market. Domestic tourism promotion is also needed to highlight the importance to local Namibians of tourism’s economic and employment generation potential. According to Namibian Tourism Board (NTB) reports, about 60 percent of operators described their business as “en route/stop-‐over/going up or down the regions” type guests. Longer stays were attributed to hunting clients and business/conference guests. Luring travellers to stay over longer at more established “destinations” is indicated by the NTB as a challenge. Identification of opportunities for tourism product or facility development lacked much fresh or innovative thinking. However the establishment of interesting tours (e.g. museum, fish factory) was mentioned. More entertainment and restaurants were needed, and certain facilities (e.g. upgrade rooms and better transport) were identified as opportunities. Lesser mentions of marketing and cultural tourism offerings were recorded as well and are key to bringing more tourists. As shown in the table below, the needs for tourism sector are estimated to be N$25 million to cover promotion activities as well as building better drainage systems around the affected lodges and the national park.

Namibia Post Disaster Needs Assessment 122
Page 122
Table 69: Summary of needs for the Tourism Sector
Sectoral needs
Recovery and Reconstruction (N$. millions)
Early Recovery (N$. millions)
Medium-‐/ Long-‐term Recovery
Total
Increase in promotion activities (organization of educational tours, road shows, and participation in International tourist fairs)
10 10
Better Flood Drainage systems around lodges and the Etosha National park
15 15
Total 25

Namibia Post Disaster Needs Assessment 123
Page 123
Annex 7: Housing
Pre-‐Disaster Situation
210,000 households live in the six affected areas (60 percent of Namibia population). The vast majority of these households (85 percent) live in rural areas. In rural areas residents build their own houses. They are able to get the timber from the bush and produce their own sand/cement blocks. In urban areas construction is mainly done by contractors or construction enterprises. Three main types of housing are observed in the region: (i) traditional houses (wooden structure, thatch roofing and sand or mud brick walls); (ii) modern (solid) housing (bricks, cement blocks and steel reinforced structure); and, (iii) informal (transitional) housing (made of corrugated iron sheets or any other cheap material). Rural settlement and traditional housing A rural settlement can be defined as a group of small, independent constructions (single rooms) that inter-‐relate through a complicated scheme of fences and corridors. Each room corresponds to a single occupant or family function. The settlement is defined by a private fence that includes the planting area, separating it from the rest of the community land. The housing compounds are usually located on lower levels of the property as the higher areas are saved for omahango (planted crop). This situation is likely based on historical need to protect the crop from flooding. In rural areas the traditional housing is typically a round, windowless single storey building with a conical roof. Construction of the buildings varies according to craftsmanship, skills and materials available locally; the three main materials are wood, wood combined with mud, or sand bricks. Roofs are generally made out of thatch and have the same typical shape throughout the six regions. More recently it is common to find within the settlements a building or two made from solid materials such as cement blocks or roofs of corrugated iron sheeting which is thought to correspond with the exposure by younger residents to urban settlements. In Caprivi, mopani poles are mainly used for the construction of traditional housing and the permission to cut the poles is regulated by local authorities. Due to scarcity of this material, in parts of eastern Caprivi some residents have to obtain these building materials across the Zambezi River in neighboring Zambia. Urban Areas, modern and informal housing
Modern housing, generally built recently and with solid materials (cement blocks, burnt bricks, or metal sheets), is mainly found in urban areas; the typical shape is square with a flat roof. Modern houses are permanent constructions, resistant to water and wind and need little or no maintenance. Modern (solid) housing, although built with waterproof materials, can still be highly vulnerable to inundation from heavy rains if built on ground level or low lying area. This is common as there is a general lack of flood awareness.
Informal settlements are housing groups that are established beyond the defined limits of the city and lack any social services or public infrastructure (i.e. schools, hospitals, or drainage systems). Usually this type of settlement grows without any planning or supervision, in low areas like those in a river basin or other undesirable ecological situations. The informal settlement occupies these locations because the land is free and for the proximity to town and paid employment. Tenancy of

Namibia Post Disaster Needs Assessment 124
Page 124
housing varies according to the site where they are built. Those without any legal tenure are typically built in informal settlements of urban areas.
Informal (transitional) housing is mainly found in the informal settlements, in low lying areas or along the roads, mostly used as shops or bars, commonly referred to as “cuca shops” or “shebeens.” The main building materials are metal sheets covering a light framework, usually made of wood, with a door and no windows. Most of these structures have no constructed floor or proper insulation. While its transitional character is self-‐evident, these building are often used by its inhabitants as permanent housing.
Vulnerability in the Housing Sector
Traditional housing is highly vulnerable to floods as it lies generally at the ground level. The building materials are not flood resistant, particularly when in standing water as occurred in the flooding of 2009. Informal (transitional) housing is highly vulnerable to floods and water inundations because of their location and their fragile construction. Urban areas typically occupy higher ground level and are built with solid materials in various styles and methods. Usually they are protected by drainage systems that evacuate rain water from its surface. Urban areas become vulnerable to flooding from heavy rains when the drainage system does not work adequately (e.g. growth of residential areas without simultaneously enlarging the drainage system or lack of maintenance for the drainage systems). In the urban areas, it is commonly observed that newly constructed elevated roads increase vulnerability as they can act a water barrier (i.e. lack of adequate culverts that respect the natural course of water).
Bottom-‐line, none of depicted types of housing in rural and urban areas have been prepared for floods or even for moderate inundations. It is rare to find a house that is built above the ground level, although located clearly in flood-‐prone areas. New modern (solid) houses are built at the ground level even those in areas prone to flooding.
Damage and Losses Assessment
According to the early assessment done by UNDAC and later by FEMCO (Report of the Flood Emergency Management Coordination Office), floods affected housing, as thousands of people were displaced to relocation centres or other transitional settlements for a period between two and four months, depending on the subsiding level of water in their living places.
At the time of the assessment, in the Caprivi and Kavango regions, some displaced people were still living in relocation camps because their houses remain inaccessible. Many affected people face possible permanent relocation to higher and more secure places because their houses have been inundated for two consecutive years and it is likely that the phenomena will continue to occur cyclically every one or two years.
The assessment of the damage and losses was based on the following calculations:

Namibia Post Disaster Needs Assessment 125
Page 125
Table 70: Calculations for damage and loss assessment in the housing sector
Households
Caprivi Kavango Ohangwena Omusati Oshana Oshikoto Total
Population 87058 202694 276099 257789 186755 191625 1,202,020
Affected population 228842 7976 228842 228842 161916 117818 974,236
Households 42965 31671 46017 42965 31126 31938 226,680
Urban 2041 5254 2186 2041 7582 4072 23,176
Rural 13248 40817 43716 40817 18053 27147 183,797
Affected households Caprivi Kavango Ohangwena Omusati Oshana Oshikoto Total
Urban Modern 0 0 524 1,487 9,747 2,504 14,262
Urban Informal 330 0 591 420 1,587 442 3,369
Rural Traditional 4,670 1,246 21,170 36,233 15,652 16,691 95,662
Total affected 5,000 1,246 22,284 38,140 26,986 19,636 113,293
Percentage of Total households
12% 4% 48% 89% 87% 61% 50%
Fully Damaged Households
Caprivi Kavango Ohangwena Omusati Oshana Oshikoto Total
Urban Modern 0 0 0 0 0 0 0
Urban Informal 330 0 118 84 317 88 938
Rural Traditional 4,670 1,246 3,895 5,942 2,630 2,837 21,221
Total Fully Damaged 5,000 1,246 4,013 6,026 2,947 2,926 22,158
Percentage of Total households
12% 4% 9% 14% 9% 9% 10%
Partially Damaged Households
Caprivi Kavango Ohangwena Omusati Oshana Oshikoto Total
Urban Modern 0 0 262 744 4,874 1,252 7,131
Urban Informal 0 0 177 126 476 133 912
Rural Traditional 0 0 8,044 12,863 5,635 8,179 34,721
Total Partially Damaged
0 0 8,483 13,732 10,984 9,563 42,763
Percentage of Total households
0% 0% 18% 32% 35% 30% 19%
Unit Cost (N$) Replacement
Repair
Urban Modern 40,000 2,500
Urban Informal 1,000 500
Rural Traditional 12,000 4,000
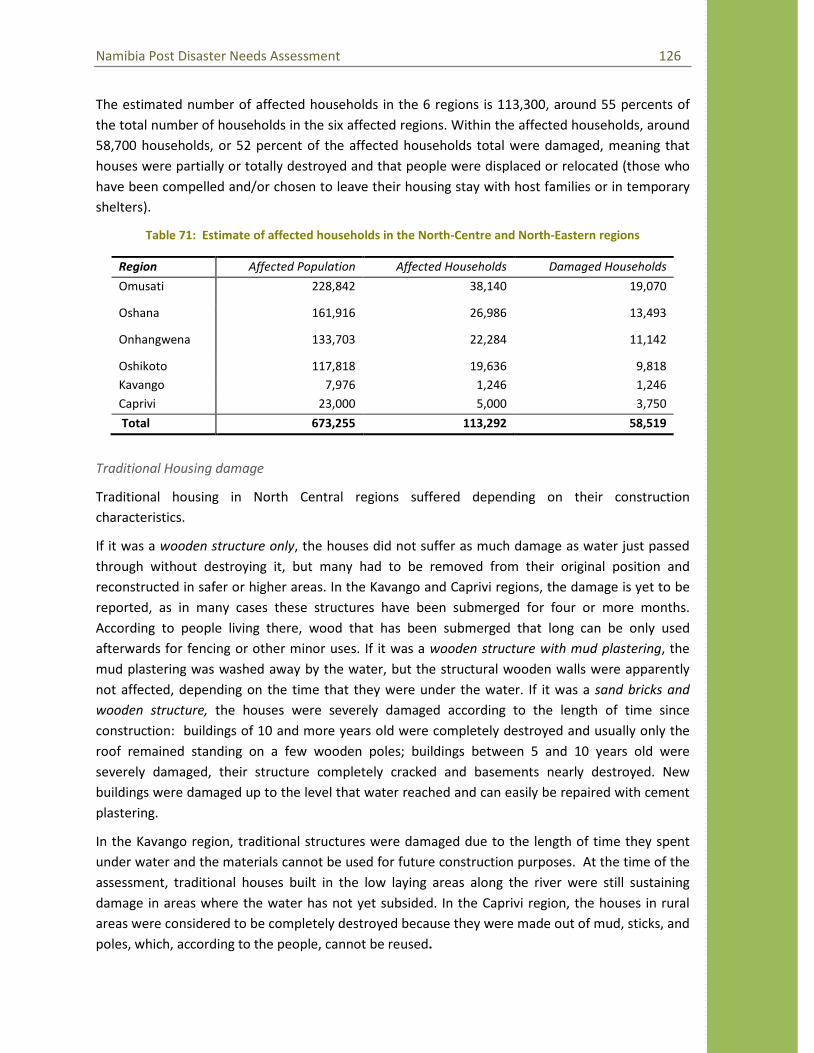
Namibia Post Disaster Needs Assessment 126
Page 126
The estimated number of affected households in the 6 regions is 113,300, around 55 percents of the total number of households in the six affected regions. Within the affected households, around 58,700 households, or 52 percent of the affected households total were damaged, meaning that houses were partially or totally destroyed and that people were displaced or relocated (those who have been compelled and/or chosen to leave their housing stay with host families or in temporary shelters).
Table 71: Estimate of affected households in the North-‐Centre and North-‐Eastern regions
Region Affected Population Affected Households Damaged Households
Omusati 228,842 38,140 19,070
Oshana 161,916 26,986 13,493
Onhangwena 133,703 22,284 11,142
Oshikoto 117,818 19,636 9,818 Kavango 7,976 1,246 1,246 Caprivi 23,000 5,000 3,750
Total 673,255 113,292 58,519
Traditional Housing damage
Traditional housing in North Central regions suffered depending on their construction characteristics.
If it was a wooden structure only, the houses did not suffer as much damage as water just passed through without destroying it, but many had to be removed from their original position and reconstructed in safer or higher areas. In the Kavango and Caprivi regions, the damage is yet to be reported, as in many cases these structures have been submerged for four or more months. According to people living there, wood that has been submerged that long can be only used afterwards for fencing or other minor uses. If it was a wooden structure with mud plastering, the mud plastering was washed away by the water, but the structural wooden walls were apparently not affected, depending on the time that they were under the water. If it was a sand bricks and wooden structure, the houses were severely damaged according to the length of time since construction: buildings of 10 and more years old were completely destroyed and usually only the roof remained standing on a few wooden poles; buildings between 5 and 10 years old were severely damaged, their structure completely cracked and basements nearly destroyed. New buildings were damaged up to the level that water reached and can easily be repaired with cement plastering.
In the Kavango region, traditional structures were damaged due to the length of time they spent under water and the materials cannot be used for future construction purposes. At the time of the assessment, traditional houses built in the low laying areas along the river were still sustaining damage in areas where the water has not yet subsided. In the Caprivi region, the houses in rural areas were considered to be completely destroyed because they were made out of mud, sticks, and poles, which, according to the people, cannot be reused.

Namibia Post Disaster Needs Assessment 127
Page 127
Nearly all affected households lost their grain and food reserves as their granaries were totally inundated and many of them suffered losses of one or more dwellings from their settlement structures.
In total, 12 percent of the total rural households in the six affected regions were partially destroyed and 19 percent were fully destroyed.
Urban Housing Damages
In the Northern regions, modern (solid) housing was not structurally damaged, and after the water subsided, it has been possible to use them again after clean up. However, damages can be observed in floors that were destroyed and in internal and external wall plastering that was in contact for a long time with contaminated water. There are many new housing developments in urban areas that have been recently built in low areas because of a lack of knowledge or appropriate advice. All this housing faces potential new inundations and is being abandoned or sold by their inhabitants. Additionally, small constructions like latrines, sewages, and other exterior facilities were severely damaged. There is lack of risks maps and enforcement regarding these structures at the local authority level as the flood phenomena is still considered new in the region.
Informal housing structures were severely damaged as they are mainly built with untreated wood. However, as the walls are simply metal sheets, damage is not as apparent but does exist. In most of these cases the loss of household goods can be considered to be 100 percent. Many informal housing and other types of housing built in informal settlements are still sustaining damage because in some areas water has not yet subsided.
In the Caprivi region, the damage to houses in the urban area of Katima was minimal compared to those in the rural areas. The damaged houses in the urban area of Katima are located in the informal settlement section of the city, and they were built of mud, sticks, and mopani poles. A few of the permanent cement type houses in the city were affected by the floods, but the city officials did not provide data on damages to these types of houses. Destroyed houses where located mainly in the low lying areas of the city and in the informal settlements such as the Choto and Cowboy Compounds.
In total, 8 percent of the total informal urban households in the six affected regions were partially and fully destroyed and 30 percent of the modern urban houses were partially destroyed.
In total, the cost of damages to all types of households in the six affected regions was N$ 258 million of which Omusati alone represents 31 percent. In comparison, the amount of losses that represent the cost of relocating people in camps was N$ 13.8 million of which Caprivi alone represents 52 percent.

Namibia Post Disaster Needs Assessment 128
Page 128
Table 72: Damage and losses (N$ million)
Regions Damages Losses Fully
destroyed Partially
destroyed Total (relocation in camps)
Caprivi 43.4 0 43.4 7.2 Kavango 17.4 0 17.4 3.8 Ohangwena 23.4 18.8 42.2 0.8 Oshikoto 17.1 16.8 33.9 0.1 Oshana 15.9 25.1 41 1.7 Omusati 35.7 44.2 79.9 0.2
Total 152.9 104.9 257.8 13.8
Governance issues
As floods are considered new phenomena in Namibia, risk reduction measures have not yet been included in housing policies, town and land use planning, and other legal procedures that can provide a semblance of protection. There are many potential amendments to be considered for legislation. Critical issues to be considered include: affected people who are eligible for relocation fear the lack of legal protection of their land rights; relocation areas have yet to be identified (though it is commonly accepted that there is enough community land and should not be an issue); and an establishment of policies for future assistance in emergencies (i.e. relocation camps, long term recovery plans, etc.). An important long term regulatory measure could be the integration of risk reduction measures into a National Housing Policy and enforcing no construction in risk-‐prone areas at the council (and city) planning levels. The Namibian government is currently implementing three housing programs in urban areas that target those who live in informal settlements or other illegal situations. These programs are: (i) National Housing Enterprise, low cost housing, directed to those who work and can afford loans; (ii) Shack Dwellers Federation, focusing on the homeless and other marginalized inhabitants; and, (iii) “Build Together,” social housing program targeting those who can offer their own labor during the construction (e.g. produce bricks, provide physical labor, etc.). These programs do not address rural areas as it is believed that rural citizens rely on their community to cope with housing tenure and land issues.
Recovery and Reconstruction Needs
A reconstruction strategy is recommended, based on the needs identified through the damage and loss figures, to be implemented under three phases: the early recovery needs, the normal reconstruction needs and the reconstruction with improvement. Early Recovery Needs
Affected populations have been assisted with shelter and food, though only through the relocation to specific camps organized by the authorities. Assistance for reconstruction or emergency shelter in their localities was not implemented. This former kind of assistance is expected to come from international relief agencies and other humanitarian organizations.

Namibia Post Disaster Needs Assessment 129
Page 129
Medium and long term Recovery and Reconstruction
Depending on the results of a participatory flood risk mapping (see DRM section), there are three possible recovery and reconstruction strategies that are recommended for the housing sector: (i) Flood proofing of existing or new houses, (ii) Relocation to safer areas, (iii) Use of semi-‐permanent structures.
Spatial planning, combined with flood risk mapping, is an essential tool for this recovery and reconstruction strategy. This is particularly important for informal settlements, which tend to be the ones most at risk from floods.
Flood proofing
Flood proofing measures fall into three categories23
In the urban areas of Caprivi, the affected people noted that risk reduction should involve the building of a water canal that will channel the flood water away from the vulnerable houses in the informal settlement sections of the city. In the rural Kavango region, risk reduction should involve the moving of people to higher ground, though close to their old area, and build their new houses there. Resettlements are part of a long term recovery plan, as many issues will have to be solved and planned, like land tenure, access to water and public services.
: (i) Elevated bases (for the house), elevated shelves (to store valuables) and false roofs capable of storing food, seeds and even people during prolonged floods; (iii) Wet-‐proofing the building (or quality improvement)—the use of better quality and new flood proof materials such as cement plastering and cement blocks, or soil-‐cement bricks, that allow water to pass through the building without causing significant damage (iii) Physical barricades built around the housing structure (e.g. earth plinths, bamboo or other strong plants). This intervention however, will only work for relatively weak flooding. In all six regions, rural housing suffers severe damages in floods of this magnitude as materials used to build traditional housing do not remain resistant under water for a long period. Therefore it is highly recommended to replace traditional materials like sand bricks or adobe with cement blocks or stabilized compacted soil blocks or other alternative construction materials that are better resistant to water. Cement blocks are commonly used in the region and the skill to produce them exists in almost every household. It is common to see people producing them in small batches on an as needed basis. It is recommended that any new housing or infrastructure should be built above the ground level and flood protection measures taken in buildings to at least the level where the flood water last reached.
The Government will need to consider whether to provide direct subsidies (cash), training, building materials, or let market instruments (such as insurance) be the main means of assistance to the affected people. In the case of distribution of construction materials (typically cement, rope, shovels, and wheel barrows), the distribution process would need to be done with regional authorities and communities to identify correctly the most affected households. Considering the high amount of the affected households in the six regions, it will be necessary to identify if this 23 INEE and GFDRR 2009. “Draft INEE Guidance Notes on Safer School Construction.” Inter-‐Agency Network for Education in Emergencies, Global Facility for Disaster Recovery and Reconstruction.

Namibia Post Disaster Needs Assessment 130
Page 130
assistance should be given at the relocation camps, at the early resettlement level, or when people have already returned to their communities. Since housing is primarily a private damage, the Government will need to strike a careful balance between direct housing assistance to the affected people, and creating perverse incentives (moral hazard) for poor people to resettle back in high risk zones.
Typically after disasters, there is a boost in demand for construction materials, which can lead to heavy demand for wood (placing further pressure on the environment). It is important to promote the use of sustainable solutions, such as soil-‐cement bricks, alternative energy sources, and, if wood must be used, reforestation.
Relocation to Safer Areas
In some cases where houses are located in a highly exposed floodplain, housing relocation to safer (higher) grounds may be the only solution. By far, the preferred solution is for the homeowner to move voluntarily to a higher location close by, as identified by the participatory flood risk mapping (see DRM section). In this case, it is crucial to use markers as references of past floods, to remind community members that such floods may come back, and that resettlement in high risk areas is to be discouraged at all costs.
In areas subject to extensive flooding, there may be no choice but to resettle a larger number of households into safer grounds. International experience has shown, however, that resettlement following disaster carries numerous risks that are often underestimated by the Government and humanitarian agencies.
Common reasons for the failure of these programs include:24
Successful resettlement programs post-‐disaster have tended to include the following features: (i) the affected communities have participated actively in the site selection, housing design and features of resettlement planning; (ii) past livelihoods (e.g. fishing) have not been disrupted; (iii) basic needs and aspirations—health, education, jobs, water, transport—continue to be accessible and affordable at the new sites; (iv) the resettled community belongs to similar ethnic, cultural background or has similar occupations (e.g. farming/fishing); (v) they lack excessive emotional ties to the old sites, and are able to bring with them items of high emotional, spiritual or cultural value; and the housing designs, layouts and natural habitats conform to the community’s way of life.
resettled sites which are inappropriate, or distant from the communities’ original livelihoods or social networks; new settlements which no longer allow for kinships or social cohesion; failure to provide for farming needs (e.g. space for livestock, tool sheds); (iv) inadequate housing materials; (v) groups resettled together that belong to different ethnic or cultural groups, or social backgrounds; and conflict or competition with adjacent communities with valid claims over resettlement sites.
24 Jha, Abas, 2009. Handbook for Post Disaster Housing and Community Reconstruction. Draft. ISDR, GFDRR, World Bank.

Namibia Post Disaster Needs Assessment 131
Page 131
Semi-‐permanent structures
Semi-‐permanent structures in flooded areas can be of three kinds: (i) Relocation camps and their logistical support warehouses, (ii) Elevated or floating platforms, and (iii) Temporary housing.
Relocation camps are basically structures that would be ready to receive refugees during disaster times, with semi-‐permanent water, sanitation, electricity, shelter and cooking facilities. They should have permanent fences, gates and security. During non-‐disaster times, the facilities could be used as community centres. They would be supported by logistical structures (warehouses) equipped to store or rapidly receive food and materials for disaster victims.
Floating platforms (equipped with water and food) allow population in critical floodplain areas to assemble temporarily and facilitate collection and relief efforts. In some flood-‐prone areas of Mozambique, they even function as temporary schools.
In some flood-‐prone zones where permanent relocation may not be a culturally-‐acceptable solution, the community may prefer to keep temporary houses in the floodplain, and permanent structure in the periphery (safer grounds).
Table 73: Early and medium and long term reconstruction Needs (N$ million)
Regions
Type of Housing
Early Recove
ry
Reconstruction as is
Build Back better
Elevated Bases and Wet Proofing
Physical Barricad
es
Relocation
Total
Central
North
modern 2.8 17.8 4.4 1.8 3.6 27.6 informal 0.7 759.7 0 0.8 2.3 traditional
178.6 115.1 17.8 35.7 347.2
North East
informal 11.0 1.0 0.7 0 1.0 2.7 traditional
59.8 39.9 0 59.8 159.6
Total 13.8 257.9 161.0 19.6 100.9 539.5
Investments such as elevating bases, wet proofing houses, building physical barricades and relocating people living in the flood plains are not targeted in the housing section of NDP3. This would therefore be in addition to the planned investments.

Namibia Post Disaster Needs Assessment 132
Page 132
Annex 8: Health
Pre-‐Disaster Situation
Namibia’s Health system under the Ministry of Health and Social Services is based on the Primary Health Care (PHC) approach for the delivery of health services to the Namibian populations. Introduction of the Minimum Package of Services (MPS) and Total Quality Management are among the efforts towards achieving health care of acceptable quality service for all people. Responsibility to health provision is being shared by both public and private sectors. The public health sector is organized into three levels: National, Regional and District Level, but management of the health services is decentralized in line with the government policy.
The health system is decentralized to make it responsive to the needs of the populations. To aid the implementation of the PHC strategies, programs have been organized into functional directorates at the national and regional level. This includes primary health care, special diseases programs, and developmental social welfare services, to mention a few. The Ministry of Health has four referral hospitals, 34 district hospitals, 37 health centres and 259 clinics. In addition, there are a relatively large number of private hospitals, clinics and private consulting rooms.
The key objective of the health sector is to provide health promotion and disease prevention services, a disease surveillance system, treatment (of both communicable and non-‐communicable diseases), prevention of malnutrition and micro nutrients deficiency, promotion of breastfeeding, and provision of supplementary food to vulnerable groups. The key issues in the health sector are:
Malaria. The country experienced ad outbreak of malaria during 2000 and 2001 in the endemic northern regions. A total of 446,265 cases (an incidence rate of 2,550 per 100,000 population) were reported with 743 deaths (Case facility rate =CFR=0.16) during the year 2000.The four northwest regions were the most affected. During 2007, the total number of malaria cases reported was 102,381 with 181 deaths, indicating a declining trend in malaria cases; in 2006 and 2007, outpatient malaria cases dropped by 35 and 79 percent respectively. Between 2005 and 2008, about 153,422 mosquito nets were distributed among the pregnant and children under the age of five in all endemic regions, for a total of 577,500 mosquito nets distributed. Indoor residual spraying coverage improved over the past several years, and was 90 percent during the 2007/08 spraying cycle. (Health Information System (HIS) 2008)
Anecdotal evidence suggests that while the cases of Malaria have decreased, this was largely due to a change in treatment based on clinical diagnosis to treatments based on test results. This change has led to an increase in treatment expenses for malaria, since additional cost were incurred as a result of increased number of people who needed to be tested for malaria.
HIV/AIDS. According to the Ministry of Health and Social Services report on the 2008 National HIV Sentinel Survey, 200,000 – 250,000 people are estimated to be living with HIV and 59,000 are estimated to be on ARTs. The country saw a slight reduction in the HIV prevalence rate (from 19.9 percent to 17.8 percent according to the Ministry of Health figures for 2006). However, the country remains one of the hardest hit by the pandemic. It is estimated that Caprivi region has a HIV

Namibia Post Disaster Needs Assessment 133
Page 133
prevalence of 31.7 percent, which the highest in the country. Of concern is the increase in reported case of HIV/AIDS among 15-‐19 year olds from 10 percent in 2004 to 12 percent in 2007 (DHS2006/7).
Maternal Mortality. The maternal mortality ratio has been on the increase since 2000 from 225 per 100,000 live births in 1992 to 271 in 2000, and 449 in 2007. This is despite the fact that over 70 percent births are delivered in hospitals (DHS 2006-‐7). Of equal concern is that about 18 percent of women attending first ANC services are under the age of 20 years, with teenage girls accounting for 9 percent of Namibia’s total fertility rate (MOHSS, HIS 2006).
Infant Mortality. Although there has been substantial variation in mortality rates across the regions, Namibia has made significant efforts and gains in reducing mortality, particularly among children over the past years. Child mortality is consistently lower in urban areas than in rural areas. However, general life expectancy has not improved partly because of HIV/AIDS epidemic. According to the DHS 2006/07, Infant Mortality rate stands at 46 per 1000 live births and child mortality stands at 69 per 1000 live births; counted among the lowest in Sub Saharan Africa.
Malnutrition. Food insecurity among vulnerable female headed households has been widely reported. Nutrition is also a concern and malnutrition levels in the under five year olds are as high as 38 percent in some of the affected regions. According to the Namibian Demographic Health Survey done in 2006, the rate of Global Acute Malnutrition was 7.5 percent.
Sexual and Reproductive Health. It is widely acknowledged that the delivery of reproductive services to the communities has not only resulted in improved general health and sexual and reproductive health. This was further strengthened by dissemination of information, and creation of awareness on nutrition, malaria, diarrheal diseases, and reproductive health, gender and HIV/AIDS issues. Unfortunately these efforts have not yet translated into behavioural changes, as they tend not to take the social, economic and cultural factors that drive behaviour into consideration.
Damage and Losses Assessment
The assessment of the health sector was mainly qualitative in design and nature. The data collection tools were developed by the assessment team, and included (i) the Initial Rapid Assessment tool (IRA) developed by the Global Health Cluster, which was modified to collect post disaster health data; (ii) the Health Resources Availability Mapping System, which collects baseline data on the health facilities; (and (iii) the DaLa tool which collects data on damages and losses incurred by the health sector during the floods.
All the six affected Regions of North Central and North-‐Eastern Namibia were visited. A total of 26 health facilities were visited including those that were flooded during the crisis. All the health facilities in the affected regions were entered into the Health Service Availability Mapping system, mainly to register facility name, type, status, ownership and human resources, both in the facility and in the catchments population. The teams also visited communities, including seven camps and six localities/settlements, to assess the general conditions and nutrition and health conditions of the populations. Key informant interviews were the main avenues of data collection, although the

Namibia Post Disaster Needs Assessment 134
Page 134
team also used group discussions, participant observation, and review of records. Meetings were held with regional councils to brief them on the purpose of the assessment and also to get briefed on the crisis situation. Key informant interviews were held with Regional Directors of the Ministry of Health and Social Services (MoHSS), Chief Medical Officers (CMOs), Principal Medical Officer (PMOs) and those in charge of health facilities. In the communities, group discussions and key informant interviews were used.
Damages from the flood were primarily sustained by the public sector to buildings and equipment. Three health facilities were flooded and relocated: Mabushe and Biro clinics in Kavango Region and Liskili clinic in Caprivi Region. The private sector was also affected. A private ward in Onandjokwe hospital (Oshikoto region) was closed down for 2 months and the paediatric ward was damaged when the sewerage pipes were totally damaged. In Oshana the basement and the front entrance of the Oshakati Intermediate Hospital pharmacy was severely damaged.
Losses were incurred as a result of relocation of the clinics to other sites, opening of new outreaches and expanding on the existing outreaches to serve the affected population. Prevention of impending outbreaks through disease surveillance and coordination of response and revenue losses incurred as a result of closing some wards and facilities and changing the TB treatment for some patients whose treatment had been interrupted in Omusati, Ohangwena and Oshikoto regions
The table below shows the damage and losses incurred during the crisis. A total of 6,344,503 N$ was lost in the damages and losses to the health facilities and extra health services that were conducted.
Table 74: Damage and Loss Estimates by Type of Health Facility
Public Private Total
Damage
District/Intermediate Hospitals 500,000 150,000 650,000
Health Centres -‐ -‐ -‐
Clinics -‐ -‐ -‐
Total 500,000 150,000 650,000
Losses
Additional medical care 1,891,345 -‐ 1,891,345
Preventive programs 714,058 -‐ 714,058
Temporary facilities 1,589,100 1,500,000 3,089,100
Total 4,194,503 1,500,000 5,694,503
Disruptions to access to basic needs and services
In the Oshikoto, Ohangwena and Omusati regions, disease control programs were somehow disrupted. This was especially true for TB control programs where about 30 patients had to be changed from a category one to a category two regimen, because of interruption in the treatment.

Namibia Post Disaster Needs Assessment 135
Page 135
In other regions, the impact of the floods on disease control programs like TB, Malaria and HIV/AIDS was minimal. Most of these programs experienced some minor disruptions in accessing patients for monitoring reasons. The Kavango and Oshana regions were completely unaffected, while in the Caprivi region there was some disruption to TB and HIV/AIDS control programs, although malaria programme remained unaffected.
Physical access: On average, the furthest community in a catchment population of the health facility is 15km. According to the national health policy on accessibility of the population to the health services, a population is considered to be accessing health services if it is within 5 km radius of a health facility. In some regions like Caprivi, and especially in the Kabbe Constituency (which experiences annual floods and was particularly hit in 2009), the average distance between health facilities is 50 km. This is, in part, because the national health policy requires populations of between 8,000 and 15,000 to set up a health clinic. In many parts of the country, where populations are sparse, the catchment area for the requisite population becomes very large, and many people travel long distances to access health facilities. The 2009 floods further exacerbated this problem by making it difficult to travel in certain areas or to reach health care facilities. Four health facilities in Caprivi-‐-‐ Mbalansinte, Isize, Schuckmansburg and Imparila Clinics-‐-‐ were completely surrounded by water, to date, are accessible only by boat or air, through Zambia by Road. In addition, at least six clinics and 86 outreach points were initially inaccessible in the Oshikoto, Omusati, Ohangwena and Oshana regions.
Financial Access. All the health facilities charge a nominal fee of N$ 4 in the clinics and N$ 8 in health centres and hospitals (during working hours). The fee changes to N$ 10 and N$ 20 for clinics, and health centres and hospitals, respectively, over the weekends and after working hours. Some services are free of charge, such as family planning, immunization, HIV counselling and testing, and TB medication. The 2009 floods caused disruptions to income, particularly amongst the vulnerable and poor populations of the northern regions, which compromised accessibility to health care services. Some areas responded by forgoing charges so that people were able to access facilities free of charge.
Early warning systems are in place in all the affected regions in form of disease surveillance. All health facilities visited were reporting diseases of epidemic potential on at least a weekly basis, and all other diseases on a monthly basis. The means of reporting from health facilities to the districts and regions are by telephone, fax and by submitting filled forms. However, in some health facilities-‐-‐ for instance Impalila, Kabbe, Isize, Mbalasinte and Schuckmansburg clinics in Caprivi-‐-‐ health workers are using their personal phones to report health data, and the network in some of those places is from Botswana, which makes it expensive for the health workers to communicate with the district or region. During the flood crisis the percentage of health facilities available dropped, because some facilities were cut off and had no means of communication. This compromised the disease monitoring for some time.
Mainly due to loss of property, some cases with psychosocial trauma have been reported in Caprivi, Kavango, Oshikoto and Oshana. Three cases of rape were also reported over one week period; one from Oshikoto and two from Oshana

Namibia Post Disaster Needs Assessment 136
Page 136
In almost all regions, an increase in the number of children who are severely malnourished due to the lack of food; abrupt breastfeeding and lack of appropriate complementary feeding was noted. As a result, health facilities began providing nutritional supplements.
In addition, due to floods some members of the community are experiencing skin diseases. At the Impalila clinic, there electricity and water services were cut off, and at the Schuckmansburg clinic there water services were disrupted. This severely impeded deliveries.
Immediate Response
Health and Nutrition Response:
A Flash Appeal for US$ 2.7 million was launched, which included a CERF component of US$ 1,299,825 that has been fully funded, of which US$ 808,171 (amounting to 62 percent) has gone to the health sector.
Two WHO experts were deployed in the field to provide technical advice and direction to the response. They visited the Omusati, Oshikoto, Ohangwena and Oshana, and Kavango and Caprivi regions, complementing government efforts. In addition a gender coordinator has been recruited, by UNFPA, to provide support against Sexual Gender Based Violence in the affected areas. One nutrition expert has been recruited by UNICEF.
A Health, Water and Sanitation coordination committee was established in Kavango and Caprivi regions comprised of a Regional Emergency Management Unit (REMU) Representative, and CMO; PMO: PHC, Representatives, Health Information Systems officers, and representatives from Nam Water and Rural Water Supply (NWRWS), WHO, UNICEF and NRCS, to further direct the response in a technical manner. In the north-‐central regions counsellors led village committees to deal with the disaster. Weekly meetings were held to discuss activities, identify the gaps and direct the response and resources equitably.
Disease trend monitoring every week in the affected regions is being done, and reports are being disseminated to committee members and other development partners. The most common diseases monitored are malaria and dysentery, but other notifiable diseases, such as cholera, measles, polio, meningococcal meningitis, and other emerging epidemic diseases, are also being monitored. No disease outbreak has so far been registered in the affected regions.
Distribution of Insecticides Treated Nets (ITNs) and water purification tablets and sachets by MOHSS and NRCS was done in the relocated camps. Health Outreaches were conducted daily in the camps in the first two weeks and reduced to twice a week in the following weeks. During the outreach sessions, health promotion and management of illnesses were done. Provision of safe water was done by NWRWS. For example in Oshana and Caprivi regions 26 outreach services were established during the floods.
The MoHSS was assisted by the Ministry of Defence, using helicopter to provide critical services. However, the reliability of the helicopter was a challenge, as there were only two helicopters to cover the four regions in the North Central area.

Namibia Post Disaster Needs Assessment 137
Page 137
WHO conducted training of health workers on cholera case management and Emergency Preparedness and Response (EPR) were conducted and flood response preparedness plans were made. UNFPA delivered 39 Reproductive Health kits in the affected regions to improve reproductive health services in the relocation camps. The EU also provided 73 humanitarian emergency kits to the flood affected regions and most of these included anti malarial medicines.
Management of severe malnutrition has been put in place by the MoHSS with the support of UNICEF. Some nutrition programs are in place in the country including high doses of vitamin A supplements, as well as community based therapeutic care programs for all children under the age of 5 years in the affected regions. In addition, food aid is being distributed among the displaced communities in the camps. However, the food ratio is being distributed by household, and does not take into consideration the number of occupants in the house. The only food provided was fish; maize meal and oil, although in some regions some people only received maize and oil and no fish.
Capacity gaps:
Referral. Most of the time, clinics and health centres refer patients to the hospitals that have one ambulance each. Referrals are rarely made from clinics to health centres. The health centres and clinics rely on these ambulances, when they have cases to refer. In most cases, in those regions that have one hospital, the ambulance is found to be needed at several clinics or health centres at the same time and given the distances to travel, some times it is too late to save lives.
In Kabbe Constituency, Caprivi Region. The Kabbe Constiuency faces a particular need. There are four clinics completely cut off from the main land, accessible only by boat, by air or through Zambia and Botswana by road. The nearest hospitals to refer cases to are hospitals in Zambia and Botswana, but this option is costly to patients, because patients pay N$ 100 per day in these hospitals.
Community care. Community health workers such as Traditional Birth Attendants (TBAs), medicine distributors, life ambassadors and traditional healers are in the communities, but are not linked to the health facilities in the area. For instance deliveries conducted by the TBAs in the communities are not known to the health workers in the health facilities. At present, not much is being done to address this, given the fact that people are far away. However, community care services should be focused on reducing on the burden of disease in the community.
Psychiatric care. All hospitals lack acute psychiatric in-‐patient care units, except at the Oshakati Intermediate Hospital. This means that psychiatric care services are limited in Kavango and Caprivi regions. Mental health cases are being admitted in the wards with the rest of the patients, or, in extreme cases, are referred to the Psychiatric Hospital in Windhoek, (a distance of 1,200 km from Katima, the town of Caprivi and 700 km from Rundu, the town of Kavango).

Namibia Post Disaster Needs Assessment 138
Page 138
Recovery Strategy
Goal: The overall goal of the health recovery process is to reverse the impact of the disaster on the population and the health systems and services in order to restore and improve the health and social well being of the population in the affected areas.
Objectives: 1. Ensuring provision of basic health and nutrition services including adequate Integrated
Disease surveillance and Response, nutrition surveillance and Epidemic Preparedness and Response
2. Ensuring reconstruction and repair of the damaged health infrastructure to agreed standards and recovery of losses
3. Establish community linkage with the health system through capacity building to ensure community mobilization and reporting for health
4. Ensuring access to safe water supply by health facilities and communities and good health through Health education and promotion
5. Organize mobilization and coordination mechanisms of resources including those with international donors, UN systems and government to implement the recovery result frame work including early recovery needs in the revision of the flash appeal.
Risks for success/failure:
Political will of the government is very crucial for the recovery programs to take effect Support of local, international community and donors Community ownership
Disaster Risk Management Issues Strategies to overcome disaster risks in the affected Regions:
Strengthen the capacity of health professionals in Epidemic Preparedness and Response including management of diseases of Epidemic potential and development of EPR Plans
Strengthen capacity of communities through recruitment and training of community health workers in life saving skills, such as provision of first aid to reduce the effects of injuries and drowning in the community during the crisis;
Strengthen Integrated Disease Surveillance and Response by training the health workers in collection, investigation, analysis and reporting and also introducing community based disease surveillance;
Strengthen nutrition surveillance system through setting up sentinel surveillance site;
Enhance the knowledge of health staff on prevention and treatment of malnutrition
Ensure that safe water supply is provided to all health facilities by testing the submerged boreholes supplying the clinics that were flooded and also collaborating with Nam water and rural water supply for provision of safe water to health facilities without water;

Namibia Post Disaster Needs Assessment 139
Page 139
Strengthen the transport and communication networks by providing ambulances to health centres and boats (especially in Caprivi) and provision of telephones to the health facilities; Strengthen Information, Education and Communication on early warning signs, disease prevention and health promotion
Provision of power in terms of solar energy to improve deliveries that occur at night in the health facilities without any source of power
Needs
Recovery expectations:
The expectations for recovery include the provision of a safe water supply to health facilities that were flooded, such as Mabushe, Lisikili, Schuckmansburg clinics.
In addition, a nutritional survey to assess the nutritional status of children and women in affected regions should be conducted. The survey will provide the prevalence of malnutrition in children which will assist in designing appropriate nutrition intervention in the affected areas.
Finally, there is a need to provide tents and screens for carrying out outreach health services for purposes of confidentiality and privacy at outreach service points most especially in camp situation.
Expectations – capacities gap
Need for capacity building to ensure that services are not disrupted. Need for telephone communications for health facilities such as Biro Clinic (Kavango Region), Schuckmansburg, Impalila, Kabbe, Isize, Mbalasinte Clinics (Caprivi Region) and Onakazizi, clinic (Oshikoto Region) to mention a few.
Where facilities are cut off, expand outreach services and ensure that there is communication (budget should be put aside for additional outreach services, fuel, as well as communication).
Purchase of two motor boats for accessing cut off clinics in Caprivi Region to work as ambulances and to transport medical supplies and equipment to the health facilities
Provision of means of transport to health centres especially those of Caprivi to quicken the process of referral and saving life to serve health centres and clinics that are attached to the health centres and to be used for outreach services
Need to have a link with the health facilities; identify, train and support the community health care workers. Link their reporting to the health facilities including community based disease surveillance
Train health workers at Regional and district levels in EPR and development of response plans and later cascade the training to lower levels
Build capacity of Health Information System and Health facility in-‐charges in data collection, analysis, reporting and interpretation and cascade the training to community health workers
Introduce acute psychiatric In-‐patient care services in Rundu intermediate hospital

Namibia Post Disaster Needs Assessment 140
Page 140
Upgrade one of the clinics in Kabbe Constituency to be a modern Health Centre that can handle most of the referral cases to solve the problem of flood barrier for referrals and post a Doctor there.
Policy implications:
Upgrading or construction of the modern health facility or setting up an acute psychiatric in-‐ patient unit will require policy to address the issue.
The activities from the recovery needs will be facilitated by: agreeing on an implementation plan and sharing information between delivery agencies and MoHSS, who will supervise on going activities with the purposes of ensuring that they are moving according to plan and agreed standards.
Intensive capacity building activities in training and health service provision will be done in the first year and the rest will be completed within four years.
Estimate of the health recovery and Reconstruction needs:
Table 75: Estimates of health recovery and reconstruction needs (N$)
ITEMS Total (N$) A. Reconstruction B. Recovery and filling in capacity gaps Health and nutrition education and promotion (including outreach teams) 400,000 Nutrition survey and surveillance 300,000 Integrated management of malnutrition 100,000 Transport and communication for health facilities: boats for Caprivi, 100,000 Ambulances (5) 3,500,000 Telephones 21,000 Screens and tents for outreach points 210,000 Community Link including community based disease surveillance (Pilot in Caprivi and Kavango)
500,000
Epidemic preparedness and Response (EPR) 200,000 Integrated Disease Surveillance and Response (IDSR) 300,000 Acute Psychiatric care unit in Rundu intermediate hospital -‐ Modern Health Centre in Kabbe Constituency -‐ Water and solar power to the Health facilities lacking 300,000 Coordination and supervision of health services and recovery activities 300,000 Total 600,000

Namibia Post Disaster Needs Assessment 141
Page 141
Annex 9: Education
Introduction
Namibia’s constitution states that every child should attend school until s/he completes Grade 7 or reaches the age of 16, whichever comes first. Eighteen years after independence, the Government of the Republic of Namibia, through the Ministry of Education, remains committed to providing quality and accessible education for its citizens. This commitment is demonstrated in the 2009 allocation of 21 percent of the national budget to the education sector.
The education system is divided into three main school phases: the primary phase (grades 1 – 7), junior secondary phase (grades 8 – 10) and the senior secondary phase (grades 11 -‐ 12). Additional vocational education and training (VET) and tertiary education (including teacher education) are also under the mandate of the Ministry of Education. Early childhood development (3-‐4 years of age) is primarily managed by the Ministry of Gender Equality and Child Welfare and pre-‐primary education in Namibia is being integrated into formal education. Private schools play an important role in the provision of general education in Namibia, particularly in urban centres. According to the current National Development Plan (NDP3), non-‐formal adult education (including family literacy) and access to relevant information are recognized in Namibia as contributors to lifelong learning and a major part of the State’s education provision (NDP3).
Damage and Losses Assessment
According to the 2008 EMIS there are 1,672 schools in Namibia (made up of 1,571 state schools and 101 private schools) and 577,290 learners (with 550,470 in state schools and 26,820 in private schools). Of the total number of learners in the country, 59 percent (340,930 learners) are located in the six affected regions, in 1,251 schools. In addition, in these six regions there are three vocational training centres and five tertiary education institutions as shown in the table below:
Table 76: Schools and learners in flood-‐affected regions
Region No. of schools No. of learners
No. of vocational education institutions
No. of tertiary education institutions
Caprivi 97 26,850 1 1 Kavango 330 70,392 1 1 Ohangwena 235 47,691 0 0 Omusati 269 87,221 0 1 Oshana 132 52,077 1 2 Oshikoto 188 56,699 0 0 Total 1,251 340,930 3 5
Although education infrastructure is the responsibility of the Ministry of Education, it is noted in the 2008 EMIS Report that in Namibia, large numbers of schools were initiated and initially built by parents who constructed "traditional" classrooms using materials which were available to them (normally poles, mud and thatch or corrugated iron sheets). At times the Government provided "prefabricated" buildings, often constructed from asbestos sheets, to build as many classrooms as
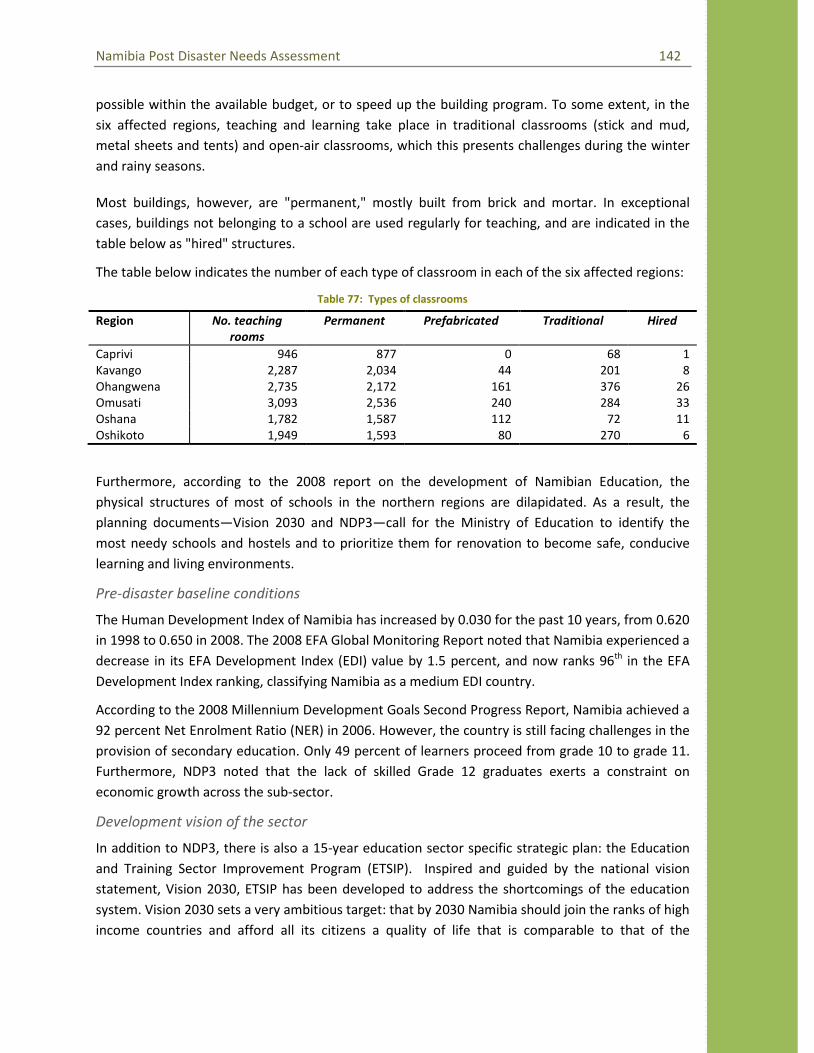
Namibia Post Disaster Needs Assessment 142
Page 142
possible within the available budget, or to speed up the building program. To some extent, in the six affected regions, teaching and learning take place in traditional classrooms (stick and mud, metal sheets and tents) and open-‐air classrooms, which this presents challenges during the winter and rainy seasons.
Most buildings, however, are "permanent," mostly built from brick and mortar. In exceptional cases, buildings not belonging to a school are used regularly for teaching, and are indicated in the table below as "hired" structures.
The table below indicates the number of each type of classroom in each of the six affected regions:
Table 77: Types of classrooms
Region No. teaching rooms
Permanent Prefabricated Traditional Hired
Caprivi 946 877 0 68 1 Kavango 2,287 2,034 44 201 8 Ohangwena 2,735 2,172 161 376 26 Omusati 3,093 2,536 240 284 33 Oshana 1,782 1,587 112 72 11 Oshikoto 1,949 1,593 80 270 6
Furthermore, according to the 2008 report on the development of Namibian Education, the physical structures of most of schools in the northern regions are dilapidated. As a result, the planning documents—Vision 2030 and NDP3—call for the Ministry of Education to identify the most needy schools and hostels and to prioritize them for renovation to become safe, conducive learning and living environments.
Pre-‐disaster baseline conditions
The Human Development Index of Namibia has increased by 0.030 for the past 10 years, from 0.620 in 1998 to 0.650 in 2008. The 2008 EFA Global Monitoring Report noted that Namibia experienced a decrease in its EFA Development Index (EDI) value by 1.5 percent, and now ranks 96th in the EFA Development Index ranking, classifying Namibia as a medium EDI country.
According to the 2008 Millennium Development Goals Second Progress Report, Namibia achieved a 92 percent Net Enrolment Ratio (NER) in 2006. However, the country is still facing challenges in the provision of secondary education. Only 49 percent of learners proceed from grade 10 to grade 11. Furthermore, NDP3 noted that the lack of skilled Grade 12 graduates exerts a constraint on economic growth across the sub-‐sector.
Development vision of the sector
In addition to NDP3, there is also a 15-‐year education sector specific strategic plan: the Education and Training Sector Improvement Program (ETSIP). Inspired and guided by the national vision statement, Vision 2030, ETSIP has been developed to address the shortcomings of the education system. Vision 2030 sets a very ambitious target: that by 2030 Namibia should join the ranks of high income countries and afford all its citizens a quality of life that is comparable to that of the

Namibia Post Disaster Needs Assessment 143
Page 143
developed world. Through ETSIP the education sector has undergone a dramatic reform of its overall national development strategy, to be in line with the EFA and Millennium Development Goals.
Pre-‐Disaster Situation
The 2008 EFA Global Monitoring Report notes that Namibia is among those countries at serious risk of not achieving the goal of a total Net Enrolment Ratio (NER) of 97 percent. Disparities have increased between rural and urban enrolment rates, with rural attendance rates declining while urban rates have increased.
Enrolment
The 2008 EMIS report also indicates that the Gross and Net Enrolment Ratio (GER/NER) for Namibia decreases as age and grade progresses and it is more significant among male learners than female learners (see table below):
Table 78: 2008 Gross and Net Enrolment Ratios
Age/Grade
Age group 7–13 Grades 1 – 7
Age group 7–13 Grades 1 -‐ 7
Age group 7–13 Grades 1 – 7
Age group 7–13 Grades 1 – 7
Total 97.4% 123% (GER)
96.8% 112.5% (GER)
92.8% 99.8% (GER)
54.5% 67.9% (GER)
Female 99.2% 121.6% (GER)
98.8% 113.1% (GER)
94.4% 100.7% (GER)
60.2% 72.2% (GER)
Male 95.7% 124.5% (GER)
94.8% 111.9% (GER)
91.0% 98.9% (GER)
48.7% 63.4% (GER)
Source: EMIS, 2008
The 2008 EFA Global Monitoring Report notes that the Gross Enrolment Ratio (GER) in pre-‐primary education has improved substantially since 1999, Namibia being a country with previously low or moderate level of participation.
Literacy
The 2008 MDG Progress Report also indicated that the literacy rate (93 percent) has not seen much progress, and it is unlikely that the target of 100 percent will be reached by 2012. Furthermore, based on the Southern African Consortium for Monitoring Education Quality (SACMEQ) reports, the general competence level of learners in Namibia is low as compared to other southern and eastern African countries.
As a result, both NPD3 and ETSIP are targeting for pro-‐poor expansion of secondary education and increased enrolments. NDP3 is especially committed to improving the NER for primary education to 99.1 percent and for secondary education to 65.4 percent by 2012.

Namibia Post Disaster Needs Assessment 144
Page 144
Table 79: Number of schools in the affected regions
Education Region
School level and number of children enrolled
Primary Combined Secondary Total Schools Children Schools Children Schools Children Schools Children Caprivi 47 18,620 38 12 8,154 97 26,774 Kavango 266 54,891 52 12 14,815 330 69,706 Ohangwena 127 23,740 90 18 23,740 235 47,480 Omusati 147 60,731 98 24 25,837 269 86,568 Oshana 66 33,164 50 16 18,410 132 51,574 Oshikoto 121 39,617 52 15 16,845 188 56,462 Total 774 230,763 380 97 107,801 1,251 338,564
The National Development Plan, NDP3 (2008 – 2012), is a five-‐year strategic plan for the entire nation, aimed at making progress towards achieving the national long-‐term development goals. Within the framework of NDP3 the education sector is tasked to provide an increased supply of middle to high level skilled labour to meet market demands over the next five years.
Orphans and vulnerable children (OVCs)
Even though the Education Sector Policy for OVCs is in place, there are only 1,070 handicapped children registered in Namibian schools. An estimated 27,000 of the handicapped children are still out of school. Furthermore, children of the most marginalized group of the Namibian communities, the San, are still out of school (ETSIP Technical Discussions, May 28, 2009).
Education for sustainable development
For Namibia, education for sustainable development (ESD) is key to a comprehensive education sector response to natural disasters. Sustainable development is understood as development that meets the needs of the present without compromising the ability of future generations to meet their own needs. An integrated approach to disaster risk reduction should include capacity building activities for Education Officers and government officials on disaster preparedness, prevention and mitigation in order to avoid and/or reduce the negative effects of future disaster situations.
Education financing
The government has invested in the education sector over many years, and about 25 percent of the national budget is allocated to education in 2008/2009 and 21 percent for 2009/2010 financial year. For the 2008/2009 financial year 50 percent of the education budget was allocated to pre-‐primary and primary education. The 2008 MDG Progress Report notes that this investment has led to higher accessibility of schools and better facilities even though teachers’ salaries absorb most of the funds.

Namibia Post Disaster Needs Assessment 145
Page 145
Table 80: Budget for 2008/2009 and 2009/2010
Budgeted amounts (N$ million) 2008/2009 2009/2010 Operational budget 4,514,601 4,904.310 Development budget 172,960 313,761 Contribution from development partners 95,200 156,800 Total 4,782,761 5,374,871
(Source: ETSIP Technical Discussion, May 28, 2009)
Table 81: Program allocation for 2008/2009 and 2009/2010
Program Financial Year (N$ million) 2008/2009 2009/2010 General Education (Grades 1 – 12) 3,756,432 4,112,555 Adult Education and Lifelong Learning 138,425 158,029 Vocational Education and Training 134,027 164,746 Knowledge and Innovation 11,186 11,054 Tertiary Education and Training 736,251 923,087 HIV and AIDS 6,440 5,400 Pre-‐primary/ECD 2,000 Capacity Building 1,000 Total 4,782,761 5,377,871
Table 82: Government expenditure 2008/2009 by February 28, 2009
Sub-‐program 2008/2009 Budget (N$ million)
Expenditure (N$ million)
Percentage disbursed
General Education 125,316 102,969 82 ICT in Education and Training 25,087 24,952 99 Adult Education and Lifelong Learning 8,960 5,836 65 Vocational Education and Training 17,919 8,305 46 Knowledge and Innovation 1,356 409 10 Tertiary Education and Training 7,168 1,963 27 HIV and AIDS 3,584 3,449 96 Pre-‐primary 1,792 1,792 100 ECD (Early childhood) 1,792 410 23 Capacity building 1,790 298 16 Total 195,200 150,153 77
Despite the investment in education, the numbers of learners dropping out of school and the repetition rates are causes for concern. In 2000 more than 54 percent of learners had repeated a grade, and in 2006 about 10,000 learners dropped out of school. The main reasons for dropping out of school were cited as pregnancy, demands from parents, and distance to school, a situation which is exacerbated by flooding.
Large proportions of schools in Namibia do not have toilets, water, telephones or electricity. The Namibian Ministry of Education has put in place a policy to reduce the overcrowding of classrooms, replace "traditional" structures, and to provide sanitary facilities and the basic services at all schools.

Namibia Post Disaster Needs Assessment 146
Page 146
Parental involvement in the education of their children
At this stage parental involvement in the education of their children, especially children with special needs, is minimal. Even though there are policies stipulating that each school should have a school board, whose membership is drawn from its immediate community, in the affected regions only a few schools managed to establish functional school boards. Government schools do not have proper PTAs, even though parents and schools’ administrators are aware that parental involvement is an important factor in children’s learning. However it is often a challenge to involve parents.
Deployment of teachers in Namibia
Teachers in Namibia obtain their training and qualifications in different education systems. Teacher training is mainly the responsibility of the Colleges of Education and the Faculty of Education at the University of Namibia. Within the framework of ETSIP the goal is to improve the utilization of teaching staff, especially given that the salary bill is higher than the country can afford.
Damage and Losses Assessment
Methodology of the Education Needs Assessment
Data was collected to assess the damages, losses and human recovery needs. The education team conducted a document review and validated findings through interviews with Ministry of Education and Ministry of Works personnel in Windhoek, and school visits in the six affected regions. Quantitative and qualitative data was analyzed to develop the basis of a recovery framework.
General description of the impact of the flooding According to the Ministry of Education, 412 schools have been affected by the 2009 flood with 159 completely closed, thus disrupting teaching and learning for approximately 96,825 children, or about 17 percent of the total learners in the six affected regions (FEMCO, April 3, 2009; OPM’s Report, March 2009). In late May, the PDNA team found that damages caused by the floods affected25
25 The Government’s interpretation of “affected” is schools that have their buildings inundated with water and therefore recommended for closure; schools that are no longer accessible as all access routes are impassable due to high water levels; and, finally, schools whose infrastructure is intact, located on high ground but still surrounded by flood water, although the learners can still access the school through other routes. For the purposes of this assessment, “affected” implies partially and completely closed schools for Omusati, Ohangwena, Oshana and Oshikoto. For Caprivi, “affected” includes schools which were open but isolated because they were partially or totally surrounded by water with limited road access, as well as schools that were closed and relocated to higher ground or temporary camps.
328 schools and 93,770 learners across the six regions (as seen in the table below). Interviews with the MOE central and regional office and school administration personnel as well as tertiary and techno-‐vocational institutions confirmed prior FEMCO and EMIS reports that the public primary, secondary and combined schools were the most affected in the six regions. The table below highlights that fact.

Namibia Post Disaster Needs Assessment 147
Page 147
Table 83: Number of schools and learners affected by the floods
Number of schools affected
Total number of schools
% affected Number of learners affected
Caprivi 29 97 29.90 6,571 Kavango 7 326 2.15 2,366 Ohangwena 63 238 26.47 24,355 Omusati 107 266 40.23 39,163 Oshana 83 131 63.36 15,301 Oshikoto 39 188 20.74 6,014 TOTAL 328 1246 26.32 93,770
Source: Interviews with EMIS, Education regional office and school staff in affected regions (May 2009)
The Ministry of Education recommended some schools for closure, especially the lower grades of 1-‐4. Older learners were able to continue going to school, albeit with difficulty, as access roads to schools were cut by flooding. A major worry among the education authorities were the learners who were due for examinations, as they were losing learning time due to school closures (OPM Report, March 2009). Schools were interrupted, on average, for one month, between March 6, 2009 and April 3, 2009. The Ministry of Education however made a plan, and missed classes were conducted over school holidays with no extra remuneration for teachers and school administrators.
Most of the primary, secondary and combined schools under study reported partial damages to property, structure, and sewerage facilities. The highest damage reported was for Omusati (55 percent) where four hostel blocks were flooded and in need of replacement. In value terms, the damages are estimated at N$29.81 million and the losses at N$3.67 million. The total damages and losses are summarized below.
Table 84: Flood damage and losses by region
Region Damages Losses Regional %
Caprivi 1,170,856.90 48,844.88 4%
Kavango 294,000.00 2,870.40 1%
Ohangwena 820,000.00 408,289.05 4%
Omusati 15,287,908.14 3,133,044.40 55%
Oshikoto 9,348,100.00 -‐82.6826 28%
Oshana 2,886,650.81 81,996.90 9%
TOTAL N$ 29,807,515.85 3,674,962.95 100%
Some school buildings were reported as damaged, which included pit latrines, and some minimal loss of furniture and teaching and learning materials, all of which need to be replaced. Equipment
26 Except for Oshikoto, the other regions experienced food savings, because they did not provide food to learners when schools were closed due to the flood. They did resume the school feeding program when schools opened. Since Oshikoto primary schools closed for only 10 days and re-‐opened for 14 holidays where they provided food, Oshikoto spent more money on providing food than they would otherwise have done on school days alone.

Namibia Post Disaster Needs Assessment 148
Page 148
was reported as largely unaffected, as perhaps it had been stored in advance of the flooding. Affected schools were typically in rural areas, and composed of a mix of permanent and traditional structures. In Caprivi, a total of eight schools (four primary and four combined) suffered physical damages and need some renovation as a result of inundations. Although these schools were relocated with most of their furniture and equipment, it is estimated that half of the textbooks, desks and chairs, as well as chalkboards will need to be replaced. In Omusati, the hostel blocks of one secondary school have been compromised, which amounts to an escalation in costs, as the construction of the Otjorute road diverted the flow of water, causing these blocks to be damaged by the floods. In Ohangwena, one primary school has suffered physical damage (two permanent classrooms flooded). In Oshana, one combined school was affected (one block of classrooms). No physical damage to schools was identified for Kavango and Oshikoto. Across all regions, the damage was exacerbated by the fact that infrastructure was not well maintained prior to the floods.
A further analysis by level of educational institution revealed that the major categories of damage across primary, secondary and combined schools were sewerage and repairs, rehabilitation and reconstruction. (see Table 85 below) In the case of primary schools, sewerage or damage to toilets/sanitation facilities was as high as 64 percent of the total damage values. This is because toilets tend to be located on lower ground compared to the classrooms and were vulnerable to flooding.
Table 85: Total damage by level of school
Primary Schools Partially Damaged Schools Construction 28% Furniture 7% Sewerage 64% Other 1% Secondary Schools Partially Damaged Schools Construction 94% Furniture 0% Sewerage 6% Other 0% Combined Schools Partially Damaged Schools Construction 7% Furniture 6% Sewerage 86% Other 0%
Road infrastructure was a major impediment to school access. New roads surrounding schools are being built without taking into consideration water flows, resulting in schools being flooded. Recovery measures pertaining to this are discussed in a later section.

Namibia Post Disaster Needs Assessment 149
Page 149
Under losses, three major categories emerged: (i) food savings; (ii) demolition costs; and (iii) loss in school revenues. The Ministry of Education Regional Offices saved money when schools were partially or completely closed due to floods as they did not provide food to learners during this time. Primary and Combined schools have a school feeding program under which one meal a day is provided to learners, while secondary schools have hostels which provide three meals a day.27
Impact on educational processes (teaching/learning, curriculum, learning outcomes)
The second largest loss was the demolition cost for the damaged hostels at Onesi Secondary in Omusati. Finally, the third largest category was school revenues to public schools in the Caprivi region. In Caprivi, particularly, 1,378 learners were relocated from flooded schools and 10 percent are consequently not expected to be able to pay fees (regional average N$75/term).
Access to schools was disrupted in all regions affected as schools had to be closed for varying times, depending on the severity of the flood waters. Schools affected were either partially (generally pre-‐primary and junior primary levels) or completely closed because flooded roads prevented access to school.
Across the affected regions, schools at all levels developed plans to catch up with teaching and learning times lost by offering extended hours, holiday classes and/or double shifts so that learners are ready for examinations. However, some learners were not absorbed in the school system. In Caprivi, 110 learners from Nakabolelwa Combined School did not benefit from access to temporary school arrangements and effectively lost almost three months of education. The provision of tents for use as temporary shelters near pupils’ school of origin was recently requested. Remedial measures adopted in other schools (double shift and use of school holidays) are unlikely to be enough to allow them to catch up with the significant period of time lost so far.
As suggested by anecdotal evidence in interviews with school principals (five in Caprivi), relocation due to floods is expected to have a detrimental effect on the quality of educational outcomes, especially performance in final examinations.
Disaster preparedness and management
While FEMCO and REMU take the lead in disaster preparedness and response, the level of disaster preparedness was minimal at best at the Regional Education Offices and within schools. There is currently no disaster preparedness sensitization or planning at the school levels. The Ministry of Education does not have a dedicated line item to respond to disasters and liaises with FEMCO/REMU for that purpose. While regional authorities do coordinate with FEMCO and the regional equivalents, REMU, there are time lags reported between requests and delivery of resources required to cope with the flood.
27 Unit cost/learner at primary and secondary levels: N$1.56/day. Source: Sanet Cloete, Regional Deputy Director, Ohangwena and Ikera, Ministry of Education Central Office, May 2009. Unit cost/secondary learner is N$19 on average. Sources: Hostel Officers, Regional Offices in Oshikoto, Ohangwena, Omusati and Oshana.

Namibia Post Disaster Needs Assessment 150
Page 150
Cross-‐Cutting Themes
HIV & AIDS
In Namibia, more than 180,000 people aged 15-‐49 are estimated to live with HIV (i.e. prevalence rate of 15.3 percent). HIV and AIDS disproportionately affects young people aged 15-‐24; females; and those living in the Northern regions of Namibia, which have been affected by the 2009 floods. Nationally, the epidemic is affecting the size, growth rate, age, and skill composition of both current and future workforces, the largest proportion of which is employed in the education sector (approximately 38,000 employees). The HIV and AIDS epidemic is also changing the demand, supply, and quality of education.
Displacement and disruption of schooling can have significant and detrimental effects on socio-‐economic and health conditions. Providing temporary schooling, and ensuring education systems are reconstructed, can provide safe spaces for vulnerable children, including orphans and children living with HIV, to access key services (such as school grants, guidance and counseling, or feeding programs). Formal and non-‐formal education can contribute to the prevention of increased prevalence rates through awareness raising activities.
Protection and child protection
Displacement of communities and damage to school buildings disrupt educational provision and put individuals at risk in environments that should be protective. Relocation and the necessity to travel further distances to school, increases the risk of abuse and harassment and deters parents from sending children, particularly girls, to school. Within temporary shelters, a lack of adequate lighting, inadequate and mixed toilets and bathing facilities, unclean water, overcrowded tents and poor location combined with inadequate perimeter fencing also increase the risk of gender-‐based violence and child abuse. In Caprivi, in particular, the lack of sanitation facilities has been noted as a vital concern.
Schools can act as protective providers of adequate facilities. Under appropriate conditions of security, provision of education can also help protect children and youth from forced labor, prostitution, criminal activities and drug abuse. Education can provide life-‐saving messages regarding flood-‐onset and promote early warning systems. Non-‐formal education and awareness-‐raising of circumstantial dangers for women and children can help to build community resilience and capacity to develop protective mechanisms at the local level.
Gender
Girls are at particular risk of exploitation and abuse during displacement. Inadequate lighting and bathing facilities in temporary shelters make women and girls vulnerable and fearful of sexual abuse and harassment. Teenage pregnancy is a common cause of school dropout after emergencies, and cases were reported in the regions assessed. Education can impart safe-‐sex messages to children and communities, both in regular school curricula and through informal activities during times of displacement. Changing circumstances, such as the need to travel further distances to school and the need to care for younger siblings, are also reasons for dropout at times of displacement and often impact girls more than boys. However, provision of education during

Namibia Post Disaster Needs Assessment 151
Page 151
displacement can also help to overcome gender disparities. Girls may have the opportunity of access to schooling more regularly than they did before the crisis.
Livelihoods In many rural areas, especially those affected by the 2009 floods, the primary source of community income is often from teachers. Many communities otherwise largely rely on traditional activities, such as fishery or agriculture. Community reliance on livelihoods and public land mean that they are reluctant to relocate unless a school can also be relocated and food support guaranteed during the period of relocation. In Caprivi, civil servants and teachers affected were not entitled to access food relief items, despite the political decision to provide food relief to all populations affected.
Recovery Strategy
The goal of the education sector’s Recovery Framework is to re-‐establish educational services in the flood-‐affected areas to a standard equal to or better than existed before the disaster. Those efforts will be guided by Namibian national policies and standards and the INEE Minimum Standards for Education in Emergencies, Chronic Crises and Early Reconstruction.
The recovery strategy in the education sector is to:
ವ Re-‐establish access to schools for children affected by the floods, by repairing and reconstructing schools as required, provision of additional classrooms, sewerage facilities, school materials and furniture;
ವ Improve road access to schools;
ವ Pre-‐position disaster management and response materials for the education sector, e.g. tents, building materials, school-‐in-‐a-‐box;
ವ Provide psychosocial support for teachers and learners;
ವ Provide compensatory teaching and accelerated learning and support to children, who have missed significant amounts of class time, to pass examinations, where applicable;
ವ Prevent idleness among children during school closures through non-‐formal education programs including, interactive learning activities for younger children, literacy and vocational skills training in non-‐hazardous occupations for older children and youth;
ವ Provide in-‐school awareness-‐raising on disaster risk reduction;
ವ Provide life-‐skills program including HIV and AIDS, hygiene lessons and protection messages for destitute children, parents and teachers;
ವ Strengthen facilities and faculties of Education Resource Centres in the flood-‐affected regions to support more decentralized and need-‐based teacher training;
ವ Assess the effectiveness and comprehensiveness of disaster response and disaster risk reduction elements in the Namibian school and teacher training curricula and propose necessary reforms;
ವ Provide in-‐service and pre-‐service training for teachers in disaster risk reduction;

Namibia Post Disaster Needs Assessment 152
Page 152
ವ Strengthen the capacity of multipurpose community centres to access early warning information and services and sensitize their communities on risk reduction measures;
ವ Promote dialogue between government officials and communities recurrently affected by floods; develop emergency plans adhered to by all and a medium-‐term vision for the possible permanent relocation of schools (or specific school cycles) to safer locations;
ವ Strengthen school-‐level planning and preparation for future floods, droughts and wild fires;
ವ Provide training in planning, management and administration of disaster response for Education Officers and other agency officials to be able to deal with natural disasters in future;
ವ Provide training in the INEE Minimum Standards; and
ವ Undertake additional research studies to improve the evidence base for future interventions, notably in-‐depth disaster assessment by type of educational institutions; hydro-‐geological mapping of school sites and feeder roads; assessment of sewerage systems in schools.
Table 86: Early and Longer Term Recovery and Reconstruction (N$ Million)
Subsector Needs (Program Priority Interventions)
Early Recovery
Longer Term Recovery
Recons-‐truction
Total
Repair and reconstruction of schools, including provision of additional classrooms, sewerage facilities, school materials and furniture28
56.0 29.8 56.029
Improved road access to schools30 57.0 57.0 Pre-‐positioning disaster management and response materials for the education sector, e.g. tents, building materials, school-‐in-‐a-‐box31
15.0
15.0
Psychosocial support for teachers and learners32 3.3
3.3
Compensatory teaching and support to learners, who have missed significant amounts of class time, to pass examinations, where applicable33
1.0
1.0
Non-‐formal education programs including interactive learning activities for younger children, literacy and vocational skills training in non-‐
0.4
0.4
28 See tables in text. 29 This refers to the recovery costs to build back better. It represents an alternative to the reconstruction figure which is the cost of rebuilding to pre-‐ flood conditions. 30 See tables in text. 31 School-‐in-‐a-‐Box: 25 @ N$200,000 = N$5,000,000. Assumptions for tents and building materials will follow in Flash Appeal. 32 328 schools @ N$10,000 = N$3,280,000 33 1,000 learners @ N$1,000 = N$1,000,000

Namibia Post Disaster Needs Assessment 153
Page 153
hazardous occupations for older children and youth, in camps34 In-‐school awareness-‐raising on disaster risk reduction (including materials production, printing and distribution)35
0.5
0.5 0.5 1.5
Life-‐skills program including HIV and AIDS, hygiene lessons and protection messages for destitute children, parents and teachers, in camps36
0.2
0.2
Strengthening Education Resource Centres37 2.0 1.0 3.0 Assessment of the effectiveness and comprehensiveness of disaster response and disaster risk reduction elements in the Namibian school and teacher training curricula38
0.8
0.4
1.2
In-‐service and pre-‐service training for teachers in disaster risk reduction39
3.3
0.3 0.3 3.9
Strengthen the capacity of multipurpose community centres to access early warning information and services and sensitize their communities on risk reduction measures40
0.8
8.0
Promote dialogue between government officials and communities recurrently affected by floods; develop emergency plans adhered to by all and a medium-‐term vision for the possible permanent relocation of schools (or specific school cycles) to safer locations41
0.5
0.5
Strengthen school-‐level planning and preparation for future floods, droughts and wild fires42
1.6
1.0 2.6
Training in planning, management and administration of disaster response for Education Officers and other agency officials43
0.15
0.15
0.3
Training of Ministry and agency staff in the INEE Minimum Standards44
0.15
0.15
0.3
Additional research studies45 24.0 24.0
TOTALS 27.7 125.5 55.6 208.8
34 1,642 learners @ N$250 = N$410,500 35 93,770 learners @ N$5.00 = N$468,850 in each phase. 36 1,642 learners @ N$100 = N$164,200 37 6 Education Resource Centers @ N$500,000 = $3,000,000 38Namibian and international expert consultancies, consultative process, trialling and training N$1,200,000. 39 IST: 3,000 teachers @ N$1,000 = N$3,000,000; PST: 600 teachers p.a. @ N$500 x 3 years = N$900,000. 40 Strengthen 2 centers @ N$400,000 = N$800,000; create 4 new centers @N$2,000,000 = N$8,000,000. 41Community consultation process including workshops, documentation and communication = N$500,000. 42 328 schools @ N$8,000 = N$2,620,000 43 30 trainees @ N$5,000 = N$150,000 x 2 courses = N$300,000 44 30 trainees @ N$5,000 = N$150,000 x 2 courses = N$300,000 45 3 studies @ N$8,000,000 = N$24,000,000
208.8

Namibia Post Disaster Needs Assessment 154
Page 154
Annex 10: Environment
Introduction
Natural disasters are by definition environmental events, and it is therefore difficult to precisely define what should and should not be included under the environment sector in a PDNA. For the damage and loss assessment, the environment sector essentially includes impacts on natural assets, including protected areas, and environmental clean-‐up costs, where these do not already fit readily into other sectors. Hence, impacts to production forests and fish stocks in commercial fisheries are covered under agriculture and fisheries, but impacts to natural resources which do not have established markets or are not subject to extractive use often fall between the cracks and may be incorporated into the environment sector. Impacts on water supplies and environmental health issues are usually covered by the water and sanitation and health sectors, but broader issues of water pollution and widespread debris disposal may fall under the environment. The interconnection of environment with the impacts assessed under various sectors means that:
Coordination is with other sectors is very important to ensure that impacts are neither double-‐counted nor overlooked.
The environment sector tends to include the impacts that are hard to evaluate because established markets do not exist.
Since many impacts on environmental assets are assessed under other sectors and those remaining are difficult to quantify, the damages and losses presented under the environment sector typically under-‐represent the real magnitude of the environmental impact of a disaster.
As well as the enumeration of damages and losses under the environment sector, it is therefore also necessary to provide a broader narrative of the role of environment in the disaster, including environmental impacts covered by other sectors, environmental factors that may have contributed to vulnerability to the extreme event in question, and environmental impact mitigation during reconstruction.
Pre-‐Disaster Situation
With its low population density and large expanses of arid or semi-‐arid land poorly suited to intensive agriculture, Namibia’s natural environment is generally in very good condition. The population of wild game animals in the country is equivalent to the human population, approximately two million.
Economic sectors based on natural resources—notably mining, fisheries and agriculture, and tourism—directly contribute roughly 20 percent of Namibia’s GDP, based on national accounts. This however underestimates the broader economic contribution of the environment, especially in the case of tourism, which is overwhelmingly nature-‐based. The establishment of a Tourism Satellite Account has demonstrated that tourism directly provides around 4 percent of GDP, and including indirect contributions accounts for around 14 percent. This is considerably more than the 1.6 percent of GDP contributed by hotels and restaurants sector in the standard national accounts, which is typically used as the proxy for tourism.

Namibia Post Disaster Needs Assessment 155
Page 155
The importance of the natural environment is therefore well-‐recognized and Namibia has an extensive protected areas system, which alone contributes an estimated 3-‐6 percent of GDP. The Namibia Vision 2030 states succinctly that, “Our environment is clean, and we will continue to keep it clean.” The need to extract and safeguard economic benefits from environmental resources is also recognized, especially for the poor. Community-‐Based Natural Resource Management (CBNRM) is mentioned prominently in the Vision, and has been a major program within the Ministry of Environment and Tourism in recent years. This has developed an extensive system of communal conservancies; communal lands that are managed by legally mandated community organizations for tourism income and to regulate local resource use (see figure below).
Figure 40: Registered communal conservancies in Namibia
The major long-‐term environmental challenges for Namibia will be posed by rapid population growth and climate change. Due to the relatively light development pressures to date, much remains to be done to strengthen systems for environmental impact assessment and mitigation, currently well-‐established only for large mining operations. There have been active successes for environmental management, however, such as the rapid development of the national CBNRM approach, and increases in numbers of large wildlife throughout much of the country.

Namibia Post Disaster Needs Assessment 156
Page 156
Damage and Losses Assessment
The 2009 flooding mostly affected three geographically distinct regions across northern Namibia. From east to west:
Caprivi & Kavango. This is the most densely forested region of Namibia, but the forests are still relatively dry and open with grasses and shrub occupying much of the area. The forests are based on remnants of ancient Kalahari linear dunes that form a remarkable system of parallel shallow vales only around 2km in width, but stretching over hundreds of kilometres in length. The areas actually flooded were confined to the floodplains of the major rivers. In eastern and southern Caprivi, the Zambezi and Chobe rivers have broad floodplains largely covered by grasses, with only sporadic clumps of trees on slightly higher mounds that are often also shared with small settlements. The Okavango and Kwandu have narrower floodplains covered with mostly with grasses, but also with denser gallery forest in some areas.
Although the overall population of Caprivi and Kavango is not high, it is concentrated along the edge of the floodplains, and increasing within them. Very little of the area (around 4 percent) is converted to permanent agriculture, but that does not mean that habitats have not been modified over time by burning, grazing and probably itinerant agriculture. There are four state protected areas46
Kouvelai system. The area of north central Namibia affected by the flooding comprises a unique and convoluted fan of shallow channels called Oshanas, which have also formed around a vestigial ancient Kalahari dune system, and spreads across four regions (Oshikoto, Oshana, Omusati & Ohangwena). This whole system drains gradually into the extensive Etosha salt pan at the center of Etosha National Park. This is the most densely populated region of Namibia, and there is a stark contrast between Etosha, one of the world’s most renowned large game parks, and the Oshanas to the north, which have been extensively degraded for at least two decades.
within the impacted area. Caprivi contains eight established communal conservancies and a similar number are in the process of establishment, which between them cover most of the area of land outside of the formal protected areas system.
The natural vegetation consists mainly of grasses in the seasonally wet Oshanas themselves, and of scrub or low-‐tree savanna on the higher ground between the channels. Vegetation has been extensively degraded by over-‐population, sedentarization and overgrazing, resulting in increasing soil erosion and threat of desertification. Although the area still supports important bird life, large mammals have been largely lost from the landscape beyond the northern boundary fence of Etosha.
Kunene. The Kunene river forms the western part of Namibia’s northern border. This river also flooded, but as the extent was relatively limited and the surrounding area is mostly desert with only human habitation and infrastructure, it was not covered in the assessment.
46 Mahangu Wildlife Reserve, Bwabwata National Park, Mudumu National Park, and Mamili National Park. Note that Mahangu is actually a core zone of Bwabwata, but as it is managed as a distinct unit and separate visitor data was available, it is treated as a separate area here.
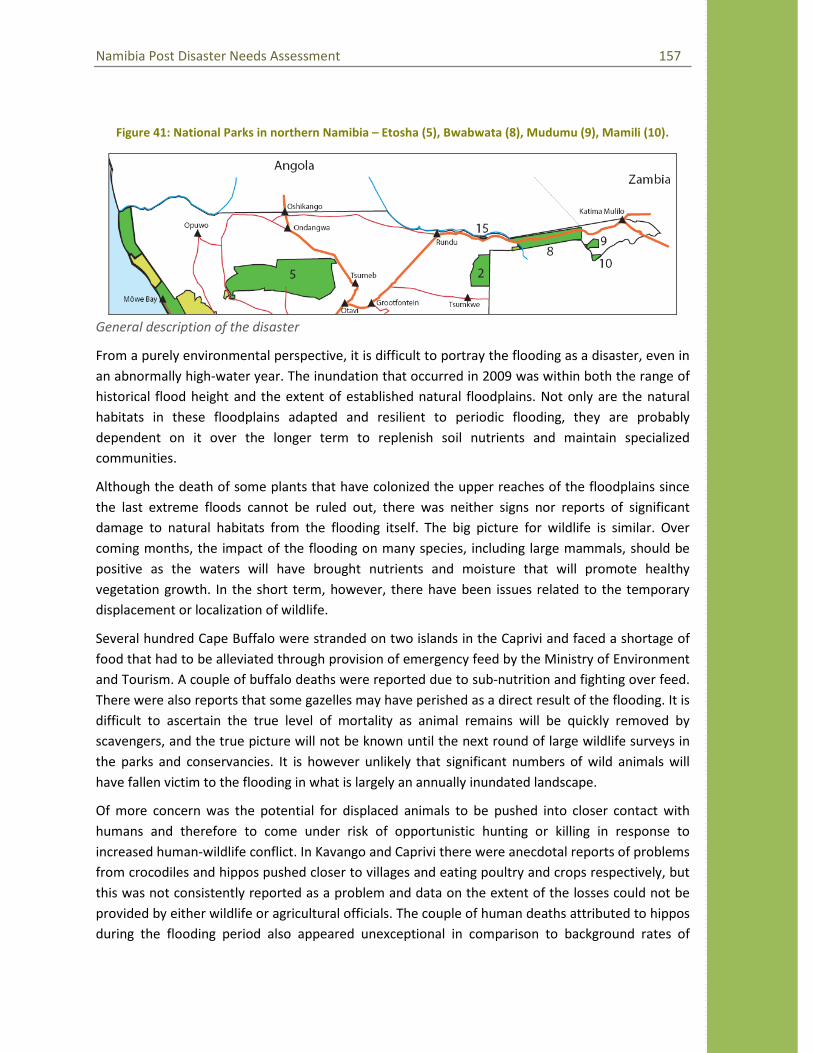
Namibia Post Disaster Needs Assessment 157
Page 157
Figure 41: National Parks in northern Namibia – Etosha (5), Bwabwata (8), Mudumu (9), Mamili (10).
General description of the disaster
From a purely environmental perspective, it is difficult to portray the flooding as a disaster, even in an abnormally high-‐water year. The inundation that occurred in 2009 was within both the range of historical flood height and the extent of established natural floodplains. Not only are the natural habitats in these floodplains adapted and resilient to periodic flooding, they are probably dependent on it over the longer term to replenish soil nutrients and maintain specialized communities.
Although the death of some plants that have colonized the upper reaches of the floodplains since the last extreme floods cannot be ruled out, there was neither signs nor reports of significant damage to natural habitats from the flooding itself. The big picture for wildlife is similar. Over coming months, the impact of the flooding on many species, including large mammals, should be positive as the waters will have brought nutrients and moisture that will promote healthy vegetation growth. In the short term, however, there have been issues related to the temporary displacement or localization of wildlife.
Several hundred Cape Buffalo were stranded on two islands in the Caprivi and faced a shortage of food that had to be alleviated through provision of emergency feed by the Ministry of Environment and Tourism. A couple of buffalo deaths were reported due to sub-‐nutrition and fighting over feed. There were also reports that some gazelles may have perished as a direct result of the flooding. It is difficult to ascertain the true level of mortality as animal remains will be quickly removed by scavengers, and the true picture will not be known until the next round of large wildlife surveys in the parks and conservancies. It is however unlikely that significant numbers of wild animals will have fallen victim to the flooding in what is largely an annually inundated landscape.
Of more concern was the potential for displaced animals to be pushed into closer contact with humans and therefore to come under risk of opportunistic hunting or killing in response to increased human-‐wildlife conflict. In Kavango and Caprivi there were anecdotal reports of problems from crocodiles and hippos pushed closer to villages and eating poultry and crops respectively, but this was not consistently reported as a problem and data on the extent of the losses could not be provided by either wildlife or agricultural officials. The couple of human deaths attributed to hippos during the flooding period also appeared unexceptional in comparison to background rates of

Namibia Post Disaster Needs Assessment 158
Page 158
human-‐wildlife conflict. Killing of larger wildlife displaced by the flooding was not reported. Probably the greatest irritation and issues of wildlife killing involved the displacement of snakes, which are widely feared and persecuted.
In Etosha National Park, displaced wildlife spilled out of the north of the park after elephants broke through fences. This increased the rate of crop predation in surrounding areas, and has led to an increase in the quota of problem elephants to be harvested in trophy hunting. There are also reports of increased disease in wild ungulates following the flooding, but the significance of this was not yet established.
River bank erosion was noted in a couple of susceptible locations (i.e. on the outside curve of meanders) on the Okavango and Zambezi in Kavango and Caprivi, respectively. Although up to five meters of river bank were removed in places, the length of bank and the total land area affected were small. The banks of the major rivers in Kavango and Caprivi are still largely fringed with extensive reed beds, at least on the Namibian side, and therefore did not suffer undue erosion. It should also be noted that some erosion and sediment in the system is natural, and may be needed in the long run to sustain the Okavango delta.
In the Oshanas, erosion did occur in places, but at a level largely insignificant in comparison with the broader issue of wind erosion during dry conditions. Some erosion along ephemeral water courses also occurred in Etosha National Park, and necessitated urgent placement of gabions by park authorities.
Although the natural assets of the protected areas in the impacted regions were affected relatively little, and may even benefit over the longer run, park infrastructure was damaged. The key impact was on roads which sustain the main recreational activity in the parks—game drives. Simply engineered, these compacted earth or gravel top roads specifically designed for wildlife viewing are present in many of the parks, but quickly deteriorate in wet conditions so as to be no longer passable to 2WD vehicles, which account for a good proportion of the visitor numbers and therefore park revenues. More severe flooding can damage (often poorly engineered) stream crossings and inundate roads to the point at which they are no longer passable even by 4WD vehicles.
In Kavango and Caprivi, the floodplains contain only sparse buildings, most of which are made from natural materials. There was therefore no significant quantity of debris requiring removal. Neither were there issues of large-‐scale sediment deposit, due to the good vegetation cover retained on the banks of the flooded rivers. In the Oshanas, more structures lay in the path of the floodwaters, especially in informal peri-‐urban settlements, but the slow pace movement within these flat and labyrinthine channels meant that the floodwaters lacked the energy to cause widespread structural damage or transport large volumes of sediment, even within this relatively fragile environment. Nevertheless, there was a modest quantity of debris that required removal in the North Central region, as well as some issues of waste being spread from the flooding of refuse dumps and septic ponds. Resettlement camps generate their own secondary environmental impacts from resource use and waste disposal, but these were also commensurate with the modest size of the camps involved, which in the largest cases only numbered a few thousand people.

Namibia Post Disaster Needs Assessment 159
Page 159
The overall picture is therefore not one of environmental devastation, but rather an uncommonly severe, but not unprecedented episode in a continuing natural process, which the local human population should be helped to better anticipate.
Natural assets
The value of erosion damage has not been generally calculated as the area of bank removed was insignificant in relation to the amount of land locally available in the Okavango and Zambezi floodplains, and soil erosion that occurred in the Oshanas was paltry in comparison to ongoing threats that desertification and wind erosion pose to agriculture in that system. The significance of erosion along the Okavango and Zambezi was its impact on the tourism infrastructure, and this is accounted for under the tourism section. Impacts on wild fish stocks will probably be beneficial and are considered under the agriculture and fisheries sector.
The few head of game animals reported killed in Caprivi are not directly evaluated as a separate estimate of losses from the reduced trophy hunting opportunities already included under the tourism sector. Costs of feeding the stranded buffalo in Caprivi were reported by the Ministry of Environment and Tourism in Rundu as N$56,000 for purchase of 59t of feed, plus N$67,000 in fuel costs for transport from Grootfontein.
Protected Areas
As for other tourist activities, park visitation and revenue has grown strongly in recent years, but is expected to level out in 2009 due to the global down-‐turn. In line with the approach followed for the tourism sector, 2008 data is therefore taken as the projected park gate revenue in the absence of floods.
Roads were damaged by the flooding in Etosha NP in Ohsikoto, Mahangu WR in Kavango and Mamili NP in Caprivi, with a consequent impact on gate revenues. In the other two parks in Caprivi, there was no significant change in visitor revenue compared with the same season in 2008. In Mahangu WR, the main game drive route was submerged, with a consequent loss of N$15,000, compared to March and April 2008. The cost of rehabilitation has been quoted at N$5m. In Mamili, replacement of lost bridges on the main access road is estimated to cost N$2m. Half the annual tourist revenue is expected to be lost as a result, but this only amounts to N$9,000.
Road damage in Etosha was estimated at N$2m by park authorities, in addition to N$1m of damage to fences caused by displaced elephants. Although the relative extent of the damage was far lower in Etosha than the North-‐Eastern parks and the period of impact shorter (two weeks as opposed to two months or more), the overall losses from gate revenues (estimated from projected changes in visitor number rather than actual receipts) were substantially greater simply because Etosha is such an important tourist destination. Losses were also incurred in Etosha due to exceptional costs of park protection in the face of displaced animals and flooded access routes. Over-‐time payments to rangers, additional fuel and boat costs totaled N$96,000.
No loss of revenue from trophy hunting was included as hunting has not taken place recently in the state protected areas where it might have been impacted. Levies paid by some tourist lodges to

Namibia Post Disaster Needs Assessment 160
Page 160
national parks are not believed to be directly related to visitor numbers (as opposed to the joint venture arrangements of some Caprivi lodges with community conservancies, see below).
Clean-‐up operations
Costs of dealing with impacts to water quality and sewerage systems are dealt with under the WASH sector. Given its diffuse and low intensity nature, no overall estimate was generated for debris removal in the North Central regions. Refuse dumping sites around Oshakati were affected, however, partly as a result of additional waste generated by the flooding, and partly as a result of being inundated themselves. The costs for establishing one new dump (including access) and for fencing an existing site in response to this was estimated by local authorities at N$500,000.
Table 87: Damages and losses in environment sector
Subsector/ Component
Damage (N$ 1000s) Losses (N$ 1000s) Macro effects: value public private value public private BOP Fiscal
Oshikoto Etosha NP 3,000 3,000 270 270 159.6 270
Oshana Waste management
500 500 500
Kavango Mahangu WR 5,000 5,000 15 15 15 15
Caprivi Mamili NP 2,000 2,000 9 9 9 9 Buffalo feeding 123 123 123
Total 10,000 10,000 917 917 183.6 917 NB: as a first approximation, all park visitor revenue in Kavango and Caprivi was estimated to derive from international tourists. International and domestic revenues were estimated separately for Etosha, hence the relative reduction in the impact on Balance of Payments.
Early recovery Given that the damages and losses evaluated in Table 87 above fall entirely within the public sector, there is little direct impact on local communities. There were reports of loss of access to wild spinach varieties which form an important complement to local diets in the Oshanas. In the floodplains of the northeast, the common property resources most relied on by locals, fish and grasses, will probably be more abundant this year as a result of the flooding. Wildlife conflict does appear to have been an issue in certain locations, but when compared to background rates and the scale of agricultural damages caused directly by flooding, the incremental impact of wildlife is likely more of a localized irritation than a serious impact. The most serious environmental issue for local people remains the potential for indirect impacts in the Oshanas due to the additional pressure of displaced people and demand for housing material on already highly stressed resources. Significant environmental deterioration has been underway in the Oshanas for a couple of decades and is well-‐recognized as an issue. However, its solution will be a lengthy process that goes well beyond the recovery from the 2009 floods. If relief and recovery activities are not well managed, there is a serious risk of temporarily aggravating the situation, but in a broader perspective, the floods are beneficial to the system and it is drought and desertification that pose the real threat when overlaid on top of continuing human pressures.
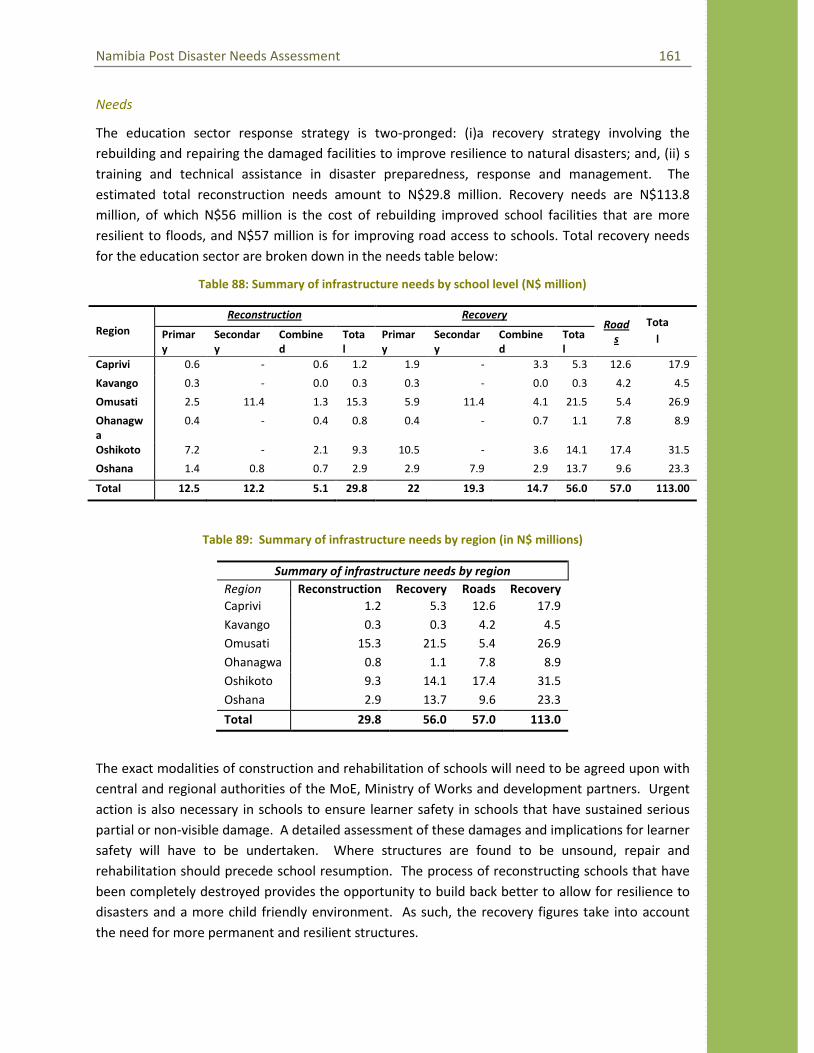
Namibia Post Disaster Needs Assessment 161
Page 161
Needs
The education sector response strategy is two-‐pronged: (i)a recovery strategy involving the rebuilding and repairing the damaged facilities to improve resilience to natural disasters; and, (ii) s training and technical assistance in disaster preparedness, response and management. The estimated total reconstruction needs amount to N$29.8 million. Recovery needs are N$113.8 million, of which N$56 million is the cost of rebuilding improved school facilities that are more resilient to floods, and N$57 million is for improving road access to schools. Total recovery needs for the education sector are broken down in the needs table below:
Table 88: Summary of infrastructure needs by school level (N$ million)
Region Reconstruction Recovery
Total
Roads Primar
y Secondary
Combined
Total
Primary
Secondary
Combined
Total
Caprivi 0.6 -‐ 0.6 1.2 1.9 -‐ 3.3 5.3 12.6 17.9
Kavango 0.3 -‐ 0.0 0.3 0.3 -‐ 0.0 0.3 4.2 4.5
Omusati 2.5 11.4 1.3 15.3 5.9 11.4 4.1 21.5 5.4 26.9
Ohanagwa
0.4 -‐ 0.4 0.8 0.4 -‐ 0.7 1.1 7.8 8.9
Oshikoto 7.2 -‐ 2.1 9.3 10.5 -‐ 3.6 14.1 17.4 31.5
Oshana 1.4 0.8 0.7 2.9 2.9 7.9 2.9 13.7 9.6 23.3
Total 12.5 12.2 5.1 29.8 22 19.3 14.7 56.0 57.0 113.00
Table 89: Summary of infrastructure needs by region (in N$ millions)
Summary of infrastructure needs by region Region Reconstruction Recovery Roads Recovery Caprivi 1.2 5.3 12.6 17.9 Kavango 0.3 0.3 4.2 4.5 Omusati 15.3 21.5 5.4 26.9 Ohanagwa 0.8 1.1 7.8 8.9 Oshikoto 9.3 14.1 17.4 31.5 Oshana 2.9 13.7 9.6 23.3 Total 29.8 56.0 57.0 113.0
The exact modalities of construction and rehabilitation of schools will need to be agreed upon with central and regional authorities of the MoE, Ministry of Works and development partners. Urgent action is also necessary in schools to ensure learner safety in schools that have sustained serious partial or non-‐visible damage. A detailed assessment of these damages and implications for learner safety will have to be undertaken. Where structures are found to be unsound, repair and rehabilitation should precede school resumption. The process of reconstructing schools that have been completely destroyed provides the opportunity to build back better to allow for resilience to disasters and a more child friendly environment. As such, the recovery figures take into account the need for more permanent and resilient structures.

Namibia Post Disaster Needs Assessment 162
Page 162
Human Recovery
The education sector was not adequately prepared for the flood disaster as evidenced by absence of contingency plans to accommodate pupils displaced by the floods. Though early warning information had indicated the possibility of flooding in Caprivi region, schools went to re-‐open in the flood plains only for pupils to relocate to schools on higher ground when the flood water arrived, resulting in disruption of education.
Due to the fact that families were relocated, proper nutrition for school-‐going children could not be guaranteed. The School Feeding Program is an important tool to keep learners in school. In 2008 there were about 85,000 children participating in this program, and this is expected to increase due to the government’s expansion of the program as a reaction to the flood and increasing food prices. The program is also intended to protect children against natural disasters such as droughts and floods.
The public’s right and need for access to accurate and timely information are critical in an emergency. Therefore, there is a need to establish and strengthen multi-‐purpose access centers in the flood-‐prone regions, which would help the dissemination of critical disaster response information.
Recovery Framework and Needs
Summary goals & principles
The environmental recovery goal is to manage immediate impacts and restore damaged assets in a manner that reduces both disaster and environmental risks.
In the case of the impacts enumerated specifically within this section that is relatively straightforward. For other sectors, it will necessitate a broad range of principles, including that reconstructed roads are subject to proper environmental engineering and drainage provision, and that building reconstruction does not deplete local resources. These principles must be included within each sector as appropriate.
Needs
Needs taken directly from the environmental damages and losses (Table 90) comprise the repair costs for the roads in protected areas, the additional wildlife management costs incurred at Etosha and in Caprivi, and the additional waste management costs incurred in Oshikoto.
Needs associated with risk reduction to be accounted in this section comprise of the costs of upgrading affected protected area roads to be more resistant to future flooding, and of upgrading the additional refuse tip to a properly engineered landfill to mitigate risks of further environmental degradation.
Based on assessments of park authorities, each of the three damaged roads will cost an additional N$2-‐3m to upgrade beyond the baseline repair cost. The total cost is therefore estimated at an additional N$7.5m.

Namibia Post Disaster Needs Assessment 163
Page 163
Based on the volume of the refuse dumps (roughly 50x50x5m), the capacity of the new disposal site is estimated at roughly 10,000t. At a landfill cost US 20/t (based on international comparisons for small-‐scale landfills), the upgrade equates to a total cost of US$200,000. The incremental cost of upgrading the open dump site is therefore roughly estimated at N$1m, beyond the initial cost of N$500,000 for an un-‐engineered site. It should be noted, however, that landfill costs are very dependent on local conditions and economies of scale, and therefore a specific assessment would be needed to design and cost the facility.
The main environmental capacity need is to strengthen the ability to manage watershed and floodplain management, including appropriate environmental impact review for projects within sensitive areas. This will be incorporated into the overall recommendations on river basin management, however, and is not separately accounted here.
Table 90: Environment sector needs
Needs (N$ 1000s) Early recovery
Later recovery
Reconstruction Totals
Additional wildlife management
219 219
PA road repair 10,000 PA road upgrade 7,500 17,500 Additional waste management
500
Refuse site upgrade 1,000 1,500 Totals 719 1,000 17,500 19,219
Table 91: Required public sector interventions
Task Indicative Budget
(N$ million)
Responsibilities Milestones Timeline
PA road reconstruction
17.5 Min of Env & Tourism: overall management Min of Transport: verification of design & construction quality
Designs inc. appropriate env. Engineering
Completion of works
31 July 31 Oct
Engineered landfill, Oshakati
1.5 Oshakati municipal authorities: overall management
Designs inc. appropriate env. Engineering
Site in full operation
31 July 30 Sept
Disaster Risk Management Issues
For the environment sector, risk management includes not only conventional DRM, but also mitigating risks of ongoing indirect environmental impacts from the disaster, including those posed by the recovery and reconstruction processes themselves.

Namibia Post Disaster Needs Assessment 164
Page 164
DRM
The state of the environment in the affected areas contributed very little to the direct vulnerability to flooding. In the Northeast, the environment remains in relatively good condition, and dense riparian vegetation probably averted widespread river bank erosion. In the Oshanas, the land is stressed, and the soil vulnerable to erosion. Even so, the flood waters were mostly slow-‐moving and the far greater threat remains from drought and desertification. The main issue of vulnerability stems simply from inappropriate location of housing and in some cases agricultural activities in flood-‐prone areas, due to population increase, spread of informal settlements, and possibly partly perverse incentives from flood relief.
DRM issues related to environment centre around the development of improved river basin and flood management systems. This includes not just upstream watershed management and early warning systems (complicated in this setting by the trans-‐boundary nature of the watersheds), but also floodplain management including zoning or at least impact assessment mechanisms for potentially competing uses such as agriculture, roads, settlement, natural storage, biodiversity and tourism. Even basic measures, such as drainage standards seem to be poorly developed or applied to floodplains with consequences such as washed out culverts obvious on public and private roads. Technical assistance will be needed both to understand options and the complications posed by climate change. This topic is covered in depth within the separate DRM section of the PDNA report, and is not replicated in the needs presented here.
Within the narrower confines of the impacts enumerated in this section, the main disaster preparedness issue is to upgrade the roads in the impacted protected areas to the level at which they can withstand likely flooding, without any undue local environmental impact. This will necessitate proper attention to environmental engineering in the designs, and particularly in regard to drainage and crossings.
Potential indirect impacts from relief activities
Displacement camps observed in Caprivi had basic waste and sanitation facilities, but these were small and spread throughout the camp, rather than having centralized facilities located apart from the regular living space. The issue is relatively minor due to the size of the camps and the generally modest waste production, but they do present some risks, nevertheless, particularly in relation to environmental health. In Schuckmannsburg, the repetitively relocated population from surrounding villages is placing a chronic (though not yet acute) strain on local fuel wood resources. In such locations, where seasonal displacement is essentially an annual event, there are opportunities for a more planned approach taking into account environmental needs. Options would include:
– reduction of displacement by meeting needs within out-‐lying villages;
– development of more regular seasonal camp facilities, including provision for waste management, sanitation and alternative cooking fuel in the design; and
– strengthening the coping ability of Schuckmannsburg residents, e.g. increasing the supply of fuel wood by coppicing.

Namibia Post Disaster Needs Assessment 165
Page 165
These issues are dealt with more comprehensively in the HRNA sections relating to camp management, and the needs are not replicated here.
The additional solid waste disposal facility developed in part to receive flooding debris in Oshakati should be upgraded to a suitably engineered landfill, resistant to future flooding, rather than simply replicating existing open dump sites.
In the wider perspective, major programs are needed to address both land degradation and solid waste management in the North Central region. Various NGO and government activities are already underway to address the former, and some efforts have also been made to prevent unregulated dumping of refuse in the Oshanas. Complete solutions will require significant and long-‐term financial commitments, and are beyond the scope of the actions that can realistically be incorporated into the recovery program for the specific flood event in question.
Environmental impact mitigation during reconstruction
In the absence of any large-‐scale engineered approaches to flood management [the key potential impact in reconstruction will be over-‐exploitation of local forests for housing timber, especially in the North Central region where the level of damage was much higher and scant timber resources are already highly stressed. It has been calculated that traditional homesteads in the Oshanas used more than 100m3 of construction timber, and a single home could consume more than 1,000 small local trees. That level of local timber consumption is simply no longer feasible, but with a total of around 25,000 full traditional home equivalents requiring reconstruction in the area, remaining forest resources are threatened with a severe impact.
Housing reconstruction programs must encourage the use of and make available alternate construction materials, as well as ensuring that what timber is used is sourced appropriately. This topic is discussed in detail under the housing sector report.
Governance issues
The greatest need for policy changes related to the environment sector concern improving river basin management and turning around the pattern of environmental degradation in the Oshanas. These topics are beyond the scope of this section and this report, respectively.
In relation to the direct environmental impacts covered in this section, a small but significant policy change would be to ensure that road specialists from the Ministry of Transport have some involvement in the oversight of road (re-‐)construction in the national parks to ensure these are designed and constructed to appropriate drainage and load specifications.
Namibia Post Disaster Needs Assessment 166
Page 166
Annex 11: Food Security
Pre-‐Disaster Situation
Food security assessments47
Food security indicators did not change significantly after 2008 floods from the situation in 2007. This indicates that food insecurity in the region is a result of long term poverty (chronic), rather than solely as a result of the last natural disasters that have hit the regions (transitory). However, the assessment revealed that transitory acute food insecurity exacerbates chronic poverty, and will affect vulnerable populations further.
conducted by the World Food Programme and the Government of Namibia after the 2008 floods revealed high levels of chronic food insecurity in the flooded area, mainly in Caprivi, Ohangwena, Omusati, Oshana, and Oshikoto. The chronic food insecurity, understood as a long-‐term and persistent inability to meet minimum food requirements, was found to be linked to HIV and AIDS, structural poverty, and impact of recurrent natural disasters in livelihoods and socioeconomic sectors.
The assessments revealed that 33 percent of households in Caprivi and 16 percent of households in the Northern Central regions were food insecure48
The food insecure population had poor or borderline food consumption
after the 2008 floods.
49
The food insecure population in the area had poor food access, as measured by a households’ ability to both purchase and produce food for its members. After the impact of the 2008 floods, approximately 50 percent of households in the Northern Central regions and 40 percent of
, understood as a low frequency of intake of food groups with relevant nutritional value. Households with poor food consumption in the region ate little more than staple grains and oil, indicating a serious nutritional deficit. Households with borderline consumption ate the equivalent of cereals and vegetables on a daily basis, plus pulses and oils about four times per week, and occasional meat and fish. Households with acceptable consumption managed to regularly consume fish, and occasionally meat, nuts, vegetables, and milk.
47 Directorate of Emergency Management. Emergency Food Security Assessment Directorate of Emergency Management (May-‐June 2008). An assessment of the impact of the flood and other natural disasters on food security of rural households in areas of Northern Namibia May-‐June 2008. Ministry of Gender Equality and Child Welfare and the UN World Food Programme (December 2007). Namibia Community and Household Surveillance (CHS): Round 2 An Impact Assessment of the Ministry of Gender Equality and Child Welfare/UN World Food Programme Food Support Programme for Orphans and Vulnerable Children (OVC) in Northern Namibia. 48 The food consumption indicator and the food access indicator were combined to create a consolidated food security indicator; a measurement both of the quality of household food consumption at present and the ability of the household to continue to maintain that level of food consumption in the future. 49 Using a 7-‐day recall period, information was collected on the variety and frequency of different foods and food groups to calculate a weighted food consumption score. Weights were based on the nutritional density of the foods. Households were then classified as having either ‘poor’, ‘borderline’ or ‘acceptable’ consumption based on the analysis of the data.

Namibia Post Disaster Needs Assessment 167
Page 167
households in Caprivi presented poor food access, with low expenditure per capita, low production of the cereal staple food, and few livestock. Households with poor food access spent on average N$ 51 per capita on all monthly expenses which is sufficient to purchase maize meal for the household members to eat for one month.
It is interesting to note that there was nearly twice the number of food-‐insecure households in Caprivi as compared to the other regions surveyed. This high level of food insecurity may be due to the high prevalence of HIV/AIDS in Caprivi (43 percent, according to the 2006 Sentinel Survey), and the regular and recurrent floods and other natural events that affect the region.
While a relatively large proportion of the population in the northern central regions had acceptable food consumption, 50 percent of the households in these areas reported that food crop production was either their first or second most important livelihood source, and these households obtained 34 percent of their total food from own production. The subsistence farmers households which depended on crop production as the main source of food are the most vulnerable to be affected by shocks.
Variations in food availability at the household level as a result of shocks as floods or crop failure are a key element to determine the food security situation of the subsistence farmers. Population groups with diverse sources of income and owning livestock might be in a better position to cope with food shortages
After the 2008 floods, a total of 146,000 people were estimated to require emergency assistance in the rural areas of the Northern Central regions and Caprivi in order to maintain their household food security and to avoid a deterioration of nutritional status and poverty level after the floods. Most of the population (80 percent) was identified to be in the rural areas of the North-‐Central regions of Ohangwena, Omusati, Oshana, and Oshikoto.
The food insecure households in the area shared the following characteristics: mostly female headed households (around 67 percent), with high percentage of widows as household head (around 40 percent), household members with low education level, using pond or stream water, living in mud thatch hut (83 percent) and/or concrete/tin house (12 percent), with no formal income sources (less than 10 percent depend on formal salary/wages), and low food consumption ( adults and children 6-‐18 eating two meals per day, and children 0-‐5 eating three).
The households of subsistence farmers presented a high degree of vulnerability, as determined by their reliability on household crops, Government grants, remittances from families, temporary income, exposure to shocks and low capacity to develop new coping strategies.
Food availability
For people living in rural communal areas of northern Namibia, subsistence agriculture remains the main means of livelihood. However, the irregular rainfall and the unsuitable terrain pose serious threats to food security and to livelihoods. In the Northern Central and Kavango rural areas most people are involved in subsistence farming, with mahangu (pearl millet) and sorghum as main crops (the estimated ratio of mahangu versus sorghum is 75 percent versus 25 percent. In the Caprivi

Namibia Post Disaster Needs Assessment 168
Page 168
region, the staple crop cultivated is predominantly maize, with some millet in the drier western regions.
The communal land tenure limits access to credit, and poor soil quality and a high dependency weather conditions characterize subsistence agriculture in the region. The subsistence farmers cultivate an average of three hectare (ha), plots and normally consume all farm products (eggs, milk and cereals). This leaves little for commercial production. Within this system, people are highly dependent on tree products and other natural resources.
The production of mahangu, the staple cereal food for the majority of the population in the Northern Central regions was reduced in 2008 because of floods, plagues of army worms, and other pests. It was estimated that the 2008 floods caused an average of a 59 percent drop in the agricultural production in the North Central Regions, and a decrease of 67 percent of the household food production.
The poor harvest of the past two seasons has reduced the household socks of mahangu, forcing the household to use savings to purchase food.
Livestock ownership in northern Namibia mainly consists of cattle, goats, donkeys, and poultry, with cattle ownership being relatively unequally distributed. The 2008 floods weakened livestock in the region, and many died after the 2009 floods. This affected the draught power capabilities in the region and decreased household asset ownership.
Fishing became a critical source of protein for many households in the North Central Regions that had to cope with the reduced harvest after the 2008 floods. The 2008 floods increased the availability of fish for a short period of time, until the water recessed.
Access to food
People living in the rural areas often retain close links with the people living in the urban areas and remittances from family employed or involved in diverse business activities in urban areas contributes to rural household income. Similarly, production from rural areas contributes to the food economy of people living in urban settings. There is largely a barter or gift economy for mahangu, which is the staple for the northern part of the country, with many urban dwellers depending on their relatives living in rural areas for food. Both rural and urban vulnerable households relay heavily on this exchange system.
In addition to remittances from relatives living in urban areas, the Government subsidies are an important source of income for many vulnerable rural households. Subsidies are received in the form of different grants administered through the line ministries. The main grants are:
Ministry of Gender Equality and Child Welfare: child welfare grants, such as maintenance, special maintenance (disabled children <16 yrs.), foster parent, place of safety allowance, subsidy for children's homes, war orphans;
Ministry of Labour: old age pension (+60 years), disability (+16 years); Veteran affairs: war veteran’s grant.

Namibia Post Disaster Needs Assessment 169
Page 169
The cash received under these grants is the main source of income for many vulnerable households to cover food and basic needs.
Due to the extended poverty households in both rural and urban areas are vulnerable to the fluctuation of staple food prices which have increased in both urban and rural areas.
The Government of Namibia has a strong role influencing the price of staple food in the country with the price of white maize and wheat controlled trough several mechanisms. During the white maize marketing period (i.e. May 1st until the domestic harvest is milled), the Namibian borders are closed to imports of white maize, in order to prevent domestically produced maize from competing with maize produced abroad. A Floor Price is then fixed by the Namibian Agronomic Board during the Closed Border Period and is calculated based on SAFEX data series.
Discussions are on-‐going for the Namibian Agronomic Board to also control the prices of mahangu. The main goal is that mahangu and maize meal must be mutually interchangeable for institutional caterers and therefore, the price of mahangu grain and maize grain must be the same. The same price agreement and marketing mechanism are applied to both maize and mahangu, as soon as mahangu is gazetted as the statistics provided by the Namibian Agronomic Board tend to show. It’s interesting to note however regional variation of key staple prices.
Food utilization
The latest nutritional measurements in the flooded area in 2008 indicated that around 11 percent of women (aged 15 to 49 years) had a Body Mass Index (BMI) under 18.5 kg/m2 indicating that they are underweight or malnourished. In addition, an estimated 21.3 percent of women had a BMI near the underweight cut-‐offs (22 in a range from 16 to 40), being vulnerable to shift to the lower BMI category during a period of low food intake. The measurements for children aged 6 to 59 months indicated high malnourishment rates that need to be closely monitored:
Global acute malnutrition (GAM) rate (z-‐score) was estimated at 7.6% with NCHS 1977 standards and at 8.3% with WHO 2005 standards;
Severe acute malnutrition was found in 1.2% (NCHS 1977) and 3.7% (WHO 2005) of children.
Damage and Losses Assessment
The slow onset of the 2009 floods has exacerbated the impact of the 2007 drought and the 2008 floods on subsistence farmers. The chronic food insecurity situation of vulnerable households in the Northern and Eastern Central regions deteriorated, moving many households into acute transitional food insecurity. Vulnerable households in Ohangwena, Omusati, Oshana, and Oshikoto regions were most affected, because of limited resilience. The Caprivi region better resisted the impacts of the floods on food security, and the Kavango region was relatively less affected.
While people directly affected by the floods in urban areas were reallocated to temporarily shelters and received food assistance, the people affected by the floods in rural areas remained in the villages to protect their assets. The population groups that did not receive food assistance during the floods relied on household food stocks and on the support from relatives and neighbours.

Namibia Post Disaster Needs Assessment 170
Page 170
However, the population affected by the floods have moved from a situation of chronic to acute food insecurity.
The households that are experiencing acute transitorily food insecurity are mostly headed by subsistence farmers that have lost their mahangu stocks, and have experienced estimated losses of 80 percent on average in the main harvest due to the impact of the floods. These are mostly single female-‐headed households, with low crop production, low expenditure per capita, and low livestock ownership in their communities. These vulnerable populations are experiencing transitory acute food insecurity as a direct effect of the floods and are in need of external assistance.
The situation can be expected to worsen in the coming months and the food security situation might deteriorate increasingly when the current food stocks at the household level are exhausted. These households already suffer from limited access to food, and will have difficulties to maintain an adequate level of food consumption in the coming months (from August – September to the next main harvest in April), unless they are provided with external food assistance.
To farmers who own cattle, selling it can be a key coping strategy as the cash obtained this way can cover the food needs of the household members for a long period of time. The ownership of cattle draws the line of the population group in need of assistance.
Food security -‐ Assistance needs
There are an estimated 163,000 people in immediate need of assistance to cover their basic food needs in the regions of Caprivi, Kavango, Omusati, Ohangwena, Oshana and Oshikoto. This period of need is estimated to be from August – September to the next main harvest in April.
Table 92: Estimation50
Province
on number of people in need of assistance to cover food needs
Average agriculture production '000
tonnes
Number of food
insecure people
Total population
% food insecure people / total population
Caprivi 9,446 25,952 79,852 32.50 Kavango 7,460 13,071 201,093 6.50 Ohangwena 19,808 36,436 227,728 16.00 Omusati 19,470 36,615 228,842 16.00 Oshana 8,442 25,907 161,916 16.00 Oshikoto 16,455 25,726 160,788 16.00 Total 163,707 1,060,219 15.44
Source: UN – World Food Programme (WFP)
50 The estimation is done with the data compiled during the field work and the data available in the assessment: Directorate of Emergency Management -‐ Emergency Food Security Assessment Directorate of Emergency Management (May-‐June 2008). An assessment of the impact of the flood and other natural disasters on food security of rural households in areas of Northern Namibia May-‐June 2008.
Namibia Post Disaster Needs Assessment 171
Page 171
Reduced household food availability
The floods have washed away the stocks of sorghum and mahangu stored from previous and the 2009 harvests. The remaining stocks at the household level are not expected to last beyond September.
Losses of mahangu stocks have reduced food availability and have affected both urban and rural vulnerable households. The rural households are forced to purchase their staple cereal, shifting to consume maize meal as mahangu is less available in the markets of the flood affected areas.
While maize meal is a commodity available in all areas, mahangu is only available in markets in the main urban centres. Vulnerable households in urban areas that traditionally rely on the mahangu transfers from relatives in rural areas will have to increase their expenses for purchasing basic food commodities.
The main harvest next year might also be affected due to the reduction in seeds, as it is likely that the most vulnerable households might consume the part of the production for seeds, and at the same time, the household annual budget to purchase seeds might be used to obtain food commodities. Without external assistance, long term reduction in household food availability is forecasted in the area.
Fishing had increased in the area due to the flooding with more fish available in the “shonas”, becoming an alternative livelihood for some affected people and increasing the protein availability. The fish is dried and sold in the local markets. After the flooding period, with the recession in the water levels, the fish availability has returned to pre-‐floods levels.
Reduced Food access
Damage in the open market infrastructure and roads occurred in some flooded areas limiting temporarily physical access to food purchases. While the market infrastructure was not severely affected, the functioning of the markets was temporarily interrupted, impacting the local economies. During the time of the assessment, the recession of waters had already allowed the normal access to markets.
The general increased of food and fuel prices at national level had also added pressure on the most vulnerable segments of the population in the flooded areas. In order to mitigate the effect of the price increases, a task force under the Office of the Prime Minister was created in 2008,lifting 15 VAT ff some basic food commodities, namely beans, bread, cake flour, cooking oil and fat, and more recently also for milk and sugar.
The rapid increase of food prices during 2008 experienced a recession in 2009, which can be attributed to a reduction on the global demand on basic food commodities and the Government measures.
As a direct consequence of the floods, there was a seasonal increase of food prices by 37 percent due to higher transportation costs, which were reported to increase by 75 percent in the flooded areas due to the damage on roads and bridges and the increased cost of fuel.

Namibia Post Disaster Needs Assessment 172
Page 172
At the time of the assessment, the prices of basic food commodities, vegetable oil, pulses and maize meal were stable at the pre – flood levels. While further fluctuation on the prices can be expected as a consequence of the low harvest and high demand, the government actions related to tax control and support of the local maize production can play an important role in maintaining low prices.
Figure 42: Maize Meal Prices in Urban and Rural Areas
Maize Meal price in Urban areas (6 region average)
0.001.002.003.004.005.006.007.008.009.00
10.00
Aug 06Sep 0
6Oct 0
6Nov
06Dc 0
6Jan 0
7Feb 07
Mar 07Ap 07
May 07Jn 07
Jl 07Aug 0
7Sep 0
7Oct 0
7Nov
07Dc 0
7Jan 0
8Feb 08
Mar 08May 0
9
Price in N$
Maize Meal price in Rural areas (6 region average)
0.00
2.00
4.00
6.00
8.00
10.00
12.00
14.00
Aug 06
Sep 06Oct
06
Nov 06
Dc 06Ja
n 07Feb 07
Mar 07Ap 07
May 07Jn
07Jl 0
7Aug 0
7
Sep 07Oct
07
Nov 07
Dc 07Ja
n 08Feb 08
Mar 08
May 09
Price in N$
Food utilization
As a direct effect of the floods, the functioning of school feeding programmes has been reported to be disrupted. A long term reduction in the food provided through the school feeding program might have a negative effect in school children.
While no significant health outbreaks have been reported as a consequence of the floods, a deterioration of the health status could occur affecting the most vulnerable population groups, namely: children under five, pregnant and lactating mothers, elderly and HIV AIDS patients.
Coping strategies
The resilience of vulnerable households has been affected by the impact of the 2007 drought and 2008 floods, exacerbating their limited coping capacity. The households affected by the floods have

Namibia Post Disaster Needs Assessment 173
Page 173
developed a variety of coping strategies or activities to obtain food and/or income after the floods. Several coping strategies have been reported in the affected area and are summarized below:
Reduction in the food intake – reduction on the number on the size of the meals and / or the number of meals per day for some family members;
Changes in the dietary diversity – reduction on purchases of non staple food as cooking oil, sugar or meat;
Changes in household expenditure patterns -‐ diverting the use of the grants received under the Namibian Social Policy to purchase food instead of covering other household expenses as school fees;
Support from relatives and neighbours – receiving food in kind and cash to buy food was reported to be coping strategy broadly used in the area. Along with it, “begging for food” was also reported as a practice in place. Being “begging” a taboo in the local culture, the fact that it is already a coping strategy in place should be considered as a sign of alarm of the food security situation in some households;
Borrowing cash – borrowing cash for relatives or neighbours to purchase food; Reliance on the market – households are obtaining staple food traditionally obtained by
own production trough purchases in the market. Increase of internal migration – migration to the main cities by some household members,
predominantly to the capital Windhoek, and to farms.
In addition, fishing was reported to be a coping strategy mainly for women and young adults during the floods, providing additional food and cash temporarily during the time of the flooding.
Dependency on food relief was reported to be main coping strategy, with the affected population expecting to receive food assistance to cope with the food shortages. Considering food assistance as a coping strategy is a sign of high vulnerability and dependency on external actors.
Immediate Response
The Government of Namibia had responded to the food insecurity situation caused by the floods distributing emergency food assistance through two different government bodies, the Emergency Management Coordination Office (FEMCO) and the Directorate of Emergency Management (DEM) office.
Both government bodies have distributed food assistance targeting urban population reallocated in temporary camps, population isolated by the floods in rural areas and rural population affected by recurrent shocks. Data on number of beneficiaries that have received food assistance or locations that have been covered by the food distribution are not available, so calculations on “assistance needs” already covered are not possible.
FEMCO distributed relief food from 9 March to 30 April consisting of in kind donations received from a diversity of donors in Oshana, Omusati, Ohangwena and Oshikoto regions. Preliminary figures compiled by Flood Emergency Management Coordination Office (FEMCO), quantified a total of 86,263 people in need of food relief as a consequence to the floods in the four targeted regions.

Namibia Post Disaster Needs Assessment 174
Page 174
Table 93: Government estimation on people in need of food relief
Item Oshana Omusati Ohangwena Oshikoto Total Percentage
Total population 186,755 261,656 276,099 191,625 916,135 100 N. of farmers with grain basket / Mahangu stock destroyed
555 695 1,656 763 3,669 0.40
N. of farmers with crop fields totally destroyed
3,437 4,392 5,671 7,496 20,996 2.29
N. of people in critical need of food relief
20,229 30,009 22,544 13,481 86,263 9.42
Source: Flood Emergency Management Coordination Office (FEMCO)
A food basket consisting of several food commodities was planned to assist the affected population calculated on the basis of average number of household members.
Table 94: FEMCO Relief Food Basket
Food commodity Ration Scale Household 1 member
Household 2-‐4
members
Household 5-‐7
members
Household more than 8 members
Maize meal 10 Kg 2 3 3 3 Cooking oil 750 Ml 1 2 2 2 Tinned beef 300 Grams 4 6 6 6 Tinned fish 400 Grams 4 6 6 6 Beans 420 Grams 4 6 6 6 Soup 1 Sachet 2 4 4 4 Sugar 1 Kg 2 3 3 3 Salt 500 grams 1 1 1 1
Source: Flood Emergency Management Coordination Office (FEMCO) Note – The ration of dried fish is 12 cans per household per month.
The total amount of food commodities distributed by FEMCO is shown in Table 95.

Namibia Post Disaster Needs Assessment 175
Page 175
Table 95: Total food distribution by FEMCO
Food commodity number unit Total units Maize meal 10 Kg 4,875 Maize meal 5 Kg 456 Cooking oil 20 Litres 70 Cooking oil 500 Ml 863 Cooking oil 750 Ml 473 Cooking oil 1 Litre 435 Cooking oil 375 Ml 13,230 Salt 1 Package 400 Sugar 2 Kg 351 Sugar 1 Kg 1,250 T/beans 1 Tin 2,136 T/fish 1 Tin 2,046 Maize meal 2.5 Kg 1,063 Rice 2 Kg 520 Bread 1 Piece 200 Biscuits 1 Package 600 Nutritional powder 1 Tin 160
Source: Flood Emergency Management Coordination Office (FEMCO)
According to the data provided by FEMCO, the distribution of the 5,013 bags of 10 kg maize meal available for food relief would have benefited approximately 2,551 households that would have received a ration of 2 bags (20 kilos) for 2 months. The figure of 2,551 households represents approximately 12 percent of the population in need of food assistance quantified by FEMCO, a total of 86,263 people.
The Directorate of Emergency Management (DEM) office of the Prime Minister has responded to the floods and the food needs providing assistance with an extension of the “Drought Food Relief Scheme”, also referred to as the now renamed as “Comprehensive Food Distribution Scheme”.
This scheme was planned to last until March 2009 assisting a total of 523,000 people (26 %) of the Namibian population considered to be food insecure from August 2008 to April 2009 (Directorate Emergency Management Register for food insecure people, 2008). Assistance was provided in the regions of Caprivi, Erongo, Hardap, Karas, Kavango, Khomas, Kunene, Ohangwen, Omaheke, Omusati, Oshana, Oshikoto and Otjozonduju and had an estimated cost of N$ 280 million. The planned food ration is presented in the table below.
Table 96: DEM Drought Food Relief Scheme planned food ration
Food commodity unit Ration
Dried fish tin of 425 grams 12 per month Maize meal bag of 12.5 kg 2 per month Maize grain bag of 25 kg 1 per month Vegetable oil bottle of 750 ml 2 per month
Source: DEM.

Namibia Post Disaster Needs Assessment 176
Page 176
In respond to the floods impact, the Comprehensive Food Distribution Scheme is planned to be extended until the next harvest and the funding is included in the 109 million Namibian dollars government’s budget to respond to the floods.
WFP UN Response
Upon request of the Government of Namibia on providing technical assistance, WFP launched an Emergency Preparedness Activity (IRA EPA 10842.0) aimed at strengthening the Government’s capacity to implement the Comprehensive Food Distribution Scheme. Technical assistance has been provided in the affected areas in the form of on the job learning and training on logistics and beneficiary targeting.
Authorities at the local, regional and central level have received guidance on warehouse management, secondary transportation of food commodities, commodity tracking, and planning of food distributions. Government staff, warehouse managers and community leaders in 18 constituencies in the six affected regions received direct guidance from WFP staff deployed in the area.
Training on methods for beneficiary targeting was provided to 103 staff at central, regional and local levels and also to community leaders, with special attention on awareness rising on beneficiaries’ profile.
Disaster Risk Management Issues
Risk reduction measures to lower the high vulnerability to food insecurity and thus, reduce the impact of future hazards on the households’ food security are can be classified under three main lines:
Reducing crop losses
In order to reduce future losses of the mahangu stocks stored in the traditional way in the grain basket, the government initiated campaign to raise awareness on the need of transforming the traditional storages into higher structures, need to continue. Providing basic construction materials and technical advice can support the household’s efforts.
A reduction in the losses of standing crops due to floods can be promoted with a campaign promoting early planting for the next harvest.
Supporting alternative livelihoods
While subsistence agriculture remain the mean livelihood in the flooded area, the irregular rainfall and unsuitable arable land, are structural problems that affect this livelihood. The irregular climate patterns made the area subjective to drought periods and heavy rains, what results in cumulative periods of losses.
Crops are regularly affected by outbreaks of crop pets while subsistence farmers have limited access to fertilizers. The majority of the villages affected by the floods in the northern central region (an estimated 80 percent) reported being affected with armyworm, while in the majority of
Namibia Post Disaster Needs Assessment 177
Page 177
the subsistence farmers in the Caprivi area reported being affected by the foot and mouth disease. In the Caprivi area, the frequent attacks from wildlife are also a threat to the crops.
While the Government subsidizes the fertilizer and seeds and provides support for the ploughing, the measures seem to not be enough to improve the subsistence agriculture of poor households. In addition, the loss of household members due to HIV and AIDS is a threat to the agriculture as it causes a reduction in the labour. Supporting alternative livelihoods51
Lowering poverty levels
in the area is required to reduce the impact of future disasters in the household economy.
Due to the strong link of chronic poverty and chronic food insecurity, measures to address the chronic poverty in the area will likely have an impact in the rising the household’s reliance to cope with food shortages caused by natural disasters.
Needs
Immediate Needs
While the Government of Namibia through Directorate Emergency Management (DEM) has the budgetary capacity to address the food assistance needs, the implementation of the food assistance is facing some challenges that need to be urgently addressed in order to reach the population in need.
Key informants interviewed during the assessment reported that the food distribution was not effected according to the plans and that food rations were not received timely by the population in need. Key informants indicated that the food rations received did not match with the planned ration and that in most cases only maize meal had been received. In addition, reports indicate that the assistance has not been provided on a monthly basis as planned, but on a one time basis.
The logistics chain in place to distribute food assistance is experiencing bottle necks that are impeding the transportation of food to the affected population. The following measures are recommended to solve these bottle necks:
Secondary transport
To facilitate the process for hiring private transporters for the distribution of food;
Food distributions
To strengthen the coordination to issue and follow food distribution plans;
Warehouse management
To dispose spoiled food stored in the warehoused; To strengthen the supplier chain ensuring flow of food to the warehouses; To do an inventory of the warehouses available for the implementation of the food
scheme,
51 The topic is treated separately in the livelihoods analysis included in the PDNA.

Namibia Post Disaster Needs Assessment 178
Page 178
To identify the equipment needs for the correct functioning as pallets, safety equipment, safety clothing, cleaning equipment, extendable ladder and industrial scale. Once identified, the most urgent equipment needs to be distributed;
To establish a standard warehouse management record system; To strengthen the payment process to ensure warehouse staff payments in time; To ensure supplying of empty bags and bottles for re – bagging / re – bottling food.
The implementation of the recommendations in time is crucial to activate a smooth food distribution; should the Government consider that putting the measures in place can not be done in a short period of time, it is recommended that the food distribution is augmented by additional government institutions / channels, in order to avoid a rapid deterioration of the food security situation of vulnerable households.
Beneficiary targeting remains a challenge to reach the food insecure population affected by the floods and experiencing acute food insecurity. The Government has defined broad targeting criteria based on demographics to identify the population subject to receive food assistance, identifying households with members that fall under the following groups: “pregnant and lactating mothers, children under five years old, elderly (more than 60 years), people living with disability and vulnerable people that the Traditional Authorities and local leaders identify to be beneficiaries of general food distribution”.
Difficulties in targeting are related to the registration of beneficiaries and were already a difficulty identified during the implementation of the 2008 food assistance. The Report on National Response to the 2008 Flood Disaster compiled by the Office of the Prime Minister. September 2008 highlights this issue:
“…Food assistance Flood affected people were issued with monthly food ratios comprising of maize meal, cooking oil and tinned fish. A variety of food items were also donated and these were also distributed to the flood affected people. Problems were however experienced in the initial phase of the flood disaster where due to lack of proper registration procedures, some people who were not targeted for the emergency food supplies were issued food thereby stretching the limited amount of food available…” (Section 2.9.1 section, page 11).
During the assessment, a similar situation to 2008 was found, with population in need of food assistance not reached under the ongoing food scheme. The informants interviewed at regional and local level explained that the beneficiaries identified for the “Comprehensive Food aid scheme” were those already identified under the “Drought Food Relief Scheme”, what represents an exclusion error of those affected by the floods but not selected previously.
The registration process identifying the food assistance beneficiaries is conducted by the Traditional authorities at the local level, what implies a high potential bias due to the lack of objective criteria during the selection. Introduction of new targeting mechanisms is required to identify the groups in need of assistance reducing inclusion and exclusion errors.
It is recommended that new criteria are defined for beneficiary targeting and that a registration of beneficiaries is done accordingly. The proposed new criteria are:

Namibia Post Disaster Needs Assessment 179
Page 179
a) Households affected by shocks and with low resilience:
and
Households that have lost their stocks of staple cereals and harvest due to the floods and do not have livestock
b) Are below the poverty line52
and
c) Present high dependency ratio:
It is recommended that, given that using the new criteria will not solve the problem of registering intended beneficiaries, the identification of beneficiaries be done through different government institutions than those currently responsible for this activity.
Households with vulnerable family members as pregnant and lactating mothers, children under five years old, elderly (more than 60 years), people living with disability that are not receiving government grants and do not receive remittances from relatives.
The local and regional authorities had reported that the food ration distributed to the flood victims was not sufficient to cover the household needs. The food ration allocated per household is standard independently of the number of household members. While in a planning stage, the household size was considered to adjust the food ration, during the implementation phase, a standard ration has been distributed. In the case of the households in rural areas, with an average 4.3 members, the situation seems to be critical as households of more than 8 family members are common. A new revised ration is to be defined and adjusted to the household size.
In addition, monitoring and evaluation mechanisms need to be put in place to ensure that the food rations are reaching the intended beneficiaries.
Medium term needs
Seeds and agriculture inputs are needed to be provided to subsistence farmers in order to ensure the next main harvest.
Establishing a monitoring system for the implementation of the food relief programme is needed in order to evaluate the efficiency and efficacy of the food distribution and propose the necessary adjustments.
Maintaining low food prices of basic food commodities is essential to ensure that the vulnerable population groups affected by the floods and that are facing structural poverty have food access. The protective measures on the local production of cereals and the elimination of VAT on the food commodities have proved to be efficient measures and are recommended to continue.
Continuing systematic monitoring of child malnutrition is required especially after the floods as the reduction of food availability can result on a worsening of malnutrition status of the vulnerable
52 Poverty lines as defined by the by the Central Bureau of Statistics in the National Planning Commission in the Office of the President are as follows: ‘severely poor’ are living on less than N$184.5 (US$19) a month, ‘poor’ are living on less than N$262.5 (US$27) a month. Central Bureau of Statistics, National Planning Commission, 2008, a review of Poverty and Inequality in Namibia.

Namibia Post Disaster Needs Assessment 180
Page 180
population groups. Conducting a nutrition survey at national level is recommended as the data will provide an updated picture of the malnutrition levels after the last shocks.
Monitoring of the food security situation is needed in the medium term in the flood affected areas to understand trends and identify possible signs of deterioration on the situation of vulnerable groups.

Namibia Post Disaster Needs Assessment 181
Page 181
Annex 12: GIS Mapping
[to be provided by EC by mid September]