from damage and loss assessment (dala) to post-disaster needs assessment (pdna) j. roberto jovel /...
TRANSCRIPT
From Damage and Loss From Damage and Loss Assessment (DaLa)Assessment (DaLa)
To Post-Disaster Needs To Post-Disaster Needs Assessment (PDNA)Assessment (PDNA)
J. Roberto Jovel / Ricardo ZapataJ. Roberto Jovel / Ricardo Zapata
8May07 RJ 2
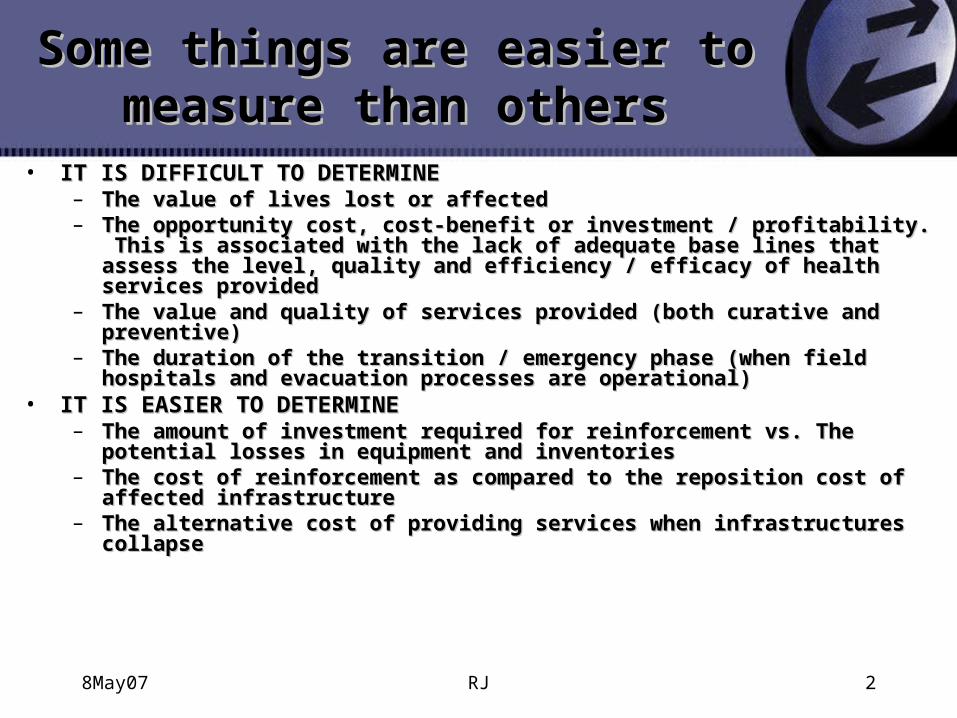
Some things are easier to Some things are easier to measure than othersmeasure than others
• IT IS DIFFICULT TO DETERMINEIT IS DIFFICULT TO DETERMINE– The value of lives lost or affectedThe value of lives lost or affected– The opportunity cost, cost-benefit or investment / profitability. This is associated The opportunity cost, cost-benefit or investment / profitability. This is associated
with the lack of adequate base lines that assess the level, quality and efficiency / with the lack of adequate base lines that assess the level, quality and efficiency / efficacy of health services providedefficacy of health services provided
– The value and quality of services provided (both curative and preventive) The value and quality of services provided (both curative and preventive) – The duration of the transition / emergency phase (when field hospitals and The duration of the transition / emergency phase (when field hospitals and
evacuation processes are operational)evacuation processes are operational)• IT IS EASIER TO DETERMINEIT IS EASIER TO DETERMINE
– The amount of investment required for reinforcement vs. The potential losses in The amount of investment required for reinforcement vs. The potential losses in equipment and inventories equipment and inventories
– The cost of reinforcement as compared to the reposition cost of affected The cost of reinforcement as compared to the reposition cost of affected infrastructureinfrastructure
– The alternative cost of providing services when infrastructures collapseThe alternative cost of providing services when infrastructures collapse
8May07 RJ 3
8May07 RJ 4
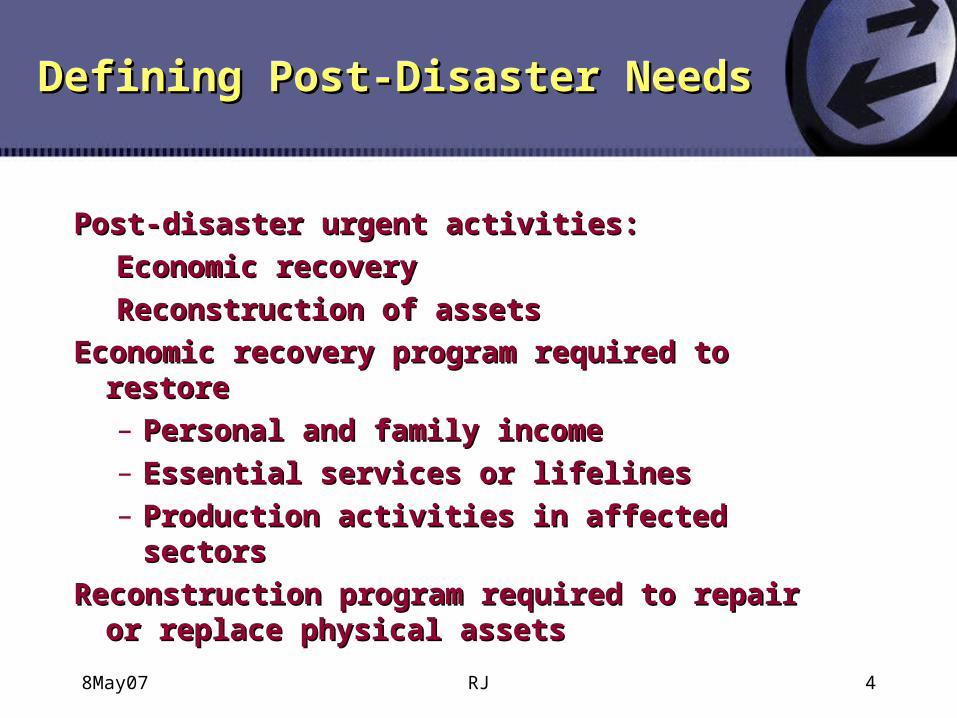
Defining Post-Disaster NeedsDefining Post-Disaster Needs
Post-disaster urgent activities:Post-disaster urgent activities:
Economic recoveryEconomic recovery
Reconstruction of assetsReconstruction of assets
Economic recovery program required to restoreEconomic recovery program required to restore– Personal and family incomePersonal and family income– Essential services or lifelinesEssential services or lifelines– Production activities in affected sectorsProduction activities in affected sectors
Reconstruction program required to repair or Reconstruction program required to repair or replace physical assetsreplace physical assets
8May07 RJ 5
Defining Post-Disaster Needs ..Defining Post-Disaster Needs ..
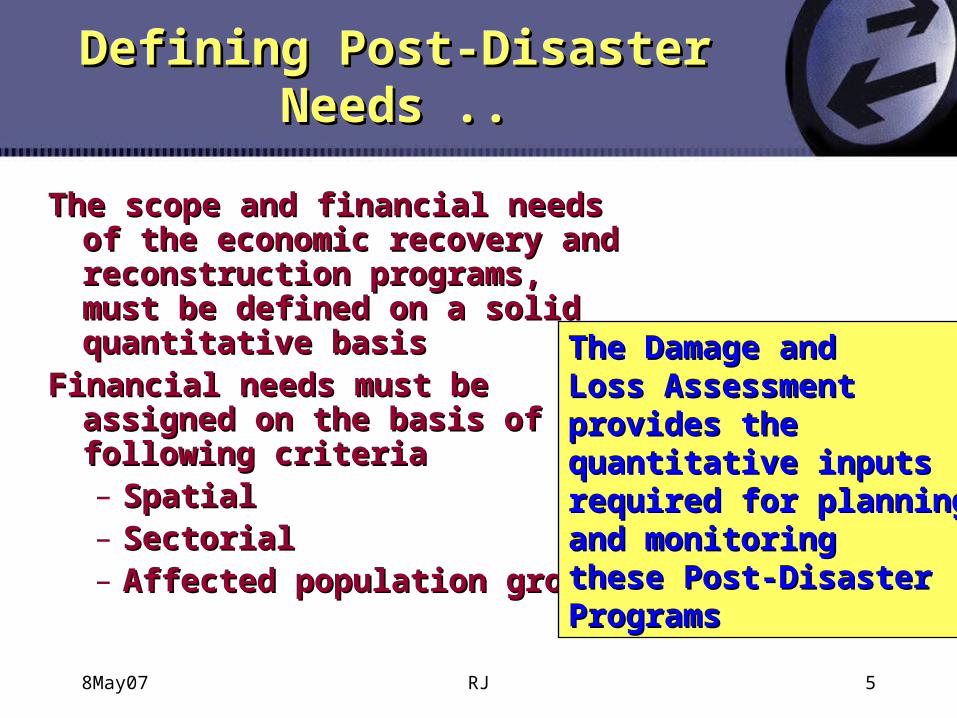
The scope and financial needs of the The scope and financial needs of the economic recovery and economic recovery and reconstruction programs, must be reconstruction programs, must be defined on a solid quantitative defined on a solid quantitative basisbasis
Financial needs must be assigned Financial needs must be assigned on the basis of the following on the basis of the following criteriacriteria– SpatialSpatial– SectorialSectorial– Affected population groupsAffected population groups
The Damage andThe Damage andLoss AssessmentLoss Assessmentprovides the provides the quantitative inputsquantitative inputsrequired for planningrequired for planningand monitoringand monitoringthese Post-Disasterthese Post-DisasterProgramsPrograms
8May07 RJ 6
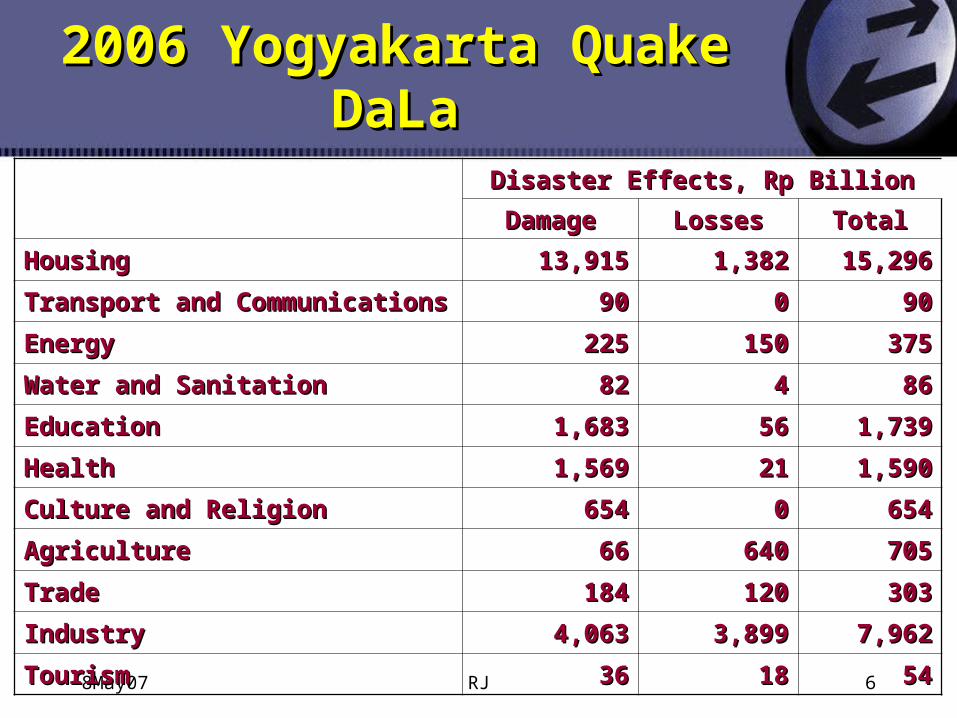
2006 Yogyakarta Quake DaLa2006 Yogyakarta Quake DaLa
Disaster Effects, Rp BillionDisaster Effects, Rp Billion
DamageDamage LossesLosses TotalTotal
HousingHousing 13,91513,915 1,3821,382 15,29615,296
Transport and CommunicationsTransport and Communications 9090 00 9090
EnergyEnergy 225225 150150 375375
Water and SanitationWater and Sanitation 8282 44 8686
EducationEducation 1,6831,683 5656 1,7391,739
HealthHealth 1,5691,569 2121 1,5901,590
Culture and ReligionCulture and Religion 654654 00 654654
AgricultureAgriculture 6666 640640 705705
TradeTrade 184184 120120 303303
IndustryIndustry 4,0634,063 3,8993,899 7,9627,962
TourismTourism 3636 1818 5454
8May07 RJ 7
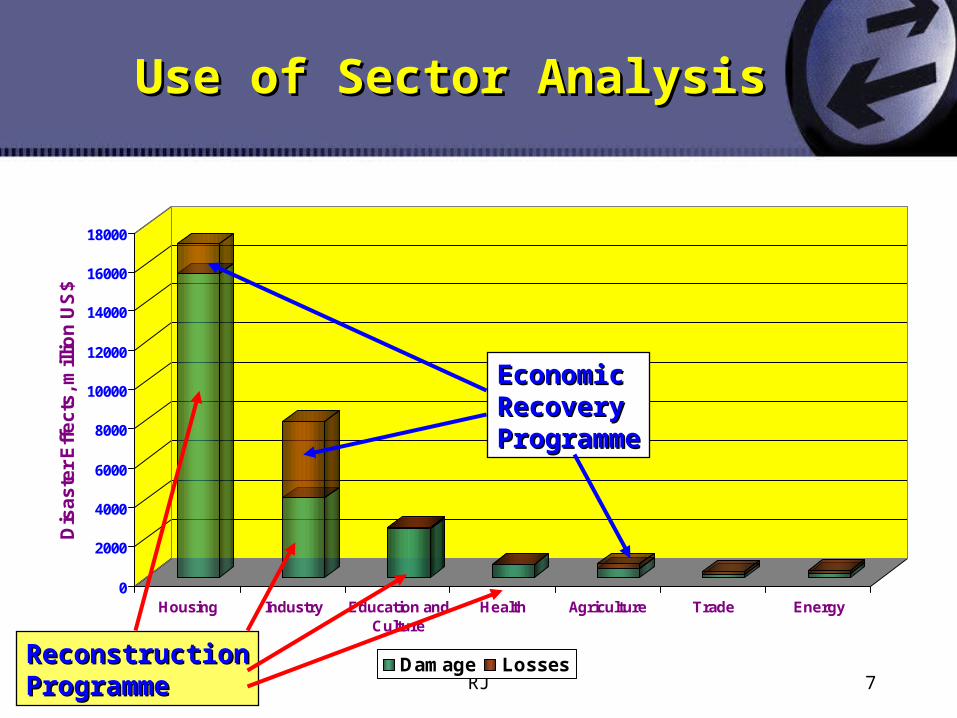
Use of Sector AnalysisUse of Sector Analysis
0
2000
4000
6000
8000
10000
12000
14000
16000
18000
Dis
as
ter
Eff
ec
ts, m
illio
n U
S$
Housing Industry Education andCulture
Health Agriculture Trade Energy
Damage LossesReconstructionReconstructionProgrammeProgramme
Economic Economic Recovery Recovery ProgrammeProgramme

From Losses to Economic From Losses to Economic Recovery PlanRecovery Plan
8May07 RJ 9
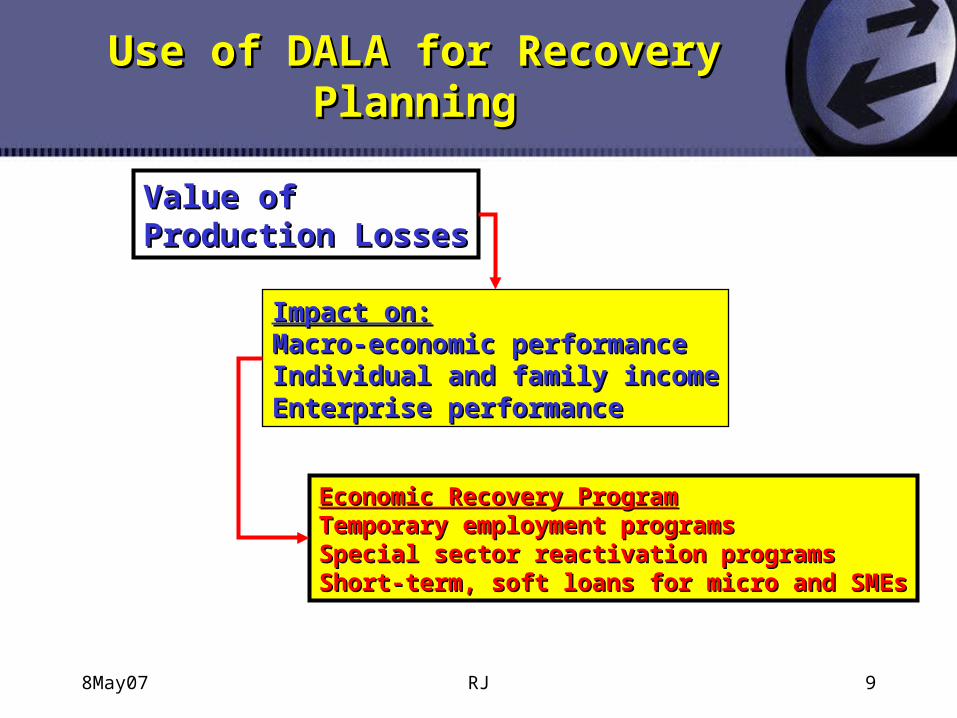
Use of DALA for Recovery Use of DALA for Recovery PlanningPlanning
Value ofValue ofProduction LossesProduction Losses
Impact on:Impact on:Macro-economic performanceMacro-economic performanceIndividual and family incomeIndividual and family incomeEnterprise performanceEnterprise performance
Economic Recovery ProgramEconomic Recovery ProgramTemporary employment programsTemporary employment programsSpecial sector reactivation programsSpecial sector reactivation programsShort-term, soft loans for micro and SMEsShort-term, soft loans for micro and SMEs
8May07 RJ 10
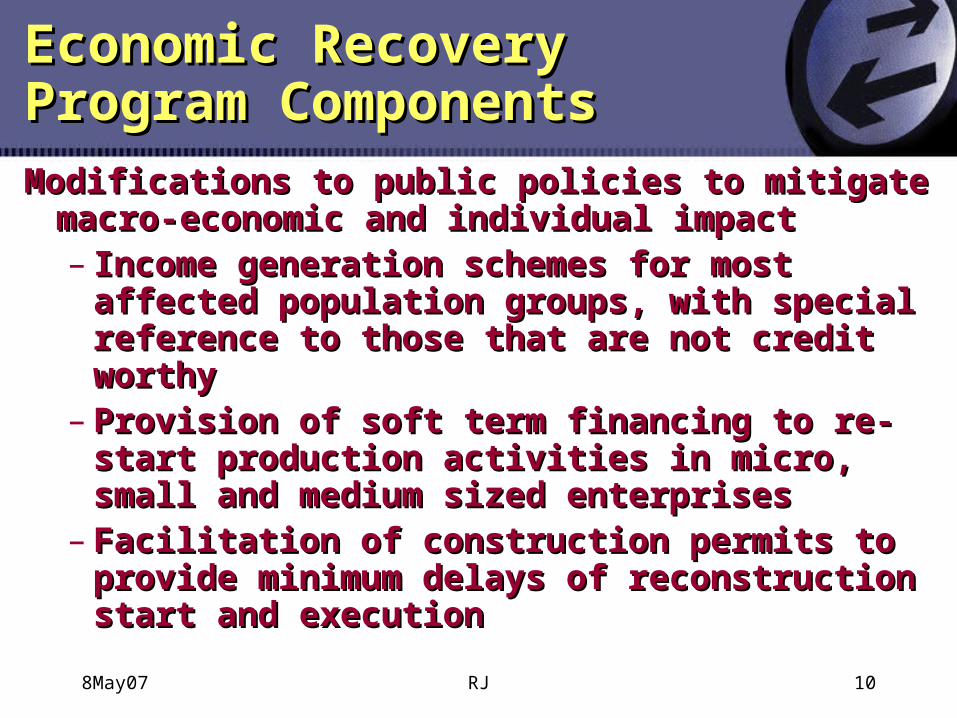
Economic Recovery Economic Recovery Program ComponentsProgram Components
Modifications to public policies to mitigate Modifications to public policies to mitigate macro-economic and individual impactmacro-economic and individual impact– Income generation schemes for most Income generation schemes for most
affected population groups, with special affected population groups, with special reference to those that are not credit worthyreference to those that are not credit worthy
– Provision of soft term financing to re-start Provision of soft term financing to re-start production activities in micro, small and production activities in micro, small and medium sized enterprisesmedium sized enterprises
– Facilitation of construction permits to Facilitation of construction permits to provide minimum delays of reconstruction provide minimum delays of reconstruction start and executionstart and execution
8May07 RJ 11
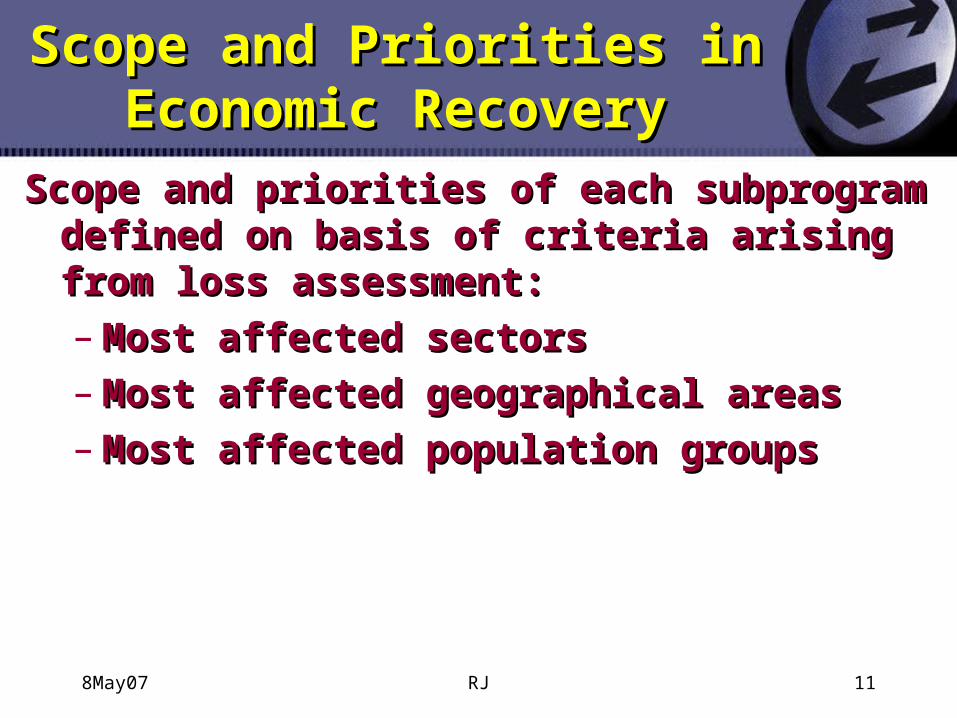
Scope and Priorities in Scope and Priorities in Economic RecoveryEconomic Recovery
Scope and priorities of each subprogram defined Scope and priorities of each subprogram defined on basis of criteria arising from loss on basis of criteria arising from loss assessment:assessment:
– Most affected sectorsMost affected sectors
– Most affected geographical areasMost affected geographical areas
– Most affected population groupsMost affected population groups
8May07 RJ 12
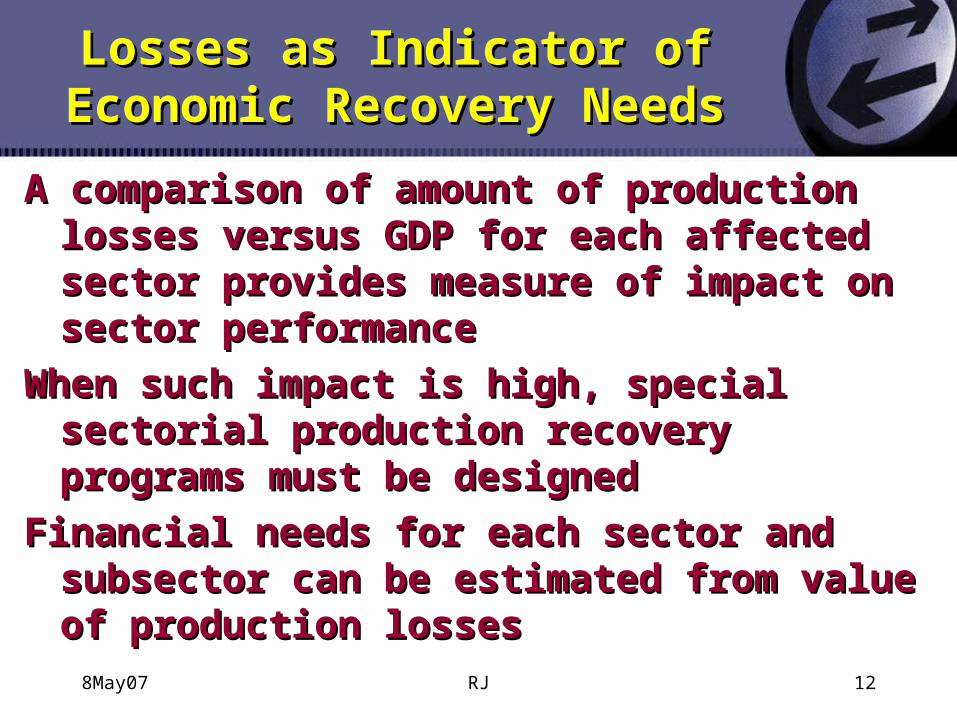
Losses as Indicator of Losses as Indicator of Economic Recovery NeedsEconomic Recovery Needs
A comparison of amount of production losses A comparison of amount of production losses versus GDP for each affected sector provides versus GDP for each affected sector provides measure of impact on sector performancemeasure of impact on sector performance
When such impact is high, special sectorial When such impact is high, special sectorial production recovery programs must be production recovery programs must be designeddesigned
Financial needs for each sector and subsector Financial needs for each sector and subsector can be estimated from value of production can be estimated from value of production losseslosses
8May07 RJ 13
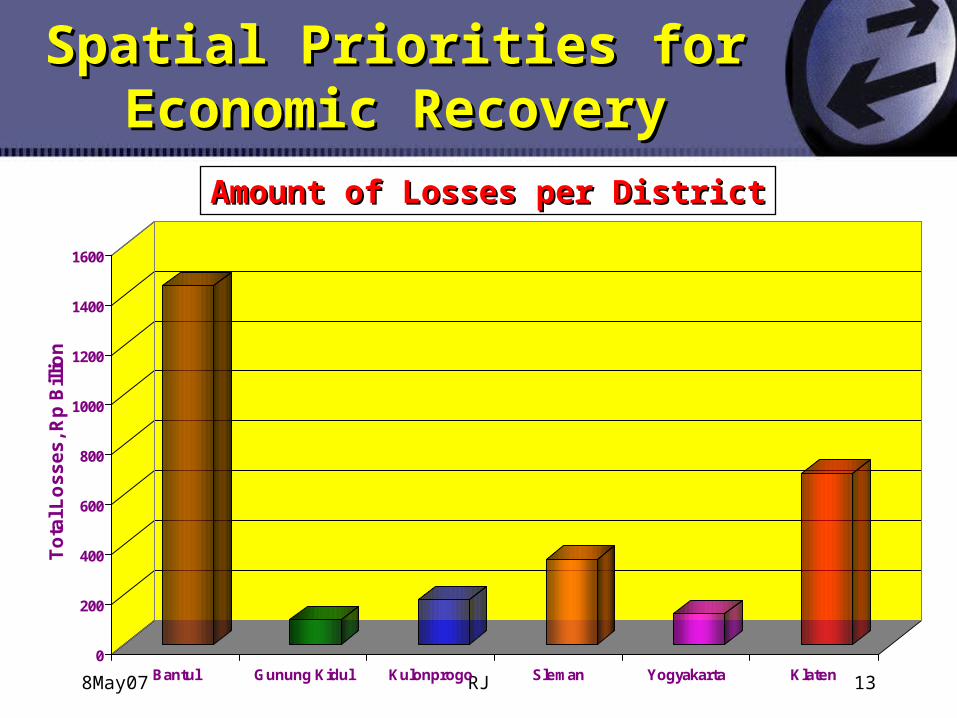
Spatial Priorities for Spatial Priorities for Economic RecoveryEconomic Recovery
0
200
400
600
800
1000
1200
1400
1600
To
tal L
os
se
s, R
p B
illio
n
Bantul Gunung Kidul Kulonprogo Sleman Yogyakarta Klaten
Amount of Losses per DistrictAmount of Losses per District
8May07 RJ 14
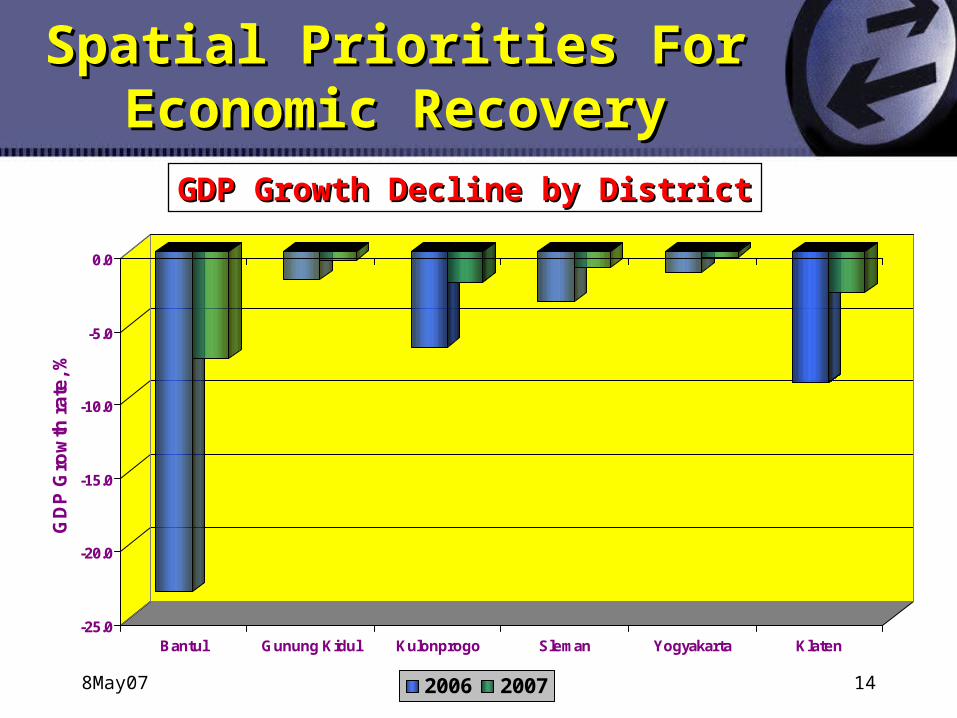
Spatial Priorities For Spatial Priorities For Economic RecoveryEconomic Recovery
-25.0
-20.0
-15.0
-10.0
-5.0
0.0
GD
P G
row
th r
ate
, %
Bantul Gunung Kidul Kulonprogo Sleman Yogyakarta Klaten
2006 2007
GDP Growth Decline by DistrictGDP Growth Decline by District
8May07 RJ 15
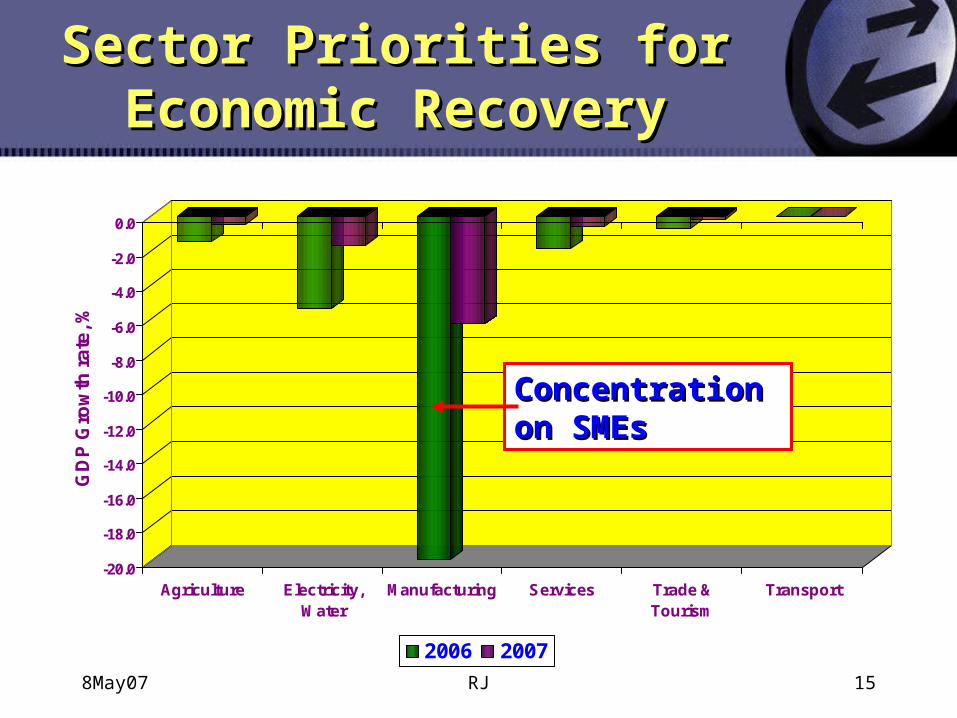
Sector Priorities for Sector Priorities for Economic RecoveryEconomic Recovery
-20.0
-18.0
-16.0
-14.0
-12.0
-10.0
-8.0
-6.0
-4.0
-2.0
0.0
GD
P G
row
th r
ate
, %
Agriculture Electricity,Water
Manufacturing Services Trade &Tourism
Transport
2006 2007
Concentration Concentration on SMEson SMEs
From Damage to From Damage to Reconstruction NeedsReconstruction Needs
8May07 RJ 17
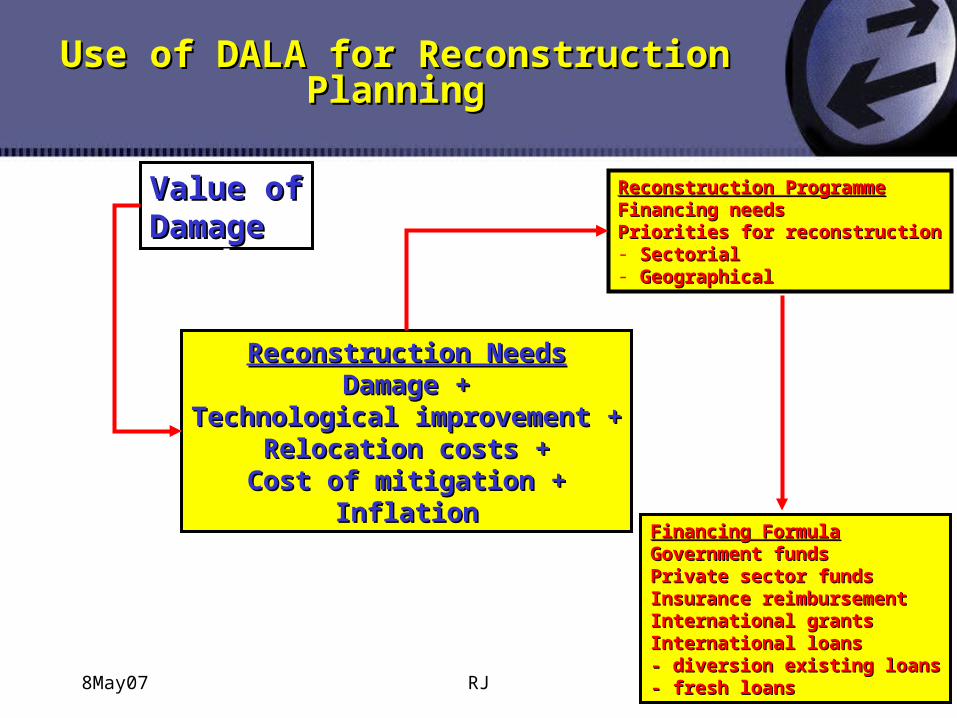
Use of DALA for Reconstruction PlanningUse of DALA for Reconstruction Planning
Value ofValue ofDamageDamage
Reconstruction NeedsReconstruction NeedsDamage +Damage +
Technological improvement +Technological improvement +Relocation costs +Relocation costs +Cost of mitigation +Cost of mitigation +
InflationInflationFinancing FormulaFinancing FormulaGovernment fundsGovernment fundsPrivate sector fundsPrivate sector fundsInsurance reimbursementInsurance reimbursementInternational grantsInternational grantsInternational loansInternational loans- diversion existing loans- diversion existing loans- fresh loans- fresh loans
Reconstruction ProgrammeReconstruction ProgrammeFinancing needsFinancing needsPriorities for reconstructionPriorities for reconstruction- SectorialSectorial- GeographicalGeographical
8May07 RJ 18
Reconstruction NeedsReconstruction Needs
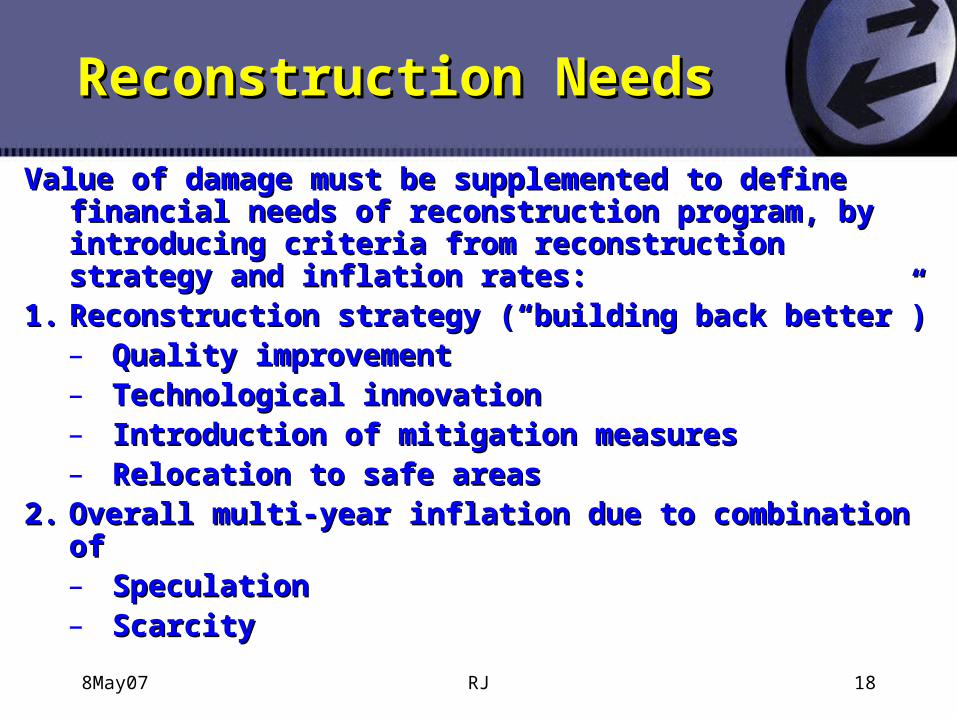
Value of damage must be supplemented to define Value of damage must be supplemented to define financial needs of reconstruction program, by financial needs of reconstruction program, by introducing criteria from reconstruction strategy and introducing criteria from reconstruction strategy and inflation rates:inflation rates:
1.1. Reconstruction strategy (“building back better”)Reconstruction strategy (“building back better”)– Quality improvementQuality improvement– Technological innovationTechnological innovation– Introduction of mitigation measuresIntroduction of mitigation measures– Relocation to safe areasRelocation to safe areas
2.2. Overall multi-year inflation due to combination ofOverall multi-year inflation due to combination of– SpeculationSpeculation– ScarcityScarcity
8May07 RJ 19
Reconstruction NeedsReconstruction Needs
Financial needs for reconstruction can be Financial needs for reconstruction can be defined, focused and prioritized on the basis of defined, focused and prioritized on the basis of the damage assessment, duly adjusted as the damage assessment, duly adjusted as indicated in previous slideindicated in previous slide
Criteria for assignation of financial resourcesCriteria for assignation of financial resources
– Per capita damage figuresPer capita damage figures
– Sector distribution of damageSector distribution of damage
– Spatial distribution of damageSpatial distribution of damage

8May07 RJ 20
Spatial Priorities for Spatial Priorities for ReconstructionReconstruction
0
1,000
2,000
3,000
4,000
5,000
6,000
7,000
8,000
9,000
10,000
Da
ma
ge
in R
p B
illio
n
Bantul Gunung Kidul Kulonprogo Sleman Yogyakarta Klaten
Total Damage per DistrictTotal Damage per District
8May07 RJ 21
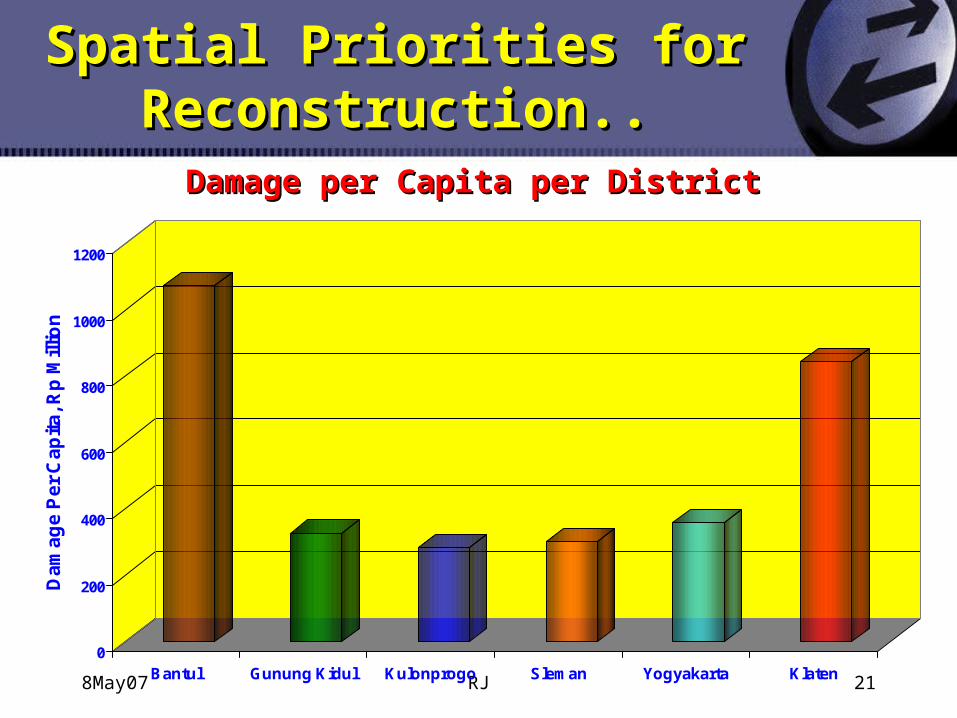
Spatial Priorities for Spatial Priorities for Reconstruction..Reconstruction..
0
200
400
600
800
1000
1200
Da
ma
ge
Pe
r C
ap
ita
, Rp
Mill
ion
Bantul Gunung Kidul Kulonprogo Sleman Yogyakarta Klaten
Damage per Capita per DistrictDamage per Capita per District
8May07 RJ 22
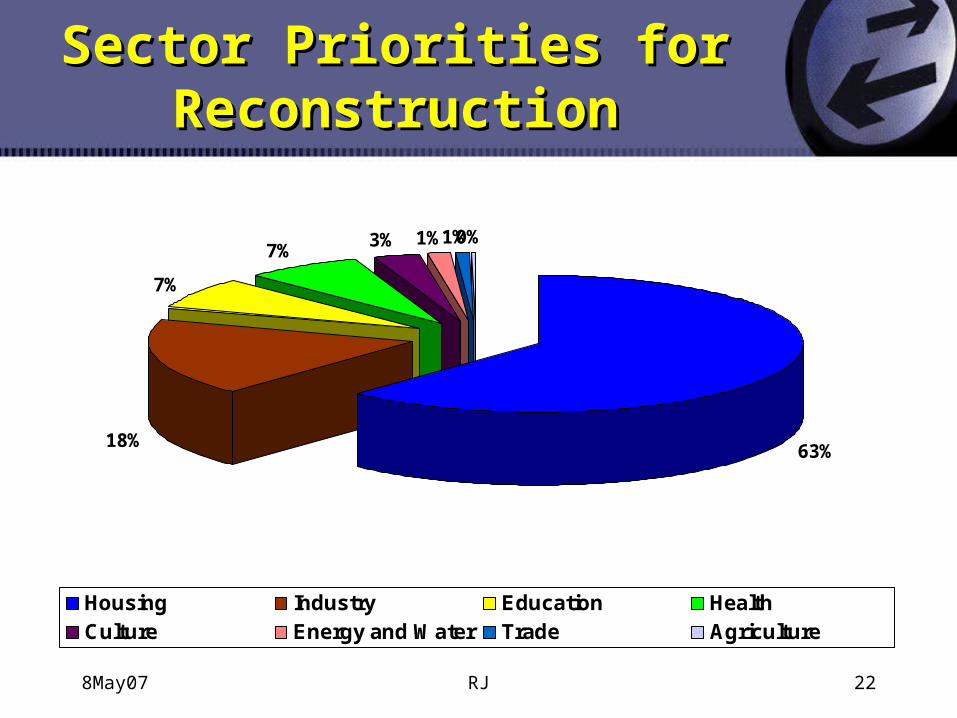
Sector Priorities for Sector Priorities for ReconstructionReconstruction
63%18%
7%
7%3% 1%1%0%
Housing Industry Education HealthCulture Energy and Water Trade Agriculture
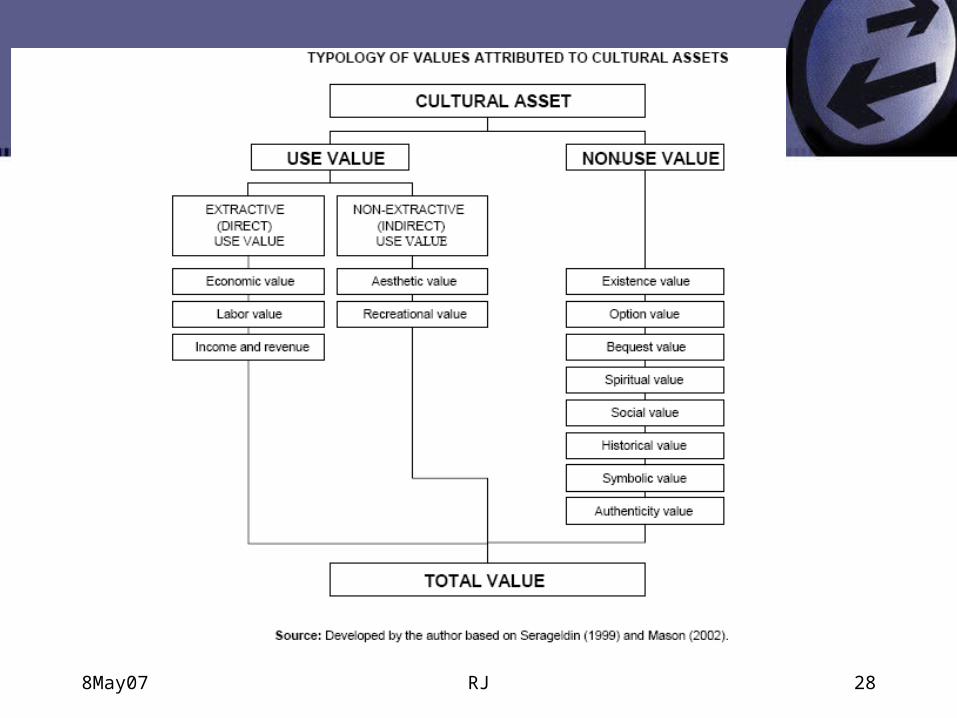
From quantitative to From quantitative to qualitativequalitative
Damage and losses to natural Damage and losses to natural capital and impact on cultural capital and impact on cultural assets: some recent examplesassets: some recent examples
8May07 RJ 24
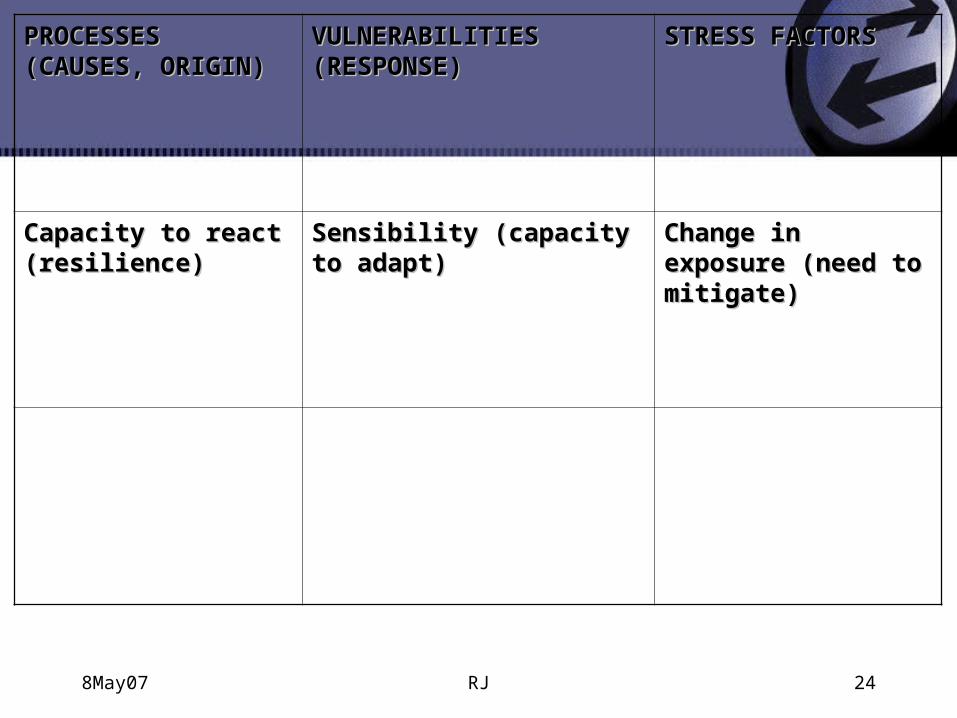
PROCESSES PROCESSES (CAUSES, ORIGIN)(CAUSES, ORIGIN)
VULNERABILITIES VULNERABILITIES (RESPONSE)(RESPONSE)
STRESS FACTORSSTRESS FACTORS
Capacity to react Capacity to react (resilience)(resilience)
Sensibility (capacity to Sensibility (capacity to adapt)adapt)
Change in exposure Change in exposure (need to mitigate)(need to mitigate)
8May07 RJ 25
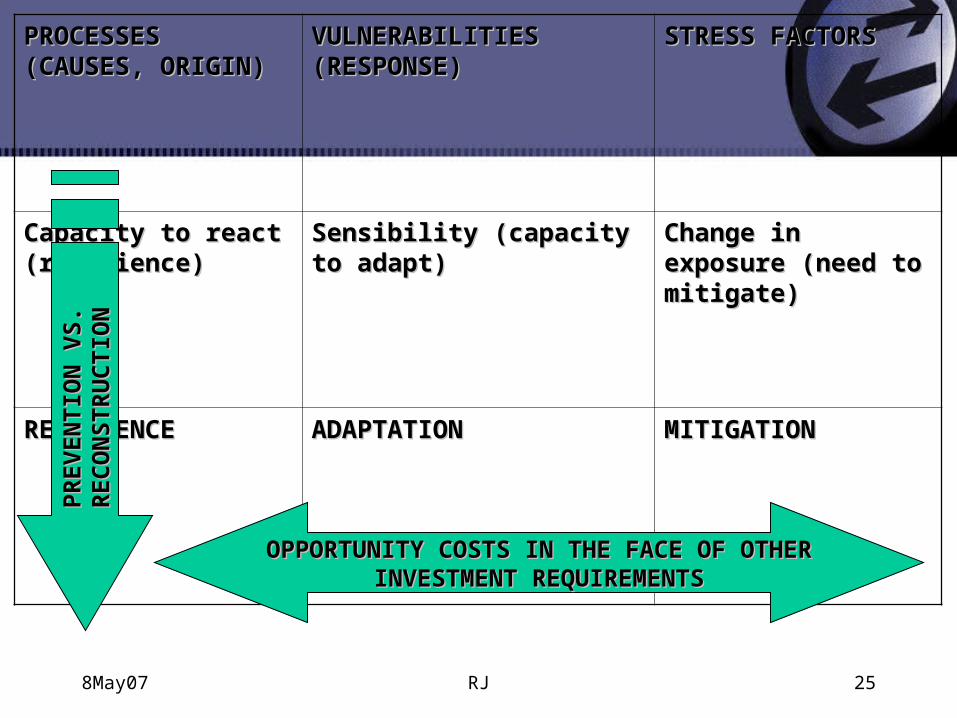
PROCESSES PROCESSES (CAUSES, ORIGIN)(CAUSES, ORIGIN)
VULNERABILITIES VULNERABILITIES (RESPONSE)(RESPONSE)
STRESS FACTORSSTRESS FACTORS
Capacity to react Capacity to react (resilience)(resilience)
Sensibility (capacity to Sensibility (capacity to adapt)adapt)
Change in exposure Change in exposure (need to mitigate)(need to mitigate)
RESILIENCERESILIENCE ADAPTATIONADAPTATION MITIGATIONMITIGATION
PR
EV
EN
TIO
N V
S.
PR
EV
EN
TIO
N V
S.
RE
CO
NS
TR
UC
TIO
NR
EC
ON
ST
RU
CT
ION
OPPORTUNITY COSTS IN THE FACE OF OTHER OPPORTUNITY COSTS IN THE FACE OF OTHER INVESTMENT REQUIREMENTSINVESTMENT REQUIREMENTS
8May07 RJ 26
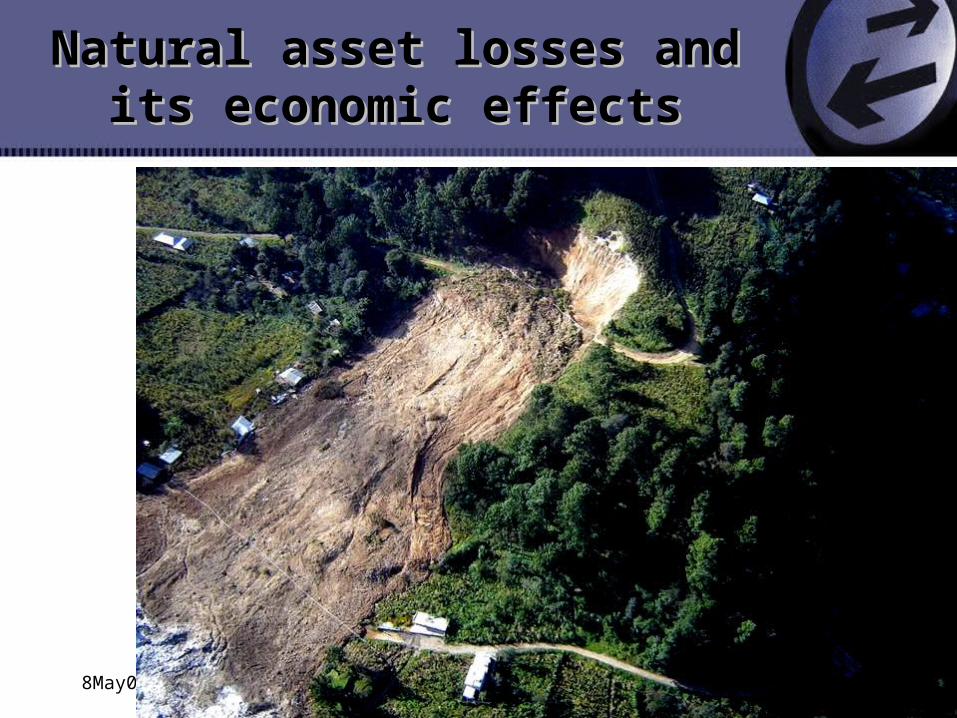
Natural asset losses and its Natural asset losses and its economic effectseconomic effects
8May07 RJ 27
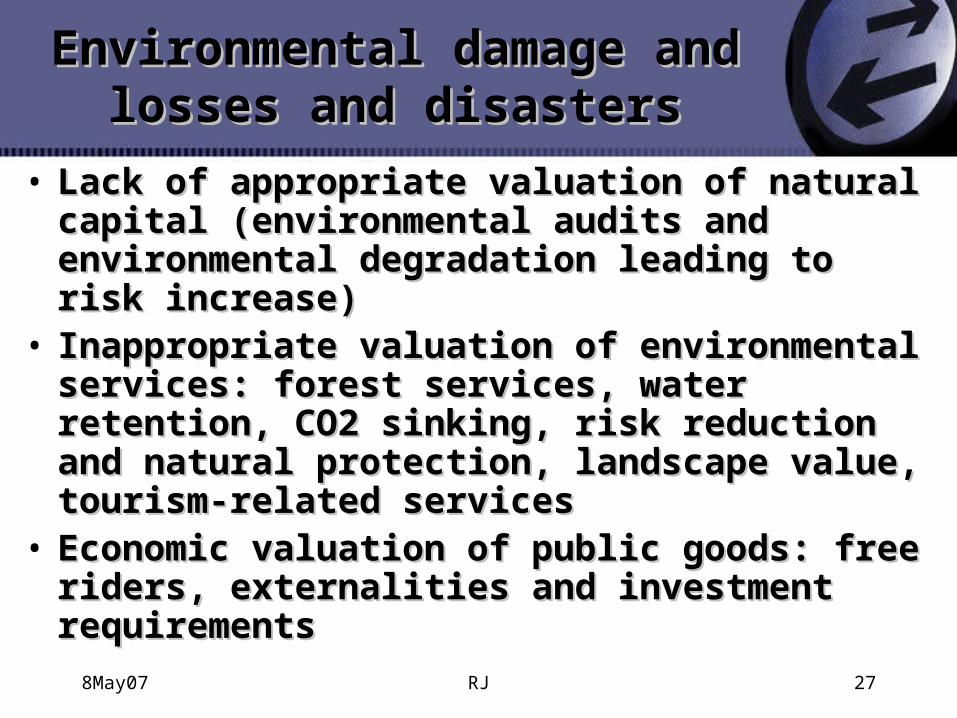
Environmental damage and Environmental damage and losses and disasterslosses and disasters
• Lack of appropriate valuation of natural capital Lack of appropriate valuation of natural capital (environmental audits and environmental (environmental audits and environmental degradation leading to risk increase)degradation leading to risk increase)
• Inappropriate valuation of environmental Inappropriate valuation of environmental services: forest services, water retention, CO2 services: forest services, water retention, CO2 sinking, risk reduction and natural protection, sinking, risk reduction and natural protection, landscape value, tourism-related serviceslandscape value, tourism-related services
• Economic valuation of public goods: free Economic valuation of public goods: free riders, externalities and investment riders, externalities and investment requirementsrequirements
8May07 RJ 28
8May07 RJ 29
8May07 RJ 30
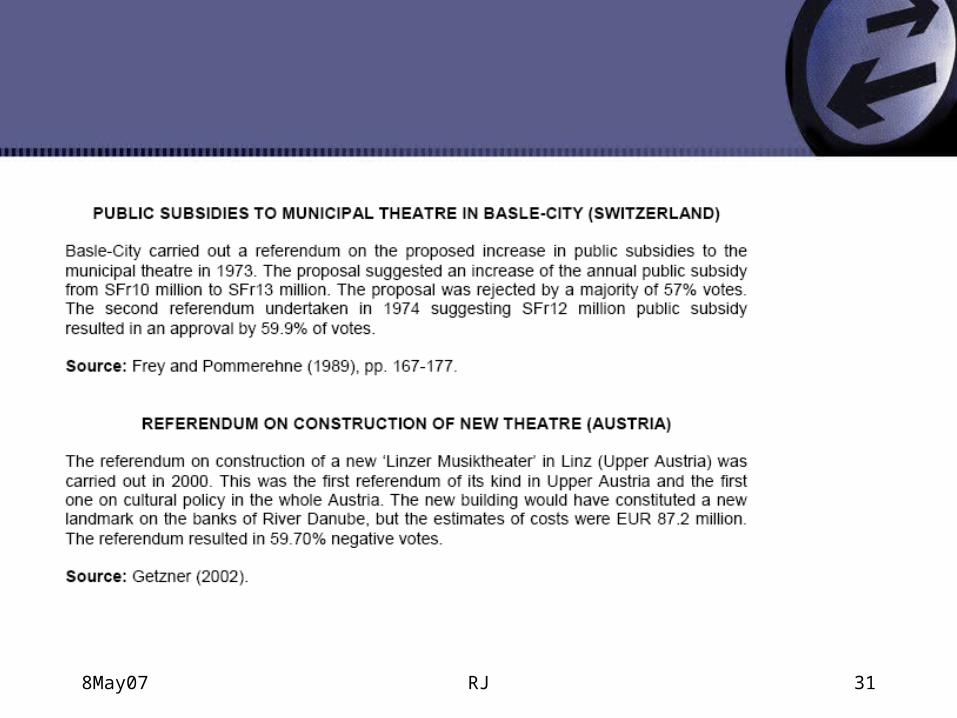
8May07 RJ 31
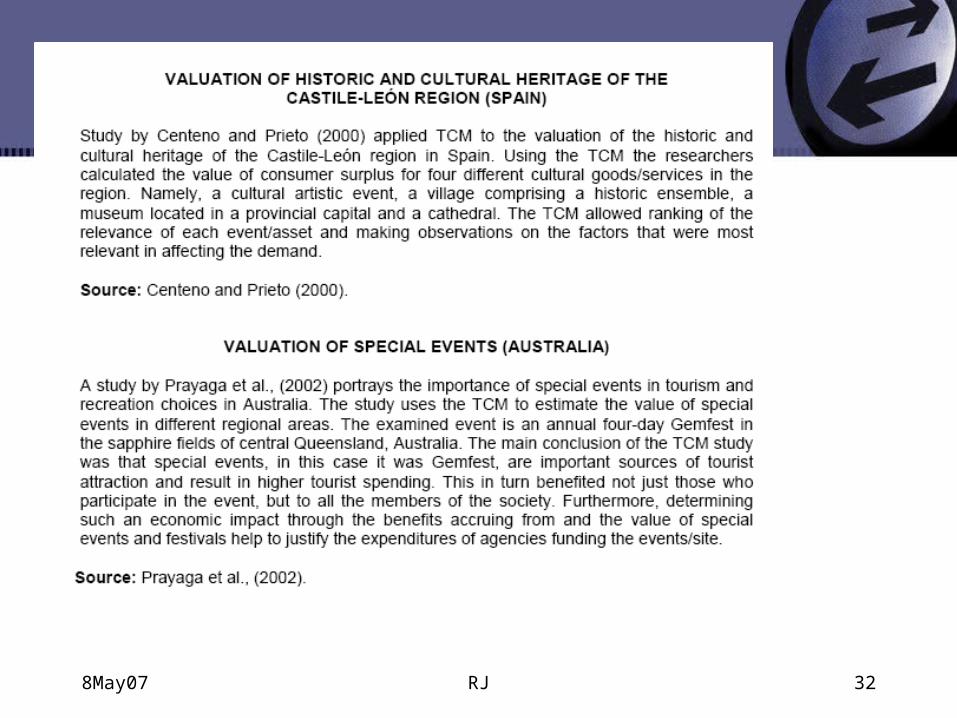
8May07 RJ 32
8May07 RJ 33
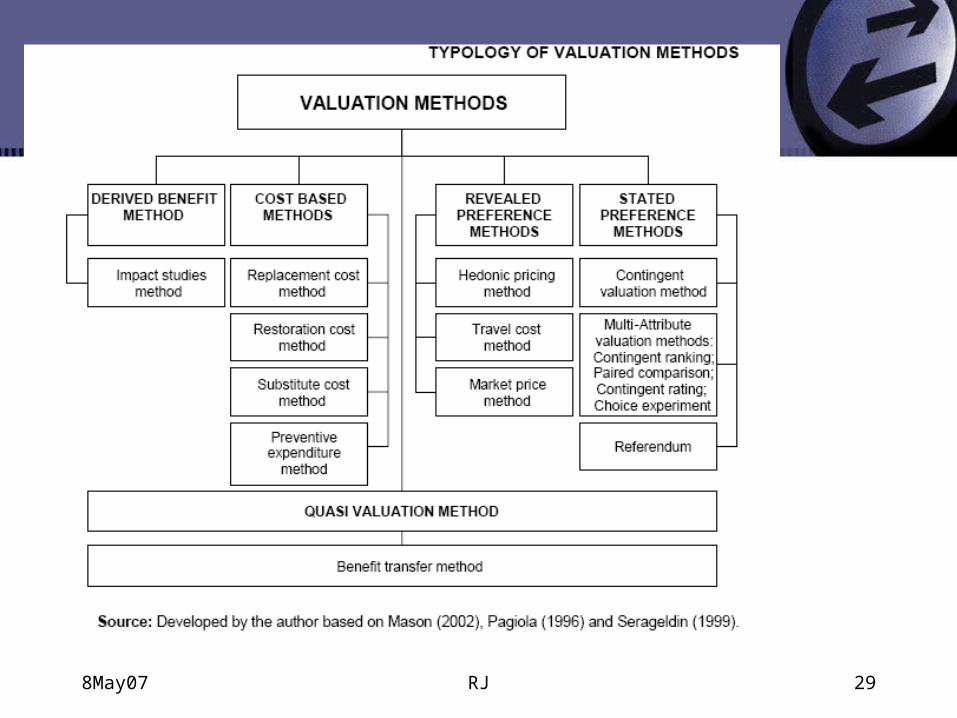
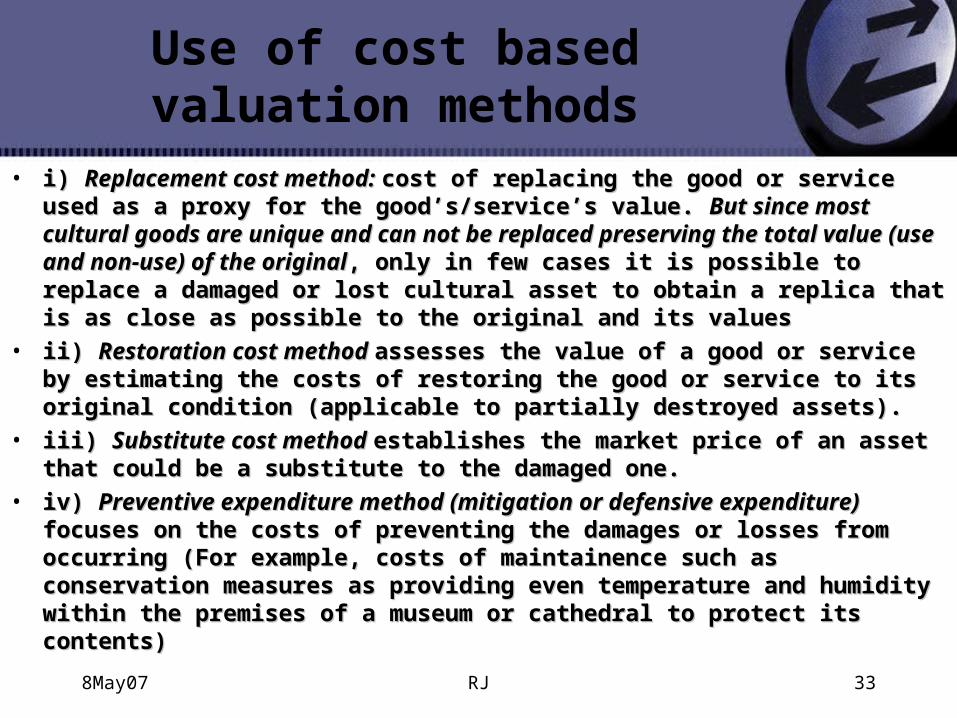
Use of cost based valuation methods
• i) i) Replacement cost method: Replacement cost method: cost of replacing the good or service used as cost of replacing the good or service used as a proxy for the good’s/service’s value. a proxy for the good’s/service’s value. But since most cultural goods are But since most cultural goods are unique and can not be replaced preserving the total value (use and non-unique and can not be replaced preserving the total value (use and non-use) of the originaluse) of the original, only in few cases it is possible to replace a damaged , only in few cases it is possible to replace a damaged or lost cultural asset to obtain a replica that is as close as possible to the or lost cultural asset to obtain a replica that is as close as possible to the original and its valuesoriginal and its values
• ii) ii) Restoration cost method Restoration cost method assesses the value of a good or service by assesses the value of a good or service by estimating the costs of restoring the good or service to its original estimating the costs of restoring the good or service to its original condition (applicable to partially destroyed assets). condition (applicable to partially destroyed assets).
• iii) iii) Substitute cost method Substitute cost method establishes the market price of an asset that establishes the market price of an asset that could be a substitute to the damaged one.could be a substitute to the damaged one.
• iv) iv) Preventive expenditure method (mitigation or defensive expenditure) Preventive expenditure method (mitigation or defensive expenditure) focuses on the costs of preventing the damages or losses from occurring focuses on the costs of preventing the damages or losses from occurring (For example, costs of maintainence such as conservation measures as (For example, costs of maintainence such as conservation measures as providing even temperature and humidity within the premises of a providing even temperature and humidity within the premises of a museum or cathedral to protect its contents)museum or cathedral to protect its contents)
8May07 RJ 34
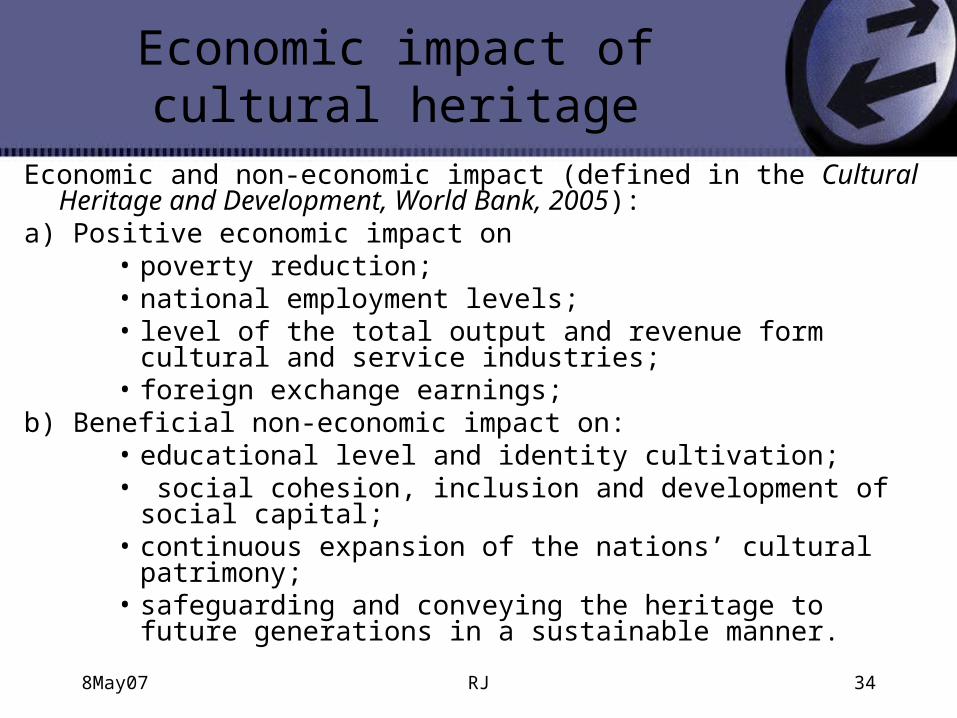
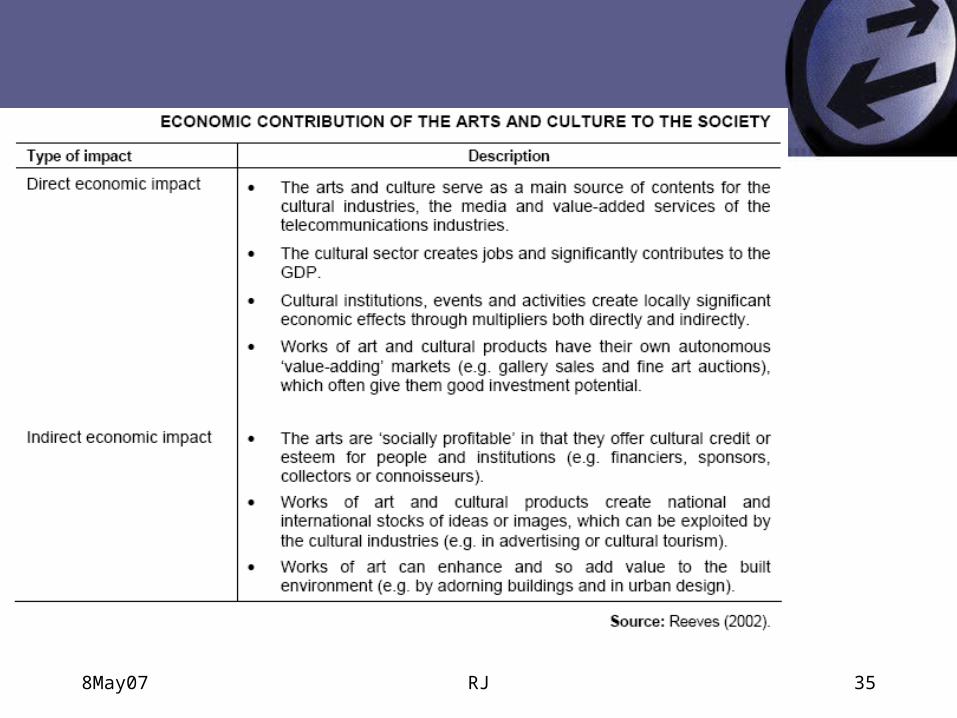
Economic impact of cultural heritage
Economic and non-economic impact (defined in the Cultural Heritage and Development, World Bank, 2005):
a) Positive economic impact on• poverty reduction;• national employment levels;• level of the total output and revenue form cultural and service
industries;• foreign exchange earnings;
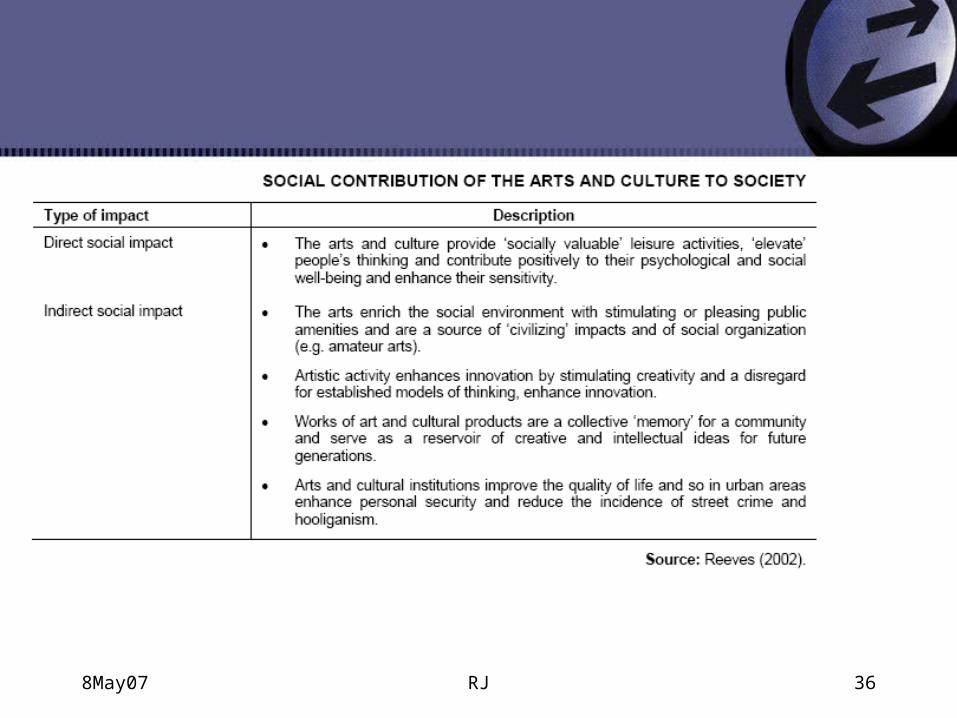
b) Beneficial non-economic impact on:• educational level and identity cultivation;• social cohesion, inclusion and development of social capital;• continuous expansion of the nations’ cultural patrimony;• safeguarding and conveying the heritage to future generations
in a sustainable manner.
8May07 RJ 35
8May07 RJ 36

8May07 RJ 37
8May07 RJ 38
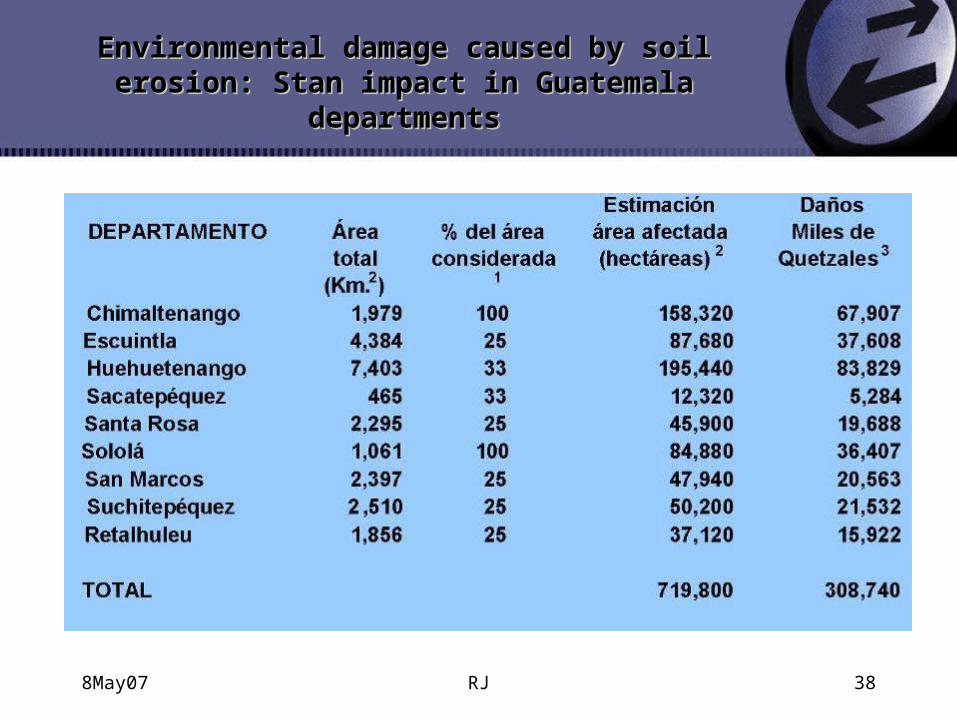
Environmental damage caused by soil erosion: Stan Environmental damage caused by soil erosion: Stan impact in Guatemala departmentsimpact in Guatemala departments
8May07 RJ 39
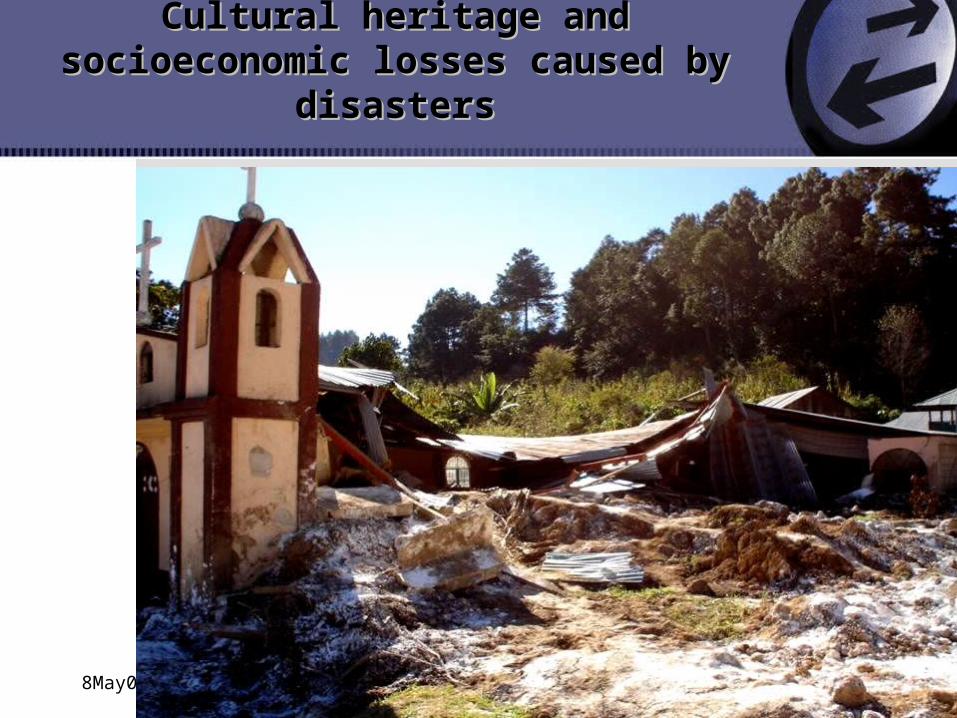
Cultural heritage and socioeconomic Cultural heritage and socioeconomic losses caused by disasterslosses caused by disasters
8May07 RJ 40
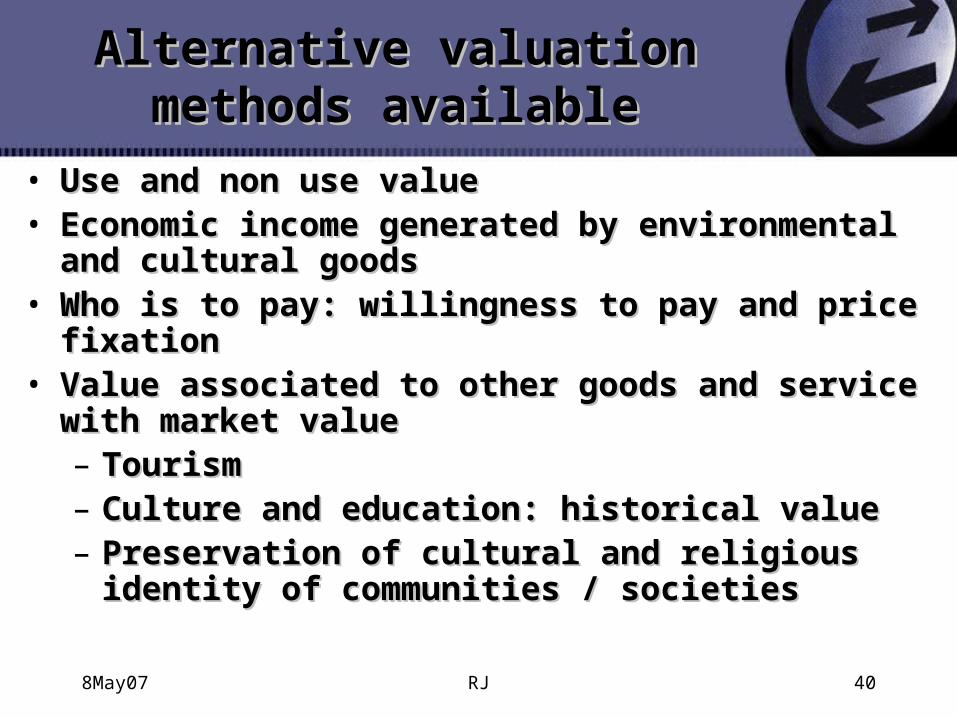
Alternative valuation methods Alternative valuation methods availableavailable
• Use and non use valueUse and non use value• Economic income generated by environmental and Economic income generated by environmental and
cultural goodscultural goods• Who is to pay: willingness to pay and price fixationWho is to pay: willingness to pay and price fixation• Value associated to other goods and service with Value associated to other goods and service with
market valuemarket value– TourismTourism– Culture and education: historical valueCulture and education: historical value– Preservation of cultural and religious identity of Preservation of cultural and religious identity of
communities / societiescommunities / societies
8May07 RJ 41
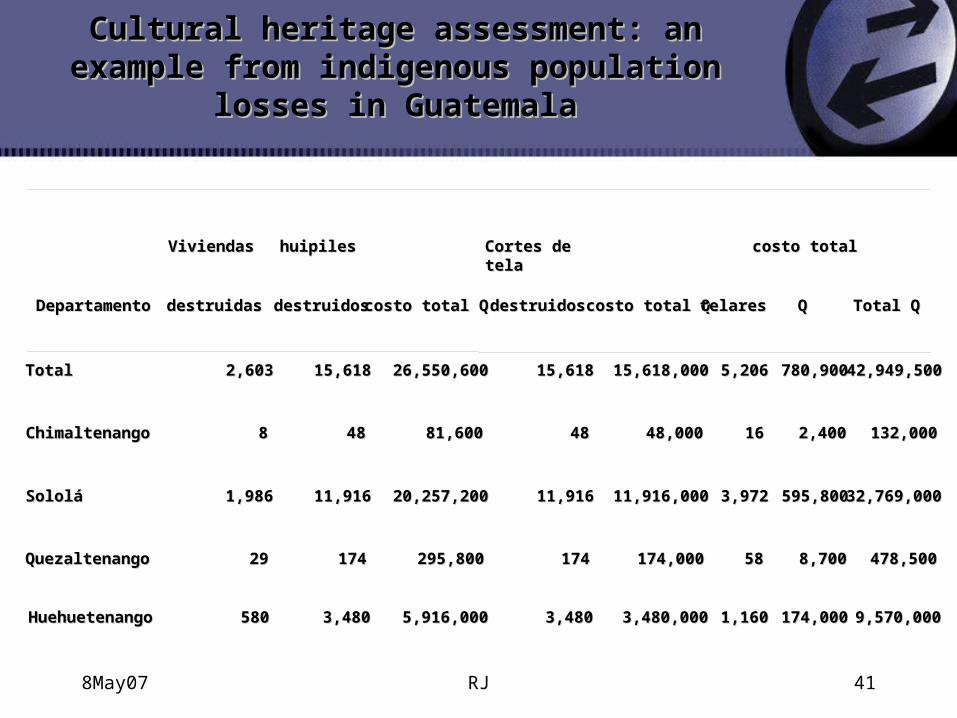
DepartamentoDepartamento
Viviendas Viviendas
destruidasdestruidas
huipiles huipiles
destruidosdestruidos costo total Qcosto total Q
Cortes de tela Cortes de tela
destruidosdestruidos costo total Qcosto total Q telarestelares
costo total costo total
QQ Total QTotal Q
TotalTotal 2,6032,603 15,61815,618 26,550,60026,550,600 15,61815,618 15,618,00015,618,000 5,2065,206 780,900780,900 42,949,50042,949,500
ChimaltenangoChimaltenango 88 4848 81,60081,600 4848 48,00048,000 1616 2,4002,400 132,000132,000
SololáSololá 1,9861,986 11,91611,916 20,257,20020,257,200 11,91611,916 11,916,00011,916,000 3,9723,972 595,800595,800 32,769,00032,769,000
QuezaltenangoQuezaltenango 2929 174174 295,800295,800 174174 174,000174,000 5858 8,7008,700 478,500478,500
HuehuetenangoHuehuetenango 580580 3,4803,480 5,916,0005,916,000 3,4803,480 3,480,0003,480,000 1,1601,160 174,000174,000 9,570,0009,570,000
Cultural heritage assessment: an example from Cultural heritage assessment: an example from indigenous population losses in Guatemalaindigenous population losses in Guatemala

Thank You.Thank You.