posten-jpm research
TRANSCRIPT
January 2000London
J.P. Morgan Securities Ltd.Nick Ward (44-20) 7325 1500 [email protected]ørn Andreassen (44-20) 7325 4898 [email protected]
This document is provided solely for the use of the Ministry of Industry, Employment and Communications (“the Ministry”) and Posten AB(“Posten”), and may not be reproduced or redistributed without the approval of J.P. Morgan’s compliance department other than (i) togovernmental departments or agencies with whom the Ministry customarily liaises in the course of its responsibilities for Posten; and (ii) toPosten itself, including subsidiaries and affiliated companies or organisations. In particular, neither this document nor any copy hereof maybe (i) taken or transmitted into the United States or redistributed in the United states or to any U.S. person; or (ii) distributed orcommunicated to the press or any wire service for transmission.
Valuation Report
Posten ABProductivity Has Been Delivered but the Cheque isStill in the Mail
• We estimate the equity value of Posten AB, excluding Postgirot, to be in the order of Skr15.2 billion (firm value Skr 16.7 billion).
• Posten is, together with Deutsche Post, the European postal operator that has improvedefficiency the most over the last five years, and Posten is today second only to TPG interms of productivity among the European postal operators.
• However, profitability is lagging. The combination of a liberalised market, universalservice obligation and a high operating leverage represents a formidable challenge forPosten’s management. Further restructuring is necessary in order to improve profitabilityand capture the full value potential.
• The bulk of Posten’s revenues, profit and value are dervived from the letter relatedoperations – Brev, Försäljning and Utrikes – that offer modest growth prospects in theircurrent form.
• We believe that Posten must take the lead – and assume the associated risks and capitalexpenditure requirements required – to develop the new information processingapplications that over time will become an important part of a postal operator.
• In order to develop a detailed understanding of the key value drivers in Posten’s businessportfolio, we recommend the use of economic value added (“EVA”) analysis. It mayalso be appropriate to consider the value impact of the strategic review recentlycompleted by Posten’s management.
European Equity Research:
Nick WardVice President(44-20) 7325 1500
European Advisory:
Torbjørn AndreassenAssociate(44-20) 7325 4898
J.P. Morgan Securities Ltd.Nick Ward (44-20) 7325 1500 [email protected]ørn Andreassen (44-20) 7325 4898 [email protected] 2
TABLE OF CONTENTS
Introduction ......................................................................................................................... 3Investment Thesis ................................................................................................................ 4
Positives........................................................................................................................... 4Risks................................................................................................................................ 5
Overview of the Swedish Postal market ................................................................................ 6Overview of Posten .............................................................................................................. 8Posten’s Relative Operating Performance ........................................................................... 10Valuation ........................................................................................................................... 13
Valuation Methodology.................................................................................................. 13Valuation Issues ............................................................................................................. 13Valuation Summary........................................................................................................ 14Divisional Valuation: Posten Brev .................................................................................. 15Divisional Valuation: Posten Utrikes .............................................................................. 18Divisional Valuation: Posten Försäljning ........................................................................ 21Divisional Valuation: Posten Logistik............................................................................. 25Divisional Valuation: PostNet......................................................................................... 28Divisional Valuation: Postfastigheter .............................................................................. 29Divisional Valuation: Overhead and Headquarter............................................................ 30
Trends in European Postal Services .................................................................................... 31Appendix ........................................................................................................................... 33
Divisional Weighted Average Cost of Capital Calculation............................................... 33Divisional Discounted Cash Flow Analysis..................................................................... 34Regression Analysis for PostNet ..................................................................................... 36Trading Multiples........................................................................................................... 37Logistics and Express Transaction Multiples................................................................... 39
3
Posten ABJanuary 2000London
INTRODUCTION
This report sets out J.P. Morgan’s preliminary views on the intrinsic value of Posten AB,excluding Postgirot.
For our analysis, we have relied on the following information sources:
• publicly available information, including annual reports;
• divisional forecasts outlining revenue and operating performance until 2002, as suppliedby Posten’s management; and
• interviews with the managers of the principal business areas.
This report was prepared at the same time as Posten’s senior management team conducted acomprehensive strategic review of Posten’s business. In this context, we want to note that thereport does not consider the value impact of any initiatives that may be implemented as aresult of the strategic review. In addition, the report contains only a brief appraisal ofPosten’s investment thesis (positives/risks) since we felt that it was not meaningful to dodetailed work in this area at a time when Posten’s strategy was subject to an internal review.
J.P. Morgan Securities Ltd.Nick Ward (44-20) 7325 1500 [email protected]ørn Andreassen (44-20) 7325 4898 [email protected] 4
INVESTMENT THESIS
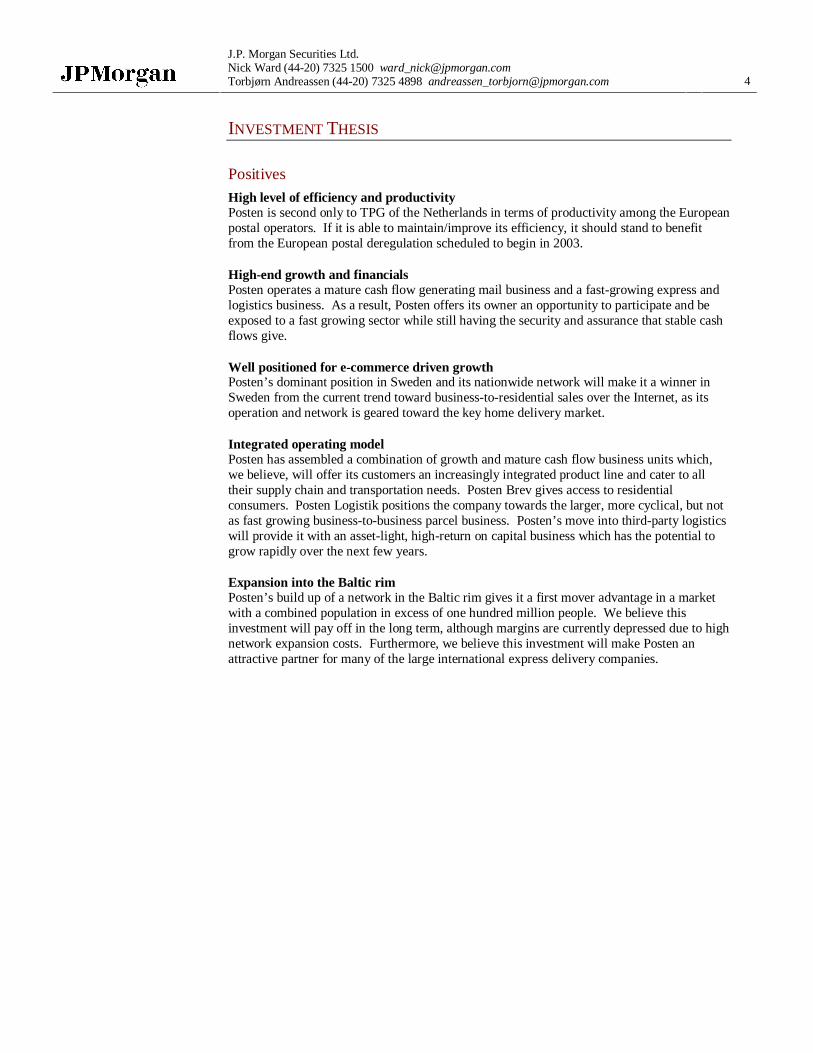
Positives
High level of efficiency and productivityPosten is second only to TPG of the Netherlands in terms of productivity among the Europeanpostal operators. If it is able to maintain/improve its efficiency, it should stand to benefitfrom the European postal deregulation scheduled to begin in 2003.
High-end growth and financialsPosten operates a mature cash flow generating mail business and a fast-growing express andlogistics business. As a result, Posten offers its owner an opportunity to participate and beexposed to a fast growing sector while still having the security and assurance that stable cashflows give.
Well positioned for e-commerce driven growthPosten’s dominant position in Sweden and its nationwide network will make it a winner inSweden from the current trend toward business-to-residential sales over the Internet, as itsoperation and network is geared toward the key home delivery market.
Integrated operating modelPosten has assembled a combination of growth and mature cash flow business units which,we believe, will offer its customers an increasingly integrated product line and cater to alltheir supply chain and transportation needs. Posten Brev gives access to residentialconsumers. Posten Logistik positions the company towards the larger, more cyclical, but notas fast growing business-to-business parcel business. Posten’s move into third-party logisticswill provide it with an asset-light, high-return on capital business which has the potential togrow rapidly over the next few years.
Expansion into the Baltic rimPosten’s build up of a network in the Baltic rim gives it a first mover advantage in a marketwith a combined population in excess of one hundred million people. We believe thisinvestment will pay off in the long term, although margins are currently depressed due to highnetwork expansion costs. Furthermore, we believe this investment will make Posten anattractive partner for many of the large international express delivery companies.
5
Posten ABJanuary 2000London
Risks
Volume growthIn predominantly fixed cost based operations, volume growth is key to profitability as highercapacity utilization translates into lower unit costs. Posten is today one of the very fewEuropean postal operators to experience an overall decline in mail volumes. If, as Postenexpects, this trend continues the only way for Posten to maintain its current profit levels willbe through continued aggressive cost cutting.
Substitution out of traditional mailElectronic mail and Internet based information processing services are real risks for postaloperators, as on-line transmission should eventually capture an important piece of the existingbusiness. Sweden already has one of the highest Internet penetrations in the world and islikely to be one of the first countries to feel the full brunt of this substitution. We believe thatadministrative mail volumes will be the first to be affected by this trend. Today, this segmentaccounts for 60% of Posten Brev’s revenue stream. In order not to lose this volume, Postenmust lead the development of information processing applications and continue to present itscustomers with new value added services – this will, however, require new technology andcapital expenditure.
SizePosten is a relatively small postal operator when viewed in a European context. Its homemarket may not be large enough to generate sufficient cash flows for future expansion andgrowth. Within mail and express delivery, size matters, as they are capital intensive, highfixed cost business. Over the past few years, the drive of many players to achieve economiesof scale has produced a wave of consolidation in the mass delivery market. Posten’s creationof Pan Nordic Logistics, together with the postal operators of Denmark and Norway (Finlandrecently dropped out of the co-operation), is an attempt to gain economies of scale (and acompetitive edge) by pooling all the international parcel operations into one unit.
Increased competitionPosten operates in the only completely liberalized postal market in Europe. Up to now,Posten has been able to maintain a high market share, but competition is intensifying andthere are over 80 different postal operators currently working in Sweden. Royal Mail’sacquisition of a stake in CityMail and Deutsche Post’s acquisition of ASG, both in 1999, havefor the first time brought deep pocketed European postal operators into direct competitionwith Posten in its home market. We believe the increased competition will, inevitably, lead toPosten losing market share and revenue, and due to its high operating leverage, this will havea direct impact on its operating performance.
Aging workforceThe age structure of Posten’s workforce constitutes an ever increasing challenge, as theaverage age of the majority of Posten’s employees, predominantly those employed withinPosten Brev, grows by one year every year.
J.P. Morgan Securities Ltd.Nick Ward (44-20) 7325 1500 [email protected]ørn Andreassen (44-20) 7325 4898 [email protected] 6
OVERVIEW OF THE SWEDISH POSTAL MARKET
Historically, the traditional postal industry has been structurally stable, with slow utility likegrowth. In nearly all of the world’s postal market there is one company, usually state-owned,that operates under some form of legal monopoly. However, the global postal market hasbeen undergoing substantial change for a number of years. National postal markets aregradually being deregulated in Europe as well as in other countries such as New Zealand,Australia and Argentina. With the total abolition of the former postal monopoly in one singlestep in 1993, Sweden is the European country that has progressed the furthest in terms ofderegulation. Sweden is today, still the only country in Europe that has implemented totalliberalization of its postal market.
Deregulation is driven by factors such as new technology, an increasingly global businessenvironment and tight state finances as well as increased customer demand for cost-effective,reliable services. The ongoing deregulation of the postal market has been compared by manyto the deregulation of the telecommunications market, which over the last ten years has led todramatic changes across national borders in terms of prices, services offered, efficiency andmarket players.
We believe the European postal industry will consolidate through three stages, similar to thatof the telecommunications market:
1. the emergence of small niche operators seeking to exploit high margin business areas;
2. mergers of established operators pursuing cost synergies; and
3. the emergence of aggressive international operators seeking to enhance earnings growthby transferring industry expertise into less mature markets
Posten is currently the only nationwide postal operator in Sweden, but it is today facingcompetition from over eighty small postal firms. Although Posten has only lostapproximately 3% of its overall market share, it is reported to have lost up to 20%-25% of thebusiness-to-business volume in the larger cities. Posten’s largest domestic competitor is thepublicly listed CityMail, which has been able to attract strategic and experienced investorssuch as Royal Mail. CityMail is one of the very few competitors to operate in more than onelocal area, currently offering services in Stockholm, Göteborg and Malmö, reachingapproximately 30% of the Swedish population.
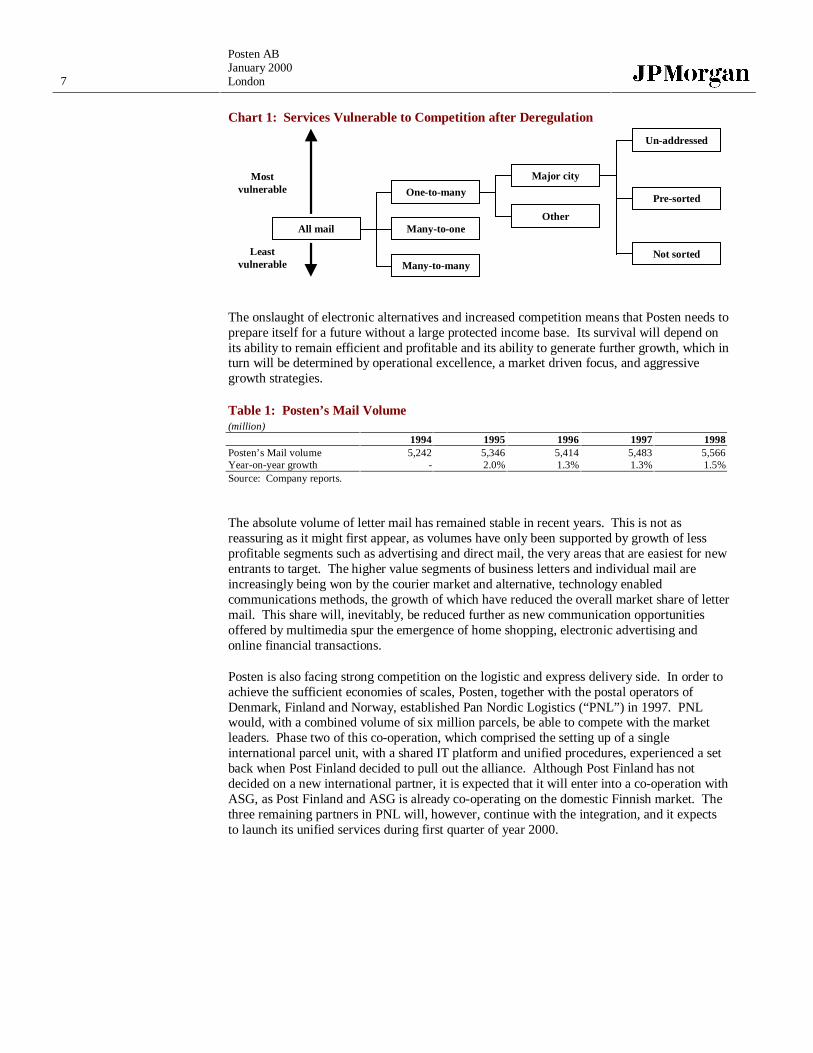
Areas most vulnerable to “cherry picking” by new entrants, are those that are easiest tooperate, i.e. the one-to-many segments, such as unaddressed mailshots from a singlecustomer. The more complex the collection and delivery requirements, the less vulnerablethe segment will be to competition. Some segments, such as hand-written addressed mail,may never prove economically attractive to private competitors, thus providing a “naturalmonopoly” to an efficient postal operator.
7
Posten ABJanuary 2000London
Chart 1: Services Vulnerable to Competition after Deregulation
All mail
Many-to-many
Many-to-one
One-to-many
Other
Major city
Un-addressed
Pre-sorted
Not sorted
Mostvulnerable
Leastvulnerable
The onslaught of electronic alternatives and increased competition means that Posten needs toprepare itself for a future without a large protected income base. Its survival will depend onits ability to remain efficient and profitable and its ability to generate further growth, which inturn will be determined by operational excellence, a market driven focus, and aggressivegrowth strategies.
Table 1: Posten’s Mail Volume(million)
1994 1995 1996 1997 1998Posten’s Mail volume 5,242 5,346 5,414 5,483 5,566Year-on-year growth - 2.0% 1.3% 1.3% 1.5%Source: Company reports.
The absolute volume of letter mail has remained stable in recent years. This is not asreassuring as it might first appear, as volumes have only been supported by growth of lessprofitable segments such as advertising and direct mail, the very areas that are easiest for newentrants to target. The higher value segments of business letters and individual mail areincreasingly being won by the courier market and alternative, technology enabledcommunications methods, the growth of which have reduced the overall market share of lettermail. This share will, inevitably, be reduced further as new communication opportunitiesoffered by multimedia spur the emergence of home shopping, electronic advertising andonline financial transactions.
Posten is also facing strong competition on the logistic and express delivery side. In order toachieve the sufficient economies of scales, Posten, together with the postal operators ofDenmark, Finland and Norway, established Pan Nordic Logistics (“PNL”) in 1997. PNLwould, with a combined volume of six million parcels, be able to compete with the marketleaders. Phase two of this co-operation, which comprised the setting up of a singleinternational parcel unit, with a shared IT platform and unified procedures, experienced a setback when Post Finland decided to pull out the alliance. Although Post Finland has notdecided on a new international partner, it is expected that it will enter into a co-operation withASG, as Post Finland and ASG is already co-operating on the domestic Finnish market. Thethree remaining partners in PNL will, however, continue with the integration, and it expectsto launch its unified services during first quarter of year 2000.
J.P. Morgan Securities Ltd.Nick Ward (44-20) 7325 1500 [email protected]ørn Andreassen (44-20) 7325 4898 [email protected] 8
OVERVIEW OF POSTEN
Sweden Post was incorporated in 1994, and is wholly owned by the Swedish State. Thecompany operates according to commercial guidelines, and is required to achieve certainfinancial targets set by its owner.
Historically, postal operators have been organized along functional lines with differentdepartments for operations, finance and marketing. Posten has, however, gone through thetransformation to create a market driven organization focused on products and customers. In1997, Posten was divided into nine customer segments and six business areas that provide theproducts and support the customer sectors.
Chart 2: Overview of Posten’s Business Areas
Managementteam
PostenBrev
PostenUtrikes
PostenFörsäljning
PostenLogistik
PostNet Other
Finance
Humanresources
Strategy andorganisation
Source: Company reports.
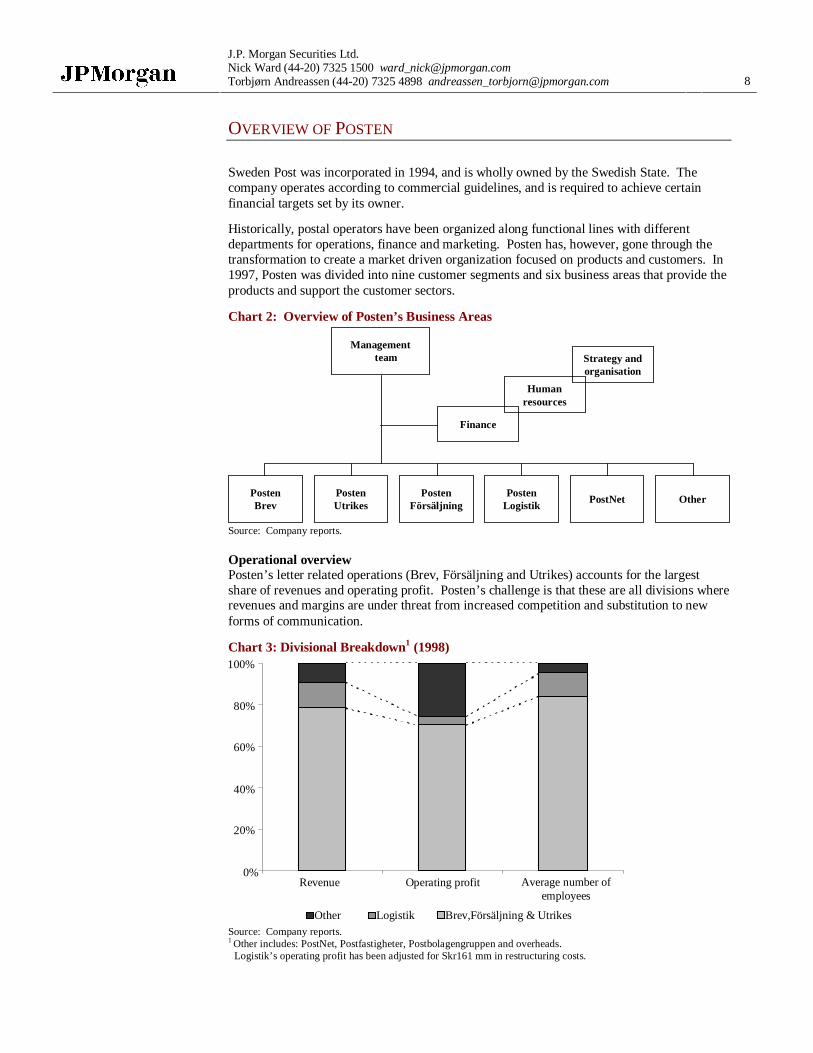
Operational overviewPosten’s letter related operations (Brev, Försäljning and Utrikes) accounts for the largestshare of revenues and operating profit. Posten’s challenge is that these are all divisions whererevenues and margins are under threat from increased competition and substitution to newforms of communication.
Chart 3: Divisional Breakdown1 (1998)
0%
20%
40%
60%
80%
100%
Revenue Operating profit Average number ofemployees
Other Logistik Brev,Försäljning & UtrikesSource: Company reports.1 Other includes: PostNet, Postfastigheter, Postbolagengruppen and overheads.
Logistik’s operating profit has been adjusted for Skr161 mm in restructuring costs.
9
Posten ABJanuary 2000London
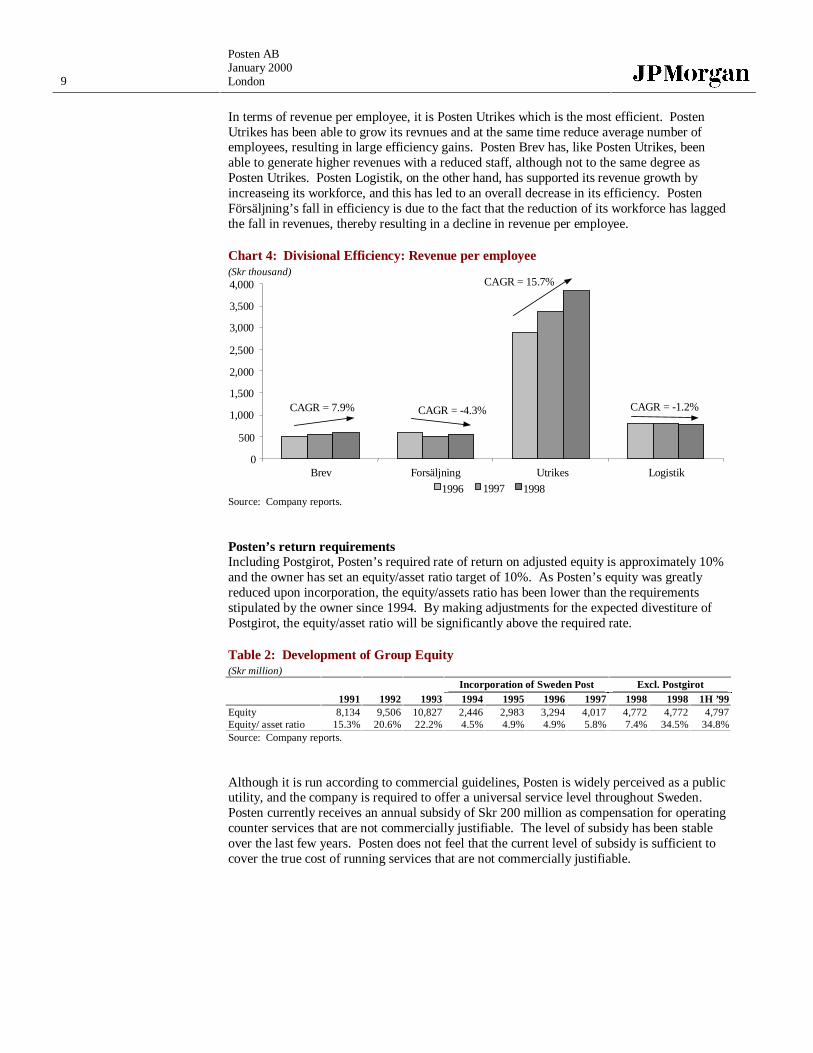
In terms of revenue per employee, it is Posten Utrikes which is the most efficient. PostenUtrikes has been able to grow its revnues and at the same time reduce average number ofemployees, resulting in large efficiency gains. Posten Brev has, like Posten Utrikes, beenable to generate higher revenues with a reduced staff, although not to the same degree asPosten Utrikes. Posten Logistik, on the other hand, has supported its revenue growth byincreaseing its workforce, and this has led to an overall decrease in its efficiency. PostenFörsäljning’s fall in efficiency is due to the fact that the reduction of its workforce has laggedthe fall in revenues, thereby resulting in a decline in revenue per employee.
Chart 4: Divisional Efficiency: Revenue per employee(Skr thousand)
0
500
1,000
1,500
2,000
2,500
3,000
3,500
4,000
Brev Forsäljning Utrikes Logistik
1996 1997 1998
CAGR = 15.7%
CAGR = -4.3%CAGR = 7.9% CAGR = -1.2%
Source: Company reports.
Posten’s return requirementsIncluding Postgirot, Posten’s required rate of return on adjusted equity is approximately 10%and the owner has set an equity/asset ratio target of 10%. As Posten’s equity was greatlyreduced upon incorporation, the equity/assets ratio has been lower than the requirementsstipulated by the owner since 1994. By making adjustments for the expected divestiture ofPostgirot, the equity/asset ratio will be significantly above the required rate.
Table 2: Development of Group Equity(Skr million)
Incorporation of Sweden Post Excl. Postgirot1991 1992 1993 1994 1995 1996 1997 1998 1998 1H ’99
Equity 8,134 9,506 10,827 2,446 2,983 3,294 4,017 4,772 4,772 4,797Equity/ asset ratio 15.3% 20.6% 22.2% 4.5% 4.9% 4.9% 5.8% 7.4% 34.5% 34.8%Source: Company reports.
Although it is run according to commercial guidelines, Posten is widely perceived as a publicutility, and the company is required to offer a universal service level throughout Sweden.Posten currently receives an annual subsidy of Skr 200 million as compensation for operatingcounter services that are not commercially justifiable. The level of subsidy has been stableover the last few years. Posten does not feel that the current level of subsidy is sufficient tocover the true cost of running services that are not commercially justifiable.
J.P. Morgan Securities Ltd.Nick Ward (44-20) 7325 1500 [email protected]ørn Andreassen (44-20) 7325 4898 [email protected] 10
POSTEN’S RELATIVE OPERATING PERFORMANCE
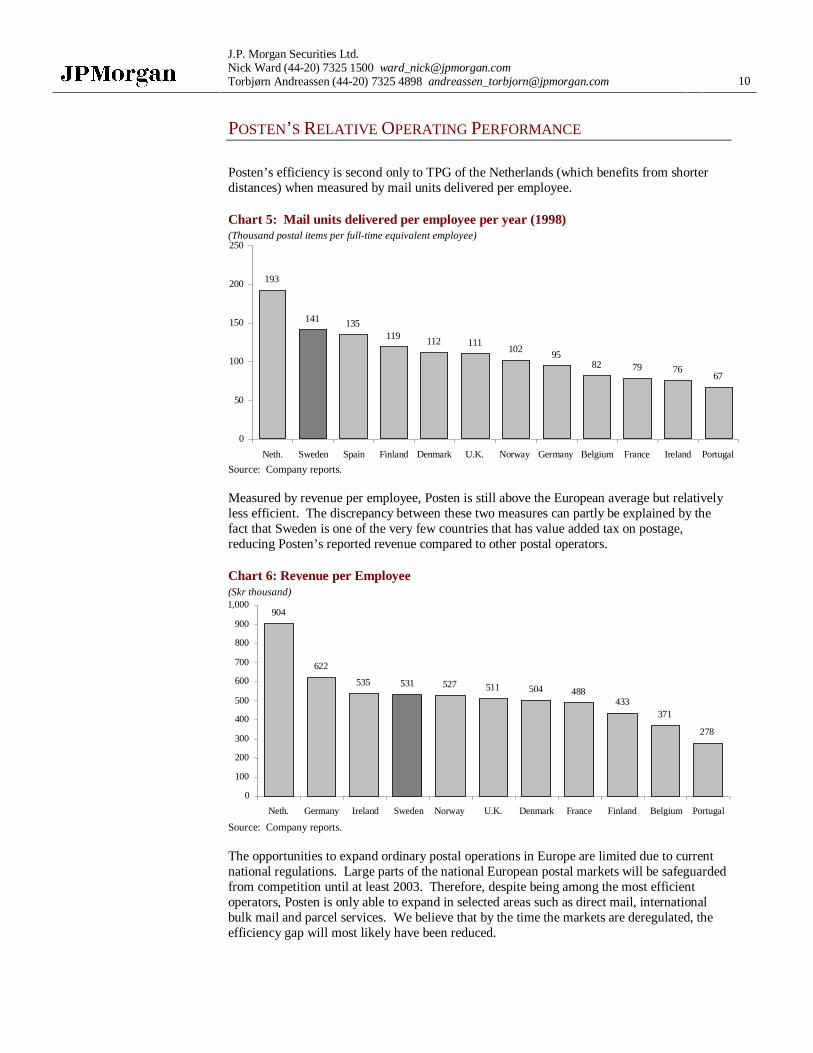
Posten’s efficiency is second only to TPG of the Netherlands (which benefits from shorterdistances) when measured by mail units delivered per employee.
Chart 5: Mail units delivered per employee per year (1998)(Thousand postal items per full-time equivalent employee)
193
141 135119 112 111
10295
82 79 7667
0
50
100
150
200
250
Neth. Sweden Spain Finland Denmark U.K. Norway Germany Belgium France Ireland Portugal
Source: Company reports.
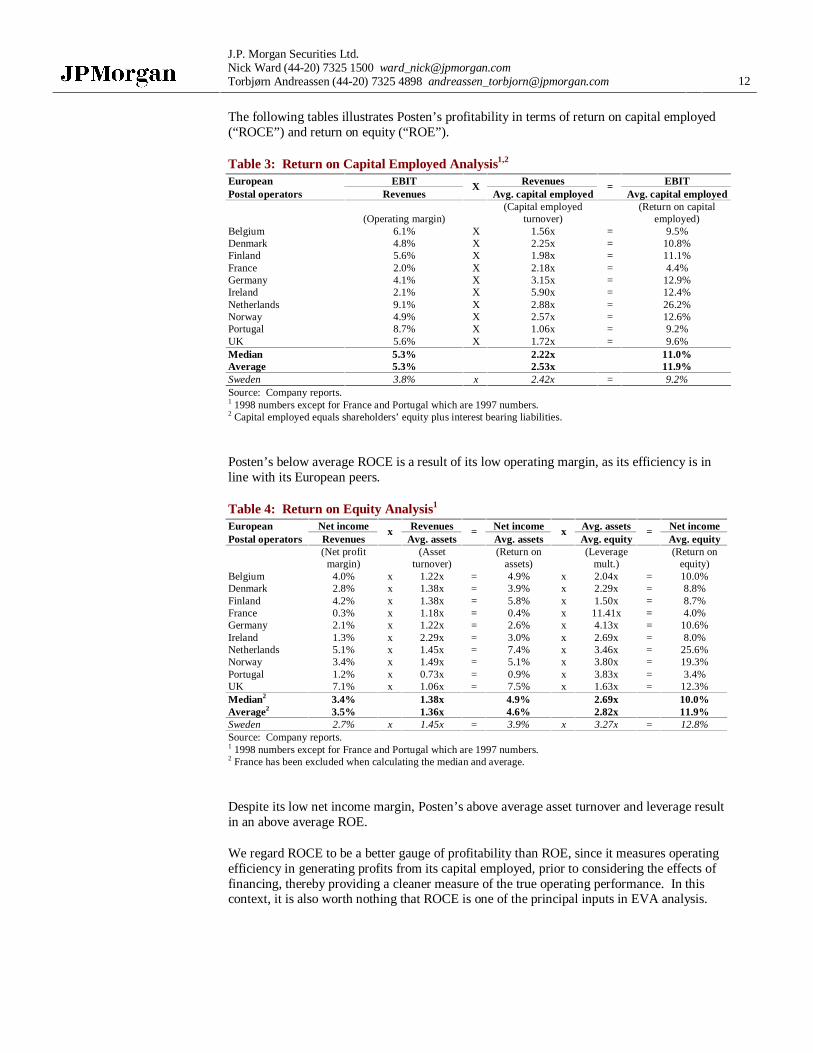
Measured by revenue per employee, Posten is still above the European average but relativelyless efficient. The discrepancy between these two measures can partly be explained by thefact that Sweden is one of the very few countries that has value added tax on postage,reducing Posten’s reported revenue compared to other postal operators.
Chart 6: Revenue per Employee(Skr thousand)
904
622
535 531 527 511 504 488433
371
278
0
100
200
300
400
500
600
700
800
900
1,000
Neth. Germany Ireland Sweden Norway U.K. Denmark France Finland Belgium Portugal
Source: Company reports.
The opportunities to expand ordinary postal operations in Europe are limited due to currentnational regulations. Large parts of the national European postal markets will be safeguardedfrom competition until at least 2003. Therefore, despite being among the most efficientoperators, Posten is only able to expand in selected areas such as direct mail, internationalbulk mail and parcel services. We believe that by the time the markets are deregulated, theefficiency gap will most likely have been reduced.

11
Posten ABJanuary 2000London
Despite its high level of efficiency, Posten’s margins have historically been below theEuropean average on both EBITDA and net income level.
Chart 7: EBITDA Margin1
14.2%
11.9% 11.9%10.8%
9.8% 9.3% 9.2%8.5% 8.3%
5.9%5.1%
0%
2%
4%
6%
8%
10%
12%
14%
16%
Portugal Neth. Denmark Finland Belgium Germany U.K. Norway Sweden Ireland France
Source: Company reports.1 1998 numbers except for France and Portugal which are 1997 numbers.
Chart 8: Net Income Margin1
7.1%
5.1%
4.2% 4.0%3.4%
2.8% 2.7%2.1%
1.3% 1.1%
0.3%0%
1%
2%
3%
4%
5%
6%
7%
8%
U.K. Neth. Finland Belgium Norway Denmark Sweden Germany Ireland Portugal France
Source: Company reports.1 1998 numbers except for France and Portugal which are 1997 numbers.
We believe that Posten’s low profitability reflects its operating environment. It is relativemore expensive to offer a universal service level in a large and disperse country, such asSweden, than in a smaller and more concentrated country. Furthermore, Posten’s highoperating leverage, coupled with the fact that it is operating in a liberalized market makes itvulnerable to “cherry picking” by new entrants, as the new entrants are not required to offer auniversal service level. Posten’s high operating leverage makes it vulnerable to marginalerosion of revenues.
J.P. Morgan Securities Ltd.Nick Ward (44-20) 7325 1500 [email protected]ørn Andreassen (44-20) 7325 4898 [email protected] 12
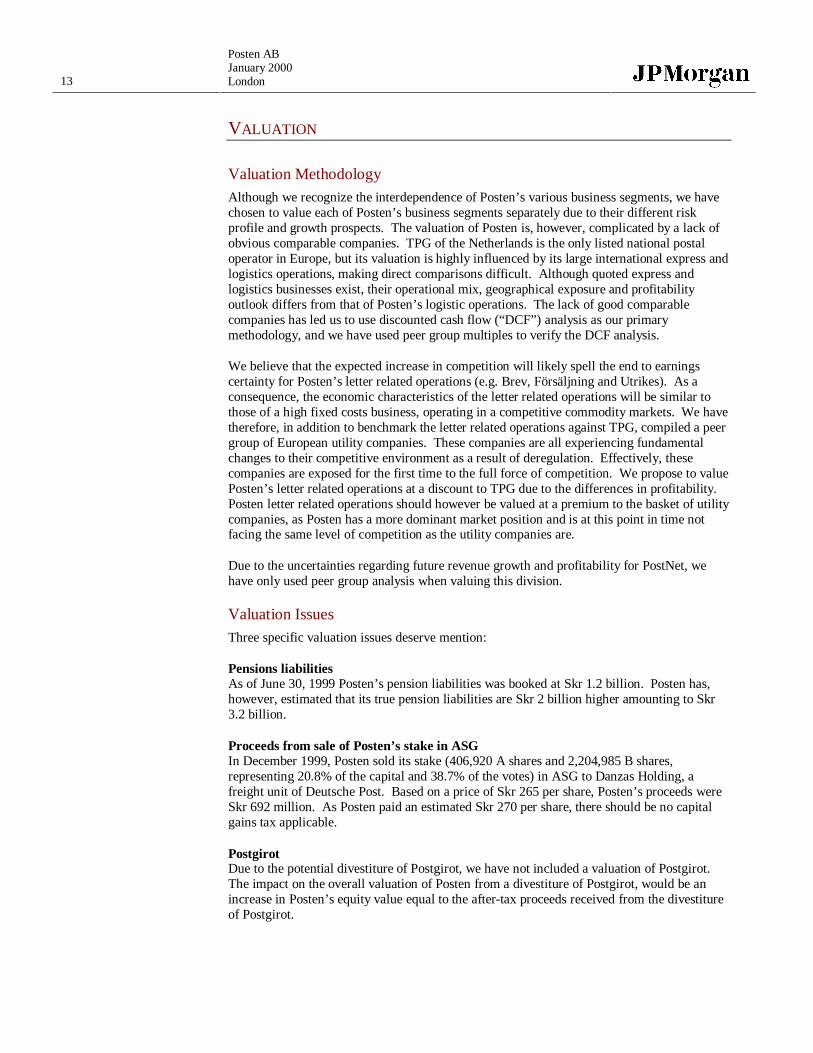
The following tables illustrates Posten’s profitability in terms of return on capital employed(“ROCE”) and return on equity (“ROE”).
Table 3: Return on Capital Employed Analysis1,2
European EBIT Revenues EBITPostal operators Revenues
XAvg. capital employed
=Avg. capital employed
(Operating margin)(Capital employed
turnover)(Return on capital
employed)Belgium 6.1% X 1.56x = 9.5%Denmark 4.8% X 2.25x = 10.8%Finland 5.6% X 1.98x = 11.1%France 2.0% X 2.18x = 4.4%Germany 4.1% X 3.15x = 12.9%Ireland 2.1% X 5.90x = 12.4%Netherlands 9.1% X 2.88x = 26.2%Norway 4.9% X 2.57x = 12.6%Portugal 8.7% X 1.06x = 9.2%UK 5.6% X 1.72x = 9.6%Median 5.3% 2.22x 11.0%Average 5.3% 2.53x 11.9%Sweden 3.8% x 2.42x = 9.2%Source: Company reports.1 1998 numbers except for France and Portugal which are 1997 numbers.2 Capital employed equals shareholders’ equity plus interest bearing liabilities.
Posten’s below average ROCE is a result of its low operating margin, as its efficiency is inline with its European peers.
Table 4: Return on Equity Analysis1
European Net income Revenues Net income Avg. assets Net incomePostal operators Revenues
xAvg. assets
=Avg. assets
xAvg. equity
=Avg. equity
(Net profitmargin)
(Assetturnover)
(Return onassets)
(Leveragemult.)
(Return onequity)
Belgium 4.0% x 1.22x = 4.9% x 2.04x = 10.0%Denmark 2.8% x 1.38x = 3.9% x 2.29x = 8.8%Finland 4.2% x 1.38x = 5.8% x 1.50x = 8.7%France 0.3% x 1.18x = 0.4% x 11.41x = 4.0%Germany 2.1% x 1.22x = 2.6% x 4.13x = 10.6%Ireland 1.3% x 2.29x = 3.0% x 2.69x = 8.0%Netherlands 5.1% x 1.45x = 7.4% x 3.46x = 25.6%Norway 3.4% x 1.49x = 5.1% x 3.80x = 19.3%Portugal 1.2% x 0.73x = 0.9% x 3.83x = 3.4%UK 7.1% x 1.06x = 7.5% x 1.63x = 12.3%Median2 3.4% 1.38x 4.9% 2.69x 10.0%Average2 3.5% 1.36x 4.6% 2.82x 11.9%Sweden 2.7% x 1.45x = 3.9% x 3.27x = 12.8%Source: Company reports.1 1998 numbers except for France and Portugal which are 1997 numbers.2 France has been excluded when calculating the median and average.
Despite its low net income margin, Posten’s above average asset turnover and leverage resultin an above average ROE.
We regard ROCE to be a better gauge of profitability than ROE, since it measures operatingefficiency in generating profits from its capital employed, prior to considering the effects offinancing, thereby providing a cleaner measure of the true operating performance. In thiscontext, it is also worth nothing that ROCE is one of the principal inputs in EVA analysis.
13
Posten ABJanuary 2000London
VALUATION
Valuation Methodology
Although we recognize the interdependence of Posten’s various business segments, we havechosen to value each of Posten’s business segments separately due to their different riskprofile and growth prospects. The valuation of Posten is, however, complicated by a lack ofobvious comparable companies. TPG of the Netherlands is the only listed national postaloperator in Europe, but its valuation is highly influenced by its large international express andlogistics operations, making direct comparisons difficult. Although quoted express andlogistics businesses exist, their operational mix, geographical exposure and profitabilityoutlook differs from that of Posten’s logistic operations. The lack of good comparablecompanies has led us to use discounted cash flow (“DCF”) analysis as our primarymethodology, and we have used peer group multiples to verify the DCF analysis.
We believe that the expected increase in competition will likely spell the end to earningscertainty for Posten’s letter related operations (e.g. Brev, Försäljning and Utrikes). As aconsequence, the economic characteristics of the letter related operations will be similar tothose of a high fixed costs business, operating in a competitive commodity markets. We havetherefore, in addition to benchmark the letter related operations against TPG, compiled a peergroup of European utility companies. These companies are all experiencing fundamentalchanges to their competitive environment as a result of deregulation. Effectively, thesecompanies are exposed for the first time to the full force of competition. We propose to valuePosten’s letter related operations at a discount to TPG due to the differences in profitability.Posten letter related operations should however be valued at a premium to the basket of utilitycompanies, as Posten has a more dominant market position and is at this point in time notfacing the same level of competition as the utility companies are.
Due to the uncertainties regarding future revenue growth and profitability for PostNet, wehave only used peer group analysis when valuing this division.
Valuation Issues
Three specific valuation issues deserve mention:
Pensions liabilitiesAs of June 30, 1999 Posten’s pension liabilities was booked at Skr 1.2 billion. Posten has,however, estimated that its true pension liabilities are Skr 2 billion higher amounting to Skr3.2 billion.
Proceeds from sale of Posten’s stake in ASGIn December 1999, Posten sold its stake (406,920 A shares and 2,204,985 B shares,representing 20.8% of the capital and 38.7% of the votes) in ASG to Danzas Holding, afreight unit of Deutsche Post. Based on a price of Skr 265 per share, Posten’s proceeds wereSkr 692 million. As Posten paid an estimated Skr 270 per share, there should be no capitalgains tax applicable.
PostgirotDue to the potential divestiture of Postgirot, we have not included a valuation of Postgirot.The impact on the overall valuation of Posten from a divestiture of Postgirot, would be anincrease in Posten’s equity value equal to the after-tax proceeds received from the divestitureof Postgirot.
J.P. Morgan Securities Ltd.Nick Ward (44-20) 7325 1500 [email protected]ørn Andreassen (44-20) 7325 4898 [email protected] 14
Valuation Summary
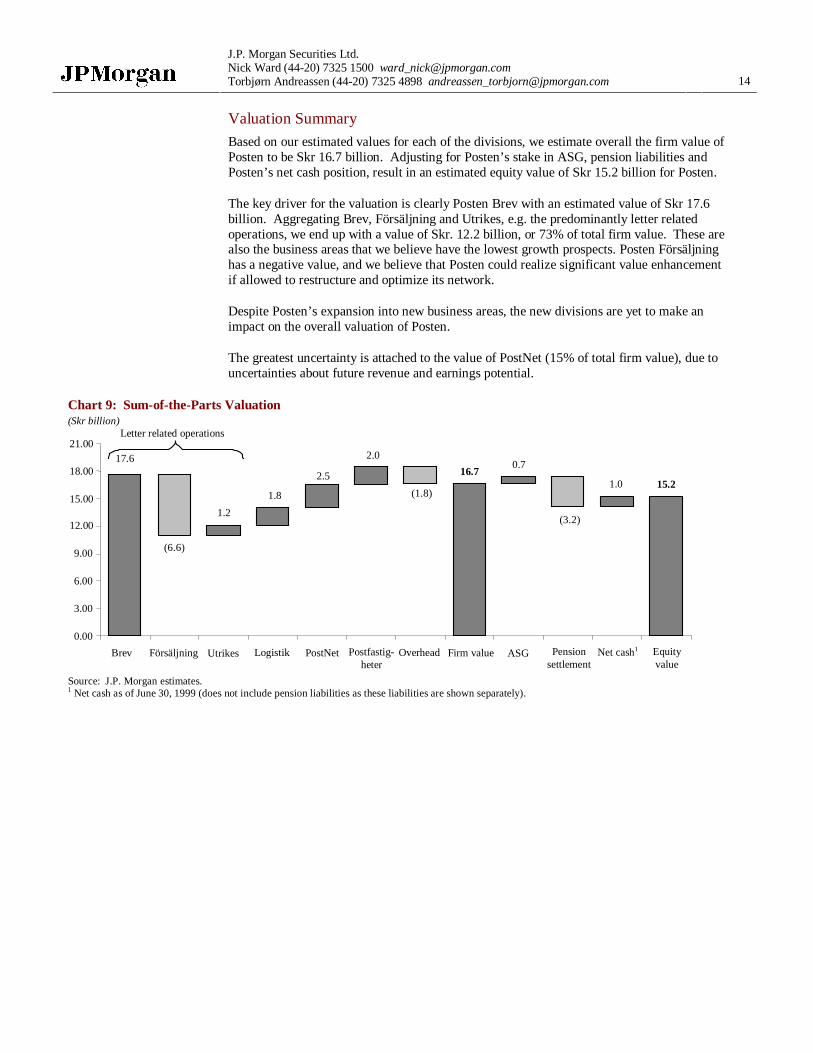
Based on our estimated values for each of the divisions, we estimate overall the firm value ofPosten to be Skr 16.7 billion. Adjusting for Posten’s stake in ASG, pension liabilities andPosten’s net cash position, result in an estimated equity value of Skr 15.2 billion for Posten.
The key driver for the valuation is clearly Posten Brev with an estimated value of Skr 17.6billion. Aggregating Brev, Försäljning and Utrikes, e.g. the predominantly letter relatedoperations, we end up with a value of Skr. 12.2 billion, or 73% of total firm value. These arealso the business areas that we believe have the lowest growth prospects. Posten Försäljninghas a negative value, and we believe that Posten could realize significant value enhancementif allowed to restructure and optimize its network.
Despite Posten’s expansion into new business areas, the new divisions are yet to make animpact on the overall valuation of Posten.
The greatest uncertainty is attached to the value of PostNet (15% of total firm value), due touncertainties about future revenue and earnings potential.
Chart 9: Sum-of-the-Parts Valuation(Skr billion)
15.216.7
17.6
(3.2)
0.72.0
2.5
1.8
1.2
1.0(1.8)
(6.6)
0.00
3.00
6.00
9.00
12.00
15.00
18.00
21.00
Brev Försäljning Utrikes Logistik PostNet Postfastig-heter
Overhead Firm value ASG Net cash1
Letter related operations
Equityvalue
Pensionsettlement
Source: J.P. Morgan estimates.1 Net cash as of June 30, 1999 (does not include pension liabilities as these liabilities are shown separately).
15
Posten ABJanuary 2000London
Divisional Valuation: Posten Brev
Posten Brev accounts for 53% of group gross revenues and an estimated 82% of the group’sEBITDA. Posten Brev is one of the most efficient postal operators in Europe, second only toTPG. Unfortunately, opportunities to export this competitive advantage to other Europeancountries are limited.
Operational overviewPosten Brev acts as an intermediary for individual and mass-produced messages, newspapersand publications throughout the country. Posten Brev offers its services through traditionalletters, hybrid mail or a combination of both. The business unit also processes lighter goods,weighting up to 2 kg, within Sweden.
In the long-term, volumes in the letter mail market are expected to decline. The UniversalPostal Union (“UPU”) foresees 2.5% volume growth per year in the letter mail market until2005 in Western Europe and the US. However, Posten’s volume has declined one percentover the last year, and this is a trend Posten expects to continue. Sweden is one of the veryfew countries in the western world to experiencing declining volumes. As Sweden has one ofthe highest Internet/e-mail penetration in the world, the substitution out of traditional mail hasprogressed further in Sweden than in other countries. Generally, Sweden’s population andcorporations have been more willing to embrace new technologies as means ofcommunications (e.g. mobile telephony) than other countries.
Posten Brev estimates that administrative mail (bank statements, cargo documents, billingdocuments, etc) accounts for 60% of its total revenue stream. We believe that electronic datacommunication poses a serious threat to this segment, and Posten Brev is alreadyexperiencing a decline in the overall volume due to the decline within this segment. Personalmail is estimated to account for 6%, and Posten Brev does not see any major changes withinthis segment. The balance is made up by direct marketing material, a segment expected togrow rapidly, helping to offset the decline in volume within the administrative mail segment.
To protect yields, Posten Brev continues to develop value-added services such as hybrid mail,database marketing, in house document handling, printing and envelope services. Thesehigher value added services are likely to compensate for margin pressure from increasedcompetition, and will also allow Posten Brev to share in the substitution to other forms ofcommunication.
Posten Brev continues to restructure its operations, and the drive to improve efficiencyremains vital to maintaining profitability. In the near-term, Posten Brev is making changes toits 13 sorting centers by closing one and increasing the capacity of another one. Posten Brevis likely to announce further plans to redesign its business process, and close more sortingcenters in the future as volume continues to decline.
Cost structureApproximately 70% of Posten Brev’s costs are fixed. Due to its high operating leverage,Posten Brev is vulnerable to marginal erosion of revenues, as a fall in revenues will have adirect impact on the divisions operating performance.
J.P. Morgan Securities Ltd.Nick Ward (44-20) 7325 1500 [email protected]ørn Andreassen (44-20) 7325 4898 [email protected] 16
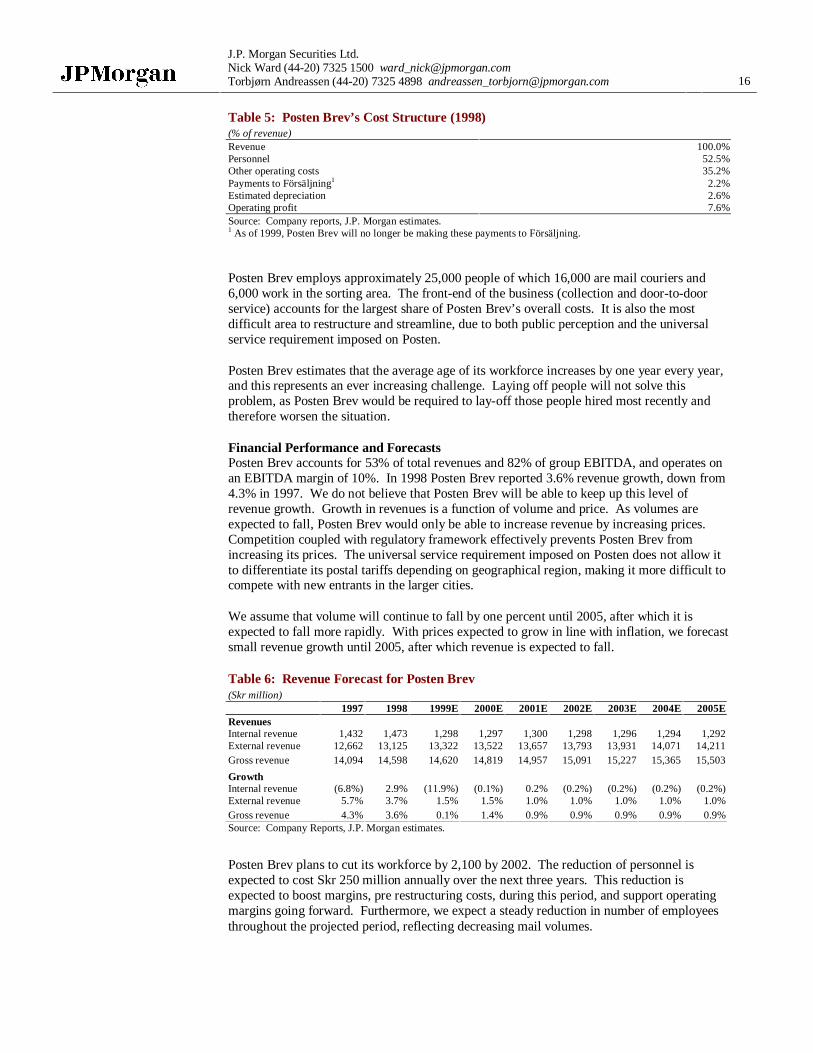
Table 5: Posten Brev’s Cost Structure (1998)(% of revenue)Revenue 100.0%Personnel 52.5%Other operating costs 35.2%Payments to Försäljning1 2.2%Estimated depreciation 2.6%Operating profit 7.6%Source: Company reports, J.P. Morgan estimates.1 As of 1999, Posten Brev will no longer be making these payments to Försäljning.
Posten Brev employs approximately 25,000 people of which 16,000 are mail couriers and6,000 work in the sorting area. The front-end of the business (collection and door-to-doorservice) accounts for the largest share of Posten Brev’s overall costs. It is also the mostdifficult area to restructure and streamline, due to both public perception and the universalservice requirement imposed on Posten.
Posten Brev estimates that the average age of its workforce increases by one year every year,and this represents an ever increasing challenge. Laying off people will not solve thisproblem, as Posten Brev would be required to lay-off those people hired most recently andtherefore worsen the situation.
Financial Performance and ForecastsPosten Brev accounts for 53% of total revenues and 82% of group EBITDA, and operates onan EBITDA margin of 10%. In 1998 Posten Brev reported 3.6% revenue growth, down from4.3% in 1997. We do not believe that Posten Brev will be able to keep up this level ofrevenue growth. Growth in revenues is a function of volume and price. As volumes areexpected to fall, Posten Brev would only be able to increase revenue by increasing prices.Competition coupled with regulatory framework effectively prevents Posten Brev fromincreasing its prices. The universal service requirement imposed on Posten does not allow itto differentiate its postal tariffs depending on geographical region, making it more difficult tocompete with new entrants in the larger cities.
We assume that volume will continue to fall by one percent until 2005, after which it isexpected to fall more rapidly. With prices expected to grow in line with inflation, we forecastsmall revenue growth until 2005, after which revenue is expected to fall.
Table 6: Revenue Forecast for Posten Brev(Skr million)
1997 1998 1999E 2000E 2001E 2002E 2003E 2004E 2005ERevenuesInternal revenue 1,432 1,473 1,298 1,297 1,300 1,298 1,296 1,294 1,292External revenue 12,662 13,125 13,322 13,522 13,657 13,793 13,931 14,071 14,211Gross revenue 14,094 14,598 14,620 14,819 14,957 15,091 15,227 15,365 15,503
GrowthInternal revenue (6.8%) 2.9% (11.9%) (0.1%) 0.2% (0.2%) (0.2%) (0.2%) (0.2%)External revenue 5.7% 3.7% 1.5% 1.5% 1.0% 1.0% 1.0% 1.0% 1.0%Gross revenue 4.3% 3.6% 0.1% 1.4% 0.9% 0.9% 0.9% 0.9% 0.9%Source: Company Reports, J.P. Morgan estimates.
Posten Brev plans to cut its workforce by 2,100 by 2002. The reduction of personnel isexpected to cost Skr 250 million annually over the next three years. This reduction isexpected to boost margins, pre restructuring costs, during this period, and support operatingmargins going forward. Furthermore, we expect a steady reduction in number of employeesthroughout the projected period, reflecting decreasing mail volumes.
17
Posten ABJanuary 2000London
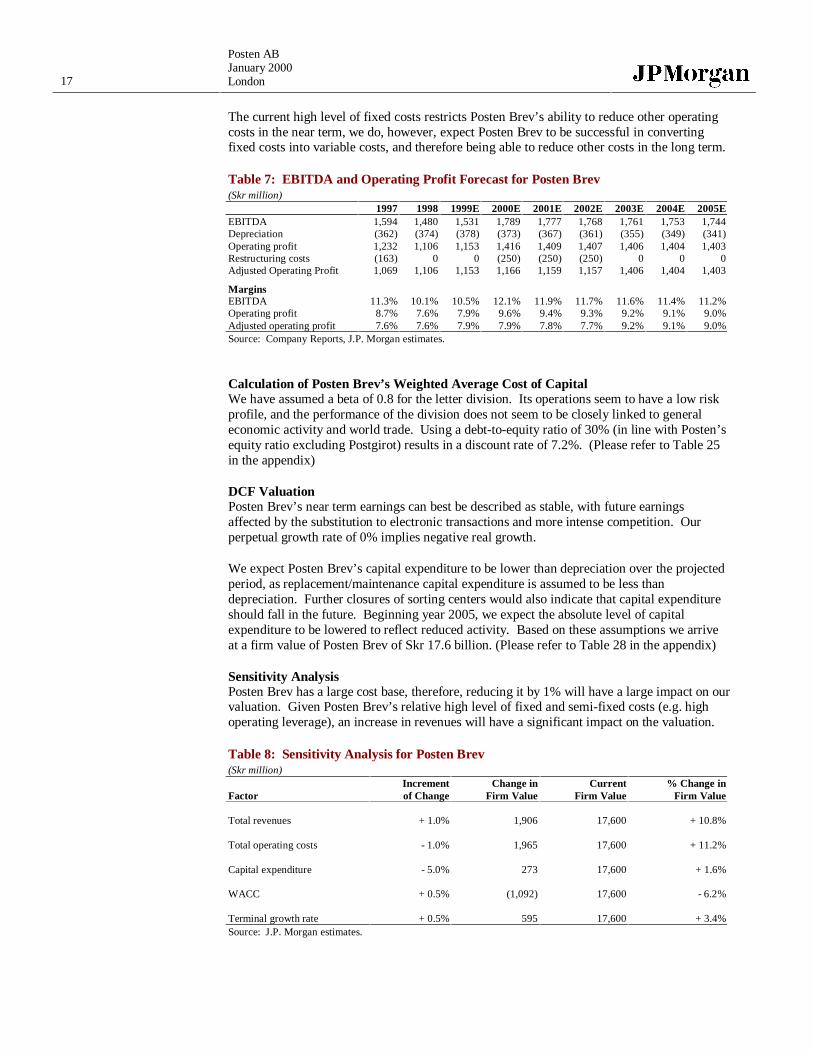
The current high level of fixed costs restricts Posten Brev’s ability to reduce other operatingcosts in the near term, we do, however, expect Posten Brev to be successful in convertingfixed costs into variable costs, and therefore being able to reduce other costs in the long term.
Table 7: EBITDA and Operating Profit Forecast for Posten Brev(Skr million)
1997 1998 1999E 2000E 2001E 2002E 2003E 2004E 2005EEBITDA 1,594 1,480 1,531 1,789 1,777 1,768 1,761 1,753 1,744Depreciation (362) (374) (378) (373) (367) (361) (355) (349) (341)Operating profit 1,232 1,106 1,153 1,416 1,409 1,407 1,406 1,404 1,403Restructuring costs (163) 0 0 (250) (250) (250) 0 0 0Adjusted Operating Profit 1,069 1,106 1,153 1,166 1,159 1,157 1,406 1,404 1,403
MarginsEBITDA 11.3% 10.1% 10.5% 12.1% 11.9% 11.7% 11.6% 11.4% 11.2%Operating profit 8.7% 7.6% 7.9% 9.6% 9.4% 9.3% 9.2% 9.1% 9.0%Adjusted operating profit 7.6% 7.6% 7.9% 7.9% 7.8% 7.7% 9.2% 9.1% 9.0%Source: Company Reports, J.P. Morgan estimates.
Calculation of Posten Brev’s Weighted Average Cost of CapitalWe have assumed a beta of 0.8 for the letter division. Its operations seem to have a low riskprofile, and the performance of the division does not seem to be closely linked to generaleconomic activity and world trade. Using a debt-to-equity ratio of 30% (in line with Posten’sequity ratio excluding Postgirot) results in a discount rate of 7.2%. (Please refer to Table 25in the appendix)
DCF ValuationPosten Brev’s near term earnings can best be described as stable, with future earningsaffected by the substitution to electronic transactions and more intense competition. Ourperpetual growth rate of 0% implies negative real growth.
We expect Posten Brev’s capital expenditure to be lower than depreciation over the projectedperiod, as replacement/maintenance capital expenditure is assumed to be less thandepreciation. Further closures of sorting centers would also indicate that capital expenditureshould fall in the future. Beginning year 2005, we expect the absolute level of capitalexpenditure to be lowered to reflect reduced activity. Based on these assumptions we arriveat a firm value of Posten Brev of Skr 17.6 billion. (Please refer to Table 28 in the appendix)
Sensitivity AnalysisPosten Brev has a large cost base, therefore, reducing it by 1% will have a large impact on ourvaluation. Given Posten Brev’s relative high level of fixed and semi-fixed costs (e.g. highoperating leverage), an increase in revenues will have a significant impact on the valuation.
Table 8: Sensitivity Analysis for Posten Brev(Skr million)
Increment Change in Current % Change inFactor of Change Firm Value Firm Value Firm Value
Total revenues + 1.0% 1,906 17,600 + 10.8%
Total operating costs - 1.0% 1,965 17,600 + 11.2%
Capital expenditure - 5.0% 273 17,600 + 1.6%
WACC + 0.5% (1,092) 17,600 - 6.2%
Terminal growth rate + 0.5% 595 17,600 + 3.4%Source: J.P. Morgan estimates.

J.P. Morgan Securities Ltd.Nick Ward (44-20) 7325 1500 [email protected]ørn Andreassen (44-20) 7325 4898 [email protected] 18
Divisional Valuation: Posten Utrikes
Posten Utrikes accounts for 8.7% of group gross revenues and an estimated 7.9% of thegroup’s EBITDA.
Operational overviewPosten Utrikes is responsible for Sweden Post’s letters and parcels to and from destinationsoutside Sweden. The business area has three sorting terminals, Arlanda, Malmö (letters) andMalmö/Toftnäs. Production is highly integrated with Posten Brev and Posten Logistik.
During 1998 international parcel handling was concentrated into one center. Thisrestructuring led to certain quality disruptions during 1998, which have spilled into 1999,depressing operating results.
Posten Utrikes estimates that it currently has a 94% market share for letters and a 46% marketshare for parcels. International letter volume is expected to remain flat, while parcels areexpected to continue to grow by 5%-10% per year. Growth in parcels is driven mostly byinternational mail orders.
Table 9: Breakdown of Volume (1998)(million items)
Import ExportLetters 125.0 112.0Parcels 1.1 4.5Source: Company reports.
Business parcels account for approximately 98.5% of the total volume of parcels.Approximately 75% of the letter volumes are business related, with 50% coming from bulk-operations. Business parcels and business letters are the segments most affected bycompetition. Posten Utrikes is facing competition from CityMail and other re-mailers on theletter side, and from the large express and logistics operators on the parcel side.
In addition to normal international letters and parcel services, Posten Utrikes also offersspecialist consignment service involving bundling a number of letters and/or parcels destinedfor one particular country. By separating and bundling large mail volumes from the ordinarymail volume and then transporting it to the final distribution centers in the country ofdestination, Posten Utrikes is able to increase speed, quality and cost of its service comparedwith that of domestic postal operators. Final delivery often has to be done by the local postaloperator until markets are fully liberalized.
Cost structureInternational mail flows require settlement systems to compensate the postal operator in thedestination country. A number of settlement systems are currently used: UPU, CEPT, andREIMS. Most European countries apply the CEPT system where the weight is based onweight and the number of items. European Union member states have adopted an alternativesystem called REIMS. REIMS sets a compensation rate equal to 80% of the domestic tariffand links this to certain quality standards.
Posten Utrikes largest share of the costs is the charges payable to foreign postal organizations,with personnel costs accounting for only a small proportion of overall costs.
19
Posten ABJanuary 2000London
Table 10: Posten Utrikes’ Cost Structure (1998)(% of revenue)Revenue 100.0%Personnel 8.2%Other operating costs 85.8%Estimated depreciation 0.4%Operating profit 5.6%Source: Company reports, J.P. Morgan estimates.
As Posten Utrikes cost base is predominantly based on volumes received from other postalorganizations, its cost structure is more variable and its operating leverage is lower than thatof the other letter related operations.
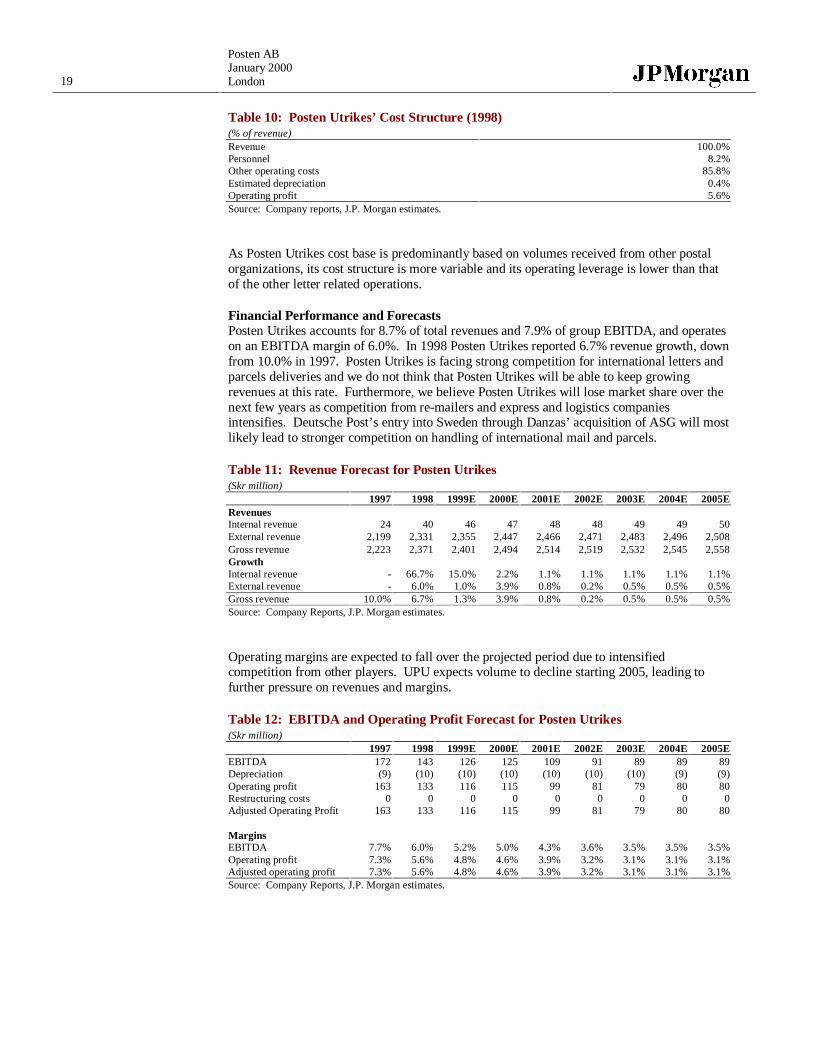
Financial Performance and ForecastsPosten Utrikes accounts for 8.7% of total revenues and 7.9% of group EBITDA, and operateson an EBITDA margin of 6.0%. In 1998 Posten Utrikes reported 6.7% revenue growth, downfrom 10.0% in 1997. Posten Utrikes is facing strong competition for international letters andparcels deliveries and we do not think that Posten Utrikes will be able to keep growingrevenues at this rate. Furthermore, we believe Posten Utrikes will lose market share over thenext few years as competition from re-mailers and express and logistics companiesintensifies. Deutsche Post’s entry into Sweden through Danzas’ acquisition of ASG will mostlikely lead to stronger competition on handling of international mail and parcels.
Table 11: Revenue Forecast for Posten Utrikes(Skr million)
1997 1998 1999E 2000E 2001E 2002E 2003E 2004E 2005ERevenuesInternal revenue 24 40 46 47 48 48 49 49 50External revenue 2,199 2,331 2,355 2,447 2,466 2,471 2,483 2,496 2,508Gross revenue 2,223 2,371 2,401 2,494 2,514 2,519 2,532 2,545 2,558GrowthInternal revenue - 66.7% 15.0% 2.2% 1.1% 1.1% 1.1% 1.1% 1.1%External revenue - 6.0% 1.0% 3.9% 0.8% 0.2% 0.5% 0.5% 0.5%Gross revenue 10.0% 6.7% 1.3% 3.9% 0.8% 0.2% 0.5% 0.5% 0.5%Source: Company Reports, J.P. Morgan estimates.
Operating margins are expected to fall over the projected period due to intensifiedcompetition from other players. UPU expects volume to decline starting 2005, leading tofurther pressure on revenues and margins.
Table 12: EBITDA and Operating Profit Forecast for Posten Utrikes(Skr million)
1997 1998 1999E 2000E 2001E 2002E 2003E 2004E 2005EEBITDA 172 143 126 125 109 91 89 89 89Depreciation (9) (10) (10) (10) (10) (10) (10) (9) (9)Operating profit 163 133 116 115 99 81 79 80 80Restructuring costs 0 0 0 0 0 0 0 0 0Adjusted Operating Profit 163 133 116 115 99 81 79 80 80
MarginsEBITDA 7.7% 6.0% 5.2% 5.0% 4.3% 3.6% 3.5% 3.5% 3.5%Operating profit 7.3% 5.6% 4.8% 4.6% 3.9% 3.2% 3.1% 3.1% 3.1%Adjusted operating profit 7.3% 5.6% 4.8% 4.6% 3.9% 3.2% 3.1% 3.1% 3.1%Source: Company Reports, J.P. Morgan estimates.
J.P. Morgan Securities Ltd.Nick Ward (44-20) 7325 1500 [email protected]ørn Andreassen (44-20) 7325 4898 [email protected] 20
Calculation of Posten Utrikes’ Weighted Average Cost of CapitalWe have attached a beta of 0.8 to Posten Utrikes when calculating its weighted average costof capital. In general, the operations seem to have a low risk profile, and the revenues in theletter divisions do not seem to be closely linked to general economic activity and world trade.Using a debt-to-equity ratio of 30% (in line with Posten’s equity ratio excluding Postgirot)results in a discount rate of 7.2%. (Please refer to Table 25 in the appendix)
DCF ValuationOur valuation of Posten Utrikes assumes that the division will only be able to increase growthmoderately over the projected period. We expect Posten Utrikes to lose market share over theprojected period and competition is also expected to lead to pressure on operating margins.Our perpetual growth rate of 0.5% implies a negative real growth.
We expect capital expenditure to be lower than depreciation over the projected period.Posten Utrikes has already made investments in new sorting operations and as volumes areexpected to decline we assume that Posten Utrikes will not need the same level of investmentas in previous years. However, capital expenditure is expected to remain relatively higher inthe initial years compared to the end of the projected period, as Posten keeps up investment toremain competitive. Based on these assumptions, our estimated firm value for Posten Utrikesis Skr 1.2 billion. (Please refer to Table 29 in the appendix)
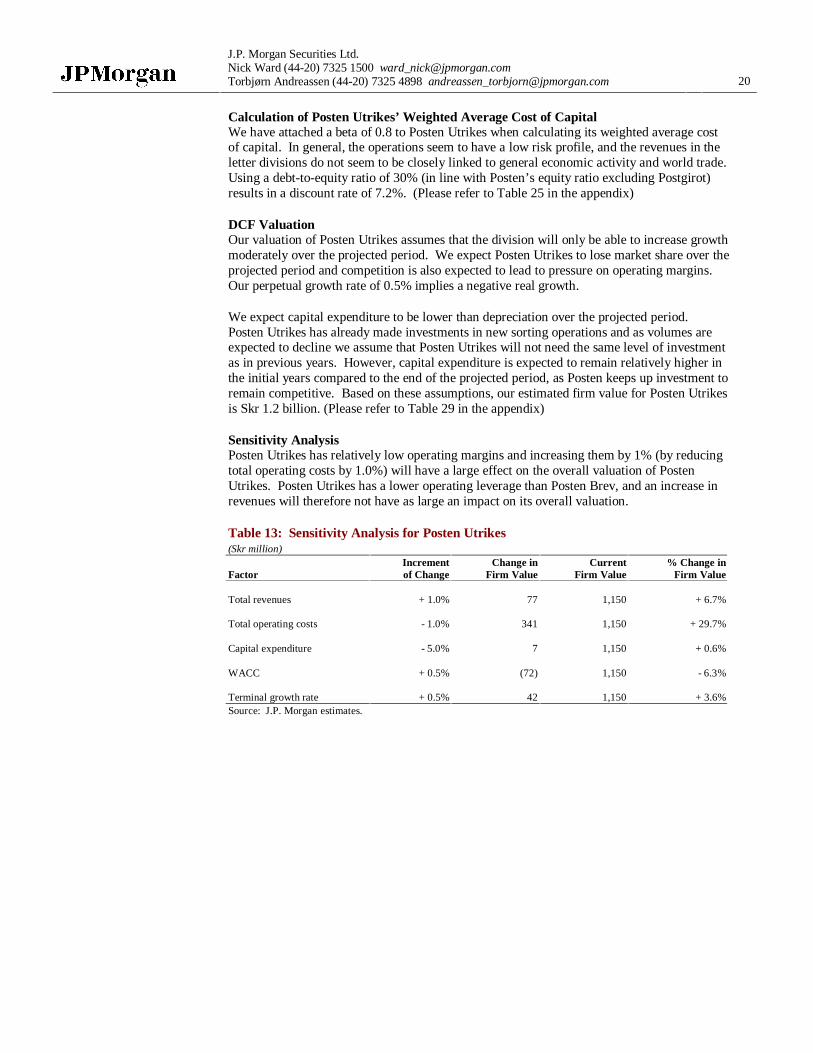
Sensitivity AnalysisPosten Utrikes has relatively low operating margins and increasing them by 1% (by reducingtotal operating costs by 1.0%) will have a large effect on the overall valuation of PostenUtrikes. Posten Utrikes has a lower operating leverage than Posten Brev, and an increase inrevenues will therefore not have as large an impact on its overall valuation.
Table 13: Sensitivity Analysis for Posten Utrikes(Skr million)
Increment Change in Current % Change inFactor of Change Firm Value Firm Value Firm Value
Total revenues + 1.0% 77 1,150 + 6.7%
Total operating costs - 1.0% 341 1,150 + 29.7%
Capital expenditure - 5.0% 7 1,150 + 0.6%
WACC + 0.5% (72) 1,150 - 6.3%
Terminal growth rate + 0.5% 42 1,150 + 3.6%Source: J.P. Morgan estimates.
21
Posten ABJanuary 2000London
Divisional Valuation: Posten Försäljning
Posten Försäljning accounts for 16.7% of group gross revenues and has a significant negativecontribution to the Group’s EBITDA (negative 27%).
Operational overviewPosten Försäljning is the retailer of Posten’s entire product range to both private individuals aswell as smaller businesses. Until March 2001, Posten Försäljning also provides financialservices offered by Nordbanken through its network. This service will end due to the fact thatPosten does not believe that it receives adequate compensation for services rendered. Postenestimates that it is currently loosing Skr 300 million annually on the agreement withNordbanken, and as a consequence the agreement will not be renewed when it expires in 2001.
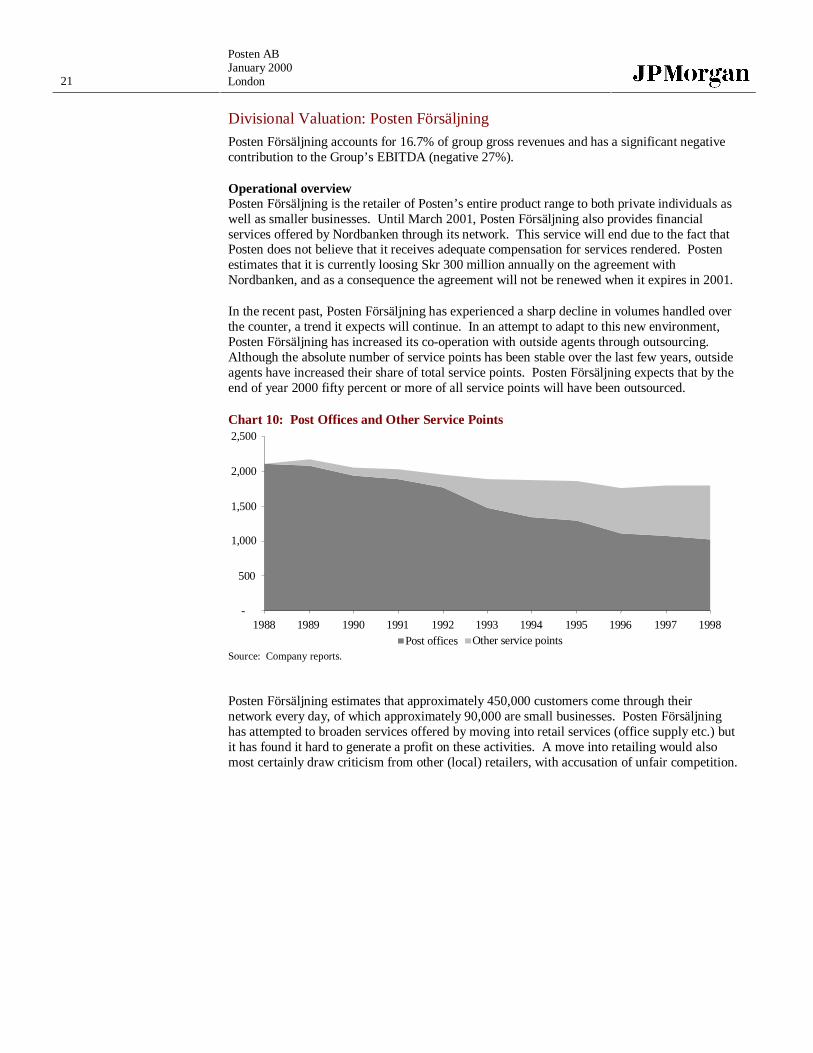
In the recent past, Posten Försäljning has experienced a sharp decline in volumes handled overthe counter, a trend it expects will continue. In an attempt to adapt to this new environment,Posten Försäljning has increased its co-operation with outside agents through outsourcing.Although the absolute number of service points has been stable over the last few years, outsideagents have increased their share of total service points. Posten Försäljning expects that by theend of year 2000 fifty percent or more of all service points will have been outsourced.
Chart 10: Post Offices and Other Service Points
-
500
1,000
1,500
2,000
2,500
1988 1989 1990 1991 1992 1993 1994 1995 1996 1997 1998Post offices Other service points
Source: Company reports.
Posten Försäljning estimates that approximately 450,000 customers come through theirnetwork every day, of which approximately 90,000 are small businesses. Posten Försäljninghas attempted to broaden services offered by moving into retail services (office supply etc.) butit has found it hard to generate a profit on these activities. A move into retailing would alsomost certainly draw criticism from other (local) retailers, with accusation of unfair competition.

J.P. Morgan Securities Ltd.Nick Ward (44-20) 7325 1500 [email protected]ørn Andreassen (44-20) 7325 4898 [email protected] 22
Cost structurePosten Försäljning has a high operating leverage and reduced revenues will have a directimpact on the divisions operating performance.
Table 14: Posten Försäljning’s Cost Structure (1998)(% of revenue)Revenue 100.0%Personnel 56.5%Other operating costs 52.0%Estimated depreciation 3.9%Operating profit -12.4%Source: Company reports, J.P. Morgan estimates.
Despite having reduced its workforce over the past few years, Posten Försäljning has laggedthe development in revenues. The termination of the Nordbanken agreement will lead to asignificant reduction in number of employees. Posten Försäljning estimates that it will haveto reduce average number of employees by 4,000 by the end of 2001 to compensate for theloss of business. Posten estimates that it will incur costs of approximately Skr 450,000 perredundancy, a total of Skr 1.8 billion. Outsourcing of services is expected to reduce PostenFörsäljning’s high operating leverage.
Financial Performance and ForecastsPosten Försäljning accounts for 16.7% of total revenues but has negative EBITDA andoperating margins – currently operating on a negative EBITDA margin of 8.5%. Revenuesfell by 1.8% in 1998 compared to a fall of 24% in 1997. The termination of the Nordbankencontract will have significant impact on revenues for Posten Försäljning, and we anticipate asharp decline in revenue over the next three years after which it will level out on a muchlower level.
As of 1999 Posten Försäljning no longer receives a remuneration of Skr 485 million from theother divisions (of which Posten Brev supplied Skr 325 million), which further contributes tothe decline of revenues.
Table 15: Revenue Forecast for Posten Försäljning(Skr million)
1997 1998 1999E 2000E 2001E 2002E 2003E 2004E 2005ERevenuesInternal revenue 2,914 2,862 2,595 2,056 1,813 1,607 1,583 1,559 1,536External revenue 1,751 1,719 1,033 830 715 360 358 356 355Gross revenue 4,665 4,581 3,628 2,886 2,528 1,967 1,941 1,916 1,890GrowthInternal revenue - -1.8% -9.3% -20.8% -11.8% -11.4% -1.5% -1.5% -1.5%External revenue - -1.8% -39.9% -19.7% -13.9% -49.7% -0.5% -0.5% -0.5%Gross revenue -23.9% -1.8% -20.8% -20.5% -12.4% -22.2% -1.3% -1.3% -1.3%Source: Company Reports, J.P. Morgan estimates.
23
Posten ABJanuary 2000London
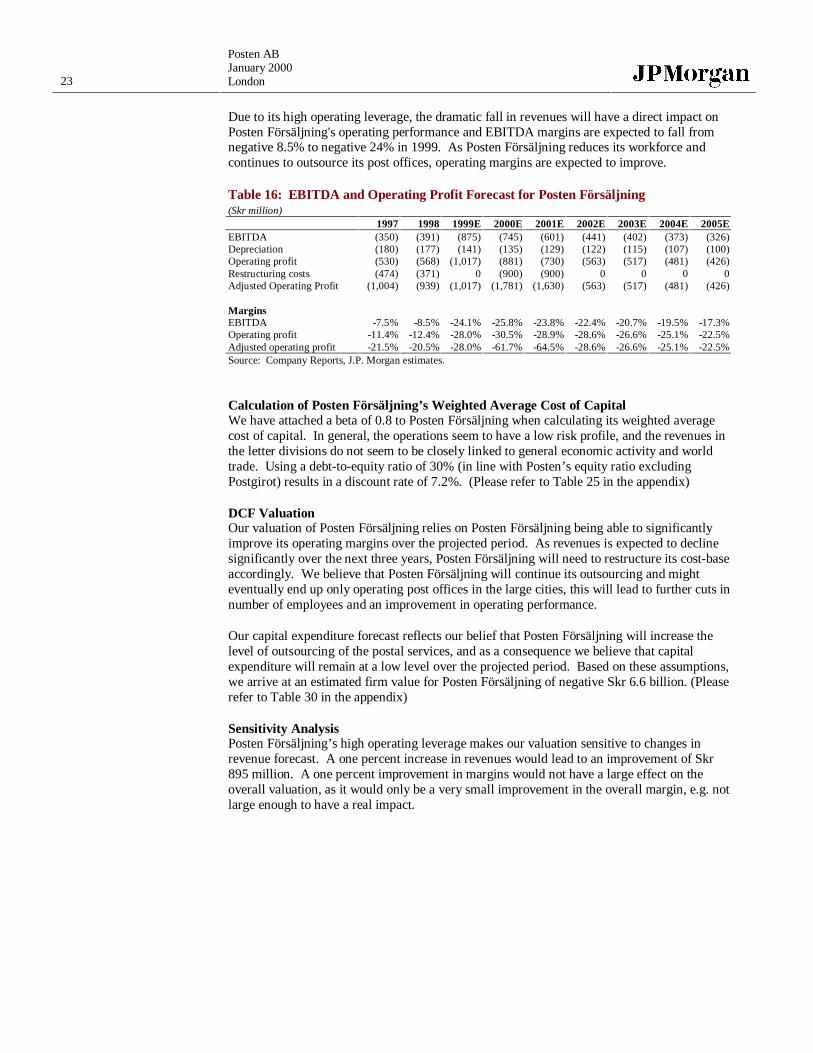
Due to its high operating leverage, the dramatic fall in revenues will have a direct impact onPosten Försäljning's operating performance and EBITDA margins are expected to fall fromnegative 8.5% to negative 24% in 1999. As Posten Försäljning reduces its workforce andcontinues to outsource its post offices, operating margins are expected to improve.
Table 16: EBITDA and Operating Profit Forecast for Posten Försäljning(Skr million)
1997 1998 1999E 2000E 2001E 2002E 2003E 2004E 2005EEBITDA (350) (391) (875) (745) (601) (441) (402) (373) (326)Depreciation (180) (177) (141) (135) (129) (122) (115) (107) (100)Operating profit (530) (568) (1,017) (881) (730) (563) (517) (481) (426)Restructuring costs (474) (371) 0 (900) (900) 0 0 0 0Adjusted Operating Profit (1,004) (939) (1,017) (1,781) (1,630) (563) (517) (481) (426)
MarginsEBITDA -7.5% -8.5% -24.1% -25.8% -23.8% -22.4% -20.7% -19.5% -17.3%Operating profit -11.4% -12.4% -28.0% -30.5% -28.9% -28.6% -26.6% -25.1% -22.5%Adjusted operating profit -21.5% -20.5% -28.0% -61.7% -64.5% -28.6% -26.6% -25.1% -22.5%Source: Company Reports, J.P. Morgan estimates.
Calculation of Posten Försäljning’s Weighted Average Cost of CapitalWe have attached a beta of 0.8 to Posten Försäljning when calculating its weighted averagecost of capital. In general, the operations seem to have a low risk profile, and the revenues inthe letter divisions do not seem to be closely linked to general economic activity and worldtrade. Using a debt-to-equity ratio of 30% (in line with Posten’s equity ratio excludingPostgirot) results in a discount rate of 7.2%. (Please refer to Table 25 in the appendix)
DCF ValuationOur valuation of Posten Försäljning relies on Posten Försäljning being able to significantlyimprove its operating margins over the projected period. As revenues is expected to declinesignificantly over the next three years, Posten Försäljning will need to restructure its cost-baseaccordingly. We believe that Posten Försäljning will continue its outsourcing and mighteventually end up only operating post offices in the large cities, this will lead to further cuts innumber of employees and an improvement in operating performance.
Our capital expenditure forecast reflects our belief that Posten Försäljning will increase thelevel of outsourcing of the postal services, and as a consequence we believe that capitalexpenditure will remain at a low level over the projected period. Based on these assumptions,we arrive at an estimated firm value for Posten Försäljning of negative Skr 6.6 billion. (Pleaserefer to Table 30 in the appendix)
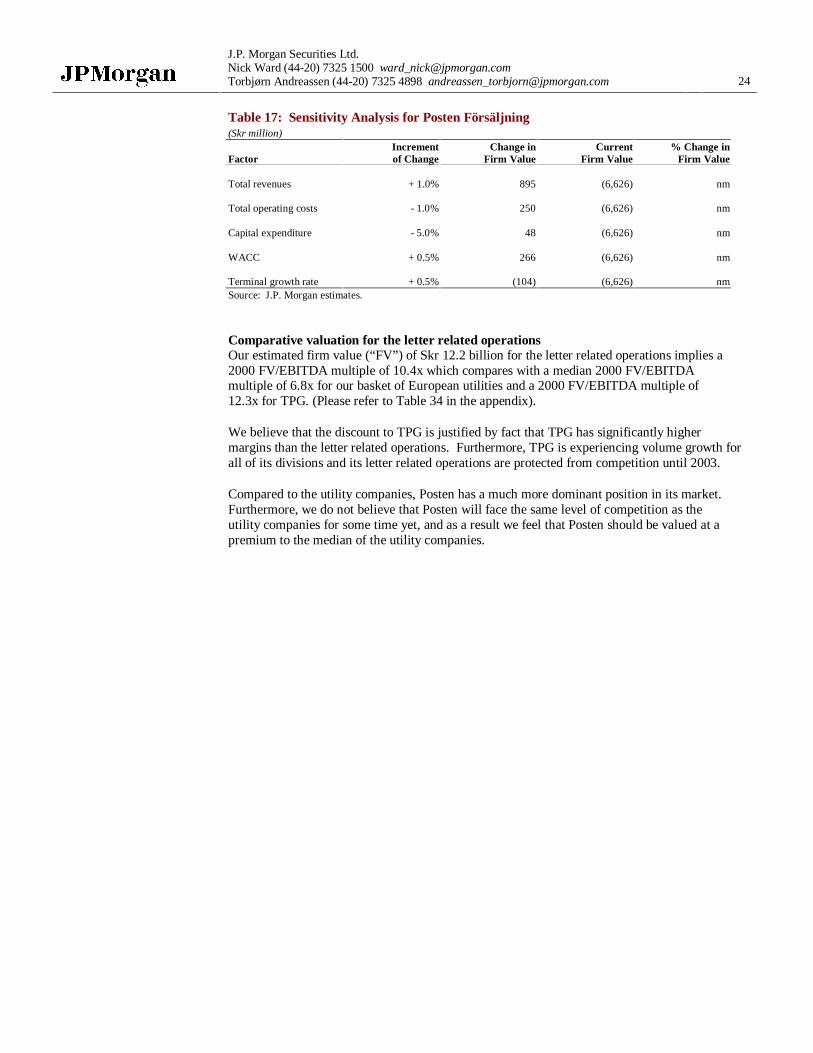
Sensitivity AnalysisPosten Försäljning’s high operating leverage makes our valuation sensitive to changes inrevenue forecast. A one percent increase in revenues would lead to an improvement of Skr895 million. A one percent improvement in margins would not have a large effect on theoverall valuation, as it would only be a very small improvement in the overall margin, e.g. notlarge enough to have a real impact.
J.P. Morgan Securities Ltd.Nick Ward (44-20) 7325 1500 [email protected]ørn Andreassen (44-20) 7325 4898 [email protected] 24
Table 17: Sensitivity Analysis for Posten Försäljning(Skr million)
Increment Change in Current % Change inFactor of Change Firm Value Firm Value Firm Value
Total revenues + 1.0% 895 (6,626) nm
Total operating costs - 1.0% 250 (6,626) nm
Capital expenditure - 5.0% 48 (6,626) nm
WACC + 0.5% 266 (6,626) nm
Terminal growth rate + 0.5% (104) (6,626) nmSource: J.P. Morgan estimates.
Comparative valuation for the letter related operationsOur estimated firm value (“FV”) of Skr 12.2 billion for the letter related operations implies a2000 FV/EBITDA multiple of 10.4x which compares with a median 2000 FV/EBITDAmultiple of 6.8x for our basket of European utilities and a 2000 FV/EBITDA multiple of12.3x for TPG. (Please refer to Table 34 in the appendix).
We believe that the discount to TPG is justified by fact that TPG has significantly highermargins than the letter related operations. Furthermore, TPG is experiencing volume growth forall of its divisions and its letter related operations are protected from competition until 2003.
Compared to the utility companies, Posten has a much more dominant position in its market.Furthermore, we do not believe that Posten will face the same level of competition as theutility companies for some time yet, and as a result we feel that Posten should be valued at apremium to the median of the utility companies.
25
Posten ABJanuary 2000London
Divisional Valuation: Posten Logistik
Posten Logistik accounts for 12.5% of group gross revenues and an estimated 6.6% of thegroup’s EBITDA in 1998. We believe that Posten Logistik is the division that offers thegreatest growth prospects for Posten due mainly to further outsourcing of logistics services bythird parties and increased e-commerce.
Operational overviewPosten Logistik is Sweden’s third largest logistics company and it is the market leader in the0-35 kg parcel segment. Posten Logistik offers complete logistics solutions within the Nordicregion, the Baltic Rim and Northwest Russia. Corporate customers account for nearly 98% ofturnover.
In terms of product mix, the express and parcel operations currently account for the largestproportion of revenues, with third party logistics accounting for only 8%.
In order to remain competitive and focused, Posten Logistik has chosen to concentrate on andprioritize three areas:
• business parcels
• third-party logistics
• focused internationalization in adjacent areas
Business parcels currently account for the largest share of revenues. However, third-partylogistics and expansion abroad are expected to become significant and important parts ofPosten Logistik’s operation.
Third-part logistics is the fastest growing secondary market within the transport industry. Formany customers or potential customers, logistic activities are seen as non-core business.Outsourcing to a competent third-party can realize significant operational improvements andcosts savings, as outsourcing would typically lead to lower inventory costs as well astransform fixed costs into variable costs. Datamonitor expects outsourcing of logisticsexpenditures to third-party operators to grow by 8% annually in Sweden until 2003.
In 1996, Posten decided to expand internationally and build up an express delivery network inthe Baltic Rim and in the other Nordic countries – a market with more than 100 millionpeople in total. Currently there are no services similar to Posten’s business parcels in theBaltic Rim area and Posten Logistik is therefore able to offer a highly competitive product.Posten Logistik’s long term goal is to create an integrated system which will offer similarproducts and services across the markets, and is operated through a unified IT system, therebyachieving economies of scale.
To stay competitive, Posten Logistik is using the Internet to support its parcel products. Onits web site, customers can find information about both international and domestic parcels, aswell as receive support services.
Cost structurePosten Logistik’s current margins are not representative for the divisions potential orperformance. The restructuring of the domestic network in 1998 and the investments ininternational operations in 1999 has negatively impacted the performance of the division in1998 and in 1999. In general, express delivery operations are relatively capital, personnel andIT intensive, requiring a large organizations and a wide network and, resulting in a highoperating leverage.
J.P. Morgan Securities Ltd.Nick Ward (44-20) 7325 1500 [email protected]ørn Andreassen (44-20) 7325 4898 [email protected] 26
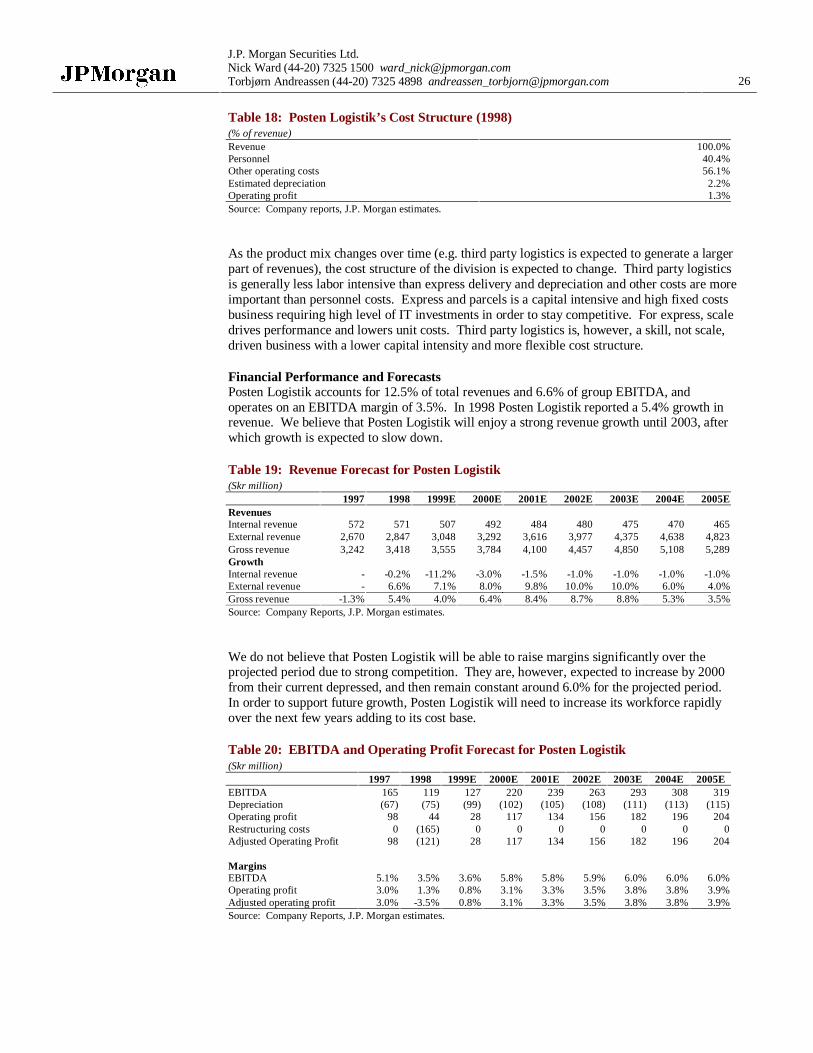
Table 18: Posten Logistik’s Cost Structure (1998)(% of revenue)Revenue 100.0%Personnel 40.4%Other operating costs 56.1%Estimated depreciation 2.2%Operating profit 1.3%Source: Company reports, J.P. Morgan estimates.
As the product mix changes over time (e.g. third party logistics is expected to generate a largerpart of revenues), the cost structure of the division is expected to change. Third party logisticsis generally less labor intensive than express delivery and depreciation and other costs are moreimportant than personnel costs. Express and parcels is a capital intensive and high fixed costsbusiness requiring high level of IT investments in order to stay competitive. For express, scaledrives performance and lowers unit costs. Third party logistics is, however, a skill, not scale,driven business with a lower capital intensity and more flexible cost structure.
Financial Performance and ForecastsPosten Logistik accounts for 12.5% of total revenues and 6.6% of group EBITDA, andoperates on an EBITDA margin of 3.5%. In 1998 Posten Logistik reported a 5.4% growth inrevenue. We believe that Posten Logistik will enjoy a strong revenue growth until 2003, afterwhich growth is expected to slow down.
Table 19: Revenue Forecast for Posten Logistik(Skr million)
1997 1998 1999E 2000E 2001E 2002E 2003E 2004E 2005ERevenuesInternal revenue 572 571 507 492 484 480 475 470 465External revenue 2,670 2,847 3,048 3,292 3,616 3,977 4,375 4,638 4,823Gross revenue 3,242 3,418 3,555 3,784 4,100 4,457 4,850 5,108 5,289GrowthInternal revenue - -0.2% -11.2% -3.0% -1.5% -1.0% -1.0% -1.0% -1.0%External revenue - 6.6% 7.1% 8.0% 9.8% 10.0% 10.0% 6.0% 4.0%Gross revenue -1.3% 5.4% 4.0% 6.4% 8.4% 8.7% 8.8% 5.3% 3.5%Source: Company Reports, J.P. Morgan estimates.
We do not believe that Posten Logistik will be able to raise margins significantly over theprojected period due to strong competition. They are, however, expected to increase by 2000from their current depressed, and then remain constant around 6.0% for the projected period.In order to support future growth, Posten Logistik will need to increase its workforce rapidlyover the next few years adding to its cost base.
Table 20: EBITDA and Operating Profit Forecast for Posten Logistik(Skr million)
1997 1998 1999E 2000E 2001E 2002E 2003E 2004E 2005EEBITDA 165 119 127 220 239 263 293 308 319Depreciation (67) (75) (99) (102) (105) (108) (111) (113) (115)Operating profit 98 44 28 117 134 156 182 196 204Restructuring costs 0 (165) 0 0 0 0 0 0 0Adjusted Operating Profit 98 (121) 28 117 134 156 182 196 204
MarginsEBITDA 5.1% 3.5% 3.6% 5.8% 5.8% 5.9% 6.0% 6.0% 6.0%Operating profit 3.0% 1.3% 0.8% 3.1% 3.3% 3.5% 3.8% 3.8% 3.9%Adjusted operating profit 3.0% -3.5% 0.8% 3.1% 3.3% 3.5% 3.8% 3.8% 3.9%Source: Company Reports, J.P. Morgan estimates.
27
Posten ABJanuary 2000London
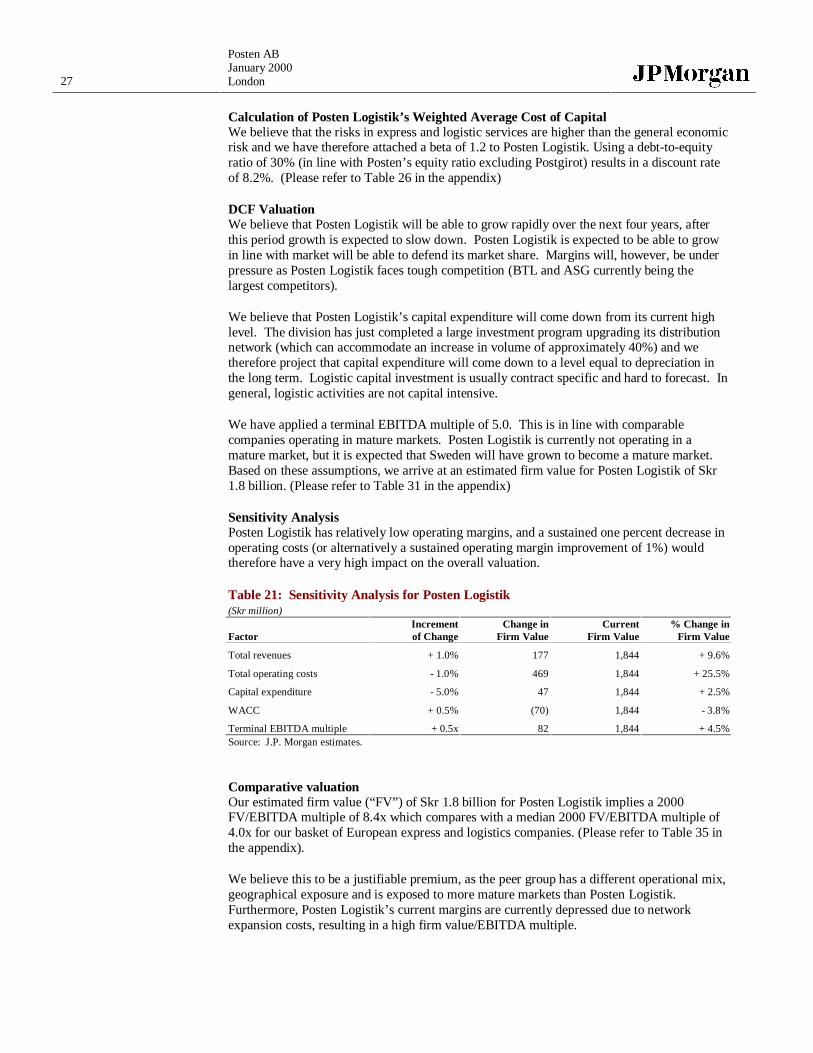
Calculation of Posten Logistik’s Weighted Average Cost of CapitalWe believe that the risks in express and logistic services are higher than the general economicrisk and we have therefore attached a beta of 1.2 to Posten Logistik. Using a debt-to-equityratio of 30% (in line with Posten’s equity ratio excluding Postgirot) results in a discount rateof 8.2%. (Please refer to Table 26 in the appendix)
DCF ValuationWe believe that Posten Logistik will be able to grow rapidly over the next four years, afterthis period growth is expected to slow down. Posten Logistik is expected to be able to growin line with market will be able to defend its market share. Margins will, however, be underpressure as Posten Logistik faces tough competition (BTL and ASG currently being thelargest competitors).
We believe that Posten Logistik’s capital expenditure will come down from its current highlevel. The division has just completed a large investment program upgrading its distributionnetwork (which can accommodate an increase in volume of approximately 40%) and wetherefore project that capital expenditure will come down to a level equal to depreciation inthe long term. Logistic capital investment is usually contract specific and hard to forecast. Ingeneral, logistic activities are not capital intensive.
We have applied a terminal EBITDA multiple of 5.0. This is in line with comparablecompanies operating in mature markets. Posten Logistik is currently not operating in amature market, but it is expected that Sweden will have grown to become a mature market.Based on these assumptions, we arrive at an estimated firm value for Posten Logistik of Skr1.8 billion. (Please refer to Table 31 in the appendix)
Sensitivity AnalysisPosten Logistik has relatively low operating margins, and a sustained one percent decrease inoperating costs (or alternatively a sustained operating margin improvement of 1%) wouldtherefore have a very high impact on the overall valuation.
Table 21: Sensitivity Analysis for Posten Logistik(Skr million)
Increment Change in Current % Change inFactor of Change Firm Value Firm Value Firm Value
Total revenues + 1.0% 177 1,844 + 9.6%
Total operating costs - 1.0% 469 1,844 + 25.5%
Capital expenditure - 5.0% 47 1,844 + 2.5%
WACC + 0.5% (70) 1,844 - 3.8%
Terminal EBITDA multiple + 0.5x 82 1,844 + 4.5%Source: J.P. Morgan estimates.
Comparative valuationOur estimated firm value (“FV”) of Skr 1.8 billion for Posten Logistik implies a 2000FV/EBITDA multiple of 8.4x which compares with a median 2000 FV/EBITDA multiple of4.0x for our basket of European express and logistics companies. (Please refer to Table 35 inthe appendix).
We believe this to be a justifiable premium, as the peer group has a different operational mix,geographical exposure and is exposed to more mature markets than Posten Logistik.Furthermore, Posten Logistik’s current margins are currently depressed due to networkexpansion costs, resulting in a high firm value/EBITDA multiple.
J.P. Morgan Securities Ltd.Nick Ward (44-20) 7325 1500 [email protected]ørn Andreassen (44-20) 7325 4898 [email protected] 28
Divisional Valuation: PostNet
PostNet has overall responsibility for the development of Posten’s range of services primarilywithin the area of electronic trade, electronic infrastructure and marketing communication.PostNet it was established in 1997.
Within the PostNet business area there are the following electronic services:
• torget.se
• PostNet Online
• catalogue services
• eDI services
• payment services
• electronic ID-cards
• soft-certificates
For the purpose of this analysis, we assume that revenues and valuation of PostNet willprimarily be driven by torget.se, Posten’s Internet portal. However, we recognize that it is asimplifying assumption requiring further analysis. We believe there may be additional valuein the other operations that may not be captured by this assumption.
Trading Multiple AnalysisAs we feel we are not able to accurately predict the growth and operating margins of PostNet,we have chosen not to value the division using a DCF analysis. Our primary method forvaluing PostNet has been comparable trading analysis.
In general the Internet sector does not yet yield significant profit streams, due to its earlystage of development of most of the companies. This has lead to a reliance on multiples ofexpected revenues.
There are currently no direct comparable listed companies in Europe (we have includedFreeserve and Easynet in our sample), and our sample/basket consist mostly of US listedcompanies. However, we do not think that European Internet portals will attract the samelevel of valuations as US companies, as we do not see the European companies having thesame potential as its US peers. Any European portal addressing a single national audiencewill have a potential market that is a fraction of the US market. Even multinational venturesdeveloping sites in every European nation and language would only address a currentaudience of 22 million online households, less than half the size of the US market.
We believe that the potential for a company is captured by its expected revenue growth, andto that end we have looked at the relationship between expected growth and current valuation.We believe that this approach capture the differences in potential market size for the variouscompanies, and therefore making a comparison based on mostly a US sample more realisticand valid than just applying firm value/revenue multiples.
When regressing 2000 FV/Revenue against expected 1998-2000 annual growth rate for thepeer companies and applying PostNet’s expected revenue growth rate of 33% we arrive at afirm value for PostNet of Skr 2.5 million. (Please refer to Chart 12 in the appendix)
Our estimated firm value implies 2000 FV/Revenue multiple of 15.3x vs. 21.7x for themedian of the peer group (please refer to Table 36 in the appendix). We believe PostNetshould be valued at a discount to the peer group, as its potential market/audience is only afraction of its peers’ potential market/audience. Online content is available globally, but onlyrelevant locally, and because Europe’s online markets are divided by language and culture,any single site addresses a potential audience that is only a fraction the size of the US market.
29
Posten ABJanuary 2000London
Divisional Valuation: Postfastigheter
Postfastigheter accounts for 3.4% of group gross revenues and an estimated 10.8% of thegroup’s EBITDA.
Operational overviewAs well as owning and managing its own properties, Postfastigheter offers consultancyservices within the property market to Posten’s business areas and also manages the propertyportfolio of Sweden Post’s Pension Foundation. Properties not utilized by Posten are rentedout on the external market. The assets are spread throughout Sweden, but in value terms mostare located in Stockholm, Göteborg and Malmö. With the aim of further concentrating theproperty stock in locations where Posten’s operations are most densely situated, a project hasbeen set up to dispose of assets.
Financial Performance and ForecastsBased on information from Posten, our model assumes that the decline in revenues willstabilize starting year 2002. Revenue is expected to decline as Postfastigheter optimizes itsreal estate portfolio by selling off non-core assets.
Table 22: Revenue Forecast for Postfastigheter(Skr million)
1999E 2000E 2001E 2002E 2003E 2004E 2005ERevenuesInternal revenue 276 252 242 242 242 242 242External revenue 176 160 155 155 155 155 155Gross revenue 452 412 397 397 397 397 397GrowthInternal revenue - -8.7% -4.0% 0.0% 0.0% 0.0% 0.0%External revenue - -9.1% -3.1% 0.0% 0.0% 0.0% 0.0%Gross revenue - -8.8% -3.6% 0.0% 0.0% 0.0% 0.0%Source: Company Reports, J.P. Morgan estimates.
Postfastigheter has a very small staff, 157 average number of employees, and most of its costsare related to service and maintenance of the properties. Margins are expected to remainstable over the projected period.
Table 23: EBITDA and Operating Profit Forecast for Postfastigheter(Skr million)
1999E 2000E 2001E 2002E 2003E 2004E 2005EEBITDA 196 175 175 175 175 175 176Depreciation (66) (62) (59) (54) (50) (46) (41)Operating profit 130 113 116 120 125 130 135Restructuring costs 0 0 0 0 0 0 0Adjusted Operating Profit 130 113 116 120 125 130 135
MarginsEBITDA 43.5% 42.6% 44.0% 44.0% 44.1% 44.2% 44.3%Operating profit 28.8% 27.4% 29.2% 30.3% 31.5% 32.7% 34.0%Adjusted operating profit 28.8% 27.4% 29.2% 30.3% 31.5% 32.7% 34.0%Source: Company Reports, J.P. Morgan estimates.
Calculation of Postfastigheter’s Weighted Average Cost of CapitalWe have assumed a beta of 0.6 for the real estate division, in line with comparable tradedSwedish real estate. Using a debt-to-equity ratio of 30% (in line with Posten’s equity ratioexcluding Postgirot) results in a discount rate of 6.8%. (Please refer to Table 27 in theappendix)
J.P. Morgan Securities Ltd.Nick Ward (44-20) 7325 1500 [email protected]ørn Andreassen (44-20) 7325 4898 [email protected] 30
DCF ValuationPostfastigheter is best described as having a stable outlook in terms of revenue growth andoperating performance. Capital expenditure is expected to remain below depreciation overthe projected period. Our terminal growth rate of 0% is in line with the overall growth ratefor the projected period.
We believe that Posten Logistik’s capital expenditure over the projected period will be basedmainly on maintenance and upkeep of the premises, and we have therefore assumed that itwill be below depreciation for the projected period. When calculation the terminal value, wedo, however, assume capital expenditure to be equal to depreciation. Based on theseassumptions, we arrive at an estimated firm value for Postfastigheter of Skr 2.0 billion.(Please refer to Table 31 in the appendix)
Sensitivity AnalysisDue to its high operating margins, the valuation of Postfastigheter is not sensitive to marginalchanges in efficiency. As we have not assumed any increase in revenue over the projectedperiod, the valuation of Postfastigheter would be sensitive to a marginal improvement inrevenue growth.
Table 24: Sensitivity Analysis for Postfastigheter(Skr million)
Increment Change in Current % Change inFactor of Change Firm Value Firm Value Firm Value
Total revenues + 1.0% 165 2,030 +8.1%
Total operating costs - 1.0% 55 2,030 +2.7%
Capital expenditure - 5.0% 27 2,030 +1.3%
WACC + 0.5% (135) 2,030 -6.6%
Terminal growth rate + 0.5% 81 2,030 +4.0%Source: J.P. Morgan estimates.
Comparative valuationOur estimated firm value (“FV”) of Skr 2.0 billion for Postfastigheter implies a 2000FV/EBITDA multiple of 11.6x which compares with a median 2000 FV/EBITDA multiple of15.3x for the comparable companies. (Please refer to Table 37 in the appendix)
We believe this discount to be justifiable, as Postfastigheter’s real estate assets are smallerthan that of its peers. Apart from its assets in the large cities, it does not have as attractivereal estate portfolio as its peers, resulting in lower operating margins.
Divisional Valuation: Overhead and Headquarter
The valuation of overhead has been based on information supplied by Posten. Internalrevenues are expected to remain stable with external revenues projected to increasemarginally due to increased external consulting services. The model assumes that there willbe reduction in number of headquarter staff. Furthermore, Posten has announced that it willbe moving to a more cost-efficient location by year 2001, and this will also lead to a reductionof costs. Depreciation has been assumed to be equal to capital expenditure over the projectedperiod. We have assumed a beta of 1.0 and a 30% debt-to-equity ratio, resulting in a discountrate of 7.7%. Based on these assumptions, we arrive at an estimated firm value for ofnegative Skr 1.8 billion. (Please refer to Table 33 in the appendix)
31
Posten ABJanuary 2000London
TRENDS IN EUROPEAN POSTAL SERVICES
The EU is committed to a full liberalization of its postal market. The European Commissionfirst set out its plans on deregulation in 1992, recommending that postal monopolies shouldbe phased out. Since then, the progress has been slow due to concerns about the negativeemployment effects of liberalization. The current postal directive is valid until 2003, but EUlooks set to review its regulatory framework in 2000, when further preparations towards fullliberalization could be made.
The regulatory review could yield three outcomes:
• maintain status quo;
• gradual liberalization with deadline for full liberalization; or
• gradual liberalization without deadline
As the EU Commission was ready earlier this year to adopt a directive, which for the firsttime proposed a complete liberalization of Europe’s postal monopolies, we believe the secondalternative is the most likely outcome of the regulatory review. The plans were howevershelved at the last minute because of the Commission’s mass resignation in March. Theliberalization could result in the industry being dominated by a small number of multi-national players, a development similar to that of the telecommunications industry.
Today, international postal traffic is growing three times faster than domestic postal traffic.Although international flows are small compared to domestic flows it is expected that asderegulation progresses, current national players will start competing with each other first forthe international mail flow and later for the domestic flows.
Drivers of change in the European postal sectorPolitical and legal issues• liberalization of the postal sector within the EU
• increased independence from governments
• EU regulations on state-owned companies’ freedom to invest and compete
Economic issues• increase in sectors that are intensive users of transportation
• expected growth in Eastern Europe and other new markets
• cluster of post & parcel companies in the Netherlands, Germany and the UK
Socio-cultural issues• increased globalization of firms and consumers
• increased penetration of e-commerce
• growing customer sophistication as they are presented with an increased choice forservices
Technological issues• growth of electronic alternatives (e.g. e-mail, hybrid mail, etc.)
• increased technological sophistication required to stay competitive, but at a higher costthan before
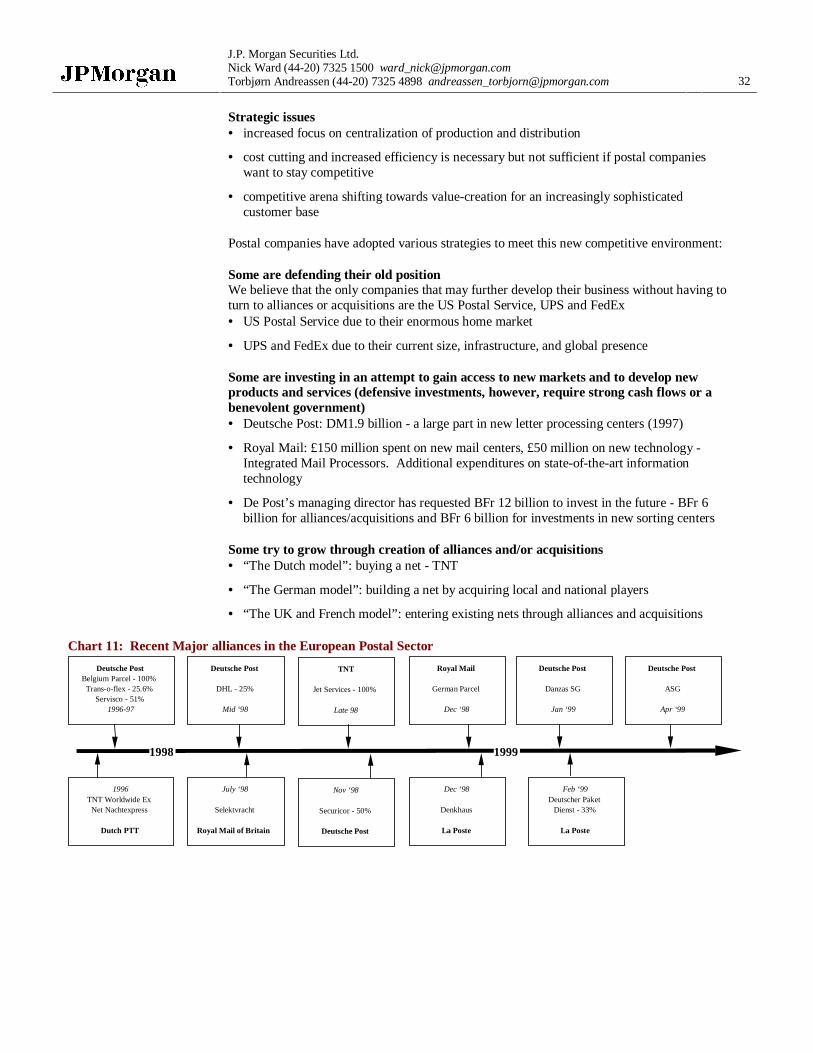
J.P. Morgan Securities Ltd.Nick Ward (44-20) 7325 1500 [email protected]ørn Andreassen (44-20) 7325 4898 [email protected] 32
Strategic issues• increased focus on centralization of production and distribution
• cost cutting and increased efficiency is necessary but not sufficient if postal companieswant to stay competitive
• competitive arena shifting towards value-creation for an increasingly sophisticatedcustomer base
Postal companies have adopted various strategies to meet this new competitive environment:
Some are defending their old positionWe believe that the only companies that may further develop their business without having toturn to alliances or acquisitions are the US Postal Service, UPS and FedEx• US Postal Service due to their enormous home market
• UPS and FedEx due to their current size, infrastructure, and global presence
Some are investing in an attempt to gain access to new markets and to develop newproducts and services (defensive investments, however, require strong cash flows or abenevolent government)• Deutsche Post: DM1.9 billion - a large part in new letter processing centers (1997)
• Royal Mail: £150 million spent on new mail centers, £50 million on new technology -Integrated Mail Processors. Additional expenditures on state-of-the-art informationtechnology
• De Post’s managing director has requested BFr 12 billion to invest in the future - BFr 6billion for alliances/acquisitions and BFr 6 billion for investments in new sorting centers
Some try to grow through creation of alliances and/or acquisitions• “The Dutch model”: buying a net - TNT
• “The German model”: building a net by acquiring local and national players
• “The UK and French model”: entering existing nets through alliances and acquisitions
Chart 11: Recent Major alliances in the European Postal Sector
Deutsche PostBelgium Parcel - 100%
Trans-o-flex - 25.6%Servisco - 51%
1996-97
Deutsche Post
DHL - 25%
Mid ‘98
TNT
Jet Services - 100%
Late 98
Royal Mail
German Parcel
Dec ‘98
1996TNT Worldwide Ex
Net Nachtexpress
Dutch PTT
July ‘98
Selektvracht
Royal Mail of Britain
Nov ‘98
Securicor - 50%
Deutsche Post
Dec ‘98
Denkhaus
La Poste
Feb ‘99Deutscher Paket
Dienst - 33%
La Poste
19991998
Deutsche Post
Danzas SG
Jan ‘99
Deutsche Post
ASG
Apr ‘99
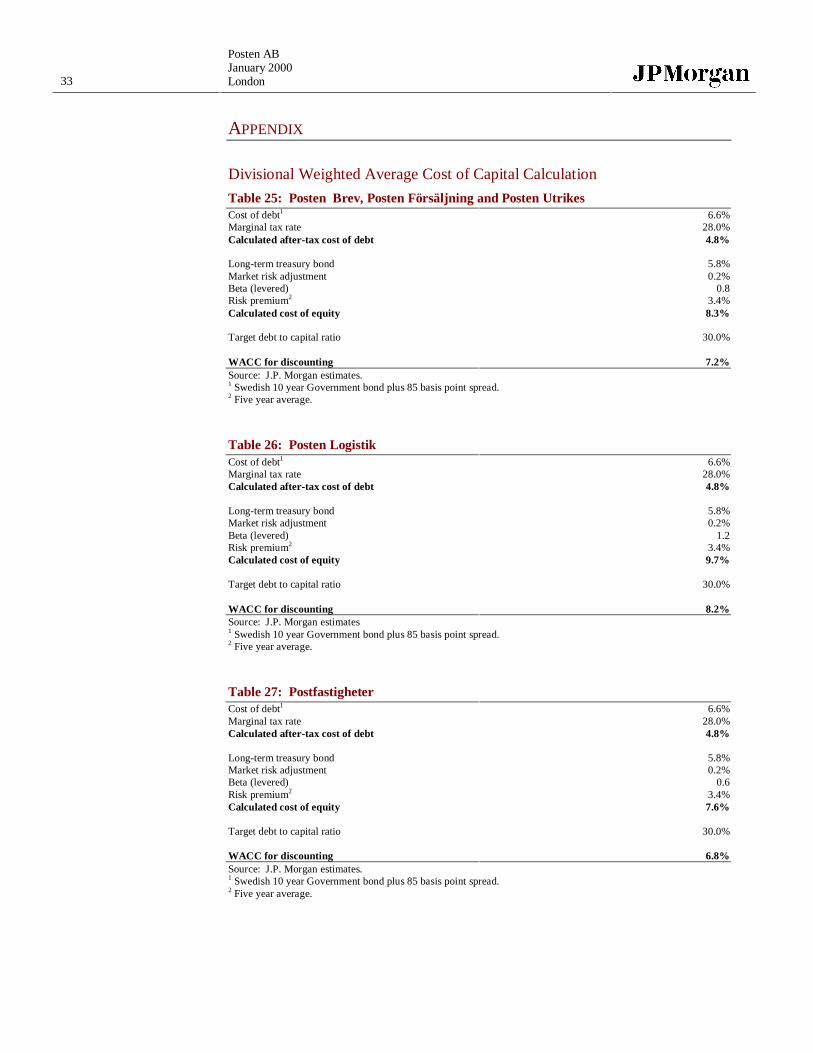
33
Posten ABJanuary 2000London
APPENDIX
Divisional Weighted Average Cost of Capital Calculation
Table 25: Posten Brev, Posten Försäljning and Posten UtrikesCost of debt1 6.6%Marginal tax rate 28.0%Calculated after-tax cost of debt 4.8%
Long-term treasury bond 5.8%Market risk adjustment 0.2%Beta (levered) 0.8Risk premium2 3.4%Calculated cost of equity 8.3%
Target debt to capital ratio 30.0%
WACC for discounting 7.2%Source: J.P. Morgan estimates.1 Swedish 10 year Government bond plus 85 basis point spread.2 Five year average.
Table 26: Posten LogistikCost of debt1 6.6%Marginal tax rate 28.0%Calculated after-tax cost of debt 4.8%
Long-term treasury bond 5.8%Market risk adjustment 0.2%Beta (levered) 1.2Risk premium2 3.4%Calculated cost of equity 9.7%
Target debt to capital ratio 30.0%
WACC for discounting 8.2%Source: J.P. Morgan estimates1 Swedish 10 year Government bond plus 85 basis point spread.2 Five year average.
Table 27: PostfastigheterCost of debt1 6.6%Marginal tax rate 28.0%Calculated after-tax cost of debt 4.8%
Long-term treasury bond 5.8%Market risk adjustment 0.2%Beta (levered) 0.6Risk premium2 3.4%Calculated cost of equity 7.6%
Target debt to capital ratio 30.0%
WACC for discounting 6.8%Source: J.P. Morgan estimates.1 Swedish 10 year Government bond plus 85 basis point spread.2 Five year average.
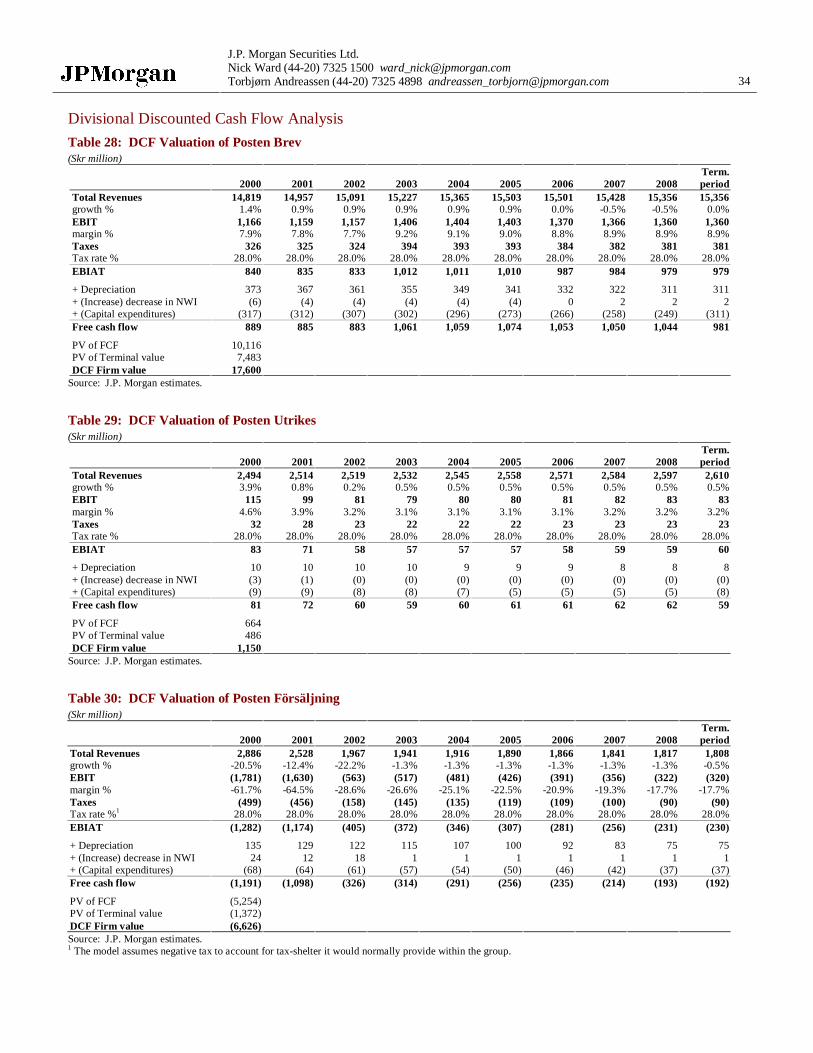
J.P. Morgan Securities Ltd.Nick Ward (44-20) 7325 1500 [email protected]ørn Andreassen (44-20) 7325 4898 [email protected] 34
Divisional Discounted Cash Flow Analysis
Table 28: DCF Valuation of Posten Brev(Skr million)
Term.2000 2001 2002 2003 2004 2005 2006 2007 2008 period
Total Revenues 14,819 14,957 15,091 15,227 15,365 15,503 15,501 15,428 15,356 15,356growth % 1.4% 0.9% 0.9% 0.9% 0.9% 0.9% 0.0% -0.5% -0.5% 0.0%EBIT 1,166 1,159 1,157 1,406 1,404 1,403 1,370 1,366 1,360 1,360margin % 7.9% 7.8% 7.7% 9.2% 9.1% 9.0% 8.8% 8.9% 8.9% 8.9%Taxes 326 325 324 394 393 393 384 382 381 381Tax rate % 28.0% 28.0% 28.0% 28.0% 28.0% 28.0% 28.0% 28.0% 28.0% 28.0%EBIAT 840 835 833 1,012 1,011 1,010 987 984 979 979
+ Depreciation 373 367 361 355 349 341 332 322 311 311+ (Increase) decrease in NWI (6) (4) (4) (4) (4) (4) 0 2 2 2+ (Capital expenditures) (317) (312) (307) (302) (296) (273) (266) (258) (249) (311)Free cash flow 889 885 883 1,061 1,059 1,074 1,053 1,050 1,044 981
PV of FCF 10,116PV of Terminal value 7,483DCF Firm value 17,600
Source: J.P. Morgan estimates.
Table 29: DCF Valuation of Posten Utrikes(Skr million)
Term.2000 2001 2002 2003 2004 2005 2006 2007 2008 period
Total Revenues 2,494 2,514 2,519 2,532 2,545 2,558 2,571 2,584 2,597 2,610growth % 3.9% 0.8% 0.2% 0.5% 0.5% 0.5% 0.5% 0.5% 0.5% 0.5%EBIT 115 99 81 79 80 80 81 82 83 83margin % 4.6% 3.9% 3.2% 3.1% 3.1% 3.1% 3.1% 3.2% 3.2% 3.2%Taxes 32 28 23 22 22 22 23 23 23 23Tax rate % 28.0% 28.0% 28.0% 28.0% 28.0% 28.0% 28.0% 28.0% 28.0% 28.0%EBIAT 83 71 58 57 57 57 58 59 59 60
+ Depreciation 10 10 10 10 9 9 9 8 8 8+ (Increase) decrease in NWI (3) (1) (0) (0) (0) (0) (0) (0) (0) (0)+ (Capital expenditures) (9) (9) (8) (8) (7) (5) (5) (5) (5) (8)Free cash flow 81 72 60 59 60 61 61 62 62 59
PV of FCF 664PV of Terminal value 486DCF Firm value 1,150
Source: J.P. Morgan estimates.
Table 30: DCF Valuation of Posten Försäljning(Skr million)
Term.2000 2001 2002 2003 2004 2005 2006 2007 2008 period
Total Revenues 2,886 2,528 1,967 1,941 1,916 1,890 1,866 1,841 1,817 1,808growth % -20.5% -12.4% -22.2% -1.3% -1.3% -1.3% -1.3% -1.3% -1.3% -0.5%EBIT (1,781) (1,630) (563) (517) (481) (426) (391) (356) (322) (320)margin % -61.7% -64.5% -28.6% -26.6% -25.1% -22.5% -20.9% -19.3% -17.7% -17.7%Taxes (499) (456) (158) (145) (135) (119) (109) (100) (90) (90)Tax rate %1 28.0% 28.0% 28.0% 28.0% 28.0% 28.0% 28.0% 28.0% 28.0% 28.0%EBIAT (1,282) (1,174) (405) (372) (346) (307) (281) (256) (231) (230)
+ Depreciation 135 129 122 115 107 100 92 83 75 75+ (Increase) decrease in NWI 24 12 18 1 1 1 1 1 1 1+ (Capital expenditures) (68) (64) (61) (57) (54) (50) (46) (42) (37) (37)Free cash flow (1,191) (1,098) (326) (314) (291) (256) (235) (214) (193) (192)
PV of FCF (5,254)PV of Terminal value (1,372)DCF Firm value (6,626)Source: J.P. Morgan estimates.1 The model assumes negative tax to account for tax-shelter it would normally provide within the group.
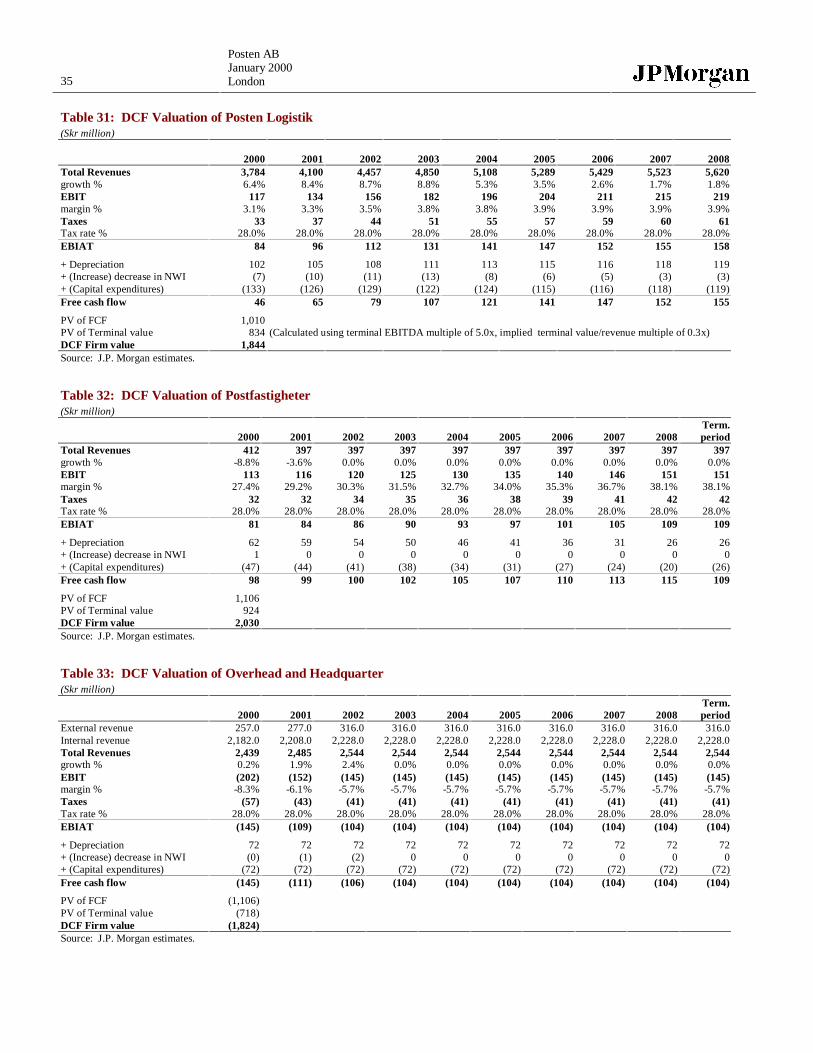
35
Posten ABJanuary 2000London
Table 31: DCF Valuation of Posten Logistik(Skr million)
2000 2001 2002 2003 2004 2005 2006 2007 2008Total Revenues 3,784 4,100 4,457 4,850 5,108 5,289 5,429 5,523 5,620growth % 6.4% 8.4% 8.7% 8.8% 5.3% 3.5% 2.6% 1.7% 1.8%EBIT 117 134 156 182 196 204 211 215 219margin % 3.1% 3.3% 3.5% 3.8% 3.8% 3.9% 3.9% 3.9% 3.9%Taxes 33 37 44 51 55 57 59 60 61Tax rate % 28.0% 28.0% 28.0% 28.0% 28.0% 28.0% 28.0% 28.0% 28.0%EBIAT 84 96 112 131 141 147 152 155 158
+ Depreciation 102 105 108 111 113 115 116 118 119+ (Increase) decrease in NWI (7) (10) (11) (13) (8) (6) (5) (3) (3)+ (Capital expenditures) (133) (126) (129) (122) (124) (115) (116) (118) (119)Free cash flow 46 65 79 107 121 141 147 152 155
PV of FCF 1,010PV of Terminal value 834 (Calculated using terminal EBITDA multiple of 5.0x, implied terminal value/revenue multiple of 0.3x)DCF Firm value 1,844Source: J.P. Morgan estimates.
Table 32: DCF Valuation of Postfastigheter(Skr million)
Term.2000 2001 2002 2003 2004 2005 2006 2007 2008 period
Total Revenues 412 397 397 397 397 397 397 397 397 397growth % -8.8% -3.6% 0.0% 0.0% 0.0% 0.0% 0.0% 0.0% 0.0% 0.0%EBIT 113 116 120 125 130 135 140 146 151 151margin % 27.4% 29.2% 30.3% 31.5% 32.7% 34.0% 35.3% 36.7% 38.1% 38.1%Taxes 32 32 34 35 36 38 39 41 42 42Tax rate % 28.0% 28.0% 28.0% 28.0% 28.0% 28.0% 28.0% 28.0% 28.0% 28.0%EBIAT 81 84 86 90 93 97 101 105 109 109
+ Depreciation 62 59 54 50 46 41 36 31 26 26+ (Increase) decrease in NWI 1 0 0 0 0 0 0 0 0 0+ (Capital expenditures) (47) (44) (41) (38) (34) (31) (27) (24) (20) (26)Free cash flow 98 99 100 102 105 107 110 113 115 109
PV of FCF 1,106PV of Terminal value 924DCF Firm value 2,030Source: J.P. Morgan estimates.
Table 33: DCF Valuation of Overhead and Headquarter(Skr million)
Term.2000 2001 2002 2003 2004 2005 2006 2007 2008 period
External revenue 257.0 277.0 316.0 316.0 316.0 316.0 316.0 316.0 316.0 316.0Internal revenue 2,182.0 2,208.0 2,228.0 2,228.0 2,228.0 2,228.0 2,228.0 2,228.0 2,228.0 2,228.0Total Revenues 2,439 2,485 2,544 2,544 2,544 2,544 2,544 2,544 2,544 2,544growth % 0.2% 1.9% 2.4% 0.0% 0.0% 0.0% 0.0% 0.0% 0.0% 0.0%EBIT (202) (152) (145) (145) (145) (145) (145) (145) (145) (145)margin % -8.3% -6.1% -5.7% -5.7% -5.7% -5.7% -5.7% -5.7% -5.7% -5.7%Taxes (57) (43) (41) (41) (41) (41) (41) (41) (41) (41)Tax rate % 28.0% 28.0% 28.0% 28.0% 28.0% 28.0% 28.0% 28.0% 28.0% 28.0%EBIAT (145) (109) (104) (104) (104) (104) (104) (104) (104) (104)
+ Depreciation 72 72 72 72 72 72 72 72 72 72+ (Increase) decrease in NWI (0) (1) (2) 0 0 0 0 0 0 0+ (Capital expenditures) (72) (72) (72) (72) (72) (72) (72) (72) (72) (72)Free cash flow (145) (111) (106) (104) (104) (104) (104) (104) (104) (104)
PV of FCF (1,106)PV of Terminal value (718)DCF Firm value (1,824)Source: J.P. Morgan estimates.
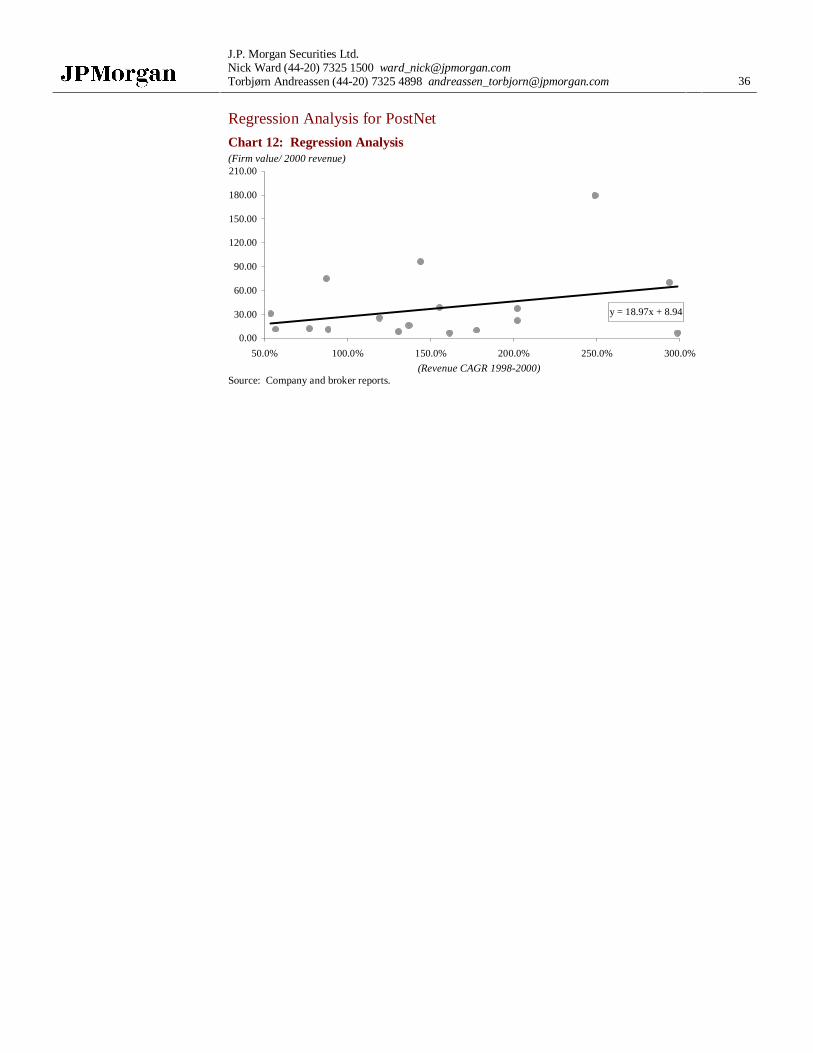
J.P. Morgan Securities Ltd.Nick Ward (44-20) 7325 1500 [email protected]ørn Andreassen (44-20) 7325 4898 [email protected] 36
Regression Analysis for PostNet
Chart 12: Regression Analysis(Firm value/ 2000 revenue)
y = 18.97x + 8.94
0.00
30.00
60.00
90.00
120.00
150.00
180.00
210.00
50.0% 100.0% 150.0% 200.0% 250.0% 300.0%
(Revenue CAGR 1998-2000)Source: Company and broker reports.
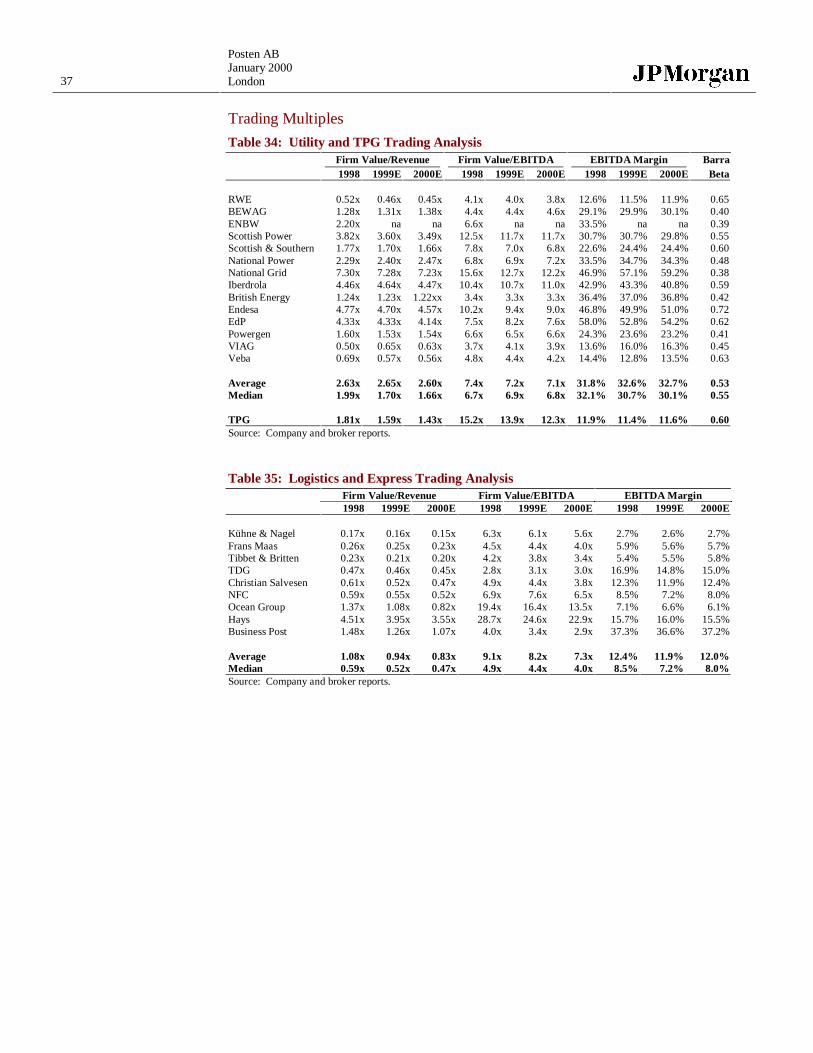
37
Posten ABJanuary 2000London
Trading Multiples
Table 34: Utility and TPG Trading AnalysisFirm Value/Revenue Firm Value/EBITDA EBITDA Margin Barra1998 1999E 2000E 1998 1999E 2000E 1998 1999E 2000E Beta
RWE 0.52x 0.46x 0.45x 4.1x 4.0x 3.8x 12.6% 11.5% 11.9% 0.65BEWAG 1.28x 1.31x 1.38x 4.4x 4.4x 4.6x 29.1% 29.9% 30.1% 0.40ENBW 2.20x na na 6.6x na na 33.5% na na 0.39Scottish Power 3.82x 3.60x 3.49x 12.5x 11.7x 11.7x 30.7% 30.7% 29.8% 0.55Scottish & Southern 1.77x 1.70x 1.66x 7.8x 7.0x 6.8x 22.6% 24.4% 24.4% 0.60National Power 2.29x 2.40x 2.47x 6.8x 6.9x 7.2x 33.5% 34.7% 34.3% 0.48National Grid 7.30x 7.28x 7.23x 15.6x 12.7x 12.2x 46.9% 57.1% 59.2% 0.38Iberdrola 4.46x 4.64x 4.47x 10.4x 10.7x 11.0x 42.9% 43.3% 40.8% 0.59British Energy 1.24x 1.23x 1.22xx 3.4x 3.3x 3.3x 36.4% 37.0% 36.8% 0.42Endesa 4.77x 4.70x 4.57x 10.2x 9.4x 9.0x 46.8% 49.9% 51.0% 0.72EdP 4.33x 4.33x 4.14x 7.5x 8.2x 7.6x 58.0% 52.8% 54.2% 0.62Powergen 1.60x 1.53x 1.54x 6.6x 6.5x 6.6x 24.3% 23.6% 23.2% 0.41VIAG 0.50x 0.65x 0.63x 3.7x 4.1x 3.9x 13.6% 16.0% 16.3% 0.45Veba 0.69x 0.57x 0.56x 4.8x 4.4x 4.2x 14.4% 12.8% 13.5% 0.63
Average 2.63x 2.65x 2.60x 7.4x 7.2x 7.1x 31.8% 32.6% 32.7% 0.53Median 1.99x 1.70x 1.66x 6.7x 6.9x 6.8x 32.1% 30.7% 30.1% 0.55
TPG 1.81x 1.59x 1.43x 15.2x 13.9x 12.3x 11.9% 11.4% 11.6% 0.60Source: Company and broker reports.
Table 35: Logistics and Express Trading AnalysisFirm Value/Revenue Firm Value/EBITDA EBITDA Margin1998 1999E 2000E 1998 1999E 2000E 1998 1999E 2000E
Kühne & Nagel 0.17x 0.16x 0.15x 6.3x 6.1x 5.6x 2.7% 2.6% 2.7%Frans Maas 0.26x 0.25x 0.23x 4.5x 4.4x 4.0x 5.9% 5.6% 5.7%Tibbet & Britten 0.23x 0.21x 0.20x 4.2x 3.8x 3.4x 5.4% 5.5% 5.8%TDG 0.47x 0.46x 0.45x 2.8x 3.1x 3.0x 16.9% 14.8% 15.0%Christian Salvesen 0.61x 0.52x 0.47x 4.9x 4.4x 3.8x 12.3% 11.9% 12.4%NFC 0.59x 0.55x 0.52x 6.9x 7.6x 6.5x 8.5% 7.2% 8.0%Ocean Group 1.37x 1.08x 0.82x 19.4x 16.4x 13.5x 7.1% 6.6% 6.1%Hays 4.51x 3.95x 3.55x 28.7x 24.6x 22.9x 15.7% 16.0% 15.5%Business Post 1.48x 1.26x 1.07x 4.0x 3.4x 2.9x 37.3% 36.6% 37.2%
Average 1.08x 0.94x 0.83x 9.1x 8.2x 7.3x 12.4% 11.9% 12.0%Median 0.59x 0.52x 0.47x 4.9x 4.4x 4.0x 8.5% 7.2% 8.0%Source: Company and broker reports.
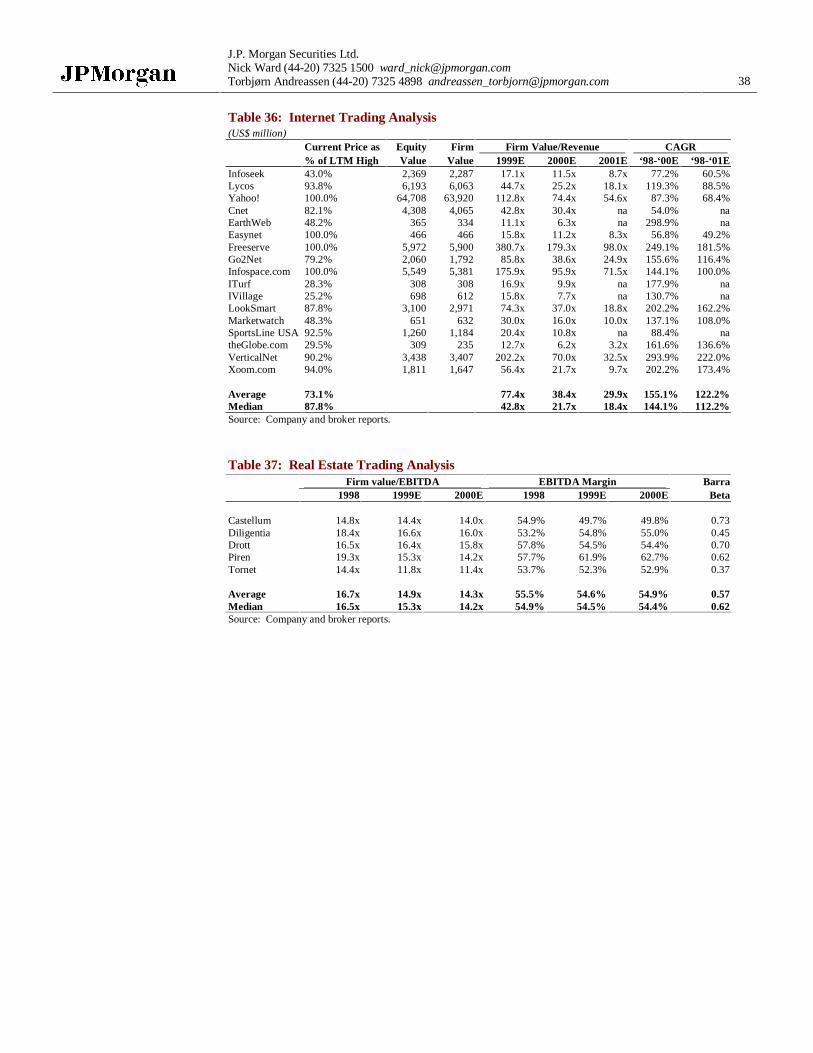
J.P. Morgan Securities Ltd.Nick Ward (44-20) 7325 1500 [email protected]ørn Andreassen (44-20) 7325 4898 [email protected] 38
Table 36: Internet Trading Analysis(US$ million)
Current Price as Equity Firm Firm Value/Revenue CAGR% of LTM High Value Value 1999E 2000E 2001E ‘98-‘00E ‘98-‘01E
Infoseek 43.0% 2,369 2,287 17.1x 11.5x 8.7x 77.2% 60.5%Lycos 93.8% 6,193 6,063 44.7x 25.2x 18.1x 119.3% 88.5%Yahoo! 100.0% 64,708 63,920 112.8x 74.4x 54.6x 87.3% 68.4%Cnet 82.1% 4,308 4,065 42.8x 30.4x na 54.0% naEarthWeb 48.2% 365 334 11.1x 6.3x na 298.9% naEasynet 100.0% 466 466 15.8x 11.2x 8.3x 56.8% 49.2%Freeserve 100.0% 5,972 5,900 380.7x 179.3x 98.0x 249.1% 181.5%Go2Net 79.2% 2,060 1,792 85.8x 38.6x 24.9x 155.6% 116.4%Infospace.com 100.0% 5,549 5,381 175.9x 95.9x 71.5x 144.1% 100.0%ITurf 28.3% 308 308 16.9x 9.9x na 177.9% naIVillage 25.2% 698 612 15.8x 7.7x na 130.7% naLookSmart 87.8% 3,100 2,971 74.3x 37.0x 18.8x 202.2% 162.2%Marketwatch 48.3% 651 632 30.0x 16.0x 10.0x 137.1% 108.0%SportsLine USA 92.5% 1,260 1,184 20.4x 10.8x na 88.4% natheGlobe.com 29.5% 309 235 12.7x 6.2x 3.2x 161.6% 136.6%VerticalNet 90.2% 3,438 3,407 202.2x 70.0x 32.5x 293.9% 222.0%Xoom.com 94.0% 1,811 1,647 56.4x 21.7x 9.7x 202.2% 173.4%
Average 73.1% 77.4x 38.4x 29.9x 155.1% 122.2%Median 87.8% 42.8x 21.7x 18.4x 144.1% 112.2%Source: Company and broker reports.
Table 37: Real Estate Trading AnalysisFirm value/EBITDA EBITDA Margin Barra
1998 1999E 2000E 1998 1999E 2000E Beta
Castellum 14.8x 14.4x 14.0x 54.9% 49.7% 49.8% 0.73Diligentia 18.4x 16.6x 16.0x 53.2% 54.8% 55.0% 0.45Drott 16.5x 16.4x 15.8x 57.8% 54.5% 54.4% 0.70Piren 19.3x 15.3x 14.2x 57.7% 61.9% 62.7% 0.62Tornet 14.4x 11.8x 11.4x 53.7% 52.3% 52.9% 0.37
Average 16.7x 14.9x 14.3x 55.5% 54.6% 54.9% 0.57Median 16.5x 15.3x 14.2x 54.9% 54.5% 54.4% 0.62Source: Company and broker reports.
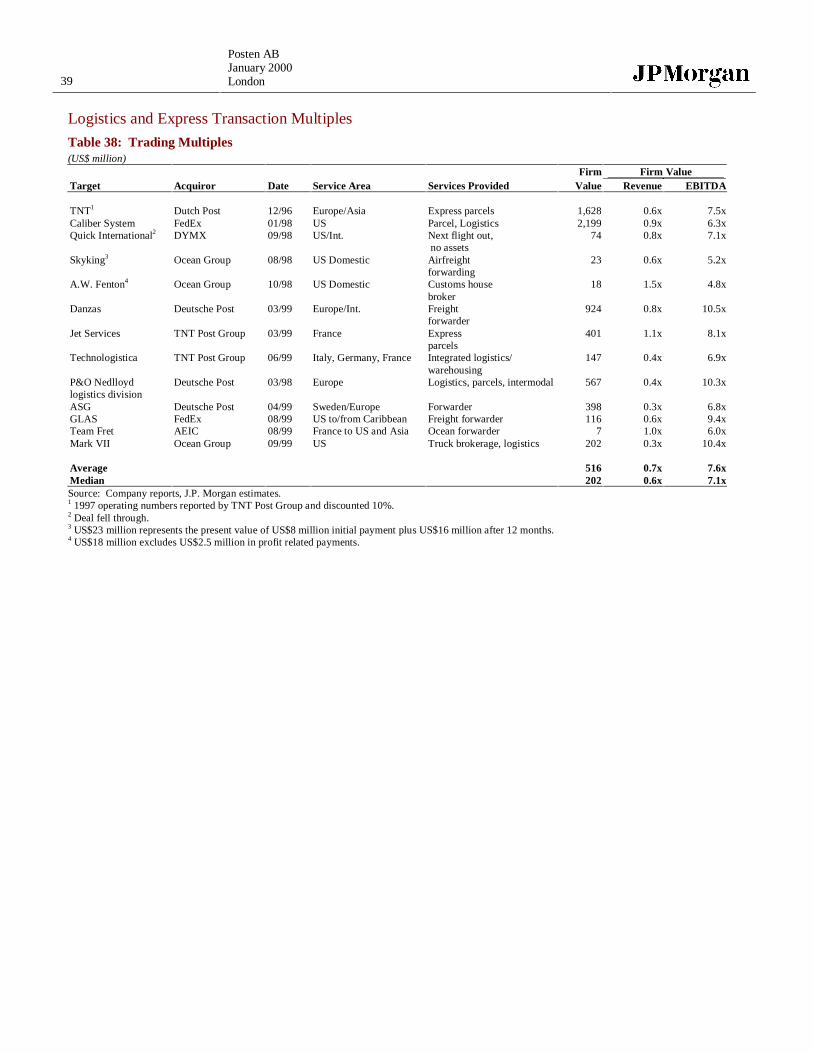
39
Posten ABJanuary 2000London
Logistics and Express Transaction Multiples
Table 38: Trading Multiples(US$ million)
Firm Firm ValueTarget Acquiror Date Service Area Services Provided Value Revenue EBITDA
TNT1 Dutch Post 12/96 Europe/Asia Express parcels 1,628 0.6x 7.5xCaliber System FedEx 01/98 US Parcel, Logistics 2,199 0.9x 6.3xQuick International2 DYMX 09/98 US/Int. Next flight out,
no assets74 0.8x 7.1x
Skyking3 Ocean Group 08/98 US Domestic Airfreightforwarding
23 0.6x 5.2x
A.W. Fenton4 Ocean Group 10/98 US Domestic Customs housebroker
18 1.5x 4.8x
Danzas Deutsche Post 03/99 Europe/Int. Freightforwarder
924 0.8x 10.5x
Jet Services TNT Post Group 03/99 France Expressparcels
401 1.1x 8.1x
Technologistica TNT Post Group 06/99 Italy, Germany, France Integrated logistics/warehousing
147 0.4x 6.9x
P&O Nedlloydlogistics division
Deutsche Post 03/98 Europe Logistics, parcels, intermodal 567 0.4x 10.3x
ASG Deutsche Post 04/99 Sweden/Europe Forwarder 398 0.3x 6.8xGLAS FedEx 08/99 US to/from Caribbean Freight forwarder 116 0.6x 9.4xTeam Fret AEIC 08/99 France to US and Asia Ocean forwarder 7 1.0x 6.0xMark VII Ocean Group 09/99 US Truck brokerage, logistics 202 0.3x 10.4x
Average 516 0.7x 7.6xMedian 202 0.6x 7.1xSource: Company reports, J.P. Morgan estimates.1 1997 operating numbers reported by TNT Post Group and discounted 10%.2 Deal fell through.3 US$23 million represents the present value of US$8 million initial payment plus US$16 million after 12 months.4 US$18 million excludes US$2.5 million in profit related payments.
J.P. Morgan Securities Ltd.Nick Ward (44-20) 7325 1500 [email protected]ørn Andreassen (44-20) 7325 4898 [email protected] 40
Additional information is available upon request.Information herein is believed to be reliable but J.P. Morgan does not warrant its completeness or accuracy. Opinions and estimates constitute our judgment and are subject to changewithout notice. Past performance is not indicative of future results. This material is not intended as an offer or solicitation for the purchase or sale of any financial instrument. J.P.Morgan and/or its affiliates and employees may hold a position or act as market maker in the financial instruments of any issuer discussed herein or act as underwriter, placementagent, advisor or lender to such issuer. This material has been approved for issue in the UK by J.P. Morgan Securities Ltd. which is a member of the London Stock Exchange and isregulated by the SFA. 2000 J.P. Morgan & Co. Incorporated. Clients should contact analysts at and execute transactions through a J.P. Morgan entity in their home jurisdictionunless governing law permits otherwise. For research to private clients in the U.K.: The investments and strategies discussed herein may not be suitable for all investors; if youhave any doubts you should consult your investment advisor. The investments discussed may fluctuate in price or value. Investors may get back less than they invested. Changes inrates of exchange may have an adverse effect on the value of investments.