post-translational modifications pc235 katalin f. medzihradszky [email protected]...
Post on 21-Dec-2015
222 views
TRANSCRIPT

Post-translational modifications
PC235Katalin F. Medzihradszky
Post-translational Modification of ProteinsExpanding Nature’s Inventory (2006)by C.T. Walsh
ISBN 0-9747077-3-2

Genome↓
Transcription – mRNA↓
Translation – proteins + co-translational modifications
↓Post-translational modifications
Just for introduction

Post-translational modifications I
• Enzymatic processing• N-, O-, C-linked glycosylation – Asn, Ser/Thr/Hyl/Hyp,
Trp• Phosphorylation – Tyr, Ser, Thr, His, Asp• Acylation
acetylation of the N-terminusfatty acid anchors on Cys
• Cross-linkage – Lys, Trp, Tyr, Met• Oxydation – Cys, Met, Trp, Tyr, His• Methylation – N-terminus, Arg, Lys• Ubiquitination - Lys

Post-translational modifications II
• Cannot be predicted – though consensus sequences have been reported for some of them
• Organism-dependent• Can be tissue- or location-specific• Stable or dynamic – high and low level• Alters biological activity, and physical
properties• May alter the immune response
↓

Sample preparation
• Will the modification survive?
• Can I get it down to a mass spectrometry friendly size?
• Isolation/enrichment?
• Losses – too hydrophilic/hydrophobic

Mass spectrometry
• Will the modification survive the ionization? the MS/MS activation?
• How unambiguous is the assignment?
modification assignment?Ac vs. Me3; phosphate vs. sulfate etc. site assignment?

Finding the N-termini
• 80-90% of the eukaryotic proteins is acetylated
If 2nd aa: G, A, S, C, T, P, V - Met-1 is clipped off; Ac- is added to
G, A, S, TIf 2nd aa: E, D, Q, M, I, L, W, F – persisting Met gets acetylated

Finding the N-termini
• McDonald L, et al., Positional proteomics: selective recovery and analysis of N-terminal proteolytic peptides.Nat Methods. 2005 Dec;2(12):955-7. Epub 2005 Nov 18.

Modified N-terminus
Modified side-chain
I don’t think any search engine will tell the difference !

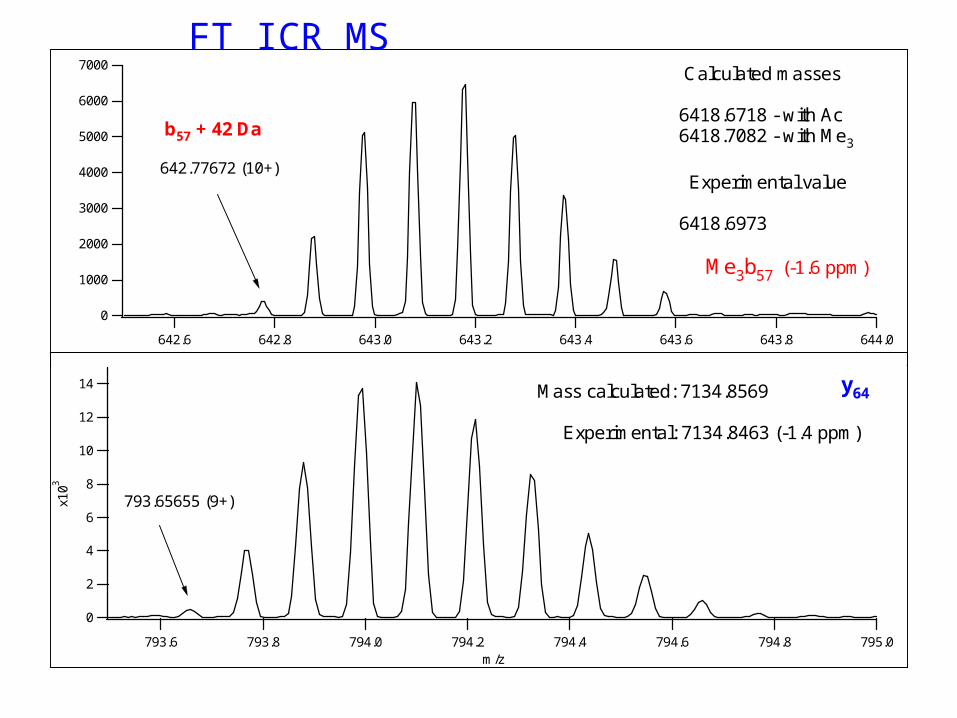
Methylation (mono, di, tri - +14, +28, +42 Da)
• N-terminus, Lys, Arg, His• Trimethyl – acetyl = 36 mmuAccurate mass measurement helps;Fragmentation is different too
• Glu (Asp) may form Me-ester – upon CBB staining (MeOH + acid) + 14 Da
7000
6000
5000
4000
3000
2000
1000
0
644.0643.8643.6643.4643.2643.0642.8642.6m/z
14
12
10
8
6
4
2
0
x103
795.0794.8794.6794.4794.2794.0793.8793.6m/z
642.77672 (10+)
b57 + 42 Da
Calculated masses 6418.6718 - with Ac 6418.7082 - with Me3
Experimental value 6418.6973 Me3b57 (-1.6 ppm)
Mass calculated: 7134.8569 Experimental: 7134.8463 (-1.4 ppm)
y64
793.65655 (9+)
FT ICR MS

700
600
500
400
300
200
100
0
Ion
Cou
nts
400350300250200150100
m/z100
80
60
40
20
0
Ion
Cou
nts
800700600500400
m/z
72.08
87.05147.11 169.10
186.13
214.13
260.20
280.20(2+)
294.85(3+)308.86(3+)
329.74(2+)
373.26(2+)
745.50
623.36599.39
462.79(2+)
479.83(2+)
571.28
486.31
422.77(2+)
427.77(2+)
44
1.5
4(2
+)
45
8.2
9
471.29(2+)
314.5(3+)
320.2(3+)
354.73(2+)
141.1
V
N y1
SV-28-H2O
a2-NH3
a2
b2
y2
y42+
[MH3-NH3-NMe3]3+
[MH3-2NH3]3+
[MH3-NH3]3+
y52+
[a7-NH3-NMe3]2+ y6
2+
y72+
[MH2-CO2H-NMe3]2+
[MH2-NH3]2+
MH22+
SVK*ESVK*EI
SV
K*E
-28
[MH2-2xNH3]2+
y6
b6-NH3-NMe3
512.36
SVK*EI-28
SVK*EI-28-NMe3
Asn-Val-Ser-Val-Lys(Me3)-Glu-Ile-Lys
- 59 Da

Disulfide-bridges
• in membrane and secreted proteinsimportant 3D structure feature
• prone to shuffling @ basic pH
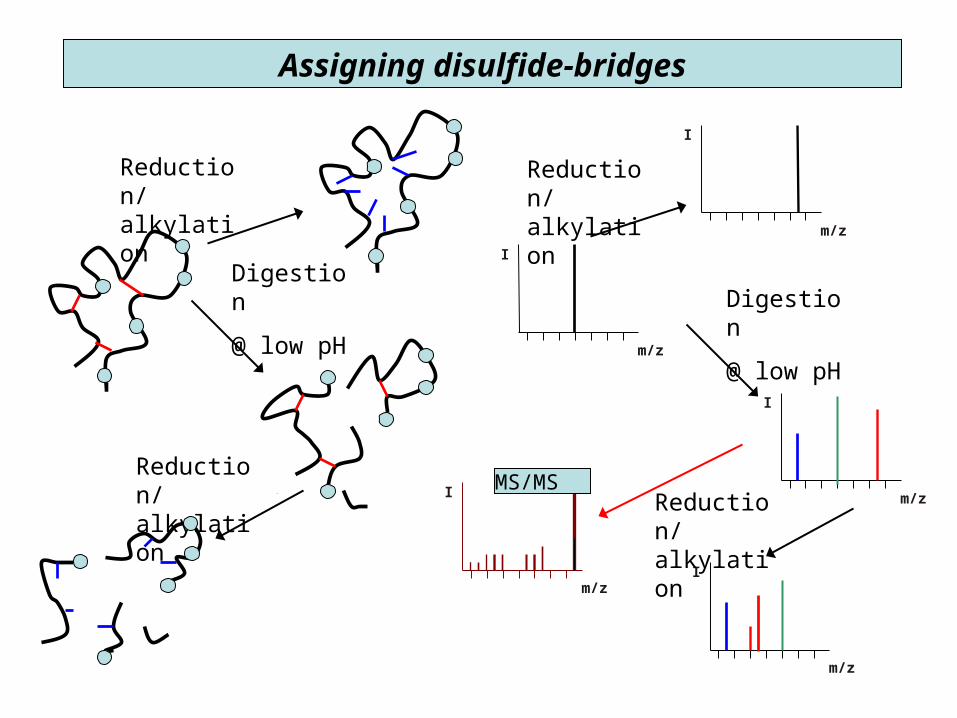
Digestion
@ low pH
Reduction/alkylation
Reduction/alkylation
I
m/z
I
m/z
I
m/z
I
m/z
I
m/z
MS/MS
Reduction/alkylation
Digestion
@ low pH
Reduction/alkylation
Assigning disulfide-bridges

Synthetic Ac-TIMP-1(Ser175)126-184
ECTVFPCLSI PCKLQSGTHC LWTDQLLQGS EKGFQSRHLA CLPREPGLCS WQSLRSQIA
Where are the disulfide bridges?
* digestion with trypsin @ pH 6;
* with pepsin in acid
Bodi, N. et al., J. Pept. Sci. 9, 430-441 (2003).

300028002600240022002000m/z
inte
nsity
12001000800600m/z
inte
nsity
1600140012001000800600m/z
[38-
44]
fre
e S
H
[33-
37]
[45-
55]
Fre
e S
H
[38-
55]
41-
49
[38-
44]-
[45-
55]
41-
49
Ac[
1-13
]-[4
5-55
]2-
7, 1
2-49
[14-
32]-
[38-
44]
20-
41
[33-
37]
[38-
44]
S*
[45-
55]
S*
Ac[
1-13
] 1
S-S
, 1 S
*
Ac[
1-13
] 3
S*
[45
-59]
1 S
*
30002800260024002200200018001600m/z
Ac[
1-13
] 1
free
SH
, 2 S
*
[38
-55]
2 S
* [
14-3
2] 1
S*
[38
-59]
2 S
*
[14
-37]
1 S
*
MALDI-TOF analysis of the tryptic digest
PSD
In-source reduction

Results from the MALDI-TOF MS
594.30 [33-37] 809.5 [38-44] szabad SH 1275.7 [45-55] szabad SH 2064.0 [38-55] 41-49 2082.1 [38-44]-[45-55] 41-49 2752.4 Ac[1-13]-[45-55] 2-49, 7-12 2950.6 [14-32]-[38-44] 20-41 3602.6 Ac[1-32] 2-7, 12-20 3620.6 Ac[1-13]-[14-32] 2-7, 12-20 4177.3 Ac[1-37] 2-7, 12-20 5665.1 Ac[1-32]-[37-
55]+H2O 2-49, 7-12, 20-41
5683.2 Ac[1-32]-[37-55]+2 H2O
2-49, 7-12, 20-41
594.30 [33-37] 866.5 [38-44] 1 CM Cys 1332.7 [45-55] 1 CM Cys 1536.8 Ac[1-13] 1 S-S, 1 CM Cys 1595.8 Ac[1-13] 1 SH, 2 CM Cys 1652.7 Ac[1-13] 3 CM Cys 1674.8 [45-59] SH 1731.9 [45-59] 1 CM Cys 2144.2 [14-32] SH 2180.1 [38-55] 2 CM Cys 2201.1 [14-32] 1 CM Cys 2579.3 [38-59] 2 CM Cys 2776.3 [14-37] 1 CM Cys 3834.7 Ac[1-32] 4 CM Cys 4409.7 Ac[1-37] 4 CM Cys
Tryptic digest After reduction/alkylation

Disulfide bridges in TIMP-1 C-terminal domain: [38-44]-S-S-[45-55], PSD of MH+ at m/z 2082.1
1000
800
600
400
200
0
Inte
nsi
ty
200015001000500m/z
2X1
75
.6, y
1,
y 1*
25
1.6
, b2
25
5.2
, y2*
-NH
3
32
2.6
, b3
77
6.3 8
10
.08
41
.7 12
42
.1* 1
27
6.4*
13
08
.9*
11
0.1
, H
19
28
, b6+
H2O
4,
b 10*
+H
2O
His-Leu-Ala-NH-CH-CO-Leu-Pro-Arg
CH2
CH2
Glu-Pro-Gly-Leu-NH-CH-CO-Ser-Trp-Gln-Ser-Leu-Arg*
S
S
810
776
842.11242.4
1276.5
1308.5
38
45
MALDI-PSD/CID yields characteristic triplets

4000
3000
2000
1000
0
Ion
Cou
nts
600500400300200100
m/z1200
800
400
0
Ion
Cou
nts
1000900800700600
m/z
400
300
200
100
0
Ion
Cou
nts
1600150014001300120011001000
m/z
Figure 9. Low energy CID of m/z 871.79 (most abundant ion in 9+ cluster), MW (monoisotopic) 7835.03 Da. This molecule was identifiedas disulfide linked peptides [443-496] and [519-531] of myosin heavy chain. Sequence and fragmentation are shown on the next page.
327.21
y3**y3**
y3**456.25
y4**
490.24y4 569.34
y5**
120.08F
201.12b2
637.32
y5 682.44y6**
763.10 (3+)b19
811.49y7**
796.13(3+)b20
872.18 (3+)
b22
706.41 (3+)b17
924.5y8**
1144.16 (2+)
1307.77 (2+)
1068.62
b9 b19b22
No characteristic triplets in ESI-CID

Fragment ions used for the identification of disulfide linked myosin peptides. (see low energy CID spectrum in Figure 9.)
b-ions myosin heavy chain peptide [443-496] 763.10 (3+) 1144.16 (2+) 796.13 (3+) 872.18 (3+) 201.12 1068.62 706.41 (3+) 1307.77 (2+) 2 9 17 19 20 22 VTRINQQLDTKQPRQYFGVLDIAGFEIFDFNSLEQLCINFTNEKLQQFFNHHhS 5 4 637.32 490.24 y-ions
myosin heavy chain peptide [519-531] DLAACIELIEKPhS 8 7 6 5 4 3 924.5 811.49 327.21 682.44 456.25 569.34 **y-ions

Disulfide BridgesThe ProteinProspector mass modification search can be used in conjunction with MS-Bridge to find peptides with disulfide bridges. For this example, mass shifts between 0-2000 Da were considered. (1023.3276+4).
KLSWADLIVFAGNCALESMGFK+4
VSFADLVVLGGCAAIEK

Glycosylationhttp://glycores.ncifcrf.gov/
Reference: Essentials of Glycobiology by Varki et al.

N-linked
AsnXxxSer/Thr/Cys

Further processing

N-linked glycosylation
• consensus sequence• GlcNAc2Man3 – coreoligomannose structure – just Man unitscomplex sugars– GlcNAc-Gal–SA
antennaehybrid structurescore fucosylationsulfate, phosphate modifications
• PNGase F removes all N-linked structures; Asn Asp

N-linked glycosylation
• Incredible heterogeneity: a site may be only partially occupied and may display numerous different carbohydrates
• species-, tissue-, cell-type-specific modification, physiological changes, diseases may alter the sugars

certain structures are immunogenic
Gal 1-3 capping, Fuc 1-3 on inner GlcNAc;blood group determinants

N-linked glycosylation
• Identification from diagnostic fragments:* HexNAc m/z 204* HexHexNAc m/z 366 Precursor scan, or „ping-pong” acquisition• Identification from oligosaccharide
heterogeneity• enrichment by HILIC or lectin-
chromatography

human lecithin:cholesterol acyltranferase and apolipoprotein D, tryptic digest, LC/MS analysis
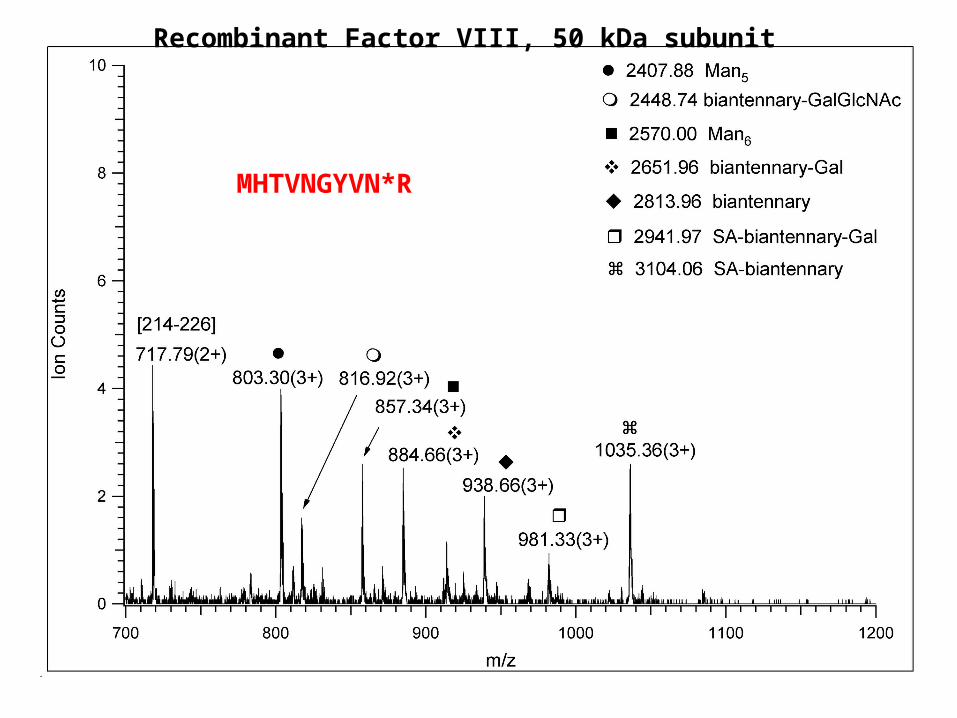
MHTVNGYVN*R
Recombinant Factor VIII, 50 kDa subunit

AG(Man8GlcNAc2)NVSNIIPASATLNADVR
peptide+GlcNAc

About the structures of N-linked glycopeptides
• from the measured mass, and the CID spectrum the modified peptide can be identified + the size and class of the sugar
• the identity of the sugar units and their linkage positions CANNOT be determined
• NMR, exo- and endoglycosidases are needed to complete the job
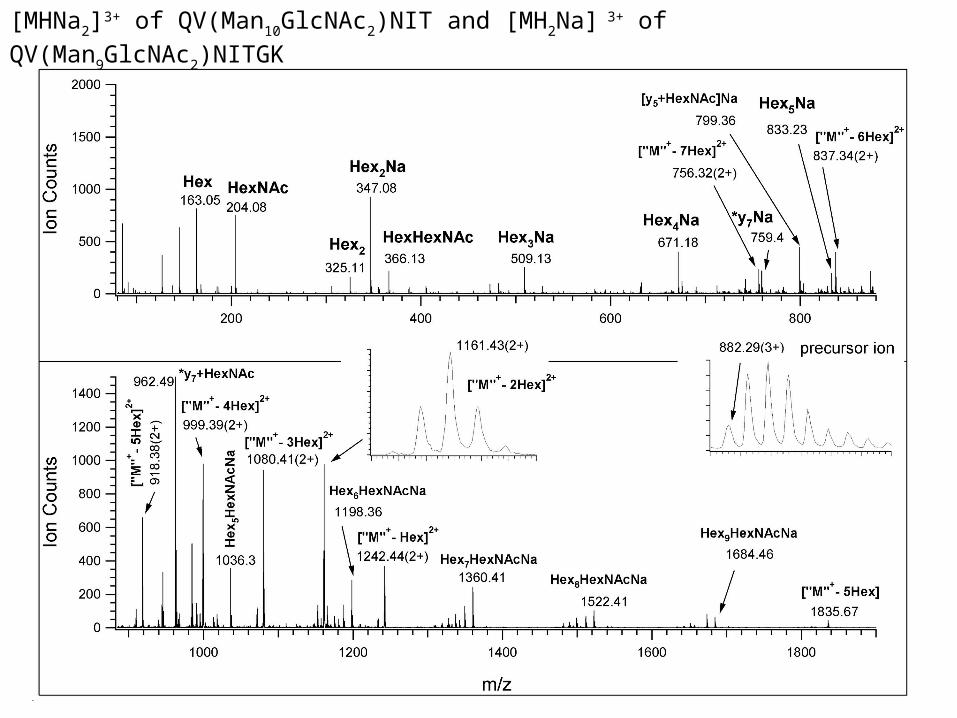
[MHNa2]3+ of QV(Man10GlcNAc2)NIT and [MH2Na] 3+ of QV(Man9GlcNAc2)NITGK

Scheme 1. Fragments observed in the low energy CID spectrum of [MH2Na]3+ of glycopeptide QV(Man9GlcNAc2)NITGK (Figure 6)
+Na 2159.81 1080.41(2+) +Na 671.18 +Na Gln Man1-2Man1 1997.77 999.39(2+)
36
Man1 Val Man1
Man1 36
Man1-4GlcNAc-GlcNAc-Asn 6 Man1-2Man1- 2Man1 Ile +Na +Na Thr 163.05 2483.87 1242.44(2+) 1684.46 2321.85 1161.43(2+) 962.49 Gly +Na 347.08 Lys +Na 1360.41 +Na Man1-2Man1 1036.30
36
Man1 Man1
Man1 36
Man1-4GlcNAc 6 Man1-2Man1 - 2Man1 204.08 +Na 1522.41 +Na 1198.36
One component from the previous slide
K.F. Medzihradszky Meth. Enzymol. 405, 116-138 (2005).

O-linked sugars
• No consensus sequence• No common core structure• No universal enzyme-elimination works (NaOH)sugars have to be reduced upon release
Detection is problematic – because of heterogeneity; variable site occupancy
Site assignment is even harder

O-linked sugars

Other O-linked core structures
• FucHarris, R.J. & Spelmann, M.W. (1993) Glycobiology, 3, 219-224.
• GlcNishimura, H et al., (1989) J. Biol. Chem. 264, 20320-20325.• Man – in yeast____________________________________
• GlcNAc – single unit; INSIDE the cell

CID fragmentation of O-linked glycopeptides
J. Am. Soc. Mass Spectrom. 7, 1996, 319-328.
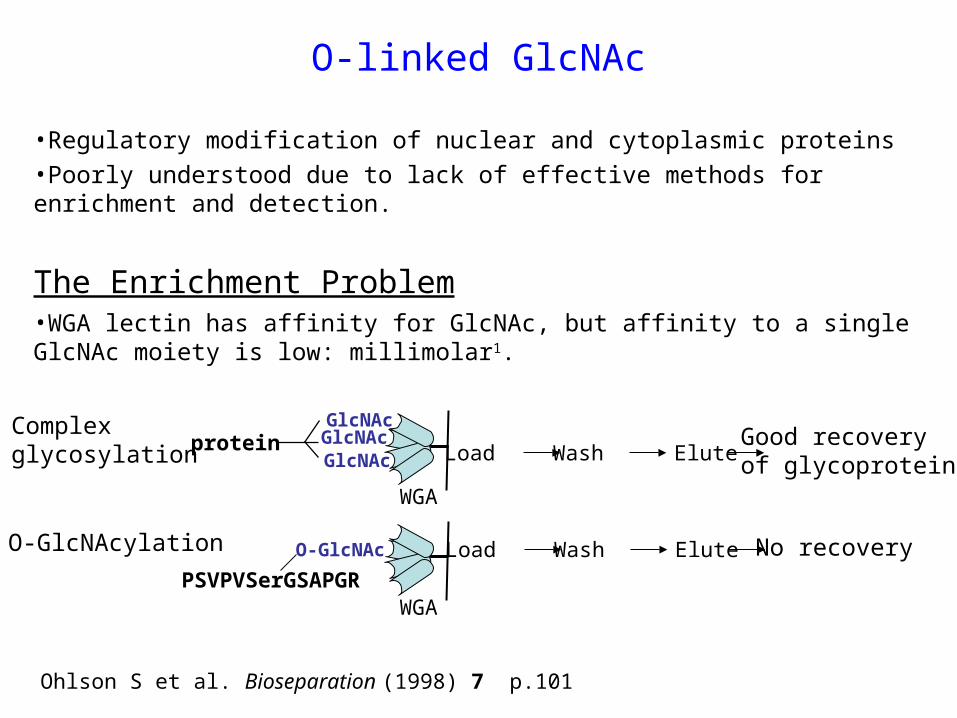
O-linked GlcNAc
•Regulatory modification of nuclear and cytoplasmic proteins
•Poorly understood due to lack of effective methods for enrichment and detection.
The Enrichment Problem•WGA lectin has affinity for GlcNAc, but affinity to a single GlcNAc moiety is low: millimolar1.
WGA
Good recoveryof glycoprotein
Complex glycosylation
Ohlson S et al. Bioseparation (1998) 7 p.101
GlcNAcGlcNAcGlcNAc
protein
No recovery
WGAPSVPVSerGSAPGR
O-GlcNAcO-GlcNAcylation
Load Wash Elute
Load Wash Elute
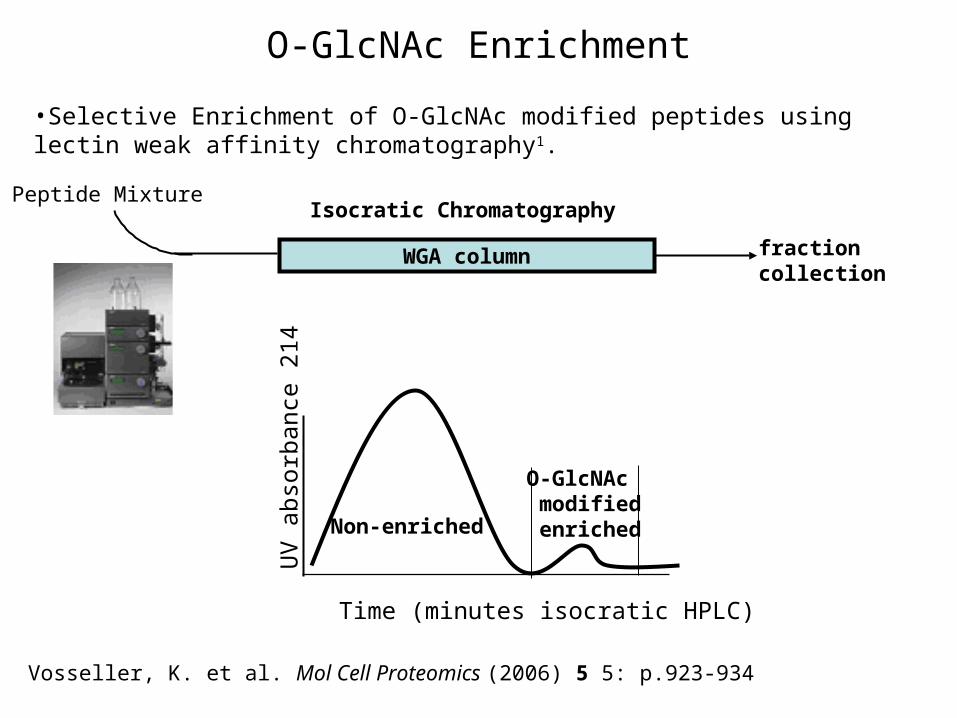
O-GlcNAc Enrichment
WGA column fraction collection
Isocratic ChromatographyPeptide Mixture
Non-enriched
O-GlcNAc modified enriched
UV
abs
orba
nce
214
Time (minutes isocratic HPLC)
Vosseller, K. et al. Mol Cell Proteomics (2006) 5 5: p.923-934
•Selective Enrichment of O-GlcNAc modified peptides using lectin weak affinity chromatography1.

CID Analysis of O-GlcNAc-Modified Peptides
Chalkley, R. J. and Burlingame, A. L. J. Am. Soc. Mass Spectrom. (2001) 12 p.1106-1113
•O-glycosidic link is significantly more labile under CID conditions than peptide backbone.
•Modification site identification using CID often not possible.

A bit about MS/MS alternatives
• ECD (electron-capture dissociation) – multiply charged ions meet electron beam in FT-ICR – larger the charge state larger the capture’s efficiency
• ETD (electron-transfer dissociation) – multiply charged ions meet stable anion (fluoranthene) in ion traps
• radical ion is formed, different mechanism mostly backbone cleavages

Mechanism of ECD I
NN
H
R1
O
H O
N
H
NN
H
R1
O
H O
N
H
+ 2H
3+
+ 2H
2+
NN
H
R1
O
H
CH2
CH2
CH2NH2
O
N
H
+ 2H
2+
NN
H
R1
O
H
H
+ H
+O
N
HCH2CH2
H2CNH2
+ H
+
c` ion z ion
+
e
electroncapture
backbone cleavage/proton abstraction
H2N H2N
H
H H
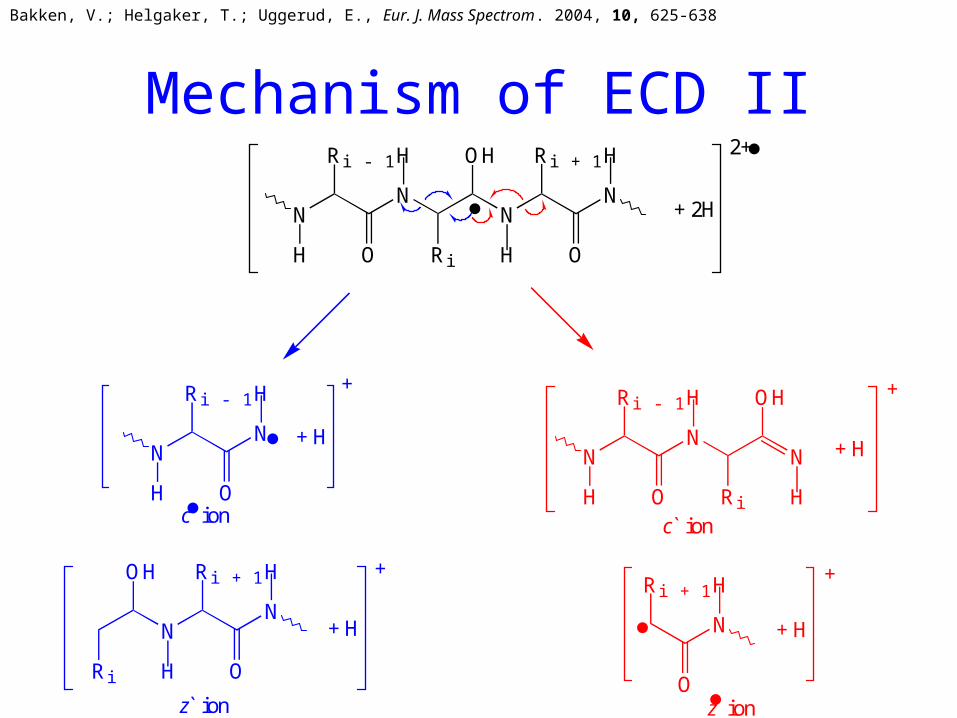
Mechanism of ECD II
NN
NN
OH
H O
Ri + 1 H
Ri
H
O
Ri - 1
H
+ 2H
2+
NN
N
OH
HRi
H
O
Ri - 1
H
N
O
Ri + 1 H
+ H
+ H
+
+
c` ion
z ion
NN
H
O
Ri - 1
H
NN
OH
H O
Ri + 1 H
Ri
+ H
+ H
+
+
c ion
z` ion
Bakken, V.; Helgaker, T.; Uggerud, E., Eur. J. Mass Spectrom. 2004, 10, 625-638
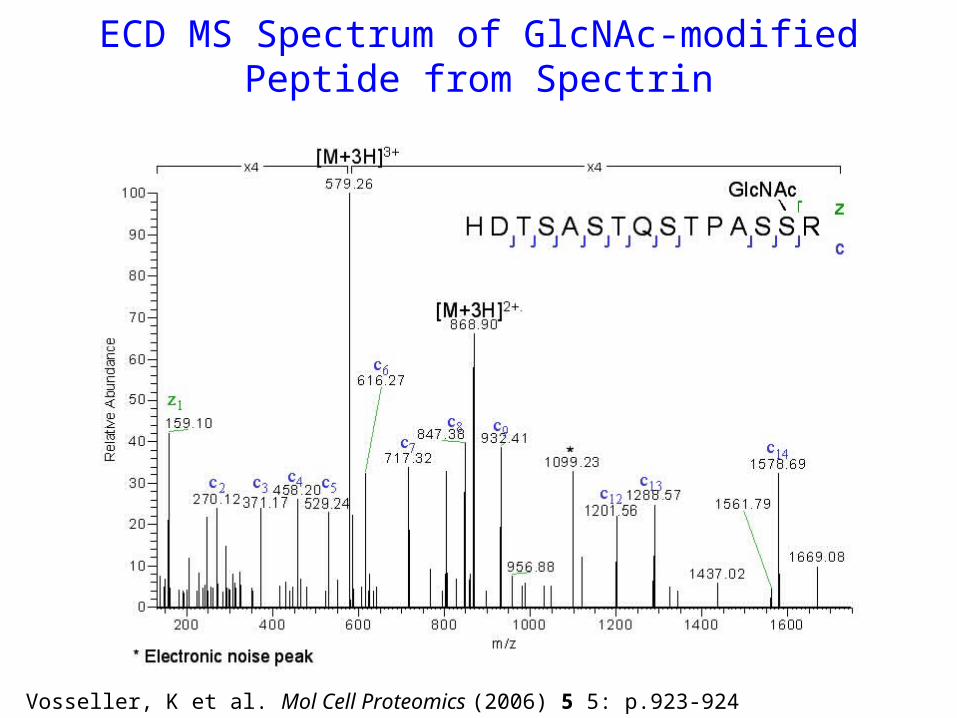
ECD MS Spectrum of GlcNAc-modifiedPeptide from Spectrin
Vosseller, K et al. Mol Cell Proteomics (2006) 5 5: p.923-924

One of the most important regulatory events:
turns proteins on and off
induces or prevents other post-translational
modifications in the same protein
signaling pathways : phosphorylation cascades
PhosphorylationBiological significance

Difficulties
a) Dynamic process : kinase vs. phosphatase
– both must be blocked during isolation
b) Phosphorylation often @ low level (<5%)
c) Lower ionization efficiency – signal of
phosphopeptides suppressed
Enrichment is a must at protein level
at peptide level

A whole cell lysate with 20,000 sites of
phosphorylation at 1% stoichiometry

A whole cell lysate with 20,000 sites of
phosphorylation at 1% stoichiometry

phosphopeptide relative distribution after a 10,000 fold
enrichment

Confirming the presence of phosphorylation
Western blot
pTyr large enough for sequence independent
recognition - works well
pSer, pThr – not reliable
Dyes – questionable reliability
Phosphatase treatment + isoelectric focusing – pI
shift
In vitro/in vivo assay with radioactive phosphate

Determining site of phosphorylation
Mikrosequencing
Mutation studies
Mass spectrometry
MS spectrum : + 80 Da shift
MS/MS fragmentation :
pSer, pThr - H3PO4 loss : –98 Da
pTyr – always retains the modification
immonium ion at m/z 216 Da

Enrichment methods
Ion exchange on SCX
IMAC : Fe(3+), Ga(3+)…
binding at low pH
methyl-esterification prior to IMAC
TiO2, ZrO2
Immunoprecipitation (only for pTyr)

Large scale vs. 1 protein
large scale phosphorylation studies: large amounts of a complex mixture is
analyzed compensating for losses during sample preparation
leads to more PTM identification but low end results are incidental
single protein samples:sample amount is usually limitedmore challengingcombination of techniques may be necessary

Survey Scan:
Precursor Ions that produce 79(-)
Phosphorylation Discovery Workflow
Acquire MSMS Spectra (+)
+ / - polarity switch
+ / - polarity switch
Dynamic Exclusion

N2 CAD Gas
linear ion trap
Detector
Q0 Q1 Q2 Q3/LITQ0 Q1 Q2 Q3/LIT
C2B C2B
4000 Q TRAP
Quadrupole Collision Cell
Sample

LCMS 300fmole Fetuin: Discovery and Identification of CDSSPDpSAEDVR
79- TIC
79- Spectrum at 11.1 min
Enhanced Resolution +ve ion Scan
+ve ion MSMS Spectrum

CDSSPDpSAEDVR
MH2+
MH2+-H3PO4
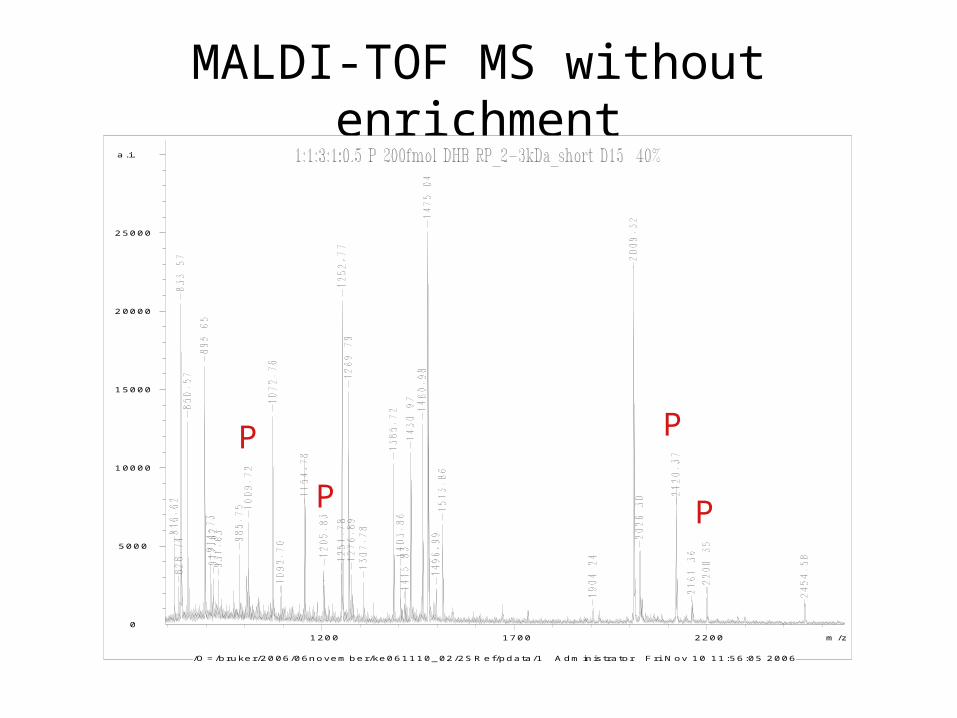
MALDI-TOF MS without enrichment
1200 1700 2200 m /z
0
5000
10000
15000
20000
25000
a.i.
/O = /bruker/2006/06novem ber/ke061110_02/2S R ef/pdata/1 A dm inistrator F ri N ov 10 11:56:05 2006
P P
PP
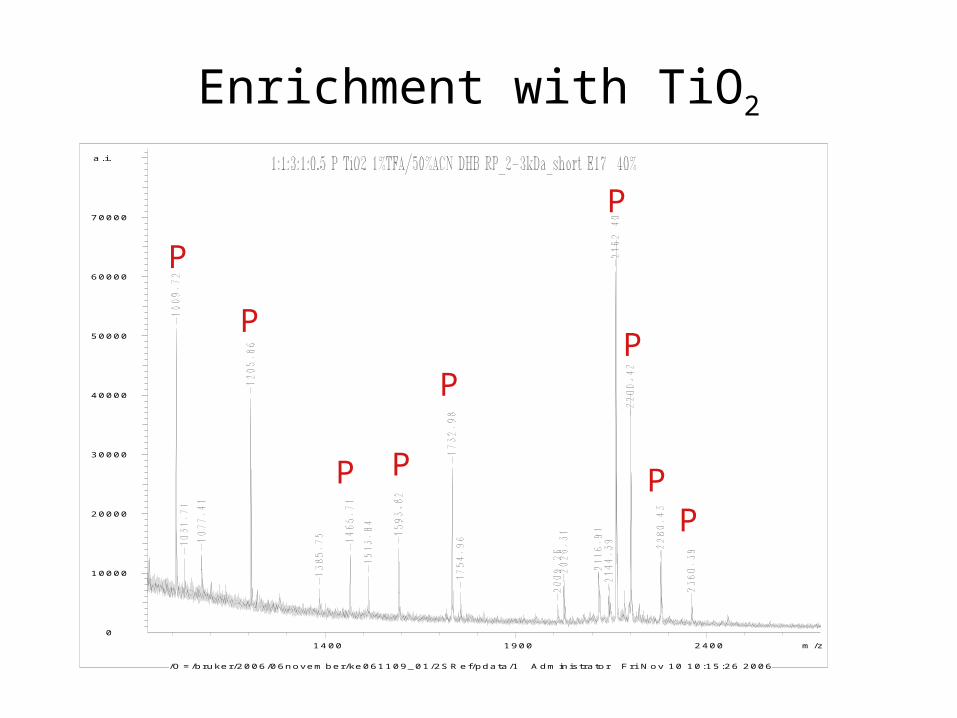
Enrichment with TiO2
1400 1900 2400 m /z
0
10000
20000
30000
40000
50000
60000
70000
a.i.
/O = /bruker/2006/06novem ber/ke061109_01/2S R ef/pdata/1 A dm inistrator F ri N ov 10 10:15:26 2006
P
P
P
P
P P
P
P
P

CID of CDSSPDpSAEDVR140x10
3
120
100
80
60
40
20
0
Inte
nsity
800600400200m/z
40x103
30
20
10
0
Inte
nsity
140012001000800600400200m/z
456
.7 M
-98
3+
518
.3 y
4
389
.3
b3
324
.1 b
2
274
.3 y
2
213
.1
PD
175
.1 y
1 435
.9 y
8-9
82+
597
.2 P
Dp
SA
ED
-98
695
.2 P
Dp
SA
ED
498
.2 b
4
871
.4 y
7
477
.3 M
## 3
+
109
4.4
b
10-9
8
870
.5 y
7
968
.4 y
8
119
2.4
b
10
389
.2 y
3
324
.1 b
2
274
.2 y
2
462
.2 b
42#
715
.4 M
## 2
+
136
0.6
M
-py
684
.4 M
-98
2+
126
2.5
M
-py-
98
756
.3 y
6
658
.4 y
6-9
8m/z 733.7 (2+)
m/z 489.6 (3+)

+80 Da: phosphate? sulfate?Phosphorylation
• Tyr, Ser, Thr, (His)• Phosphopeptides are stable in MS (except
His)• Tyr – no phosphate loss in CID• Ser, Thr – H3PO4 (98 Da) loss in CID
Sulfation
• Tyr only• Significant SO3 (80 Da) loss even in MS

FTMS accurate mass measurement
will tell the differenceIon detected MH+ determined sequence MH+ calculated [ppm] 501.27454(3+) 1501.808 GKFDYNTFVGI/LI/LK 1501.8055 +1.6 512.26184(4+) 2046.0239 AcAEEKQGRHTTNVI/LSMFR 2046.0191 +2.3 516.26027(4+) 2062.0176 AcAEEKQGRHTTNVI/LSM(O)FR 2062.0140 +1.7 603.31016(2+) 1205.6125 HTTNVI/LSMFR 1205.6101 +1.9 611.30791(2+) 1221.608 HTTNVI/LSM(O)FR 1221.6050 +2.4 643.28905(2+) 1285.5703 sulfo-HTTNVI/LSMFR 1285.5669 +2.6 phospho-HTTNVI/LSMFR 1285.5764 -4.7
myosin regulatory light chain, Lymnaea stagnalis

Chromatographic and MS-behavior20x10
3
15
10
5
0
Ion
Co
un
ts
30282624222018
5000
4000
3000
2000
1000
0
Ion
Co
un
ts
30282624222018Time [min]
250
200
150
100
50
0
Ion
Co
un
ts
580560540m/z
400
300
200
100
0
Ion
Co
un
ts
580560540m/z
m/z 546.75-546.82
m/z 586.75-586.82 546.79(2+) 586.77(2+)
546.79(2+)
586.77(2+)
YASQLNQLRunmodified
+80 Da +80 Da

CID comparison of phospho- and sulfo-LAGLQDEIGSLR
100
80
60
40
20
Ion
Co
un
ts
12001000800600400200
2000
1500
1000
500
0
Ion
Co
un
ts
12001000800600400200m/z
627.39(2+)
676.41(2+)
185.13
242.17
288.21
327.25
355.24
414.24b2
b3
y2
a4
b4
*y4
512.26
y4
771.43869.40
980.38
899.53
1069.541167.55
*y10 y10
*y8
y8-NH3
y7*y7
[MH2]2+
precursor ion
[MH2-H3PO4]2+
185.13
242.15
327.25
432.26
545.35
636.39(2+)
674.42
789.44917.50
1087.61
1158.66
precursor ion - m/z 676.3(2+)
b2
b3
a4
**y4
**y5
**y8
**y7
**y6**y10
**y11
[MH2-SO3]2+
1030.60
**y9
fragment mass = unmodified +80 Dafragment mass = unmodified -18 Da
fragment mass = unmodified
PHOSPHO
SULFO

Sulfopeptides easily can be identified as phosphopeptides!
• + 80 Da, 9 mmu difference only
• “identical” behavior by ESIMS, chromatography and under basic conditions.
• different CID fragmentation K.F. Medzihradszky et al., Mol. Cell. Proteomics, May 2004; 3: 429 - 440.

An exciting new cofactor
Reza Ghiladi Paul Ortiz de Montellano

Catalase-peroxidase
Removes harmful peroxide molecules2 H2O2→ H2O + O2
CatalaseH2O2 alternately oxidizes/reduces the heme Fe
Peroxidaseheme is oxidized by H2O2;reduction involves H-donor, such as NADH

Crystal structure of catalase-peroxidase
Haloarcula marismortui (Yamada et al. Nature structural biology)

Active site structure

Active site structure We studied the Mycobacterium tuberculosis
enzyme1) Ghiladi RA,et al., J Biol Chem. 280, 22651-63 (2005).
2) Ghiladi RA, et al, Biochemistry, 44, 15093-105 (2005).
3) Ghiladi RA, et al., J Am Chem Soc. 127, 13428-42 (2005).
CH2 OH
- CH2 - S+ – CH3
Met-255
Tyr-229
NH
CH2 -
Trp-107

What are we looking for?
* Cross-linked “tri”-peptide calculated neutral (zwitter ionic)
mass: 6880.31 Da “measured”
mass: 6879.99 Da

MS TIC
983.87(7+)
9+ 8+7+
6+ 5+
ox. (+16)
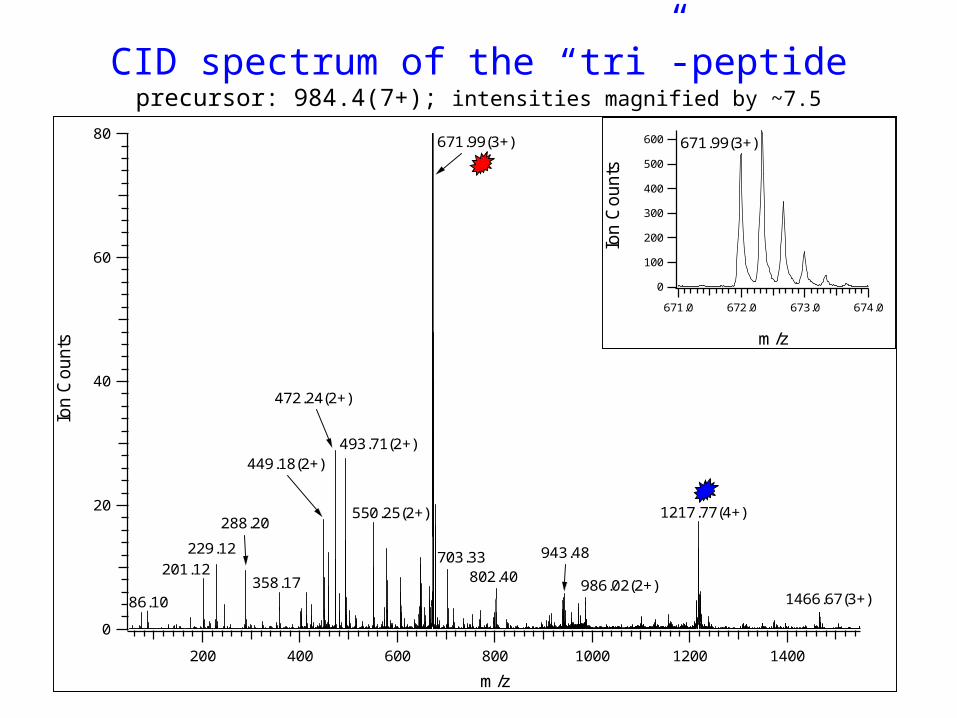
CID spectrum of the “tri”-peptideprecursor: 984.4(7+); intensities magnified by ~7.5
80
60
40
20
0
Ion
Co
un
ts
140012001000800600400200
m/z
86.10
201.12
229.12
288.20
358.17
472.24(2+)
493.71(2+)
550.25(2+)
671.99(3+)
449.18(2+)
703.33802.40
943.48
986.02(2+)
1217.77(4+)
1466.67(3+)
600
500
400
300
200
100
0
Ion
Cou
nts
674.0673.0672.0671.0
m/z
671.99(3+)

Fragmentation scheme of the cross-linked structure
*4397 *4116 1537* 846 644* 502 288 *4511 *4187 1820* 1594* 1155* 943* 715 573 403 175
D L E N P L A A VQMGLI-NH-CH-CO-V N P E G P N G N P D P M A A A V D I R 358 569 753 923 3712 3925 229 472 682 824 (496) 175 (567) 338
M A-NH-CH-CO-H A A G T Y R CH2
CH2 4868.31 (+H) CH3 2014.07 (-H) S + OH CH2
CH2 1728* 915* 703 589 351 147 1028* 802 * 646 452 204
NH2-CH-CO-A M N D V E T A A L I V G G H T F G K 6 1 4 91 5 * 1 212 * - 1 8 10* 7 4 3 98 6 * 1 311 * 1 5 62* 8 4 4 * 10 9 9* 1 3 68 *
16 6 3 *
*4511 – y-type ions, cleavage from 4868 – mostly triply charged ions detected 3712 – b-type ions, cleavage from 4868 614 – b-type ions, derived from 915* - doubly charged ion was detected 915* – singly charged ion was detected too
NH
Proven by MS/MS/MS

When we don’t have a clue…
Prospector will search for non-specified modifications
2 step search:a)what’s there?b)is it
modified?

Characterization of protein populations
• structural information obtained from peptides
→ conclusions about the proteins
• Analysis of the intact proteins yielding extensive structural information
“top-down” approach

Requirements for Top-Down Analysis
• Reasonable amount of protein – pmoles.• Protein compatible with ESIMS.• Relatively simple protein mixture.• High resolution and mass accuracy instrument -
FTMS• Efficient protein fragmentation: ECD > CID
• Good ion statistics and deconvolution software (needs to be able to predict isotope pattern to determine monoisotopic mass).

Histones – Ideal samples?
• Small proteins
• Post-translationally extensively modified: phosphorylation, acetylation, methylation, ubiquitination
• Histone code: PTM state regulates gene transcription ‘on’ and ‘off’ state
Tetrahymena histone H2B variants studied

Strahl and Allis, Nature (2000) 403, 41-45.
`Histone Code' Hypothesis

Tetrahymena histone H2B 12+ envelope
H2B.1
H2B.1+Me
H2B.1+2Me
H2B.1+42
H2B.1+42+O
H2B.1+70
H2B.1+84H2B.2+42
H2B.2+56
H2B.2+70H2B.1+3x42H2B.2+2x42

Electron-capture dissociation spectrum of the H2B mixture
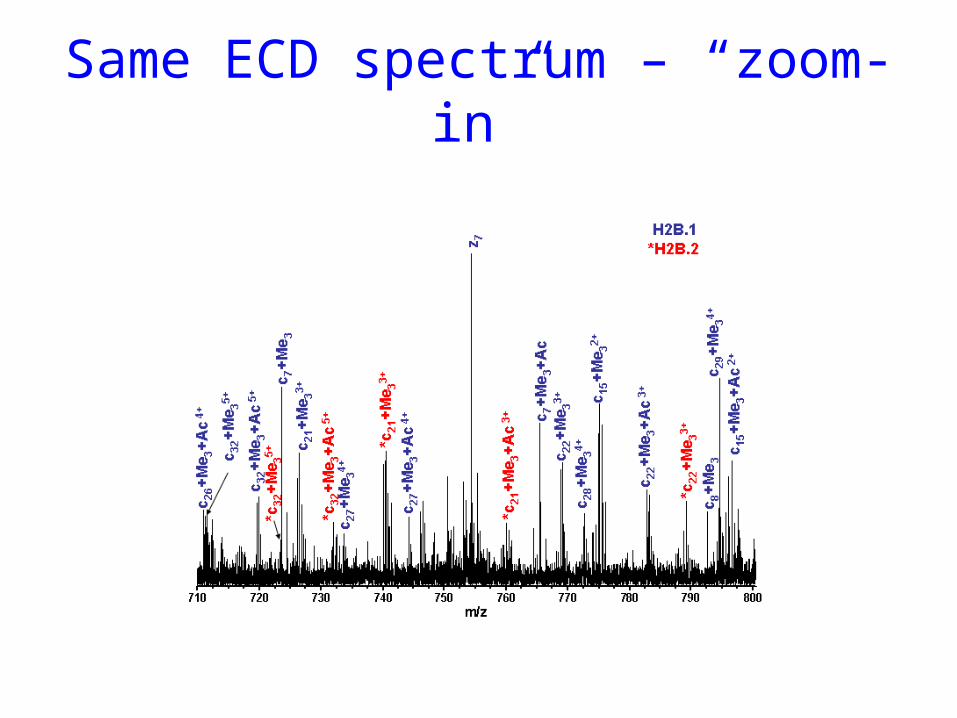
Same ECD spectrum – “zoom-in”
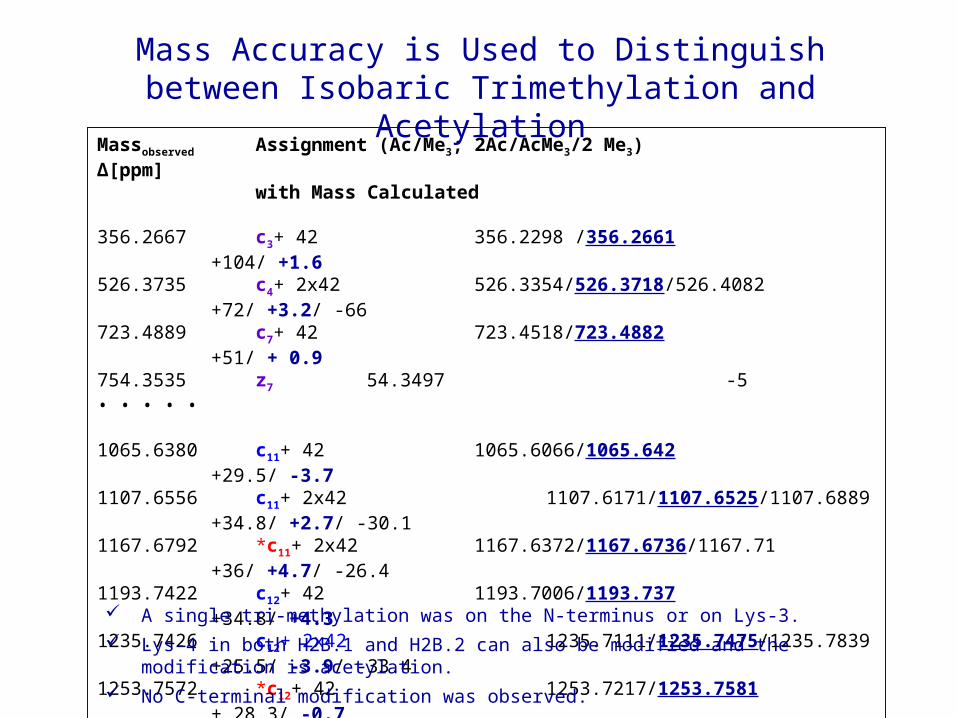
Massobserved Assignment (Ac/Me3; 2Ac/AcMe3/2 Me3) Δ[ppm] with Mass Calculated
356.2667 c3+ 42 356.2298 /356.2661 +104/ +1.6526.3735 c4+ 2x42 526.3354/526.3718/526.4082 +72/ +3.2/ -66 723.4889 c7+ 42 723.4518/723.4882 +51/ + 0.9754.3535 z7 54.3497 -5 • • • • •
1065.6380 c11+ 42 1065.6066/1065.642 +29.5/ -3.7 1107.6556 c11+ 2x42 1107.6171/1107.6525/1107.6889 +34.8/ +2.7/ -30.11167.6792 *c11+ 2x42 1167.6372/1167.6736/1167.71 +36/ +4.7/ -26.41193.7422 c12+ 42 1193.7006/1193.737 +34.8/ +4.31235.7426 c12+ 2x42 1235.7111/1235.7475/1235.7839 +25.5/ -3.9/ -33.41253.7572 *c12+ 42 1253.7217/1253.7581 + 28.3/ -0.7• • • • •
9383.2622 c82+ 42 9383.2877/9383.3241 -2.7/ -6.610563.767 z94 10563.7159 +4.811548.262 z102 11548.324 -5.3
Mass Accuracy is Used to Distinguish between Isobaric Trimethylation and Acetylation
A single tri-methylation was on the N-terminus or on Lys-3.
Lys-4 in both H2B.1 and H2B.2 can also be modified and the modification is acetylation.
No C-terminal modification was observed.

ECD sequence coverage of the two isoforms
1APKKAPAAAA EKKVKKAPTT EKKNKKKRSE TFAIYIFKVL KQVHPDVGIS
51KKAMNIMNSF INDSFERIAL ESSKLVRFNK RRTLSSREVQ TAVKLLLPGE
101LARHAISEGT KAVTKFSSST N
1APKKAPAATT EKKVKKAPTT EKKNKKKRSE TFAIYIFKVL KQVHPDVGIS
51KKAMNIMNSF INDSFERIAL ESSKLVRFNK RRTLSSREVQ TAVKLLLPGE
101LARHAISEGT KAVTKFSSSS N
H2B.1
H2B.2
N-terminus or Lys-3 is trimethylated, Lys-4 is acetylated in both

CID Spectrum of an +84 Da modified H2B.1 Peptide
m/z 490.31 (2+)b5
b8a8b7
a7b6
a5
b9
b4
P
y2
326.2185
PAA
y3
b92+
b82+
a82+
b72+
a72+
MH2+
b62+
a62+
a92+
b52+
a2/AP-28
(a8-NH3)2+
AA-28
b2/PA
K (Ac)
K (Ac)
AAA-28
a52+
(MH-H2O)2+
APK*K* (Me3, Ac) APAAAA
Characteristic K(Ac) immonium ion 126.09 indicates the presence of Lys-acetylation
PK*K*AP
K*K*APAA-28
K*K*APAA
K*K*APAAA
PK*K*AP2+
[K*K*APAA-28]2+
K*K*APAA2+
Internal fragments show the modifications are on the two lysines, instead of the N-terminus.

APxxAPAAAA APwwAPAAAA APwx (or xw) APAAAA
Massobs (Da)
Ions
Masscal (Da)
Error (ppm)
Ions
Masscal (Da)
Error (ppm)
Ions
Masscal (Da)
Error (ppm)
70.0676 P 70.0657 27
115.0867 AA-28 115.0871 -3
126.0925 K(Ac) 126.0919 27
141.1077 a2 141.1028 35
143.0843 AA 143.0821 15
161.0948 y2 161.0926 14
169.1013 b2 or PA 169.0977 21
232.1331 y3 232.1297 15
240.1382 PAA 240.1348 14
552.3975 a5 552.3510 84 a5 552.4237 -47 a5 552.3873 18
580.3822 b5 580.3459 63 b5 580.4186 -63 b5 580.3823 0
578.4262 PxxAP-28 578.3666 103 PwwAP-28 578.4394 -23 PwxAP-28 578.4030 40
580.3968 b5 580.3459 88 b5 580.4186 -38 b5 580.3823 25
606.4080 PxxAP 606.3615 77 PwwAP 606.4343 -43 PwxAP 606.3979 17
649.4450 a6 649.4037 64 a6 649.4765 -49 a6 649.4401 8
677.4436 b6 677.3986 66 b6 677.4714 -41 b6 677.4350 13
720.4550 a7 720.4408 20 a7 720.5136 -81 a7 720.4772 -31
748.4628 b7 748.4357 36 b7 748.5085 -61 b7 748.4721 -12
791.5098 a8 791.4779 40 a8 791.5507 -52 a8 791.5143 -6
819.5088 b8 819.4729 44 b8 819.5456 -45 b8 819.5092 0
Error for Common Ions (AVG ± STD) 20±9
Error for Modification Ions (AVG ± STD) 60±23 49±16 15±10
x—K(Ac); w– K(Me3)
Mass Accuracy of Fragment Ion Series Determines the +84 Da as a Tri-methylation
and an Acetylation

Summary of H2B Posttranslational Characterization
Intact Protein Analysis Proteolytic Digest Analysis
Molecular Weight ECD- FT-ICR
MS Trypsin Asp-N
H2B.1- Me3 (N*-or K3)-Me3 [1-45]- Me3
H2B.2- Me3 (N* or K3)-Me3 [1-45]- Me3
H2B.1- Me3 Ac (N* or K3)-Me3 K4-Ac
N*-Me3 K4-Ac and
(K3K4)- Me3 Ac (K3K4)-Me3 Ac
Most Abundant
H2B.2- Me3 Ac (N* or K3)-Me3 K4-Ac
N*-Me3 K4-Ac and
(K3K4)-Me3 Ac (K3K4)-Me3 Ac
H2B.1 56 Da (K3K4)- Me Ac
H2B.1 70 Da N*-Me2 K4-Ac (K3K4)- Me2 Ac
H2B.2 56 Da (K3K4)- Me Ac
H2B.2 70 Da (K3K4)- Me2 Ac
H2B.1- Me [1-45] Me
H2B.1- Me2 [1-45] Me2
H2B.2- Me [1-45] Me
Less Abundant
H2B.2- Me2 [1-45] Me2
H2B.1/H2B.2-K41-Ac
H2B.1 K111-Me2-3 Least
Abundant H2B.2 K111-Me3/Ac
N* indicate N-terminus of the protein

Modified peptides in the tryptic digestIon detected MH+ calculated Structure [ppm]
418.608 (3+) 1253.758 4K(Ac)APAAAAEKKVK15 +40
438.611 (3+) 1313.779 4K(Ac)APAATTEKKVK15 +29
341.978 (4+) 1364.889 APKK (Ac,Me3)APAAAAEKK13 +44
413.773 (4+) 1652.011 APKK(Ac,Me3)APAATTEKKVK15 +35
Me3APKK(Ac)APAATTEKKVK15
410.269 (4+) 1637.995 Me2APKK(Ac) APAATTEKKVK15 +35
398.770 (4+) 1591.990 APKK(Ac,Me3)APAAAAEKKVK15
Me3APKK (Ac) APAAAAEKKVK15 +42
395.266 (4+) 1577.974 Me2APKK (Ac) APAAAAEKKVK15 +42
487.961 (3+) 1461.843 39VLK(Ac)QVHPDVGISK51 +17
631.668 (3+) 1892.972 HAISEGTK(Me2)AVTKFSSSTN121 +9
104HAISEGTKAVTK(Me3)FSSSSN121
1892.935 104HAISEGTKAVTK(Ac)FSSSSN121 +28
636.323(3+) 1906.950 104HAISEGTK(Me3)AVTKFSSSTN121 +2
Me3 @ N-terminus, Lys-3, Lys-111; Ac @ Lys-4; Lys-41[1-15] peptide always doubly modified!

Why to use both?
“bottom-up” approach: • More sensitive ~300 fmoles injected• Reveals more modificationsBUT• Misses the major protein component!
“top-down” reveals the relative distribution of differently modified populations

Conclusions
•Mass spectrometry is a sensitive, non-biased approach to peptide/protein modification analysis.
•Isolation, MS analysis has to be adjusted to the PTM of interest
•Enrichment methods work much better on large amounts of protein than small.
•For single protein/simple mixture PTM analysis, best approach is to use no enrichment, try to fragment as many components as possible then try to find spectra of modified peptides.
• Peptide-level analysis may not reflect accurately the composition of protein populations