post opening project evaluation - gov.uk...five years after study october 2014 an executive agency...
TRANSCRIPT

1
Safe roads, reliable journeys, informed travellers
Post Opening Project Evaluation
M27 J11-12 Climbing Lanes
Five Years After Study
October 2014
An executive agency of the
Department for Transport
Post Opening Project Evaluation
M27 J11-12 Climbing Lanes Five Years After Study
2
Table of contents Chapter Pages Executive Summary 4 1. Introduction 7
Background 7
Scheme Context 7 Local Network Supply and Demand Changes 10
Post Opening Project Evaluation (POPE) 10
Key Findings from One Year After Study 11
Report Structure 11 2. Traffic Impact Evaluation 12
Introduction 12
Data Sources 12
Background Changes in Traffic 12
Traffic Volume Analysis 14
Journey Time Analysis 20
Forecast vs. Observed Journey Time Savings 23
Journey Time Reliability 23
3. Safety Evaluation 27
Introduction 27
Data Sources 27
Collision Numbers 29
Fatalities and Weighted Injuries 32
Collision Locations 32
Forecast vs. Outturn Collision Numbers 34
Road Safety Audit Stage 4b 35
Collision Rates 35
Statistical Significance 36
Security 36
4. Economy 38 Introduction 38
Scheme Costs 38
Present Value Costs (PVC) 39
Forecast Benefits 40 Journey Time Benefits 40
Collision Benefits 41
Present Value Benefits (PVB) 41 Benefit to Cost Ratio (BCR) 42
Wider Economic Impacts 43
5. Environment 45 Introduction 45
Traffic Forecast Evaluation 48
Five Years After Assessment 49
Noise 49 Local Air Quality 51
Greenhouse Gases 51
Landscape and Townscape 52 Heritage 55
Biodiversity 56
Water Quality and Drainage 57
Post Opening Project Evaluation
M27 J11-12 Climbing Lanes Five Years After Study
3
Physical Fitness 58
Journey Ambience 58
6. Accessibility and Integration 61
Accessibility 61
Option Values 61
Severance 61
Integration 61 Transport Interchange 62
Land Use Policy 62
7. Appraisal Summary Table & Evaluation Summary Table 64 Appraisal Summary Table 64
Evaluation Summary Table 64
8. Conclusions 67
Scheme Specific Objectives 67
Appendices 68
Appendix A. Tables and Figures in this Report 69
Appendix B. Glossary 71
Appendix C. Information requested for Environmental section 73
Appendix D. ES and OYA Comparison Viewpoints 74
D.1. ES Photomontage Comparison Viewpoints 74
D.2. One year after (OYA) vs Five Year After (FYA) Comparison Viewpoints 80

Post Opening Project Evaluation
M27 J11-12 Climbing Lanes Five Years After Study
4
Executive Summary
Scheme Description
The M27 junction 11 to junction 12 Climbing Lanes is a Highways Agency major scheme which was
completed in September 2008. The scheme provided climbing lanes approximately 1.1 miles (1.8 km)
long in each direction, approaching a summit between junction 11 and junction 12 of the M27. The
widened sections of carriageway are now 4 lanes wide, and return to 3 lanes by outside lane merging.
The purpose of the scheme was to separate slow-moving heavy goods vehicles from faster traffic and
to improve vehicle flow on this section of the motorway.
Scheme Objectives Objectives
(from Environmental Statement and public information leaflet) Objective Achieved?
To improve traffic flows and reduce congestion
To minimise environmental impacts
To improve safety
To improve journey times and reliability Partial
Key Findings
Traffic forecasts assumed no additional traffic would be generated as a result of the scheme and
this is consistent with the observed findings. Observed journey times are lower in the westbound
direction compared to pre-scheme and slightly higher in the eastbound direction.
There has been a slight increase in the number of collisions since the scheme opened.
The outturn Benefit-Cost Ratio (BCR) of 4.1 is lower than forecast BCR of 5.5. This is due to the
lower than expected benefits. However the scheme still represents high value for money.
Summary of Scheme Impacts
Traffic
The observed post opening flows are 2% lower than pre-scheme flows along the scheme section.
Traffic flows on other roads in the scheme vicinity has also recorded lower traffic flows (1% to
11%).
Observed traffic is lower than forecast traffic in all three growth scenarios considered for scheme
appraisal.
The proportion of heavy vehicles (over 5.2metres in length) has reduced from 13.5% to 12%
since the scheme opened.
Westbound journey times are about 20 seconds lower compared to pre-scheme and eastbound
journey times are slightly higher than the pre-scheme.
For the westbound direction peak period, the observed time saving is slightly higher than the
forecast time saving and in the eastbound direction the observed time saving is lower than the
forecast.
The scheme has had a moderate beneficial effect on journey time reliability in line with that
forecast in the appraisal and the route stress has reduced from 94% in the pre-scheme to 84%

Post Opening Project Evaluation
M27 J11-12 Climbing Lanes Five Years After Study
5
post opening. Journey time variability has decreased (with the exception of the eastbound
direction in the PM peak).
Safety
After accounting for background trend in collision reduction, there has been a slight increase of
3.4 collisions per annum on the M27 (an increase from 13.8 to 17.2 collisions). This increase is
not statistically significant.
The numbers of fatal and slight collisions have reduced post opening, but there has been an
increase in the number of serious collisions.
Closer examination of the directional distribution of collisions pre-scheme and post opening has
revealed that there is an increase in the frequency of collisions in the eastbound direction with a
cluster of collisions near the eastbound lane merge. In the westbound direction, the number of
collisions has reduced to half than that of pre-scheme.
A reduction in collisions of 1% was forecast for the opening year, but observed data shows that
collisions have increased by 25% compared to pre scheme after accounting for the background
trend in collision reduction (an increase from 13.8 to 17.2 collisions).
Environment
The scheme’s impact on local air quality is better than expected. Greenhouse gas emissions are
lower than forecast and lower than pre-scheme emissions. This is primarily due to lower traffic
levels than forecast.
Establishment of planting is mixed. Lack of topsoil within planting plots has directly resulted in
widespread failures of trees and shrubs. Calcareous grass establishment is in line with
expectations at this stage. However, based on the lack of control of invasive scrub species such
as gorse and bramble, planting areas outside of the scheme boundaries, planted as a part of the
scheme, are not receiving the control required in the Handover Environmental Management Plan.
Due to the increase in retained vegetation during construction, the effects of the tree and shrub
failures are not significant.
No monitoring of the reptile translocation has been undertaken to determine the establishment of
habitat enhancement.
Accessibility and Integration
The scheme’s impact on the Option Values, Severance and Access to the Transport System sub-
objectives of neutral as expected.
This scheme is compatible with regional and national transport polices and most local policies.
Post Opening Project Evaluation
M27 J11-12 Climbing Lanes Five Years After Study
6
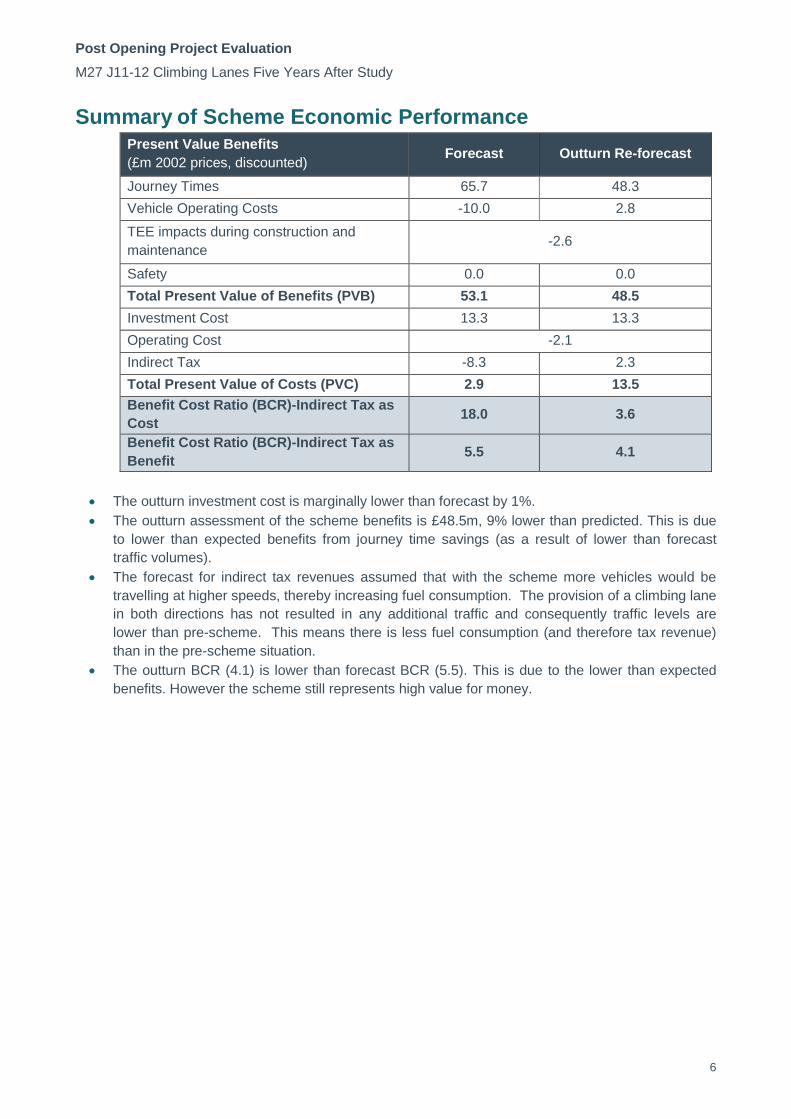
Summary of Scheme Economic Performance
Present Value Benefits
(£m 2002 prices, discounted) Forecast Outturn Re-forecast
Journey Times 65.7 48.3
Vehicle Operating Costs -10.0 2.8
TEE impacts during construction and
maintenance -2.6
Safety 0.0 0.0
Total Present Value of Benefits (PVB) 53.1 48.5
Investment Cost 13.3 13.3
Operating Cost -2.1
Indirect Tax -8.3 2.3
Total Present Value of Costs (PVC) 2.9 13.5
Benefit Cost Ratio (BCR)-Indirect Tax as
Cost 18.0 3.6
Benefit Cost Ratio (BCR)-Indirect Tax as
Benefit 5.5 4.1
The outturn investment cost is marginally lower than forecast by 1%.
The outturn assessment of the scheme benefits is £48.5m, 9% lower than predicted. This is due
to lower than expected benefits from journey time savings (as a result of lower than forecast
traffic volumes).
The forecast for indirect tax revenues assumed that with the scheme more vehicles would be
travelling at higher speeds, thereby increasing fuel consumption. The provision of a climbing lane
in both directions has not resulted in any additional traffic and consequently traffic levels are
lower than pre-scheme. This means there is less fuel consumption (and therefore tax revenue)
than in the pre-scheme situation.
The outturn BCR (4.1) is lower than forecast BCR (5.5). This is due to the lower than expected
benefits. However the scheme still represents high value for money.

Post Opening Project Evaluation
M27 J11-12 Climbing Lanes Five Years After Study
7
1. Introduction Background
1.1 This report represents the Five Years After (FYA) post opening study of the M27 J11-12
Climbing Lanes scheme (hereafter known as ‘the scheme’) which opened in September
2008. The evaluation has been prepared as part of the Highways Agency’s (HA’s) Post
Opening Project Evaluation (POPE) programme. POPE is undertaken one year and five years
after the opening of all major schemes.
1.2 The purpose of the POPE FYA study is to evaluate whether the original objectives of the
scheme have been achieved, and to provide a comparison of predicted and actual scheme
impacts. The study presents an evaluation of the scheme’s impact according to the
Government’s objectives for transport.
1.3 More specifically, the report sets out the following:
A comparison of the ‘before’ and ‘after’ traffic volumes on the M27 J11-12 and other
roads in the vicinity of the scheme;
A comparison of ‘before’ and ‘after’ journey times on the scheme section;
An outline of the changes in collision rates on the scheme following the opening of the
scheme;
A monetised comparison of the predicted and actual impacts of the scheme;
Evaluation of the impact of the scheme upon the environment, more specifically its
impact upon noise, air quality, landscape, biodiversity, heritage and water; and
An assessment of the scheme’s impact on the accessibility and integration objectives.
Scheme Context 1.4 The M27 is a strategic route between Portsmouth and Southampton, and forms part of the
Trans-European Network (TERN) along the south coast of England. The M27 carries the
highest traffic volumes in the south coast corridor. The link between J11 and J12 is situated on
the northern fringe of Portsmouth. At J11, the M27 is joined by A27 while at J12, the M27
motorway ends and becomes A27 and at the south it is joined by M275. The location of the
scheme and its context within the road network is shown in Figure 1.1.
Scheme Objectives
1.5 The objectives of the scheme, as given in the Environmental Statement, July 2006 (ES), were:
To improve traffic flows and relieve congestion; and
To minimise adverse environmental impacts.
1.6 In addition to the above, two other objectives were listed in the Public Exhibition leaflet dated
November 2005:
To improve safety; and
To improve journey times and reliability.
1.7 Regarding safety, the Forecasting & Economics Report found that there would be no accident
saving, and the Appraisal Summary Table (AST) gave a neutral safety assessment.
Scheme Description
1.8 The scheme provided an additional lane approximately 1.1 miles (1.8 km) long, in each
direction on the approach to the crest of a hill. The scheme was designed to separate slow-
moving heavy goods vehicles (HGV) from faster traffic, and improve the general vehicle flow
on this section of motorway by providing extra capacity.
1.9 The M27 between J11 and J12 is 5.25 km in length and, prior to the scheme was a three-lane
dual carriageway motorway. The road rises to a summit approximately mid-way between J11
and J12. The new eastbound climbing lane starts as a continuation of the J11 eastbound on-
slip, and continues for a distance of approximately 1.7 km, terminating about 600 metres east
of the Hill Road overbridge. The return to normal carriageway width here is achieved by the

Post Opening Project Evaluation
M27 J11-12 Climbing Lanes Five Years After Study
8
fourth (outside) lane tapering into the third lane. Therefore traffic in the inside climbing lane
need not change lanes past the end of the scheme.
1.10 The westbound carriageway widening starts about 200 metres west of the Paulsgrove Rail
underbridge, with an additional outside lane, which continues for a distance of about 1.8 km.
This also terminates with a taper from the outside lane.
1.11 To enable the scheme to be built within the existing highway boundary, the other lanes are
reduced slightly in width. There is a 3-metre wide nearside hard shoulder, a 1-metre offside
hard strip, and a 3-metre central reserve. The nearside hard shoulder width is reduced at
bridges. Along the length of the scheme, the nearside (climbing) lane has the standard width
of 3.65 metres.
1.12 The location of the climbing lanes in relation to other features of the road is shown below in
Figure 1.2.
Figure 1.1 – Scheme Location

Post Opening Project Evaluation
M27 J11-12 Climbing Lanes Five Years After Study
9
Figure 1.2 – Scheme Layout
Problems prior to the Scheme
1.13 The gradients leading up to the crest of the hill, approximately midway between the two
junctions, mean there is a high proportion of slow moving traffic, which before the scheme,
caused disruption to the flow and hence congestion. The reduction in overall vehicle speed
caused by the slow-moving heavy vehicles on the uphill gradients, had been causing concern
for a number of years.
1.14 The AST states that the problems that led to the scheme implementation were:
‘ Flows at capacity at peak periods’
‘Slow moving traffic contributing to congestion’
1.15 The scheme’s Environmental Statement (ES) ‘M27 Junctions 11 to 12 Climbing Lanes
Environmental Statement Volume 1’ (July 2006) states that: ‘the area has seen considerable
growth in recent years based around the existing settlements of Southampton, Fareham,
Gosport and Portsmouth. There are high traffic flows on this section of the M27 throughout
most of the day. The gradients... mean there is a high proportion of slow moving traffic. Heavy
goods vehicles and weaving traffic associated with the two junctions are also factors
contributing to congestion and disruption to the flow of traffic on the main carriageway. Growth
in traffic is anticipated in future years which would increase the present day problems ’.
Alternatives of the Scheme Considered
1.16 The scheme’s Non-Technical Summary of the Environmental Statement states that: ‘A
number of alternatives have been considered ... including narrower lane widths and full
standard lane widths. Full standard lanes widths would have required the demolition and
rebuilding of many of the existing bridges and gantries. There are many problems associated
with this including a need to acquire additional land, resulting in significant environmental
impacts and disruption.

Post Opening Project Evaluation
M27 J11-12 Climbing Lanes Five Years After Study
10
History of the Scheme
1.17 The South Coast Corridor Multi-Modal Study (SoCoMMS), which reported in August 2002,
made recommendations for a long term strategy to address transport problems on the South
Coast. One of the key recommendations included was to enhance the current road network’s
overall efficiency, with improvements to the operation of the M27 between J11 and J12.
1.18 A brief history of the principal events involved in the development of the scheme is provided in
Table 1.1.
Table 1.1 – Chronology of the Scheme
Date Event
March 2005 Scheme entered Targeted Programme of Improvements
October-2006 Public Inquiry
February-2007 Decision announcement and Orders
January-2008 Construction starts
September-2008 Scheme opens
June 2010 One Year After study published
Local Network Supply and Demand Changes 1.19 Local road network changes in the locality of the scheme area can sometimes have an impact
on traffic flows, journey times or collisions. Another major scheme that was implemented close
to this scheme on the M27 is the M27 Junction 3 -4 widening. Construction began in February
2008 and opened to traffic in January 2009. This provided one additional lane in each
direction on the M27 between J3 and J4 over a distance of approximately 4.6Km. The pre-
scheme appraisal did not take account of this scheme.
1.20 Tipner Regeneration works commenced in January 2013 just to the south of J12 on the M27
on the M275 into Portsmouth. At the time of writing this report the plans in place are; a new
junction on the M275, a 663 space park and ride facility and development of the area to the
east of the M275. During the work on the junction there will be narrow lanes and reduced
speed limits on the M275.
Post Opening Project Evaluation (POPE) 1.21 The HA is responsible for improving the strategic highway network (motorways and trunk
roads) by delivering the Major Schemes programme. At each key decision stage through the
planning process, schemes are subject to a rigorous appraisal process to provide a
justification for the project’s continued development.
1.22 When submitting a proposal for a major transport scheme, the Department for Transport (DfT)
specifies that an Appraisal Summary Table (AST) is produced which records the degree to
which the DfT’s objectives for transport have been achieved. The contents of the AST allow
judgements to be made about the overall value for money of the scheme. The AST for this
scheme is presented in Table 7.1 on page 65.
1.23 POPE studies are carried out for all Major Schemes to evaluate the strengths and
weaknesses in the techniques used for appraising schemes. This is so that improvements can
be made in the future. For POPE, this is achieved by comparing information collected before
and after the opening of the scheme to traffic, against predictions made during the planning
process. The outturn impacts of a scheme are summarised in an Evaluation Summary Table
(EST) which summarises the extent to which the objectives of a scheme have been achieved.
The EST for this scheme can be found in Table 7.2 on page 66.
1.24 POPE of Major Schemes goes beyond monitoring progress against targets set beforehand.
Instead, it provides the opportunity to study which aspects of the intervention and appraisal
tools used to evaluate it are performing better or worse than expected, and how they can be
made more effective. More specifically the objectives of POPE evaluation reports are as
follows:

Post Opening Project Evaluation
M27 J11-12 Climbing Lanes Five Years After Study
11
Provide a quantitative and qualitative analysis of scheme impacts consistent with
national transport appraisal guidance (WebTAG) and scheme specific objectives.
Identify discrepancies between forecast and outturn impacts.
Explain differences between forecast and outturn impacts.
Identify key issues relating to appraisal methods that will assist the HA in ongoing
improvement of appraisal approaches and tools used for major schemes.
Key Findings from One Year After Study 1.25 The purpose of the FYA study is to verify and study in more detail the emerging trends and
conclusions presented in the OYA study report. The main conclusions made in the M27 J11-
12 Climbing Lanes Scheme OYA report were as follows:
Traffic flows were predicted not to change as a result of the scheme, and this had been
confirmed.
Time savings were better than predicted; hence the economic benefit was better than
predicted.
Accident levels were predicted to be unchanged with the scheme, and this was
confirmed.
The outturn cost of £13.2 million was almost exactly as predicted.
Environmental outcomes were broadly as expected.
Noise and local air quality were generally as expected. Greenhouse gas emissions were
greater than before (due to higher vehicle speeds) but the increase was less than
predicted.
Landscape and biodiversity: mitigation measures were generally in line with
expectations although it was too soon to evaluate the establishment of new planting.
The proposed motorway lighting was reduced, resulting in less light impact than
predicted.
The impacts on heritage, water, physical fitness, and journey ambience were generally
as predicted.
1.26 Overall, it was concluded that the following scheme objectives were met:
Improve traffic flows and reduce congestion
Minimise environmental impacts
Improve journey times and reliability
1.27 It was noted in the OYA report that it was too early to assess the objective to improve safety.
Report Structure 1.28 The remainder of this report is structured as follows:
Chapter 2 – Traffic Impact Evaluation.
Chapter 3 – Safety.
Chapter 4 – Economy.
Chapter 5 – Environment.
Chapter 6 – Accessibility and Integration.
Chapter 7 – Appraisal Summary Table and Evaluation Summary Table.
Chapter 8 – Conclusions.
1.29 There are also a number of appendices listed below as follows:
Appendix A – Tables and Figures in this Report.
Appendix B – Glossary.
Appendix C – Information requested for Environmental section.
Appendix D – ES and OYA Comparison Viewpoints.

Post Opening Project Evaluation
M27 J11-12 Climbing Lanes Five Years After Study
12
2. Traffic Impact Evaluation Introduction
2.1 This section examines traffic data to provide a before, one year after and five years after
opening comparison of traffic flows and journey times on the scheme section and other roads
in the vicinity. The purpose of this evaluation is to understand whether changes in traffic flows
and journey times may be attributable to the scheme.
2.2 This section comprises:
A summary of the sources used to compile data for this evaluation.
A description of national, regional and local background traffic trends to provide context
against which observed changes in actual traffic can be considered.
A detailed comparison of before and one year after and five years after traffic flows on
key routes in the study area likely to be affected by the scheme to provide context
against which observed changes in actual traffic can be considered.
An evaluation of key differences between forecast and outturn impacts of the scheme in
terms of traffic flows and journey times to identify whether traffic flow changes were as
expected or otherwise. Consideration is then given for any differences to identify
whether alternative approaches in scheme appraisal would have lead to a more
accurate forecast.
Data Sources 2.3 This section of the report uses data from several sources to inform the “before” and “after”
analysis of changes in traffic volumes and journey times on key routes that may be attributable
to the scheme. For the purposes of this evaluation study, the main sources of count data
include:
Traffic Count Data
Permanent count data obtained from the TRADs1 database for count locations on the
HA network.
Journey Time Data
Journey times along the M27 J11-J12 have been extracted from the HA’s Journey Time
Database (JTDB). The JTDB contains average journey times and average speeds for
each junction to junction link on the Highways Agency’s core network.
Background Changes in Traffic 2.4 Historically in POPE scheme evaluations, the ‘before’ counts have often been factored to take
account of background traffic growth so that they are directly comparable with the ‘after’
counts. This usually involves the use of National Road Traffic Forecasts (NRTF), with local
adjustments made using National Transport Model (NTM) Local Growth Factors.
2.5 However, in light of the recent economic climate, which has seen widespread reductions in
motor vehicle travel in the United Kingdom (UK) as a whole since 2008, it is no longer deemed
appropriate to use this method of factoring ‘before’ counts to reflect background changes in
traffic. Rather, recent POPE studies have taken a more considered approach in order to
assess changes in the vicinity of the scheme, within the context of national, regional and
locally observed background changes in traffic.
National Trends, Regional and Local Trends
2.6 The Department for Transport (DfT) produces observed annual statistics for all motor vehicles
by local authority2.Data between 2008 (before start of construction) and 2013 (the latest
1 TRADS is the Highways Agency website containing traffic flow data from automatic traffic counts on the HA’s strategic network.
Post Opening Project Evaluation
M27 J11-12 Climbing Lanes Five Years After Study
13
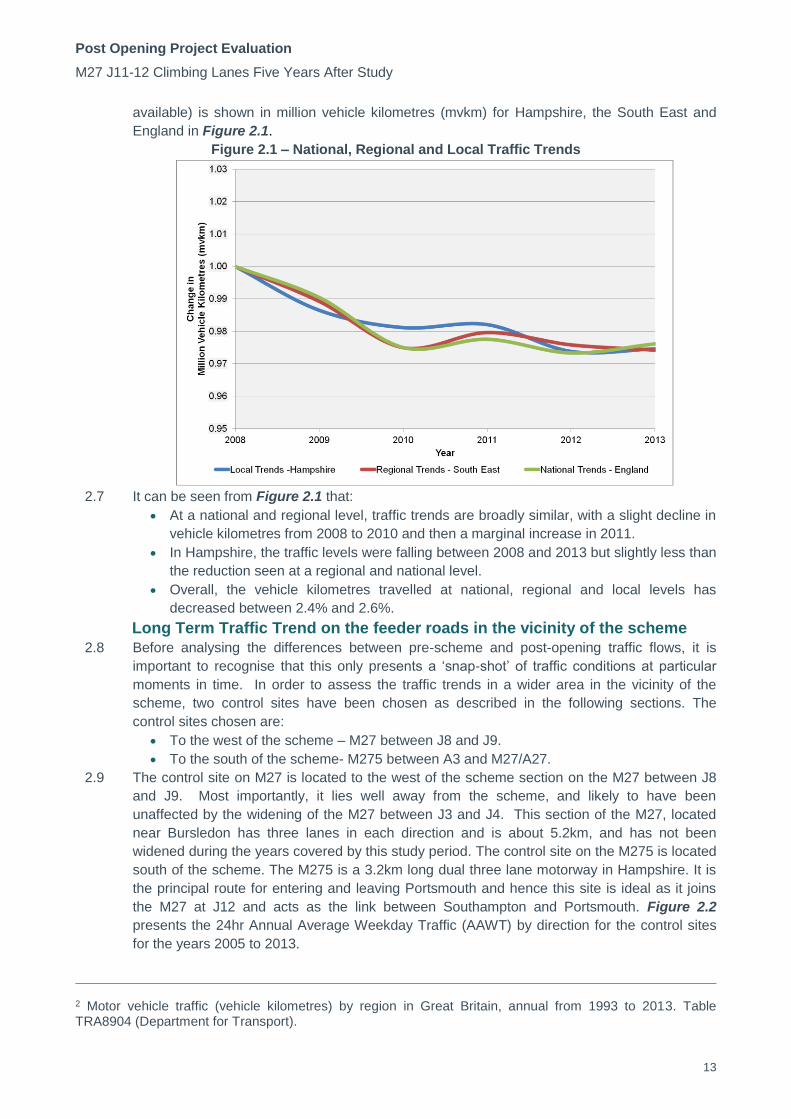
available) is shown in million vehicle kilometres (mvkm) for Hampshire, the South East and
England in Figure 2.1.
Figure 2.1 – National, Regional and Local Traffic Trends
2.7 It can be seen from Figure 2.1 that:
At a national and regional level, traffic trends are broadly similar, with a slight decline in
vehicle kilometres from 2008 to 2010 and then a marginal increase in 2011.
In Hampshire, the traffic levels were falling between 2008 and 2013 but slightly less than
the reduction seen at a regional and national level.
Overall, the vehicle kilometres travelled at national, regional and local levels has
decreased between 2.4% and 2.6%.
Long Term Traffic Trend on the feeder roads in the vicinity of the scheme
2.8 Before analysing the differences between pre-scheme and post-opening traffic flows, it is
important to recognise that this only presents a ‘snap-shot’ of traffic conditions at particular
moments in time. In order to assess the traffic trends in a wider area in the vicinity of the
scheme, two control sites have been chosen as described in the following sections. The
control sites chosen are:
To the west of the scheme – M27 between J8 and J9.
To the south of the scheme- M275 between A3 and M27/A27.
2.9 The control site on M27 is located to the west of the scheme section on the M27 between J8
and J9. Most importantly, it lies well away from the scheme, and likely to have been
unaffected by the widening of the M27 between J3 and J4. This section of the M27, located
near Bursledon has three lanes in each direction and is about 5.2km, and has not been
widened during the years covered by this study period. The control site on the M275 is located
south of the scheme. The M275 is a 3.2km long dual three lane motorway in Hampshire. It is
the principal route for entering and leaving Portsmouth and hence this site is ideal as it joins
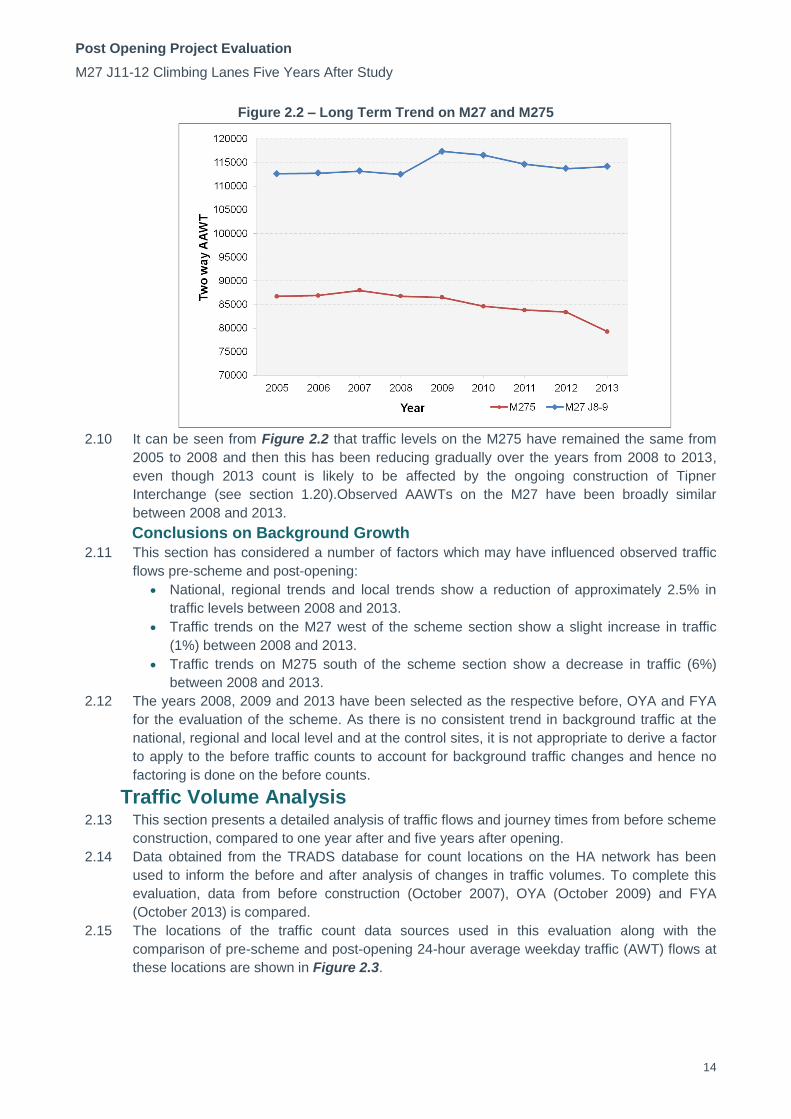
the M27 at J12 and acts as the link between Southampton and Portsmouth. Figure 2.2
presents the 24hr Annual Average Weekday Traffic (AAWT) by direction for the control sites
for the years 2005 to 2013.
2 Motor vehicle traffic (vehicle kilometres) by region in Great Britain, annual from 1993 to 2013. Table TRA8904 (Department for Transport).
Post Opening Project Evaluation
M27 J11-12 Climbing Lanes Five Years After Study
14
Figure 2.2 – Long Term Trend on M27 and M275
2.10 It can be seen from Figure 2.2 that traffic levels on the M275 have remained the same from
2005 to 2008 and then this has been reducing gradually over the years from 2008 to 2013,
even though 2013 count is likely to be affected by the ongoing construction of Tipner
Interchange (see section 1.20).Observed AAWTs on the M27 have been broadly similar
between 2008 and 2013.
Conclusions on Background Growth
2.11 This section has considered a number of factors which may have influenced observed traffic
flows pre-scheme and post-opening:
National, regional trends and local trends show a reduction of approximately 2.5% in
traffic levels between 2008 and 2013.
Traffic trends on the M27 west of the scheme section show a slight increase in traffic
(1%) between 2008 and 2013.
Traffic trends on M275 south of the scheme section show a decrease in traffic (6%)
between 2008 and 2013.
2.12 The years 2008, 2009 and 2013 have been selected as the respective before, OYA and FYA
for the evaluation of the scheme. As there is no consistent trend in background traffic at the
national, regional and local level and at the control sites, it is not appropriate to derive a factor
to apply to the before traffic counts to account for background traffic changes and hence no
factoring is done on the before counts.
Traffic Volume Analysis 2.13 This section presents a detailed analysis of traffic flows and journey times from before scheme
construction, compared to one year after and five years after opening.
2.14 Data obtained from the TRADS database for count locations on the HA network has been
used to inform the before and after analysis of changes in traffic volumes. To complete this
evaluation, data from before construction (October 2007), OYA (October 2009) and FYA
(October 2013) is compared.
2.15 The locations of the traffic count data sources used in this evaluation along with the
comparison of pre-scheme and post-opening 24-hour average weekday traffic (AWT) flows at
these locations are shown in Figure 2.3.

Post Opening Project Evaluation
M27 J11-12 Climbing Lanes Five Years After Study
15
Figure 2.3 – Comparison of Pre-scheme and Post-opening Two-way AWT

Post Opening Project Evaluation
M27 J11-12 Climbing Lanes Five Years After Study
16
2.16 The key points regarding changes in Average Weekday Traffic(AWT) along the scheme
section, other motorways and local roads in the study area from Figure 2.3 are:
Along the scheme section, traffic is lower than pre-scheme levels for both One Year
After (OYA) and Five Years After (FYA) scheme opening.
There is a marginal growth in traffic between OYA and FYA for the M27 scheme section.
The traffic levels on the M27 between J10 and J11 (west of scheme section) has also
seen a reduction compared to pre-scheme levels and a growth in traffic between OYA
and FYA in line with the trend observed along the scheme section.
East of the scheme section on the M27 between J12 and A3, at the FYA traffic has
grown by 4% compared to pre-scheme levels. At OYA, traffic volumes at this section
reduced by 2%.
Before scheme construction, traffic on the A27 east of the scheme was slightly higher
than the traffic levels observed post opening. Traffic flows between OYA and FYA are
similar.
Traffic levels on the A27 link to M27 J11 has decreased post scheme opening, with
flows in 2013 being 6% below that observed pre scheme.
On the M275, south of the scheme section, traffic has reduced. The decline observed in
percentage terms at OYA is 2% and at FYA is 11%. Since this reduction is greater than
the reduction seen elsewhere in the study area, it is reasonable to assume that traffic
management associated with the ongoing construction of Tipner interchange which
commenced in January 2013 (see Section 1.20) could be the contributory factor rather
than the impact of the scheme.
2.17 Overall it can be seen from the key points above that the traffic levels using the scheme
section have reduced since 2007. All the roads in the vicinity of the scheme section and which
act as feeder link to the scheme section have also recorded reductions to a similar extent
except east of the scheme section. The traffic flow changes at all locations considered is
within the range of +/-5% except for M275. The scheme opening coincided with what is widely
regarded as the economic recession in 2008.Hence the reduction in traffic levels post opening
is likely to be a reflection of the general downturn in traffic levels following the recession as
they are broadly in line with the reductions seen at the national, regional and local level as
discussed in section 2.11 rather than being an impact of the scheme itself.
Heavy Goods Vehicles (HGV)
2.18 Slow moving HGV’s along the scheme section was a key contributory factor to the need for
the scheme. At locations where classified data is available, it is possible to assess the
proportion and number of HGVs. By looking at this information for 2007, 2009 and 2013, it is
possible to determine if there has been a change in the vehicle composition following the
scheme’s introduction.
2.19 Table 2.1 shows a comparison for the proportion of vehicles greater than 5.2m in length. This
is used as a proxy for HGV measurements as data is available on a like-for-like basis in before
and post opening. Classified count data has been obtained from the Highways Agency
TRADS database and presented in the table below.
Table 2.1 – HGV flows on an average weekday
Map Reference Description Before (2007) OYA
(2009) FYA (2013)
1 M27 between J10-J11 17,000
(14.5%)
15,400
(13.3%)
15,300
(13.1%)
2 M27 between J11-J12 17,800
(13.5%)
14,800
(11.6%)
15,300
(12.0%)
3 M27 between J12 & A3 10,800
(16.0%)
9,900
(15.0%)
11,100
(15.7%)
4 A27 East of A3 16,500 14,800 16,700
Post Opening Project Evaluation
M27 J11-12 Climbing Lanes Five Years After Study
17
(13.0%) (11.7%) (13.3%)
6 M275 South of M27 5,800
(8.4%)
5,600
(8.2%)
5,500
(8.8%)
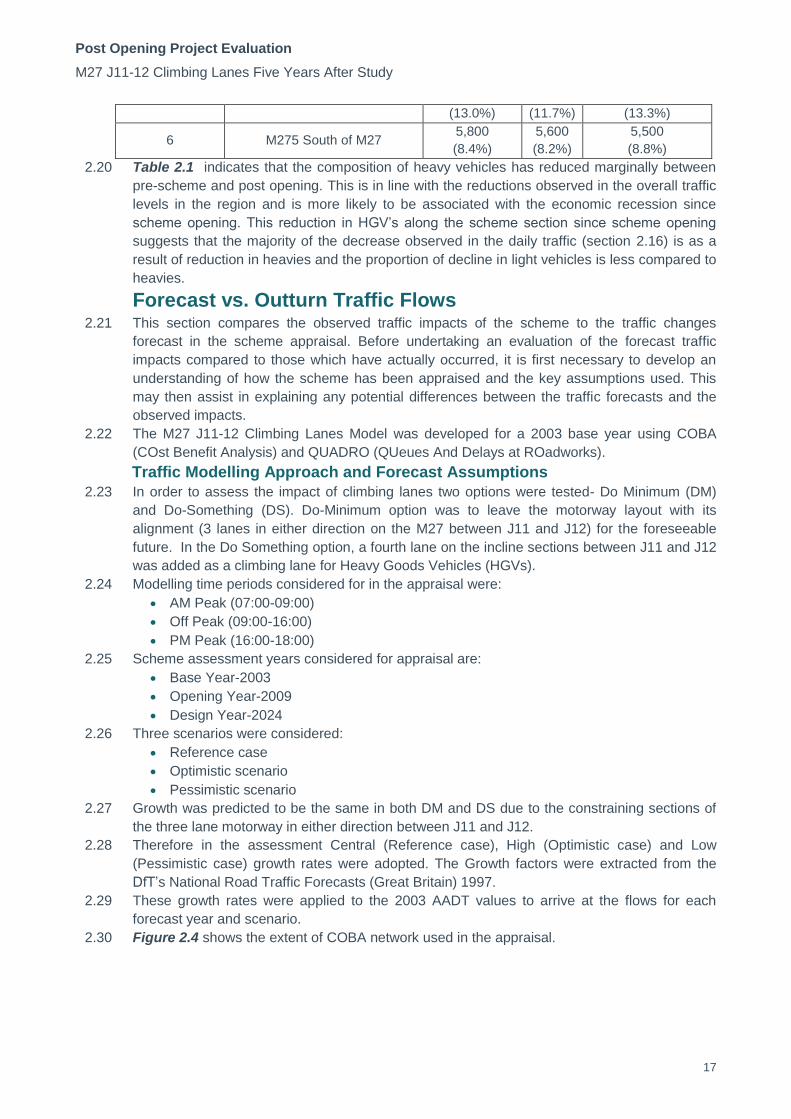
2.20 Table 2.1 indicates that the composition of heavy vehicles has reduced marginally between
pre-scheme and post opening. This is in line with the reductions observed in the overall traffic
levels in the region and is more likely to be associated with the economic recession since
scheme opening. This reduction in HGV’s along the scheme section since scheme opening
suggests that the majority of the decrease observed in the daily traffic (section 2.16) is as a
result of reduction in heavies and the proportion of decline in light vehicles is less compared to
heavies.
Forecast vs. Outturn Traffic Flows 2.21 This section compares the observed traffic impacts of the scheme to the traffic changes
forecast in the scheme appraisal. Before undertaking an evaluation of the forecast traffic
impacts compared to those which have actually occurred, it is first necessary to develop an
understanding of how the scheme has been appraised and the key assumptions used. This
may then assist in explaining any potential differences between the traffic forecasts and the
observed impacts.
2.22 The M27 J11-12 Climbing Lanes Model was developed for a 2003 base year using COBA
(COst Benefit Analysis) and QUADRO (QUeues And Delays at ROadworks).
Traffic Modelling Approach and Forecast Assumptions
2.23 In order to assess the impact of climbing lanes two options were tested- Do Minimum (DM)
and Do-Something (DS). Do-Minimum option was to leave the motorway layout with its
alignment (3 lanes in either direction on the M27 between J11 and J12) for the foreseeable
future. In the Do Something option, a fourth lane on the incline sections between J11 and J12
was added as a climbing lane for Heavy Goods Vehicles (HGVs).
2.24 Modelling time periods considered for in the appraisal were:
AM Peak (07:00-09:00)
Off Peak (09:00-16:00)
PM Peak (16:00-18:00)
2.25 Scheme assessment years considered for appraisal are:
Base Year-2003
Opening Year-2009
Design Year-2024
2.26 Three scenarios were considered:
Reference case
Optimistic scenario
Pessimistic scenario
2.27 Growth was predicted to be the same in both DM and DS due to the constraining sections of
the three lane motorway in either direction between J11 and J12.
2.28 Therefore in the assessment Central (Reference case), High (Optimistic case) and Low
(Pessimistic case) growth rates were adopted. The Growth factors were extracted from the
DfT’s National Road Traffic Forecasts (Great Britain) 1997.
2.29 These growth rates were applied to the 2003 AADT values to arrive at the flows for each
forecast year and scenario.
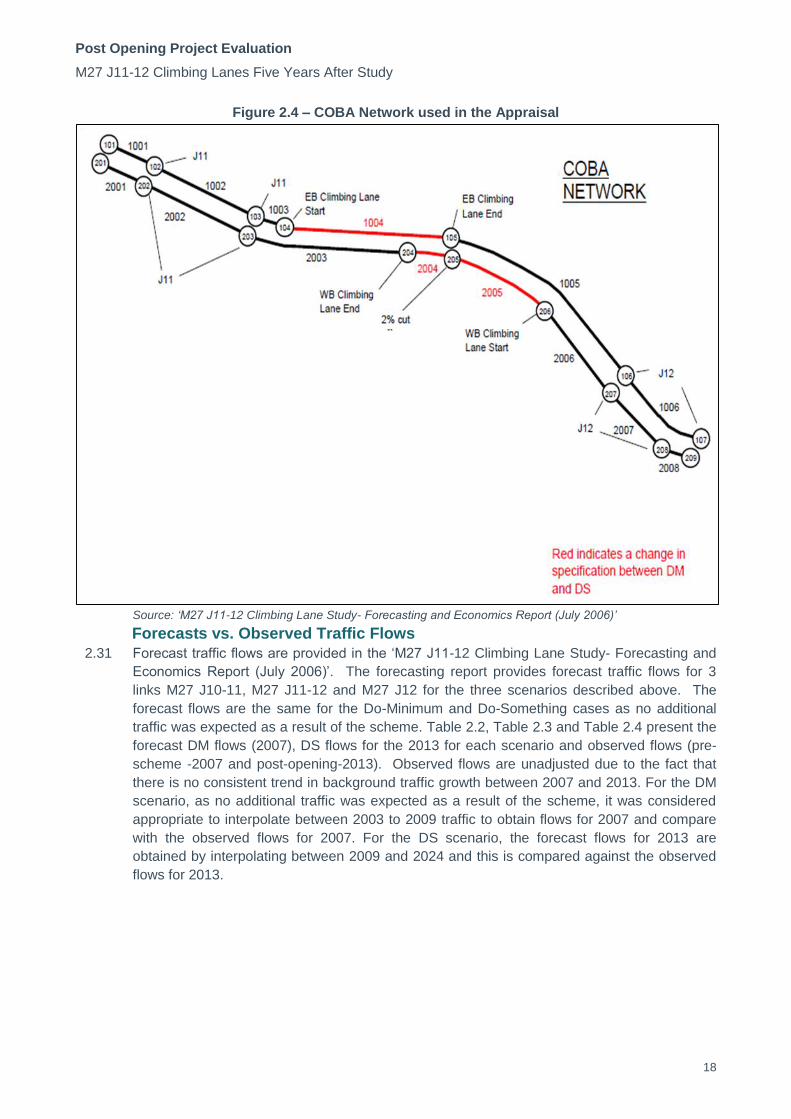
2.30 Figure 2.4 shows the extent of COBA network used in the appraisal.
Post Opening Project Evaluation
M27 J11-12 Climbing Lanes Five Years After Study
18
Figure 2.4 – COBA Network used in the Appraisal
Source: ‘M27 J11-12 Climbing Lane Study- Forecasting and Economics Report (July 2006)’
Forecasts vs. Observed Traffic Flows
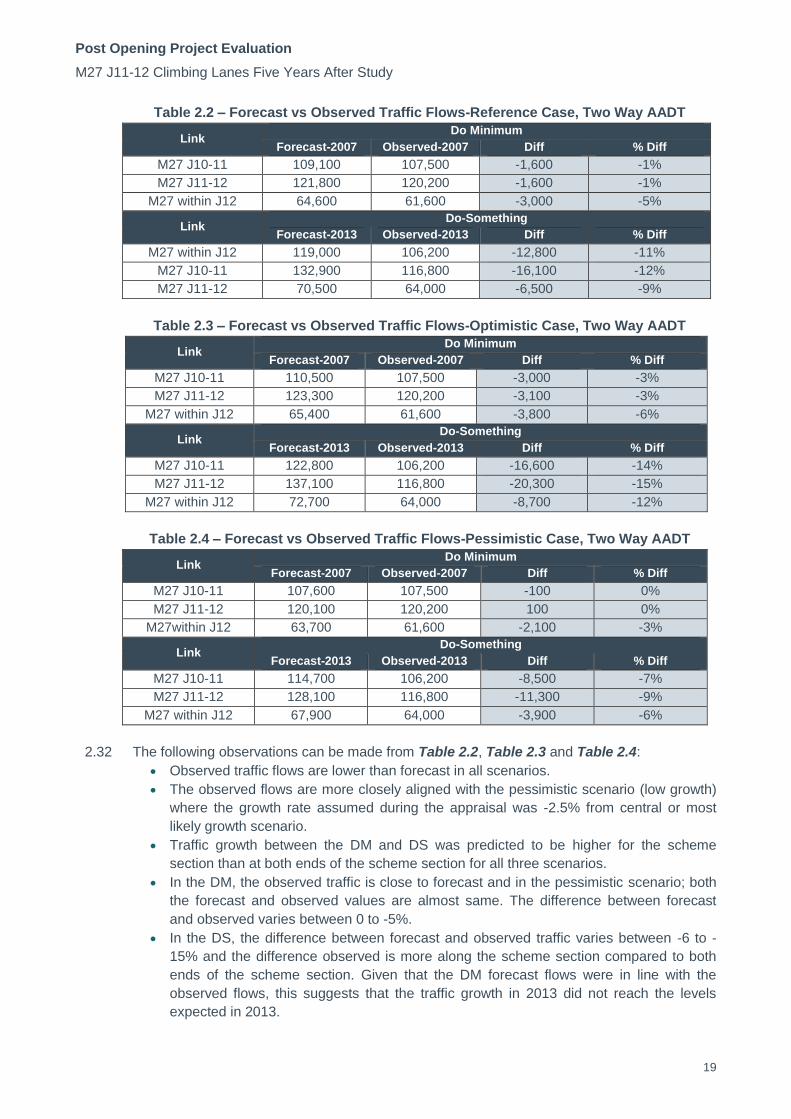
2.31 Forecast traffic flows are provided in the ‘M27 J11-12 Climbing Lane Study- Forecasting and
Economics Report (July 2006)’. The forecasting report provides forecast traffic flows for 3
links M27 J10-11, M27 J11-12 and M27 J12 for the three scenarios described above. The
forecast flows are the same for the Do-Minimum and Do-Something cases as no additional
traffic was expected as a result of the scheme. Table 2.2, Table 2.3 and Table 2.4 present the
forecast DM flows (2007), DS flows for the 2013 for each scenario and observed flows (pre-
scheme -2007 and post-opening-2013). Observed flows are unadjusted due to the fact that
there is no consistent trend in background traffic growth between 2007 and 2013. For the DM
scenario, as no additional traffic was expected as a result of the scheme, it was considered
appropriate to interpolate between 2003 to 2009 traffic to obtain flows for 2007 and compare
with the observed flows for 2007. For the DS scenario, the forecast flows for 2013 are
obtained by interpolating between 2009 and 2024 and this is compared against the observed
flows for 2013.
Post Opening Project Evaluation
M27 J11-12 Climbing Lanes Five Years After Study
19
Table 2.2 – Forecast vs Observed Traffic Flows-Reference Case, Two Way AADT
Link Do Minimum
Forecast-2007 Observed-2007 Diff % Diff
M27 J10-11 109,100 107,500 -1,600 -1%
M27 J11-12 121,800 120,200 -1,600 -1%
M27 within J12 64,600 61,600 -3,000 -5%
Link Do-Something
Forecast-2013 Observed-2013 Diff % Diff
M27 within J12 119,000 106,200 -12,800 -11%
M27 J10-11 132,900 116,800 -16,100 -12%
M27 J11-12 70,500 64,000 -6,500 -9%
Table 2.3 – Forecast vs Observed Traffic Flows-Optimistic Case, Two Way AADT
Link Do Minimum
Forecast-2007 Observed-2007 Diff % Diff
M27 J10-11 110,500 107,500 -3,000 -3%
M27 J11-12 123,300 120,200 -3,100 -3%
M27 within J12 65,400 61,600 -3,800 -6%
Link Do-Something
Forecast-2013 Observed-2013 Diff % Diff
M27 J10-11 122,800 106,200 -16,600 -14%
M27 J11-12 137,100 116,800 -20,300 -15%
M27 within J12 72,700 64,000 -8,700 -12%
Table 2.4 – Forecast vs Observed Traffic Flows-Pessimistic Case, Two Way AADT
Link Do Minimum
Forecast-2007 Observed-2007 Diff % Diff
M27 J10-11 107,600 107,500 -100 0%
M27 J11-12 120,100 120,200 100 0%
M27within J12 63,700 61,600 -2,100 -3%
Link Do-Something
Forecast-2013 Observed-2013 Diff % Diff
M27 J10-11 114,700 106,200 -8,500 -7%
M27 J11-12 128,100 116,800 -11,300 -9%
M27 within J12 67,900 64,000 -3,900 -6%
2.32 The following observations can be made from Table 2.2, Table 2.3 and Table 2.4:
Observed traffic flows are lower than forecast in all scenarios.
The observed flows are more closely aligned with the pessimistic scenario (low growth)
where the growth rate assumed during the appraisal was -2.5% from central or most
likely growth scenario.
Traffic growth between the DM and DS was predicted to be higher for the scheme
section than at both ends of the scheme section for all three scenarios.
In the DM, the observed traffic is close to forecast and in the pessimistic scenario; both
the forecast and observed values are almost same. The difference between forecast
and observed varies between 0 to -5%.
In the DS, the difference between forecast and observed traffic varies between -6 to -
15% and the difference observed is more along the scheme section compared to both
ends of the scheme section. Given that the DM forecast flows were in line with the
observed flows, this suggests that the traffic growth in 2013 did not reach the levels
expected in 2013.
Post Opening Project Evaluation
M27 J11-12 Climbing Lanes Five Years After Study
20
The scheme forecasts assumed no additional traffic generated as a result of the scheme
and this is consistent with the observed.
2.33 In summary, the observed traffic flows are consistently lower than the forecasts and the
difference is less pronounced in the pessimistic scenario where the growth rate expected was
less than the central growth rate at the time of appraisal. The model was built using 2003 data
and the observed growth rate for appraisal was considered from 2001. The growth rate for
appraisal was considered from TEMPRO and NRTF and traffic growth was higher than has
been observed. The period covered by this study has witnessed an economic recession (see
section 2.11) which has coincided with a wide spread reduction in traffic levels. This could be
the possible reason for difference between forecasts and observed.
Journey Time Analysis
2.34 This section considers the impact on journey times following the scheme’s implementation.
Pre-scheme journey times along the M27 J11-12 route are compared with post-opening
journey times for both directions. The journey time analysis is split into three components:
Analysis of pre and post-scheme journey time differences along the scheme.
A comparison of forecast and outturn journey times along the scheme.
A comparison of journey time reliability pre-scheme and post-opening.
2.35 The journey time periods assessed align with the modelled journey times in the Traffic
Forecasting Report, and are as follows:
Weekdays AM peak (07:00 to 09:00).
Weekdays inter-peak period (09:00 to 16:00).
Weekdays PM peak (16:00 to 18:00).
Weekday average journey time (Monday to Friday-07:00 to 19:00)
Weekend average journey time (Saturday and Sunday-07:00 to 19:00)
2.36 The calendar periods used in this FYA study are:
Before: November 2006 to October 2007.
OYA: November 2008 to October 2009.
FYA: November 2012 to October 2013.
Observed Journey Times
2.37 Observed journey times have been taken from the HA’s Journey Time Database (JTDB). The
JTDB records average journey times between sections of trunk roads in England. Data was
extracted for pre- and post- scheme journey times on link M27 J11-12 and used to analyse the
impact of the scheme on journey times. Table 2.5 gives the direction wise pre-scheme and
post-opening journey time along the scheme section and the observed savings in journey
time.
Scheme Objective: to improve traffic flow and reduce congestion

Post Opening Project Evaluation
M27 J11-12 Climbing Lanes Five Years After Study
21
Table 2.5– Average Journey times and savings on the M27 J11-J12 (Seconds)
AM IP PM Weekday Weekend
Eastbound
Before 339 258 272 278 246
OYA 316 256 280 274 245
FYA 347 263 284 287 251
Savings -8 -5 -12 -9 -5
% Change -2% -2% -5% -3% -2%
Westbound
Before 293 253 331 278 240
OYA 266 252 299 265 242
FYA 272 251 304 267 243
Savings 21 2 27 11 -2
% Change 7% 1% 8% 4% -1%
2.38 The results presented in Table 2.5 reveal that:
Journey times on the M27 J11-12 westbound have decreased at FYA than pre-scheme
levels and slightly higher than the OYA. In the weekend, the increase seen is negligible.
In the AM and PM peak period, the average journey time is faster by 21 and 27 seconds
respectively.
In the eastbound direction, journey times have increased slightly compared to pre-
scheme levels for all time periods considered.
Eastbound journey time is higher than the westbound journey time in the AM peak and
vice versa in the PM peak.
2.39 The results presented in the previous section provides a brief summary of average journey
time changes before and after scheme opening for different time periods. This section will now
analyse average weekday journey time results for the M27 corridor, between J11 and J12, in
order to understand the hourly variation on journey times over a 24hour period.

Post Opening Project Evaluation
M27 J11-12 Climbing Lanes Five Years After Study
22
Figure 2.5 – M27 J11-12 Eastbound Average Weekday Journey Time Profile
Figure 2.6 – M27 J11-12 Westbound Average Weekday Journey Time Profile
2.40 The results presented in Figure 2.5 and Figure 2.6 reveal that:
In the eastbound direction, journey times have increased slightly compared to pre-
scheme levels for all time periods considered, but the trend observed in FYA is
consistent with the before.
Average weekday journey time at FYA is consistently lower than pre-scheme levels in
the westbound direction.
Overnight journey times are relatively unchanged.
OYA journey times are lower than both pre-scheme and FYA average journey times
except for the eastbound PM peak.

Post Opening Project Evaluation
M27 J11-12 Climbing Lanes Five Years After Study
23
Journey times are highest in the AM peak in the eastbound direction and in the PM peak
in the westbound direction and this trend continues post scheme opening.
Journey time variability has improved for westbound traffic post opening, although both
the AM and PM peaks still show longer journey times than during the interpeak.
Journey time variability is an issue in the eastbound direction with sharp peak during the
AM peak period and the average time is nearly double as the interpeak period.
Forecast vs. Observed Journey Time Savings 2.41 The forecasting report or the AST gave no indication of the expected journey time savings.
Modelled journey times (for the opening year of 2009) for DM and DS scenarios for the length
of the scheme section have been extracted from the original COBA output files.
Table 2.6 – Forecast vs. Observed Journey Times (Seconds)
Direction Time
Period
Forecast Observed
DM DS Saving Without
Scheme
With
Scheme Saving
Eastbound Offpeak 241 241 0 (0%) 249 260 -11 (4%)
Peak 306 291 15 (-5%) 295 306 -11 (3%)
Westbound Offpeak 245 242 3 (-1%) 242 245 -3 (1%)
Peak 306 291 15 (-5%) 299 280 19 (-6%)
2.42 The key points from Table 2.6 are:
Time savings were forecast to arise mainly during the peak periods.
For the westbound direction peak period, the observed saving is slightly higher than the
forecast saving and in the eastbound direction the observed saving is lower than the
forecast in the peak periods.
The appraisal forecast the same savings for both eastbound and westbound directions,
however the observed trend for each direction shows differences.
Off peak savings were expected to be negligible as a result of the scheme, but observed
information suggests there has been a slight increase in journey times for eastbound
traffic.
Forecast peak period journey times for Do Minimum were higher than the observed pre-
scheme journey times and for Do Something forecast journey times were lower than
observed. This explains the lesser savings in observed than forecast.
Journey Time Reliability
2.43 WebTAG states that reliability is a sub-objective of the economic assessment of a scheme
and refers to the impact of the scheme on improving journey time variability. It also states that
assessment of reliability is a rapidly developing area. As such the following sections present
the reliability impact of the scheme based on the route stress method and the changes in the
standard deviation of journey times.
Assessment of Reliability using Route Stress
Appraisal
2.44 The scheme AST states that the scheme impact would be that ‘journey time reliability likely to
be improved’. Overall the AST scored the reliability sub objective as Moderate Beneficial.
2.45 A reliability assessment for each growth scenario is provided in the ‘M27 J11-12 Climbing
Lane Study- Forecasting and Economics Report (July 2006)’. A stress based approach was
used to predict the scheme’s impact on reliability. The stress factor for a particular link is
defined as the ratio of the Annual Average Daily Traffic flow to the Congestion Reference Flow
Scheme Objective: to improve reliability
Post Opening Project Evaluation
M27 J11-12 Climbing Lanes Five Years After Study
24
(DMRB3 ). In all growth scenarios and forecast years, the overall impact of the scheme with
respect to journey time variability was assessed to be moderate beneficial. Forecasting report
also mentions that the limitations of using this stress based approach is that it does not
estimate stress on the link on non-weekdays and non consideration of variables that would
influence capacity such as hilliness, bendiness or the operation of junctions.
Evaluation
2.46 In order to make a comparison with the forecasts, a stress based approach (DMRB) has been
used to assess the reliability impacts of the scheme. The capacity of a link depends on the
number of lanes. In this case the improvement has given 4 lanes in each direction where there
are climbing lanes, and there remain 3 lanes where no climbing lanes. The prediction was
based on a value of 3.5 lanes in each direction for the Do-Something case, because
throughout the link there are a total of 7 lanes in both directions. The same value is therefore
used in this POPE evaluation.
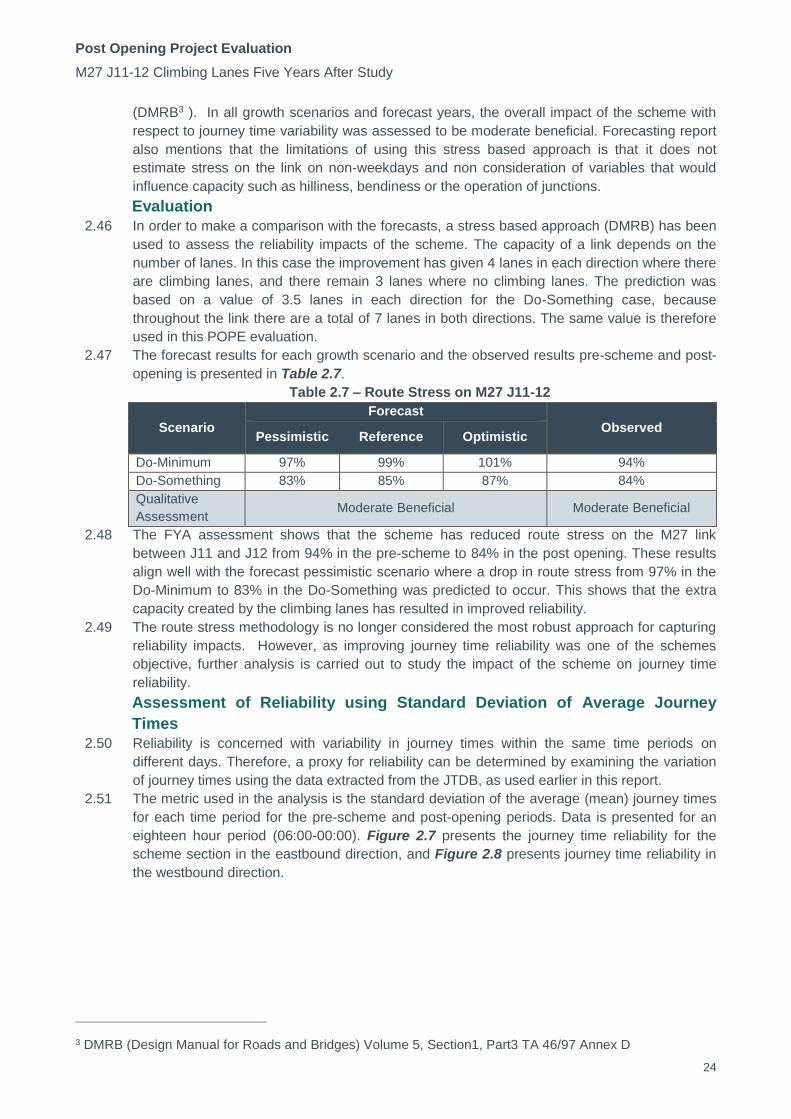
2.47 The forecast results for each growth scenario and the observed results pre-scheme and post-
opening is presented in Table 2.7.
Table 2.7 – Route Stress on M27 J11-12
Scenario
Forecast
Observed Pessimistic Reference Optimistic
Do-Minimum 97% 99% 101% 94%
Do-Something 83% 85% 87% 84%
Qualitative
Assessment Moderate Beneficial Moderate Beneficial
2.48 The FYA assessment shows that the scheme has reduced route stress on the M27 link
between J11 and J12 from 94% in the pre-scheme to 84% in the post opening. These results
align well with the forecast pessimistic scenario where a drop in route stress from 97% in the
Do-Minimum to 83% in the Do-Something was predicted to occur. This shows that the extra
capacity created by the climbing lanes has resulted in improved reliability.
2.49 The route stress methodology is no longer considered the most robust approach for capturing
reliability impacts. However, as improving journey time reliability was one of the schemes
objective, further analysis is carried out to study the impact of the scheme on journey time
reliability.
Assessment of Reliability using Standard Deviation of Average Journey
Times
2.50 Reliability is concerned with variability in journey times within the same time periods on
different days. Therefore, a proxy for reliability can be determined by examining the variation
of journey times using the data extracted from the JTDB, as used earlier in this report.
2.51 The metric used in the analysis is the standard deviation of the average (mean) journey times
for each time period for the pre-scheme and post-opening periods. Data is presented for an
eighteen hour period (06:00-00:00). Figure 2.7 presents the journey time reliability for the
scheme section in the eastbound direction, and Figure 2.8 presents journey time reliability in
the westbound direction.
3 DMRB (Design Manual for Roads and Bridges) Volume 5, Section1, Part3 TA 46/97 Annex D

Post Opening Project Evaluation
M27 J11-12 Climbing Lanes Five Years After Study
25
Figure 2.7 – M27 J11-12 Eastbound Journey Time Reliability
Figure 2.8 – M27 J11-12 Westbound Journey Time Reliability
2.52 The results presented in Figure 2.7 and Figure 2.8 based on the spread of average journey
times reveal that:
In the pre-scheme there were high fluctuations in the journey times in both directions
and this has improved post scheme opening.
In the westbound direction, journey times were varying with three peaks in the AM, IP
and PM. Post scheme opening, this has reduced considerably and in the Interpeak, the
curve is flat indicating that the journey time is consistent.
In the eastbound direction, journey time reliability has worsened during the PM peak
period. The results for eastbound direction show that journey time reliability in the PM
peak remains an issue between OYA and FYA.
Post Opening Project Evaluation
M27 J11-12 Climbing Lanes Five Years After Study
26
Overall journey time reliability has improved with fewer peaks during the day indicating
that the scheme has catered to the objective of improving journey time reliability in the
longer term.
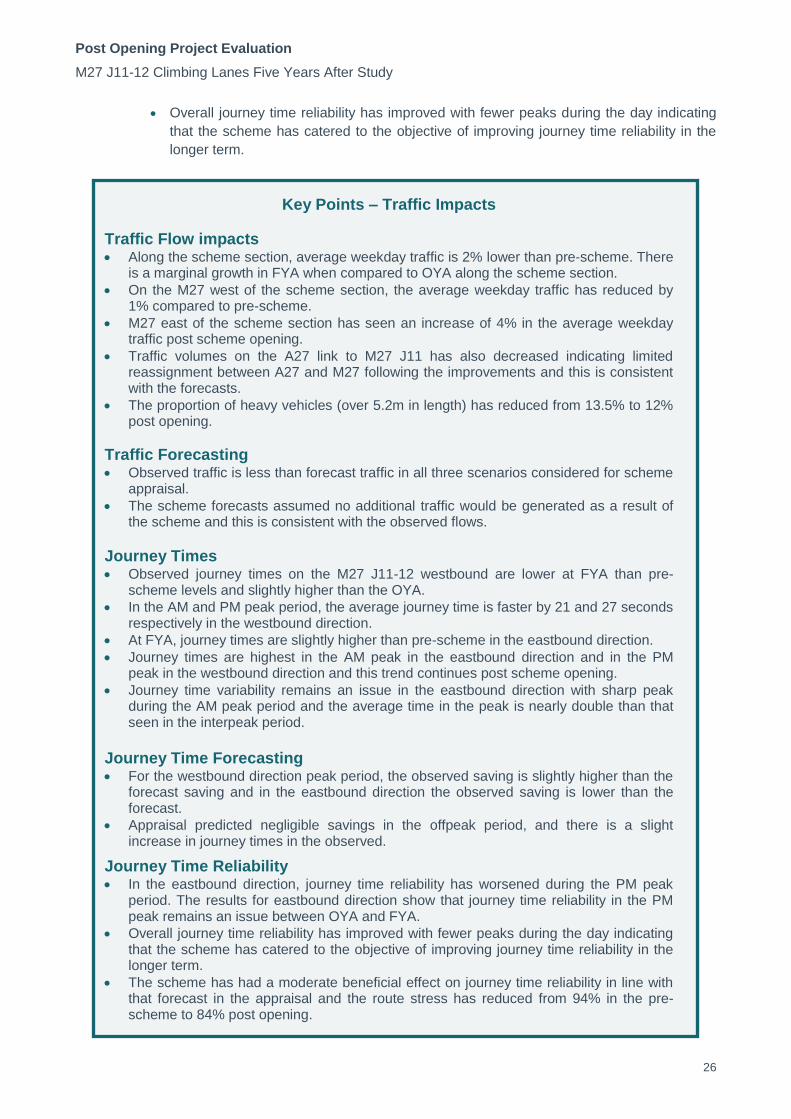
Key Points – Traffic Impacts
Traffic Flow impacts Along the scheme section, average weekday traffic is 2% lower than pre-scheme. There
is a marginal growth in FYA when compared to OYA along the scheme section.
On the M27 west of the scheme section, the average weekday traffic has reduced by 1% compared to pre-scheme.
M27 east of the scheme section has seen an increase of 4% in the average weekday traffic post scheme opening.
Traffic volumes on the A27 link to M27 J11 has also decreased indicating limited reassignment between A27 and M27 following the improvements and this is consistent with the forecasts.
The proportion of heavy vehicles (over 5.2m in length) has reduced from 13.5% to 12% post opening.
Traffic Forecasting Observed traffic is less than forecast traffic in all three scenarios considered for scheme
appraisal.
The scheme forecasts assumed no additional traffic would be generated as a result of the scheme and this is consistent with the observed flows.
Journey Times Observed journey times on the M27 J11-12 westbound are lower at FYA than pre-
scheme levels and slightly higher than the OYA.
In the AM and PM peak period, the average journey time is faster by 21 and 27 seconds respectively in the westbound direction.
At FYA, journey times are slightly higher than pre-scheme in the eastbound direction.
Journey times are highest in the AM peak in the eastbound direction and in the PM peak in the westbound direction and this trend continues post scheme opening.
Journey time variability remains an issue in the eastbound direction with sharp peak during the AM peak period and the average time in the peak is nearly double than that seen in the interpeak period.
Journey Time Forecasting For the westbound direction peak period, the observed saving is slightly higher than the
forecast saving and in the eastbound direction the observed saving is lower than the forecast.
Appraisal predicted negligible savings in the offpeak period, and there is a slight increase in journey times in the observed.
Journey Time Reliability In the eastbound direction, journey time reliability has worsened during the PM peak
period. The results for eastbound direction show that journey time reliability in the PM peak remains an issue between OYA and FYA.
Overall journey time reliability has improved with fewer peaks during the day indicating that the scheme has catered to the objective of improving journey time reliability in the longer term.
The scheme has had a moderate beneficial effect on journey time reliability in line with that forecast in the appraisal and the route stress has reduced from 94% in the pre-scheme to 84% post opening.
Post Opening Project Evaluation
M27 J11-12 Climbing Lanes Five Years After Study
27
3. Safety Evaluation Introduction
3.1 This chapter examines the impact of the scheme on safety. The DfT’s objectives for transport
set out the principal objectives to reduce collisions and improve security. This includes
reducing the loss of life, injuries and damage resulting from transport collisions and crime.
3.2 In order to assess the scheme’s impact on collisions, this section of the report analyses
changes in personal injury collisions (PICs) occurring in the five year period before scheme
opening and after. Evaluation of the scheme’s impact on personal security has also been
undertaken through the use of observations made during a site visit.
3.3 For the safety objective, the AST states that ‘Accident benefits are possible, however DMRB
guidance (volume 13 section 1) provides a constant accident rate for D3 and D4 motorways,
hence evaluation has not been included within the economic assessment’.
Data Sources Forecast Data
3.4 Improving safety was not a scheme objective in the ES presented at Public Inquiry, but it was
highlighted in the Public Exhibition Leaflet. Accident benefits were not considered in scheme
forecasting, on the grounds that standard accident rates in COBA for 4-lane motorways are
the same as for 3 lanes, hence COBA would be unable to calculate a benefit.
3.5 The COBA network considered for scheme appraisal was limited to the M27 J11-12 mainline
and on and off-slips. The extent of the network is illustrated in Figure 2.4.
Observed Data
3.6 Even though collision benefits were not considered as part of appraisal, collision rate changes
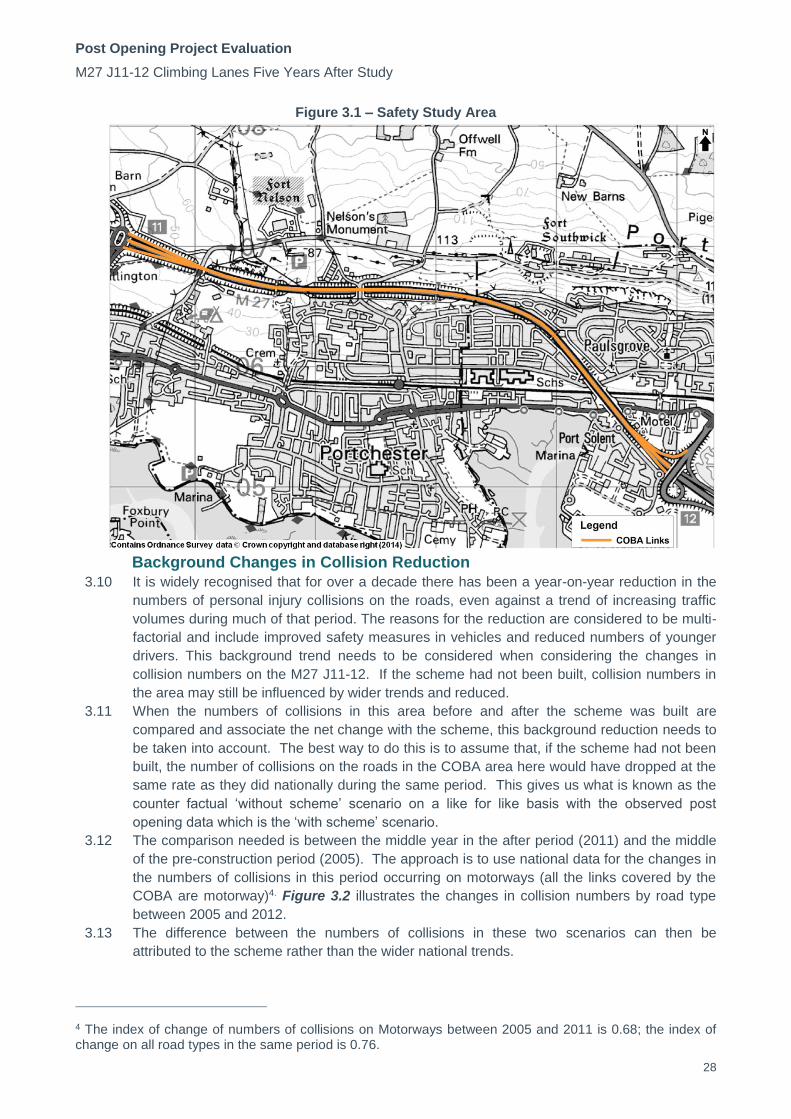
are evaluated for all major schemes under POPE. For the purpose of this study, the area of
influence is considered to be the COBA area considered for appraisal and collision data has
been obtained from Hampshire County Council for the area shown in Figure 3.1.
3.7 The data covers the following time periods:
Pre-scheme: Five years before the start of scheme construction (January 2003 to
December 2007).
Construction: January 2008 to August 2008.
Post-opening: September 2008 to August 2013.
3.8 The collision data is based on the records of PICs (i.e. collisions that may involve injuries to
one or more persons) recorded in the STATS19 data collected by the police when attending
collisions. Collisions that do not result in injury are not included in this dataset and are thus not
considered in this evaluation.
3.9 It should also be noted that at this stage, the collision data may not yet have been validated by
the DfT. The requirement for up to date and site specific information necessitated the use of
unvalidated data sourced from the local authority. Thus the data is judged to be sufficiently
robust for use in this study, but it may be subject to change. However, it is not anticipated that
this would be significant in terms of the analysis of collision numbers presented in this report.
Post Opening Project Evaluation
M27 J11-12 Climbing Lanes Five Years After Study
28
Figure 3.1 – Safety Study Area
Background Changes in Collision Reduction
3.10 It is widely recognised that for over a decade there has been a year-on-year reduction in the
numbers of personal injury collisions on the roads, even against a trend of increasing traffic
volumes during much of that period. The reasons for the reduction are considered to be multi-
factorial and include improved safety measures in vehicles and reduced numbers of younger
drivers. This background trend needs to be considered when considering the changes in
collision numbers on the M27 J11-12. If the scheme had not been built, collision numbers in
the area may still be influenced by wider trends and reduced.
3.11 When the numbers of collisions in this area before and after the scheme was built are
compared and associate the net change with the scheme, this background reduction needs to
be taken into account. The best way to do this is to assume that, if the scheme had not been
built, the number of collisions on the roads in the COBA area here would have dropped at the
same rate as they did nationally during the same period. This gives us what is known as the
counter factual ‘without scheme’ scenario on a like for like basis with the observed post
opening data which is the ‘with scheme’ scenario.
3.12 The comparison needed is between the middle year in the after period (2011) and the middle
of the pre-construction period (2005). The approach is to use national data for the changes in
the numbers of collisions in this period occurring on motorways (all the links covered by the
COBA are motorway)4. Figure 3.2 illustrates the changes in collision numbers by road type
between 2005 and 2012.
3.13 The difference between the numbers of collisions in these two scenarios can then be
attributed to the scheme rather than the wider national trends.
4 The index of change of numbers of collisions on Motorways between 2005 and 2011 is 0.68; the index of change on all road types in the same period is 0.76.

Post Opening Project Evaluation
M27 J11-12 Climbing Lanes Five Years After Study
29
Figure 3.2 – Trends in Injury Collision Numbers5
Collision Numbers 3.14 This section analyses the observed trends in PICs following the implementation of the
scheme. This includes investigating the changes in the number of collisions and associated
casualties as well as whether there has been a reduction in the relative severity of incidents.
Collisions
3.15 An evaluation of before and after opening collision numbers by year for the whole of the
COBA M27 J11-12 modelled area is shown in Table 3.1. Additionally presented is the pre-
scheme counterfactual number of collisions, which is an alteration, based on the
counterfactual scenario in which it is assumed that without the scheme in place, the collision
numbers here would have reduced in line with the regional trend. The results are also
presented graphically in Figure 3.3.
Table 3.1 – Number of Collisions by Severity in the M27 J11-12 COBA Area
Period Time Period Number of Collisions Average Annual
From To Fatal Serious Slight Total Fatal Serious Slight All
Pre-
Scheme
Jan-2003 Dec-2003 0 3 24 27
0.4 1.4 18.6 20.4
Jan-2004 Dec-2004 1 1 18 20
Jan-2005 Dec-2005 0 1 14 15
Jan-2006 Dec-2006 1 0 24 25
Jan-2007 Dec-2007 0 2 13 15
Without scheme Counterfactual (adjusted for background reduction)6 13.8
Construction
Period Jan-2008 Aug-2008 0 2 5 7 0.0 3.0 7.5 10.5
Post-Opening
Sep-2008 Aug-2009 0 1 16 17
0.0 3.0 14.2 17.2
Sep-2009 Aug-2010 0 4 15 19
Sep-2010 Aug-2011 0 5 10 15
Sep-2011 Aug-2012 0 4 16 20
Sep-2012 Aug-2013 0 1 14 15
5 Data sourced from DfT table RAS 10002 which includes reported collisions and collision rates by road class and severity, Great Britain.
6 Background factor in collision numbers for Motorways 2005-2011 was 0.68.
Post Opening Project Evaluation
M27 J11-12 Climbing Lanes Five Years After Study
30
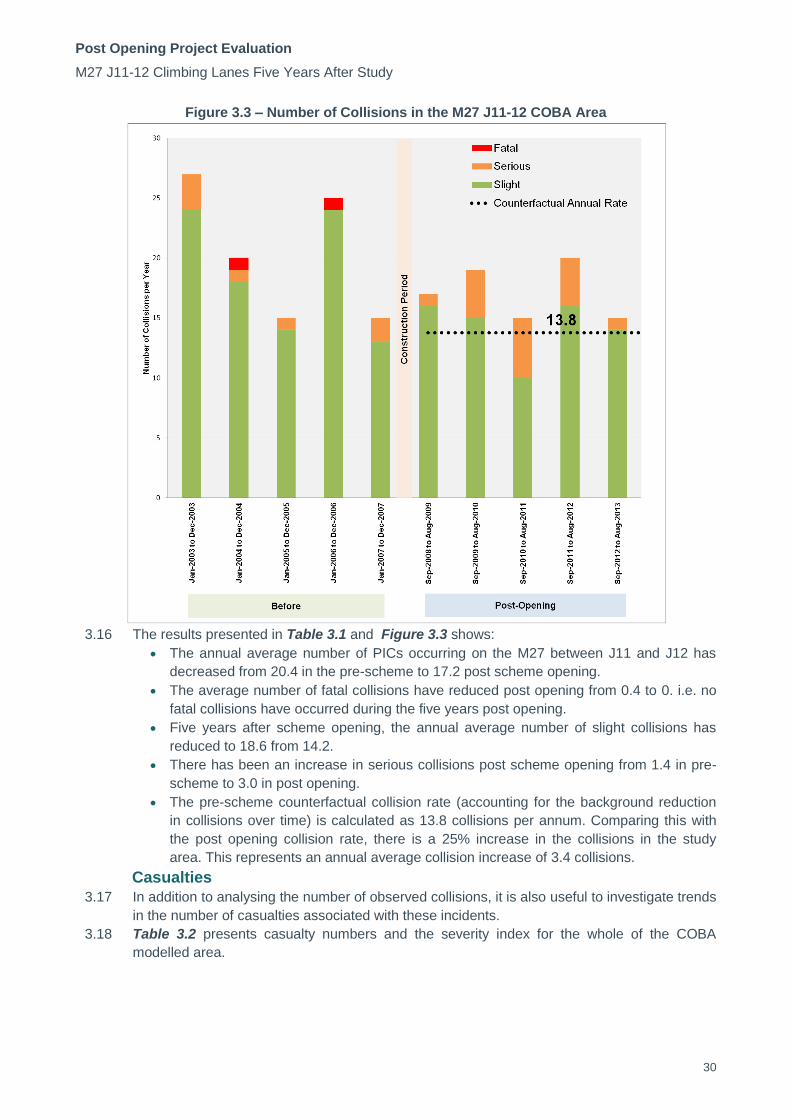
Figure 3.3 – Number of Collisions in the M27 J11-12 COBA Area
3.16 The results presented in Table 3.1 and Figure 3.3 shows:
The annual average number of PICs occurring on the M27 between J11 and J12 has
decreased from 20.4 in the pre-scheme to 17.2 post scheme opening.
The average number of fatal collisions have reduced post opening from 0.4 to 0. i.e. no
fatal collisions have occurred during the five years post opening.
Five years after scheme opening, the annual average number of slight collisions has
reduced to 18.6 from 14.2.
There has been an increase in serious collisions post scheme opening from 1.4 in pre-
scheme to 3.0 in post opening.
The pre-scheme counterfactual collision rate (accounting for the background reduction
in collisions over time) is calculated as 13.8 collisions per annum. Comparing this with
the post opening collision rate, there is a 25% increase in the collisions in the study
area. This represents an annual average collision increase of 3.4 collisions.
Casualties
3.17 In addition to analysing the number of observed collisions, it is also useful to investigate trends
in the number of casualties associated with these incidents.
3.18 Table 3.2 presents casualty numbers and the severity index for the whole of the COBA
modelled area.

Post Opening Project Evaluation
M27 J11-12 Climbing Lanes Five Years After Study
31
Table 3.2 – Number of Casualties in the M27 J11-12 COBA Area
Period Time Period Number of Casualties Average Annual
From To Fatal Serious Slight Total Fatal Serious Slight All
Pre-
Scheme
Jan-2003 Dec-2003 0 3 43 46
0.4 1.6 28.0 30.0
Jan-2004 Dec-2004 1 2 30 33
Jan-2005 Dec-2005 0 1 20 21
Jan-2006 Dec-2006 1 0 30 31
Jan-2007 Dec-2007 0 2 17 19
Without scheme Counterfactual (adjusted for background reduction)7 22.6
Construction
Period Jan-2008 Aug-2008 0 2 6 8 0.0 3.0 9.0 12.0
Post-
Opening
Sep-2008 Aug-2009 0 1 21 22
0.0 3.0 25.0 28.0
Sep-2009 Aug-2010 0 4 26 30
Sep-2010 Aug-2011 0 5 22 27
Sep-2011 Aug-2012 0 4 34 38
Sep-2012 Aug-2013 0 1 22 23
3.19 From Table 3.2 it can be seen that:
The annual average number of casualties has reduced from 30 to 28.0 post scheme
opening without accounting for background reduction.
Taking into account the national trend, there is an increase of 5.4 casualties per annum
post scheme opening.
Fatal casualties per annum have reduced from 0.4 to 0 post scheme opening.
There is a saving of 3.0 slight casualties per annum post scheme opening.
The increase in serious casualty observed along the study area post scheme opening is
1.4.
Collision and Casualty Severity Index
3.20 The collision severity index is the ratio of the number of collisions classed as serious or fatal
compared to the total number of collisions. The casualty severity index is the ratio of the
number of casualties classed as serious or fatal compared to the total number of casualties. A
summary of the before and after opening collision and casualty severity indices by year is
shown in Table 3.3.
Table 3.3 – Collision and Casualty Severity Index
Period From To
Collision
Severity
Index
Annual
Average
Casualty
Severity Index
Annual
Average
Pre Scheme
Jan-2003 Dec-2003 0.11
0.09
0.07
0.07
Jan-2004 Dec-2004 0.10 0.09
Jan-2005 Dec-2005 0.07 0.05
Jan-2006 Dec-2006 0.04 0.03
Jan-2007 Dec-2007 0.13 0.11
Construction Jan-2008 Aug-2008 0.29 0.29 0.25 0.25
Post Opening
Sep-2008 Aug-2009 0.06
0.17
0.05
0.11
Sep-2009 Aug-2010 0.21 0.13
Sep-2010 Aug-2011 0.33 0.19
Sep-2011 Aug-2012 0.20 0.11
Sep-2012 Aug-2013 0.07 0.04
7 Background factor of Casualties for Great Britain 2005-2011 was 0.75.

Post Opening Project Evaluation
M27 J11-12 Climbing Lanes Five Years After Study
32
3.21 Table 3.3 shows that the collision and casualty severity index has increased post scheme
opening even though the number of collisions have reduced as seen in the previous section.
This increase is as a result of the reduction in the number of slight casualties and an increase
in the number of serious casualties post opening.
Fatalities and Weighted Injuries 3.22 The collision rate discussed above does not take into account the severity of collisions. To
analyse this, the Fatalities and Weighted Injuries (FWI) metric is presented which is a
combined measure of casualties based on the numbers of fatal, serious and slight casualties.
The FWI for the five years before and five years after period is shown in Table 3.4. To take
into account the changes in traffic on the M27 and for comparison with other schemes, the
FWI rate per billion vehicle kilometres (bvkm) is also presented. It should be noted that these
figures do not account for changes in background reduction in collisions/casualties.
Table 3.4 – FWI on M27 J11-12 COBA Area
Period FWI/collision FWI/year FWI/bvkm
Pre-Scheme 0.041 0.84 3.6
Post-Opening 0.032 0.55 2.5
3.23 From Table 3.4 it can be seen that each of the FWI metrics have reduced following scheme
opening. The FWI/bvkm has reduced from 3.6 to 2.5.
Collision Locations 3.24 The location of collisions occurring within the M27 J11-12 COBA area for the pre-scheme and
post opening periods by direction is presented in Figure 3.4, Figure 3.5, Figure 3.6 and
Figure 3.7 respectively.

Post Opening Project Evaluation
M27 J11-12 Climbing Lanes Five Years After Study
33
Figure 3.4 – Collision Locations –Pre scheme –Eastbound Carriageway
Figure 3.5 – Collision Locations –Pre scheme – Westbound Carriageway
Figure 3.6 – Collision Locations – Post Opening –Eastbound Carriageway
Figure 3.7 – Collision Locations – Post Opening –Westbound Carriageway

Post Opening Project Evaluation
M27 J11-12 Climbing Lanes Five Years After Study
34
3.25 From Figure 3.4 to Figure 3.7 it can be seen that collisions were evenly distributed along the
link with slightly higher concentrations near the junctions (M27 J11 and J12) before the
scheme was constructed. However the collisions at either junction remain same as pre-
scheme levels with the cluster at J11 being more prominent. Post opening, the number of
serious collisions has increased and this is distributed along the link between M27 J11 and
J12.
3.26 A direction wise analysis of collisions has shown that the number of collisions in the
eastbound direction (51 collisions) was slightly higher than the westbound (49 collisions)
during the pre-scheme period. The number of collisions in the five years since scheme
opening in the eastbound direction is 60 compared against 26 collisions in the westbound
direction. This shows that even though the total number of collisions has reduced since
scheme opening (as discussed in Table 3.1) in the COBA area, a directional imbalance in
collisions is observed post scheme opening. There is an increase in collisions post scheme
opening in the eastbound direction compared to pre-scheme due to a cluster of accidents
being observed at the climbing lane merge (This is considered in more detail later in this
chapter). In the westbound direction the number of post scheme collisions is nearly half of pre-
scheme.
Forecast vs. Outturn Collision Numbers 3.27 This section compares the number of observed collisions discussed earlier with those
predicted to occur. The predictions have been obtained from the COBA model for this scheme
and cover the whole of the modelled area (shown previously in Figure 3.1). For the outturn
collisions the annual average before and after the scheme opened are used for the same area
as used in the COBA appraisal.
Table 3.5 – Comparison of Forecast and Outturn Collisions for the scheme Key Links
Forecast Opening
Year
Do Minimum (without scheme) 26.90
Do Something (with scheme) 26.70
Saving 0.20
% Change 1%
Outturn Annual
Average
Before Opening 20.4
Before Opening (counterfactual) 13.8
After Opening 17.2
Change* -3.4
% Change* -25%
* Comparison of before and after completed using counterfactual scenario for before.
3.28 It can be seen from Table 3.5 that the scheme appraisal forecast a marginal decrease of 1%
collisions in the opening year. However, there has been an observed average increase in
collisions of 3.4 per year, representing an increase of 25%, when comparing the post-opening
data to the counterfactual collisions which adjusts the pre-scheme data for background
collision trends.
3.29 Without the counterfactual adjustment we see that there has been a decrease in collisions
along the scheme, but we cannot attribute this saving solely to the scheme without adjusting
for background collision trends.
3.30 A comparison of the forecast and observed collisions levels in both the scenarios shows that a
higher number of collisions were expected in the forecasts (26.9 in the Do-Minimum and 26.7
in the Do Something). This difference could be because traffic was forecast to grow
significantly between the base year and the scheme opening year. As there has been less
growth in background traffic, traffic did not increase to the same scale as was forecast
resulting in fewer accidents.
Post Opening Project Evaluation
M27 J11-12 Climbing Lanes Five Years After Study
35
Road Safety Audit Stage 4b 3.31 A Stage 4b Road Safety Audit (RSA) was produced in December 2012. This was based on 36
months of pre-scheme collision data (19th January 2005 to 18th January 2008) and 36 months
of post-opening data (31st August 2008 to 30th August 2011). The study area considered was
between 250m prior to the start of the widening and 500m after the merge back to 3 lanes in
the eastbound and westbound directions. The conclusions from the RSA Stage 4b audit were
as follows:
Collision frequency has increased on the eastbound carriageway following the
implementation of the climbing lane scheme.
An increase in collisions was noticed since opening of the scheme occurring during the
hours of darkness.
From the assessment of post scheme collision data, a cluster of collisions were noted on
the eastbound carriageway in the vicinity of the merge.
3.32 As part of RSA stage 4b audit, it was recommended to review the signage, studs and road
markings.
3.33 A further evaluation of the location of collisions five years before and after opening has been
carried out using the data collected as part of this FYA study. The area selected is between
Hill Road Overbridge and High Tor Footbridge (Figure 3.6 and Figure 3.7) where the lane
merge occurs. The results are shown in Table 3.6.
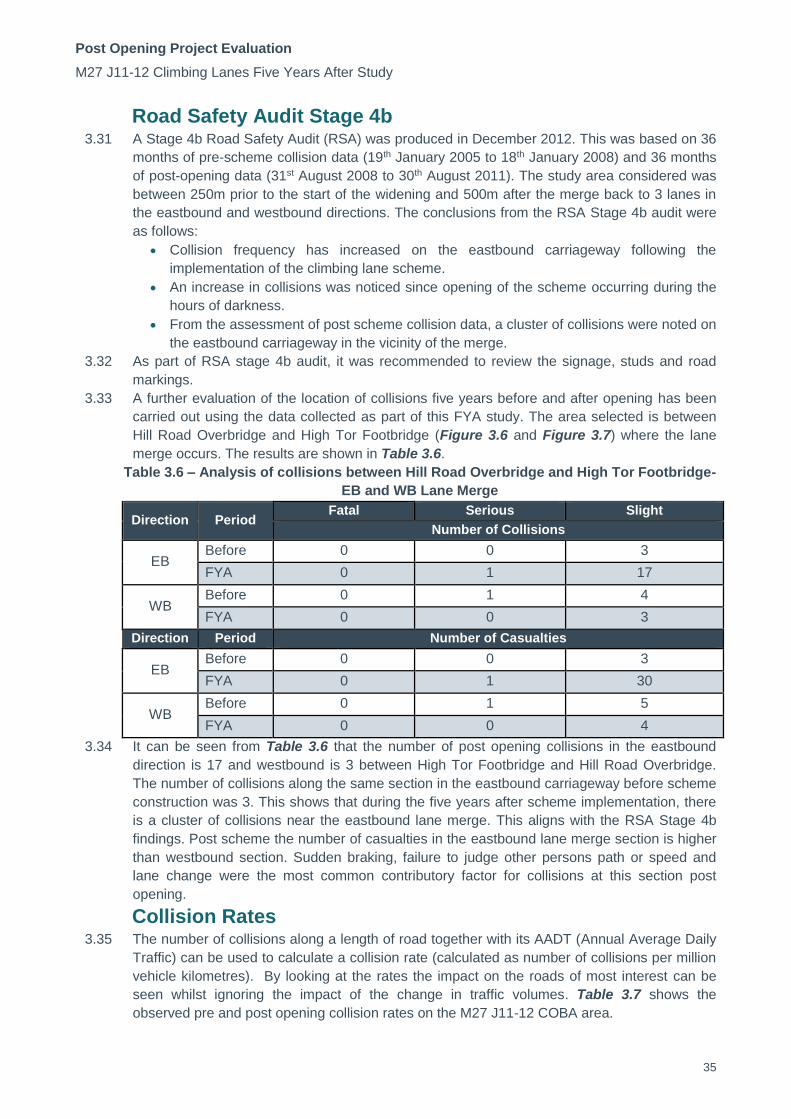
Table 3.6 – Analysis of collisions between Hill Road Overbridge and High Tor Footbridge-
EB and WB Lane Merge
Direction Period Fatal Serious Slight
Number of Collisions
EB Before 0 0 3
FYA 0 1 17
WB Before 0 1 4
FYA 0 0 3
Direction Period Number of Casualties
EB Before 0 0 3
FYA 0 1 30
WB Before 0 1 5
FYA 0 0 4
3.34 It can be seen from Table 3.6 that the number of post opening collisions in the eastbound
direction is 17 and westbound is 3 between High Tor Footbridge and Hill Road Overbridge.
The number of collisions along the same section in the eastbound carriageway before scheme
construction was 3. This shows that during the five years after scheme implementation, there
is a cluster of collisions near the eastbound lane merge. This aligns with the RSA Stage 4b
findings. Post scheme the number of casualties in the eastbound lane merge section is higher
than westbound section. Sudden braking, failure to judge other persons path or speed and
lane change were the most common contributory factor for collisions at this section post
opening.
Collision Rates 3.35 The number of collisions along a length of road together with its AADT (Annual Average Daily
Traffic) can be used to calculate a collision rate (calculated as number of collisions per million
vehicle kilometres). By looking at the rates the impact on the roads of most interest can be
seen whilst ignoring the impact of the change in traffic volumes. Table 3.7 shows the
observed pre and post opening collision rates on the M27 J11-12 COBA area.
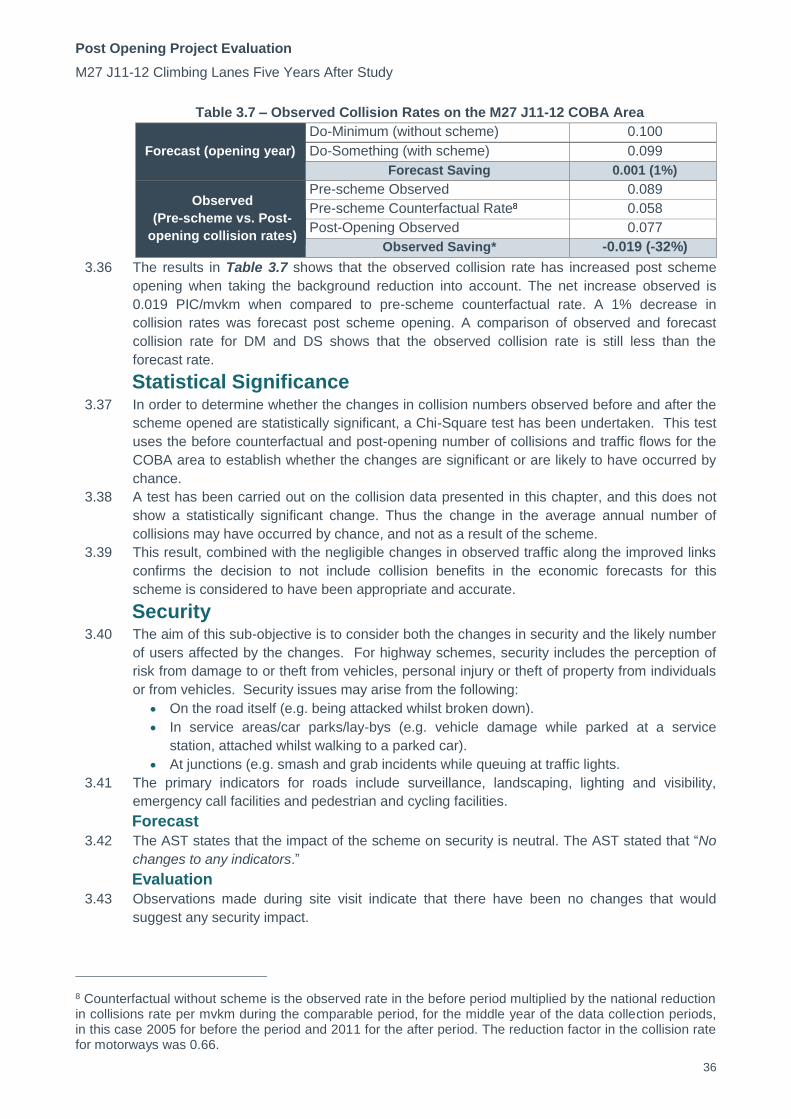
Post Opening Project Evaluation
M27 J11-12 Climbing Lanes Five Years After Study
36
Table 3.7 – Observed Collision Rates on the M27 J11-12 COBA Area
Forecast (opening year))
Do-Minimum (without scheme) 0.100
Do-Something (with scheme) 0.099
Forecast Saving 0.001 (1%)
Observed
(Pre-scheme vs. Post-
opening collision rates)
Pre-scheme Observed 0.089
Pre-scheme Counterfactual Rate8 0.058
Post-Opening Observed 0.077
Observed Saving* -0.019 (-32%)
3.36 The results in Table 3.7 shows that the observed collision rate has increased post scheme
opening when taking the background reduction into account. The net increase observed is
0.019 PIC/mvkm when compared to pre-scheme counterfactual rate. A 1% decrease in
collision rates was forecast post scheme opening. A comparison of observed and forecast
collision rate for DM and DS shows that the observed collision rate is still less than the
forecast rate.
Statistical Significance 3.37 In order to determine whether the changes in collision numbers observed before and after the
scheme opened are statistically significant, a Chi-Square test has been undertaken. This test
uses the before counterfactual and post-opening number of collisions and traffic flows for the
COBA area to establish whether the changes are significant or are likely to have occurred by
chance.
3.38 A test has been carried out on the collision data presented in this chapter, and this does not
show a statistically significant change. Thus the change in the average annual number of
collisions may have occurred by chance, and not as a result of the scheme.
3.39 This result, combined with the negligible changes in observed traffic along the improved links
confirms the decision to not include collision benefits in the economic forecasts for this
scheme is considered to have been appropriate and accurate.
Security 3.40 The aim of this sub-objective is to consider both the changes in security and the likely number
of users affected by the changes. For highway schemes, security includes the perception of
risk from damage to or theft from vehicles, personal injury or theft of property from individuals
or from vehicles. Security issues may arise from the following:
On the road itself (e.g. being attacked whilst broken down).
In service areas/car parks/lay-bys (e.g. vehicle damage while parked at a service
station, attached whilst walking to a parked car).
At junctions (e.g. smash and grab incidents while queuing at traffic lights.
3.41 The primary indicators for roads include surveillance, landscaping, lighting and visibility,
emergency call facilities and pedestrian and cycling facilities.
Forecast
3.42 The AST states that the impact of the scheme on security is neutral. The AST stated that “No
changes to any indicators.”
Evaluation
3.43 Observations made during site visit indicate that there have been no changes that would
suggest any security impact.
8 Counterfactual without scheme is the observed rate in the before period multiplied by the national reduction in collisions rate per mvkm during the comparable period, for the middle year of the data collection periods, in this case 2005 for before the period and 2011 for the after period. The reduction factor in the collision rate for motorways was 0.66.

Post Opening Project Evaluation
M27 J11-12 Climbing Lanes Five Years After Study
37
Key Points - Safety
Collisions The annual average number of PICs occurring on the M27 between J11 and J12 has
decreased from 20.4 in the pre-scheme to 17.2 post scheme opening.
When taking the background reduction into account, there is a slight increase in the annual average collisions of 3.4 post scheme opening.
The number of fatal and slight collisions have reduced post opening, but there has been an increase in the number of serious collisions.
Collision and casualty severity index has increased post opening.
Analysis of Fatalities and Weighted Index shows a reduction in each of the indices post opening without accounting for background reduction.
Statistical test on the collision data shows that the changes in collision rate observed is statistically insignificant.
Location of Collisions
The cluster of collisions observed near M27 J11 and J12 in the pre-scheme remains the same post opening.
The total number of collisions has reduced in the westbound carriageway post scheme opening, but there is an increase in the eastbound direction.
A cluster of collisions is observed near the eastbound lane merge during the five years period since scheme opening and this aligns with the RSA stage 4b findings.
Post scheme opening a directional imbalance in collisions is observed with higher frequency on the eastbound carriageway compared to westbound carriageway.
Forecasts
A reduction in collisions of 1% was forecast for the opening year, but observed data shows that collisions have increased by 25% compared to pre scheme (after accounting for the background trend in collision reduction).
Appraisal forecast a marginal reduction in collision rate of 1% and the observed increase after accounting for background reduction is 32%. However the observed collision rate is still less than the forecast collision rate.
Security
The scheme’s impact on security is assessed as neutral.

Post Opening Project Evaluation
M27 J11-12 Climbing Lanes Five Years After Study
38
4. Economy Introduction
4.1 This section presents an evaluation of how the scheme is performing against the DfT’s
economy objective, which is defined in WebTAG as:
To support sustainable economic activity and get good value for money
4.2 The five sub-objectives for economy are as follows:
Get good value for money in relation to impacts on public accounts.
Improve transport economic efficiency for business users and transport providers.
Improve transport economic efficiency for consumer users.
Improve reliability.
Provide beneficial wider economic impacts.
4.3 When a scheme is appraised, an economic assessment is used to determine the scheme’s
value for money. This assessment is based on an estimation of costs and benefits from
different sources:
Transport Economic Efficiency (TEE) benefits (savings related to travel times, vehicle
operating costs and user charges).
Accident costs (savings related to numbers and severity level of accidents).
Costs to users due to delays during construction and future maintenance periods.
4.4 This section provides a comparison between the outturn costs and benefits and the forecast
economic impact and the scheme’s wider economic impacts.
Sources
4.5 The economic assessment presented in this section is based upon:
COBA files used for the economic modelling of the scheme (July 2006).
Forecasting and Economics Report (July 2006).
Outturn costs obtained from the Highways Agency Regional Finance Manager.
The forecast scheme costs have been taken from the pre-construction ministerially
approved budget (MP Director’s Instruction 06/07, Annex 1, Version 1.2 final-a, issued
May 2007).
Scheme Costs Introduction
4.6 This section compares the forecast costs of the scheme as of the start of the construction
period with the actual spend at the time of this evaluation.
4.7 Costs of the scheme are also considered for the full appraisal period of 60 years such that
they can be compared with the benefits over the same period. The full costs examined were
made up of the following:
Investment costs : before and during construction;
Indirect Tax Revenues: during the 60 years after opening.
4.8 Investment costs are considered in terms of a common price base of 2002 for comparison with
forecast. For comparison with the benefits which are expressed in terms of present value,
overall costs are likewise expressed, and termed Present Value Cost (PVC).
Investment Costs
4.9 The investment cost is the cost to the HA of constructing the scheme and purchasing any
land. The forecast scheme cost has been obtained from the latest ministerially approved
budget. It is the final estimate before the award of contract and is dated May 2007. This
provides the undiscounted M27 J11 to J12 Climbing Lanes costs (including forecast spend,
scheme risks, optimum bias and land provisions) in 2006 costs for second quarter. This has
been converted to 2002 prices for comparison with outturn costs using a 2006Q2 RPI of 197.6
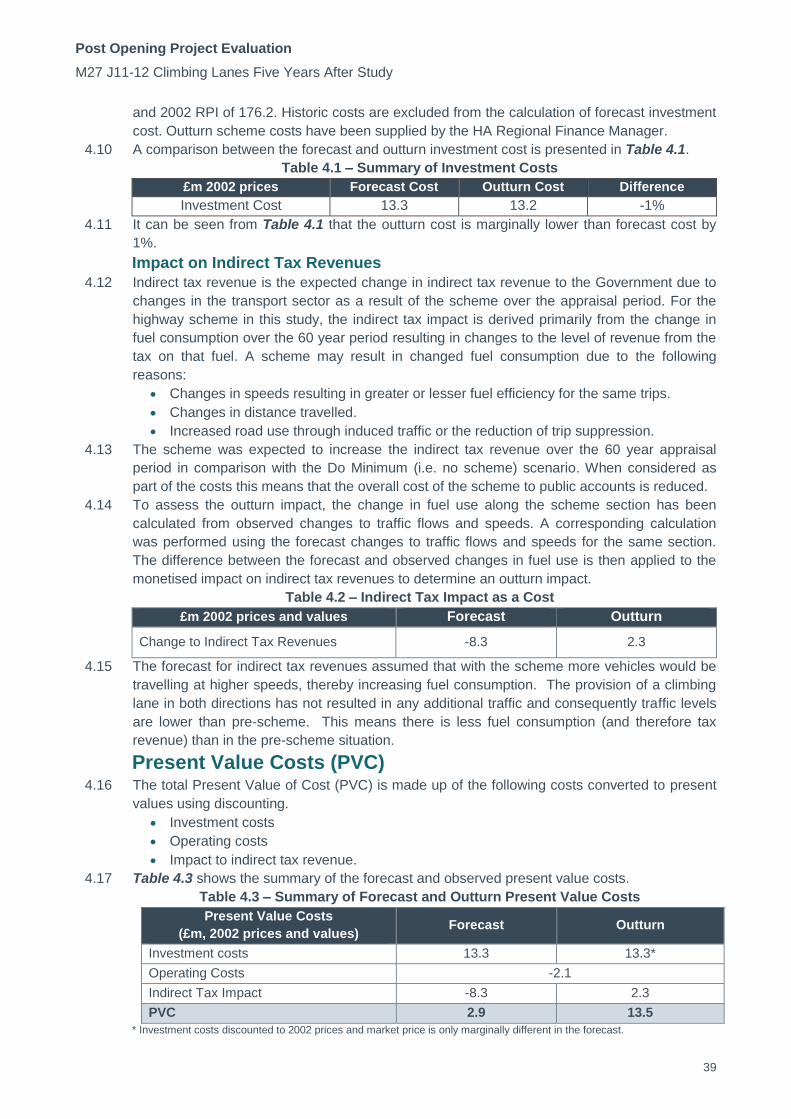
Post Opening Project Evaluation
M27 J11-12 Climbing Lanes Five Years After Study
39
and 2002 RPI of 176.2. Historic costs are excluded from the calculation of forecast investment
cost. Outturn scheme costs have been supplied by the HA Regional Finance Manager.
4.10 A comparison between the forecast and outturn investment cost is presented in Table 4.1.
Table 4.1 – Summary of Investment Costs
£m 2002 prices Forecast Cost Outturn Cost Difference
Investment Cost 13.3 13.2 -1%
4.11 It can be seen from Table 4.1 that the outturn cost is marginally lower than forecast cost by
1%.
Impact on Indirect Tax Revenues
4.12 Indirect tax revenue is the expected change in indirect tax revenue to the Government due to
changes in the transport sector as a result of the scheme over the appraisal period. For the
highway scheme in this study, the indirect tax impact is derived primarily from the change in
fuel consumption over the 60 year period resulting in changes to the level of revenue from the
tax on that fuel. A scheme may result in changed fuel consumption due to the following
reasons:
Changes in speeds resulting in greater or lesser fuel efficiency for the same trips.
Changes in distance travelled.
Increased road use through induced traffic or the reduction of trip suppression.
4.13 The scheme was expected to increase the indirect tax revenue over the 60 year appraisal
period in comparison with the Do Minimum (i.e. no scheme) scenario. When considered as
part of the costs this means that the overall cost of the scheme to public accounts is reduced.
4.14 To assess the outturn impact, the change in fuel use along the scheme section has been
calculated from observed changes to traffic flows and speeds. A corresponding calculation
was performed using the forecast changes to traffic flows and speeds for the same section.
The difference between the forecast and observed changes in fuel use is then applied to the
monetised impact on indirect tax revenues to determine an outturn impact.
Table 4.2 – Indirect Tax Impact as a Cost
£m 2002 prices and values Forecast Outturn
Change to Indirect Tax Revenues -8.3 2.3
4.15 The forecast for indirect tax revenues assumed that with the scheme more vehicles would be
travelling at higher speeds, thereby increasing fuel consumption. The provision of a climbing
lane in both directions has not resulted in any additional traffic and consequently traffic levels
are lower than pre-scheme. This means there is less fuel consumption (and therefore tax
revenue) than in the pre-scheme situation.
Present Value Costs (PVC) 4.16 The total Present Value of Cost (PVC) is made up of the following costs converted to present
values using discounting.
Investment costs
Operating costs
Impact to indirect tax revenue.
4.17 Table 4.3 shows the summary of the forecast and observed present value costs.
Table 4.3 – Summary of Forecast and Outturn Present Value Costs
Present Value Costs
(£m, 2002 prices and values) Forecast Outturn
Investment costs 13.3 13.3*
Operating Costs -2.1
Indirect Tax Impact -8.3 2.3
PVC 2.9 13.5
* Investment costs discounted to 2002 prices and market price is only marginally different in the forecast.

Post Opening Project Evaluation
M27 J11-12 Climbing Lanes Five Years After Study
40
4.18 It can be seen from Table 4.3 that the outturn scheme present value costs is £13.5m
compared to forecast cost £2.9m. The difference is primarily due to the less revenue from
indirect tax in the outturn. This is due to the fact that the forecasts assumed higher
background traffic growth and hence higher indirect tax impact. Forecasts showed a net
indirect tax revenue and this offset a considerable proportion of the investment costs. These
values for the costs are used in the calculation of the Benefit Cost Ratio in Table 4.9.
Forecast Benefits 4.19 A summary of the predicted scheme impacts from the Forecasting and Economics Report is
shown in Table 4.4. This shows that over the 60 year appraisal period the scheme was
predicted to generate about £53 million benefits with the vast majority arising from reduced
journey times. Table 4.4 indicates also provides a summary of the benefits which will be
considered in this post opening evaluation, and those which have been excluded.
Table 4.4 – Economic Impact of Scheme
Benefit
Stream
Predicted
Benefits Evaluation
£m % Evaluate? Reason
Journey
Times 65.7 124%
Represents a considerable proportion of the overall
scheme benefits
Relatively straightforward to measure outturn
impacts in opening year.
Vehicle
Operating
Costs
-10.0 -19% Closely linked to changes in indirect tax.
TEE impacts
during
construction
and
maintenance
-2.6 -5% Not within the remit of POPE
Small proportion of the overall scheme impacts.
Safety 0.0 0%
Accident benefits were not included in the
appraisal and the outturn impact has been shown to
not be statistically significant.
PVB 53.1 100%
Journey Time Benefits Forecast Journey Time Benefits
4.20 Journey time benefits for this scheme were forecast using the COBA program. The forecast
journey time benefits over the whole 60-year appraisal period have been taken from the
Forecasting and Economics Report. These are shown in Table 4.5. The extent of the network
considered for appraisal is presented in Figure 2.4.
Table 4.5 – Summary of TEE forecast impacts
Consumers & Business users combined £m 2002 prices and values
Journey Time 65.7
4.21 Journey time benefits expected as a result of the scheme were 124% (i.e. greater than) the
PVB. This was expected as a result of the extra capacity provided by the scheme and
restricting slower vehicles to the nearside lane.
Evaluation of Journey Time Benefits
4.22 The POPE methodology for evaluating the economic value of benefits arriving from vehicle
hour savings is based upon comparing the observed vehicle hour savings, combined with the
assumption that the observed vehicle hour saving at the FYA stage can be taken as indicative
of that over the whole 60 year appraisal period. Based on this assumption, comparing the
Post Opening Project Evaluation
M27 J11-12 Climbing Lanes Five Years After Study
41
forecast vehicle hour saving with the observed vehicle hour saving enables the calculation of
the 60 year monetised benefit.
4.23 The same calculation has been completed using the forecast and observed flows and journey
times for M27 J11 to J12.
4.24 The 26% difference between forecast and outturn savings is applied to the forecast journey
time benefits in line with the POPE methodology.
4.25 Table 4.6 compares the forecast with the outturn assessment.
Table 4.6 – Monetised Journey Time Benefits
Present Value Benefits
(£m 2002 prices, discounted) Forecast Outturn
Journey Time Benefits 65.7 48.3
4.26 From Table 4.6 it can be seen that the outturn journey time benefits on the scheme section
are less than the forecast benefit. This is likely due to the fact that the forecasts predicted
higher traffic growth and hence slower journey times in the Do-Minimum compared to Do-
Something, resulting in higher savings. However the observed traffic growth is less than
forecast and journey time savings observed is less than what was predicted scenario
Evaluation of TEE Vehicle Operating Costs Benefits
4.27 For most highway schemes including this one, the VOC and indirect tax impacts are both very
closely linked to changes in fuel consumption (e.g. changes in speeds, changes in traffic
flows) which has similar magnitude of impacts, but from opposite sides of the benefits
balance. That is, if there is increased fuel consumption, VOC will increase due to users paying
more for fuel (i.e. a disbenefit) and thus more indirect tax will be collected by the Treasury
which is considered to be a benefit according to current guidance. For this evaluation, the
ratio used for the reforecast indirect tax impact calculation (as shown in Table 4.2) has been
applied to the monetary value for VOC.
4.28 The forecast and the outturn vehicle operating cost comparison is shown in Table 4.7.
Table 4.7 – FYA VOC Benefits
Present Value Benefits
(£m 2002 prices, discounted) Forecast Outturn
Vehicle Operating Costs (VOC) -10.0 2.8
4.29 This evaluation shows that the outturn assessment of VOC’s now gives rise to a benefit. This
is due to the fact that the forecasts assumed higher background traffic growth and hence
increased VOC’s. The observed traffic flows on the motorway are lower than forecast and the
provision of a climbing lane in both directions has not resulted in any additional traffic resulting
in lower traffic than pre-scheme. There is only marginal improvement in speed compared to
pre-scheme. A combination of these factors has resulted in a VOC benefit.
Collision Benefits Forecast Benefits
4.30 The scheme forecasting did not consider collision benefits, on the grounds that COBA
standard collision rates for four lane motorways are the same as for three lanes, hence COBA
would be unable to calculate a benefit. This is in line with the DfT guidance issued in 2004.
Evaluation of Collision Benefits
4.31 The analysis performed at this FYA stage showed that there is no statistical evidence that the
scheme has had an impact on collision rate within the study area. As such the monetised
safety impact is reforecast to be £0m.
Present Value Benefits (PVB) 4.32 A cost benefit analysis of a major scheme requires all the benefits to be considered for the
whole of the appraisal period and they need to be expressed on a like-for-like basis with the
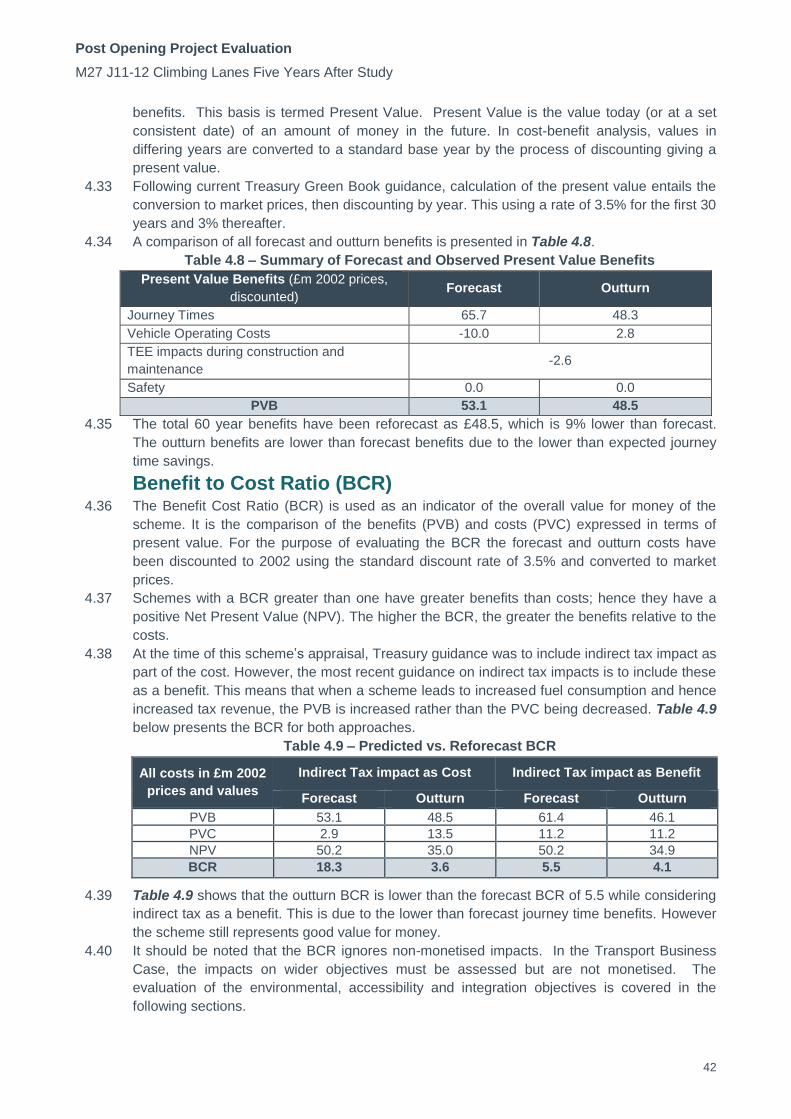
Post Opening Project Evaluation
M27 J11-12 Climbing Lanes Five Years After Study
42
benefits. This basis is termed Present Value. Present Value is the value today (or at a set
consistent date) of an amount of money in the future. In cost-benefit analysis, values in
differing years are converted to a standard base year by the process of discounting giving a
present value.
4.33 Following current Treasury Green Book guidance, calculation of the present value entails the
conversion to market prices, then discounting by year. This using a rate of 3.5% for the first 30
years and 3% thereafter.
4.34 A comparison of all forecast and outturn benefits is presented in Table 4.8.
Table 4.8 – Summary of Forecast and Observed Present Value Benefits
Present Value Benefits (£m 2002 prices,
discounted) Forecast Outturn
Journey Times 65.7 48.3
Vehicle Operating Costs -10.0 2.8
TEE impacts during construction and
maintenance -2.6
Safety 0.0 0.0
PVB 53.1 48.5
4.35 The total 60 year benefits have been reforecast as £48.5, which is 9% lower than forecast.
The outturn benefits are lower than forecast benefits due to the lower than expected journey
time savings.
Benefit to Cost Ratio (BCR) 4.36 The Benefit Cost Ratio (BCR) is used as an indicator of the overall value for money of the
scheme. It is the comparison of the benefits (PVB) and costs (PVC) expressed in terms of
present value. For the purpose of evaluating the BCR the forecast and outturn costs have
been discounted to 2002 using the standard discount rate of 3.5% and converted to market
prices.
4.37 Schemes with a BCR greater than one have greater benefits than costs; hence they have a
positive Net Present Value (NPV). The higher the BCR, the greater the benefits relative to the
costs.
4.38 At the time of this scheme’s appraisal, Treasury guidance was to include indirect tax impact as
part of the cost. However, the most recent guidance on indirect tax impacts is to include these
as a benefit. This means that when a scheme leads to increased fuel consumption and hence
increased tax revenue, the PVB is increased rather than the PVC being decreased. Table 4.9
below presents the BCR for both approaches.
Table 4.9 – Predicted vs. Reforecast BCR
All costs in £m 2002
prices and values
Indirect Tax impact as Cost Indirect Tax impact as Benefit
Forecast Outturn Forecast Outturn
PVB 53.1 48.5 61.4 46.1
PVC 2.9 13.5 11.2 11.2
NPV 50.2 35.0 50.2 34.9
BCR 18.3 3.6 5.5 4.1
4.39 Table 4.9 shows that the outturn BCR is lower than the forecast BCR of 5.5 while considering
indirect tax as a benefit. This is due to the lower than forecast journey time benefits. However
the scheme still represents good value for money.
4.40 It should be noted that the BCR ignores non-monetised impacts. In the Transport Business
Case, the impacts on wider objectives must be assessed but are not monetised. The
evaluation of the environmental, accessibility and integration objectives is covered in the
following sections.

Post Opening Project Evaluation
M27 J11-12 Climbing Lanes Five Years After Study
43
Wider Economic Impacts Forecast
4.41 The AST stated that the Paulsgrove and Wymering areas of Portsmouth were subject to South
East of England Development Agency (SEEDA) single regeneration funding, but the scheme
was not in a regeneration area. The assessment was ‘neutral’.
Evaluation
4.42 As a strategically important route along the south coast, the M27 provides the key link
between Portsmouth and Southampton. One of the main objectives of this scheme was to
reduce journey times and improve reliability. As detailed in the previous chapter, journey
times and reliability have experienced a partial improvement. The scheme has also provided
additional highway capacity on this section of the M27.
4.43 As in the OYA assessment, it is considered that the Wider Economic Impacts of the scheme
have been neutral.

Post Opening Project Evaluation
M27 J11-12 Climbing Lanes Five Years After Study
44
Key Points – Economy
Present Value of Benefits (PVB)
The journey time benefits are 9% lower than expected due to the reduction in traffic and marginal journey time savings.
In accordance with DMRB guidance which does not give reduced accident rates for widening motorways, there were no forecast accident benefits for this scheme.
The outturn PVB is 10% lower than forecast. This reduction in PVB is due to the lower than expected benefits from journey time savings.
Scheme Costs
The outturn investment cost is close to predicted.
Indirect tax revenue is lower than expected. This can be attributed to the lower than expected traffic flows along the scheme section and the very minimal improvements in speed following scheme opening.
The outturn PVC of £13.5m is higher than forecast PVC of £2.9m. This is due to the lower than expected indirect tax (a negative cost) in the outturn.
Benefit Cost Ratio (BCR)
The outturn BCR (4.1) is lower than forecast BCR (5.5) while considering indirect tax as a benefit. This is due to the lower than expected benefits. However the scheme still represents high value for money.
Post Opening Project Evaluation
M27 J11-12 Climbing Lanes Five Years After Study
45
5. Environment
Introduction 5.1 This section documents the evaluation of the environmental sub-objectives, focussing on
those aspects not fully evaluated at the One Year After (OYA) stage or where suggestions
were made for further study.
5.2 It should be noted that information received by POPE for this FYA evaluation has been
restricted to the site visit alone for this evaluation.
5.3 The ES stated that the scheme objectives were:
To resolve the congestion problems on the M27 between Junctions 11 and 12.
To minimise the adverse environmental impacts.
5.4 The Non-Technical Summary of the Environmental Statement (NTS) noted that the scheme
had been designed to minimised environmental impacts by:
Summary of OYA Evaluation Recommendations
The OYA evaluation identified a number of areas where further analysis was required at the Five Year After (FYA) stage to confirm the longer term impacts of the scheme on the surrounding environment, these are summarised as follows: Landscape – As planting stock was only one season old it was too soon to evaluate the effectiveness of the planting measures, and this together with confirmation of the plant species used on site should be reviewed as part of the FYA evaluation. Details of off-site planting were not provided at OYA and this should also be considered at the FYA stage. It was suggested that the long term landscape management operations should be reviewed to ensure the expected compensation for loss of vegetation by the implementation of appropriate landscape management to improve the quality, structure and diversity of the existing grassland and scrub vegetation has been undertaken. Establishment of mitigation screen planting provided at key locations, including close to Cornaway Allotment Gardens and Hillsley Road subway entrance should be reviewed due to topsoil not being imported to promote biodiversity. Growth rates should be assessed at FYA to ensure screening targets will be achieved. Heritage – The archaeological archive was proposed to be deposited for storage with the Hampshire County Council Museum Service, Winchester and this will be confirmed at the FYA stage. Biodiversity – Reptile translocation was undertaken as advance works due to seasonal constraints; hibernacula’s were created outside the widened scheme and the reptile fences installed. Habitat enhancement was implemented in selected off site receptor areas. Monitoring reports should be assessed at FYA to determine whether mitigation has been maintained and monitored as expected. Water Quality - It was suggested that water is considered again at the FYA stage, particularly with regard to the effectiveness of the measures included in the scheme.
Scheme Objective: To improve the existing conditions where possible and minimise and mitigate environmental impacts on areas within and adjacent to the length of
the M27 concerned.

Post Opening Project Evaluation
M27 J11-12 Climbing Lanes Five Years After Study
46
Taking as little land as possible from the soft estate (that is the land between the hard
shoulder and motorway boundary fence);
Using quieter road surfacing to reduce traffic noise; and
Upgrading the motorway drainage system by separating carriageway run-off from the
chalk aquifers and by the provision of improved pollution protection.
Figure 5.1 – Key Location Plan – Scheme locations referenced in Environment
Chapter
5.5 The following environmental sub-objectives were appraised in the ES and in the Appraisal
Assessment Table (AST) according to NATA guidance at that time (2008):
Noise;
Local Air Quality;
Greenhouse Gases;
Heritage;
Landscape;
Biodiversity;
Water Environment;
Physical fitness; and
Journey Ambience.
5.6 For each of these environmental sub-objectives, the evaluation in this Section assesses the
environmental impacts predicted in the scheme’s AST and ES against those observed five
years after opening.
5.7 In the context of the findings from the OYA evaluation and using new evidence collected five
years after opening, this section presents:
An evaluation of the ongoing effectiveness of the mitigation measures implemented as
part of the scheme;

Post Opening Project Evaluation
M27 J11-12 Climbing Lanes Five Years After Study
47
An updated summary of key impacts against all of the nine environment WebTAG sub
objectives, with particular focus on assessment of sub-objectives where it was too early
to conclude at the OYA evaluation stage; and
Additional analysis relevant to close out issues/ areas for further study as identified at
the OYA stage for consideration at the FYA stage.
Figure 5.2 – View of the scheme looking east from the Downend Road overbridge
showing the start of the eastbound climbing lane
Methodology
5.8 This section focuses on those aspects not fully evaluated at OYA, or where at OYA,
suggestions were made for further study and also any issues that have arisen since the OYA
evaluation. The detail of the OYA study is not repeated here, and reference is made to the
OYA report where required, although key points are incorporated into this FYA report where
appropriate to provide contextual understanding.
5.9 No new modelling or survey work has been undertaken for this FYA environmental evaluation.
Data Collection
5.10 The following documents have been used in the compilation of this chapter of the report:
Appraisal Summary Table, 28 July 2006;
M27 Junctions 11 to 12 Climbing Lanes Environmental Statement, July 2006, Volume 1
Text, Volume 2 Appendices, Volume 3 Figures and NTS;
M27 Junction 11-12 Climbing Lane Study, Forecasting and Economics Report, July
2006;
M27 Junction 11-12 Climbing Lanes Handover Environmental Management Plan
(HEMP), Draft September 2008, Draft updated January 2009;
Environmental Commitments Register, 20 March 2009; and
As Built drawings for Planting Design, March 2008, and Landscape Design, December
2008.
5.11 A full list of the background information requested and received to help with the compilation of
this chapter of the report is included in Table C.1 in Appendix C.
Site Visit
5.12 As part of the FYA evaluation, a site visit was undertaken in mid May 2014. This included the
taking of photographs to provide comparison views with selected ES photomontages and OYA
photographs. These are shown in Appendix D.
Consultation
5.13 Three statutory environmental organisations (Natural England, English Heritage and the
Environment Agency), Portsmouth City Council, Fareham Borough Council and Parish
Councils (Boarhunt/ SouthWick and Widley) were contacted as part of the FYA evaluation
regarding their views on the impacts they perceive the road has had on the environment as
shown in Table 5.1.
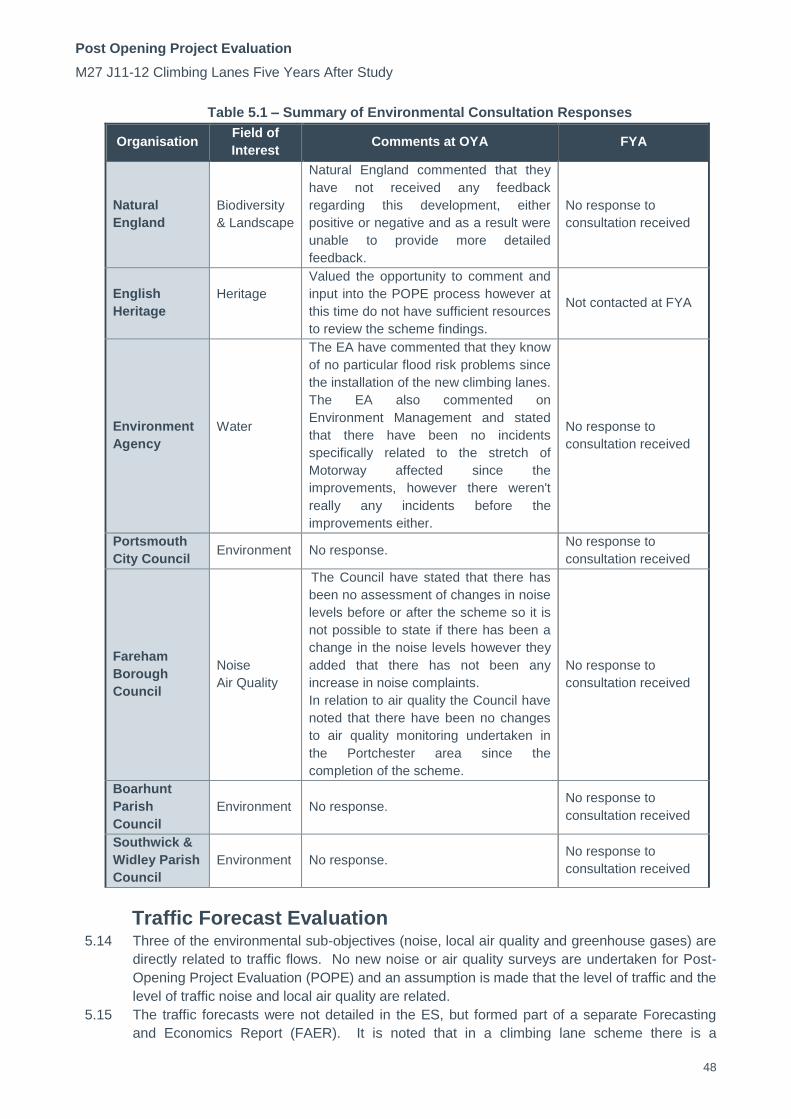
Post Opening Project Evaluation
M27 J11-12 Climbing Lanes Five Years After Study
48
Table 5.1 – Summary of Environmental Consultation Responses
Organisation Field of
Interest Comments at OYA FYA
Natural
England
Biodiversity
& Landscape
Natural England commented that they
have not received any feedback
regarding this development, either
positive or negative and as a result were
unable to provide more detailed
feedback.
No response to
consultation received
English
Heritage
Heritage
Valued the opportunity to comment and
input into the POPE process however at
this time do not have sufficient resources
to review the scheme findings.
Not contacted at FYA
Environment
Agency
Water
The EA have commented that they know
of no particular flood risk problems since
the installation of the new climbing lanes.
The EA also commented on
Environment Management and stated
that there have been no incidents
specifically related to the stretch of
Motorway affected since the
improvements, however there weren't
really any incidents before the
improvements either.
No response to
consultation received
Portsmouth
City Council Environment No response.
No response to
consultation received
Fareham
Borough
Council
Noise
Air Quality
The Council have stated that there has
been no assessment of changes in noise
levels before or after the scheme so it is
not possible to state if there has been a
change in the noise levels however they
added that there has not been any
increase in noise complaints.
In relation to air quality the Council have
noted that there have been no changes
to air quality monitoring undertaken in
the Portchester area since the
completion of the scheme.
No response to
consultation received
Boarhunt
Parish
Council
Environment No response. No response to
consultation received
Southwick &
Widley Parish
Council
Environment No response. No response to
consultation received
Traffic Forecast Evaluation 5.14 Three of the environmental sub-objectives (noise, local air quality and greenhouse gases) are
directly related to traffic flows. No new noise or air quality surveys are undertaken for Post-
Opening Project Evaluation (POPE) and an assumption is made that the level of traffic and the
level of traffic noise and local air quality are related.
5.15 The traffic forecasts were not detailed in the ES, but formed part of a separate Forecasting
and Economics Report (FAER). It is noted that in a climbing lane scheme there is a
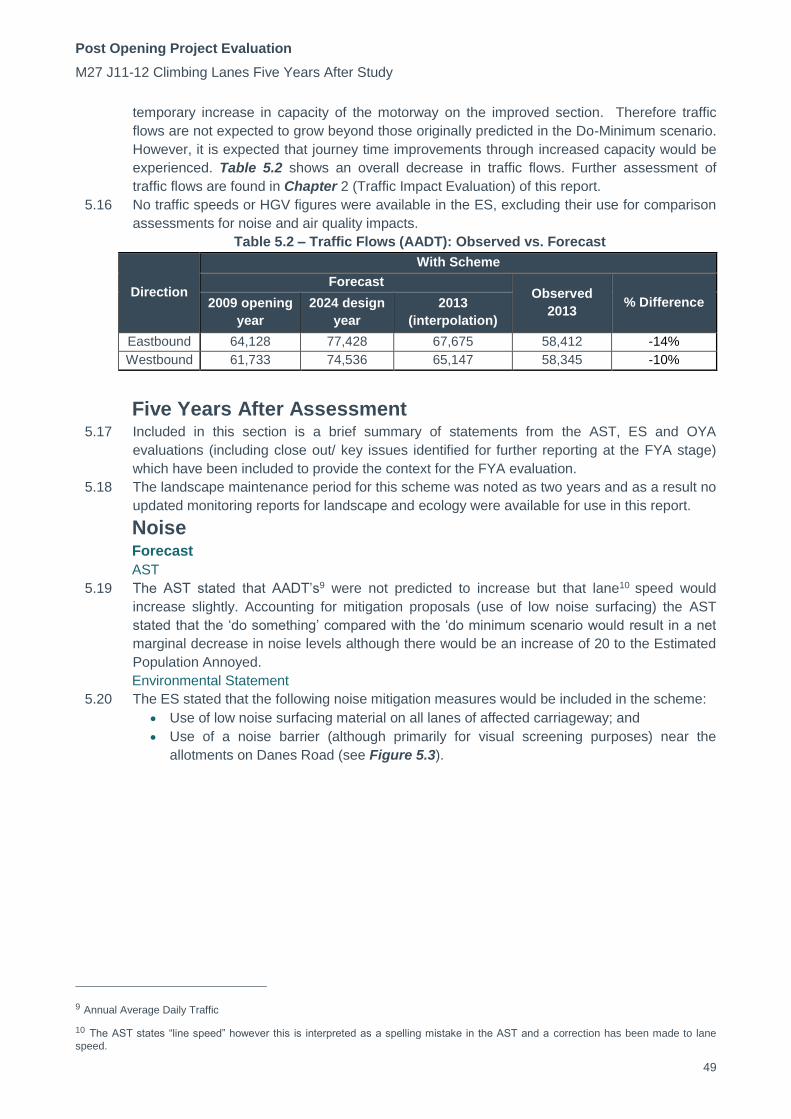
Post Opening Project Evaluation
M27 J11-12 Climbing Lanes Five Years After Study
49
temporary increase in capacity of the motorway on the improved section. Therefore traffic
flows are not expected to grow beyond those originally predicted in the Do-Minimum scenario.
However, it is expected that journey time improvements through increased capacity would be
experienced. Table 5.2 shows an overall decrease in traffic flows. Further assessment of
traffic flows are found in Chapter 2 (Traffic Impact Evaluation) of this report.
5.16 No traffic speeds or HGV figures were available in the ES, excluding their use for comparison
assessments for noise and air quality impacts.
Table 5.2 – Traffic Flows (AADT): Observed vs. Forecast
Direction
With Scheme
Forecast Observed
2013 % Difference 2009 opening
year
2024 design
year
2013
(interpolation)
Eastbound 64,128 77,428 67,675 58,412 -14%
Westbound 61,733 74,536 65,147 58,345 -10%
Five Years After Assessment 5.17 Included in this section is a brief summary of statements from the AST, ES and OYA
evaluations (including close out/ key issues identified for further reporting at the FYA stage)
which have been included to provide the context for the FYA evaluation.
5.18 The landscape maintenance period for this scheme was noted as two years and as a result no
updated monitoring reports for landscape and ecology were available for use in this report.
Noise Forecast
AST
5.19 The AST stated that AADT’s9 were not predicted to increase but that lane10 speed would
increase slightly. Accounting for mitigation proposals (use of low noise surfacing) the AST
stated that the ‘do something’ compared with the ‘do minimum scenario would result in a net
marginal decrease in noise levels although there would be an increase of 20 to the Estimated
Population Annoyed.
Environmental Statement
5.20 The ES stated that the following noise mitigation measures would be included in the scheme:
Use of low noise surfacing material on all lanes of affected carriageway; and
Use of a noise barrier (although primarily for visual screening purposes) near the
allotments on Danes Road (see Figure 5.3).
9 Annual Average Daily Traffic
10 The AST states “line speed” however this is interpreted as a spelling mistake in the AST and a correction has been made to lane
speed.

Post Opening Project Evaluation
M27 J11-12 Climbing Lanes Five Years After Study
50
Figure 5.3 – The noise / screening barrier adjacent to the Cornaway Allotment
Gardens, Danes Road
5.21 On opening in 2009, with mitigation in place, the scheme was predicted to result in a decrease
in exposure to traffic noise for the vast majority of properties. With the scheme in design year
(2024) all properties were predicted to experience decreases in exposure to traffic noise.
These decreases would be marginally less with the scheme than without.
5.22 The ES stated that with or without the scheme there would be a decrease in the percentage
bothered by both traffic noise and vibration. Furthermore the ES stated that there were no
properties within 300m of the scheme that would be likely to be eligible for insulation under the
Noise Insulation Regulations.
OYA conclusions
5.23 A low noise surface was used as expected. In addition to the expected noise barrier at Danes
Road, two additional acoustic barriers were included in the scheme as design changes; at
Anson Grove (shown at FYA in Figure 5.4), Browning Avenue and adjacent to part of
Falmouth Road. These were replacement and upgraded barriers for those removed as a result
of the widening scheme.
Figure 5.4 – View of acoustic barrier near Anson Grove looking east from High Tor
Overbridge
5.24 Based on the traffic forecast evaluation, which concluded that the scheme did not affect traffic
flows, it was likely that the impact of the scheme on the local noise climate was generally as
expected.
Consultation
5.25 Consultation responses for noise and vibration were not received at the time of writing.
Evaluation
5.26 Table 5.2 demonstrates a decrease in traffic flows within the scheme although this reduction
is not sufficient to allow for a ‘better than expected’ result due to the assumption made by
POPE methodology that noise levels will be as expected if observed traffic flows are within
25% more or 20% less than predicted flows.

Post Opening Project Evaluation
M27 J11-12 Climbing Lanes Five Years After Study
51
5.27 POPE has not been provided with the Road Surface Index value of the low noise surface or
the noise reduction properties of the acoustic barriers.
5.28 Based on the information presented in this evaluation, it is concluded that the effects of the
scheme are as expected in terms of noise.
Local Air Quality Forecast
AST
5.29 The AST stated there were no Air Quality Management Areas within the study and that in
future scenarios all residential properties would experience NO2 and PM10 levels that were
within Air Quality Objectives. It was expected that the scheme would result in a slight
deterioration in air quality due to an increase in traffic speed and the reduction in distance
between properties and traffic. A total of 1378 residential properties were predicted to
experience deterioration in air quality (for both PM10 and NO2). Impacts on Portsdown Site of
Special Scientific Interest (SSSI), Downend Chalk Pit SSSI and Portsmouth Harbour Special
Protection Area (SPA) were predicted to be negligible.
Environment Statement
5.30 The ES noted the following with regard to air quality:
Local Air Quality
The baseline position of pollutant concentrations within the study area were well within
the mandatory Air Quality Objectives for all pollutants except nitrogen dioxide;
By the Opening Year, the ES predicted that pollutant concentrations would remain within
the mandatory Air Quality Objectives, with or without the scheme;
The ES predicted that pollutant concentrations would decrease in future years;
In both Do-minimum and Do-Something scenarios, the ES predicts that PM10 would
exceed the provisional Air Quality Objective for the annual mean of this pollutant (it also
stated that this is primarily due to high background concentrations); and
Overall the ES predicted a slight deterioration of Local Air Quality however this was not
considered significant as the deterioration would not exceed mandatory Air Quality
Objectives.
OYA conclusions
5.31 The results of the traffic forecast evaluation concluded that the scheme would not affect traffic
flows. With the effects of the economic downturn taken into account, link flows showed no
change and therefore it was likely that the impacts of the scheme on the different aspects of
air quality were generally as expected.
Consultation
5.32 Consultation responses for Air Quality were not received at the time of writing.
Evaluation
5.33 As can be seen in by Table 5.2 above, the data indicates that the observed traffic flows are
lower than forecast by the FAER. Based on the assumption made by POPE methodology that
air quality will be better than expected if observed traffic flows are greater than 10% less than
predicted flows, it is concluded that the effects of the scheme are better than expected in
terms of local air quality.
Greenhouse Gases 5.34 The assessment of the impacts of transport schemes on emissions of greenhouse gases is
one of the environment sub-objectives. WebTAG notes that carbon dioxide (CO2) is
considered the most important greenhouse gas which is therefore used as the key indicator
for the purposes of assessing the impacts of transport options on climate change. Changes in
CO2 levels are expressed in terms of equivalent tonnes of carbon released as a result of the
scheme.

Post Opening Project Evaluation
M27 J11-12 Climbing Lanes Five Years After Study
52
Forecast
5.35 The AST stated that ‘In the opening year, total CO2 emissions predicted with the scheme in
operation (Do Something 52,586 tonnes/yr) are slightly higher than those predicted for the Do
Minimum scenario (50,989 tonnes/yr) as a result of increases in traffic speeds’. This is an
increase of 1,597 tonnes of CO2, resulting from the scheme.
5.36 By current guidelines, greenhouse gas emissions are reported in terms of tonnes of carbon.
On this basis, the emission was predicted to rise from 13,893 to 14,329 (+435) tonnes of
carbon in the opening year.
5.37 The emission presented in the ES is exactly the same as presented in AST for both the
scenarios. The scheme forecasting was carried out with COBA 11.6, and therefore this was
not the source of the greenhouse gas predictions used for the AST and ES as this version is
not able to calculate carbon emissions. Hence the methodology for the emission used in the
appraisal is unknown.
Evaluation
5.38 An analysis of emissions from vehicles using the M27 scheme section has been undertaken.
In order to undertake this analysis, current Design Manual for Roads and Bridges (DMRB)
guidance has been used to re-forecast carbon emissions for the DM and DS scenarios using
data contained in the Traffic Forecasting and Economics Report. Observed carbon emissions
were calculated using the same methodology for the before and after scenarios, using flow
and speed data collected for this study. As the same geographic area has been modelled for
the forecast and observed scenarios, a clear comparison can be made between the data
outputs. Reforecast and outturn carbon emissions are provided in Table 5.3.
Table 5.3 – Reforecast and Outturn Carbon Emissions (Carbon tonnes/year)
Reforecast Observed
Do Minimum/Counterfactual(based on before) 22,171 24,850
Do-Something/Post opening 23,651 23,042
Net Difference 1,480 (7%) -1808 (-7%)
5.39 It can be seen from Table 5.3 5.3 that the outturn carbon emissions along the scheme section
are lower than the forecast emissions. The five year after opening emissions are lower than
pre-scheme emission and this is due to the lower traffic levels and marginal change in speed
post scheme opening. Hence the scheme’s impact on carbon emission is better than
expected.
Landscape and Townscape Landscape
Forecast
AST
5.40 The AST stated that as the scheme would be accommodated within the existing highway
boundary visual impacts would be limited to a short distance and on small areas of residential
properties immediately adjacent to the road. The existing landform of cuttings and steeply
sloping topography to the north of the scheme would ensure a very tight visual envelope which
would closely follow the majority of the highway boundary. The assessment was neutral.
Environment Statement
5.41 The ES stated that visual impacts were principally confined to within the highway boundary
and largely constituted an increase in urbanisation of the highway corridor. The ES also noted
that the components of the scheme did not greatly impact on the landscape character and
visual impacts would only affect those receptors with direct views of the highway corridor.
5.42 The ES stated that the single greatest impact during operation would be the visual impact of
increased light pollution through the inclusion of highway lighting within both verges from east
of Downend Road Overbridge to Allaway Avenue Underbridge. This would create a significant

Post Opening Project Evaluation
M27 J11-12 Climbing Lanes Five Years After Study
53
alteration from the existing landscape character of the motorway corridor and increase
potential night time visual impacts, particularly adjacent to Cornaway Allotment Gardens and
associated residential properties and open space.
5.43 The Non Technical Summary from the ES mentions the inclusion of change to central reserve
concrete safety barrier. It is noted that this brings in an increased element of urbanisation to
the scheme.
5.44 The ES included landscape mitigation measures to be incorporated into the scheme proposals
in order to reduce the potential visual effect of the proposed improvements as well as further
moderate the impact of the existing motorway. The ES noted that that maintenance of
existing, and design of proposed landscape planting should aim to enhance and promote
biodiversity and sustainable objectives and reflect the policies of the relevant planning
guidance. These measures were as follows:
Maximisation of the retention of existing vegetation to provide visual containment and
integration with the surrounding landscape;
Where proposed, planted mitigation should be based on a palette of species that reflect
those already present within the study area and that may promote local biodiversity.
Removal of scrub encroachment in areas of chalk grassland to enhance biodiversity and
integration into the surrounding landscape; Particular consideration was to be given to
ensuring scrub adjacent to Portsdown Hill SSSI was not removed to the detriment of the
SSSI from degradation of air quality and deposition.
Provision of on and off site planting to ameliorate visual impacts and promote
biodiversity, sustainable objectives and reflect policies of the relevant planning
guidance;
Planting to be undertaken to supplement and soften the impact of structural mitigation
e.g. noise fences;
Sensitive design of supplementary landscape planting to be used to maximise
integration within the wider landscape;
5.45 Two key locations were identified for screen planting; these included Cornaway Allotment
Gardens and the entrance to Hillsley Road Subway.
OYA conclusions
5.46 The OYA report noted that the scheme was implemented within the highway corridor with
minimal disturbance and changes to the existing cutting slopes. Given the existing context of
the road corridor and the location in cutting, the influence on surrounding landscape character
had been limited.
5.47 The OYA report also noted that the scheme had not resulted in any new views towards the
road or significant changes to existing views which was due, in part to the changes to the
lighting scheme and the drainage design.
5.48 Removal of 3 kilometres of lighting was included as design changes during construction,
including not replacing existing lighting. This has resulted in lower impacts than forecast
during the daytime scenario as there were fewer lighting columns and a reduction in
urbanisation. Design changes to the drainage design were implemented due to the small
working area available in some locations that would have resulted in loss of screening
vegetation.
5.49 Compensation for the loss of small areas of habitat was provided in the form of areas of
landscape planting. Habitat enhancement was implemented in selected off site receptor areas.
This included selective scrub removal and creation of hibernacula. The plant species used
were native and the composition of the proposed mix was expected to reflect the nature of
existing scrub vegetation.
Consultation
5.50 Consultation responses for Landscape were not received at the time of writing.
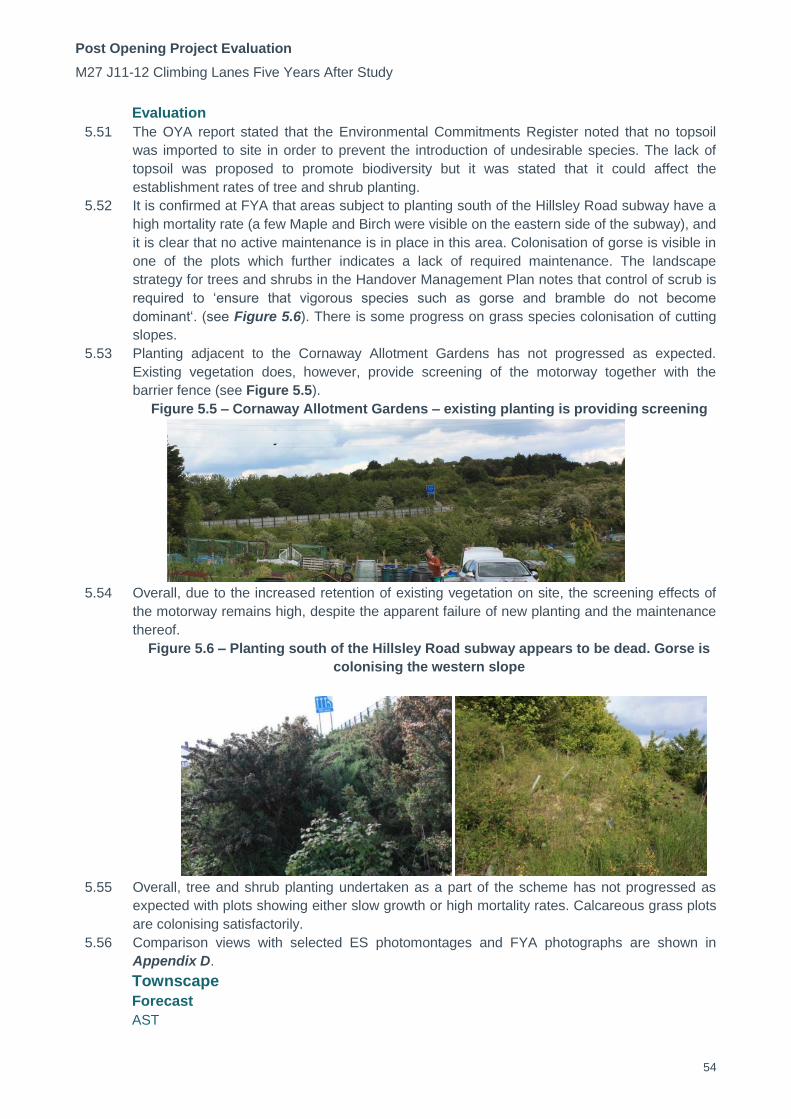
Post Opening Project Evaluation
M27 J11-12 Climbing Lanes Five Years After Study
54
Evaluation
5.51 The OYA report stated that the Environmental Commitments Register noted that no topsoil
was imported to site in order to prevent the introduction of undesirable species. The lack of
topsoil was proposed to promote biodiversity but it was stated that it could affect the
establishment rates of tree and shrub planting.
5.52 It is confirmed at FYA that areas subject to planting south of the Hillsley Road subway have a
high mortality rate (a few Maple and Birch were visible on the eastern side of the subway), and
it is clear that no active maintenance is in place in this area. Colonisation of gorse is visible in
one of the plots which further indicates a lack of required maintenance. The landscape
strategy for trees and shrubs in the Handover Management Plan notes that control of scrub is
required to ‘ensure that vigorous species such as gorse and bramble do not become
dominant‘. (see Figure 5.6). There is some progress on grass species colonisation of cutting
slopes.
5.53 Planting adjacent to the Cornaway Allotment Gardens has not progressed as expected.
Existing vegetation does, however, provide screening of the motorway together with the
barrier fence (see Figure 5.5).
Figure 5.5 – Cornaway Allotment Gardens – existing planting is providing screening
5.54 Overall, due to the increased retention of existing vegetation on site, the screening effects of
the motorway remains high, despite the apparent failure of new planting and the maintenance
thereof.
Figure 5.6 – Planting south of the Hillsley Road subway appears to be dead. Gorse is
colonising the western slope
5.55 Overall, tree and shrub planting undertaken as a part of the scheme has not progressed as
expected with plots showing either slow growth or high mortality rates. Calcareous grass plots
are colonising satisfactorily.
5.56 Comparison views with selected ES photomontages and FYA photographs are shown in
Appendix D.
Townscape
Forecast
AST

Post Opening Project Evaluation
M27 J11-12 Climbing Lanes Five Years After Study
55
5.57 The AST predicted that as the Scheme was wholly contained within the existing highway
corridor, no townscape features would be impacted upon. The assessment was neutral.
Environmental Statement
5.58 The ES identified that the overall townscape effects of the Scheme would be Neutral.
OYA Evaluation
5.59 The one year evaluation noted that the motorway corridor was distinct from the adjacent areas
(more open landscape to the north and townscape to the south) and considered that, as
expected, no townscape features had been impacted on as a result of the scheme. It noted
further that the reduced lighting scheme had reduced the impact of the motorway lighting,
although the scheme was within an already well lit urban area.
Consultation
5.60 Consultation responses for Townscape were not received at the time of writing.
Evaluation
5.61 No further evaluation has been undertaken, as no changes regarding Townscape have been
identified during the FYA site visit and there were no unresolved issues from the OYA report.
5.62 Based on this information, it is concluded that the effects of the scheme on Townscape remain
as expected.
Heritage Forecast
AST
5.63 The AST stated that there would be no identified impacts on known sites of national or local
importance within the study area and that there was a very low potential for discovery of
additional sites (although the possibility existed). Overall the scheme would have a Neutral
effect on Heritage.
Environmental Statement
5.64 The ES noted that the study area contained four scheduled monuments (three of which are
also listed buildings), together with five other listed buildings. Historically important hedgerows
also existed within the study area.
5.65 The ES stated that the scheme would not fundamentally alter the alignment or scale of the
road and therefore there would be negligible impact on the visual setting of any upstanding
monuments or buildings. The ES also stated that the potential for survival of hitherto
unrecorded archaeological deposits within the motorway fence line was extremely low and
that any surviving features would already be truncated, depleted or otherwise damaged.
5.66 The principle aim of the archaeological mitigation was noted as being to minimise the physical
effect of the scheme on the visible and buried cultural heritage resource and archaeology as
far as is reasonably practicable.
OYA Evaluation
5.67 The OYA assessment noted that the scheme had been implemented within the highway
corridor as expected, with minimal disturbance and changes to the existing cutting slopes. It
concluded that given the existing context of the road corridor and the location in cutting, the
influence on setting of surrounding historic features (such as Listed Buildings and Scheduled
Monuments) was considered to be neutral. With regard to archaeology, it was reported at
OYA that the evaluation and watching briefs were undertaken as planned and that no
archaeological features, artefacts or deposits were found. Confirmation of the deposition of the
archive remained outstanding at OYA.
Consultation
5.68 Consultation responses for Heritage were not received at the time of writing.
Evaluation
5.69 The Hampshire Records Office advised that they could not trace a deposition of the archive
with specific references to the scheme

Post Opening Project Evaluation
M27 J11-12 Climbing Lanes Five Years After Study
56
5.70 No further evaluation has been undertaken, as no changes regarding Heritage have been
identified during the FYA site visit. The Handover Environmental Management Plan stated that
no archaeological features, deposits or artifacts were exposed during the construction works.
Biodiversity Forecast
AST
5.71 The AST stated that there would be no significant long term impacts to Portsmouth Harbour
Special Protection Area (SPA), Portsdown Site of Special Scientific Interest (SSSI) or any
Sites of Importance for Nature Conservation (SINC’s). It also stated that short term impacts on
reptiles, invertebrates and vegetation would be mitigated by habitat enhancement. Overall the
scheme would have a Neutral effect on Biodiversity.
Environment Statement
5.72 The ES noted that the scheme would not result in any effects on Portsmouth Harbour SPA
(directly or indirectly) nor would it have significant long term effects on Portsdown SSSI or any
of the SINC’s within the study area. However the ES does note that there would be short to
medium term adverse impacts at Hill Road Paddock SINC and Anson Grove SINC, however
these would drop to neutral in the long term.
5.73 Within the highway corridor the ES noted that there would be temporary minor negative
impacts upon the chalk grassland and the associated protected and notable species (namely
invertebrate and reptile populations), due to construction activities.
5.74 The ES noted that there would be compensation for loss of and disturbance to verge habitats,
particularly chalk grassland, which would take the form of management to improve the extent
and quality of retained areas of chalk grassland within the highways soft-estate. On site
management would be focused on scrub removal, particularly of introduced species such as
Sycamore and on large stands of single species (e.g. Bramble). Cyclical management would
continue in subsequent years aimed at ensuring chalk grassland is not lost to scrub regrowth.
This management would be undertaken so as to be sympathetic to fauna such as reptiles and
invertebrates present within these areas, particularly on the south-facing embankments, which
provide ideal habitat for these species groups. Within these chalk grassland areas small areas
of scrub would be retained to provide suitable cover for invertebrates and reptiles and provide
a high biological and structural diversity to the habitat present. Larger areas of diverse scrub
would be retained outside of the chalk grassland areas. Cyclical management would also seek
not to compromise any screening functions of the scrub.
5.75 No imported earthworks material, particularly topsoil, would be used on the site in order to
prevent the introduction of undesirable plant species into the area that may out-compete chalk
grassland species. Any disturbed areas would be left to regenerate naturally from the existing
seedbank.
5.76 Overall, the scheme was predicted to have slight adverse effects in the short to medium term.
In the long term the overall effect on biodiversity would be neutral.
OYA conclusions
5.77 The OYA report observed that reptile translocation was undertaken as advance works by the
MAC prior to the main contract being awarded due to seasonal constraints; hibernacula’s were
created outside the widened scheme and the reptile fences installed. The final scheme had
not significantly altered reptile habitat. Habitat enhancement was implemented in selected off
site receptor areas. This included selective scrub removal and creation of hibernacula. The
report concluded that the establishment of habitat enhancement should be considered at FYA
by which time the draft HEMP was expected to have been finalised.
Consultation
5.78 Consultation responses for Biodiversity were not received at the time of writing.

Post Opening Project Evaluation
M27 J11-12 Climbing Lanes Five Years After Study
57
Evaluation
5.79 No monitoring reports or an updated HEMP were made available to POPE to allow an
assessment of the hibernacula and reptile relocation, or habitat enhancement works
undertaken as a part of the scheme.
5.80 The site visit undertaken in May 2014 noted that there appeared to be limited progress of
shrub and tree planting plots planted as a part of the scheme, although the species rich
grassland (natural and calcareous) appeared to be progressing as expected.
5.81 Overall, an assessment of the success of the biodiversity mitigation measures and impact of
the scheme cannot be provided due to the limited information available to POPE.
Water Quality and Drainage Forecast
AST
5.82 The AST stated that by eliminating road runoff to aquifers (by sealed drainage) water quality
would be improved. The inclusion of spill containment before each outfall would also reduce
the risk of accidental spillage. There would be no significant effect on Portsmouth Harbour
SPA as the quality of discharge would be improved and outfall rate maintained by the
attenuation system. The predicted impacts were assessed to be slight beneficial overall.
Environmental Statement
5.83 The ES stated that the permanent land drainage and flooding effects would result in a small
increase in the volume of runoff in proportion to the area drained, but after the proposed
mitigation the assessment was neutral on these attributes.
5.84 In relation to water quality, the application of an appropriate Construction Environmental
Management Plan (CEMP) and adoption of best practice during the construction phase would
mean any temporary effect to either the surface or groundwater system would be negligible.
Furthermore the ES stated that the interception facilities to be incorporated at each outfall
would be designed such that they could be isolated to prevent discharge to outfalls in the
event of an accident or spill.
5.85 During the operation of the scheme, the predicted effects on water quality were stated as
minor beneficial due to a predicted reduction of contaminants in the run-off and the reduction
of accidental spillages impacting on watercourses.
5.86 The ES also addressed the impact on groundwater resources and quality. On this matter the
ES stated that the underlying chalk aquifer was both vulnerable and important but that the
water table was said to be approximately 10m below the existing carriageway.
5.87 The ES stated that all existing and new gullies, culverts and drainage pipe work should either
be modified or designed to be sealed to prevent road drainage from discharging to ground,
although it was concluded that volumes generated by the scheme would be slightly reduced.
The overall predicted effects were assessed as minor beneficial.
OYA Evaluation
5.88 The OYA assessment stated that the drainage design for the scheme was adapted during
construction to allow for retention of existing vegetation and that based on the information
available mitigation appeared to have been implemented as expected. The report suggested
that the water objective should be considered again at the FYA stage, particularly with regard
to the effectiveness of the measures included in the scheme. It concluded that consultation
should be repeated as no feedback had been received for the OYA report.
Consultation
5.89 Consultation responses for Water Quality and Drainage were not received at the time of
writing.
Evaluation
5.90 No information has been received by POPE to indicate that the drainage installed by the
scheme is operating other than as expected.
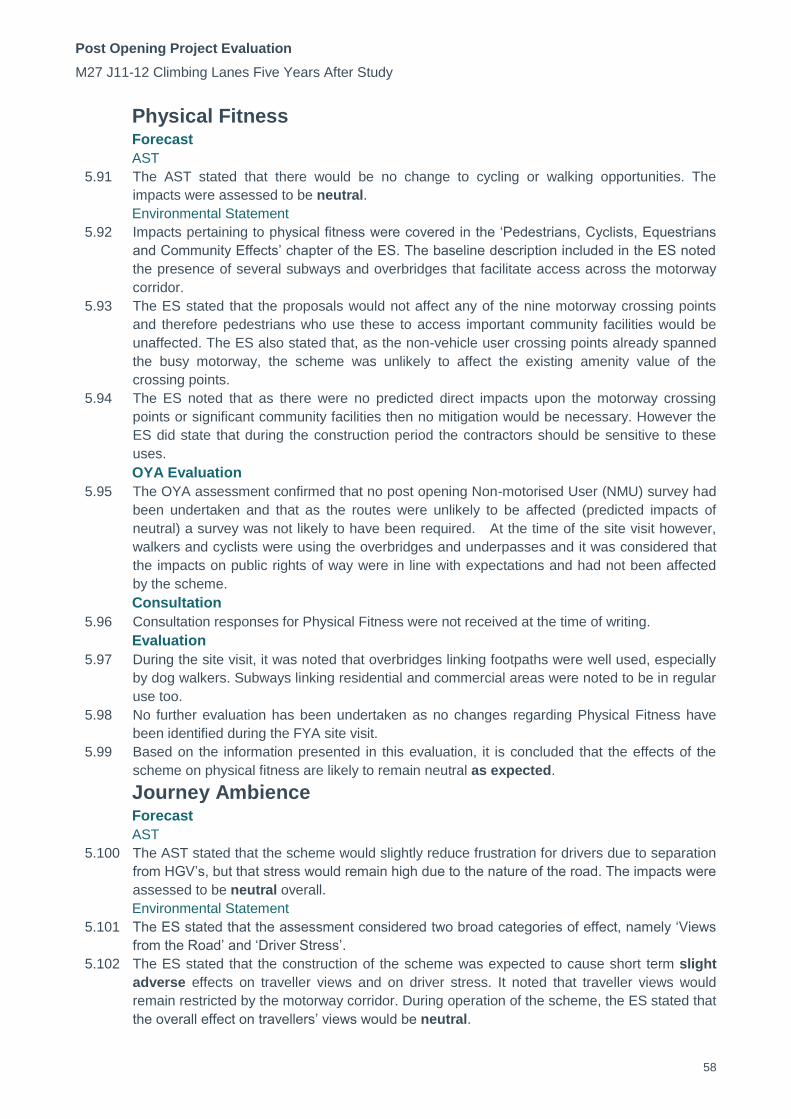
Post Opening Project Evaluation
M27 J11-12 Climbing Lanes Five Years After Study
58
Physical Fitness Forecast
AST
5.91 The AST stated that there would be no change to cycling or walking opportunities. The
impacts were assessed to be neutral.
Environmental Statement
5.92 Impacts pertaining to physical fitness were covered in the ‘Pedestrians, Cyclists, Equestrians
and Community Effects’ chapter of the ES. The baseline description included in the ES noted
the presence of several subways and overbridges that facilitate access across the motorway
corridor.
5.93 The ES stated that the proposals would not affect any of the nine motorway crossing points
and therefore pedestrians who use these to access important community facilities would be
unaffected. The ES also stated that, as the non-vehicle user crossing points already spanned
the busy motorway, the scheme was unlikely to affect the existing amenity value of the
crossing points.
5.94 The ES noted that as there were no predicted direct impacts upon the motorway crossing
points or significant community facilities then no mitigation would be necessary. However the
ES did state that during the construction period the contractors should be sensitive to these
uses.
OYA Evaluation
5.95 The OYA assessment confirmed that no post opening Non-motorised User (NMU) survey had
been undertaken and that as the routes were unlikely to be affected (predicted impacts of
neutral) a survey was not likely to have been required. At the time of the site visit however,
walkers and cyclists were using the overbridges and underpasses and it was considered that
the impacts on public rights of way were in line with expectations and had not been affected
by the scheme.
Consultation
5.96 Consultation responses for Physical Fitness were not received at the time of writing.
Evaluation
5.97 During the site visit, it was noted that overbridges linking footpaths were well used, especially
by dog walkers. Subways linking residential and commercial areas were noted to be in regular
use too.
5.98 No further evaluation has been undertaken as no changes regarding Physical Fitness have
been identified during the FYA site visit.
5.99 Based on the information presented in this evaluation, it is concluded that the effects of the
scheme on physical fitness are likely to remain neutral as expected.
Journey Ambience Forecast
AST
5.100 The AST stated that the scheme would slightly reduce frustration for drivers due to separation
from HGV’s, but that stress would remain high due to the nature of the road. The impacts were
assessed to be neutral overall.
Environmental Statement
5.101 The ES stated that the assessment considered two broad categories of effect, namely ‘Views
from the Road’ and ‘Driver Stress’.
5.102 The ES stated that the construction of the scheme was expected to cause short term slight
adverse effects on traveller views and on driver stress. It noted that traveller views would
remain restricted by the motorway corridor. During operation of the scheme, the ES stated that
the overall effect on travellers’ views would be neutral.

Post Opening Project Evaluation
M27 J11-12 Climbing Lanes Five Years After Study
59
5.103 A moderate beneficial impact on driver stress was predicted due to the increased capacity of
the carriageway, enhanced surface quality, reduced frustration and fear of accidents.
Nevertheless, overall driver stress would remain high due to the nature of the M27.
5.104 Mitigation measures described in the ES were limited to standardised approaches for signage,
lighting, safety barriers and surfaces, minor alteration to all of these would, it was said, have
some limited effect on views from the road and on driver stress.
OYA Evaluation
Traveller Views
5.105 The OYA assessment concluded that the nature of the motorway corridor and the extents of
the cutting had not been altered significantly. The signage strategy for the scheme was largely
unaltered with only minor changes (relocation) due to the widening and additional signage to
indicate merges. Traveller views were considered to be as expected.
Driver Stress
5.106 Chapters 2 and 3 of the OYA POPE report addressed traffic volume and flow and road safety.
The broad findings in relation to these factors was summarised as follows:
traffic volumes were largely in line with predictions;
average daily link journey times had reduced, particularly in peak periods; and
the spatial distribution, rate and nature of accidents was broadly similar to before the
scheme.
Traveller Care
The scheme has not changed access from the M27 to local facilities and as such, the
impact of the scheme on traveller care is considered to be neutral.
Consultation
5.107 Consultation responses for Journey Ambience were not received at the time of writing.
Evaluation
5.108 As noted in the traffic section of this report, average weekday traffic within the M27 J11-12
scheme and other roads is lower than pre-scheme, with a marginal growth in FYA compared
to OYA. Westbound journey times are faster by 21 and 27 seconds in the AM and PM peak
respectively compared to pre-scheme and eastbound journey times are slightly higher than
the pre-scheme (8 and 12 seconds in the AM and PM peak respectively).
5.109 The scheme has had a moderate beneficial effect on journey time reliability in line with that
forecast in the appraisal and the route stress has reduced from 94% in the pre-scheme to 84%
post opening. Collisions resulting in injury have seen a slight increase at FYA when
accounting for background trend in collision reduction although without this accounting,
collisions have reduced.
5.110 Overall, based on the information above, driver stress has reduced due to an improvement in
journey times.
5.111 No further evaluation has been undertaken as no changes regarding Journey Ambience have
been identified during the FYA site visit.
5.112 Based on the information presented in this evaluation, it is concluded that the effects of the
scheme on journey ambience are likely to remain neutral as expected.

Post Opening Project Evaluation
M27 J11-12 Climbing Lanes Five Years After Study
60
Key Points – Environment
Noise
The observed traffic flow within the scheme extents is lower than predicted in the Traffic Forecast and Economic Report although as it does not exceed the thresholds set by POPE Methodology for noise to be considered ‘better or worse than’ expected, the scheme remains ‘as expected’.
Air Quality
As stated for noise, the observed traffic flows for the scheme are lower than predicted and based on the thresholds set by POPE Methodology for Air Quality it is concluded that the effects of the scheme are ‘better than expected’ in terms of local air quality.
Greenhouse Gases
The five year after opening emissions are lower than pre-scheme emission and this is due to the lower traffic levels and marginal change in speed post scheme opening. Hence the scheme’s impact on carbon emission is better than expected.
Landscape and Townscape
Overall, tree and shrub planting undertaken as a part of the scheme has not progressed as expected with plots showing either slow growth or high mortality rates. Calcareous grass plots (are colonising satisfactorily. However, it is noted that due to design changes during construction, retention of vegetation was higher than anticipated and it is not expected that screening effects or habitat accommodation has been negatively affected by the failure of small pockets of scheme planting.
It is noted in the LEMP that a two year maintenance period was scheduled for the scheme. It is noted that planting undertaken as a part of the scheme is not immediately adjacent to protected sites, but the enhancement undertaken appears to have failed largely due to a lack of topsoil and appropriate maintenance. No replacement planting for plant failures has been undertaken. Planting plots are not receiving the required maintenance noted in the draft HEMP.
Biodiversity
No monitoring reports have been produced within the five year after maintenance period for reptile translocation and creation of hibernacula outside the widened scheme.
Due to the lack of information received by POPE, no final evaluation has been made.
Cultural Heritage
No confirmation of the deposition of the finds has been received. The Hampshire Records office confirmed that they could not trace records for the scheme.
No further evaluation has been undertaken as a part of the FYA assessment. The effects of the scheme on built heritage are as expected.
Water
No information has been made available to POPE which would indicate that the scheme drainage measures are performing other than as intended.
Physical Fitness
Footpaths and cycleways viewed during the FYA site visit were well used and appeared to be capable of performing as expected.
Journey Ambience
Driver stress has decreased due to journey time reductions and reductions in collision overall, although serious collisions have increased in number.
Based on the information presented it is concluded that the effects of the scheme on journey ambience are likely to remain as expected.
Post Opening Project Evaluation
M27 J11-12 Climbing Lanes Five Years After Study
61
6. Accessibility and Integration 6.1 This chapter evaluates the impact of the scheme in terms of the accessibility and integration
objectives; comparing qualitative forecast assessments from the scheme AST with post-
opening findings and analysis of policy objectives.
Accessibility 6.2 The accessibility objective is concerned with how the scheme has affected the ability of people
in different locations to reach different types of facility, using any mode of transport. The
accessibility objective consists of three sub-objectives. These are:
Option values;
Access to the transport system; and
Severance
Option Values
6.3 Option values, as defined in WebTAG, relate to the availability of different transport modes
within the study area, even if they are not used. For example, a car user may value a bus
service along their route even if they never used it because they have the option of another
mode should their car become unavailable.
Forecast
6.4 For the objective regarding option values, the AST states that there should be ‘no change to
availability of transport services’. As such the AST forecast a score of ‘neutral’ for this
objective.
Evaluation
6.5 The outturn evaluation is neutral (as expected) because there has been no change to option
values as a result of the scheme.
Access to the Transport System
6.6 WebTAG states that access to the transport system is strongly influenced by the two key
variables introduced at the start of this section, i.e. access to a private car and proximity to a
public transport service.
Forecast
6.7 The scheme appraisal stated that ‘No changes affecting changes to the transport system’ and
forecast a score of ‘neutral’ for this objective.
Evaluation
6.8 The outturn evaluation is neutral (as expected) because there has been no change to access
to the transport system as a result of the scheme.
Severance
6.9 Severance refers to the degree to which movement and activities within the community are
affected by the presence of a major road or other transport link, and particularly the degree of
separation of residents from the facilities and services they use within their community.
Forecast
6.10 The scheme appraisal stated that ‘No change to routes crossing the scheme’. The forecast
impact for this sub objective is ‘neutral’.
Evaluation
6.11 There has been no change to the crossing provision so the impact on severance is neutral as
expected.
Integration 6.12 The integration objective consists of two main elements:
Interchange with other transport modes: how the scheme assists different modes of
transport in working together and the ease of people moving between them to choose
sustainable transport choices; and

Post Opening Project Evaluation
M27 J11-12 Climbing Lanes Five Years After Study
62
Land Use Policy and Other Government Policies: how the scheme integrates with local
land use and wider government objectives.
Transport Interchange
6.13 The transport interchange objective relates to the extent to which the scheme contributes
towards the Government objective of improving transport interchange for passengers and
freight.
Forecast
6.14 The AST states: ‘No effect on passenger or freight interchange facilities’. The forecast impact
for this sub objective is ‘neutral’.
Evaluation
6.15 There has not been a direct impact on the provision of transport interchange facilities. The
outturn impact is therefore neutral as expected.
Land Use and Other Government Policy
6.16 This section looks at the scheme in relation to national, regional and local level land use and
development policies.
Forecast
6.17 The scheme forecast was slight beneficial with regards to the integration with local, regional
and national policy.
Evaluation
6.18 An evaluation of the impact of the scheme in relation to local, regional and national policy is
contained in Table 6.1.
Key Points – Accessibility and Integration
Accessibility It is considered that the AST rating of neutral for the Option Values, Severance and
Access to the Transport System sub-objectives is appropriate given the outturn impact of the scheme.
Integration The scheme has not had an impact on the provision of public transport interchange,
as expected.
The scheme integrates well with the objectives set out in regional policies and contributes to improving the reliability of the transport system in region. The scheme’s impact on Land Use and Other Government Policies is therefore considered to be beneficial.

Post Opening Project Evaluation
M27 J11-12 Climbing Lanes Five Years After Study
63
Table 6.1 – Scheme Alignment with National, Regional and Local Policy
Policy/Docu
ment Relevant Policy Objective/Reference Relevant Scheme Impacts Alignment
Lo
ca
l a
nd
Su
b-R
eg
ion
al
Po
lic
ies
Hampshire
Local
Transport
Plan (HLTP)
The objectives of HLTP are:
To increase accessibility to services.
To promote safety.
To reduce the impact and effect of congestion.
To widen travel choice.
To contribute towards improvements in air quality.
To support wider quality of life objectives.
To encourage value for money and efficient asset management. The HLTP includes a number of Area Transport Strategies. The M27 Junctions 11-12 is covered within the Solent Transport Strategy, which indicates that the scheme will play a part in the regeneration
of the Fareham – Gosport Peninsular.
The HLTP states that Hampshire County Council welcomed the climbing lanes scheme as: “These may, in part, help to address capacity issues on the M27 and therefore be of assistance in improving
access to the Fareham and Gosport peninsula”.
The HLTP states that the South Downs area running from Winchester to Eastbourne is currently being designated as a National Park this will include the East Hampshire and Sussex Downs Areas of
Outstanding Natural Beauty. Although the M27 climbing lanes scheme does not fall within this area it is expected that the tourism and leisure opportunities presented will increase the amount of traffic
using the M27 between Junctions 11-12 where the climbing lanes have been implemented.
The Port at Portsmouth is designated as an International Gateway in the HLTP and is reached by leaving the M27 at Junction 12 and using the M275. The port is the UK’s second busiest continental
ferry port that caters for passengers and road haulage operators. Expected growth at the port will increase the amount of traffic using the M27 Junctions 11-12.
Southampton Airport and Port are both designated as International Gateways access to which is via the M27. Works carried out at Junctions 11-12 of the M27 will have effects on the congestion and
functioning of the motorway network around Southampton.
The scheme has increased the capacity of the M27 in both directions on a key part of the network.
Local air quality has improved (although this is due to reduced traffic volumes not necessarily associated with the scheme).
The number of collisions on the M27 has increased in the eastbound direction.
Partial
Portsmouth
City Local
Plan (2001-
2011)
The Portsmouth City Local Transport Plan (PCLP) 2001 -2011, adopted 21st July 2006, does not mention the M27 climbing lanes scheme.
Housing Employment and Regeneration
The PCLP mentions the Gateway Project which involves a coordinated approach being taken toward environmental improvements in the west of the city including along the M27/M275 and Mile End
Road. This is a scheme that is located at Junction 12 of the M27 and so is very close to the climbing lanes scheme. The benefits of the climbing lanes scheme will be felt at the Gateway Project
including congestion reduction and the associated environmental benefits.
The scheme has increased the capacity of the M27 in both directions on a key part of the network. Yes
Reg
ion
al P
oli
cy
Regional
Economic
Strategy
(2006-2016)
Portsmouth and Southampton are identified in the Regional Economic Strategy being Regional Hubs and as such are centres of economic activity and transport services and was identified as one of the
eight locations within the South East targeted for infrastructure investments.
The seventh of nine priorities established for the Coastal South East Region is to “Improve connectivity along the coast and with key hinterlands and London of which would be shown through:
“Appropriate solutions adopted and investment secured for improvements along the M27 / A27 / A259 South Coast artery, A2 and Solent-Midlands A34 corridor”
One of the targets for achieving this is to: “Reduce road congestion and pollution levels by improving travel choice, promoting public transport, managing demand and facilitating modal shifts”.
The scheme has increased the capacity of the M27 in both directions on a key part of the network. Yes
South East
Plan
Regional
Spatial
Strategy
(May 2009)
M27 climbing lanes scheme is listed as a strategic transport infrastructure priority.
The South Hampshire Sub Regional Transport Policy SH7 states that “The transport and planning authorities will work together to… manage the strategic transport network for longer distance journeys
(especially from/to the ports of Southampton and Portsmouth and Southampton Airport) and the local network for shorter journeys”.
A Strategic Development Area is allocated just to the north of Fareham. This envisages the construction of up to 10,000 dwellings, with access to the M27 at either Junction 10 or 11.
The scheme has been implemented in line with the proposals.
Yes
Nati
on
al
Po
lic
y
The Future
of
Transport: a
Network for
2030
The Strategy builds on the progress that had already been made since the implementation of the 10 year plan for transport. This plan extended out to 2014-2015 but strategy also looks even further
ahead, at the challenges we face over next 20-30 years.
The Strategy is build around three themes:
Sustained investment;
Improvements in transport management; and
Planning ahead.
The main goal is to provide a road network that provides a more reliable and free-flowing system for motorists, other road users and businesses, where travellers can make informed choices about how
and when they travel, and so minimise the adverse impact of road traffic on the environment and other people.
The scheme provides an improved road network to cater for the traffic along the corridor.
Yes
Action for
Roads -
A network
for the 21st
century
(July 2013)
Support the UK economy and drive growth into the future through provision of a well-connected road infrastructure with sufficient capacity;
Push for greater safety, and avoid letting the improvements of recent years breed complacency; and
Ensure transport plays its part in meeting carbon budgets and other environmental targets.
By improving the strategic road network in the area, the scheme enhances the integrated transport network at both a local and regional level, supporting economic growth objectives.
Observed changed in carbon emissions is lower than forecast.
Yes

Post Opening Project Evaluation
M27 J11-12 Climbing Lanes Five Years After Study
64
7. Appraisal Summary Table &
Evaluation Summary Table Appraisal Summary Table
7.1 The AST is a brief summary of the main economic, safety, environmental and social impacts
of a highway scheme. Table 7.1 presents the AST for the scheme.
7.2 The version of the AST dated 28 July 2006 is reproduced as Table 7.1, and is evaluated in
this POPE study.
7.3 The AST presents a brief description of the scheme, a statement detailing the problems that
the scheme planned to address, and makes an assessment of the scheme’s predicted
qualitative and quantitative impacts against the following core NATA objectives:
Environment – an estimate of the impact of the scheme on factors such as noise, local
air quality, landscape, biodiversity, and water;
Safety – measured reduction in the number and severity of accidents and qualitative
assessment of impacts on security;
Economy – Estimated impact of the scheme upon journey times, vehicle operating costs,
scheme costs, journey time reliability and wider economic impact;
Accessibility – A review of scheme impact upon access to the public transport network,
community severance, and non-motorised user impact; and
Integration – A description of how a scheme is integrated with wider local planning,
regional and national policy objectives.
Evaluation Summary Table 7.4 The EST was devised for the POPE process to record a summary of the outturn impacts
against the NATA objectives, compared to the predictions in the AST.
7.5 Drawing on the results presented in this report, Table 7. presents the EST for the scheme. An
assessment of each of the objectives at the FYA stage is given. Where possible, the format of
the EST mirrors the appearance and process of the AST to enable direct comparison between
the two.
7.6 The monetary benefit quoted in the AST match those given in the Forecasting and Economics
Report (FAER), with ‘Low’ in the AST corresponding to ‘Pessimistic’ in FAER, and ‘High’ in the
AST corresponding to ‘Optimistic’ in FAER. No central case is shown in the AST, but there are
‘Reference’ case figures in FAER. This reference case matches the COBA output supplied to
POPE.
7.7 With regard to scheme cost, the figure of £45m shown in the top right-hand corner of the AST
seems to be the net present value (NPV), not the PVC.

Post Opening Project Evaluation
M27 J11-12 Climbing Lanes Five Years After Study
65
Table 7.1 – Appraisal Summary Table (AST)
APPRAISAL SUMMARY TABLE – Stage 3: Environmental Statement
M27 JUNCTION 11-12
CLIMBING LANES
Description: New climbing lanes on the M27 between Fareham and Portsmouth eastward from Junction 11 and westwards
from Junction 12
Problems: Flows at capacity at peak periods.
Slow moving traffic contributing to congestion
Present Value of Costs to
Public Accounts £45m
OBJ SUB-OBJECTIVE QUALITATIVE IMPACTS QUANTITATIVE IMPACT ASSESSMENT
En
vir
on
men
t
Noise
AADTs are not predicted to increase, but line speed will increase slightly. Existing noise attenuation measures will be retained as mitigation. Benefits from new low-
noise surfacing on all lanes of the affected carriageways will be achieved, although this will be marginally offset by the effects of increased line speed. The net
result will be a marginal decrease in noise levels. An estimated 269 people will continue to be exposed to road traffic noise in excess of 70dB with zero in excess
of 75 dB. 135 people would no longer be exposed to road traffic noise in excess of 75 dB in the opening year.
Estimated population annoyed:
Do Minimum: 731
Do Something: 751
Estimated population annoyed:
Do Something–Do Minimum =20
Local Air Quality
There are currently no Air Quality Management Areas in the study area. All residential properties experience NO2 and PM10 levels within the Air Quality Objectives
in future scenarios. The scheme is predicted to result in a slight deterioration in air quality due to an increase in traffic speed and the reduction in distance between
properties and traffic. However no increases of annual mean PM10 of more than 1µg/m3 or increases in annual NO2 of more than 2µg/m3 are predicted at residential
properties. Impacts on Portsdown SSSI, Downland Chalk Pit SSSI and Portsmouth Harbour SPA are negligible.
No. of Properties PM10 NO2
Air Q improved 0 0
Air Q Deterioration 1378 1378
PM10 Assessment score +77.77
NO2 Assessment +71.86
Greenhouse Gases
In the opening year, total CO2 emissions predicted with the scheme in operation (Do Something 52,586 tonnes/yr) are slightly higher than those predicted for the
Do Minimum scenario (50,989 tonnes/yr) as a result of increases in traffic speeds.
Present (2003) = 49,254 (tonnes/yr)
Do-minimum 2009 = 50,989
Do-scheme 2009 = 52,586
2009(DS-DM)=+1597 tonnes/yr
Landscape
Proposed scheme is accommodated within the existing highway boundary. Visual impact limited to short distance on small areas of residential properties adjacent.
Existing landform – cuttings and steeply sloping topography to the north of the scheme ensure a very tight visual envelope that closely follows the majority of the
highway boundary
Neutral
Townscape Scheme wholly contained within existing highway corridor – no townscape features impacted upon. Neutral
Heritage of Historic
Resources No identified impacts on known sites of national or local importance within study area; very low potential for discovery of additional sites, but possibility does exist Neutral
Biodiversity Proposals confined to the existing footprint. No significant long term impacts predicted to Portsmouth Harbour SPA, Portsdown SSSI or any SINCs. Short term
impacts on reptiles, invertebrates and vegetation mitigated by habitat enhancement and recreation. Neutral
Water Environment
Water quality improvements by eliminating road runoff to aquifers by sealed drainage. Risks from accidental spillage reduced by the incorporation of spill
containment before each outfall. No significant effect on Portsmouth Harbour SPA as quality of discharge improved by passive interception and increase in quantity
of freshwater SPA by additional drained carriageway area is <0.02% and rate is kept at current levels by attenuation within system.
Slight beneficial
Physical Fitness No change to cycling/ walking opportunities Neutral
Journey Ambience Slight reduction in frustration due to separation from HGVs, but Stress remains ‘high’ due to nature of road. Neutral
Safe
ty
Accidents Accident benefits are possible, however DMRB guidance (Volume 13 Section 1) provides a constant accident rate for D3 and D4 motorways, hence evaluation has
not been included within the economic assessment. Neutral
Security No change to any indicators Neutral
Eco
no
my
Public Accounts COBA and QUADRO results using a 3.5% discount rate. All costs are 2002 prices discounted to 2002 and are shown in weighted £m High: central govt PVC £8.868m
Low: central govt PVC £8.430m
High: PVC £8.868m
Low: PVC £8.430m
TEE: Business Users &
Transport Providers COBA and QUADRO results using a 3.5% discount rate. All costs are 2002 prices discounted to 2002 and are shown in weighted £m
High Low
Users PVB £41.174m £19.317m
Trans prov PVB -£0.003m -£0.022m
Other PVB £0.000m £0.000m
High: PVB £41.171m
Low: PVB £8.430m
TEE: Consumers COBA and QUADRO results using a 3.5% discount rate. All costs are 2002 prices discounted to 2002 and are shown in weighted £m High: Users PVB £33.312m
Low: Users PVB £15.207m
High: Users PVB £33.312m
Low: Users PVB £15.207m
Reliability Journey time reliability likely to be improved Moderate beneficial
Wider Economic
Impacts Paulsgrove and Wymering subject to SEEDA single regeneration funding, but scheme not in a Regeneration Area Neutral
Acce
ssib
ilit
y
Option Values No change to availability of transport services Neutral
Severance No change to routes crossing the scheme Neutral
Access to the Transport
System No changes affecting changes to the transport system Neutral
Inte
gra
tio
n Transport Interchange No effect on passenger or freight interchange facilities Neutral
Land Use Policy All works to be carried out within the existing highway boundary. No changes to local landscape patterns. Scheme generally supported by national, regional, and
local policies Slight beneficial
Other Government
Policies Policies are neither helped nor hindered, reflecting the nature of the scheme proposal Neutral

Post Opening Project Evaluation
M27 J11-12 Climbing Lanes Five Years After Study
66
Table 7.2 – Evaluation Summary Table (EST)
OBJ SUB-
OBJECTIVE QUALITATIVE IMPACTS
QUANTITATIVE
IMPACT ASSESSMENT
En
vir
on
me
nt
Noise Overall, there is a decrease in traffic flows within the scheme although this reduction is not sufficient to allow for a ‘better than expected’ evaluation. - As expected
Local Air Quality Observed traffic flows are lower than forecast and therefore it is concluded that the effects of the scheme are better than expected in terms of local air quality. - Better than expected
Greenhouse
Gases There is a reduction in Carbon emissions along the scheme section post opening compared to the pre-scheme - Better than expected
Landscape Lack of topsoil within planting plots has directly resulted in widespread failures of trees and shrubs. Calcareous grass establishment is in line with expectations at FYA. Planting as a part of the scheme is not
receiving the control of scrub required in the HEMP. Due to the increase in retained vegetation during construction, the effects of the tree and shrub failures is not significant -
Neutral
As expected
Townscape N/A - -
Heritage of
Historic
Resources
Deposition of the archives with the Hampshire Records Office has not been traced. - Neutral
As expected
Biodiversity No monitoring reports or an updated HEMP were made available to POPE to allow an assessment of hibernacula and reptile relocation, or habitat enhancement works undertaken as a part of the scheme. Based
on this, an assessment of the success of the biodiversity mitigation measures and impact of the scheme cannot be provided. - _
Water
Environment No information has been provided to indicate that impacts are other than ‘as expected’. -
Slight Beneficial
As expected
Physical Fitness Footpaths, overbridges and subways appeared to be well used during the site visit and are performing as expected. - Neutral
As expected
Journey
Ambience Driver stress has reduced due a decrease in collisions and increase in journey time reliance. -
Neutral
As expected
Safe
ty Accidents There has been a reduction in the annual number of collisions without accounting for background reduction, but this is not statistically significant. - Worse than expected
Security No Impact - Neutral
Eco
no
my
Public Accounts Investment cost as expected. PVC = £13.2m As expected
Transport
Economic
Efficiency
Journey time benefits were lower than forecast due to lower than expected traffic volumes.
Outturn journey
time benefits:
£48.3m
Lower than expected
Reliability Reduction in route stress from 94% to 84% post scheme opening. - As expected
Wider Economic
Impacts The scheme does not serve a designated regeneration area. - Neutral
Acce
ss
ibil
ity
Option Values No change to availability of transport services. - As expected
Severance No change to routes crossing M27. - As expected
Access to the
Transport System No changes affecting transport system. - As expected
Inte
gra
tio
n Transport
Interchange The scheme has not had an impact on transport interchange facilities. - As expected
Land Use Policy
& Other Gov’t
Policies
The scheme integrates well with the local, regional and national policy. - As expected
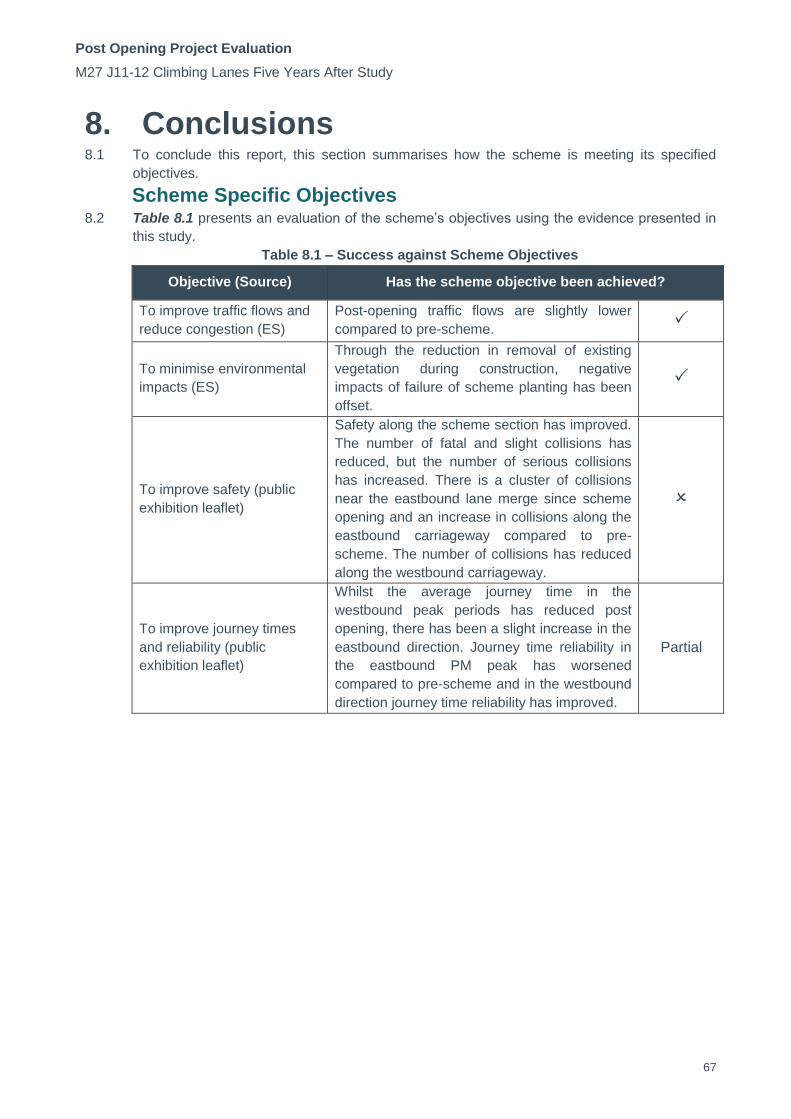
Post Opening Project Evaluation
M27 J11-12 Climbing Lanes Five Years After Study
67
8. Conclusions 8.1 To conclude this report, this section summarises how the scheme is meeting its specified
objectives.
Scheme Specific Objectives 8.2 Table 8.1 presents an evaluation of the scheme’s objectives using the evidence presented in
this study.
Table 8.1 – Success against Scheme Objectives
Objective (Source) Has the scheme objective been achieved?
To improve traffic flows and
reduce congestion (ES)
Post-opening traffic flows are slightly lower
compared to pre-scheme.
To minimise environmental
impacts (ES)
Through the reduction in removal of existing
vegetation during construction, negative
impacts of failure of scheme planting has been
offset.
To improve safety (public
exhibition leaflet)
Safety along the scheme section has improved.
The number of fatal and slight collisions has
reduced, but the number of serious collisions
has increased. There is a cluster of collisions
near the eastbound lane merge since scheme
opening and an increase in collisions along the
eastbound carriageway compared to pre-
scheme. The number of collisions has reduced
along the westbound carriageway.
To improve journey times
and reliability (public
exhibition leaflet)
Whilst the average journey time in the
westbound peak periods has reduced post
opening, there has been a slight increase in the
eastbound direction. Journey time reliability in
the eastbound PM peak has worsened
compared to pre-scheme and in the westbound
direction journey time reliability has improved.
Partial

Post Opening Project Evaluation
M27 J11-12 Climbing Lanes Five Years After Study
68
Appendices

Post Opening Project Evaluation
M27 J11-12 Climbing Lanes Five Years After Study
69
Appendix A. Tables and Figures in this
Report Tables Table 1.1 – Chronology of the Scheme 10
Table 2.1 – HGV flows on an average weekday 16
Table 2.2 – Forecast vs Observed Traffic Flows-Reference Case, Two Way AADT 19
Table 2.3 – Forecast vs Observed Traffic Flows-Optimistic Case, Two Way AADT 19
Table 2.4 – Forecast vs Observed Traffic Flows-Pessimistic Case, Two Way AADT 19
Table 2.5– Average Journey times and savings on the M27 J11-J12 (Seconds) 21
Table 2.6 – Forecast vs. Observed Journey Times (Seconds) 23
Table 2.7 – Route Stress on M27 J11-12 24
Table 3.1 – Number of Collisions by Severity in the M27 J11-12 COBA Area 29
Table 3.2 – Number of Casualties in the M27 J11-12 COBA Area 31
Table 3.3 – Collision and Casualty Severity Index 31
Table 3.4 – FWI on M27 J11-12 COBA Area 32
Table 3.5 – Comparison of Forecast and Outturn Collisions for the scheme Key Links 34
Table 3.6 – Analysis of collisions between Hill Road Overbridge and High Tor Footbridge-EB and WB Lane Merge 35
Table 3.7 – Observed Collision Rates on the M27 J11-12 COBA Area 36
Table 4.1 – Summary of Investment Costs 39
Table 4.2 – Indirect Tax Impact as a Cost 39
Table 4.3 – Summary of Forecast and Outturn Present Value Costs 39
Table 4.4 – Economic Impact of Scheme 40
Table 4.5 – Summary of TEE forecast impacts 40
Table 4.6 – Monetised Journey Time Benefits 41
Table 4.7 – FYA VOC Benefits 41
Table 4.8 – Summary of Forecast and Observed Present Value Benefits 42
Table 4.9 – Predicted vs. Reforecast BCR 42
Table 5.1 – Summary of Environmental Consultation Responses 48
Table 5.2 – Traffic Flows (AADT): Observed vs. Forecast 49
Table 5.3 – Reforecast and Outturn Carbon Emissions (Carbon tonnes/year) 52
Table 6.1 – Scheme Alignment with National, Regional and Local Policy 63
Table 7.1 – Appraisal Summary Table (AST) 65
Table 7.2 – Evaluation Summary Table (EST) 66
Table 8.1 – Success against Scheme Objectives 67
Table C.1 – Information requested to evaluate the environmental sub-objective. 73
Figures
Figure 1.1 – Scheme Location 8
Figure 1.2 – Scheme Layout 9
Figure 2.1 – National, Regional and Local Traffic Trends 13
Figure 2.2 – Long Term Trend on M27 and M275 14
Figure 2.3 – Comparison of Pre-scheme and Post-opening Two-way AWT 15
Figure 2.4 – COBA Network used in the Appraisal 18
Figure 2.5 – M27 J11-12 Eastbound Average Weekday Journey Time Profile 22
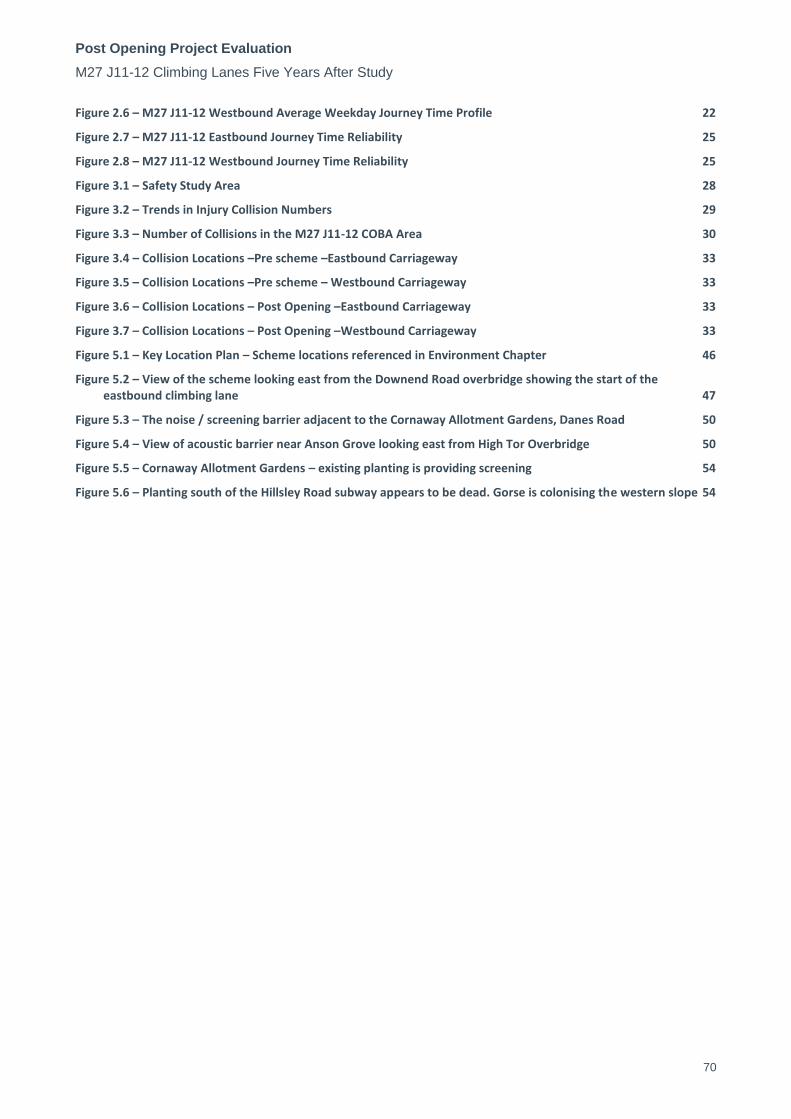
Post Opening Project Evaluation
M27 J11-12 Climbing Lanes Five Years After Study
70
Figure 2.6 – M27 J11-12 Westbound Average Weekday Journey Time Profile 22
Figure 2.7 – M27 J11-12 Eastbound Journey Time Reliability 25
Figure 2.8 – M27 J11-12 Westbound Journey Time Reliability 25
Figure 3.1 – Safety Study Area 28
Figure 3.2 – Trends in Injury Collision Numbers 29
Figure 3.3 – Number of Collisions in the M27 J11-12 COBA Area 30
Figure 3.4 – Collision Locations –Pre scheme –Eastbound Carriageway 33
Figure 3.5 – Collision Locations –Pre scheme – Westbound Carriageway 33
Figure 3.6 – Collision Locations – Post Opening –Eastbound Carriageway 33
Figure 3.7 – Collision Locations – Post Opening –Westbound Carriageway 33
Figure 5.1 – Key Location Plan – Scheme locations referenced in Environment Chapter 46
Figure 5.2 – View of the scheme looking east from the Downend Road overbridge showing the start of the eastbound climbing lane 47
Figure 5.3 – The noise / screening barrier adjacent to the Cornaway Allotment Gardens, Danes Road 50
Figure 5.4 – View of acoustic barrier near Anson Grove looking east from High Tor Overbridge 50
Figure 5.5 – Cornaway Allotment Gardens – existing planting is providing screening 54
Figure 5.6 – Planting south of the Hillsley Road subway appears to be dead. Gorse is colonising the western slope 54

Post Opening Project Evaluation
M27 J11-12 Climbing Lanes Five Years After Study
71
Appendix B. Glossary Terms Definition
AADT Annual Average Daily Traffic. Average of 24 hour flows, seven days a week, for all days
within a year.
Accessibility
Accessibility can be defined as 'ease of reaching'. The accessibility objective is concerned
with increasing the ability with which people in different locations, and with differing
availability of transport, can reach different types of facility.
ADT Average Daily Traffic. Average daily flows across a given period.
AST
Appraisal Summary Table. This records the impacts of the scheme according to the
Government’s five key objects for transport, as defined in DfT guidance contained on its
Transport Analysis Guidance web pages, WebTAG.
AAWT Annual Average Weekday Traffic. As AADT but for five days (Monday to Friday) only.
AWT Average Weekday Traffic. As ADT but for five days (Monday to Friday) only.
BCR Benefit Cost Ratio. This is the ratio of benefits to costs when both are expressed in terms
of present value i.e. PVB divided by PVC.
Bvkm Billion Vehicle Kilometres
COBA
Cost Benefit Analysis. A computer program which compares the costs of providing road
schemes with the benefits derived by road users (in terms of time, vehicle operating costs
and accidents), and expresses the results in terms of a monetary valuation. The COBA
model uses the fixed trip matrix unless it is being used in Accident-only mode.
CRF Congestion Reference Flow
DfT Department for Transport
Discount
Rate
The percentage rate applied to cash flows to enable comparisons to be made between
payments made at different times. The rate quantifies the extent to which a sum of money
is worth more to the Government today than the same amount in a year's time.
Discounting
Discounting is a technique used to compare costs and benefits that occur in different time
periods and is the process of adjusting future cash flows to their present values to reflect
the time value of money, e.g. £1 worth of benefits now is worth more than £1 in the future.
A standard base year needs to be used which is 2002 for the appraisal used in this report.
DM Do Minimum. In scheme modelling, this is the scenario which comprises the existing road
network plus improvement schemes that have already been committed.
DMRB Design Manual for Roads and Bridges
DS Do Something. In scheme modelling, this is the scenario detailing the planned scheme
plus improvement schemes that have already been committed.
EA Environment Agency
ES Environmental Statement
EST Evaluation Summary Table. In POPE studies, this is a summary of the evaluations of the
TAG objectives using a similar format to the forecasts in the AST.
FYA Five Year After
HA Highways Agency. An Executive Agency of the DfT, responsible for operating,
maintaining and improving the strategic road network in England.
HGV Heavy Goods Vehicle
KSI Killed or Seriously Injured. KSI is the proportion of casualties who are killed or seriously
injured and is used as a measure of collision severity.
LNS Low Noise Surfacing
MAC Managing Area Contractor Organisation normally contracted in 5-year terms for
undertaking the management of the road network within a HA area.
MVKM Million Vehicle Kilometres
NATA New Approach to Appraisal. The basis of the standard DfT appraisal approach when this
scheme was appraised.
NMU Non-Motorised User. A generic term covering pedestrians, cyclists and equestrians.
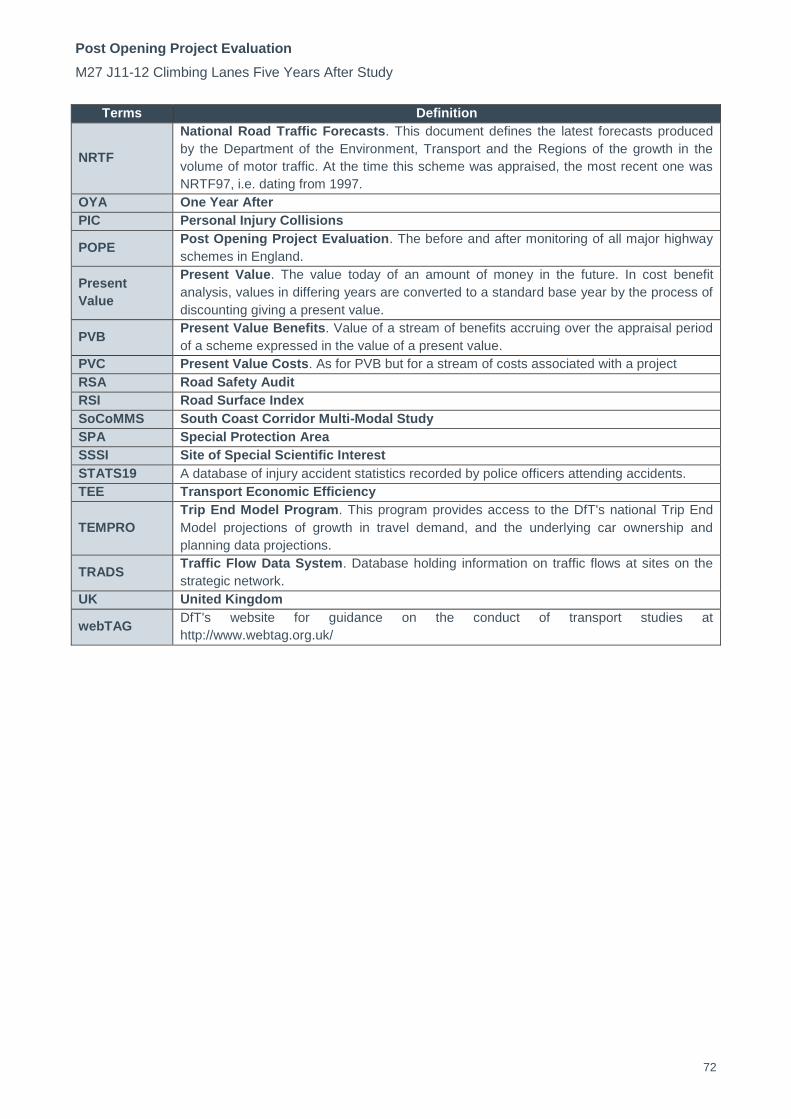
Post Opening Project Evaluation
M27 J11-12 Climbing Lanes Five Years After Study
72
Terms Definition
NRTF
National Road Traffic Forecasts. This document defines the latest forecasts produced
by the Department of the Environment, Transport and the Regions of the growth in the
volume of motor traffic. At the time this scheme was appraised, the most recent one was
NRTF97, i.e. dating from 1997.
OYA One Year After
PIC Personal Injury Collisions
POPE Post Opening Project Evaluation. The before and after monitoring of all major highway
schemes in England.
Present
Value
Present Value. The value today of an amount of money in the future. In cost benefit
analysis, values in differing years are converted to a standard base year by the process of
discounting giving a present value.
PVB Present Value Benefits. Value of a stream of benefits accruing over the appraisal period
of a scheme expressed in the value of a present value.
PVC Present Value Costs. As for PVB but for a stream of costs associated with a project
RSA Road Safety Audit
RSI Road Surface Index
SoCoMMS South Coast Corridor Multi-Modal Study
SPA Special Protection Area
SSSI Site of Special Scientific Interest
STATS19 A database of injury accident statistics recorded by police officers attending accidents.
TEE Transport Economic Efficiency
TEMPRO
Trip End Model Program. This program provides access to the DfT's national Trip End
Model projections of growth in travel demand, and the underlying car ownership and
planning data projections.
TRADS Traffic Flow Data System. Database holding information on traffic flows at sites on the
strategic network.
UK United Kingdom
webTAG DfT's website for guidance on the conduct of transport studies at
http://www.webtag.org.uk/

Post Opening Project Evaluation
M27 J11-12 Climbing Lanes Five Years After Study
73
Appendix C. Information requested for
Environmental section Table C.1 – Information requested to evaluate the environmental sub-objective.
Environment Specific Requirements OYA Response FYA Response
Environment Statement (ES) or Stage 3 Scheme
Assessment Report (SAR) or Environmental
Assessment Report (EAR) including Environmental
Masterplan (EMP) drawings.
ES Provided by HA. Received at OYA.
AST. Provided by HA. Received at OYA.
Any amendments / updates, additional surveys or
reports since the ES/ SAR/ EAR. None provided. None received.
Any changes to the schemes since the ES/ SAR/
EAR e.g. to lighting and signs, retention of material
on site in earthworks in the form of landscape
bunds or other, or to proposed mitigation
measures.
Provided by HA. Received at OYA.
As built drawings for landscape/ biodiversity/
environmental mitigation measures/ drainage/
fencing/ earthworks etc.
Landscape As Built drawings
received.
Only landscape as built
drawings received at OYA, no
further drawings or reports
received at FYA
Construction Environment Management Plan
(CEMP). None provided None provided
Landscape and Ecology Aftercare Plan (LEAP) or
Landscape Management Plan (LMP). None provided None provided
Health and Safety File – Environment sections (to
include all environment As-Built reports). None provided None provided
Handover Environmental Management Plan
(HEMP). Draft report received at OYA
No further updates received
at FYA.
Relevant Contact Names for consultation. Provided by HA From OYA and sourced by
POPE.
Archaeological Reports (popular and academic). None provided None provided
The Road Surface Influence (RSI) value of any low
noise surface installed. None provided None provided
The insulation performance properties of any noise
barriers installed (The BS EN 1794-2 result
provided by the noise barrier manufacturer).
None provided None provided
List of properties eligible for noise insulation. None eligible None received.
Employers Requirements Works Information -
Environment sections. None provided None provided
Reports for any pre/ post opening survey and
monitoring work e.g. for noise, biodiversity, water
quality).
None provided None provided
Animal mortality data. None provided None provided
Pre or Post opening Non-motorised User (NMU)
Audits or Vulnerable User Surveys. Not undertaken. None undertaken.
Scheme Newsletters / publicity material/ Award
information for the scheme. None provided. None available at FYA.

Post Opening Project Evaluation
M27 J11-12 Climbing Lanes Five Years After Study
74
Appendix D. ES and OYA Comparison
Viewpoints D.1. ES Photomontage Comparison Viewpoints

Post Opening Project Evaluation
M27 J11-12 Climbing Lanes Five Years After Study
75
D.1.1. ‘Before’ and ‘After’ views from Upper Cornaway Lane footbridge.
Figure D.1 – ES Figure 9.4a – Viewpoint A[1]: Upper Cornaway Lane Footbridge looking west (FP 117) – summer
OYA comparison view (winter) FYA comparison view (summer)
Figure D.2 – POPE view looking west from Upper Cornaway footbridge: View illustrates the deep motorway cutting, westbound climbing lane, open chalk verges and slightly amended signage layout (eastbound)
Existing retained vegetation on highway cutting slopes has grown substantially since opening and serves to soften the effects of the scheme overall. New planting provided as part of the scheme has not established.

Post Opening Project Evaluation
M27 J11-12 Climbing Lanes Five Years After Study
76
D.1.2. Before and after views from Cornaway Allotment Gardens
Figure D.3 – ES figure A2 Cornaway allotment Gardens (summer)
Figure D.4 – FYA comparison view (summer)

Post Opening Project Evaluation
M27 J11-12 Climbing Lanes Five Years After Study
77
D.1.3. ‘Before’ and ‘After’ views from Hill Road Overbridge (looking east)
Figure D.5 – ES Figure 9. 4b – Viewpoint C[2]: Hill Road Overbridge looking east – Winter
OYA comparison view (winter) FYA comparison view (summer)
Figure D.6 – POPE views looking east from Hill Road overbridge
The vegetation on the chalk slope immediately adjacent to the highway is growing well. It is expected that the calcareous grassland will colonise the small cutting slope by Design year.

Post Opening Project Evaluation
M27 J11-12 Climbing Lanes Five Years After Study
78
D.1.4. ‘Before’ and ‘After’ views from High Tor footbridge
Figure D.7 – ES Figure 9. 4b – Viewpoint D: High Tor Footbridge looking east (FP119B) - summer
Figure D.8 – POPE OYA view looking east from High Tor footbridge: View illustrates westbound climbing lane, retained signage (eastbound carriageway) and new VMS
Figure D.9 – POPE FYA view looking east from High Tor footbridge: View illustrates westbound climbing lane, retained signage (eastbound carriageway) and new VMS
No additional planting appears to have been undertaken within this view, with existing vegetation providing screening and habitat connectivity. Views are as expected
The motorway is located above the housing estate near Anson Grove. Trees and shrubs were planted prior to the current scheme and are effectively screening the motorway (see Figure D.10).

Post Opening Project Evaluation
M27 J11-12 Climbing Lanes Five Years After Study
79
D.1.5. ‘Before’ and ‘After’ views from Hillsley Road
Figure D.10 – ES Figure 9.4c – Viewpoint E: Hillsley Road looking south - Summer
Figure D.11 – POPE OYA view looking south from Hillsley Road: View illustrates former lighting columns now removed and westbound climbing lane.
Figure D.12 – POPE FYA view looking south from Hillsley Road: View illustrates ‘greening’ of barriers on the eastbound carriageway.
Partial screening of the barrier (far side of M27) has been achieved which assists in softening the effects of the scheme both within and beyond the boundaries of the motorway.

Post Opening Project Evaluation
M27 J11-12 Climbing Lanes Five Years After Study
80
D.2. OYA vs FYA Comparison Viewpoints
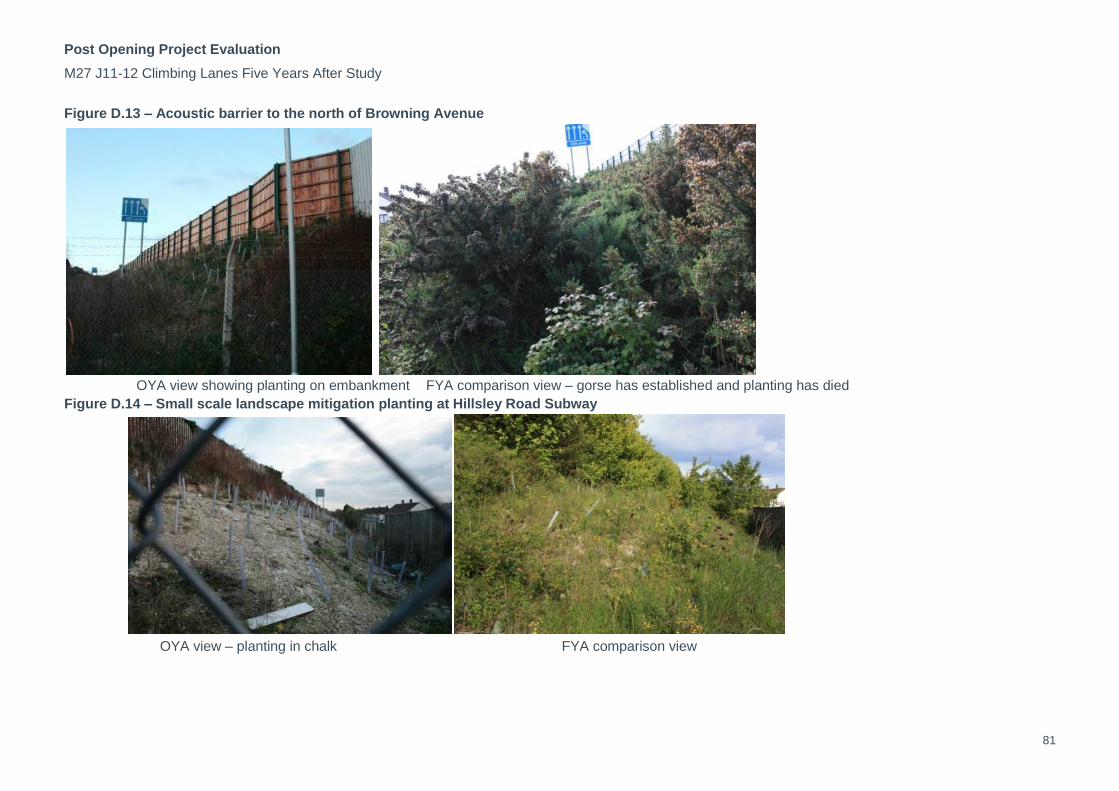
Post Opening Project Evaluation
M27 J11-12 Climbing Lanes Five Years After Study
81
Figure D.13 – Acoustic barrier to the north of Browning Avenue
OYA view showing planting on embankment FYA comparison view – gorse has established and planting has died
Figure D.14 – Small scale landscape mitigation planting at Hillsley Road Subway
OYA view – planting in chalk FYA comparison view

Post Opening Project Evaluation
M27 J11-12 Climbing Lanes Five Years After Study
82
Figure D.1 – Typical example of retained habitat and vegetation cover
OYA view FYA comparison view
Figure D.1 – Existing underpass entrance at Beverston Road
OYA view FYA comparison view
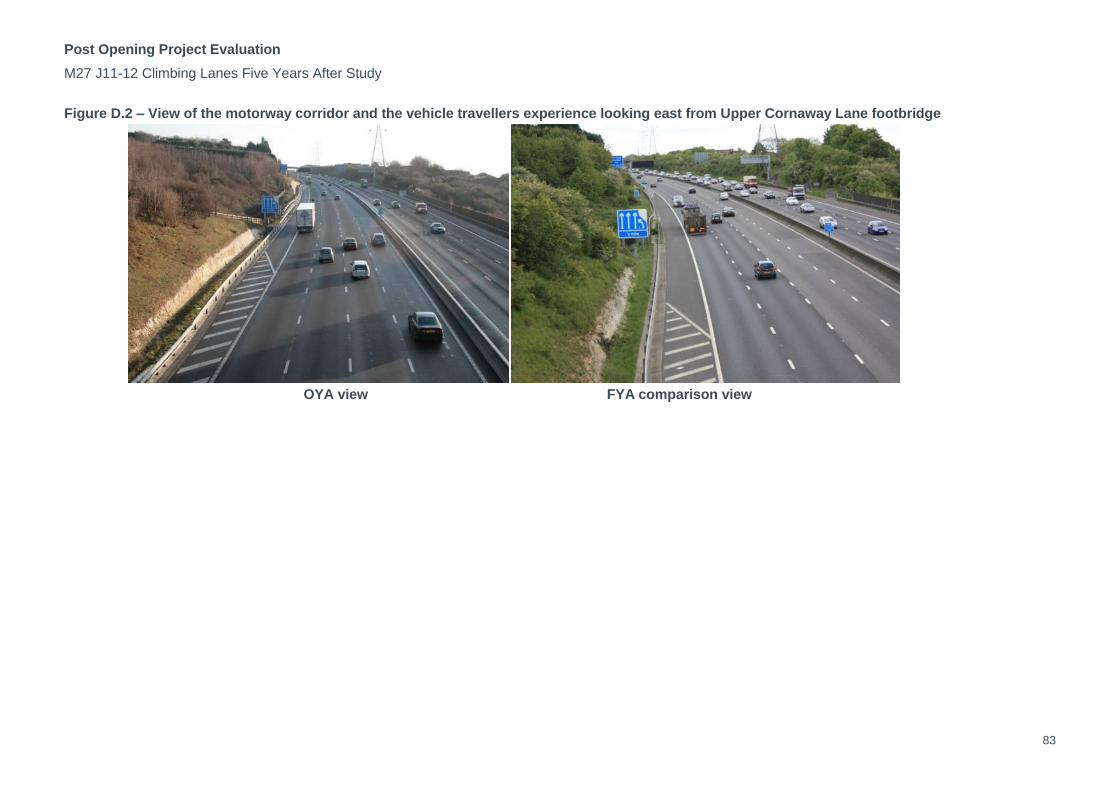
Post Opening Project Evaluation
M27 J11-12 Climbing Lanes Five Years After Study
83
Figure D.2 – View of the motorway corridor and the vehicle travellers experience looking east from Upper Cornaway Lane footbridge
OYA view FYA comparison view