positive operating leverage results in another … · positive operating leverage results in...
TRANSCRIPT

HVS San Francisco | 100 Bush Street, Suite 750, San Francisco, CA 94104 HVS.com
POSITIVE OPERATING LEVERAGE RESULTS IN ANOTHER YEAR OF STRONG HOTEL VALUE GAINS; CAP RATES START TO RISE
Suzanne Mellen, CRE, MAI, ISHC, FRICS Senior Managing Director
JANUARY 2016
| PAGE 2
Five years of steady cap rates and rising NOI have resulted in significant U.S. hotel asset appreciation. The current economic landscape is likely to cause hotel cap rates to rise in 2016, moderating future value gains. Transaction activity is expected to decline this year owing to the current volatility of the capital markets, following a record year for hotel transactions in 2015. This article looks at hotel sales and capitalization rate trends, the impact of operating leverage on hotel values, and the outlook for 2016.1
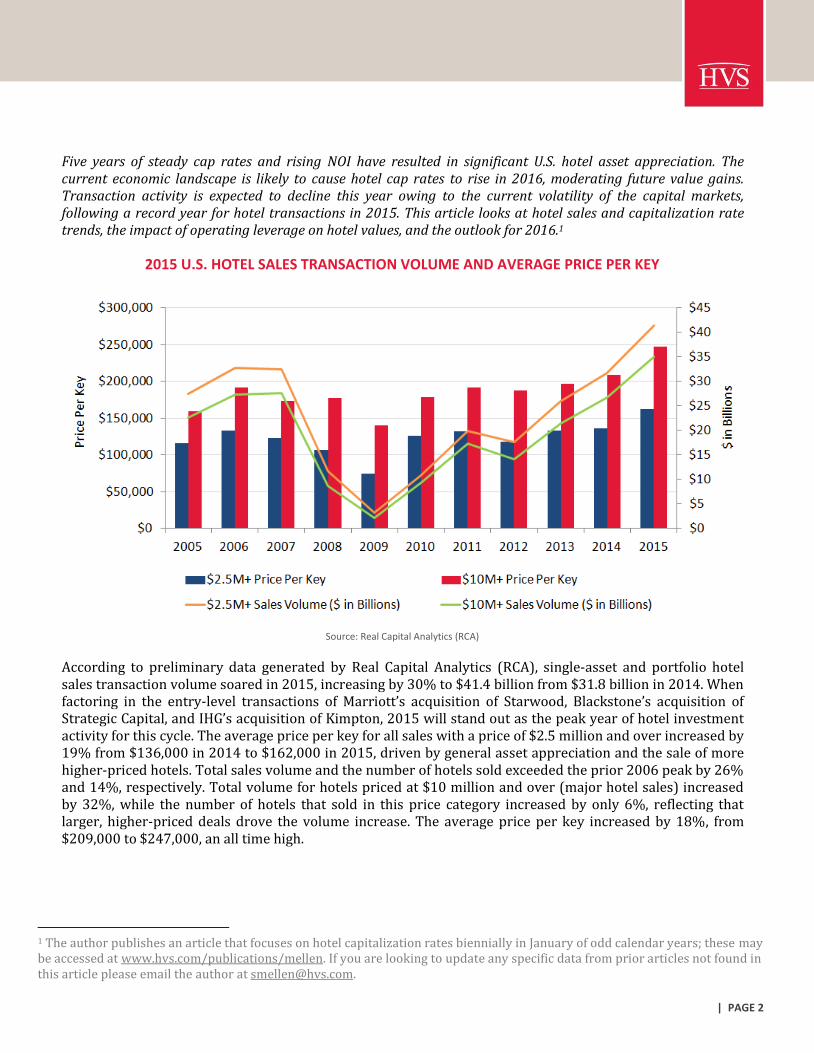
2015 U.S. HOTEL SALES TRANSACTION VOLUME AND AVERAGE PRICE PER KEY
Source: Real Capital Analytics (RCA)
According to preliminary data generated by Real Capital Analytics (RCA), single-asset and portfolio hotel sales transaction volume soared in 2015, increasing by 30% to $41.4 billion from $31.8 billion in 2014. When factoring in the entry-level transactions of Marriott’s acquisition of Starwood, Blackstone’s acquisition of Strategic Capital, and IHG’s acquisition of Kimpton, 2015 will stand out as the peak year of hotel investment activity for this cycle. The average price per key for all sales with a price of $2.5 million and over increased by 19% from $136,000 in 2014 to $162,000 in 2015, driven by general asset appreciation and the sale of more higher-priced hotels. Total sales volume and the number of hotels sold exceeded the prior 2006 peak by 26% and 14%, respectively. Total volume for hotels priced at $10 million and over (major hotel sales) increased by 32%, while the number of hotels that sold in this price category increased by only 6%, reflecting that larger, higher-priced deals drove the volume increase. The average price per key increased by 18%, from $209,000 to $247,000, an all time high.
1 The author publishes an article that focuses on hotel capitalization rates biennially in January of odd calendar years; these may be accessed at www.hvs.com/publications/mellen. If you are looking to update any specific data from prior articles not found in this article please email the author at [email protected].

| PAGE 3
Capitalization rates derived from sales of full-service and luxury hotels2 in 2015 evidenced a slight contraction as a result of the larger number of hotels in markets with high barriers to entry in the data set. Competition for high-quality assets remained high and was fueled by foreign capital, private equity, and, in the first half of 2015, by REITs as well. In contrast, capitalization rates for limited-service and select-service/extended-stay hotels in low-barriers-to-entry markets started to rise as the potential impact of increased supply became more evident.
The following chart sets forth average capitalization rates derived from sales based on trailing-12-month NOI and projected first-year NOI at the time of sale. These rates are derived from hotels that HVS appraised at the time of sale and, thus, the derived capitalization rates are dependent upon the individual sales transactions that constitute the data set. Individual sales transactions can affect the cap rate range and averages.3
CAPITALIZATION RATES DERIVED FROM SALES TRANSACTIONS
The following chart, which illustrates capitalization rates and internal rates of return by product segment, reflects the step-up in rates of return from the full-service to select-service and limited-service sectors. Discount rates have continued to decline modestly, reflecting the low cost of capital available for hotel transactions and the anticipated slowing of future RevPAR and NOI gains.
AVERAGE RATES OF RETURN DERIVED FROM 2015 SALES TRANSACTIONS
Source: HVS
2 Capitalization rates are derived from actual sales transactions that HVS appraised at the time of sale based on TTM and 1st-year projected NOI. 3 Cap rates reported by RCA for full-service hotels include select-service products that offer food and beverage, and thus cannot be directly compared to cap rates reported in this article.
| PAGE 4
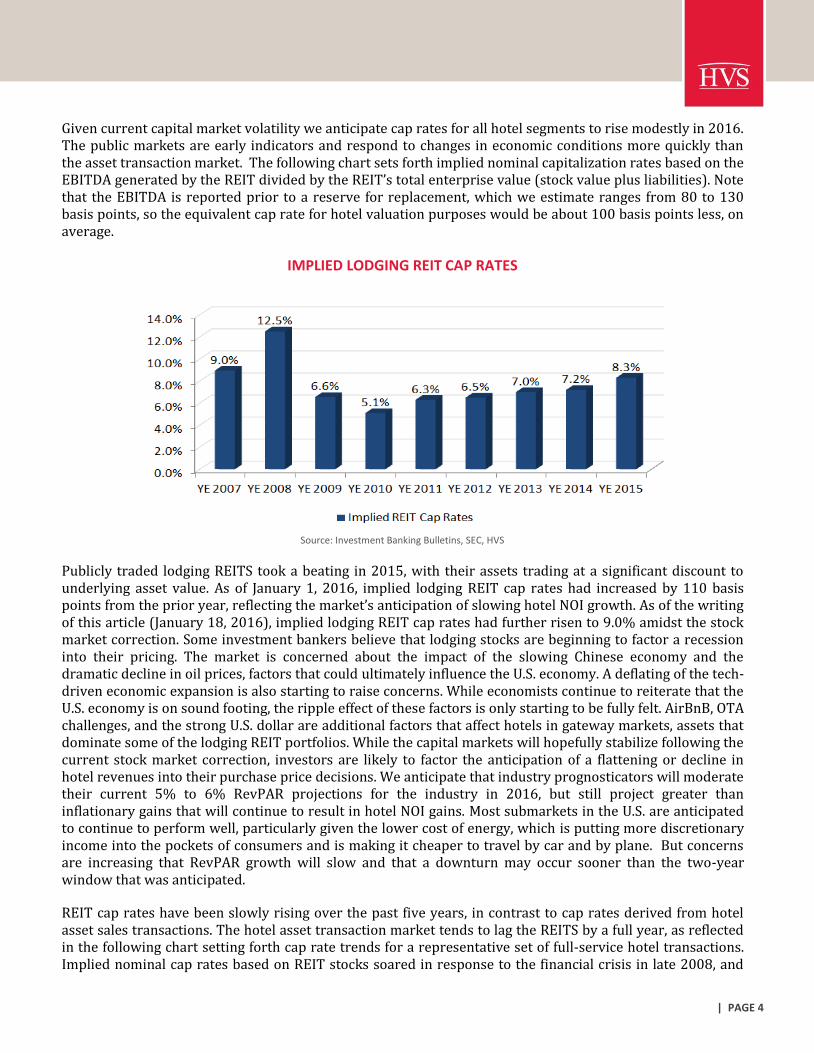
Given current capital market volatility we anticipate cap rates for all hotel segments to rise modestly in 2016. The public markets are early indicators and respond to changes in economic conditions more quickly than the asset transaction market. The following chart sets forth implied nominal capitalization rates based on the EBITDA generated by the REIT divided by the REIT’s total enterprise value (stock value plus liabilities). Note that the EBITDA is reported prior to a reserve for replacement, which we estimate ranges from 80 to 130 basis points, so the equivalent cap rate for hotel valuation purposes would be about 100 basis points less, on average.
IMPLIED LODGING REIT CAP RATES
Source: Investment Banking Bulletins, SEC, HVS
Publicly traded lodging REITS took a beating in 2015, with their assets trading at a significant discount to underlying asset value. As of January 1, 2016, implied lodging REIT cap rates had increased by 110 basis points from the prior year, reflecting the market’s anticipation of slowing hotel NOI growth. As of the writing of this article (January 18, 2016), implied lodging REIT cap rates had further risen to 9.0% amidst the stock market correction. Some investment bankers believe that lodging stocks are beginning to factor a recession into their pricing. The market is concerned about the impact of the slowing Chinese economy and the dramatic decline in oil prices, factors that could ultimately influence the U.S. economy. A deflating of the tech-driven economic expansion is also starting to raise concerns. While economists continue to reiterate that the U.S. economy is on sound footing, the ripple effect of these factors is only starting to be fully felt. AirBnB, OTA challenges, and the strong U.S. dollar are additional factors that affect hotels in gateway markets, assets that dominate some of the lodging REIT portfolios. While the capital markets will hopefully stabilize following the current stock market correction, investors are likely to factor the anticipation of a flattening or decline in hotel revenues into their purchase price decisions. We anticipate that industry prognosticators will moderate their current 5% to 6% RevPAR projections for the industry in 2016, but still project greater than inflationary gains that will continue to result in hotel NOI gains. Most submarkets in the U.S. are anticipated to continue to perform well, particularly given the lower cost of energy, which is putting more discretionary income into the pockets of consumers and is making it cheaper to travel by car and by plane. But concerns are increasing that RevPAR growth will slow and that a downturn may occur sooner than the two-year window that was anticipated.
REIT cap rates have been slowly rising over the past five years, in contrast to cap rates derived from hotel asset sales transactions. The hotel asset transaction market tends to lag the REITS by a full year, as reflected in the following chart setting forth cap rate trends for a representative set of full-service hotel transactions. Implied nominal cap rates based on REIT stocks soared in response to the financial crisis in late 2008, and

| PAGE 5
then declined markedly by year-end 2009 once it was clear that the economy was stabilizing and that hotel performance was set for recovery. Contrast that with cap rates derived from sales transactions, which peaked in 2009 and then declined markedly in 2010 once the market had bottomed out. Typically cap rates calculated based on historical NOI divided by a sales price will be lower than a “going-in” cap rate based on projected NOI, as net income is anticipated to rise in a healthy economic environment. In 2008 we started to see cap rates based on historical NOI rise above those based on projected NOI, reflecting the market’s anticipation of a near-term decline in NOI. In 2015 we saw cap rates based on historical NOI continue to remain above going-in rates, but the difference between the two is narrowing as investors moderate their expectations. We will likely see a further narrowing of the gap between these two metrics in 2016, and for some assets and markets the cap rate based on historical NOI will rise above the cap rate based on projected NOI.
DERIVED FULL-SERVICE CAP RATES TRENDS
Source: HVS
Interest rates have a significant impact on capitalization rates. While the Fed raised the federal funds rate by 0.25% in December, market participants interviewed for this article anticipate that the Fed will prolong the horizon of the planned three subsequent 0.25% increases resulting from the current state of the capital markets. The disfavor of hotel investments when the economy starts to falter is resulting in increased spreads. Underwriting is becoming more stringent, which is reducing loan proceeds. The CMBS market for hotel financing is currently faltering owing to the concern that hotel loans may be difficult to securitize. If financing becomes more difficult the transaction market will be negatively impacted. With fewer buyers and less favorable financing, assets will likely not garner the prices that had been anticipated and sellers will wait to sell their assets until the market stabilizes.
As we face this change in market conditions it is worth reviewing the factors that impact hotel values during good times and bad. The steadiness of hotel cap rates together with strongly rising RevPAR levels over the past five years stimulated extraordinary hotel asset appreciation that reached peak levels in 2015. Values surged in many markets, as the majority of the recent RevPAR increase was driven by gains in ADR, which generates greater flow-through to the bottom line than occupancy.
The following example of an actual hotel’s performance over the past six years illustrates the impact of positive operating leverage on the value of a full-service, luxury hotel. The hotel’s revenue increased by a compound annual rate of change (CAGR) of 11% from 2010 through 2015, while expenses increased by a CAGR of 7%, resulting in the hotel’s net income increasing by a phenomenol CAGR of 34%.

| PAGE 6
IMPACT OF POSITIVE OPERATING LEVERAGE ON HOTEL PROFITABILITY
Source: HVS
Total revenues increased by 165% while expenses increased by 140% over the five-year period, resulting in an extraordinary 432% increase in NOI. While this success story reflects the upper end of the market, it illustrates why we have been hearing about many eye-popping hotel sales prices. Historically, as revenues and NOI increase the market requires a higher rate of return as potential upside lessens and interest rates rise as the economy strengthens. But in this most recent cycle neither interest rates nor capitalization rates rose as the cycle extended, and in fact cap rates in some markets continued to decline over the past year, driving asset prices ever higher. Assuming a constant 5.5% cap rate for this sample hotel results in a remarkable 432% value increase, from $200,000 per key in 2010 to $864,000 per key in 2015, levels that were borne out by actual transactions.
ILLUSTRATION OF VALUE RISE BECAUSE OF POSITIVE OPERATING LEVERAGE AND STEADY CAP RATES
Source: HVS
Given where we are in the investment cycle and the headwinds facing the U.S. economy it is important to remember that the positive operating leverage that has resulted in such significant value gains turns into negative leverage when RevPAR declines. The following chart sets forth the average operating performance of full-service U.S. hotels at the peak of the cycle (2007) adjacent to the trough of the recession (2009), followed by the same data for 2014, as reported by STR. It is interesting to note that the broad rule of thumb

| PAGE 7
that changes in RevPAR have two times the impact on NOI appears to hold true. The 21% RevPAR decline from 2007 to 2009 resulted in a 44% decline in NOI (negative operating leverage), while the 46% RevPAR increase from 2009 to 2014 resulted in a 101% increase in NOI (positive operating leverage). The significant operating leverage is due to the high fixed expenses of a hotel operation, which, once exceeded, allow a hotel to generate strong gains in NOI when revenue is rising at a greater rate than expenses.
STR HOST ALMANAC – U.S. FULL-SERVICE HOTEL OPERATING STATISTICS
Source: STR, HVS
The same rule of thumb applies to limited-service hotels, but with a somewhat lesser impact in both negative and positive operating leverage scenarios.
STR HOST ALMANAC – U.S. LIMITED-SERVICE HOTEL OPERATING STATISTICS
Source: STR, HVS

| PAGE 8
The potential for negative operating leverage to drive down hotel NOI, together with the need to re-lease hotel rooms every night, are the two primary factors that cause hotels to come out of favor during an economic contraction. While we anticipate that hotels will continue to benefit from positive operating leverage over the near term, it is the fear of the industry reversing course that is affecting the capital markets, which in turn is likely to slow transaction activity.
Outlook for 2016
In summary, 2016 will be a year of shifting sand for the hotel investment market. While we are in the midst of a stock market correction that is being particularly harsh to lodging, individual asset values are much more stable than stock values due to differences in liquidity and ownership timelines. Given strong economic fundamentals, and the positive impact of lower energy prices on travel costs and discretionary income, we can expect the lodging industry to perform well in 2016, though at more modest NOI and value gains than in recent years. Cap rates are anticipated to remain low for desirable gateway, high-barriers-to-entry markets. Markets with lower barriers to entry facing new supply are likely to experience a rise in return requirements. One benefit of the changing market environment is that it may reduce the new supply that will be financed and get built during this cycle, lessening the impact on existing hotels. Markets that face downturns in their dominant industries will see the largest rise in cap rates, as buyers factor a NOI reduction into their purchase prices. The positive operating leverage that has fueled hotel value gains is expected to continue over the near term, though the specter of a reversal in hotel operating performance will likely result in higher cap rates and reduced transaction activity.
HVS.com HVS San Francisco | 100 Bush Street, Suite 750, San Francisco, CA 94104
About HVS
HVS, the world’s leading consulting and services organization focused on the hotel, mixed-use, shared ownership, gaming, and leisure industries, celebrated its 35th anniversary in June 2015. Established in 1980, the company performs 4,500+ assignments each year for hotel and real estate owners, operators, and developers worldwide. HVS principals are regarded as the leading experts in their respective regions of the globe. Through a network of more than 35 offices and more than 500 professionals, HVS provides an unparalleled range of complementary services for the hospitality industry. HVS.com
Superior Results through Unrivaled Hospitality Intelligence. Everywhere.
About Suzanne R. Mellen
Suzanne R. Mellen is a Senior Managing Director, Practice Leader of HVS Consulting & Valuation. She has been evaluating hotels and associated real estate for 38 years, has authored numerous articles, and is a
frequent lecturer and expert witness on the valuation of hotels and related issues. Ms. Mellen has a BS degree in Hotel Administration from Cornell University and holds the following designations: MAI (Appraisal Institute), CRE (Counselor of Real Estate), ISHC (International Society of Hospitality Consultants) and FRICS (Fellow of the Royal Institution of Chartered Surveyors).
Contact Suzanne Mellen at (415) 265-0351 or